Embed Size (px)
Citation preview
THE UNIVERSITY OF ADELAIDE
The influence of soil genesis, type and composition on constraints to
plant growth in salt-affected soils in Upper South East South Australia
Melissa Fraser
A thesis submitted for the degree of Doctorate of Philosophy
Faculty of Sciences, School of Earth and Environmental Science
May 2011
ii
TABLE OF CONTENTS
TABLE OF CONTENTS ............................................................................................................. II
ABSTRACT .............................................................................................................................. VI
STATEMENT OF DECLARATION ............................................................................................. VI
ACKNOWLEDGEMENTS .......................................................................................................... X
THESIS STRUCTURE .............................................................................................................. XII
CHAPTER 1 ............................................................................................................................. 1
INTRODUCTION ...................................................................................................................... 1
1.1 ENVIRONMENTAL SETTING .................................................................................................................... 5
1.2 SALT-AFFECTED SOILS IN AUSTRALIA ..................................................................................................... 8
1.3 SOIL SALINITY ......................................................................................................................................... 9
1.3.1 Salinity in the USE ........................................................................................................................ 12
1.3.2 Effects of salts on plants and soils ............................................................................................... 13
1.4 SODICITY ............................................................................................................................................... 15
1.4.1 Exchangeable Sodium Percentage ............................................................................................... 16
1.4.2 The deterioration of soil structure by dispersion ........................................................................ 17
1.4.3 The nature and content of organic matter and clay dispersion .................................................. 19
1.4.4 Soil pH and clay dispersion .......................................................................................................... 20
1.4.5 Mineralogical composition and dispersion .................................................................................. 21
1.4.6 Dominance of calcium vs. magnesium ........................................................................................ 22
1.4.7 Soil biology ................................................................................................................................... 22
1.4.8 Mechanical disturbance and clay dispersion ............................................................................... 23
1.4.9 Sodicity and clay dispersion, effects on soil permeability and water holding characteristics ..... 23
1.5 SOIL MINERALOGY................................................................................................................................ 25
1.5.1 Kaolinite ....................................................................................................................................... 26
1.5.2 Illite .............................................................................................................................................. 27
1.5.3 Smectite ....................................................................................................................................... 28
1.5.4 Non Phyllosilicate minerals.......................................................................................................... 31
1.6 CONCLUSION ........................................................................................................................................ 32
1.7 HYPOTHESES ......................................................................................................................................... 33
1.8 REFERENCES ......................................................................................................................................... 34

iii
CHAPTER 2 ........................................................................................................................... 39
ARTIFICIAL DRAINAGE AFFECTS THE PHYSICOCHEMICAL PROPERTIES OF SALT-AFFECTED
HEAVY CLAY SOILS IN THE UPPER SOUTH EAST OF SOUTH AUSTRALIA .............................. 39
2.1 INTRODUCTION .................................................................................................................................... 39
2.2 ENVIRONMENTAL SETTING OF THE STUDY .......................................................................................... 42
2.3 METHODS ............................................................................................................................................. 45
2.3.1 Historic Groundwater Trends ...................................................................................................... 46
2.3.2 Trench Location and Sampling..................................................................................................... 46
2.3.3 Soil Chemical Analyses ................................................................................................................. 47
2.4 RESULTS ................................................................................................................................................ 49
2.4.1 South Study Site ........................................................................................................................... 49
2.4.1.1 Groundwater Trends .............................................................................................................. 50
2.4.1.2 Soil Chemistry ........................................................................................................................ 51
2.4.2 Central Study Site ........................................................................................................................ 52
2.4.2.1 Groundwater Trends .............................................................................................................. 53
2.4.2.2 Soil Chemistry ........................................................................................................................ 55
2.4.3 North Study Site ........................................................................................................................... 56
2.4.3.1 Groundwater Trends .............................................................................................................. 56
2.4.3.2 Soil Chemistry ........................................................................................................................ 57
2.4.4 Clay Mineralogy of the Soils ........................................................................................................ 58
2.5 DISCUSSION .......................................................................................................................................... 60
2.5.1 Rainfall, artificial drainage and groundwater trends ................................................................... 60
2.5.2 Interpretation of soil properties .................................................................................................. 62
2.5.2.1 Smectite-rich Soils .................................................................................................................. 62
2.5.2.2 Illite-Kaolinite- rich soils ......................................................................................................... 66
2.6 CONCLUSION ........................................................................................................................................ 68
2.7 REFERENCE LIST .................................................................................................................................... 70
CHAPTER 3 ........................................................................................................................... 72
COMBINING GEOPHYSICAL TOOLS, SOIL SURVEY AND SOIL CHEMISTRY TO INVESTIGATE
THE CAUSE OF SPATIAL VARIABILITY OF SOILS IN THE UPPER SOUTH EAST OF SA ............ 72
3.1 INTRODUCTION .................................................................................................................................... 72
3.2 METHODS ............................................................................................................................................. 74
3.2.1 Study Site ..................................................................................................................................... 75
3.2.2 Geophysical Surveys .................................................................................................................... 75
3.2.3 Preliminary Soil Sampling ............................................................................................................ 77
iv
3.2.4 Soil Chemical Analysis .................................................................................................................. 77
3.2.5 Trench Location ........................................................................................................................... 78
3.2.6 Trench Soil Sampling and Chemical Analysis ............................................................................... 79
3.3 RESULTS ................................................................................................................................................ 80
3.3.1 EMI Survey ................................................................................................................................... 80
3.3.2 GPR Survey................................................................................................................................... 81
3.3.3 Preliminary Soil Survey ................................................................................................................ 84
3.3.4 Trench Results ............................................................................................................................. 86
3.4 DISCUSSION .......................................................................................................................................... 89
3.4.1 Key Profiles .................................................................................................................................. 90
3.4.2 Relationships between soil profile properties and geophysical features .................................... 92
3.4.3 Relationship between EMI and GPR patterns ............................................................................. 95
3.5 CONCLUSION ........................................................................................................................................ 98
3.6 REFERENCE LIST .................................................................................................................................... 99
CHAPTER 4 ......................................................................................................................... 101
GENESIS AND DISTRIBUTION OF CLAY MINERALS AND CARBONATES IN LACUSTRINE AND
PALUSTRINE SEDIMENTS OF UPPER SOUTH EAST SA ........................................................ 101
4.1 INTRODUCTION .................................................................................................................................. 101
4.1.1 Study setting .............................................................................................................................. 102
4.1.2 Types of continental carbonates and their identification ......................................................... 104
4.1.3 Previous studies of soils in the region ....................................................................................... 109
4.2 METHODS ........................................................................................................................................... 111
4.3 RESULTS .............................................................................................................................................. 113
4.3.1 XRD patterns of the Powder Bulk Samples ................................................................................ 113
4.3.2 Elemental analysis ..................................................................................................................... 117
4.3.3 XRD patterns and TEM of the <2 μm fraction............................................................................ 119
4.3.4 Petrographic examination ......................................................................................................... 124
4.3.5 Isotopic analysis ......................................................................................................................... 128
4.4 DISCUSSION ........................................................................................................................................ 129
4.4.1 Genesis and types of clay minerals ............................................................................................ 129
4.4.2 Genesis of lacustrine, palustrine and calcrete carbonates on the Avenue Plain ....................... 135
4.4.2.1 Palustrine limestones ........................................................................................................... 136
4.4.2.2 Lacustrine marl and clay ...................................................................................................... 138
4.4.2.3 Groundwater calcretes / silcretes ........................................................................................ 139
4.4.2.4 Pedogenic calcretes ............................................................................................................. 143
4.4.3 Development of soil profiles...................................................................................................... 144

v
4.5 CONCLUSION ...................................................................................................................................... 149
4.6 REFERENCE LIST .................................................................................................................................. 151
CHAPTER 5 ......................................................................................................................... 155
ON-FARM RESEARCH IMPROVES FARMER KNOWLEDGE AND FACILITATES CHANGE ...... 155
5.1 INTRODUCTION .................................................................................................................................. 155
5.2 METHODS AND ACTIVITIES ................................................................................................................. 157
5.3 RESULTS AND DISCUSSION ................................................................................................................. 159
5.3.1 Knowledge of salinity and sodicity ............................................................................................ 159
5.3.2 Management practices, production and sustainability ............................................................. 162
5.3.3 On-farm research and extension methods ................................................................................ 166
5.3.4 Community perception and the drainage schemes ................................................................... 169
5.4 CONCLUSIONS .................................................................................................................................... 170
5.5 REFERENCES ....................................................................................................................................... 171
CHAPTER 6 ......................................................................................................................... 172
GENERAL DISCUSSION AND CONCLUSIONS ....................................................................... 172
6.1 INTRODUCTION .................................................................................................................................. 172
6.2 SUMMARY OF RESEARCH AND CONTRIBUTION TO KNOWLEDGE ..................................................... 173
6.3 GENERAL DISCUSSION ........................................................................................................................ 185
6.3.1 Illite- and Kaolinite-rich soils...................................................................................................... 185
6.3.2 Smectite-rich soils ...................................................................................................................... 188
6.4 LIMITATIONS OF THE STUDY AND RECOMMENDATIONS FOR FUTURE RESEARCH ........................... 192
6.5 CONCLUSIONS .................................................................................................................................... 197
6.6 REFERENCES ....................................................................................................................................... 199
APPENDIX 1 ........................................................................................................................ 201
APPENDIX 2 ........................................................................................................................ 204
APPENDIX 3 ........................................................................................................................ 205
vi
ABSTRACT
This thesis documents the physicochemical, mineralogical, geochemical and
morphological characteristics of two major soil types present on the interdunal Avenue
Plain in the Upper South East of South Australia. Their evolution in the landscape is
hypothesised. The district has historically been affected by dryland salinity and seasonal
flooding; artificial drainage has been adopted in some areas to ameliorate these
constraints. The study was instigated in collaboration with members of the Keilira Farm
Management Group (KFMG) in response to a perceived decline in pasture growth since
the establishment of the Fairview Drain in the Keilira District in 1997.
A preliminary study was conducted on three properties at Keilira; two included drains
(South and Central sites) and one was un-drained (North), with the aim of investigating
the effects of artificial drainage on soil physicochemical condition. Annual rainfall and
standing water levels (SWL) in a series of observation wells were assessed. Results
showed that groundwater levels have fallen both with a decline in annual rainfall and the
implementation of artificial drainage. The lowering of SWL has facilitated the leaching of
salts, often resulting in the expression of sodicity. Comparison with 1950 (pre-drainage)
data confirmed that a change in soil physicochemical condition has occurred at both
drained and un-drained sites. Poor plant growth was prevalent when the soils were both
chemically hostile and structurally unstable. Soil type and mineralogy were found to vary
both across and within study sites; smectite-dominant soils located at the un-drained
North site exhibited the most hostile chemical conditions for plant growth.
vii
Subsequent studies at the South site used geophysical tools and soil survey to determine
the extent of soil physicochemical variability, whereas mineralogical investigations were
performed to identify their cause. Data from the geophysical surveys were used to locate
the position for a representative soil trench. Soil samples were collected both across the
survey area and within the trench. X-ray Diffraction, X-ray Fluorescence and Transmission
Electron Microscopy analyses were conducted both on whole soil samples and the
separated clay-size fraction. Petrographic analysis of indurated carbonates was conducted
using thin-sections. Carbon and oxygen isotopic analysis was performed to determine the
type and origin of the carbonates present.
Two distinct soil types were detected at the site, a Chromosol overlying indurated
carbonate that supported good pasture growth and species diversity, and a deep saline-
sodic Vertosol that supported only poor pasture growth. The electromagnetic induction
survey revealed discrete conductive zones that most likely relate to the depth of the
groundwater capillary fringe and presence of clay-rich horizons. Ground Penetrating
Radar detected the isolated patches of deep, extremely saline and strongly sodic
Vertosols, in addition to numerous indurated carbonate horizons.
Results confirmed that the variability of soil types and carbonate morphology is related to
position in the landscape and historic oscillations in ground and surface water levels.
Chromosols are predominately found on the eastern side of the Avenue Plain and within
the shorelines of lunettes where calcareous lacustrine sediments were periodically
exposed and modified, resulting in the development of highly indurated palustrine
limestones. These soils are dominated by illite and kaolinite clay minerals that are

viii
stratified above the palustrine barrier; they respond well to artificial drainage and
chemical amelioration.
The Vertosols are located predominately on the western side of the interdunal plain in
the lowest parts of the landscape, such as in the basins of lunettes and throughout
natural drainage lines. These soil types are particularly prone to the development of high
pH, extreme salinity and strong sodicity and can be difficult to ameliorate. One
particularly degraded Vertosol was dominated in surface horizons by the Mg-rich clay
mineral saponite, whereas other horizons contained montmorillonite, sepiolite and
palygorskite, in addition to Mg-rich calcite and ankerite.
In addition to this work the KFMG instigated on-farm research (OFR) to investigate
amelioration strategies. Extension activities were conducted to improve farmer
knowledge and facilitate management change. A survey conducted with the three
farmers intimately involved in the project confirmed that the combination of off-site
research, OFR and regular extension activities improved their knowledge of dryland
salinity, sodicity and soil variability on their farms. Management practices have been
affected as a result.
It is concluded that the decline in pasture growth observed is due primarily to the
sporadic presence of Vertosols that are extremely saline, strongly sodic and very strongly
alkaline. Poor plant growth may also be observed on Chromosols when sodic.

ix
STATEMENT OF DECLARATION
This work contains no material that has been accepted for the award of any other degree
or diploma in any university or other tertiary institution to Melissa Fraser and, to the best
of my knowledge and belief, contains no material previously published or written by
another person, except where due reference has been made in the text.
I give consent to this copy of my thesis, when deposited in the University Library, being
made available for loan and photocopying, subject to the provisions of the Copyright Act
1968.
I also give permission for the digital version of my thesis to be made available on the web,
via the University’s digital research repository, the Library catalogue, and also through
web search engines, unless permission has been granted by the University to restrict
access for a period of time.
Melissa Fraser Date

x
ACKNOWLEDGEMENTS
This research was conducted under the supervision of Associate Professor David
Chittleborough, Dr Jock Churchman and Dr Pichu Rengasamy from the University of
Adelaide (U of A). I was also aided by the assistance and inspiration provided by Richard
Merry (CSIRO), Adrian Beech (CSIRO), Mark Raven (CSIRO), Peter Self (CSIRO) and Colin
Rivers (U of A). Editorial assistance was provided by Margaret Cargill (U of A) whose
contribution was invaluable. The interpretation of petrography was aided by Pontifex and
Associates and geophysical data by Ecophyte Technologies. My sincere and wholehearted
thanks go to all of these people for their patience, guidance and encouragement
throughout my candidature.
This research would not have been possible without the help and input from the three
farmers primarily involved in this project. Their donation of time, land and resources was
crucial to the success of this thesis and I thank them for their enthusiasm, persistence and
willingness to participate. I hope that this research will contribute to improving the
sustainability and viability of their farming systems for years to come.
Financial assistance for this research was provided by the University of Adelaide, School
of Earth and Environmental Science, the CRC for Plant Based Management of Dryland
Salinity, the Future Farm Industries CRC, the Keilira Farm Management Group and South
East Natural Resources Management Board. I am very grateful for the personal and
professional development opportunities that were provided by both the University and
the CRC and would particularly like to thank Daryll Richardson (CRC) and Dr Ron Smernik
(U of A) for their continued enthusiasm for enhancing the PhD experience.

xi
I would also like to thank my family and friends for their support and encouragement
during my 4 years of full-time study and 2 years part-time. Thanks especially go to Jock,
who became a dear friend that I have steadfastly been able to rely upon. Richard Merry
also provided core background knowledge and encouragement and has inspired me to
become a better scientist. I would also like to acknowledge my past university lecturers,
Ann McNeill who gave me the courage to embark on this journey, and Cameron Grant
whose healthy level of criticism encouraged me to do better. A special mention must also
go to my fellow post-grad students who made the journey a little less daunting and the
friends that always had an open office door to listen to my gripes: Debbie Miller, Thea
Williams, David Summers, Kate Langdon and Lisa Le in particular.
Finally I would like to thank my partner, Sean Chalmers, for being brave enough to take
on a relationship with someone mid-way through a PhD. I look forward to embarking on
our newly married life together and to building our home and life in the NT.
xii
THESIS STRUCTURE
This PhD project came to fruition in 2005 when a group of farmers from South Australia’s
Upper South East approached the University of Adelaide to help them investigate a
problem they observed on their farms. I was looking for a new challenge and came on-
board, intrigued by the nature of their concerns and excited about working with a group
of growers and the prospect of incorporating an extension component into my research
project. This thesis documents the studies and activities that were conducted to help the
Keilira farmers understand the cause of declining plant growth across their farms and the
factors that lead to its development. Each Chapter contained herein has been written as
an independent document in a format appropriate for publication in scientific journals;
some degree of repetition therefore occurs since journal articles must be self-contained.
Chapter 1 introduces the problems encountered by the farmers and gives an overview of
the environmental setting for the study. As this environment was/is affected by dryland
salinity, a review of literature follows focusing on saline and sodic soils. As the degree of
structural degradation in sodic soils is affected by clay mineralogy, a review of soil clay
minerals is also included.
Chapter 2 investigates the flux of groundwater levels throughout the study area, with
particular reference to the effect of deep artificial drains. Three core study sites were
selected and the current soil condition is compared to historic data for two key soil types
identified.

xiii
Chapter 3 explains how geophysical equipment was used to identify the location for a
large study trench that was subsequently excavated. Physicochemical data collected
within the trench and from other sampling points allowed inferences to be made about
the features that were detected in the geophysical surveys.
Chapter 4 investigates the study trench in more detail, with particular reference to the
clay mineral and carbonate types and variability present. Based on these data,
hypotheses explaining the evolution of the landscape and the soil types are formulated.
Chapter 5 is an evaluation of the project and its outcomes, including how the knowledge
and skills of the participating growers has changed since the projects inception.
Chapter 6 summarises and discusses the findings from this thesis and makes
recommendations for future research arising from the work presented.
CHAPTER 1
INTRODUCTION
Soils that are affected by sufficient levels of either soil solution or exchangeable sodium
to limit economic and environmental sustainability are broadly categorised as saline,
sodic, or saline-sodic soils (Northcote and Skene 1972). Saline soils contain high
concentrations of soluble salts, impacting on plant growth through osmotic effects (Keren
2000). A different but equally significant threat to plant production is seen in sodic soils.
Sodicity occurs when the concentration of sodium ions on the exchange complex reaches
a level where it disrupts soil structure by swelling and dispersion, severely affecting soil-
water and soil-air relations (Rengasamy and Olsson 1991). Sodicity often occurs when clay
rich saline soils are leached of salts, with dispersion occurring once the electrolyte
concentration falls below a threshold level (Rengasamy and Olsson 1991). Hence, the
expression of sodicity may occur following the amelioration of salinity.
In South Australia’s Upper South East region up to 40% of the land is affected by dryland
salinity alone (National Land and Water Resources Audit and National Heritage Trust
2001). To help combat this problem, the Upper South East Dryland Salinity and Flood
Management Program (USE DS&FMP) was implemented throughout parts of the region.
The expansion of a deep artificial drainage network was one of the strategies employed in
the program, with the aim of lowering soil salinity and intercepting surface flood waters;
in 1997 the Fairview drain was one of the major systems excavated. Since this time, local
land managers have noticed patches of declining pasture growth on the Avenue Plain and

2
were of the opinion that these areas were increasing annually, coinciding with the
extension of the drains and the subsequent reduction of groundwater levels.
The area of concern is situated on the Avenue Plain in the Upper South East (USE) of
South Australia (SA), in an area locally referred to as the Keilira District (Fig. 1.1). At an
average 22 m above sea level, the inter-dunal plain (approximately 8 km wide at Keilira)
was investigated by Blackburn in 1952 and he is the only researcher to have extensively
studied the soils in this area (Hundreds of Minecrow & Townsend). In this study, 20 soil
profiles were collected in late summer and autumn of 1950; 77 soil samples were
subsequently analysed for pH, total soluble salts (%), NaCl (%), CaCO3 (%), C, N & P (%),
and particle size distribution. Blackburn’s observations of the typical soil physicochemical
condition in the Kingston-Avenue Drainage area concluded:
� The soils are mainly alkaline and generally saline as well;
� Calcium carbonate is present in all sampled profiles, though in many it was absent
from the top 7 cm of soil;
� Great variability in the salinity and organic matter occurred in the soils of the
plains;
� Colour was less variable; most of the soils of the plains were either grey or black;
� The vast majority of the soils on the plains were shallow, approximately 7.5 – 45
cm deep, but more commonly between 15 – 30 cm, overlying limestone.
Blackburn’s investigations confirm that the soils at Keilira were once saline, however,
little scientific data on the soils of this region has been collected since the implementation
of broad-scale artificial drainage, despite growing concerns over declining plant growth.

3
Fig. 1.1 Map depicting the South East of South Australia, overlaid with current and proposed drainage alignments. The blue square highlights the Upper South East Region, and the small blue rectangle identifies the Keilira District. Source: SECWMB (2003)
NOTE: This figure is included on page 3 of the print copy of the thesis held in the University of Adelaide Library.

4
Given the relationship between salinity and sodicity, the implementation of the drainage
schemes and the purported reduction in groundwater levels and soil salinity, it is possible
that the degrading effects of sodicity are now being expressed across this landscape, and
are having a detrimental impact on pasture growth.
The farmers also noticed that the affected areas were confined mostly to the western
side of the plains, within 2-3 km of the major drainage alignments. Their fear at that time
was that all of the land parallel to the drains would succumb to the same problem.
Because of the farmers’ observations, the current and future planned expansion of the
drainage schemes and the lack of recent soil investigations, the need to conduct new
research in the region arose. The aim of this study therefore was to investigate the
current physicochemical condition of the soils at Keilira and to identify the cause of
variable plant growth and proliferation in this environment. To undertake such
investigations, it was important to first gain an understanding of the relationship between
salinity and sodicity and the physical and chemical constraints that may be encountered
in this environment; the factors that influence their development and expression, such as
clay mineralogy, also needed to be identified. The following review of the literature is
intended to meet this purpose; it was written at the outset of the project. As the project
progressed it became evident that the review of additional literature was required
(principally on continental carbonates); the literature of interest is contained within the
relevant chapters.
5
1.1 ENVIRONMENTAL SETTING
The area referred to in this thesis as the ‘Keilira District’ is located in the USE of SA on the
Avenue Plain. The land is mainly used for meat and fibre production, grazing livestock on
improved pastures; some cereal cropping is also performed. Geologically, the USE region
is characterised by three key features, the Padthaway Ridge, Murray Basin and Otway
Basin (South East Catchment Water Management Board 2003). Flanked on the western
side by the ocean and the State of Victoria to the east (Appendix 1.1), most of this area is
characterised by dune fields of reworked riverine and littoral deposits (Butler et al. 1983).
Within the Murray Basin more specifically, the Keilira district (360 42’ 32.38”S 1400 09’
46.46”E) is situated 30 km inland from the coastal township of Kingston. Part of the
Bridgewater Formation (Firman 1973), the East and West Avenue Ranges that flank Keilira
belong to a series of stranded coastal dunes that are aligned parallel to the current
coastline. The suite of ridges reportedly contain deposits of calcareous sands, including
fragments of marine organisms, with varying proportions of quartz, resulting in the
development of Podzols1
The numerous inter-dunal plains of the south-east region are more recent and are
generally formed of grey fluviatile silts, sands and gravels, resulting in Solodized solonetz
and Terra rossa soils (Blackburn et al. 1965; Butler et al. 1983).
Rising from 26 – 30 m above sea level, thermoluminescence dating suggests that the East
and West Avenue ranges formed in the Middle Pleistocene, some 414,000 ± 29 and
342,000 ± 32 years ago respectively (Huntley et al. 1993).
1 Australian Soil Classification (Great Soil Group classification): Podosol (Podzol); Chromosol (Terra rossa);
Sodosol (Solodized solonetz) and Vertosol (Rendzina)
6
and Rendzina soils, the latter being restricted to areas of fine textured estuarine or
lacustrine sediments (Blackburn 1983). Limestone is generally found within 0.2 to 0.4 m
of the soil surface, and ranges in form from hard and flinty to fairly soft weathered types
and grey cemented calcareous material underlain by marly material and hard stone
(Blackburn 1952).
The character of the landscape, soils and geology of the South East combined with a
relatively high annual rainfall (climate is further discussed in Chapter 2) has historically led
to annual surface water inundation (flooding) across much of the region (South East
Catchment Water Management Board 2003), including the Avenue Plain. There is a
gentle gradient downwards from east to west on the Avenue Plain, causing surface
waters to gently drain to the west before being intercepted by the eastern side of the
West Avenue Range, directing the flow north-westwards (Appendix 1.2). These features
make the USE prone to frequent and sometimes prolonged surface water inundation
during the winter and spring months (Appendix 1.3). In 1866 Goyder reported accounts of
floodwaters rising 0.3 - 1.8 m above the surface of the soil in this region, with some areas
never drying out completely (England 1993). Before European settlement in this area it is
believed that the floodwaters gradually travelled north, feeding into Salt Creek,
eventually supplying fresh water from the USE to the south lagoon of the Coorong
(England 1993).
The nature of the landscape and surface water inundation therefore leads to a rapid
vertical recharge of a shallow unconfined aquifer within the Murray Group Limestone in
the Murray Basin and the Gambier Limestone of the Otway Basin which is approximately

7
20 m deep (Holmes and Waterhouse 1983). Some recharge of this aquifer may also occur
through upward leakage of water from the confined aquifer in areas where the confining
layer permits movement (South East Catchment Water Management Board 2003).
Unconfined aquifer salinity in the Keilira district is reported to range between 1500 –
7000 mg/L.
The second major groundwater system in the USE is a deep confined aquifer that flows in
a westerly and south-westerly direction from its eastern edge in the Victorian Grampians.
This regional aquifer is primarily recharged by lateral inflow in the eastern parts of the
Murray Basin, flowing through the Dilwyn Formation in the Otway Basin and the Renmark
Group in the Murray Basin. An upper confining layer of clay and marl forms the aquitard
that separates the two aquifers (Holmes and Waterhouse 1983).
Widespread settlement throughout the South East of SA first occurred in the mid 1800’s
and the land was quickly developed for agricultural production, capitalising on the
availability of good quality water and the openness of native vegetation. However,
seasonal inundation was a problem, hence artificial drainage was first constructed near
Millicent from 1864 - 1883 to overcome this problem, ensuring agricultural productivity,
transport routes and communications were not compromised by the annual floodwaters.
However, with no natural relief for the water to escape to the coast, much of the drain
water was channelled to the northwest, increasing the volume of water travelling
throughout the USE region. Over time, artificial drainage networks have gradually
expanded, with an estimated 2,400 km of shallow and deep drains now intercepting
surface floodwater and shallow groundwater across the South East. During the 1950’s the
8
Blackford and Jacky Whites drains were excavated, allowing the waters of the Keilira
district to be discharged to the ocean just north of Kingston. In 1997 extensive
development of the drainage network in the USE was conducted, with the establishment
of the 55 km long Fairview drain further aiding the removal of waters from Keilira.
1.2 SALT-AFFECTED SOILS IN AUSTRALIA
Salt-affected soils are widespread in the arid to semi-arid regions of the world, with much
of this land exhibiting limitations to agricultural productivity; they include saline, sodic,
magnesium, gypsiferous and acid sulphate (Szabolcs 1989) types. Salinity is a widespread
and well known problem in Australia, however Rengasamy and Olsson (1991) highlight
that Australia exhibits the highest ratio of sodic to saline soils across several continents of
the world (Table 1.1). More recently it has been reported that over 60% of soils in
Australian agricultural zones are sodic in comparison to the 16% of agricultural soils
affected by water table induced salinity (Rengasamy 2006).
Table 1.1 The comparative distribution of areas of saline and sodic soils on several continents (10³ Km²). Source: Rengasamy and Olsson (1991).
The map shown in Fig. 1.2 depicts Northcote & Skene’s predicted distribution of saline
and sodic soils in Australia in 1972. The soils in the South East of South Australia are
shown here to be of an alkaline, strongly sodic nature. Given this information, it is
NOTE: This table is included on page 8 of the print copy of the thesis held in the University of Adelaide Library.
9
therefore likely that sodicity also occurs in the Keilira District in addition to salinity and
may further suppress plant growth and proliferation through the effects of dispersion.
Fig. 1.2 Distribution of Saline and Sodic soils in Australia.
1.3 SOIL SALINITY
Salt can occur naturally in the regolith of agricultural land due to rock mineral weathering,
from deposits of oceanic derived atmospheric salts and through submergence by
seawater. It is generally believed that prior to agricultural development salt
accumulations on the surface of the soil were leached through the profile by percolating
rain, accumulating below the root zones of native vegetation. Leaching potential was not
great enough to allow the transport of salts into the deep groundwater (Rengasamy
2002a) and environmental degradation was limited as the landscape was vegetated by
tolerant species and the hydrological cycle was in equilibrium. However, in Australia,
rising shallow groundwater levels have resulted from the disturbance to the equilibrium
in the hydrological cycle (Ghassemi et al. 1995), principally brought about by the
NOTE: This figure is included on page 9 of the print copy of the thesis held in the University of Adelaide Library.
10
extensive clearing of native vegetation since European settlement for agricultural
purposes. The reduction in perennial and deep-rooted vegetation and increase in
production of annual shallow rooted species has resulted in a reduction of water usage. In
places, this has enabled excess water to recharge aquifers, resulting in increases in the
volume of groundwater in these areas. Such rising groundwater levels enable the
mobilisation of stored salts from deep in the regolith, transporting soluble salts back to
the surface. These salts can concentrate and accumulate in the root zone and on the soil
surface as evaporation of soil moisture from depths of up to 2 m (Rengasamy 2002a) can
occur.
Salinisation is identified as the process whereby the concentration of total dissolved
solids in water and soil is increased due to natural or human-induced processes
(Ghassemi et al. 1995); these are termed as primary and secondary salinity respectively.
Primary or naturally saline soils occur in regions where accumulations of salts occur
naturally, and are expressed in the landscape due to naturally shallow groundwater,
unaffected by European land use changes (Fitzpatrick 2003). Salt lakes, saltpans, salt
marshes and salt flats are all examples of naturally occurring saline areas (Shaw et al.
1997). Secondary saline soils are caused by rising saline groundwater and
characteristically possess high salt accumulations due to evaporative water loss in saline
seeps (Fitzpatrick 2003) and this is commonly identified as dryland or seepage salinity.
Figure 1.3 demonstrates some of the processes of induced salinisation.
11
Fig. 1.3 Causes and effects of induced land salinity. Source: (EPA 2000)
Secondary irrigation-induced salinity can also occur as a result of water applied during
irrigation. Poor management of irrigated crops can lead to an excess of water leaching
past the root zone, aiding recharge to the groundwater (Shaw et al. 1997). The rising
groundwater can again mobilise salts, bringing them to the surface and into the root zone
where the increased salt concentration can have detrimental osmotic effects on the
irrigated crop.
Another form of salinisation occurs from accumulations of salts derived from wind and
rain and soil weathering reactions. Salt that is deposited in this way can accumulate in
NOTE: This figure is included on page 11 of the print copy of the thesis held in the University of Adelaide Library.

12
soils with poor hydraulic conductivity (such as sodic soils), in low rainfall dryland areas, in
areas of high vegetative transpiration and climates that induce high evaporation during
summer months. It is known as dry saline land or transient salinity, can be subsoil or
surface-expressed, and is not associated with groundwater fluctuation (Rengasamy
2002a).
1.3.1 Salinity in the USE
Soil surveys conducted by Blackburn in the Kingston-Avenue area in 1950 identified areas
of saline soils and the presence of salt tolerant vegetation. Attention was drawn to the
spread of salt-water tea tree populations across the Avenue plains, possibly indicating an
increase in dryland salinity throughout this area. Northcote and Skene’s map of saline and
sodic soils categorise the soils in this area as being AS1; having alkaline strongly sodic and
sodic clay soils intergrading to saline forms or to normal forms.
In the Upper South East it is estimated that primary salinity currently affects 22,500 ha of
land while secondary salinity affects over 250,000 ha (Barnett 2000) accounting for 40%
of the total land area. Another 409,500 ha of land is at risk of becoming salt-affected by
2050 if no further management strategies are implemented throughout the region
(National Land and Water Resources Audit and National Heritage Trust 2001). It is
estimated that an average of 700,000 tonnes of rain-borne salt is deposited in the South
East catchment (including the Keilira district) annually, and 710, 000 tonnes of salt are
removed from the catchment in the drainage networks throughout the region.

13
1.3.2 Effects of salts on plants and soils
Osmosis, or the diffusion of water across a membrane, is the process by which plants take
up water from soil (Raven and Johnson 1996). Detrimental effects on plant growth due to
osmotic processes occur when the concentration of salts in the soil solution affects the
osmotic gradient of plant roots. In non-saline environments, an osmotic gradient is set up
by the plant with a higher concentration of solutes in the core of the root relative to soil
water. As the plant uses water, suction is created in the plant and water is able to pass
through the root cell membrane to deliver water in an attempt to achieve equilibrium
between the root and soil solutions. When a soil is saline, the concentration of solutes in
the soil is higher and the gradient between the soil solution and the root solution is
reduced, making it harder for the plant to extract water. If soil salt loads are highly
elevated, the osmotic potential of the soil decreases to a point where the plant can no
longer extract water from the soil. As dehydration of the plant cells occur, stomata begin
to close, resulting in a reduction of photosynthesis, detrimentally affecting plant growth,
and plant death may occur (Buck et al. 2004). Prolonged exposure of plants to saline
environments can lead to the uptake and accumulation of toxic ions such as Na, Cl and
HCO3. This accumulation may lead to the interference of normal cell function, disrupting
plant growth, also potentially causing plant death. Electrical Conductivity of a 1:5
soil:water solution (EC1:5) however, does not give an accurate indication of the salt load
that plant roots are exposed to insitu, so soil texture has to be accounted for (Adcock et
al. 2007). The guidelines (Shaw 1999) presented in Table 1.2 are proposed for soils with
differing clay contents.
14
Table 1.2 Soil salinity ratings for Electrical Conductivity of a 1:5 soil:water solution in dSm-1 for different soil textures as determined by Shaw (1999), in Hazelton and Murphy (2007)
The effects of salts on soil are wide and varied, depending on soil type and chemistry, salt
type and concentration and position in the landscape. Saline conditions generally have
detrimental effects on plant growth, as previously discussed, and they can in some cases
result in a total loss of plant growth and resultant soil cover. Bare salt scalds can develop,
leaving vast tracts of land exposed to the degrading effects of wind and water erosion,
dependant on their position in the landscape. Unprotected saline soils on hill slopes and
in gullies are prone to a loss of soil with the development of blowouts and deep rills.
The most commonly reported effect of salts on soils is the development of sodicity while
other degradational effects are not well reported. The presence of salt in coarse textured
soils (dominated by sand) has very little effect on soil structure or chemistry, because
quartz minerals do not possess charge and their structural development is minimal. Salt
accumulation in clay soils, however, can have significant impacts on soil physicochemical
properties. Clays have a net negative charge and can therefore attract cations,
predominately calcium, magnesium, sodium and potassium. In environments where
NOTE: This table is included on page 14 of the print copy of the thesis held in the University of Adelaide Library.
15
saline waters are rich in sodium chloride, the presence of excess sodium ions can
dominate exchange sites, displacing calcium and magnesium. Smectite clay minerals in
particular naturally possess the ability to shrink and swell during changing moisture
regimes and this process is enhanced by the presence of sodium, which attracts water
into the clay minerals. Depending on the total concentration of electrolytes in solution,
clay particles will either flocculate or disperse. Soils that disperse due to the presence of
sodium ions are identified as being sodic and are discussed in detail in section 1.4.
1.4 SODICITY
Sodic soils have historically been defined by their exchangeable sodium percentage value
(ESP); a soil is considered to be sodic when the ESP is >6 and those with an ESP >15 as
strongly sodic (Northcote and Skene 1972). The later is the value proposed by the United
States Salinity Laboratory Staff (1954) above which soils are considered to exhibit adverse
properties. Rengasamy (2003), however, states that a soil may also be considered sodic
when the exchangeable sodium reaches a concentration where it disrupts soil structure
through a breakdown of soil aggregates, due primarily to the dispersion of clay particles.
All sodic soils are dispersive, whereas all dispersive soils need not be sodic. Because of
enhanced dispersion, sodicity causes major soil structural decline, principally a loss of
porosity that results in poor soil-water and soil-air relations and leads to adverse affects
on plant growth and crop production (Rengasamy 2002b). Sodic soils often exhibit surface
sealing, crusting and hardsetting which commonly cause restricted infiltration,
waterlogging, increased runoff and erosion to occur (Naidu et al. 1995). Such soil
constraints limit the availability of water and nutrients to plants and can have dire
consequences for agricultural productivity.

16
1.4.1 Exchangeable Sodium Percentage
Soils with sodic properties are characterised by moderate to high exchangeable sodium.
The percentage of negative charge occupied by sodium is known as the exchangeable
sodium percentage (ESP). ESP is often used as a measure of sodicity and is determined by
analysing the solid phase of the soil.
ESP = (exchangeable sodium / cation exchange capacity) x 100
Northcote and Skene (1972) proposed a classification for Australian sodic soils (Table 1.3),
whereby soils with an ESP greater than 6 are considered to be sodic. However, it has been
found that the extent of soil structural degradation by dispersion varies depending on
electrolyte concentration (EC) and ESP, the nature and content of organic matter, soil pH,
clay content and mineralogy, dominance of calcium vs. magnesium and soil biology
(Rengasamy et al. 1984; Chorom et al. 1994; Churchman et al. 1995; Barzegar et al. 1997;
Nelson and Oades 1997; Grieger 1999).
Table 1.3 Sodicity ratings and ESP proposed for Australian Soils by Northcote and Skene (1972).
An alternative determination of the content of exchangeable sodium in soils can be
calculated by measuring the Na, Ca and Mg in a soil solution, obtained from either a 1:5
soil:water extract or from a saturation extract. Cations in soil solution move freely
between the soil solution and exchange sites, maintaining equilibrium between adsorbed
ions and those in solution, however, divalent ions are adsorbed more strongly than
NOTE: This table is included on page 16 of the print copy of the thesis held in the University of Adelaide Library.
17
monovalent ions. Based on this concept, sodium adsorption ratio is defined as follows
(Rengasamy 2003):
SAR = Na+/ �������++ Mg² +) / 2
Where Na+, Ca²+ and Mg²+ refer to soluble ionic concentrations in meq L¯¹
It has been found that the SAR measured from saturation extracts often is approximately
equal to the ESP of a soil and while the relationship may vary depending on several
factors, SAR can be considered to be a measure of sodicity (Rengasamy 2003).
1.4.2 The deterioration of soil structure by dispersion
Dispersion occurs when the electrical double layers of two soil clay particles over-lap or
interact. The diffuse double layer refers to the alternate layers of negative and positive
charges that exist between a clay particle surface and the soil solution. As the distance
from the soil particle face increases, there are progressively more anions in the solution
until the electrical neutrality of the bulk solution is reached, in which the number of
cations equals the number of anions (Buck et al. 2004). The diffuse double layer, in effect,
occupies the space between the clay surface and the soil solution and has a thickness less
than one-millionth of a centimetre, governed by two main factors, the ionic strength
(electrolyte concentration) of the solution and the cation valence. The thickness of the
diffuse double layer decreases with an increase in the ionic strength, it is then said to
become compressed. The diffuse double layer further compresses when the exchange
sites are dominated by polyvalent cations such as calcium and magnesium. The double
layer expands when the exchange sites are dominated by monovalent ions such as
sodium (Quirk 1968).

18
When two clay particles with a high concentration of monovalent sodium counter ions
come close together, the double layers can overlap or interact, resulting in the total
concentration of ions mid way between the two particles to be greater than in the soil
solution in which the particle is immersed (Buck et al. 2004). The resultant change in
osmotic pressure draws water between the particles, causing them to move further apart.
In smectitic soils particularly, the expansion may be reversible for high soild:solution
ratios, and the effect if known as swelling. In the presence of low electrolyte water, a
sodic soil may move one stage further towards disruption so that the particles become
dispersed completely from one another, severely affecting soil physical characteristics.
Fig. 1.4 Dispersion and flocculation of soils as affected by EC and ESP. Source: (Pichu Rengasamy, The University of Adelaide, pers. comm. March 2006)
If the electrolyte concentration of the soil solution is high enough, the osmotic potential
between soil solution and the inter-clay spaces is reduced enough to prevent dispersion
and enhance flocculation, even in soils dominant in sodium (Fig. 1.4). The deleterious
19
effects of sodium are therefore often only evident once salts have been leached below a
threshold level (Rengasamy 2002b). Soils that are affected by salinity therefore have a
tendency to express sodic behaviour after amelioration strategies to lower soil EC have
been implemented.
1.4.3 The nature and content of organic matter and clay dispersion
Organic matter and its various fractions commonly contribute to both the formation and
the stabilisation of soil aggregates but, under some circumstances, specific fractions of
organic matter can also destabilise aggregates and increase the dispersibility of clay and
silt sized materials (Kay and Angers 2000). The effect of organic matter in sodic soils is
complex and is only discussed briefly here, the reader is referred to Churchman et al.
(1995), Nelson and Oades (1997), Baldock and Nelson (2000) and Kay and Angers (2000)
for a more detailed discussion on the role of organic matter in sodic soils.
Sodic soils often exhibit low organic matter contents as plant productivity is affected by
the physical and chemical constraints generated by the presence of excess exchangeable
sodium. Soil structure further degrades in the absence of the plant roots, polysaccharides
and fungal hyphae (Tisdall et al. 1997) that generally stabilise macro-aggregates (Barzegar
et al. 1997).
The presence of organic matter can both suppress swelling and enhance dispersion, often
at the same time (Churchman et al. 1995). In the first instance, Churchman et al. (1995)
conclude that in some soils swelling is probably suppressed as organic matter acts as a
coating and linking agent, lowering the surface area of the soil minerals with which it is

20
associated. In the second instance, humic substances, the more persistent components of
organic matter, can aid dispersion in soils as organic anions decrease the activity of
multivalent cations such as Ca through complexation (Barzegar et al. 1997), therefore
increasing the SAR of the soil solution.
Nelson and Oades (1997) also note that an increase in organic matter in the soil can result
in the production of weak acids that may lower the pH of the soil. Lowering the pH of the
soil will lower the net negative charge of the clay minerals and will aid in suppressing
dispersion. In contrast, however, the presence of some types of organic matter in clay
soils can also increase the net negative charge of soil clay minerals, enhancing clay
dispersibility, especially at high pH.
1.4.4 Soil pH and clay dispersion
Much of the behaviour of soils is governed by the nature of the surfaces of soil particles,
particularly their surface area and charge (Rengasamy and Churchman 1999) and it is the
presence of exchangeable cations on exchange sites that ultimately determines the
degree of swelling and dispersion of clay minerals. Chorom et al. (1994) found that in a
study of three soils, each dominated by one of three different soil minerals, all the soils
exhibited a reduction in net negative charge when the pH(water) went below 6 and the
percentage of dispersible clay reduced considerably. At lower pH values, mineral
dissolution caused an increase in EC, further aiding flocculation in addition to the effect of
the reduction in net negative charge. When the pH was increased, an increase in net
negative charge was observed corresponding with an increase in dispersible clay
percentage.
21
In addition to the constraints posed to plant production through salinity and sodicity,
alkalinity is a common subsoil constraint observed in south-eastern Australian soils. In
sodic soils, alkaline conditions (pH >8.5) are also often observed as sodium ions interact
with carbonate and bicarbonate ions in the soil matrix and NaCO32- / HCO3
- minerals are
formed (Rengasamy 2002b). The hydrolysis of these minerals releases free OH¯ ions into
the soil solution, further increasing the pH, hence enhancing dispersibility. Highly alkaline
conditions may also lead to plant deficiencies of P and N, micronutrient deficiencies (Zn,
Cu, Mn, Fe) and/or toxicities of B and molybdenum (Adcock et al. 2007). The ratings
presented in Table 1.4 are given as an interpretation of soil pH measured in water (1:5
soil:water).
Table 1.4 Soil pH ratings for neutral – very strongly alkaline soils, in Hazelton and Murphy (2007).
1.4.5 Mineralogical composition and dispersion
Kaolinite, illite and smectite are the three most common aluminosilicate minerals found
in the clay fractions of soils (Churchman et al. 1995). Kaolinites and illites exhibit very
little swelling while smectites are capable of substantial swelling, especially in the
presence of monovalent exchangeable cations in low EC solutions. The shrink - swell
nature of smectitic clays can mask the degradative effects of sodicity, as the soils have the
ability to ‘heal’ themselves through their self-mulching behaviour, aiding the break up of
NOTE: This table is included on page 21 of the print copy of the thesis held in the University of Adelaide Library.

22
compacted layers. Kaolinitic soils are often acidic when they are not greatly affected by
the presence of sodium, but kaolinitic soils can exhibit sodic behaviour under high pH
conditions. Nonetheless, kaolinitic soils are often coarse-textured, which diminishes the
effects of clay dispersion (Churchman et al. 1995). Illitic soils can exhibit severe
degradation, as illites are highly susceptible to dispersion (Emerson 1983) when sodic
because of their particle size and shape, but lack the ability to shrink and swell (Fanning et
al. 1989).
1.4.6 Dominance of calcium vs. magnesium
High levels of exchangeable Mg in the soil have been shown to enhance the dispersion of
some soils that also have high ESP’s. A study by Rengasamy et al. (1986) found higher
concentrations of magnesium salts than calcium salts were required to induce
flocculation in a Red Brown Earth. Ca2+ and Mg2+ ions are both divalent and therefore
bind more strongly to clay minerals than Na+ ions. Mg2+ ions, however, have a larger
hydrated diameter than Ca2+ ions and therefore do not bind as strongly as Ca2+ ions. Since
the repulsive force in an exchangeable calcium dominated clay is smaller, the aggregates
in a calcium soil are more stable (Rengasamy et al. 1986) than those in an exchangeable
Mg2+ dominated soil. Exchangeable Mg2+ does not however have the same level of
influence over dispersive behaviours as does exchangeable Na+ (Buck et al. 2004).
1.4.7 Soil biology
Baldock and Nelson (2000) define resilience as the capacity of an ecosystem to return to
its initial state after disturbance. Resilience is an important soil property and an indicator
of how well a soil system is able to recover from external disruptions. Together with soil
23
resistance (the inherent capacity to withstand disturbance) it ultimately defines the
stability of a soil (Krull et al. 2005). There is a dearth of information relating to the role of
soil biology in sodic soils. It is believed, however, that soils with a greater microbial
diversity are more resistant to perturbations and more resilient than soils with less
diverse communities.
1.4.8 Mechanical disturbance and clay dispersion
Mechanical disturbance (e.g. when aggregates of soils and clay minerals are disturbed
when wet) can cause clay dispersion, even in the absence of sodium (Chorom et al. 1994).
Mechanical dispersion commonly occurs when heavy machinery and agricultural
implements are passed over or worked through the soil following a rainfall event. Areas
that are affected by sodicity often suffer greater structural degradation as the lower
hydraulic conductivity generates waterlogged conditions, enabling strong disturbance to
occur during cropping operations.
1.4.9 Sodicity and clay dispersion, effects on soil permeability and water holding
characteristics
So and Aylmore (1995) report that the hydraulic conductivity (HC) of a soil is an important
parameter used to assess plant growth, soil aeration, soil water recharge, surface runoff,
erosion and evapotranspiration. Factors that influence HC are numerous and include
texture, structure, soil moisture, biological activity, electrolyte concentration of the soil
solution and ESP (Coulombe et al. 1996). As HC reduces in a soil, rates of infiltration (IR),
redistribution (or drainage) and evaporation are also reduced (So and Aylmore 1995).
These conditions are conducive to the development of waterlogging, potentially having
24
severe impacts on seed germination at planting, and reducing the amount of oxygen
available to crop roots. Whereas an initial increase in evaporation may be observed in a
waterlogged soil, the rate of drying often exceeds the HC of the soil, and the surface may
dry rapidly, forming a surface crust. This crust subsequently reduces the evaporation of
moisture from the soil, further enhancing the waterlogged conditions (So and Aylmore
1995).
In sodic soils, as ESP increases and EC decreases, the HC of the soil is significantly reduced
(Shainberg and Letey 1984). There are various reasons why a decrease in HC is observed
in sodic soils. In highly smectitic soils, swelling of particles may contribute to the initial
reduction of HC as the high adsorption capacity of sodium ions for water causes swelling,
possibly causing blockage to the surrounding water-conducting pores.
As previously discussed, as ESP increases and EC decreases, the potential for clay
dispersion also increases, especially in illitic and smectitic soils. These mobile clay
particles are then able to translocate throughout the soil matrix, often blocking soil pores,
further reducing HC. Whereas the process of swelling is generally reversible with changing
soil moisture regimes and electrolyte concentration, the movement and blocking of pores
with dispersed clay is largely irreversible and can cause the formation of impermeable
clay layers in the soil profile (Shainberg and Letey 1984). These layers can act as physical
barriers to water movement and root growth, and can also aid the accumulation of salts
in the root zone and resultant development of transient salinity.
25
Plant root growth and seedling emergence can also be affected due to the suppressing
effects of high soil strength. Barzegar et al. (1995) conducted a study to investigate
changes in tensile strength of Australian soils in relation to the properties of the soil clay.
The results of this investigation led to the conclusion that soil strength was highly related
to clay content, clay type, CEC of clay and the amounts of clay dispersed either
spontaneously or mechanically. Clay soils dominated by smectite minerals of fine size and
high CEC were found to result in the highest tensile strength compared to illitic and
kaolinitic soils.
1.5 SOIL MINERALOGY
The texture of a soil is determined according to the proportions of different sized
particles present in the soil. Particle size classes of soils recognised by the U.S.D.A system
include gravel, very coarse sand, coarse sand, medium sand, fine sand, silt and clay
(White 1997). The clay fraction of soils contains particles that are two micron (μm) in
size and smaller and this fraction of the soil can contain a large assortment of minerals.
The clay fraction of soils can be divided into two broad classes by type, the crystalline clay
minerals (predominantly phyllosilicates) and the accessory minerals (non-phyllosilicates).
Minerals in the clay fraction have large surface areas that are chemically active and can
hold a variety of cations and anions by various mechanisms. It is the presence of cations
on clay mineral surfaces that give them many of their characteristic properties, including
plasticity and the ability to absorb water and swell (Norrish and Pickering 1983).

26
This fraction is also responsible, along with organic matter, for holding nutrient elements
and water for use by plants, and for reducing the susceptibility to leaching. The
crystalline clay minerals found in the <2 μm fraction of the soil include the fine-grained
layer lattice silicates (phyllosilicates) kaolinite, illite and smectite.
1.5.1 Kaolinite
Kaolin minerals, which include kaolinite and less commonly halloysite, are 1:1 layered
aluminosilicates, with layers comprising one tetrahedrally coordinated silicon-based sheet
combined with one octahedrally coordinated aluminium sheet via shared oxygen atoms.
The lower surface of each layer consists of closely packed hydroxyl (OH) groups, and the
upper surface of hexagonal rings of oxygen atoms, as seen in Figure 1.5. Layers are held
together by hydrogen bonding between the hydrogen and oxygen atoms of adjacent
layers. Kaolinite is a non-expanding mineral (in water) with a basal spacing of 7 Å
(McLaren and Cameron 1996).
Compared to other clay minerals, the layer charge of kaolinite is extremely low (<0.005
mol of negative charge per unit cell), due primarily to the small amount of Al substitution
for Si in the tetrahedral layer (McLaren and Cameron 1996). This amount of isomorphous
substitution results in a low cation exchange capacity (CEC) to be observed, usually in the
range of 1-10 cmol(+)/kg. Norrish and Pickering (1983) comment however, that at least
part of the exchange capacity is pH dependent, indicating that some variable charge
arises from dissociation of H+ and OH- ions at the crystal edges. Since the basal spacing of
kaolinites does not leave room for interlayer cations, all of the charge-compensating
cations are adsorbed on the exterior surfaces of a stack of layers (van Olphen 1977).

27
1.5.2 Illite
Illites are dioctahedral clay micas that have 2:1 (tet:oct) structures, consisting of a sheet
based on octahedrally coordinated cations between two tetrahedrally coordinated silica
sheets (Fig. 1.6). The unit layers have (non-exchangeable) K ions holding them together,
these positive ions balancing the negative charge created by isomorphous substitution of
Al for Si in one fourth of the tetrahedral sheet, and in some cases Mg for Al (Norrish and
Pickering 1983). Some substitution of Mg and Fe for Al in the octahedral sheet is also
possible, contributing to the average net negative charge of 1.6 mol per unit cell.
Illites are also non-expanding minerals with a basal interlayer spacing of about 10 Å
(Norrish and Pickering 1983), however this spacing can increase as the mineral weathers
and K is gradually replaced by cations of higher ionic potential, principally Ca and Mg
(White 1997). In contrast to smectite minerals, only the external cations of illite clays are
exchangeable as a consequence of the strong association of interlayer potassium with the
Kaolinite
Tetrahedral Sheet
Octahedral Sheet
Fig. 1.5 1:1 (Tetrahedral: Octahedral) layer Phyllosilicate, kaolinite (Grim 1962).
NOTE: This figure is included on page 27 of the print copy of the thesis held in the University of Adelaide Library.

28
layers, resulting in a smaller cation exchange capacity, despite the higher degree of
isomorphous substitution and resultant layer charge. The CEC of illites is considered to be
in the range of 20 – 40 cmol(+)/kg (Norrish and Pickering 1983).
Illite
Tetrahedral Sheet Octahedral Sheet Tetrahedral Sheet Interlayer space Tetrahedral Sheet
Fig. 1.6 2:1 layer Phyllosilicate, illite (Grim 1962).
1.5.3 Smectite
Smectites are a group of expansive 2:1 layer silicate minerals and as in micas (illite) the
layer has a negative charge due to isomorphous substitution, giving rise to a variety of
chemical compositions resulting in the formation of the different major minerals in this
group (Table 1.5). Substitution of Al for Si in the tetrahedral sheet is sometimes observed,
while Al is commonly replaced by Mg in the octahedral sheet (Fig. 1.7), but can also be
replaced by Fe, Cr, Zn, and Li, creating a layer charge ranging between 0.4 - 1.2 mol of
negative charge per unit cell (White 1997).
NOTE: This figure is included on page 28 of the print copy of the thesis held in the University of Adelaide Library.
29
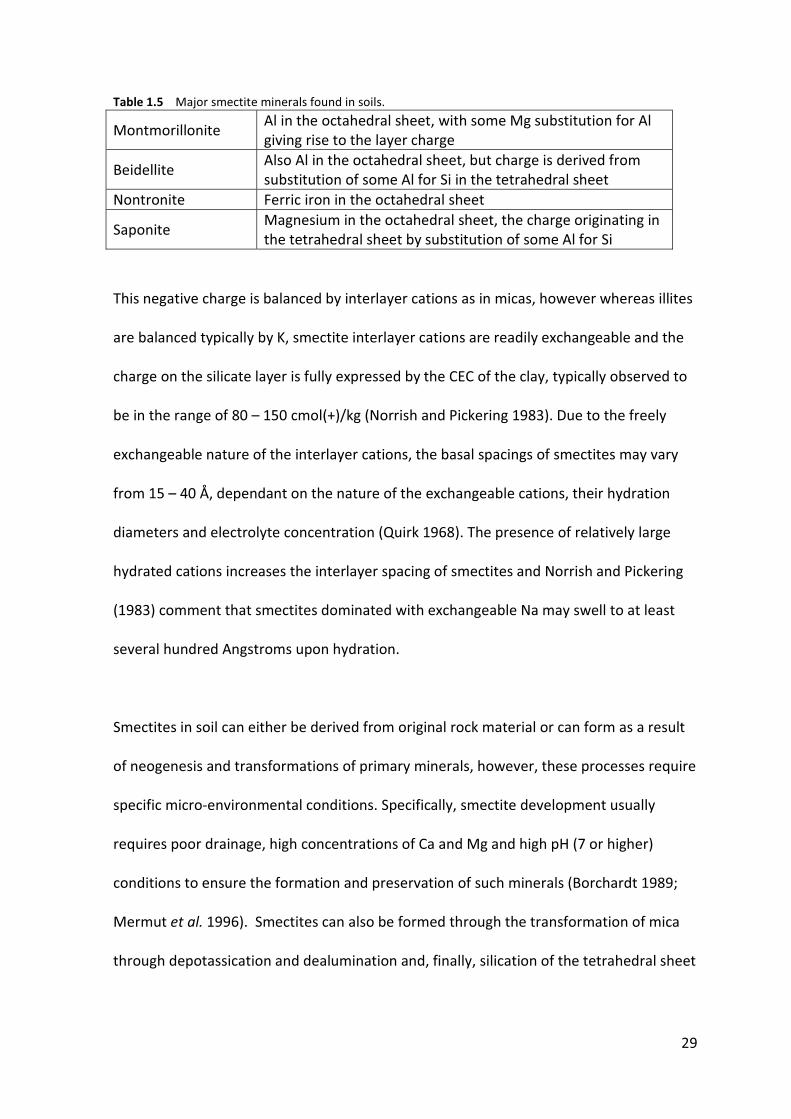
Table 1.5 Major smectite minerals found in soils.
Montmorillonite Al in the octahedral sheet, with some Mg substitution for Al giving rise to the layer charge
Beidellite Also Al in the octahedral sheet, but charge is derived from substitution of some Al for Si in the tetrahedral sheet
Nontronite Ferric iron in the octahedral sheet
Saponite Magnesium in the octahedral sheet, the charge originating in the tetrahedral sheet by substitution of some Al for Si
This negative charge is balanced by interlayer cations as in micas, however whereas illites
are balanced typically by K, smectite interlayer cations are readily exchangeable and the
charge on the silicate layer is fully expressed by the CEC of the clay, typically observed to
be in the range of 80 – 150 cmol(+)/kg (Norrish and Pickering 1983). Due to the freely
exchangeable nature of the interlayer cations, the basal spacings of smectites may vary
from 15 – 40 Å, dependant on the nature of the exchangeable cations, their hydration
diameters and electrolyte concentration (Quirk 1968). The presence of relatively large
hydrated cations increases the interlayer spacing of smectites and Norrish and Pickering
(1983) comment that smectites dominated with exchangeable Na may swell to at least
several hundred Angstroms upon hydration.
Smectites in soil can either be derived from original rock material or can form as a result
of neogenesis and transformations of primary minerals, however, these processes require
specific micro-environmental conditions. Specifically, smectite development usually
requires poor drainage, high concentrations of Ca and Mg and high pH (7 or higher)
conditions to ensure the formation and preservation of such minerals (Borchardt 1989;
Mermut et al. 1996). Smectites can also be formed through the transformation of mica
through depotassication and dealumination and, finally, silication of the tetrahedral sheet
30
(Mermut et al. 1996). These conditions are so critical that smectites can transform to
kaolinite plus iron oxide as a result of improved drainage.
Smectite
Tetrahedral Sheet Octahedral Sheet Tetrahedral Sheet Interlayer space Tetrahedral Sheet Fig. 1.7 2:1 layer Phyllosilicates with Al, Fe, Mg substituted for Si in Oct Sheet, smectite (Grim 1962).
Borchardt (1989) elaborates by commenting that the weathering rates of smectites can
be increased to a rate where even intermediately stable minerals are not formed in the
presence of drastically improved soil drainage. Smectite can be dissolved through simple
hydrolysis, and the high acidity produced by the oxidation of pyrite (common in poorly
drained sediments) further aids dissolution. Some smectites can tolerate low pH, but only
in the presence of high concentrations of Si and Mg in solution and when leaching is
restricted.
NOTE: This figure is included on page 30 of the print copy of the thesis held in the University of Adelaide Library.
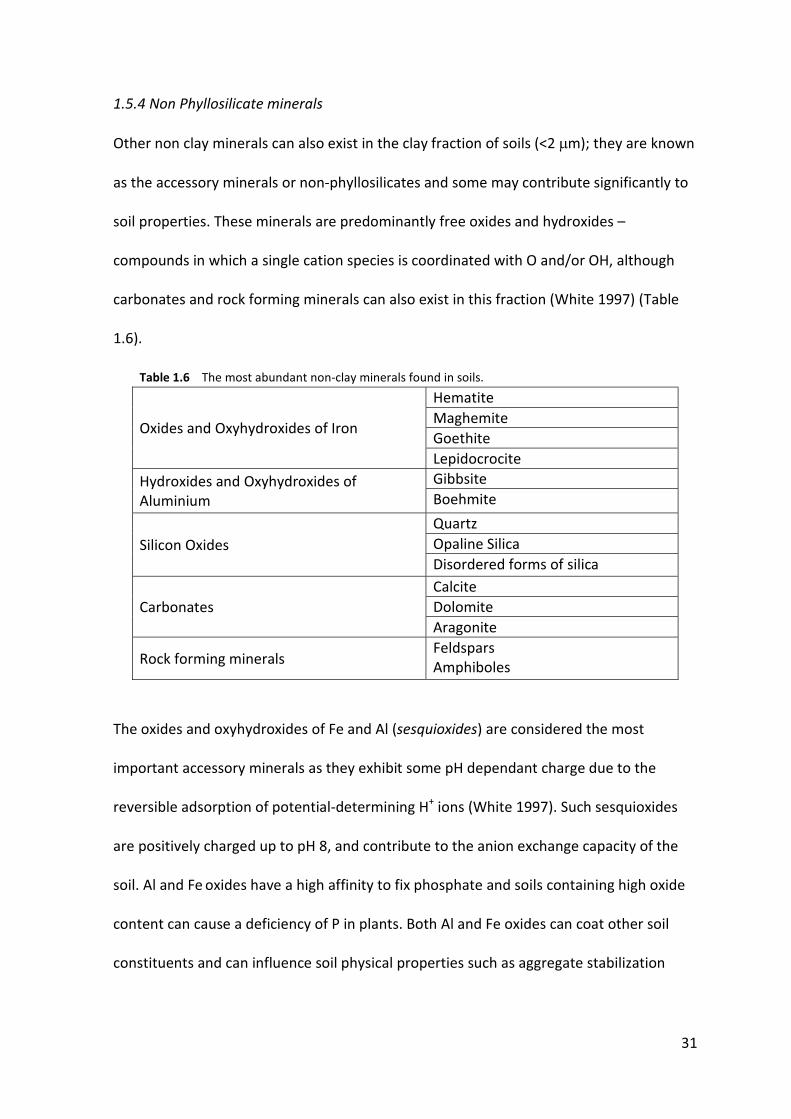
31
1.5.4 Non Phyllosilicate minerals
Other non clay minerals can also exist in the clay fraction of soils (<2 �m); they are known
as the accessory minerals or non-phyllosilicates and some may contribute significantly to
soil properties. These minerals are predominantly free oxides and hydroxides –
compounds in which a single cation species is coordinated with O and/or OH, although
carbonates and rock forming minerals can also exist in this fraction (White 1997) (Table
1.6).
Table 1.6 The most abundant non-clay minerals found in soils.
Oxides and Oxyhydroxides of Iron
Hematite Maghemite Goethite Lepidocrocite
Hydroxides and Oxyhydroxides of Aluminium
Gibbsite Boehmite
Silicon Oxides Quartz Opaline Silica Disordered forms of silica
Carbonates Calcite Dolomite Aragonite
Rock forming minerals Feldspars Amphiboles
The oxides and oxyhydroxides of Fe and Al (sesquioxides) are considered the most
important accessory minerals as they exhibit some pH dependant charge due to the
reversible adsorption of potential-determining H+ ions (White 1997). Such sesquioxides
are positively charged up to pH 8, and contribute to the anion exchange capacity of the
soil. Al and Fe oxides have a high affinity to fix phosphate and soils containing high oxide
content can cause a deficiency of P in plants. Both Al and Fe oxides can coat other soil
constituents and can influence soil physical properties such as aggregate stabilization

32
(Krishna Murti et al. 1977) and the swelling and dispersion characteristics of the soil
(Taylor et al. 1983).
Oxides of manganese and titanium also exist in soils, but contribute little to the chemical
and physical properties of the soil and thus are not discussed here. Carbonates such as
calcite can also occur in soils formed on chalk and limestone and in high pH soils of arid
regions. Carbonates affect soils mainly through their effects on altering pH.
1.6 CONCLUSION
Saline and sodic soils are both widespread across Australia’s agricultural land and can
cause major limitations to crop and pasture productivity. Salinity is known to occur in the
Keilira District of USE SA and deep drainage schemes have been employed to help
ameliorate this problem. In saline environments, however, sodic soils will only remain
stable as long as the EC of the soil solution remains high enough to induce flocculation.
Hence, the expression of sodicity has been found to occur following the remediation of
saline soils, with high exchangeable sodium in the presence of low EC soil solutions
facilitating the dispersion of clay particles, causing subsequent structural decline.
The purpose of the artificial drainage has been to intercept surface flood waters and to
lower groundwaters to facilitate leaching, thereby reducing soil salinity levels. Northcote
and Skene (1972) reported that the soils in the vicinity of the Keilira District were
moderately to strongly sodic, and it is therefore possible that the effects of sodicity are
now being seen across this landscape as the drains serve their purpose. Alkalinity is also a
constraint in Australian soils that is known to occur in conjunction with sodicity. As the
expression of sodicity is governed by many factors, such as pH, clay mineralogy and cation

33
ratio, in addition to soil EC and ESP, it is therefore crucial that a thorough assessment of
the soils in this region be conducted to determine the factors that are detrimentally
affecting plant growth.
1.7 HYPOTHESES
Given these conclusions, the following hypotheses are proposed:
1. That the observed decline in pasture growth is the consequence of multiple soil
physicochemical constraints, including salinity, sodicity and alkalinity.
2. That the physicochemical condition of the soil has been altered as a consequence
of artificial drainage.
3. That the development of soil physicochemical variability is a function of:
i. Hydrology
ii. Position in the landscape
iii. Clay mineralogy
4. That farmer knowledge of the problem and how to manage it can be improved by
interaction with researchers.
34
1.8 REFERENCES
Adcock D, McNeill AM, McDonald GK, Armstrong RD (2007). Subsoil constraints to crop production on neutral and alkaline soils in south-eastern Australia: a review of current knowledge and management strategies. Australian Journal of Experimental Agriculture 47, 1245-1261. Baldock JA, Nelson PN (2000). Soil Organic Matter. In 'Handbook of Soil Science'. Eds M E Sumner. B25-B84. CRC Press: Boca Raton, USA. Barnett SR (2000). Extent and impacts of dryland salinity in South Australia. National Land and Water Resources Audit, PIRSA Report Book 2000/00045, South Australia. Barzegar RA, Nelson PN, Oades JM, Rengasamy P (1997). Organic Matter, Sodicity and Clay Type: Influence on Soil Aggregation. Soil Science Society of America Journal 61, 1131 - 1137. Barzegar RA, Oades JM, Rengasamy P, Murray RS (1995). Tensile strength of dry, remoulded soils as affected by properties of the clay fraction. Geoderma 65, 93 - 108. Blackburn G (1952). The Soils of the Kingston-Avenue Drainage Area, South Australia. CSIRO Division of Soils, Melbourne. Blackburn G (1983). Soils. In 'Natural history of the South East'. Eds M.J. Tyler, C.R. Twidale, J.K. Ling and J.W. Holmes. 39-48. Royal Society of South Australia Inc: Adelaide, SA. Blackburn G, Ludbrook NH, Clarke ARP, Bond RD (1965). 'Soil development associated with stranded beach ridges in south-east South Australia'. CSIRO: Melbourne. Borchardt G (1989). Smectites. In 'Minerals in Soil Environments'. Eds J. B. Dixon and S. B. Weed. 675 - 727. Soil Science Society of America: Madison, USA. Buck S, Dalgliesh N, Daniells I, Dang Y, Donaldson S, Farquarson B, Grewall H, Kelly R, McDonald M, Routley R, Schwenke G, Scott F (2004). 'Subsoil constraints to crop production in north-eastern Australia'. DPI&F Queensland: Brisbane. Butler BE, Blackburn G, Hubble GD (1983). Murray-Darling Plains. In 'Soils: an Australian viewpoint'. Eds Division of Soils CSIRO. 231-239. CSIRO: Melbourne, VIC and Academic Press: London. Chorom M, Rengasamy P, Murray RS (1994). Clay Dispersion as Influenced by pH and Net Particle charge of Sodic Soils. Australian Journal of Soil Research 32, 1243 - 1252. Churchman GJ, Skemstad JO, Oades JM (1995). Effects of clay minerals and organic matter on sodicity. In 'Australian Sodic Soils: Distribution, properties and management'. Eds R Naidu, M. E. Sumner and P Rengasamy. 107-119. CSIRO Australia: East Melbourne.
35
Coulombe CE, Wilding LP, Dixon JB (1996). Overview of Vertisols: characteristics and impacts on society. Advances in Agronomy 57, 289 - 375. Emerson WW (1983). Inter-particle bonding. In 'Soils: an Australian viewpoint'. Eds Division of Soils CSIRO. 477-498. CSIRO / Academic Press: Melbourne / London. England R (1993). 'The Cry of the Coorong: The History of Water Flows into the Coorong'. www.dwlbc.sa.gov.au/assets/files/IB_CryoftheCoorong.pdf EPA (2000). NSW State of the Environment 2000 Report. NSW Environment Protection Authority, Sydney, NSW. Fanning DS, Keramidas VZ, El-Desoky MA (1989). Micas. In 'Minerals in soil environments'. Eds J. B. Dixon, S. B. Weed and R.C. Dinauer. 551-634. Soil Science Society of America: Madison, Wisconsin, USA. Firman JB (1973). 'Regional stratigraphy of surficial deposits in the Murray Basin and Gambier Embayment'. A. B. James, Govt. Printer: Adelaide. Fitzpatrick RW (2003). 'Assessment of physico-chemical changes in dryland saline soils when drained or disturbed for developing management options: a review of determinations in fields and lysimeters'. CSIRO Land and Water: Canberra, ACT. Ghassemi F, Jakeman AJ, Nix HA (1995). 'Salinisation of land and water resources: human causes, extent, management, and case studies'. NSW University Press: Sydney, NSW. Grieger G (1999). The effect of mineralogy and exchangeable magnesium on the dispersive behaviour of weakly sodic soils. The University of Adelaide, Department of Soil Science. PhD Thesis: 242pp Grim RE (1962) 'Applied Clay Mineralogy.' McGraw-Hill Book Company, INC: New York, USA. Hazelton P, Murphy B (2007). 'Interpreting Soil Test Results: what do all the numbers mean'. CSIRO Publishing: Collingwood, VIC. Holmes JW, Waterhouse JD (1983). Hydrology. In 'Natural History of the South East'. Eds M.J. Tyler, C.R. Twidale, J.K. Ling and J.W. Holmes. 49 - 59. Royal Society of South Australia Inc: Adelaide. Huntley DJ, Hutton JT, Prescott JR (1993). The stranded beach-dune sequence of south-east South Australia: A test of thermoluminescence dating, 0-800 ka. Quaternary Science Reviews 12, 1-20. Kay BD, Angers DA (2000). Soil Structure. In 'Handbook of soil science'. Eds M. E. Sumner. A229-A276. CRC Press: Boca Raton, USA.
36
Keren R (2000). Salinity. In 'Handbook of Soil Science'. Eds M E Sumner. G3 - G25. CRC Press: Boca Raton, USA. Krishna Murti GSR, Singh G, Rengasamy P (1977). The Nature of Soil Clays and the Stability of Microaggregates. Australian J. Soil Research 15, 115 - 119. Krull ES, Skemstad JO, Baldock JA. (2005). 'Functions of Soil Organic Matter and the Effect on Soil Properties'. Grains Research Development Corporation. From http://www.grdc.com.au/growers/res_summ/pdfs/cso00029.pdf. Accessed January 18 2006. McLaren RG, Cameron KC (1996). 'Soil science: sustainable production and environmental protection'. Oxford University Press: Auckland, N.Z. Mermut AR, Padmanabham E, Eswaran H, Dasog GS (1996). Pedogenesis. In 'Vertisols and technologies for their management'. Eds N. Ahmad and A. R. Mermut. 43 - 62. Elsevier Science: Amsterdam. Naidu R, Merry R, Churchman GJ, Wright MJ, Murray RS, Fitzpatrick RW, Zarcinas BA (1995). Sodicity in South Australia: A review. In 'Australian Sodic Soils: Distribution, properties and management'. Eds R. Naidu, M E Sumner and P. Rengasamy. 265-275. CSIRO Australia: East Melbourne, Vic. National Land and Water Resources Audit, National Heritage Trust (2001). Australian dryland salinity assessment 2000 extent, impacts, processes, monitoring and management options. Turner, ACT. Nelson PN, Oades JM (1997). Organic Matter, Sodicity and Soil structure. In 'Sodic Soils: Distribution, Properties, Management, and Environmental Consequences'. Eds M. E. Sumner and R. Naidu. 51-75. Oxford University Press: New York. Norrish K, Pickering JG (1983). Clay Minerals. In 'Soils: an Australian viewpoint'. Eds Division of Soils CSIRO. 281 - 308. CSIRO: Melbourne. Northcote KH, Skene JKM (1972). 'Australian soils with saline and sodic properties'. CSIRO: Melbourne. Quirk JP (1968). Particle interaction and soil swelling. Israel Journal of Chemistry 6, 213 - 234. Raven PH, Johnson GB (1996). 'Biology'. Wm. C. Brown Publishers: Dubuque, IA. Rengasamy P (2002a). Transient salinity and subsoil constraints to dryland farming in Australian sodic soils: an overview. Australian Journal of Experimental Agriculture 42, 351-361.

37
Rengasamy P (2002b). Sodic Soils: soil processes, characteristics and classification. In 'Encyclopaedia of Soil Science'. Eds R. Lal. 1221-1223. Marcel Dekker Inc: New York. Rengasamy P (2003). Spontaneously dispersive and potentially dispersive soils. Crop Science Society of South Australia Newsletter. Adelaide. Rengasamy P (2006). World salinization with emphasis on Australia. Journal of Experimental Botany 57, 1017 - 1023. Rengasamy P, Churchman GJ (1999). Cation Exchange Capacity, Exchangeable Cations and Sodicity. In 'Soil Analysis an Interpretation Manual'. Eds KI Peverill, LA Sparrow, DJ Reuter. 147 - 158. CSIRO Publishing: Collingwood, VIC. Rengasamy P, Greene R, Ford G (1986). Influence of Magnesium on Aggregate Stability in Sodic Red-Brown Earths. Australian Journal of Soil Research 24, 229-37. Rengasamy P, Greene R, Ford G, Mehanni AH (1984). Identification of Dispersive Behaviour and the Management of Red-brown Earths. Australian J. Soil Research 22, 413 - 431. Rengasamy P, Olsson KA (1991). Sodicity and Soil Structure. Australian Journal of Soil Research 29, 935 - 952. Shainberg I, Letey J (1984). Response of soils to sodic and saline conditions. Hilgardia 61, 21-57. Shaw R (1999). Soil salinity - electrical conductivity and chloride. In 'Soil Analysis an Interpretation Manual'. Eds K I Peverill, L Sparrow and D J Reuter. 129 - 145. CSIRO: Collingwood, VIC. Shaw R, Gordon I, Queensland Salinity and Contaminant Hydrology Group, Queensland Department of Natural Resources (1997). 'Salinity management handbook'. Department of Natural Resources: Indooroopilly, Qld. So HB, Aylmore LAG (1995). The effect of sodicity on soil physical behaviour. In 'Australian Sodic Soils: Distribution, properties and management'. Eds R Naidu, P Rengasamy and M E Sumner. 71-79. CSIRO: East Melbourne, Vic. South East Catchment Water Management Board (2003). South East Catchment Water Management Plan 2003 - 2008. South East Catchment Water Management Board, Mount Gambier. Szabolcs I (1989). 'Salt-affected soils'. CRC Press: Boca Raton, USA. Taylor RM, McKenzie AW, Fordham, Gillman GP (1983). Oxide Minerals. In 'Soils: an Australian viewpoint'. Eds Division of Soils. 309 - 334. CSIRO: Melbourne.

38
Tisdall JM, Smith SE, Rengasamy P (1997). Aggregation of soil by fungal hyphae. Australian Journal of Soil Research 35, 55-60. United States Salinity Laboratory Staff (1954). Diagnosis and improvement of saline and alkali soils. U.S.D.A. agric. Handb. No. 60 van Olphen H (1977). 'An Introduction to Clay Colloid Chemistry'. John Wiley & Sons: New York, USA. White RE (1997). 'Principles and practice of soil science: the soil as a natural resource'. Blackwell Science: Oxford, England; Malden, MA, USA.
39
CHAPTER 2
ARTIFICIAL DRAINAGE AFFECTS THE PHYSICOCHEMICAL PROPERTIES OF SALT-AFFECTED
HEAVY CLAY SOILS IN THE UPPER SOUTH EAST OF SOUTH AUSTRALIA
2.1 INTRODUCTION
Salt-affected soils are widespread across Australia’s arable land, severely limiting
agricultural productivity. In 2001 it was estimated that 250,000 hectares or 40% of the
land in the Upper South East (USE) of South Australia (SA), comprising productive
farmland, native vegetation and wetlands, had been degraded by salinisation caused by
high groundwater levels and flooding (National Land and Water Resources Audit and
National Heritage Trust 2001). The total cost to South Australia due to dryland salinity,
through losses in agricultural production and maintenance to roads and infrastructure,
was estimated to exceed $44 million per year and was expected to climb to almost $60
million by 2020 (Barnett 2000). Given the significance of this problem, great efforts have
been made to reclaim the USE from the deleterious effects of dryland salinity. In 1995
‘The Upper South East Dryland Salinity and Flood Management Program’ (USE DS&FMP)
was developed to address community concerns about dryland salinity, waterlogging and
ecosystem fragmentation and degradation in this region (Department of Water Land and
Biodiversity Conservation 2009).
Artificial drainage networks had expanded rapidly in the 100 years that followed
European settlement in South East SA, and the construction of a further 665 km of
artificial drains was recommended in the new USE DS&FM program. This included the
40
construction of the 55 km long, 3 m deep Fairview Drain, that intersected the inter-dunal
Avenue Plain. The aim was to capture surface floodwaters that annually inundate the
area, and to lower groundwater levels in the local unconfined aquifer, thereby lowering
soil salinity. Nonetheless, since the implementation of the USE DS&FMP, a perceived
decline in plant growth across an area of the Avenue Plain, known as the Keilira District,
has led to growing levels of concern amongst members of the Keilira Farm Management
Group (KFMG). In 2005, local land managers sought help after initially observing poor
plant growth and bare patches of soil. They were of the opinion that the affected areas
were increasing, coinciding with the extension of the drainage network and possible
reduction of groundwater levels. However, there were also patches of declining plant
growth occurring on farms that had not yet employed artificial drainage, so the need
became evident to investigate the trends in groundwater levels and the possible effects
of artificial drainage on soil physicochemical properties at both drained and undrained
sites.
Despite the implementation of the USE DS&FMP and the subsequent construction of the
Fairview Drain across the Avenue Plain in 1997/98, the only author to date who has
conducted research and published data on the soils in this area is Blackburn (1952). In the
vicinity of the Fairview Drain on the central - western side of the Avenue Plain, he
identified two distinct soil associations. The first of these he called Soil Association J and
characterised as variable grey and black clay rich soils that showed differentiation of
colour, texture and structure and were mainly saline, occurring in the uneven lagoon –
lunette areas. The soils were often relatively bare (Blackburn 1952). The Total Soluble Salt
41
% (TSS) in these soil types ranged from 0.026 – 9.1% and they were moderately to
strongly alkaline throughout (Clarke 1955).
The second common soil type identified was Soil Association R, characterised by a surface
horizon (<0.1 m) of loamy fine sand overlying a shallow black clay subsoil, with limestone
occurring within 0.3 m (Blackburn 1952). The TSS % for these soils was significantly lower
than for Soil Association J, ranging from 0.086 – 1.6% and the soils were strongly to very
strongly alkaline throughout (Clarke 1955). The data collected by Blackburn (1952) and
reported by Clarke (1955) confirm that historically the soils of this region were salt-
affected and so the USE DS&FMP recommendation to expand the drainage network,
lowering groundwater levels and hence soil salinity, seemed appropriate.
Lowering salinity levels can, however, have both positive and negative impacts on soils
and plant growth depending on the soil texture and clay mineralogy. Whereas saline soils
contain high concentrations of soluble salts, impacting on plant growth through osmotic
effects (Keren 2000), a comparably important threat to plant production is seen in sodic
soils. Sodicity occurs when the concentration of sodium on the exchange complex reaches
a level where it disrupts soil structure through dispersion, severely affecting soil-water
and soil-air relations (Rengasamy and Olsson 1991). Sodicity often occurs in clay rich
saline soils that are leached of salts, with dispersion occurring once the EC falls below a
threshold electrolyte concentration (Rengasamy and Olsson 1991). However, clay
mineralogy can significantly affect the swelling and dispersion potential of sodic soils
(Churchman et al. 1993) and other factors such as pH and OM can also aid or suppress the
expression of sodicity (Chorom et al. 1994). Given that the USE DS&FMP was instigated to
42
lower groundwater levels, and that Blackburn observed both heavy and light textured
soils with varying degrees of salinity, it is possible that leaching has occurred, leading to
the expression of sodicity. However, no recent studies have been published for the Keilira
District identifying how the soil condition has changed since Blackburn’s initial study and
the extensive implementation of artificial drainage throughout the USE.
The primary aim of this study, therefore, was to determine the likely effects that artificial
drainage has had on soil physicochemical properties in the Keilira District in South
Australia and to identify whether the observed plant decline is being caused directly by
the drainage schemes, as the farmers feared. This aim was achieved by: (i) determining
the factors that influence the flux in standing water levels across this region and their
trends over time, (ii) identifying the soil physicochemical constraints to plant production,
comparing soils with differing drainage histories, and (iii) comparing current and historic
data to identify the possible effects of artificial drainage on soil physicochemical
properties and the consequences for pasture growth.
2.2 ENVIRONMENTAL SETTING OF THE STUDY
The USE of SA is characterised by a remarkable sequence of stranded dunes, deposited
over the past 800,000 years (ka) as the result of the staged accession and recession of the
ocean (Huntley et al. 1993). The dune systems run roughly parallel to the current
coastline, creating a westerly barrier to surface waters, and historically caused seasonal
inundation on the inter-dunal plains during winter and spring.
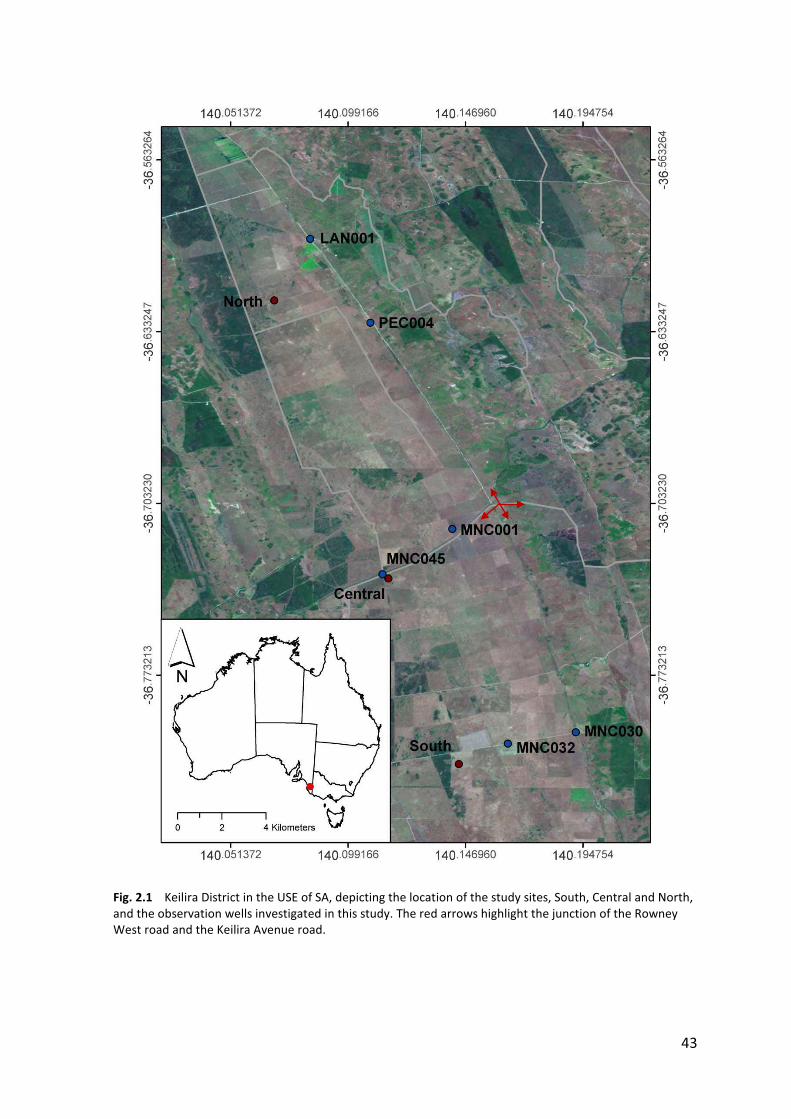
43
Fig. 2.1 Keilira District in the USE of SA, depicting the location of the study sites, South, Central and North, and the observation wells investigated in this study. The red arrows highlight the junction of the Rowney West road and the Keilira Avenue road.

44
The inter-dunal Avenue Plain is land-locked by two of the relic dunes, the East Avenue
and West Avenue Ranges, with surface waters generally flowing from east to west and
then travelling north-westerly. The area referred to here as the Keilira District on the
Avenue Plain is intersected by the junction of the Rowney West and Keilira-Avenue Roads,
near Keilira Station (36.71°S 140.16°E). The district encompasses agricultural land 15 km
north and 15 km south of the Rowney West road, spanning an area of ~18,000 ha (Fig.
2.1).
2.2.1 Climate
The USE of SA has a temperate climate with warm dry summers and cold wet winters.
Mean summer daily temperatures at Keith (36.10°S 140.36°E) range from a minimum
12.7° C to a maximum 29° C, whereas mean daily winter temperatures fall to a mean
minimum of 5.7° C and reach a maximum of 15.3° C (Australian Bureau of Meteorology
2009). Mean winter rainfall at Keilira Station exceeds 230 mm and mean summer rainfall
is generally <70 mm. Historic annual rainfall records for Keilira Station presented in Figure
2.2, show marked variability in rainfall over the record period. Data for the years 1945 –
2000 were sourced from the Australian Bureau of Meteorology (2009) and records for
2001 – 2008 from Keilira Station records (Shane Rook, Manager Keilira Station, pers.
comm. March 2009).

45
Interestingly, the extension of the drainage networks in the USE coincides with a decline
in rainfall since 1990. The 5-year moving average for this region prior to 1990 indicates
that rainfall patterns move in peaks and troughs, generally 100 mm above and 50 mm
below the long-term mean of 555 mm. Since 1990 however, the peaks in the rainfall
pattern barely exceed 45 mm above the long-term mean, whereas the troughs fall to
below 465 mm for the years 1994 – 1998 and 2004 – 2008.
2.3 METHODS
Three study sites, named South, Central and North, were selected for investigation,
spanning a distance of 30 km (Fig. 2.1). Each of the sites had a different drainage history,
including one site (North) that was not artificially drained and yet displayed patches of
poor plant growth similar to those seen at the drained South and Central sites.
Fig. 2.2 Annual rainfall (mm) at Keilira Station for the years 1945 – 2008, showing a marked decline in rainfall in recent years. The five year moving average indicates a steep decline since 2002, falling from the long-term mean of 555 mm (1945 – 2008) to 458 mm (2004 – 2008).
1945
1950
1955
1960
1965
1970
1975
1980
1985
1990
1995
2000
2005
Annu
al R
ainf
all (
mm
)
0
200
400
600
800
1000Annual RainfallMoving 5-year mean Mean 1945 - 2008
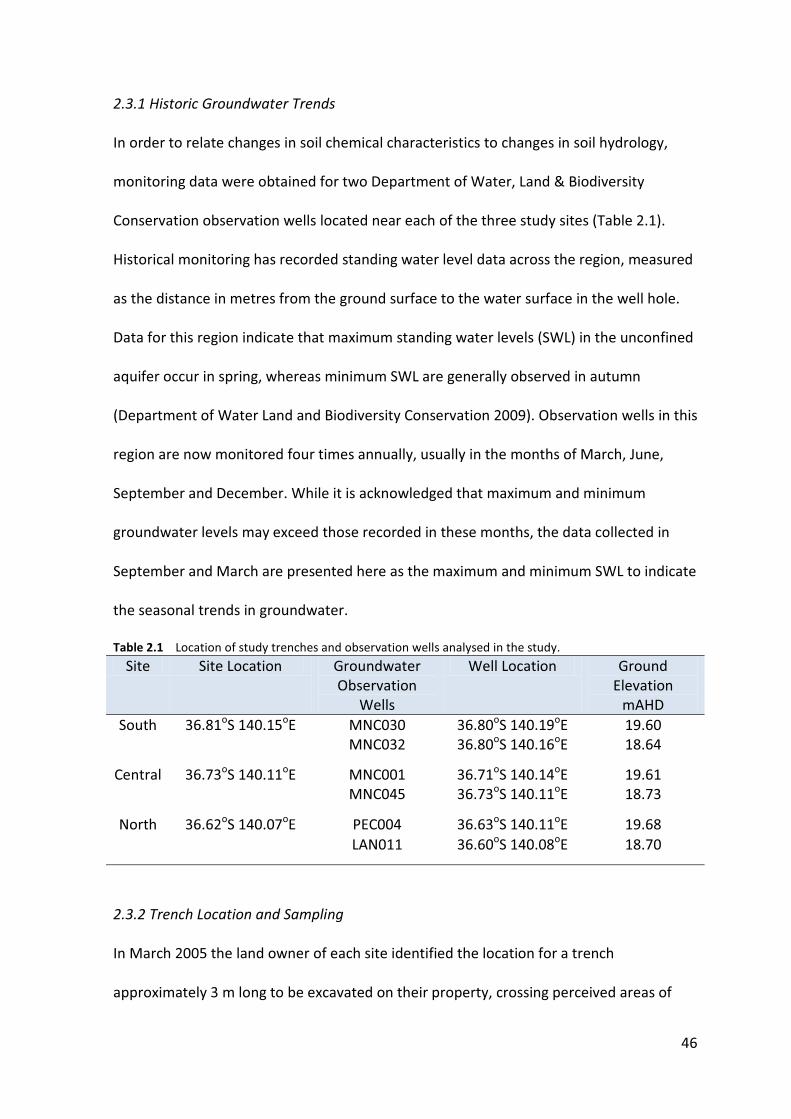
46
2.3.1 Historic Groundwater Trends
In order to relate changes in soil chemical characteristics to changes in soil hydrology,
monitoring data were obtained for two Department of Water, Land & Biodiversity
Conservation observation wells located near each of the three study sites (Table 2.1).
Historical monitoring has recorded standing water level data across the region, measured
as the distance in metres from the ground surface to the water surface in the well hole.
Data for this region indicate that maximum standing water levels (SWL) in the unconfined
aquifer occur in spring, whereas minimum SWL are generally observed in autumn
(Department of Water Land and Biodiversity Conservation 2009). Observation wells in this
region are now monitored four times annually, usually in the months of March, June,
September and December. While it is acknowledged that maximum and minimum
groundwater levels may exceed those recorded in these months, the data collected in
September and March are presented here as the maximum and minimum SWL to indicate
the seasonal trends in groundwater.
Table 2.1 Location of study trenches and observation wells analysed in the study.
Site Site Location Groundwater Observation
Wells
Well Location Ground Elevation
mAHD South
36.81oS 140.15oE MNC030 36.80oS 140.19oE 19.60
MNC032 36.80oS 140.16oE 18.64
Central 36.73oS 140.11oE MNC001 36.71oS 140.14oE 19.61 MNC045 36.73oS 140.11oE 18.73
North 36.62oS 140.07oE PEC004 36.63oS 140.11oE 19.68 LAN011 36.60oS 140.08oE 18.70
2.3.2 Trench Location and Sampling
In March 2005 the land owner of each site identified the location for a trench
approximately 3 m long to be excavated on their property, crossing perceived areas of
47
‘good soil’ and ‘poor soil’ based on their impressions of plant growth. Owing to the
seasonal conditions, plant growth was negligible, therefore residual stubble cover,
surface topography and soil physical characteristics were also considered in the
determination of ‘good’ and ‘poor’ soil. Two profiles were sampled at each site, one from
the ‘good’ and one from the ‘poor’ areas, and are labelled accordingly. Photographs of
the profiles can be seen in Appendix 2. Samples were collected at regular intervals down
each soil profile to a depth of between 0.7 and 0.9 m.
2.3.3 Soil Chemical Analyses
Samples were air dried and a representative portion was ground and passed through a 2
mm diameter sieve. On the fine earth fraction pH(H2O), EC (as EC1:5) and spontaneous
dispersion were determined using a 1:5 soil:water suspension (Kelly and Rengasamy
2006). The soil salinity criteria of Shaw (1999) were used to assign salinity ratings for EC1:5
data collected from soils with varying clay content. The sodicity guidelines for Australian
soils identified by Northcote and Skene (1972) were used to assign sodicity ratings, and
soil pH was classified according to the guidelines presented by Slattery et al. (1999). Once
agitated, the suspensions were allowed to settle for 4 hours to determine the degree of
mechanical dispersion (potential dispersion).
Total carbon content of the soil was determined by combustion in a Leco furnace and the
organic carbon content was determined by Heanes wet oxidation following the method
for saline soils (>0.5 % Cl) outlined in Rayment and Higginson (1992). Total carbonate
content (as CaCO3) was determined following the modified pressure-calcimeter method
(Sherrod et al. 2002) using 2 grams of soil, 8ml of 3M HCl containing 3% by weight of
48
FeCl2, and a pressure transducer monitored by a digital voltmeter. The voltage was
correlated to a set of standard samples with varying CaCO3 contents.
Due to the highly calcareous, alkaline and saline nature of these soils, the CEC and
exchangeable cation concentration of the samples were determined following the
Rayment and Higginson (1992) method for soils with EC1:5 > 0.3 dSm-1 and pHH20 > 7.4.
Following the removal of soluble salts, exchangeable basic cations were extracted using 1
M ammonium chloride at pH 8.5 (Rayment and Higginson 1992). The Ca, Mg, Na and K
concentrations of the samples were determined by GBC-906 flame atomic absorption
spectrophotometry. The CEC of the soils were determined by measurement of NH4+ and
Cl- in an auto-analyser. Exchangeable sodium percentage was calculated by the
relationship ESP = (Na/CEC) x 100.
Particle size distribution was determined using a method adapted from Gee and Bauder
(1986). The carbonate component of the soil was first removed using 1 M sodium acetate
adjusted to pH 5 with acetic acid at a ratio of 1:2 soil:solution. Suspensions were mixed in
a 250ml centrifuge bottle, allowed to stand in a 60oC water bath overnight, cooled,
centrifuged and the supernatant decanted. The process was repeated until effervescence
ceased. Organic matter was removed by adding sodium hypochlorite 12.5 w/v (adjusted
to pH 8 with HCl) to the soil in the ratio of 1:4 soil:solution and allowed to stand in a fume
cupboard for 16 hours (Mikhail and Briner 1978). Samples were centrifuged and
repeatedly washed with distilled water until the EC of the suspension was <1 dSm-1. Soils
were dispersed using sodium hexametaphosphate (Calgon) and the proportions of sand,
silt and clay determined by the sedimentation method of Gee and Bauder (1986).
49
Removal of the clay fraction was assisted by the addition of 1 M CaCl2, following which all
samples were centrifuged and washed with RO H20 before being washed twice with
ethanol and air dried.
For mineralogical analysis, a 0.04 g sample of the isolated calcium-saturated clay fraction
(<2 μm) was dispersed in deionised water using an ultrasonic probe. The clay was
oriented onto a porous ceramic membrane using a vacuum pump, solvated with 3 drops
of glycerol and allowed to drain. X-ray diffraction (XRD) patterns were collected with a
PANalytical X’Pert Pro Multi Purpose Diffractometer. A cobalt XRD tube operating at 40kV
and 45mA with a flat graphite monochromator and programmable divergence slit was
used to determine the mineralogical composition, aided by the Xplot program (Mark
Raven, CSIRO, pers. comm. 2009).
2.4 RESULTS
2.4.1 South Study Site
The South site, on the property Shepherds Hill, is located within 3 km of the Blackford
Drain, which was dug in 1956. The Jacky Whites Drain and a series of private shallow
feeder drains (<2 m deep) intersect the Shepherds Hill property; these drains were
gradually expanded in the years 1962, 1975, 1979, 1983, 1993 and 1997. Data from two
observation wells, MNC030 and MNC032, were studied to determine the effects of
artificial drainage on SWL at this site.
The study trench here was excavated across an area of thick stubble cover at the ‘good’
end and an area in a slight topographical low with only fair stubble cover at the ‘poor’
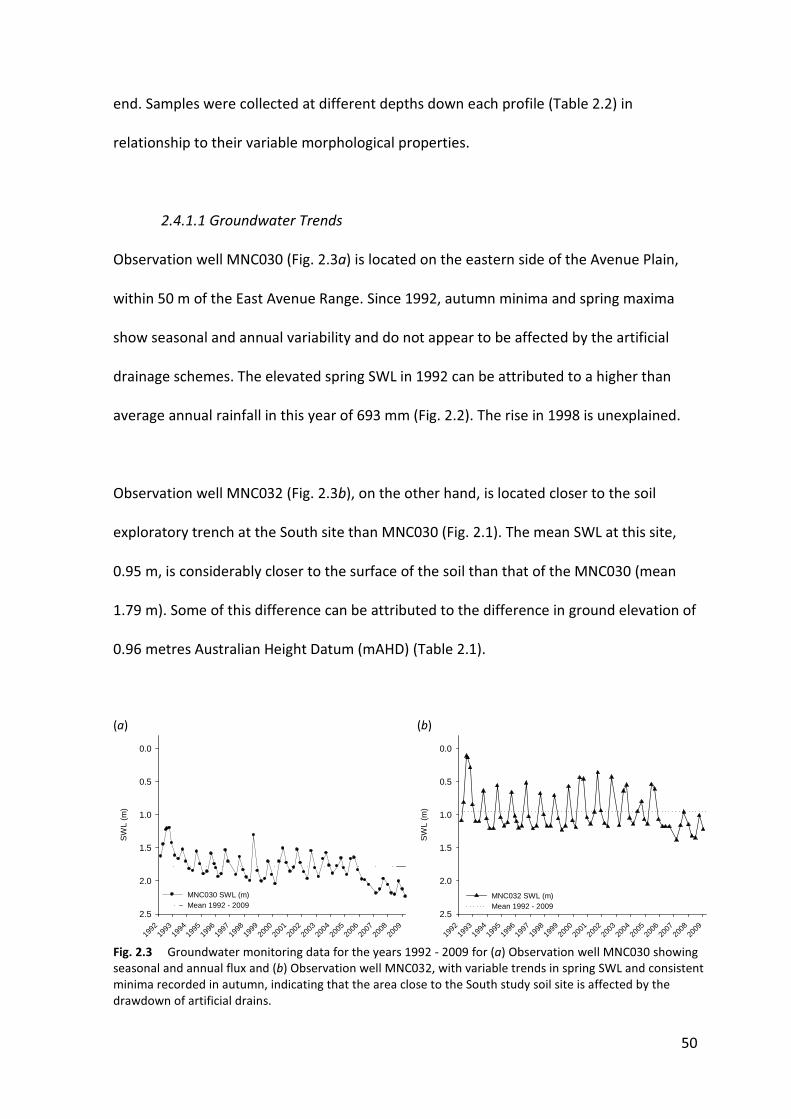
50
end. Samples were collected at different depths down each profile (Table 2.2) in
relationship to their variable morphological properties.
2.4.1.1 Groundwater Trends
Observation well MNC030 (Fig. 2.3a) is located on the eastern side of the Avenue Plain,
within 50 m of the East Avenue Range. Since 1992, autumn minima and spring maxima
show seasonal and annual variability and do not appear to be affected by the artificial
drainage schemes. The elevated spring SWL in 1992 can be attributed to a higher than
average annual rainfall in this year of 693 mm (Fig. 2.2). The rise in 1998 is unexplained.
Observation well MNC032 (Fig. 2.3b), on the other hand, is located closer to the soil
exploratory trench at the South site than MNC030 (Fig. 2.1). The mean SWL at this site,
0.95 m, is considerably closer to the surface of the soil than that of the MNC030 (mean
1.79 m). Some of this difference can be attributed to the difference in ground elevation of
0.96 metres Australian Height Datum (mAHD) (Table 2.1).
(a)
(b)
Fig. 2.3 Groundwater monitoring data for the years 1992 - 2009 for (a) Observation well MNC030 showing seasonal and annual flux and (b) Observation well MNC032, with variable trends in spring SWL and consistent minima recorded in autumn, indicating that the area close to the South study soil site is affected by the drawdown of artificial drains.
1992
1993
1994
1995
1996
1997
1998
1999
2000
2001
2002
2003
2004
2005
2006
2007
2008
2009
SW
L (m
)
0.0
0.5
1.0
1.5
2.0
2.5
MNC030 SWL (m)Mean 1992 - 2009
1992
1993
1994
1995
1996
1997
1998
1999
2000
2001
2002
2003
2004
2005
2006
2007
2008
2009
SW
L (m
)
0.0
0.5
1.0
1.5
2.0
2.5
MNC032 SWL (m)Mean 1992 - 2009
51
The relatively uniform minimum SWL observed at MNC032 over the period 1992 – 2005 is
evidence that the local Jacky Whites Drain and deeper Blackford Drain have consistently
lowered water tables in this area. September (spring) SWL range between 0.14 and 0.8 m,
with a mean SWL of 0.55 m, exhibiting annual variation, whereas March (autumn) levels
have a mean SWL of 1.16 m and much less variability (range 1.09 - 1.23 m).
During 2006 – 2008 the decline in both spring and autumn SWL at MNC030 and MNC032
can be attributed to the decline in annual rainfall from the long-term average of 555 mm
to 450 mm for this time period, (Fig. 2.1) but the reduction at MNC030 is more
pronounced.
2.4.1.2 Soil Chemistry
As seen in Table 2.2, pH, EC and ESP throughout the ‘good’ end of this trench steadily
increase down the soil profile, becoming very strongly alkaline, very highly saline and
strongly sodic at depth. The surface 0 – 0.1 m, however, exhibits chemical conditions
conducive to better plant growth as it is non-sodic, with mild alkalinity and moderate
salinity. In comparison, the ‘poor’ soil at this site exhibits better chemical conditions for
plant growth, except for a higher concentration of salt in the surface 0 – 0.1 m ( EC1:5 of
0.52 dSm-1), high enough to affect salt tolerant crop species (Shaw 1999). Below 0.1 m,
the soil becomes moderately to very strongly alkaline, moderately saline and marginally
sodic to a depth of 0.5 m.
A major difference between the two soils at this site is the depth to the carbonate rich
horizon. At the ‘good’ end, carbonate content increases from <10 % to >70 % at 0.30 –
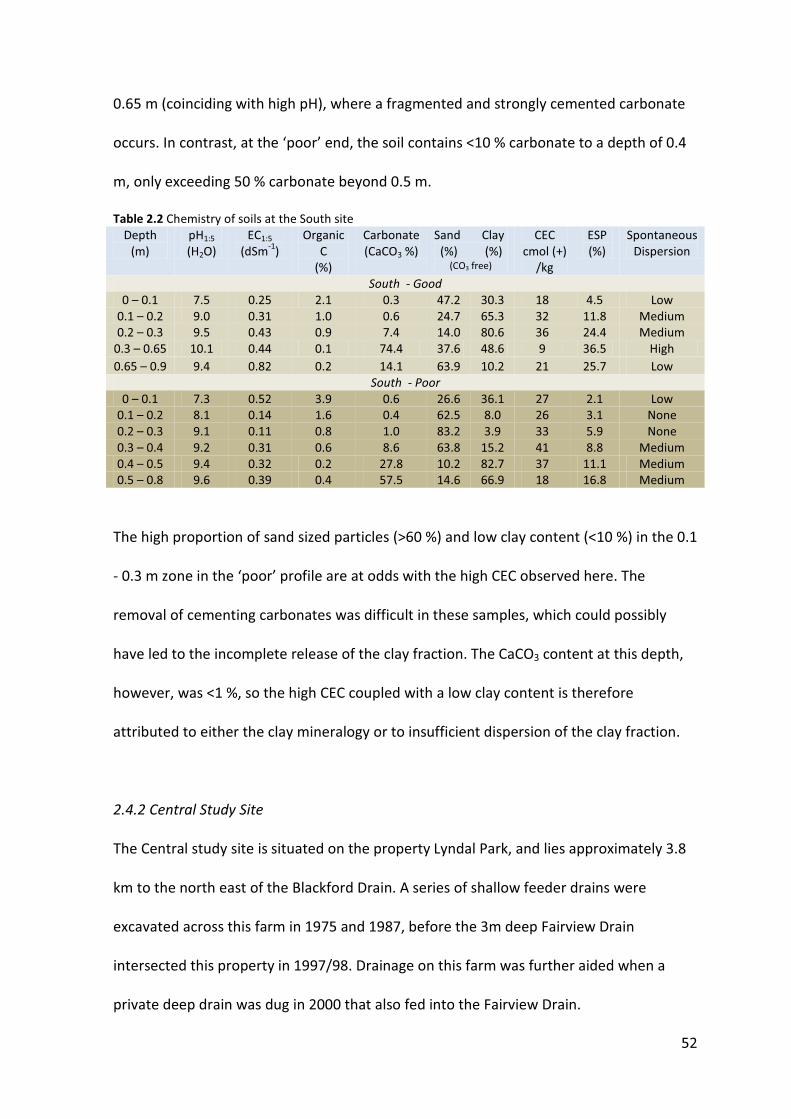
52
0.65 m (coinciding with high pH), where a fragmented and strongly cemented carbonate
occurs. In contrast, at the ‘poor’ end, the soil contains <10 % carbonate to a depth of 0.4
m, only exceeding 50 % carbonate beyond 0.5 m.
Table 2.2 Chemistry of soils at the South site Depth
(m) pH1:5 (H2O)
EC1:5
(dSm-1) Organic
C (%)
Carbonate (CaCO3 %)
Sand Clay (%) (%)
(CO3 free)
CEC cmol (+)
/kg
ESP (%)
Spontaneous Dispersion
South - Good 0 – 0.1 7.5 0.25 2.1 0.3 47.2 30.3 18 4.5 Low
0.1 – 0.2 9.0 0.31 1.0 0.6 24.7 65.3 32 11.8 Medium 0.2 – 0.3 9.5 0.43 0.9 7.4 14.0 80.6 36 24.4 Medium
0.3 – 0.65 10.1 0.44 0.1 74.4 37.6 48.6 9 36.5 High 0.65 – 0.9 9.4 0.82 0.2 14.1 63.9 10.2 21 25.7 Low
South - Poor 0 – 0.1 7.3 0.52 3.9 0.6 26.6 36.1 27 2.1 Low
0.1 – 0.2 8.1 0.14 1.6 0.4 62.5 8.0 26 3.1 None 0.2 – 0.3 9.1 0.11 0.8 1.0 83.2 3.9 33 5.9 None 0.3 – 0.4 9.2 0.31 0.6 8.6 63.8 15.2 41 8.8 Medium 0.4 – 0.5 9.4 0.32 0.2 27.8 10.2 82.7 37 11.1 Medium 0.5 – 0.8 9.6 0.39 0.4 57.5 14.6 66.9 18 16.8 Medium
The high proportion of sand sized particles (>60 %) and low clay content (<10 %) in the 0.1
- 0.3 m zone in the ‘poor’ profile are at odds with the high CEC observed here. The
removal of cementing carbonates was difficult in these samples, which could possibly
have led to the incomplete release of the clay fraction. The CaCO3 content at this depth,
however, was <1 %, so the high CEC coupled with a low clay content is therefore
attributed to either the clay mineralogy or to insufficient dispersion of the clay fraction.
2.4.2 Central Study Site
The Central study site is situated on the property Lyndal Park, and lies approximately 3.8
km to the north east of the Blackford Drain. A series of shallow feeder drains were
excavated across this farm in 1975 and 1987, before the 3m deep Fairview Drain
intersected this property in 1997/98. Drainage on this farm was further aided when a
private deep drain was dug in 2000 that also fed into the Fairview Drain.
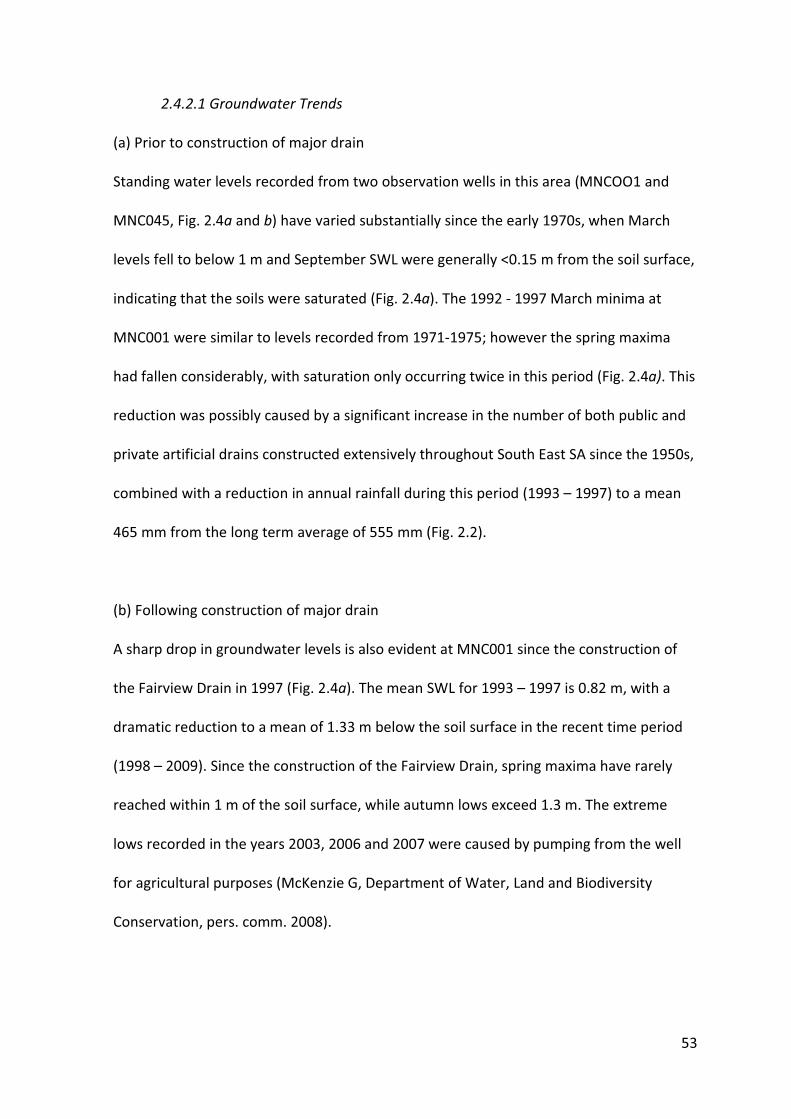
53
2.4.2.1 Groundwater Trends
(a) Prior to construction of major drain
Standing water levels recorded from two observation wells in this area (MNCOO1 and
MNC045, Fig. 2.4a and b) have varied substantially since the early 1970s, when March
levels fell to below 1 m and September SWL were generally <0.15 m from the soil surface,
indicating that the soils were saturated (Fig. 2.4a). The 1992 - 1997 March minima at
MNC001 were similar to levels recorded from 1971-1975; however the spring maxima
had fallen considerably, with saturation only occurring twice in this period (Fig. 2.4a). This
reduction was possibly caused by a significant increase in the number of both public and
private artificial drains constructed extensively throughout South East SA since the 1950s,
combined with a reduction in annual rainfall during this period (1993 – 1997) to a mean
465 mm from the long term average of 555 mm (Fig. 2.2).
(b) Following construction of major drain
A sharp drop in groundwater levels is also evident at MNC001 since the construction of
the Fairview Drain in 1997 (Fig. 2.4a). The mean SWL for 1993 – 1997 is 0.82 m, with a
dramatic reduction to a mean of 1.33 m below the soil surface in the recent time period
(1998 – 2009). Since the construction of the Fairview Drain, spring maxima have rarely
reached within 1 m of the soil surface, while autumn lows exceed 1.3 m. The extreme
lows recorded in the years 2003, 2006 and 2007 were caused by pumping from the well
for agricultural purposes (McKenzie G, Department of Water, Land and Biodiversity
Conservation, pers. comm. 2008).
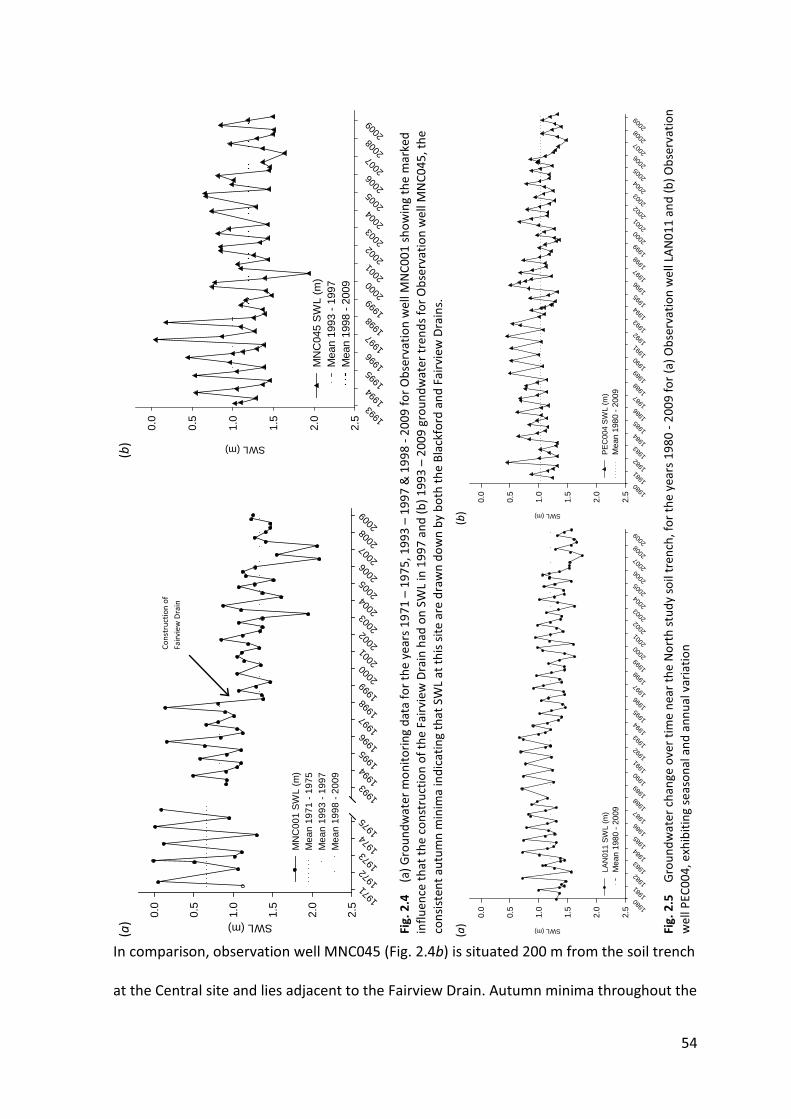
54
Fig.
2.4
(a
) Gro
undw
ater
mon
itori
ng d
ata
for
the
year
s 19
71 –
197
5, 1
993
– 19
97 &
199
8 - 2
009
for
Obs
erva
tion
wel
l MN
C001
sho
win
g th
e m
arke
d in
fluen
ce th
at th
e co
nstr
uctio
n of
the
Fair
view
Dra
in h
ad o
n SW
L in
199
7 an
d (b
) 199
3 –
2009
gro
undw
ater
tren
ds fo
r O
bser
vatio
n w
ell M
NC0
45, t
he
cons
iste
nt a
utum
n m
inim
a in
dica
ting
that
SW
L at
this
site
are
dra
wn
dow
n by
bot
h th
e Bl
ackf
ord
and
Fair
view
Dra
ins.
Fig.
2.5
G
roun
dwat
er c
hang
e ov
er ti
me
near
the
Nor
th s
tudy
soi
l tre
nch,
for
the
year
s 19
80 -
2009
for
(a) O
bser
vatio
n w
ell L
AN
011
and
(b) O
bser
vatio
n w
ell P
EC00
4, e
xhib
iting
sea
sona
l and
ann
ual v
aria
tion
In comparison, observation well MNC045 (Fig. 2.4b) is situated 200 m from the soil trench
at the Central site and lies adjacent to the Fairview Drain. Autumn minima throughout the
(a)
(b)
1971
1972
1973
1974
1975
1993
1994
1995
1996
1997
1998
1999
2000
2001
2002
2003
2004
2005
2006
2007
2008
2009
SWL (m)0.0
0.5
1.0
1.5
2.0
2.5
MN
C00
1 SW
L (m
)M
ean
1971
- 19
75M
ean
1993
- 19
97M
ean
1998
- 20
09
1993
1994
1995
1996
1997
1998
1999
2000
2001
2002
2003
2004
2005
2006
2007
2008
2009
SWL (m)
0.0
0.5
1.0
1.5
2.0
2.5
MN
C04
5 S
WL
(m)
Mea
n 19
93 -
1997
M
ean
1998
- 20
09
Cons
truc
tion
of
Fairv
iew
Dra
in
(a)
(b)
1980
1981
1982
1983
1984
1985
1986
1987
1988
1989
1990
1991
1992
1993
1994
1995
1996
1997
1998
1999
2000
2001
2002
2003
2004
2005
2006
2007
2008
2009
SWL (m)
0.0
0.5
1.0
1.5
2.0
2.5
LAN
011
SW
L (m
)M
ean
1980
- 20
09
1980
1981
1982
1983
1984
1985
1986
1987
1988
1989
1990
1991
1992
1993
1994
1995
1996
1997
1998
1999
2000
2001
2002
2003
2004
2005
2006
2007
2008
2009
SWL (m)
0.0
0.5
1.0
1.5
2.0
2.5
PE
C00
4 S
WL
(m)
Mea
n 19
80 -
2009

55
monitoring record are consistent for MNC045 prior to 1998 (in contrast to MNC001) and
this is attributed to the drawdown of groundwater at this site by the nearby Blackford
Drain. The effect of the construction of the Fairview Drain is also evident at this site after
1997, with spring maxima SWL falling from a mean 0.35 m pre-construction to a mean
0.93 m post-construction.
2.4.2.2 Soil Chemistry
The profile corresponding to good pasture growth at the Central site (Central ‘good’) had
shallow soil (<0.3 m) overlying clay marl that was moderately to very strongly alkaline
with depth, highly saline below 0.1 m (with a salt bulge in the profile at 0.3 m) and
strongly sodic throughout (Table 2.3).
The structure of the surface soil was less massive and exhibited less surface pugging than
the adjacent ‘poor’ soil; the EC was sufficiently high enough to affect salt sensitive plant
species (Shaw 1999).
Table 2.3 Chemistry of soils at the Central site.
Depth (m)
pH1:5 (H2O)
EC1:5
(dSm-1) Organic C
(%) Carbonate (CaCO3 %)
Sand Clay (%) (%)
(CO3 free)
CEC cmol (+)
/kg
ESP (%)
Spontaneous Dispersion
Central – Good
0 – 0.1 7.8 0.33 1.9 0.4 61.1 23.5 14 16.1 Medium
0.1 – 0.2 9.5 0.62 0.8 0.6 40.4 51.8 25 44.0 High
0.2 – 0.3 10.1 0.92 0.8 8.5 23.7 70.8 28 52.3 High
0.3 – 0.55 10.1 0.53 0.5 49.4 28.2 33.5 17 52.7 Low 0.55 – 0.65 9.9 0.42 0.3 4.7 71.8 4.4 30 40.2 Medium
Central – Poor
0 – 0.1 7.2 0.18 2.2 0.3 59.2 22.8 16 5.5 Low
0.1 – 0.2 8.3 0.10 0.9 0.3 51.7 31.9 15 12.8 High
0.2 – 0.3 8.9 0.17 0.8 0.8 33.1 58.6 27 22.8 High
0.3 – 0.6 9.9 0.40 0.8 35.6 40.4 28.4 23 39.6 Medium
0.6 – 0.9 9.9 0.51 0.0 41.4 36.1 28.1 23 40.0 High
56
The ‘poor’ soil exhibited better chemical conditions for plant growth in the surface 0.3 m
than the ‘good’ profile, with low salinity, moderate sodicity and a mild to moderate
alkalinity throughout the profile. The carbonate horizon in this profile was composed of a
fractured limestone pan with pockets of rubble and friable clay. The particle size
distribution of the 0.55 – 0.65 m horizon in the Central ‘good’ soil is at variance with the
CEC and clay content, possibly the result of insufficient dispersion of the clay fraction.
2.4.3 North Study Site
The North study site lies 12 km north of the Central site, on the property Cherita. It
currently (2009) has no artificial drainage but has been surveyed for the construction of
the Baldhills Drain. The soil trench at the North site was excavated to a depth of 0.7 m,
where a hard calcrete pan was intercepted.
2.4.3.1 Groundwater Trends
Observation wells LAN011 and PEC004, located on the eastern edge of the Avenue Plain,
are approximately 2.8 km north-east and 3.1 km south-east respectively from the trench
at the North site. Given the distance of these wells from the trench and their location on
the eastern side of the Avenue Plain (where elevations are higher than the western side),
it is expected that SWL at the study site would be closer to the soil surface. However,
there are no observation wells with a long term monitoring record located on the
central/western side of the plain; hence these two wells were selected for investigation.
LAN011 (Fig. 2.5a) and PEC004 (Fig. 2.5b) both exhibit seasonal and annual variability,
indicating that this area is not affected by other regional drainage systems. Both wells
57
also show a decline in mean SWL since 1992. For the period 1980 – 1992, the mean spring
SWL for LAN011 was 0.81 m (range 0.67 – 1.13 m), falling to a mean 1.1 m (with a range
of 0.91 – 1.55 m) for the years 1993 – 2008, while autumn SWL fell from a mean 1.29 m
to 1.5 m during the same period. While the variability is not as great as for LAN011, SWL
at PEC004 fell from a spring mean of 0.64 m to 0.88 m and an autumn mean of 1.15m to
1.22 m for the time periods 1980 – 1992 and 1993 – 2008 respectively, confirming that
SWL are highly responsive to rainfall patterns.
At both wells, the most significant reduction in SWL occurred during 2006 – 2008, when
the spring maxima SWL failed to exceed the long term annual mean. At LAN011, mean
annual SWL fell to 1.54 m, a reduction of 0.23 m from the longer term average (1980-
2005) of 1.19 m. At PEC004, mean annual SWL fell from 1.02 m to 1.27 m during the same
period. This reduction in both spring maxima and the annual mean SWL in the period
2006-2008 again coincides with the reduction in annual rainfall for this period.
2.4.3.2 Soil Chemistry
In contrast to the Central and South sites, both ends of this trench were very strongly
alkaline, extremely saline (EC1:5 >1 dSm-1 in most cases) and strongly sodic (ESP >40 %);
these characteristics were coupled with spontaneously dispersive clay throughout the
profile (Table 2.4). Organic carbon is also notably higher in these soils than in those from
the Central and South sites.
Despite the soils being strongly sodic, they were very well aggregated in the field, a
characteristic that is probably at least partly due to the elevated EC and the high OC
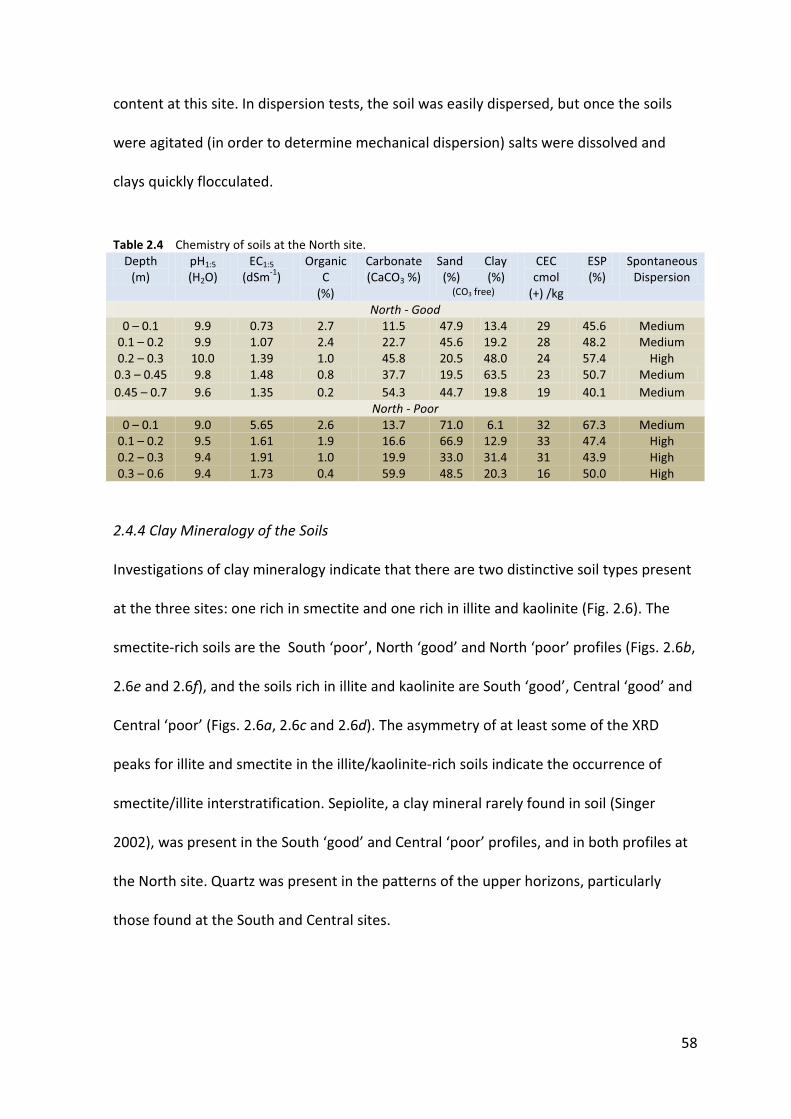
58
content at this site. In dispersion tests, the soil was easily dispersed, but once the soils
were agitated (in order to determine mechanical dispersion) salts were dissolved and
clays quickly flocculated.
Table 2.4 Chemistry of soils at the North site. Depth
(m) pH1:5 (H2O)
EC1:5
(dSm-1) Organic
C (%)
Carbonate (CaCO3 %)
Sand Clay (%) (%)
(CO3 free)
CEC cmol
(+) /kg
ESP (%)
Spontaneous Dispersion
North - Good 0 – 0.1 9.9 0.73 2.7 11.5 47.9 13.4 29 45.6 Medium
0.1 – 0.2 9.9 1.07 2.4 22.7 45.6 19.2 28 48.2 Medium 0.2 – 0.3 10.0 1.39 1.0 45.8 20.5 48.0 24 57.4 High
0.3 – 0.45 9.8 1.48 0.8 37.7 19.5 63.5 23 50.7 Medium 0.45 – 0.7 9.6 1.35 0.2 54.3 44.7 19.8 19 40.1 Medium
North - Poor 0 – 0.1 9.0 5.65 2.6 13.7 71.0 6.1 32 67.3 Medium
0.1 – 0.2 9.5 1.61 1.9 16.6 66.9 12.9 33 47.4 High 0.2 – 0.3 9.4 1.91 1.0 19.9 33.0 31.4 31 43.9 High 0.3 – 0.6 9.4 1.73 0.4 59.9 48.5 20.3 16 50.0 High
2.4.4 Clay Mineralogy of the Soils
Investigations of clay mineralogy indicate that there are two distinctive soil types present
at the three sites: one rich in smectite and one rich in illite and kaolinite (Fig. 2.6). The
smectite-rich soils are the South ‘poor’, North ‘good’ and North ‘poor’ profiles (Figs. 2.6b,
2.6e and 2.6f), and the soils rich in illite and kaolinite are South ‘good’, Central ‘good’ and
Central ‘poor’ (Figs. 2.6a, 2.6c and 2.6d). The asymmetry of at least some of the XRD
peaks for illite and smectite in the illite/kaolinite-rich soils indicate the occurrence of
smectite/illite interstratification. Sepiolite, a clay mineral rarely found in soil (Singer
2002), was present in the South ‘good’ and Central ‘poor’ profiles, and in both profiles at
the North site. Quartz was present in the patterns of the upper horizons, particularly
those found at the South and Central sites.
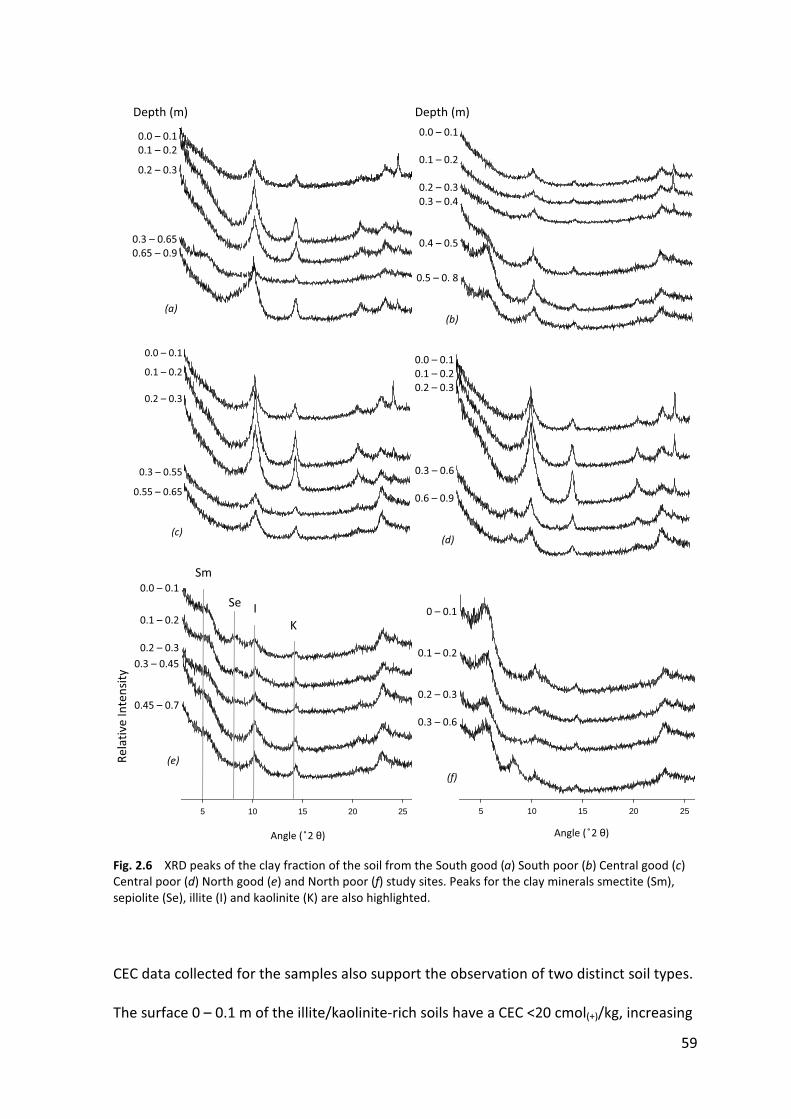
59
CEC data collected for the samples also support the observation of two distinct soil types.
The surface 0 – 0.1 m of the illite/kaolinite-rich soils have a CEC <20 cmol(+)/kg, increasing
Depth (m) Depth (m)
Rela
tive
Inte
nsity
Fig. 2.6 XRD peaks of the clay fraction of the soil from the South good (a) South poor (b) Central good (c) Central poor (d) North good (e) and North poor (f) study sites. Peaks for the clay minerals smectite (Sm), sepiolite (Se), illite (I) and kaolinite (K) are also highlighted.
0.0 – 0.1 0.1 – 0.2
0.2 – 0.3
0.3 – 0.65 0.65 – 0.9
(a)
0.0 – 0.1
0.1 – 0.2
0.2 – 0.3 0.3 – 0.4
0.4 – 0.5
0.5 – 0. 8
(b)
0.0 – 0.1
0.1 – 0.2
0.2 – 0.3
0.3 – 0.55
0.55 – 0.65
(c)
0.0 – 0.1 0.1 – 0.2 0.2 – 0.3
0.3 – 0.6
0.6 – 0.9
(d)
0.0 – 0.1
0.1 – 0.2
0.2 – 0.3
0.3 – 0.45
0.45 – 0.7
(e)
Angle ( ���
5 10 15 20 25
0 – 0.1
0.1 – 0.2
0.2 – 0.3
0.3 – 0.6
(f)
Angle ( ���
5 10 15 20 25
Sm
K
Se I
60
with depth. These soils are also shallow, with moderately to strongly indurated carbonate
horizons occurring from 0.3m in the South ‘good’ and Central ‘poor’ soils. In contrast, the
surface 0 – 0.1 m of the smectite-rich soils have a CEC > 27 cmol(+)/kg, and indurated
carbonate horizons that are only intercepted below 0.6 m. A related trend is also seen
with organic carbon, with the higher CEC soils recording OC contents of 3.9, 2.7 and 2.6 %
in comparison to the lower CEC soils with OC of 2.1, 1.9 and 2.2%.
The higher OC content recorded in the high CEC soils can be attributed to the texture and
clay mineralogy of the surface soils. The combination of high OC content, the presence of
smectites and possible inter-stratification may have led to the development of high CEC
soils despite some horizons having relatively low clay contents, as seen in the South ‘poor’
and Central ‘good’ profiles.
2.5 DISCUSSION
The primary aim of this Chapter is to determine the likely effects that artificial drainage
has had on soil physicochemical properties in the Keilira District in the Upper South East
of South Australia, and to determine whether the observed plant decline in this region is
caused directly by the drainage schemes. Annual rainfall and the implementation of
artificial drainage have been considered when analysing the flux in SWL across the region,
and the current condition of soils with differing drainage histories has been assessed.
2.5.1 Rainfall, artificial drainage and groundwater trends
Significant changes in rainfall intensity are evident in this region since the 1940s. In the
years 1990 - 2008, annual rainfall only exceeds the long term mean (555 mm) four times,

61
and in 2006 the moving 5 year average fell to the lowest levels on record (Fig. 2.1). This
reduction in rainfall is reflected in standing water levels recorded from wells intercepting
the unconfined aquifer in this region. In the northern part of the Keilira District no
artificial drainage has yet been employed, however, observation well monitoring data for
PEC004 and LAN011 (Fig. 2.5a and b) indicate that a decline in SWL has occurred since
1993. At both wells, the most significant reduction in SWL occurred during 2006 – 2008,
with a reduction in both spring maxima and autumn minima. This reduction coincides
with the decline in annual rainfall for these years (Fig. 2.2) and is a trend observed also for
MNC001, MNC030 and MNC032 (Fig. 2.3a, 2.3b, 2.4a). At MNC045 (Fig. 2.4b) the same
trend is not observed, a result that was possibly caused by the local land manager
operating the weir in the Fairview Drain and thus manipulating SWL.
Whereas the wells show seasonal variation and a strong correlation to rainfall, the data
also show that SWL have been altered by the implementation of artificial drainage. The
consistent minimum SWL observed at MNC032 and MNC045 for the years 1993 – 2005
indicate that the Jacky Whites and Blackford Drains have effectively lowered groundwater
in the vicinity of the South and Central study sites. In addition, the significant decline in
SWL in 1998 seen at MNC001 coincides with the construction of the 3 m deep Fairview
Drain in 1997/98. This observation well lies approximately 400 m north of the Fairview
Drain on the Avenue Plain, and reductions in both autumn minima and spring maxima
occur after 1997. These data suggest that the area of land between the Blackford Drain
and observation wells MNC030 and MNC045 has been subject to a lowering of
groundwater levels, and potentially of leaching, for over 50 years. Both the South and
Central study sites are located within this zone. In addition, the land between the
62
Fairview Drain and MNC001 has been subject to improved drainage and leaching since
the drain’s construction in 1997. From these data it can be concluded that SWL are highly
responsive to the implementation of artificial drainage and also to annual rainfall. It is
therefore likely that the lowering of SWL in this region, both through a reduction in
rainfall and through artificial drainage, facilitates the leaching of salts from these soils.
2.5.2 Interpretation of soil properties
All soils investigated in the current study are very strongly alkaline, highly saline and
strongly sodic at some point in their profile. The combination of these factors creates
hostile conditions for plant growth. Nonetheless, the soils from the South, Central and
North sites together exhibit wide variability in their chemical and mineralogical
properties.
Mineralogical investigations of the soils confirm that there are two distinct soil types
present, which supports Blackburn’s observations of 1952. Given these mineralogical
similarities, the soils have been grouped into two classes, smectite-rich soils and
illite/kaolinite-rich soils, and compared to Blackburn’s historical data. The following
sections discuss the data for each soil class, considering their historic and current
chemical properties, drainage histories and observations of plant growth.
2.5.2.1 Smectite-rich Soils
When the chemical properties of the smectite-rich soils (South ‘poor’, North ‘good’ and
North ‘poor’) are compared across sites, it is evident that the soil at the South site has the
lowest pH, EC and ESP (Fig. 2.7a, 2.7c and 2.7d). As previously discussed, the analysis of

63
groundwater levels at the South site (Fig. 2.3b) indicate that the Blackford and Jacky
Whites Drains have effectively lowered SWL to a consistent depth of approximately 1.2 m
in autumn. The data presented in Figure 2.7 suggest that this lowering of SWL facilitates
the leaching of salts. Hence soil pH and EC at the South site have been lowered in
comparison to those of the undrained soils at the North site. The landowner at the South
site has also applied gypsum (England R, pers. comm. June 2006) which, when combined
with leaching, this may have contributed to the significantly lower ESP observed here (Fig.
7d).
(a) pH (H2O) (b) CaCO3 % (c) EC1:5 (dSm-1) (d) ESP
Dep
th (m
)
0
0.2
0.4
0.6
Fig. 2.7 Properties of smectite rich soils at the drained site, South ‘poor’ ( ) and the undrained North ‘good’ ( ) and North ‘poor’ ( ) sites, compared to the pH and EC measured for soil association J ( ) by Blackburn in 1950 prior to artificial drainage throughout this area. Open symbols are used here to represent drained sites, closed symbols for non-drained sites.
In comparison, soils at the North site clearly have the highest pH, EC and ESP (Fig. 2.7a,
2.7c and 2.7d) of the smectitic soils. These characteristics can be attributed to poor
internal drainage, brought about by the high clay content of the soil, the dominance of
7.5 8.5 9.5 10.5 0 20 40 60 80 0.0 1.5 3.0 4.5 6.0 7.5 9.0 0 15 30 45 60 75

64
smectite minerals, the presence of a highly indurated carbonate cap at 0.6 - 0.7 m and the
absence of artificial drainage throughout this area.
However, the pH and EC data collected here are not the highest reported in an historical
context. The observed chemical and physical properties of the smectite-rich soils closely
align to the characteristics outlined for Blackburn’s Soil Association J. The samples
collected in Blackburn’s study were retrieved from the CSIRO archives in Canberra and
analysed following current methods using a 1:5 soil:water suspension, ensuring the valid
comparison of recent and historic data. A representative profile for Soil Association J is
profile number 18 (Clarke 1955), which exhibited extreme salinity throughout much of
the profile (Fig. 2.7c). The variability in EC in this profile from 8.3 dSm-1 at the surface to
0.85 dSm-1 at 0.03 m increasing to 5.7 dSm-1 at 0.35 m, is attributed to a remarkable
variability of thin soil horizons in the profile with differing texture. At the surface a light
grey/brown fine sandy loam (5 % clay) was present, with an acid-effervescent surface
crust, underlain by light grey fine sand (0.25 % clay). The clay content then increases
steadily down the profile, reaching a maximum of 46 % at 0.35 m, with lower EC at 0.7 m
as CaCO3 content increases to >40 %. The presence of thin soil horizons with distinct
textural contrasts were not found in the current study, the upper horizons appear to be
more homogenous, possibly brought about by mechanical cultivation and livestock traffic.
At the North site it is possible that salt loads have been reduced since the 1950s because
of the reduction in rainfall and the natural lowering of groundwater levels. The analysis of
the wells PEC004 and LAN011 (Fig. 2.5a and 2.5b) showed that mean annual SWL have
fallen since 1992 in the vicinity of the North study site, coinciding with the reduction in

65
annual rainfall. It must be noted, however, that Blackburn did not sample soils in close
vicinity to the North study site, so this particular inference is not supported by data.
Another possible explanation for the lowering of soil salinity throughout the northern
area since the 1950s is the construction in 1956 of the Blackford Drain, which, for the first
time, allowed discharge of drain water to the ocean and the export of salt from this
region. Prior to the construction of this drain, drainage policies from 1900 – 1950 were to
channel surface waters to the northwest, significantly increasing water flows, and
potentially also salt loads in the USE (South East Catchment Water Management Board
2003).
At the time of Blackburn’s study it was observed that plant species varied substantially
between the soil associations. He noted that a combination of halophytic species often
colonised the clay-rich saline areas; scattered samphire in a growth of thatching grass and
broombush generally indicated higher soil salinity. As much of the landscape has been
cleared of native vegetation, cultivated for agricultural purposes and sown down to
pasture, current land managers in this region have few natural/native indicators to show
the vastly different soil types present on their farms. This has been brought about as the
native vegetation and undulation once associated with the saline clay-rich soils (soil
association J) no longer segregates the two distinct soil types. Since the implementation
of drainage and the subsequent lowering of soil salinity at the South site, the land
manager has moved away from growing salt tolerant pasture species, cultivating a mixed
lucerne, medic and chicory pasture (Robert England, pers. comm. June 2006). In contrast,
salt-tolerant pasture species still predominate at the North site, leading to the observed

66
thick stubble cover and prolific root growth seen here, despite the extreme salt loads in
the soils. The areas of poor plant growth at the South ‘poor’ site and also at the North
‘poor’ site can therefore be attributed to the high concentration of salt at the surface
(Table 2.2 and 2.4), potentially brought about by the evaporation of subsoil moisture
during the summer months from the clay rich soil found here.
2.5.2.2 Illite-Kaolinite- rich soils
The observed properties of the soil profiles South ‘good’, Central ‘good’ and Central
‘poor’ correlate to Blackburn’s Soil Association R and are rich in the clay minerals illite and
kaolinite. When we compare the current soil properties of this soil type to Blackburn’s
historic data (profile 14), we also see that the pH and EC of these soils are generally lower
than those observed in 1952 (Fig. 2.8a, 2.8c). This phenomenon is attributed to the
implementation of artificial drainage in this region, falling SWL and the subsequent
leaching of salts from the soils at the South and Central study sites.
The Central ‘poor’ and South ‘good’ profiles exhibit similar trends in pH, EC and ESP
throughout (Fig. 2.8a, 2.8c and 2.8d), and the levels are lower than the pH, EC and ESP
reported for the Central ‘good’ profile. Since the construction of the Jacky Whites,
Blackford and Fairview Drains, maximum SWL at the South and Central sites rarely reach
within 0.5 m of the soil surface (Figure 2.3b, 2.4a and 2.4b), well below the indurated
carbonate cap that separates the upper and lower soil horizons in the South ‘good’ and
Central ‘poor’ profiles. This calcrete is not conducive to capillary rise due to its extremely
low porosity, and it is likely that salts are no longer mobilised into the root zone of
pastures through upward movement of saline groundwater. In contrast, the 0.3 – 0.55 m

67
horizon in the Central ‘good’ profile contains marl, with a higher clay % and CEC (Table
2.3), and is therefore more conducive to water movement up and down the profile. This
may explain the higher pH, EC and ESP that are observed here. Therefore, the soils with
shallow indurated carbonate-rich horizons and low SWL are more prone to leaching and
hence exhibit better chemical conditions for plant growth, as seen here in the South
‘good’ and Central ‘poor’ profiles.
(a) pH (H2O) (b) CaCO3 % (c) EC1:5 (dSm-1) (d) ESP
Dep
th (m
)
0
0.2
0.4
0.6
0.8
Fig. 2.8 Properties of illite/kaolinite-rich soils at the drained sites of South ‘good’ ( ), Central ‘good’ ( ) and Central ‘poor’ ( ) sites, compared to the pH and EC measured of soil association R ( ) by Blackburn in 1950 prior to artificial drainage throughout this area.
However, the nature of the clay minerals present in these soils, predominately illite and
kaolinite, combined with a low to moderate salinity and high ESP in the 0.1 - 0.3 m zone
results in these soils being unstable when wet (Churchman et al. 1993), causing them to
degrade physically. Field observations during trench excavation showed that livestock
movement and machinery operations caused significant structural decline when these
soils were saturated. Once dispersed, soil density and strength increase as the soil dries to
7.5 8.5 9.5 10.5 0 20 40 60 80 0.0 1.0 2.0 3.0 0 15 30 45 60

68
an extent that it is not easily penetrated by plant roots. Subsequent water infiltration is
compromised in these dispersive soils, compounding the hostile conditions for plant
growth. Unlike the smectite-dominant soils, these soils lack the ability to shrink and swell
and hence to regenerate structure once dispersion has occurred. The combination of
these factors has led to a compacted surface underlain by a massive columnar structure
in the Central ‘poor’ profile and is responsible for the observed poor plant growth at this
site, despite it having lower EC and ESP than the ‘good’ end. However, as the upward
movement of saline groundwater is no longer a common occurrence, these soils should
be easily ameliorated with gypsum application.
2.5.3 Observations of pH for all Soils
Soil pH values in all drained sites are lower than those observed by Blackburn, coinciding
with a low CaCO3 content of the upper 0.3 m of soil, whereas the soil pH values of the
undrained North sites are higher (Fig. 2.7a). Drained sites have <10 % carbonate in
comparison to the North site values of 11 – 45 %, implying that the leaching of sodium,
chloride, and carbonate and bicarbonate ions is occurring, resulting in lower soil pH.
2.6 CONCLUSION
Groundwater levels in the Upper South East of South Australia are highly responsive to
rainfall and also to the implementation of artificial drainage, and show a falling trend
since the early 1990s, especially since the construction of the Fairview Drain in 1997. This
reduction in groundwater has facilitated the leaching of salts, and the physicochemical
condition of the soils has changed since Blackburn’s investigations in 1952. Problem soils
observed by landowners of the three study sites have been caused by the combination of
69
high soil pH, high to extreme EC and extremely high ESP and have been affected by a
reduction in groundwater levels; these soils commonly are smectitic in mineralogy. The
combination of these factors has led to the development of soils that are both chemically
hostile and structurally unstable. Nevertheless, the mineralogy of the soil governs the
level of structural degradation when the soils are sodic, such that the illite/kaolinite-
dominant soils are particularly degraded, resulting in the highly compacted form
observed.
From this study it is further concluded that the observed decline in plant growth has
multiple causes; it is not related solely to the extension of the artificial drainage network,
as the local farmers had feared.
The most outstanding feature of these soils is the high variability of soil chemical, physical
and mineralogical characteristics that were found to occur across very small spatial scales.
An understanding of the factors that govern the development of such characteristics will
contribute to the effective management of this region, especially when the further
extension of artificial drainage networks is being considered.
70
2.7 REFERENCE LIST
Australian Bureau of Meteorology. (2009). 'Monthly mean maximum temperature KEITH'. Australian Bureau of Meteorology. From: http://www.bom.gov.au/jsp/ncc/cdio/weatherData/av?p_nccObsCode=36&p_display_type=dataFile&p_stn_num=025507 Accessed 22/03/2009. Australian Bureau of Meteorology. (2009). 'Monthly Rainfall KINGSTON SE (KEILIRA STATION)'. Australian Bureau of Meteorology. From: http://www.bom.gov.au/jsp/ncc/cdio/weatherData/av?p_nccObsCode=139&p_display_type=dataFile&p_stn_num=026010 Accessed 21/03/2009. Barnett SR (2000). Extent and impacts of dryland salinity in South Australia. National Land and Water Resources Audit, PIRSA Report Book 2000/00045, South Australia. Blackburn G (1952). The Soils of the Kingston-Avenue Drainage Area, South Australia. CSIRO Division of Soils, Melbourne. Chorom M, Rengasamy P, Murray RS (1994). Clay Dispersion as Influenced by pH and Net Particle charge of Sodic Soils. Australian Journal of Soil Research 32, 1243 - 1252. Churchman GJ, Skemstad JO, Oades JM (1993). Influence of Clay Minerals and Organic Matter on Effects of Sodicity on Soils. Australian Journal of Soil Research 31, 779 - 800. Clarke ARP (1955). The laboratory examination of soils from County Macdonnell, County Robe, County Buckingham and County Cardwell, South Australia (Collected 1949 - 1952). CSIRO Division of Soils, Adelaide. Department of Water Land and Biodiversity Conservation. (2009). 'Obswell'. Department of Water, Land and Biodiversity Conservation. From https://obswell.pir.sa.gov.au/new/obsWell/MainMenu/menu. Accessed 05/04/2009. Department of Water Land and Biodiversity Conservation. (2009). 'USE Dryland Salinity and Flood Management Program '. Department of Water Land and Biodiversity Conservation. From http://www.dwlbc.sa.gov.au/land/programs/use/index.html. Accessed 05/05/2009. Gee GW, Bauder JW (1986). Particle-size Analysis. In 'Methods of Soil Analysis. Part 1'. Eds A Klute. 383 - 411. American Society of Agronomy Inc: Madison, WI, USA. Huntley DJ, Hutton JT, Prescott JR (1993). The stranded beach-dune sequence of south-east South Australia: A test of thermoluminescence dating, 0-800 ka. Quaternary Science Reviews 12, 1-20. Kelly J, Rengasamy P (2006). 'Diagnosis and management of soil constraints: transient salinity, sodicity and alkalinity'. University of Adelaide: Adelaide, SA.

71
Keren R (2000). Salinity. In 'Handbook of Soil Science'. Eds M E Sumner. G3 - G25. CRC Press: Boca Raton, USA. Mikhail EH, Briner GP (1978). Routine Particle Size Analysis of Soils Using Sodium Hypochlorite and Ultrasonic Dispersion. Australian Journal of Soil Research 16, 241 - 244. National Land and Water Resources Audit, National Heritage Trust (2001). Australian dryland salinity assessment 2000 extent, impacts, processes, monitoring and management options. Turner, ACT. Northcote KH, Skene JKM (1972). 'Australian soils with saline and sodic properties'. CSIRO: Melbourne. Rayment G, Higginson F (1992). 'Australian Laboratory Handbook of Soil and Water Chemical Methods'. Inkata Press: Melbourne. Rengasamy P, Olsson KA (1991). Sodicity and Soil Structure. Australian Journal of Soil Research 29, 935 - 952. Shaw R (1999). Soil salinity - electrical conductivity and chloride. In 'Soil Analyses an Interpretation Manual'. Eds K I Peverill, L Sparrow and D J Reuter. 129 - 145. CSIRO: Collingwood, VIC. Sherrod LA, Dunn G, Peterson GA, Kolberg RL (2002). Inorganic Carbon Analysis by Modified Pressure-Calcimeter Method. Soil Science Society of America Journal 66, 299-305. Singer A (2002). Palygorskite and Sepiolite. In 'Soil Mineralogy with Environmental Applications'. Eds Soil Science Society of America. 555-571. SSSA: Madison, WI, USA. Slattery WJ, Conyers MK, Aitken RL (1999). Soil pH, aluminium, manganese and lime requirement. In 'Soil Analyses an Interpretation Manual'. Eds K I Peverill, L Sparrow and D J Reuter. 103 - 128. CSIRO: Collingwood, VIC. South East Catchment Water Management Board (2003). South East Catchment Water Management Plan 2003 - 2008. South East Catchment Water Management Board, Mount Gambier.
72
CHAPTER 3
COMBINING GEOPHYSICAL TOOLS, SOIL SURVEY AND SOIL CHEMISTRY TO INVESTIGATE
THE CAUSE OF SPATIAL VARIABILITY OF SOILS IN THE UPPER SOUTH EAST OF SA
3.1 INTRODUCTION
The South East Region of South Australia (SA) is characterised geologically by a sequence
of relic stranded beach dunes and inter-dunal plains that have formed over the past 800
Ka (Huntley et al. 1993). The inter-dunal plains are often affected by surface-water
inundation and have historically been saline (Blackburn 1952). Engineering (artificial
drains) and agronomic mitigation strategies have been employed by local land holders
and regional Natural Resource Management Boards to ameliorate dryland salinity, and to
interrupt the surface waters with the aim of lowering groundwater levels (South East
Catchment Water Management Board 2003). Previous studies conducted by Blackburn
(1952) on the soils in the Kingston-Avenue district showed that they were extremely
saline and moderately to strongly alkaline. Despite the implementation of 50 years of
artificial drainage throughout this region, a recent study found that some soils were still
salt-affected (Chapter 2 of this thesis). Such soils often exhibit strongly sodic properties in
addition to being strongly alkaline and extremely saline, and patches of declining pasture
growth were also often observed. In both of the previous studies, however, the chemical
and mineralogical characteristics of the soils were found to be highly variable, even across
small distances, the cause of which had not been identified. Given the decline in plant
growth observed and the current and proposed further extension of the drainage
73
network in this region, a more thorough understanding of the scale and extent of such
variability and the factors responsible for its development is required.
In order to gain such information, a strategic investigation of the soil and underlying
geomorphology of the landscape is required; however, traditional soil surveying methods
are often time consuming and costly, particularly in environments where indurated
horizons are present. To reduce the resources needed and to aid such investigations,
geophysical tools, such as Electromagnetic Induction (EMI) scanning and Ground
Penetrating Radar (GPR), can be used as rapid, non-invasive methods for indirectly
collecting soil information. EMI sensors respond to bulk soil conductivity, known as
apparent conductivity (ECa, typically recorded in dSm-1) and can be used for mapping soil
features that affect the electrical conductivity (EC) of subsurface layers, such as clay
content, salt concentration and moisture content (James et al. 2003). GPR in contrast,
transmits pulses of radio-frequency electromagnetic energy which propagate through the
soil and are reflected at layers or objects with contrasting dielectric properties (Doolittle
et al. 2006). The identification of soil physicochemical properties and subsurface
structures, such as the boundaries between different materials, can therefore be inferred
from GPR surveys. When EMI and GPR surveys are conducted and analysed in unison,
they can provide an indicator of important soil properties and their spatial distribution
within the landscape (Sudduth et al. 2001).
The aims of this study therefore were to: (i) conduct an EMI and GPR survey across a 4
hectare area in the Keilira District, (ii) analyse the constructed ECa and GPR images in
conjunction with preliminary soil results in order to identify the zone of greatest soil and

74
geological variability, (iii) chemically characterise this variability, and (iv) determine the
cause of the spatial variability of soil properties in this region.
3.2 METHODS
Various methods were used in this study to strategically investigate the soils. Initially, a
geophysical survey was conducted across the selected study site and preliminary soil
samples were collected. The concurrent interpretation of these data led to the location of
a study trench where profiles were strategically sampled and analysed.
(a) (b)
(c) (d)
Fig. 3.1 (a) Patchy seedling emergence (winter 2006) with area of poor plant growth and slumping in the background. (b) Surface crusting and efflorescence in a bare patch. (c) Site of the study trench, before excavation, looking east (summer 2007). Area of poor plant growth (lower left hand corner) corresponds to that of photo a above and soil profiles 1 and T3. (d) Excavating the trench, looking west.
75
3.2.1 Study Site
The property ‘Shepherds Hill’ is located in the area locally referred to as the Keilira
District, in the Upper South East of South Australia, approximately 30km inland from the
coastal township of Kingston. The land owners had previously identified areas across the
property with declining pasture growth (Fig. 3.1a) and a survey site, approximately 200m
x 200m in size, was selected for investigation. Varying plant species and proliferation,
bare patches of soil and variable microtopography were observed.
3.2.2 Geophysical Surveys
Geophysical surveys (EMI and GPR) were conducted in July 2006 by Ecophyte
Technologies Pty Ltd. A report was prepared by them, detailing the methods used for
data collection, analysis and image preparation; the report has been drawn upon to
provide a summary of these methods herein.
A Geophex Ltd GEM-2 broadband electromagnetic sensor was used to conduct the EMI
survey, with data collected at frequencies of 46,275, 40,275, 34,525 and 30,875 Hz. EM
penetration investigation depths were calculated at 3.4, 3.5, 3.7 and 3.8 m respectively
(non-weighted average), based on the assumption of homogenous substrates. The
calculations do not account for changes in magnetic susceptibility or the variability in
subsurface composition; therefore, the exact penetration depth is not known. These
calculated depths can be considered as likely maxima.
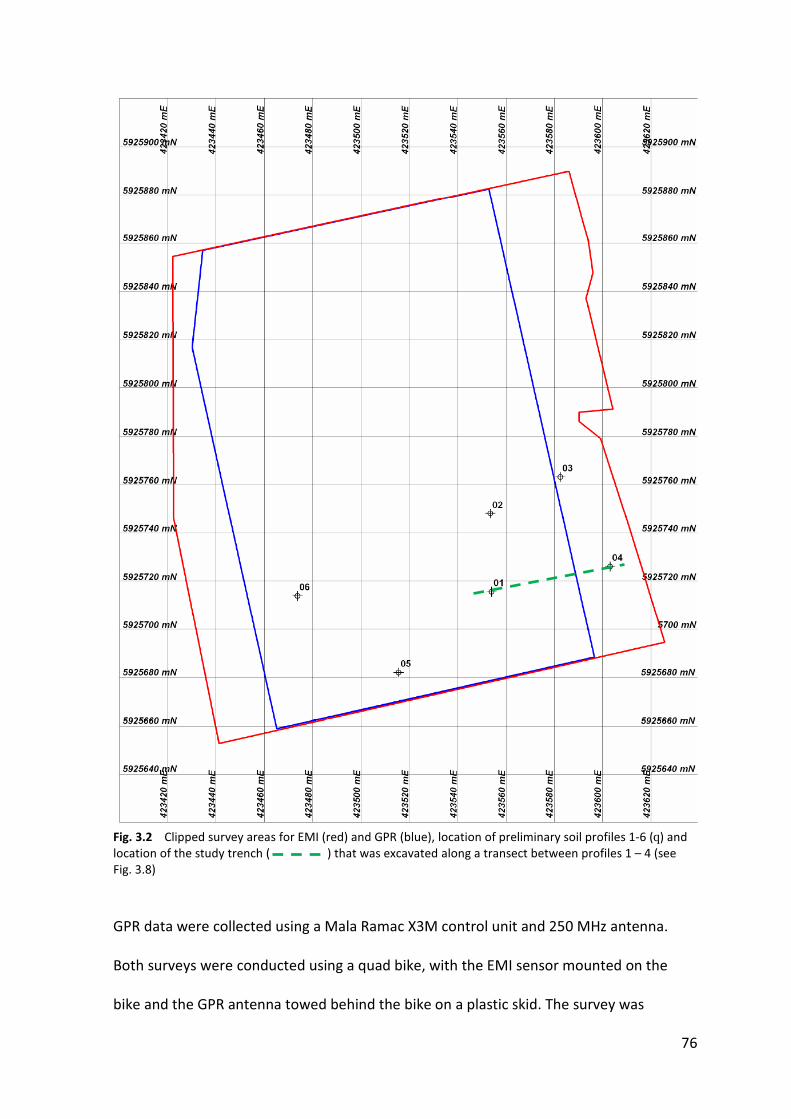
76
Fig. 3.2 Clipped survey areas for EMI (red) and GPR (blue), location of preliminary soil profiles 1-6 (q) and location of the study trench ( ) that was excavated along a transect between profiles 1 – 4 (see Fig. 3.8)
GPR data were collected using a Mala Ramac X3M control unit and 250 MHz antenna.
Both surveys were conducted using a quad bike, with the EMI sensor mounted on the
bike and the GPR antenna towed behind the bike on a plastic skid. The survey was
77
conducted at a slow travelling speed to ensure steady contact with the ground surface.
Outputs from EMI and GPR were coupled to a differential global positioning system. The
surveys were conducted along 99 parallel survey lines, positioned approximately 2 m
apart and were 160 m long, oriented northeast to southwest. Raw EMI and GPR data
were filtered and edited prior to processing to remove unreliable data and a core survey
area was clipped from the survey coverage (Fig. 3.2). Electroconductivity images were
constructed for each of the collection frequencies and GPR data were presented as both
vertical profiles (radargrams) as collected, and as time-depth slices cut from a 3-D block.
3.2.3 Preliminary Soil Sampling
Six soil profiles were sampled in conjunction with the geophysical survey to allow
preliminary analysis of the constructed images; the location of the sample sites is
illustrated in Fig. 3.2. Profiles were sampled at 0.1m intervals using a hand auger, with
the overall profile depth governed by the presence of indurated carbonate horizons.
3.2.4 Soil Chemical Analysis
Samples were air dried and a representative portion was ground and passed through a 2
mm diameter sieve. On the fine earth fraction pHH20, EC and spontaneous dispersion were
determined using a 1:5 soil:water suspension (Kelly and Rengasamy 2006). Samples from
each horizon were hand-textured (McDonald and Isbell 1990) and the soil salinity criteria
of Shaw (1999) were used to assign salinity ratings. The sodicity guidelines for Australian
soils identified by Northcote and Skene (1972) were used to assign sodicity ratings, and
soil pH was classified according to the guidelines presented by Slattery et al. (1999).
Because of the highly calcareous, alkaline and saline nature of the soils, CEC and
78
exchangeable cation concentration were determined following the method of Rayment
and Higginson (1992) for soils with EC1:5 > 0.3 dSm-1 and pHH20 > 7.4. Following the removal
of soluble salts, exchangeable basic cations were extracted using 1 M ammonium chloride
at pH 8.5 (Rayment and Higginson 1992) and the Ca, Mg, Na and K concentrations were
determined by GBC-906 flame atomic absorption spectrophotometry. CEC was
determined by measurement of NH4+ and Cl in an auto-analyser. Exchangeable sodium
percentage was calculated by the relationship ESP = (Na/CEC) x 100.
3.2.5 Trench Location
EMI, GPR and preliminary soil sampling data were analysed collectively and a zone was
identified in the lower southeast quadrant of the geophysical survey area that exhibited
both a high level of radargram variation and profile patterning, and a transition across EM
zones. Within this zone a transect was selected for the excavation of a trench to facilitate
detailed investigations on the soils and underlying geology. The transect selected lay
between the preliminary soil sampling points 1 and 4 (Fig. 3.2) corresponding to GPR
survey line 19. A 60 m long, 1 m wide trench was excavated to a depth varying between
0.9 and 1.7 m (Fig. 3.1c and d). During excavation it became evident that a strongly
indurated horizon was present in the profile, generally located between 0.7 and 0.9 m.
This horizon was hard to penetrate solely with the excavator bucket; a rock breaker was
required to allow excavation below this impediment. Owing to the cost and time involved
in excavating a trench of this size, only some profiles were excavated below the indurated
horizon.
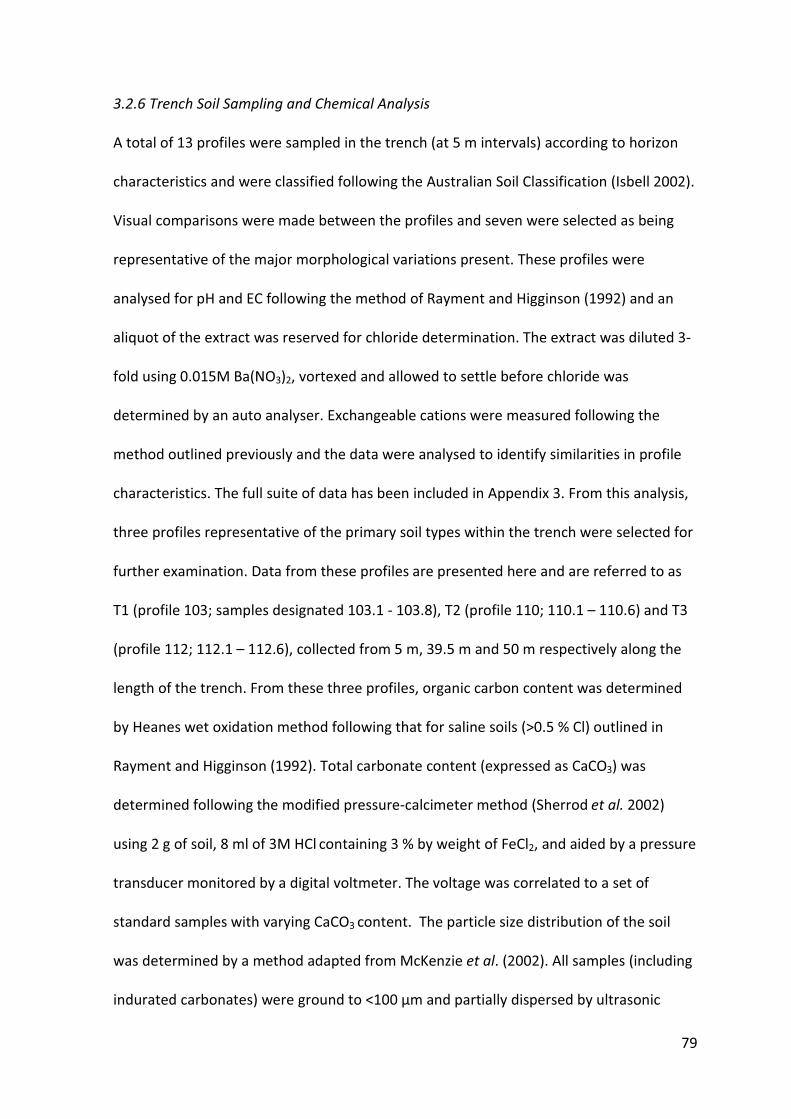
79
3.2.6 Trench Soil Sampling and Chemical Analysis
A total of 13 profiles were sampled in the trench (at 5 m intervals) according to horizon
characteristics and were classified following the Australian Soil Classification (Isbell 2002).
Visual comparisons were made between the profiles and seven were selected as being
representative of the major morphological variations present. These profiles were
analysed for pH and EC following the method of Rayment and Higginson (1992) and an
aliquot of the extract was reserved for chloride determination. The extract was diluted 3-
fold using 0.015M Ba(NO3)2, vortexed and allowed to settle before chloride was
determined by an auto analyser. Exchangeable cations were measured following the
method outlined previously and the data were analysed to identify similarities in profile
characteristics. The full suite of data has been included in Appendix 3. From this analysis,
three profiles representative of the primary soil types within the trench were selected for
further examination. Data from these profiles are presented here and are referred to as
T1 (profile 103; samples designated 103.1 - 103.8), T2 (profile 110; 110.1 – 110.6) and T3
(profile 112; 112.1 – 112.6), collected from 5 m, 39.5 m and 50 m respectively along the
length of the trench. From these three profiles, organic carbon content was determined
by Heanes wet oxidation method following that for saline soils (>0.5 % Cl) outlined in
Rayment and Higginson (1992). Total carbonate content (expressed as CaCO3) was
determined following the modified pressure-calcimeter method (Sherrod et al. 2002)
using 2 g of soil, 8 ml of 3M HCl containing 3 % by weight of FeCl2, and aided by a pressure
transducer monitored by a digital voltmeter. The voltage was correlated to a set of
standard samples with varying CaCO3 content. The particle size distribution of the soil
was determined by a method adapted from McKenzie et al. (2002). All samples (including
indurated carbonates) were ground to <100 μm and partially dispersed by ultrasonic
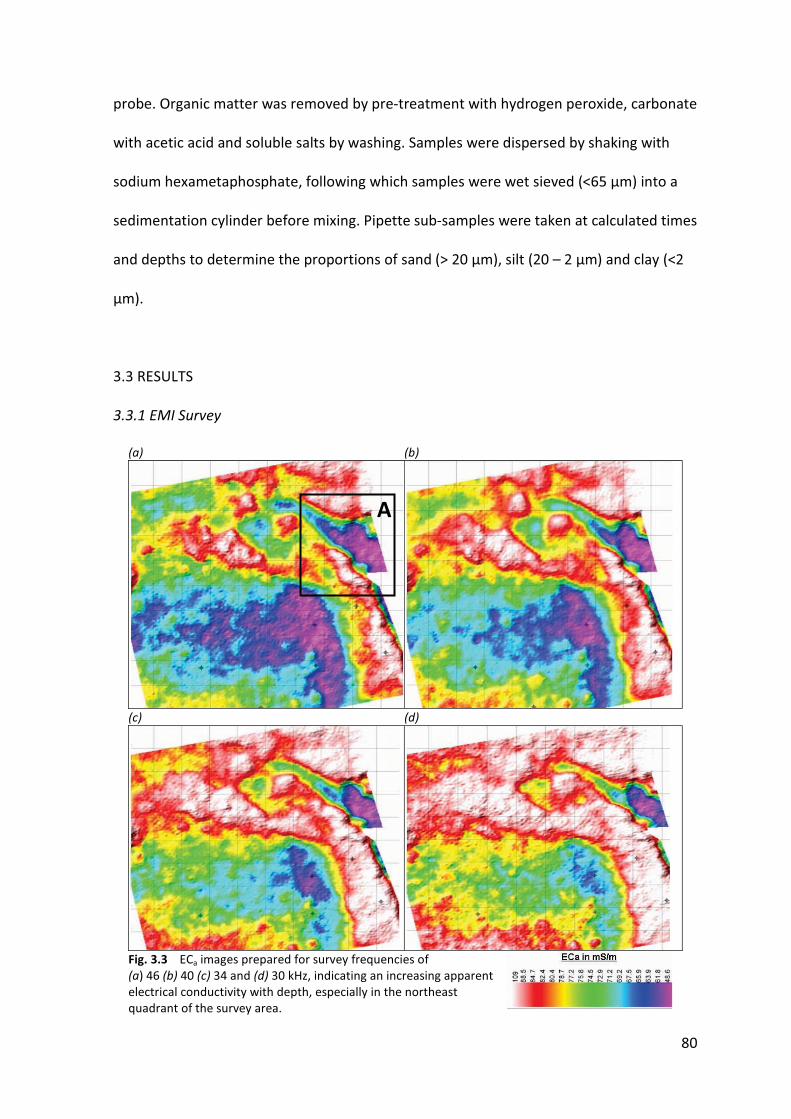
80
probe. Organic matter was removed by pre-treatment with hydrogen peroxide, carbonate
with acetic acid and soluble salts by washing. Samples were dispersed by shaking with
sodium hexametaphosphate, following which samples were wet sieved (<65 μm) into a
sedimentation cylinder before mixing. Pipette sub-samples were taken at calculated times
and depths to determine the proportions of sand (> 20 μm), silt (20 – 2 μm) and clay (<2
μm).
3.3 RESULTS
3.3.1 EMI Survey
(a) (b)
(c) (d)
Fig. 3.3 ECa images prepared for survey frequencies of (a) 46 (b) 40 (c) 34 and (d) 30 kHz, indicating an increasing apparent electrical conductivity with depth, especially in the northeast quadrant of the survey area.
A

81
Discrete zones of high apparent electrical conductivity (ECa) were identified in the EMI
survey and strong correlations in ECa were evident between the images for the four
collection frequencies. ECa generally increased with depth in most zones (Fig. 3.3).
The highest ECa is observed in the arc that extends from the southeast corner of the
survey to the northwest corner. One discrete zone (A, Fig. 3.3a) in the northeast quadrant
exhibits the lowest ECa for the survey area and remains relatively unchanged for each
collection frequency. This area corresponds to the outcropping of a limestone ridge that
has a higher elevation than the surrounding areas and was vegetated with eucalyptus
trees rather than pasture species.
3.3.2 GPR Survey
A total of 99 GPR survey lines, 135m long and 2m deep, were processed using a
consistent set of image processing parameters that facilitated the best overall distinction
of soil profile features. The Ecophyte Technologies Report (2007) identifies a number of
distinct features evident on the radargrams (Fig. 3.4) viz.:
(a) Grey, smooth, relatively featureless zones.
(b) Zones extending from a few to tens of metres, dominated by distinct vertical
‘streaks’ that have sharp, distinct edges extending through the radargrams.
(c) Zones dominated by closely packed lines that are sometimes ‘wavy’, near parallel
to the ground surface.
(d) Parabolic features that indicate strongly reflective subsoil features, generally less
than 1 m deep in the profile.
(e) Layers of near parallel lines that appear to be less closely packed below 1 m.
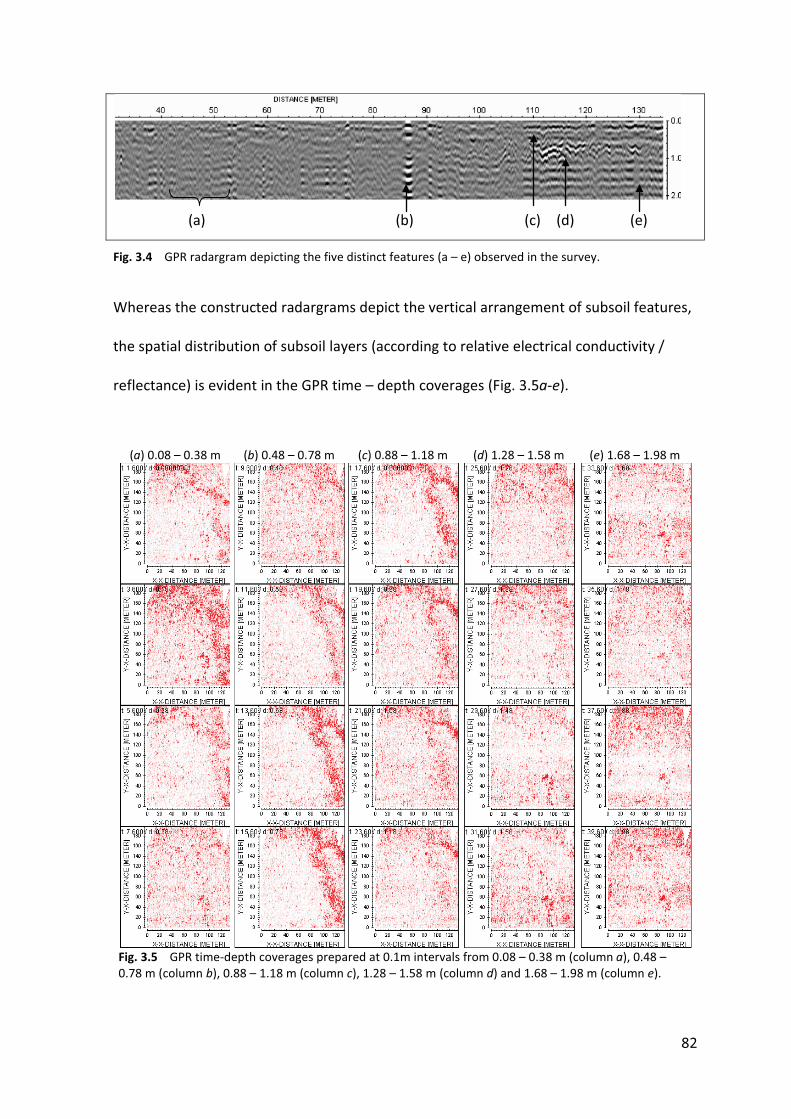
82
Fig. 3.4 GPR radargram depicting the five distinct features (a – e) observed in the survey. Whereas the constructed radargrams depict the vertical arrangement of subsoil features,
the spatial distribution of subsoil layers (according to relative electrical conductivity /
reflectance) is evident in the GPR time – depth coverages (Fig. 3.5a-e).
(a) 0.08 – 0.38 m (b) 0.48 – 0.78 m (c) 0.88 – 1.18 m (d) 1.28 – 1.58 m (e) 1.68 – 1.98 m
Fig. 3.5 GPR time-depth coverages prepared at 0.1m intervals from 0.08 – 0.38 m (column a), 0.48 – 0.78 m (column b), 0.88 – 1.18 m (column c), 1.28 – 1.58 m (column d) and 1.68 – 1.98 m (column e).
(e) (c) (a) (b) (d)
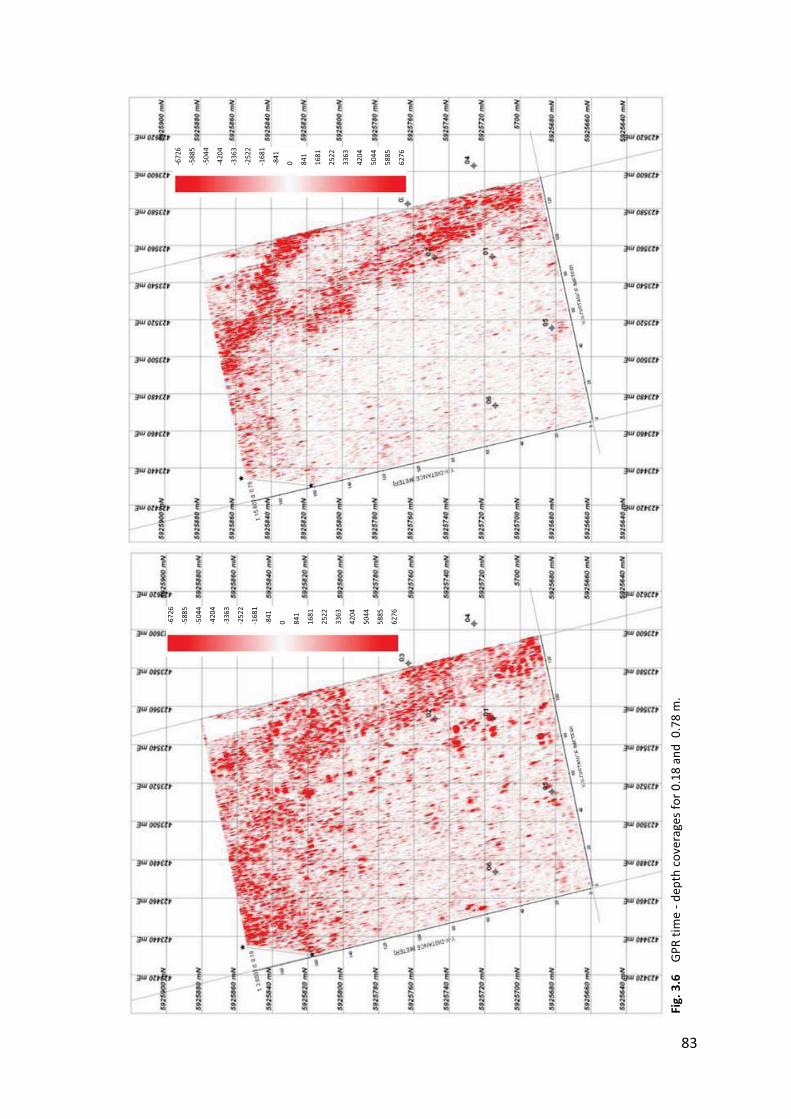
83
Fig.
3.6
G
PR ti
me
- dep
th c
over
ages
for
0.18
and
0.7
8 m
.
-672
6
-588
5
-504
4
-420
4
-336
3
-252
2
-168
1
-841
0 841
1681
2522
3363
4204
5044
5885
6276
-672
6
-588
5
-504
4
-420
4
-336
3
-252
2
-168
1
-841
0 841
1681
2522
3363
4204
5044
5885
6276
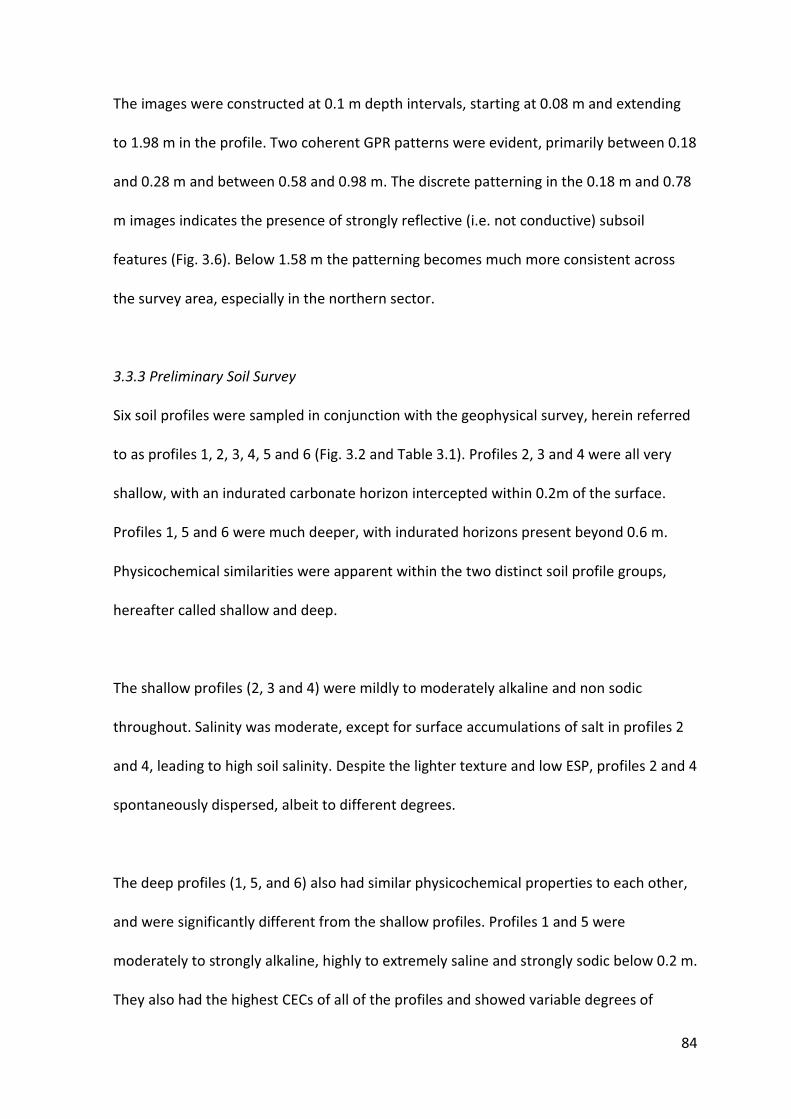
84
The images were constructed at 0.1 m depth intervals, starting at 0.08 m and extending
to 1.98 m in the profile. Two coherent GPR patterns were evident, primarily between 0.18
and 0.28 m and between 0.58 and 0.98 m. The discrete patterning in the 0.18 m and 0.78
m images indicates the presence of strongly reflective (i.e. not conductive) subsoil
features (Fig. 3.6). Below 1.58 m the patterning becomes much more consistent across
the survey area, especially in the northern sector.
3.3.3 Preliminary Soil Survey
Six soil profiles were sampled in conjunction with the geophysical survey, herein referred
to as profiles 1, 2, 3, 4, 5 and 6 (Fig. 3.2 and Table 3.1). Profiles 2, 3 and 4 were all very
shallow, with an indurated carbonate horizon intercepted within 0.2m of the surface.
Profiles 1, 5 and 6 were much deeper, with indurated horizons present beyond 0.6 m.
Physicochemical similarities were apparent within the two distinct soil profile groups,
hereafter called shallow and deep.
The shallow profiles (2, 3 and 4) were mildly to moderately alkaline and non sodic
throughout. Salinity was moderate, except for surface accumulations of salt in profiles 2
and 4, leading to high soil salinity. Despite the lighter texture and low ESP, profiles 2 and 4
spontaneously dispersed, albeit to different degrees.
The deep profiles (1, 5, and 6) also had similar physicochemical properties to each other,
and were significantly different from the shallow profiles. Profiles 1 and 5 were
moderately to strongly alkaline, highly to extremely saline and strongly sodic below 0.2 m.
They also had the highest CECs of all of the profiles and showed variable degrees of
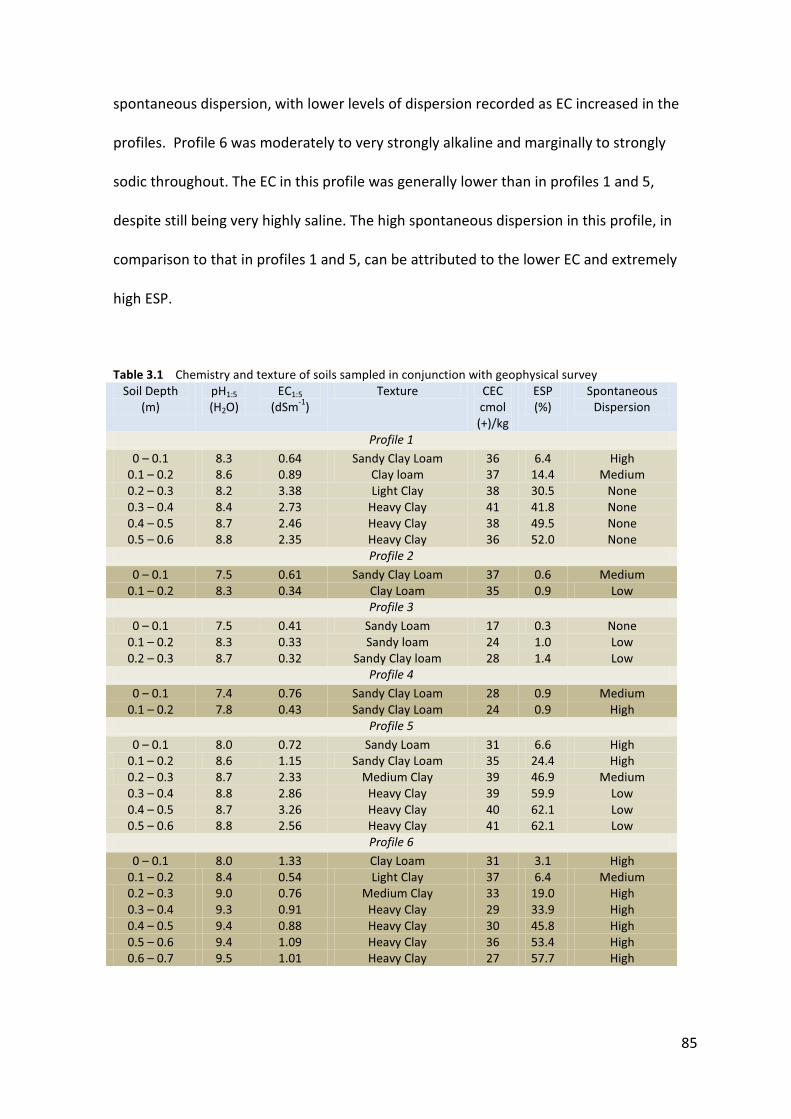
85
spontaneous dispersion, with lower levels of dispersion recorded as EC increased in the
profiles. Profile 6 was moderately to very strongly alkaline and marginally to strongly
sodic throughout. The EC in this profile was generally lower than in profiles 1 and 5,
despite still being very highly saline. The high spontaneous dispersion in this profile, in
comparison to that in profiles 1 and 5, can be attributed to the lower EC and extremely
high ESP.
Table 3.1 Chemistry and texture of soils sampled in conjunction with geophysical survey Soil Depth
(m) pH1:5 (H2O)
EC1:5
(dSm-1) Texture CEC
cmol (+)/kg
ESP (%)
Spontaneous Dispersion
Profile 1 0 – 0.1 8.3 0.64 Sandy Clay Loam 36 6.4 High
0.1 – 0.2 8.6 0.89 Clay loam 37 14.4 Medium 0.2 – 0.3 8.2 3.38 Light Clay 38 30.5 None 0.3 – 0.4 8.4 2.73 Heavy Clay 41 41.8 None 0.4 – 0.5 8.7 2.46 Heavy Clay 38 49.5 None 0.5 – 0.6 8.8 2.35 Heavy Clay 36 52.0 None
Profile 2 0 – 0.1 7.5 0.61 Sandy Clay Loam 37 0.6 Medium
0.1 – 0.2 8.3 0.34 Clay Loam 35 0.9 Low Profile 3
0 – 0.1 7.5 0.41 Sandy Loam 17 0.3 None 0.1 – 0.2 8.3 0.33 Sandy loam 24 1.0 Low 0.2 – 0.3 8.7 0.32 Sandy Clay loam 28 1.4 Low
Profile 4 0 – 0.1 7.4 0.76 Sandy Clay Loam 28 0.9 Medium
0.1 – 0.2 7.8 0.43 Sandy Clay Loam 24 0.9 High Profile 5
0 – 0.1 8.0 0.72 Sandy Loam 31 6.6 High 0.1 – 0.2 8.6 1.15 Sandy Clay Loam 35 24.4 High 0.2 – 0.3 8.7 2.33 Medium Clay 39 46.9 Medium 0.3 – 0.4 8.8 2.86 Heavy Clay 39 59.9 Low 0.4 – 0.5 8.7 3.26 Heavy Clay 40 62.1 Low 0.5 – 0.6 8.8 2.56 Heavy Clay 41 62.1 Low
Profile 6 0 – 0.1 8.0 1.33 Clay Loam 31 3.1 High
0.1 – 0.2 8.4 0.54 Light Clay 37 6.4 Medium 0.2 – 0.3 9.0 0.76 Medium Clay 33 19.0 High 0.3 – 0.4 9.3 0.91 Heavy Clay 29 33.9 High 0.4 – 0.5 9.4 0.88 Heavy Clay 30 45.8 High 0.5 – 0.6 9.4 1.09 Heavy Clay 36 53.4 High 0.6 – 0.7 9.5 1.01 Heavy Clay 27 57.7 High
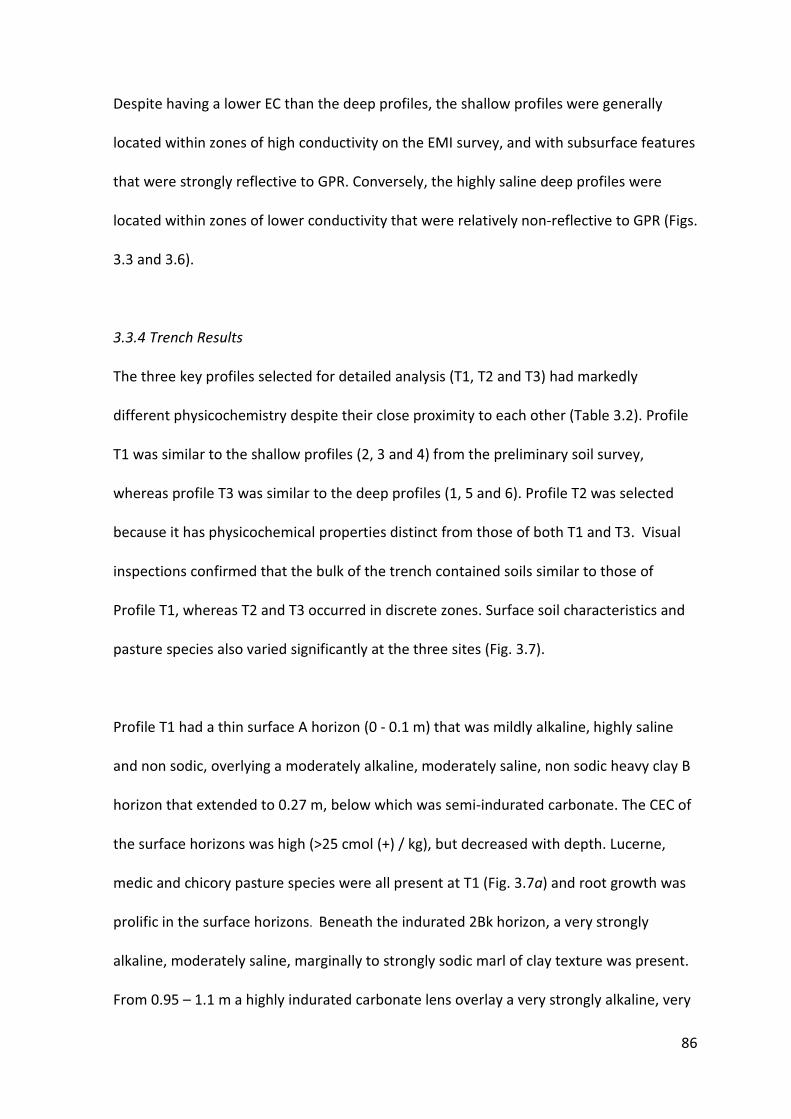
86
Despite having a lower EC than the deep profiles, the shallow profiles were generally
located within zones of high conductivity on the EMI survey, and with subsurface features
that were strongly reflective to GPR. Conversely, the highly saline deep profiles were
located within zones of lower conductivity that were relatively non-reflective to GPR (Figs.
3.3 and 3.6).
3.3.4 Trench Results
The three key profiles selected for detailed analysis (T1, T2 and T3) had markedly
different physicochemistry despite their close proximity to each other (Table 3.2). Profile
T1 was similar to the shallow profiles (2, 3 and 4) from the preliminary soil survey,
whereas profile T3 was similar to the deep profiles (1, 5 and 6). Profile T2 was selected
because it has physicochemical properties distinct from those of both T1 and T3. Visual
inspections confirmed that the bulk of the trench contained soils similar to those of
Profile T1, whereas T2 and T3 occurred in discrete zones. Surface soil characteristics and
pasture species also varied significantly at the three sites (Fig. 3.7).
Profile T1 had a thin surface A horizon (0 - 0.1 m) that was mildly alkaline, highly saline
and non sodic, overlying a moderately alkaline, moderately saline, non sodic heavy clay B
horizon that extended to 0.27 m, below which was semi-indurated carbonate. The CEC of
the surface horizons was high (>25 cmol (+) / kg), but decreased with depth. Lucerne,
medic and chicory pasture species were all present at T1 (Fig. 3.7a) and root growth was
prolific in the surface horizons. Beneath the indurated 2Bk horizon, a very strongly
alkaline, moderately saline, marginally to strongly sodic marl of clay texture was present.
From 0.95 – 1.1 m a highly indurated carbonate lens overlay a very strongly alkaline, very
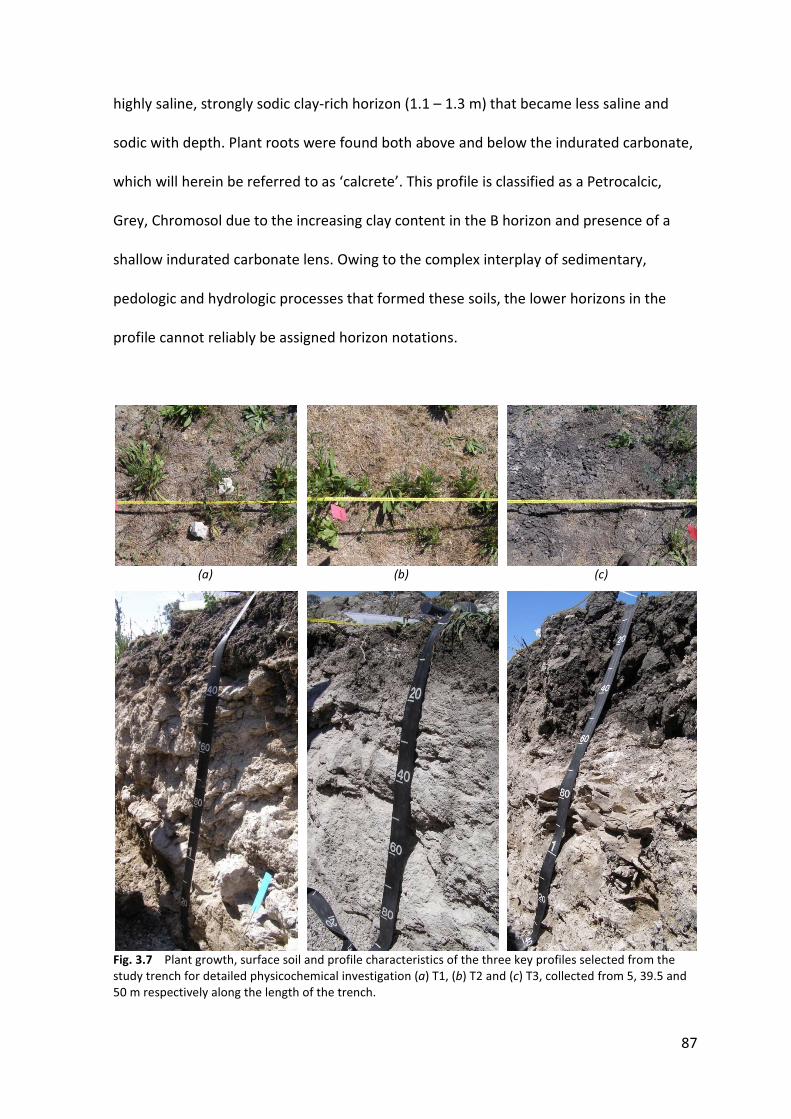
87
highly saline, strongly sodic clay-rich horizon (1.1 – 1.3 m) that became less saline and
sodic with depth. Plant roots were found both above and below the indurated carbonate,
which will herein be referred to as ‘calcrete’. This profile is classified as a Petrocalcic,
Grey, Chromosol due to the increasing clay content in the B horizon and presence of a
shallow indurated carbonate lens. Owing to the complex interplay of sedimentary,
pedologic and hydrologic processes that formed these soils, the lower horizons in the
profile cannot reliably be assigned horizon notations.
(a) (b) (c)
Fig. 3.7 Plant growth, surface soil and profile characteristics of the three key profiles selected from the study trench for detailed physicochemical investigation (a) T1, (b) T2 and (c) T3, collected from 5, 39.5 and 50 m respectively along the length of the trench.

88
Profile T2 was highly calcareous throughout, and although the pH steadily increased with
depth (becoming very strongly alkaline), it did not exhibit the shallow indurated features
of T1; it is classified as an Epihypersodic, Petrocalcic, Hypercalcic, Calcarosol. Plant growth
at this site was not as prolific as in T1, and medic was absent (Fig. 3.7b). The carbonate in
this profile was soft and friable, and although the clay content was relatively low, the soil
was highly saline and strongly sodic in the section 0.2 – 0.8 m. In the zone 0.8 – 0.87 m a
calcrete horizon was present, beneath which lay a very strongly alkaline, highly saline,
strongly sodic clay-rich lens that was 0.03 m thick. The full extent of this calcrete horizon
is not known as the profile was not excavated below 0.9 m where the indurated calcrete
was again present.
Table 3.2 Chemistry of three distinct profiles representative of soil types in the study trench Soil
Depth (m)
Horizon pH1:5 (H2O)
EC1:5
(dSm-1) Cl-
(mg/kg) Organic
C (%)
Carbonate (CaCO3 %)
Sand Clay (%) (%)
(CO3 free)
CEC (NH4)
cmol (+) / kg
ESP (%)
Profile T1 0.0 – 0.1 A 7.7 0.57 20.0 2.6 2.6 40.8 32.1 27.3 1.2 0.1 – 0.27 B 8.4 0.39 26.0 0.8 8.0 3.5 93.2 37.1 1.7 0.27 – 0.4 2Bk - - Indurated Carbonate - - 0.8 74.0 40.4 55.9 11.3 4.7 0.4 – 0.65 - 9.2 0.27 19.2 0.4 65.1 12.6 83.4 17.0 7.9 0.65 – 0.95 - 9.4 0.36 27.9 0.3 70.6 7.2 87.7 14.9 19.1 0.95 – 1.1 - - - - - - - - - Calcrete - - - - - - 0.3 66.1 9.7 83.0 15.9 34.7 1.1 – 1.3 - 9.5 1.23 1086.6 0.2 22.1 10.3 87.3 30.5 38.2 1.3 – 1.5 - 9.4 0.8 734.3 0.2 86.8 22.1 70.6 16.6 28.2
Profile T2 0.0 – 0.1 A 8.38 0.34 18.6 1.8 21.5 20.8 68.6 36 2.4 0.1 – 0.2 Bk 8.9 0.41 27.6 0.5 73.2 10.3 81.1 13 7.6 0.2 – 0.5 Bk 9.5 0.42 42.5 0.3 82.7 11.1 86.1 11 20.5 0.5 – 0.8 Bk 9.5 0.45 46.7 0.2 74.9 12.4 83.9 10 31.1 0.8 – 0.87 - - - - - - - - - Calcrete - - - - - - 0.2 84.7 33.8 55.5 8 38.5 0.87 – 0.9 - 9.4 0.70 72.6 0.3 17.0 24.6 61.2 27 33.1
Profile T3 0.0 – 0.1 A 8.9 1.01 349.5 1.7 21.3 16.5 45.0 36 18.8 0.1 – 0.3 B 9.5 2.22 650.7 0.7 31.5 4.3 74.9 38 41.3 0.3 – 0.5 B 9.8 2.18 843.0 0.8 34.4 3.7 77.0 30 55.9 0.5 – 0.7 Bk 9.6 1.36 609.2 0.4 61.8 9.8 76.6 14 52.0 0.7 – 1.0 - - - - - - - - - Calcrete - - - - - - 0.3 81.0 39.4 51.3 4 44.5 1.0 – 1.4 - 9.7 0.48 154.5 0.2 79.9 47.8 45.1 8 39.3
89
In contrast to profiles T1 and T2, profile T3 was deep (0.7 m) and mostly black (dry colour
5Y 2.5/1) clay-rich, very strongly alkaline, extremely saline and strongly sodic, below
which was calcrete and is classified as an Episodic, Epipedal, Black, Vertosol. Whereas the
chloride content was high throughout T3 (>300 - >800 mg/kg), corresponding to the
extremely high salinity, in the 1.1 -1.3 m horizon of T1, the chloride content was >1000
mg/kg. This chloride value is much greater than those of profile T3, despite the EC being
lower in T1. Some of the EC response in T3 may therefore be attributed to the presence
of pedogenic sodium carbonate and bicarbonate, given the high pH also observed here.
The CEC was also high in these upper horizons, exceeding 30 cmol (+) / kg to 0.5 m depth.
Pedological characteristics of this profile were also significantly different to those
observed in T1 and T2. The upper 0.5 m of soil was dominated by massive peds of
columnar shape (Fig. 3.7c). Distinct vertical cracks were present and slickensides were
evident, with smooth faces ranging in size from a few to tens of centimetres. These
features are consistent with those associated with Vertosols (Isbell 2002) or Vertisols (Soil
Survey Staff 1975). Beneath the calcrete the EC decreased from 1.36 to 0.48 dSm-1 (highly
saline), and appears to be a unique feature in this landscape. The CEC was also lower in
the deeper horizons than that of the horizons above the calcrete, yet they remained
strongly sodic. Pasture growth at T3 was sparse and only chicory was present (Fig. 3.7c).
The surface soil was well aggregated and salt efflorescence was evident, characteristics
not observe in profiles T1 and T2.
3.4 DISCUSSION
The primary aim of this study was to investigate the spatial variability of soil
physicochemical properties in the study area and potentially to identify its cause and
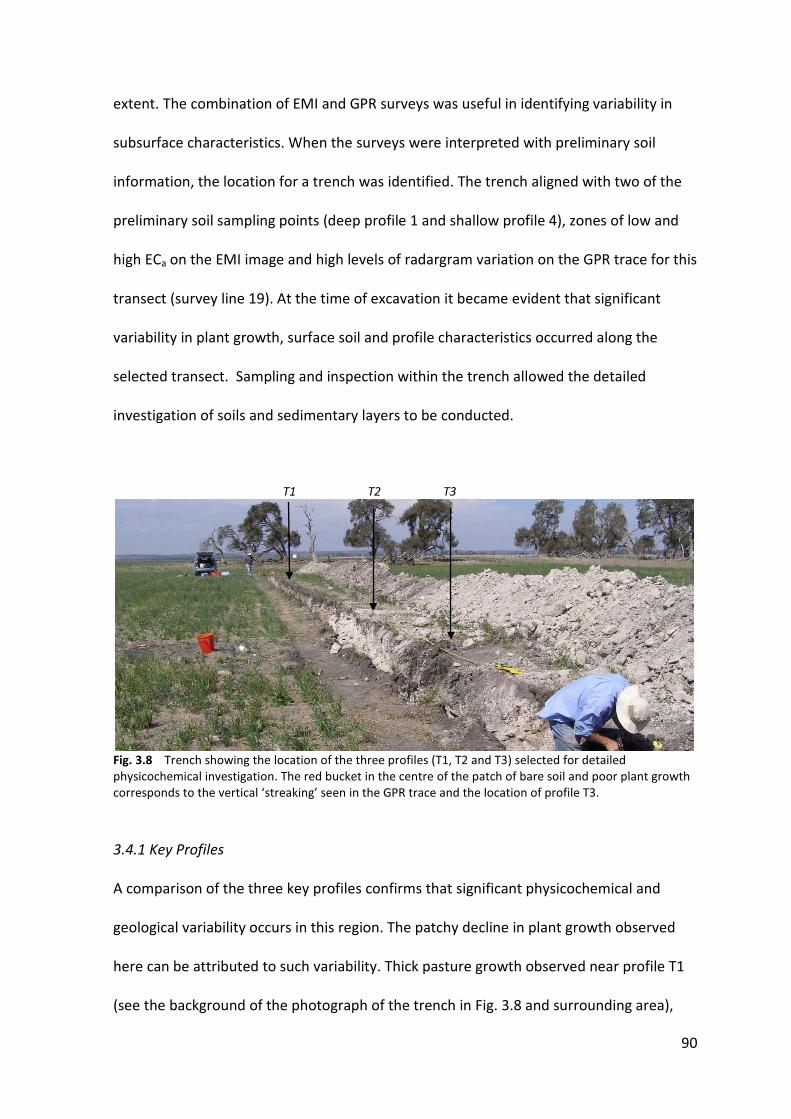
90
extent. The combination of EMI and GPR surveys was useful in identifying variability in
subsurface characteristics. When the surveys were interpreted with preliminary soil
information, the location for a trench was identified. The trench aligned with two of the
preliminary soil sampling points (deep profile 1 and shallow profile 4), zones of low and
high ECa on the EMI image and high levels of radargram variation on the GPR trace for this
transect (survey line 19). At the time of excavation it became evident that significant
variability in plant growth, surface soil and profile characteristics occurred along the
selected transect. Sampling and inspection within the trench allowed the detailed
investigation of soils and sedimentary layers to be conducted.
T1 T2 T3
Fig. 3.8 Trench showing the location of the three profiles (T1, T2 and T3) selected for detailed physicochemical investigation. The red bucket in the centre of the patch of bare soil and poor plant growth corresponds to the vertical ‘streaking’ seen in the GPR trace and the location of profile T3.
3.4.1 Key Profiles
A comparison of the three key profiles confirms that significant physicochemical and
geological variability occurs in this region. The patchy decline in plant growth observed
here can be attributed to such variability. Thick pasture growth observed near profile T1
(see the background of the photograph of the trench in Fig. 3.8 and surrounding area),
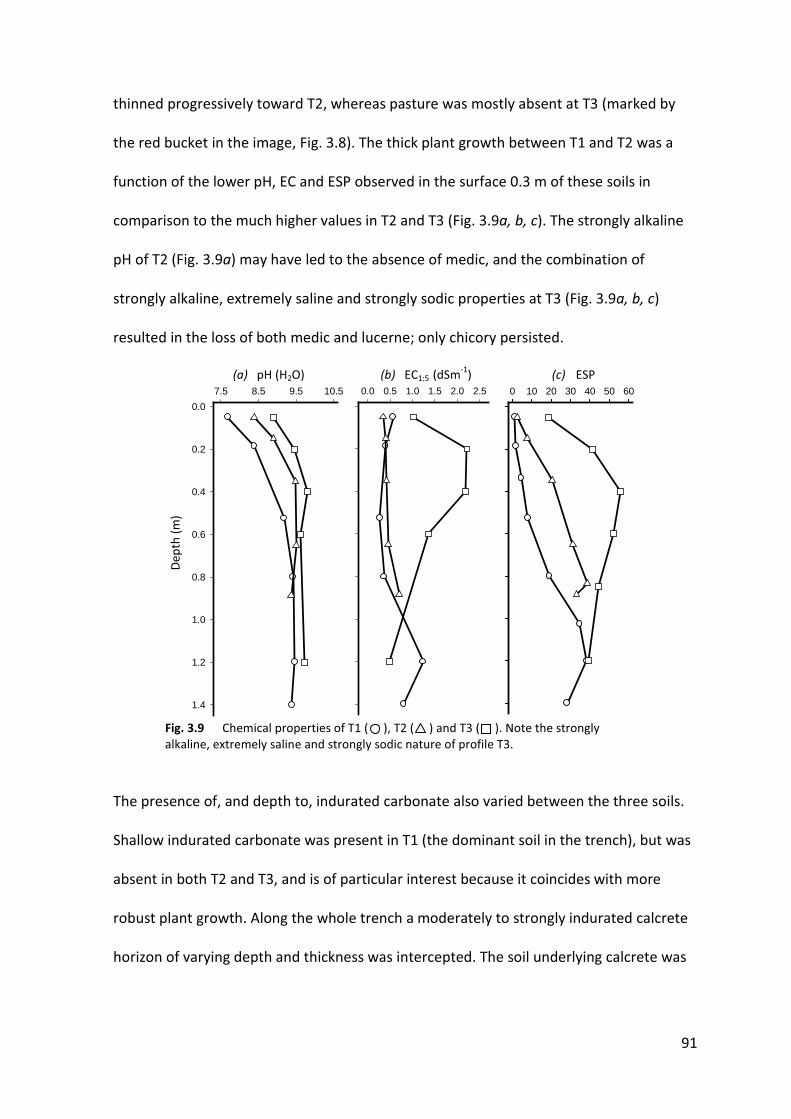
91
thinned progressively toward T2, whereas pasture was mostly absent at T3 (marked by
the red bucket in the image, Fig. 3.8). The thick plant growth between T1 and T2 was a
function of the lower pH, EC and ESP observed in the surface 0.3 m of these soils in
comparison to the much higher values in T2 and T3 (Fig. 3.9a, b, c). The strongly alkaline
pH of T2 (Fig. 3.9a) may have led to the absence of medic, and the combination of
strongly alkaline, extremely saline and strongly sodic properties at T3 (Fig. 3.9a, b, c)
resulted in the loss of both medic and lucerne; only chicory persisted.
Dep
th (m
)
(a) pH (H2O) (b) EC1:5 (dSm-1) (c) ESP
Fig. 3.9 Chemical properties of T1 ( ), T2 ( ) and T3 ( ). Note the strongly alkaline, extremely saline and strongly sodic nature of profile T3.
The presence of, and depth to, indurated carbonate also varied between the three soils.
Shallow indurated carbonate was present in T1 (the dominant soil in the trench), but was
absent in both T2 and T3, and is of particular interest because it coincides with more
robust plant growth. Along the whole trench a moderately to strongly indurated calcrete
horizon of varying depth and thickness was intercepted. The soil underlying calcrete was
7.5 8.5 9.5 10.50.0
0.2
0.4
0.6
0.8
1.0
1.2
1.4
0.0 0.5 1.0 1.5 2.0 2.5 0 10 20 30 40 50 60
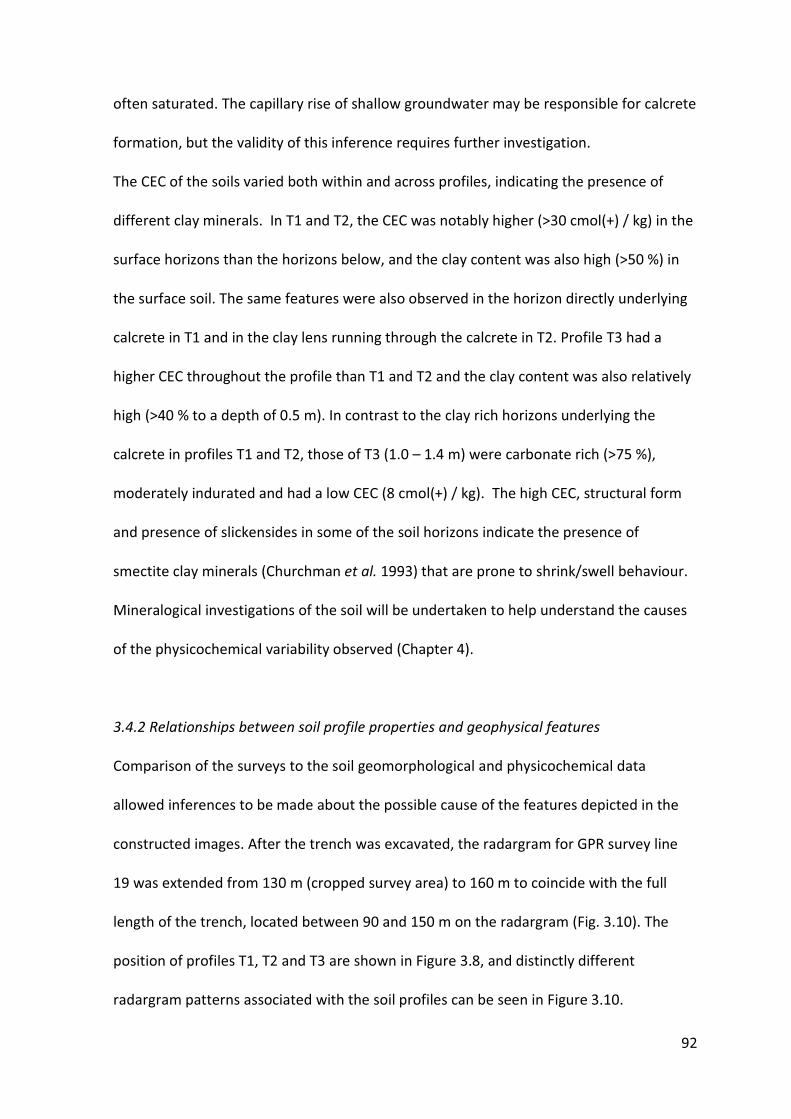
92
often saturated. The capillary rise of shallow groundwater may be responsible for calcrete
formation, but the validity of this inference requires further investigation.
The CEC of the soils varied both within and across profiles, indicating the presence of
different clay minerals. In T1 and T2, the CEC was notably higher (>30 cmol(+) / kg) in the
surface horizons than the horizons below, and the clay content was also high (>50 %) in
the surface soil. The same features were also observed in the horizon directly underlying
calcrete in T1 and in the clay lens running through the calcrete in T2. Profile T3 had a
higher CEC throughout the profile than T1 and T2 and the clay content was also relatively
high (>40 % to a depth of 0.5 m). In contrast to the clay rich horizons underlying the
calcrete in profiles T1 and T2, those of T3 (1.0 – 1.4 m) were carbonate rich (>75 %),
moderately indurated and had a low CEC (8 cmol(+) / kg). The high CEC, structural form
and presence of slickensides in some of the soil horizons indicate the presence of
smectite clay minerals (Churchman et al. 1993) that are prone to shrink/swell behaviour.
Mineralogical investigations of the soil will be undertaken to help understand the causes
of the physicochemical variability observed (Chapter 4).
3.4.2 Relationships between soil profile properties and geophysical features
Comparison of the surveys to the soil geomorphological and physicochemical data
allowed inferences to be made about the possible cause of the features depicted in the
constructed images. After the trench was excavated, the radargram for GPR survey line
19 was extended from 130 m (cropped survey area) to 160 m to coincide with the full
length of the trench, located between 90 and 150 m on the radargram (Fig. 3.10). The
position of profiles T1, T2 and T3 are shown in Figure 3.8, and distinctly different
radargram patterns associated with the soil profiles can be seen in Figure 3.10.
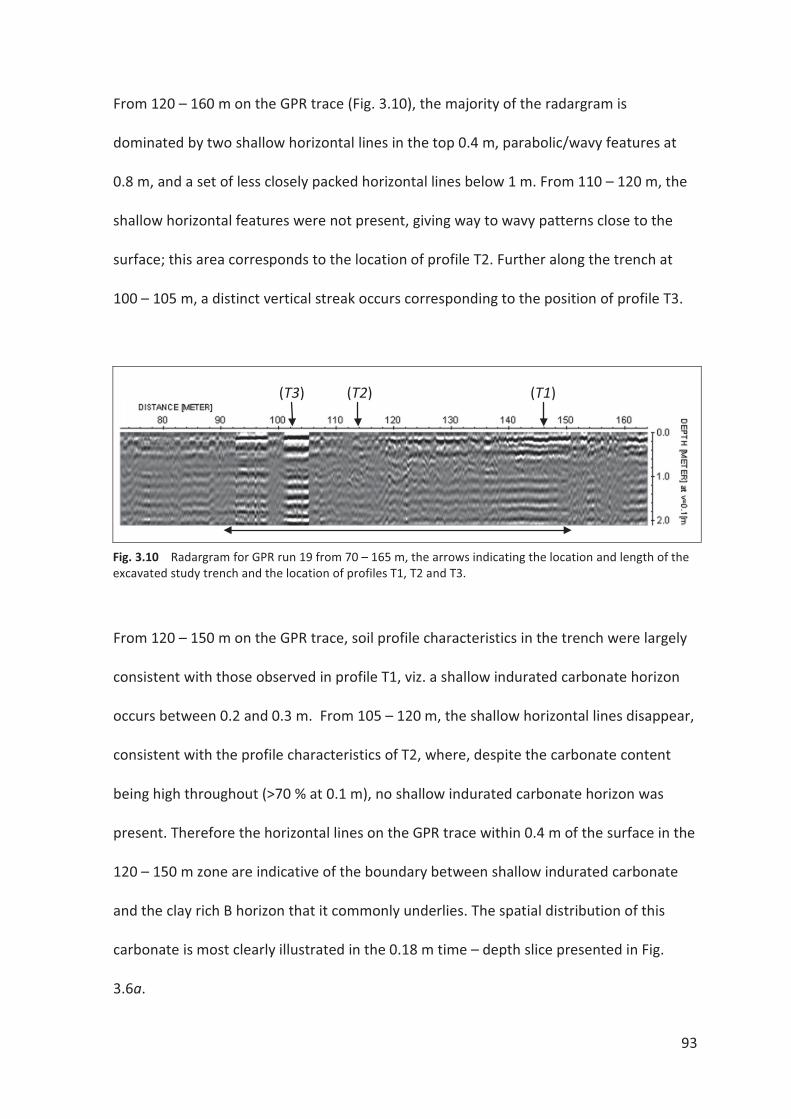
93
From 120 – 160 m on the GPR trace (Fig. 3.10), the majority of the radargram is
dominated by two shallow horizontal lines in the top 0.4 m, parabolic/wavy features at
0.8 m, and a set of less closely packed horizontal lines below 1 m. From 110 – 120 m, the
shallow horizontal features were not present, giving way to wavy patterns close to the
surface; this area corresponds to the location of profile T2. Further along the trench at
100 – 105 m, a distinct vertical streak occurs corresponding to the position of profile T3.
Fig. 3.10 Radargram for GPR run 19 from 70 – 165 m, the arrows indicating the location and length of the excavated study trench and the location of profiles T1, T2 and T3.
From 120 – 150 m on the GPR trace, soil profile characteristics in the trench were largely
consistent with those observed in profile T1, viz. a shallow indurated carbonate horizon
occurs between 0.2 and 0.3 m. From 105 – 120 m, the shallow horizontal lines disappear,
consistent with the profile characteristics of T2, where, despite the carbonate content
being high throughout (>70 % at 0.1 m), no shallow indurated carbonate horizon was
present. Therefore the horizontal lines on the GPR trace within 0.4 m of the surface in the
120 – 150 m zone are indicative of the boundary between shallow indurated carbonate
and the clay rich B horizon that it commonly underlies. The spatial distribution of this
carbonate is most clearly illustrated in the 0.18 m time – depth slice presented in Fig.
3.6a.
(T1) (T2) (T3)

94
The parabolic/wavy features located between 0.6 - 0.8 m depth across the length of the
radargram corresponds to the position of the highly indurated calcrete horizon that was
found in every sampled profile. The spatial distribution of calcrete can therefore best be
seen in the 0.78 m GPR time-depth slice (Fig. 3.6b).
Beneath the indurated calcrete, a clay-rich saline horizon was commonly intercepted and
the depth to groundwater in a local observation well (MNC032) at the time of sampling
was recorded at 1.18 m (Department of Water Land and Biodiversity Conservation 2009).
The less closely packed horizontal lines observed below 1 m across the full extent of the
radargram have therefore been related to the presence of a groundwater capillary fringe.
Doolittle et al. (2006) explain that as the width of the capillary fringe increases, GPR
reflections from groundwater have increasingly lower amplitudes, more dispersed
characteristics, and are therefore less distinguishable on GPR radargrams. This is reflected
in the presence of the less closely packed features on the GPR trace below 1m. The
patterning associated with the capillary fringe and depth to groundwater can be seen in
Fig. 3.5 between 1.18 and 1.98 m.
The distinct vertical streaking that occurs in survey line 19 at 105 m corresponds to the
presence of deep, clay-rich, highly saline and strongly sodic Vertosols, such as those
found in profile T3. The combination of these properties results in the soil being highly
electromagnetically conductive, and hence non reflective to GPR, and a ‘conductivity
shadow’ (Fig. 3.10 T3) results through the vertical extent of the radargram. A profile was
also sampled between 90 and 100 m that exhibited the same physicochemical

95
characteristics as T3 (Appendix 3, profile number 113; 113.1 – 113.4), corresponding to
the second vertical streak present on the radargram.
3.4.3 Relationship between EMI and GPR patterns
In addition to the relationships between the soil physicochemical properties and the GPR
images, there are also relationships between the GPR and EMI surveys. EMI images for
the four collection frequencies indicate that ECa increased with depth in most zones.
When these images were compared with GPR time-depth slices, there was a correlation
in the patterns between ECa at all frequencies, and GPR features at 0.68 – 0.98 m. In Fig.
3.11, the 46 kHz EMI image was converted to grey scale and overlaid with a transparent
image of the GPR time-depth slice from 0.78 m.
Visual observations of these patterns suggest that there are areas of low ECa that are
highly reflective to GPR (Fig. 3.11 A) and areas of high ECa with low GPR reflectance (Fig.
3.11 B). The GPR patterning observed in the time-depth slice for 0.78 m was related to
the presence of a highly indurated calcrete lens; however field observations showed that
its thickness and uniformity varied. In profile T1, calcrete occurs at 0.95 m and was only
0.15 m in thickness (Fig. 3.7a). A clay-rich horizon was found below the calcrete that was
saturated and highly saline and many roots were present both above and below the
calcrete. Similar observations were made 19.5 m along the trench, where a calcrete
horizon in the zone 1.0 – 1.25 m was again underlain by a saturated clay horizon. Such
observations lead to the conclusion that the calcrete found in this zone does not form an
impenetrable barrier to water movement and root exploration.
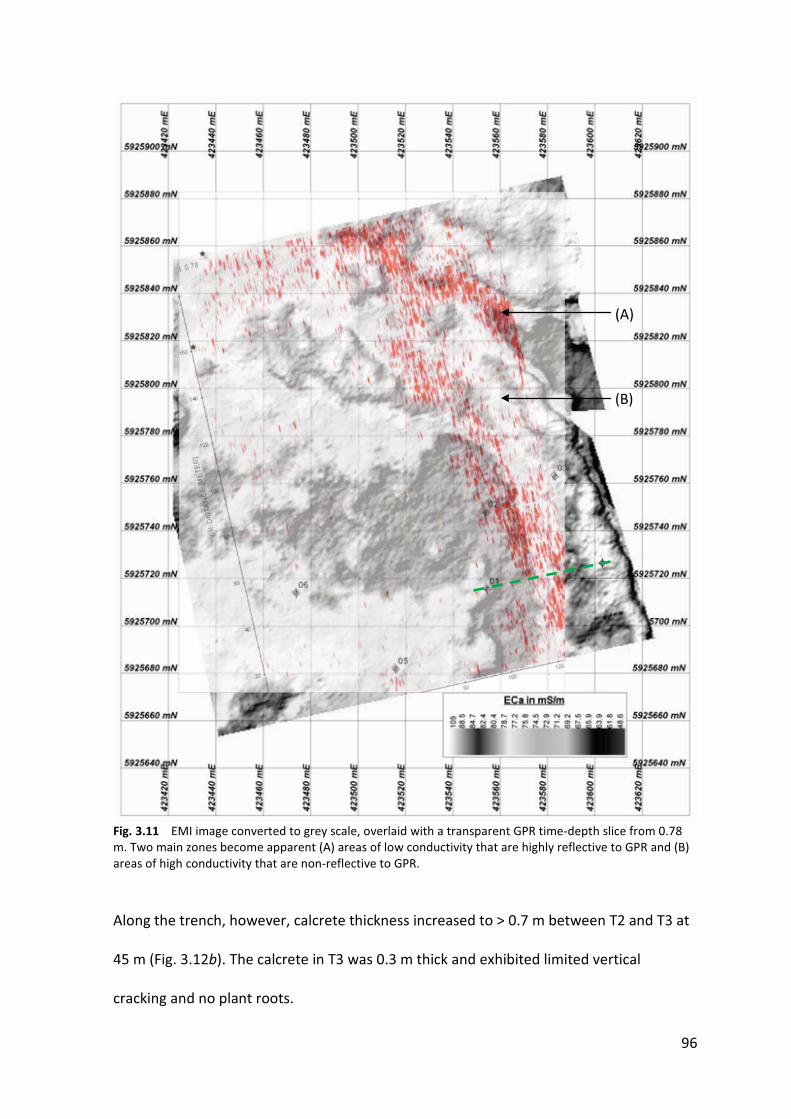
96
Fig. 3.11 EMI image converted to grey scale, overlaid with a transparent GPR time-depth slice from 0.78 m. Two main zones become apparent (A) areas of low conductivity that are highly reflective to GPR and (B) areas of high conductivity that are non-reflective to GPR.
Along the trench, however, calcrete thickness increased to > 0.7 m between T2 and T3 at
45 m (Fig. 3.12b). The calcrete in T3 was 0.3 m thick and exhibited limited vertical
cracking and no plant roots.
(A)
(B)

97
(a) (b)
Fig. 3.12 Photographs of sampled profiles from (a) 19.5 and (b) 45 m in the study trench. The profile in image a is similar to that seen in T1, exhibiting shallow indurated carbonate (A) and a deeper thin calcrete lens (B), underlain by a saturated clay rich horizon. In image b, no shallow indurated horizon is present but a 0.7 m thick calcrete is found (C).
From these visual associations, we further conclude that the GPR patterning in the 0.78 m
time - depth slice is related to thick accumulations of calcrete not conducive to capillary
rise and water accumulation, leading to the low ECa and high GPR reflectance observed
(Fig. 3.11 B). The highly conductive zones that fringe this area of high reflectance are
therefore attributed to either subsoil moisture (the groundwater capillary fringe) and/or
saline clay-rich horizons that were found below the fractured, thin accumulations of
calcrete (Fig. 3.12a).
B
C
A
98
3.5 CONCLUSION
The primary aim of this paper was to investigate the variability of soil physicochemical
properties in the study area and to potentially identify its cause and extent.
The EMI survey revealed discrete conductivity zones that are most likely linked to the
depth of the groundwater capillary fringe and the presence of clay-rich horizons
positioned below calcrete. Isolated patches of deep, clay rich, extremely saline and
strongly sodic Vertosols occurred sporadically, and were identifiable by distinct vertical
streaks that extended through the GPR radargrams. The GPR survey identified the
presence of an indurated carbonate horizon typically located between 0.18 and 0.38 m in
the profile. Thick accumulations of calcrete were also detected by GPR. Good pasture
growth was consistently observed in the Chromosols that have clay-rich, high CEC surface
horizons overlying shallow indurated carbonate from 0.2 m. Extreme pH, EC and ESP
values were recorded in the Vertosols and have a profound effect on plant growth.
Transitions between these two soil types were also observed (Calcarosols). Further
investigations of the chemistry and form of the indurated carbonate horizons and the
mineralogy of the soils in these key profiles is required to adequately determine the cause
of such variability in the landscape.
99
3.6 REFERENCE LIST
Blackburn G (1952). The Soils of the Kingston-Avenue Drainage Area, South Australia. CSIRO Division of Soils, Melbourne. Churchman GJ, Skemstad JO, Oades JM (1993). Influence of Clay Minerals and Organic Matter on Effects of Sodicity on Soils. Australian Journal of Soil Research 31, 779 - 800. Department of Water Land and Biodiversity Conservation. (2009). 'Obswell'. Department of Water, Land and Biodiversity Conservation. From https://obswell.pir.sa.gov.au/new/obsWell/MainMenu/menu. Accessed 05/04/2009. Doolittle JA, Jenkinson B, Hopkins D, Ulmer M, Tuttle W (2006). Hydropedological investigations with ground-penetrating radar (GPR): Estimating water-table depths and local ground-water flow pattern in areas of coarse-textured soils. Geoderma 131, 317-329. Ecophyte Technologies Pty Ltd (2007). Final Report on Pilot Geophysical Trials for Soil and Near-surface Degradation pattern Targets, Shepherds Hill, Southeast region of South Australia. Huntley DJ, Hutton JT, Prescott JR (1993). The stranded beach-dune sequence of south-east South Australia: A test of thermoluminescence dating, 0-800 ka. Quaternary Science Reviews 12, 1-20. Isbell RF (2002). 'The Australian soil classification'. CSIRO Publishing: Collingwood, VIC. James IT, Waine TW, Bradley RI, Taylor JC, Godwin RJ (2003). Determination of Soil Type Boundaries using Electromagnetic Induction Scanning Techniques. Biosystems Engineering 86, 421-430. Kelly J, Rengasamy P (2006). Diagnosis and Management of Soil Constraints: Transient Salinity, Sodicity and Alkalinity. The University of Adelaide, Adelaide. McDonald RC, Isbell RF (1990). 'Australian Soil and Land Survey Field Handbook'. Inkata Press: Melbourne. McKenzie NJ, Coughlan KJ, Cresswell HP (2002). 'Soil physical measurements and interpretation for land evaluation'. CSIRO Publishing: Collingwood, VIC. Northcote KH, Skene JKM (1972). 'Australian soils with saline and sodic properties'. CSIRO: Melbourne. Rayment G, Higginson F (1992). 'Australian Laboratory Handbook of Soil and Water Chemical Methods'. Inkata Press: Melbourne.
100
Shaw R (1999). Soil salinity - electrical conductivity and chloride. In 'Soil Analyses an Interpretation Manual'. Eds K I Peverill, L Sparrow and D J Reuter. 129 - 145. CSIRO: Collingwood, VIC. Sherrod LA, Dunn G, Peterson GA, Kolberg RL (2002). Inorganic Carbon Analysis by Modified Pressure-Calcimeter Method. Soil Science Society of America Journal 66, 299-305. Slattery WJ, Conyers MK, Aitken RL (1999). Soil pH, aluminium, manganese and lime requirement. In 'Soil Analyses an Interpretation Manual'. Eds K I Peverill, L Sparrow and D J Reuter. 103 - 128. CSIRO: Collingwood, VIC. Soil Survey Staff (1975). 'Soil taxonomy : a basic system of soil classification for making and interpreting soil surveys'. U.S. Dept. of Agriculture Soil Conservation Service : for sale by the Supt. of Docs. U.S. Govt. Print. Off: [Washington]. South East Catchment Water Management Board (2003). South East Catchment Water Management Plan 2003 - 2008. South East Catchment Water Management Board, Mount Gambier. Sudduth KA, Drummond ST, Kitchen NR (2001). Accuracy issues in electromagnetic induction sensing of soil electrical conductivity for precision agriculture. Computers and Electronics in Agriculture 31, 239-264.

101
CHAPTER 4
GENESIS AND DISTRIBUTION OF CLAY MINERALS AND CARBONATES IN LACUSTRINE
AND PALUSTRINE SEDIMENTS OF UPPER SOUTH EAST SA
4.1 INTRODUCTION
Recent investigations in South Australia’s Upper South East region found that there was a
range of soil physicochemical constraints across different soil types. A study was
instigated as a result of localised patches of declining plant growth being observed by
farmers on the Avenue Plain; results confirmed that some soil types were highly saline,
sodic and alkaline, creating hostile conditions for plant growth (Chapter 2 of this thesis).
Multiple carbonate-rich horizons, both unconsolidated and indurated, were present
within the top 2 m of the soil profile. Soils that supported good pasture growth typically
had shallow grey surface soils that were not strongly saline or sodic, overlying an
indurated carbonate horizon within 0.3 m of the surface. In contrast, the soils that
expressed poor pasture growth were deep (> 0.6 m), black, clay rich and strongly alkaline,
saline and sodic; the shallow indurated carbonate horizon was absent in these soil types
(Chapter 3 of this thesis). In addition, another study found that a diverse range of clay
minerals were present in these soils, including kaolinite, sepiolite, illite and smectite; the
clay mineralogy also appeared to affect plant growth and proliferation when the soils
were sodic (Chapter 2). These results and observations have raised the question of how
these soils, and their contrasting chemical, mineralogical and morphological properties,
formed in this landscape, given that these properties clearly affect plant growth.
102
4.1.1 Study setting
The study is located on the Avenue Plain in the Upper South East (USE) of South Australia
(SA), in an area locally referred to as the Keilira district, which is situated between the
East and West Avenue ranges (36.71°S 140.16°E). These ranges are two of thirteen
prominent coastal barriers that feature on the Coorong to Mount Gambier Coastal Plain
in SA’s South East. Part of the Bridgewater Formation (Firman 1973), these Pleistocene
barriers (dune ranges), are the product of shoreline sedimentation during successive
interglacial maxima and various interstadials. Preservation of the original morphology of
these landforms is the result of the interplay of the gradual uplift of the coastal plain,
successive sea-level transgressions and regressions, and rapid calcrete genesis. The
spatial separation of the ranges has been brought about by steady, epeirogenic uplift in
response to Quaternary volcanism (Murray-Wallace et al. 1999).
Whereas much is known about the age, origin and morphology of these barriers
(Schwebel 1983; Murray-Wallace et al. 1999; Huntley and Prescott 2001), little work has
been conducted on the inter-dunal plains that separate the relic dunes. As part of the
Coonambidgal Formation (Firman 1973), the Avenue Plain is one such area. Composed of
both indurated and unconsolidated calcareous materials (continental carbonates) of
predominantly lacustrine origin (Schwebel 1983), these sediments appear to have been
deposited initially as part of a regressive sequence at the stabilised interglacial sea level,
and then continued to accumulate in areas of outcropping watertable as the sea level
retreated (Schwebel 1983). Any consideration of the origins of the soils in this region
would therefore need to include investigations of the carbonates found here to

103
determine the effect that the lacustrine sediments have had on mineral genesis and soil
profile development.
Fig. 4.1 Map showing the position (a) and predicted ages (b) of the relic coastal barriers in South East South Australia, from Huntley and Prescott (2001). The denotes the location of the Keilira District on the Avenue Plain.
(a)
(b)

104
4.1.2 Types of continental carbonates and their identification
The types of minerals that accumulate in lacustrine sediments are affected by the source
area, the salinity of the waters and hydrology of the lake basin (including output and
input of surface water, rainfall and groundwater) and include primary precipitates,
detrital and clastic materials and minerals formed through early – later diagenetic
processes (Gierlowski-Kordesch 2010). Carbonates are a common precipitate found in
lacustrine sediments, deposited mostly in the form of mud – sized material. They include
carbonates and bicarbonates of Ca, Mg, Ba, Mn, Fe, Na and Sr (and varying combinations
of these) to form minerals such as low Mg calcite, high Mg calcite, aragonite, magnesite,
dolomite, siderite, trona and ankerite, to name but a few (Gierlowski-Kordesch 2010).
Recent research into the formation of continental carbonates, however, shows that their
development in such sedimentary environments is affected by the interplay of many
complex processes (Alonso-Zarza 2003). Of the vast range of continental carbonates,
lacustrine and palustrine carbonates and calcretes are the common types formed in
hydrologically restricted depositional environments, such as the Avenue Plain. Lacustrine
carbonates are those deposited in saline and freshwater perennial lake systems of any
depth (subaqueous), whereas palustrine carbonates include those formed in ephemeral
lakes, including alluvial and fluvial systems, and on perennial lake margins. These
environments typically have very low gradients and low water energy and are prone to
the periodic exposure of the sediments (subaqueous to subaerial conditions) as the level
of the lake water fluctuates (Gierlowski-Kordesch 2010). The term ‘calcrete’ is used to
describe authigenic carbonate minerals that accumulate in the vadose and / or phreatic
zones of the soil profile (Alonso-Zarza and Wright 2010b). A transition between these

105
carbonates can also occur in any given landscape, as described in detail by Alonso-Zarza
(2003) and shown in Figure 4.2.
Due to their depositional conditions and subsequent alteration, each of these types of
continental carbonates exhibit characteristic facies (morphological characteristics).
Petrographic examination of the facies and microfabrics therefore provide an indication
of their origin and the environmental conditions under which they formed. Lacustrine
carbonates commonly have a muddy texture and if lithified are referred to as mudstone,
micrite or calcilutite; they generally contain > 80 % carbonate by weight (Gierlowski-
Kordesch 2010). Marl and chalk are other carbonates that can form in lacustrine settings,
containing between 20 – 80 % w/w and > 60 % w/w of carbonate respectively. Common
petrographic features of lacustrine carbonates include the presence of charophytes
(green algae), ostracods (bivalved micro-crustaceans) and molluscs (bivalves and
gastropods) (Fig. 4.2). Palustrine carbonates, which form from lacustrine mud, exhibit
signs of diagenesis and a loss of their primary muddy texture. Their diagenetic
modification is driven by desiccation processes, root and soil organism activity and the
remobilisation of carbonate and iron (Alonso-Zarza 2003). The common petrographic
features observed in palustrine carbonates include desiccation cracks, mottling, and
grains such as intraclasts, peloids and nodules (Fig. 4.2).
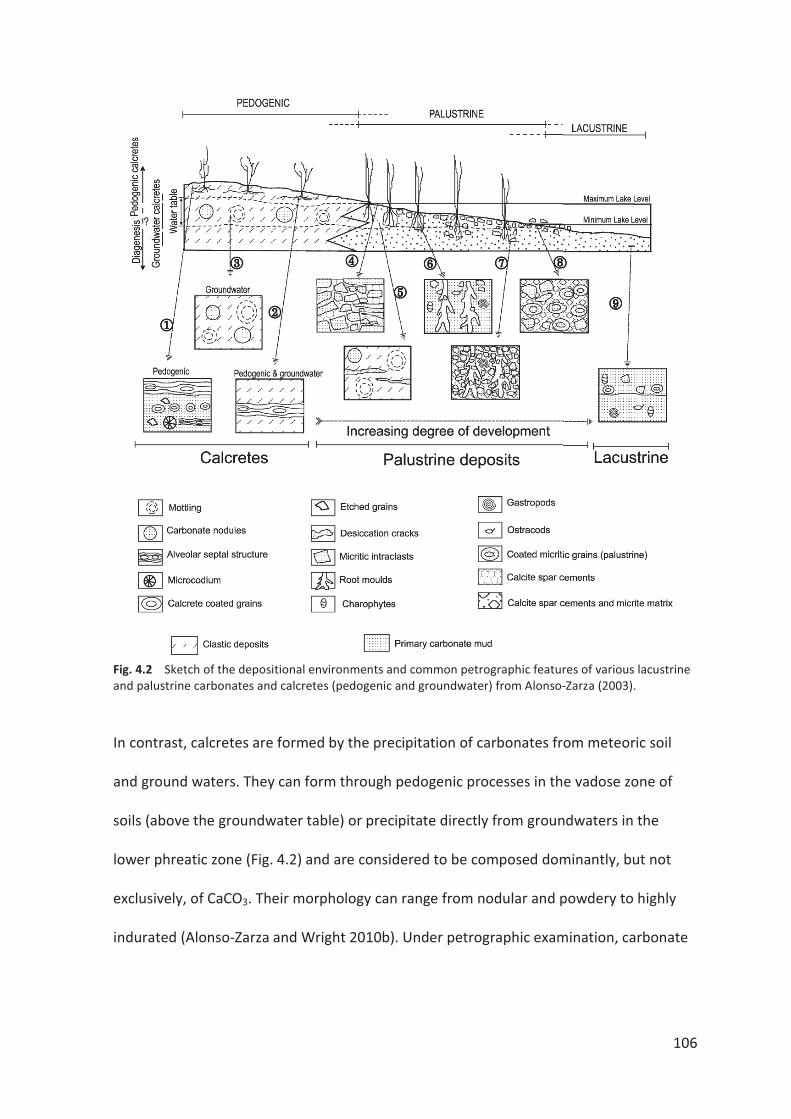
106
Fig. 4.2 Sketch of the depositional environments and common petrographic features of various lacustrine and palustrine carbonates and calcretes (pedogenic and groundwater) from Alonso-Zarza (2003).
In contrast, calcretes are formed by the precipitation of carbonates from meteoric soil
and ground waters. They can form through pedogenic processes in the vadose zone of
soils (above the groundwater table) or precipitate directly from groundwaters in the
lower phreatic zone (Fig. 4.2) and are considered to be composed dominantly, but not
exclusively, of CaCO3. Their morphology can range from nodular and powdery to highly
indurated (Alonso-Zarza and Wright 2010b). Under petrographic examination, carbonate

107
nodules, mottling, calcrete coated grains and alveolar-septal structures (by-products of
fungal activity), among others, may be observed (Fig. 4.2).
In addition to petrographic examination, oxygen and carbon stable isotope analyses are
useful tools that can be used to help determine the types and origin of continental
carbonates. As lacustrine, palustrine and calcrete carbonates precipitate from
continental (non marine) solutions, either through inorganic precipitation or through
biologically mediated processes (Deocampo 2010), they incorporate the isotopes of C, O
and Sr within them. Stable isotopes are discussed in terms of their ratios, and most
commonly the ratio of abundance of the second most common isotope, compared to the
most common isotope, e.g. 13C/12C or 18O/16O (Halverson 2008). Isotopic ratios are
typically expressed in Delta � ���� �������������������������� ������������������������� � ��
a geologically meaningful and internationally recognised standard and expressed in per
mil variations (‰). For terrestrial carbon and oxygen isotope analysis, the reference
material used is Vienna Pee Dee Belemnite (VPDB) from the USA. The concentration of 13C
������������������ ������� �� ������������������13C, whereby: �13C = (R/Rs – 1) *100),
where R = 13C/12C ratio in the sample, and Rs = 13C/12C ratio in the VPDB standard.
!�����������18O is the ratio of 18O/16O in the sample, compared to the 18O/16O ratio of the
VPDB standard (Halverson 2008).
Investigations of the composition and partitioning of stable isotopes can, in some
instances, provide valuable information about the environmental and climatic conditions
in which they were precipitated. Alonso-"��#���@@\����� ��������� �������� � �����18O)
values of lacustrine carbonates reflect the isotopic composition of the lake water in which
108
they formed, which in turn is affected by the isotopic composition of rainwater, potential
evaporation, the influence of groundwater flows and any changes in water sources. In
addition, Tanner (2010) reports that the oxygen isotope composition of pedogenic soil
carbonates (vadose calcretes) ���� ��� �����^�������18O of the water from which the
carbonate precipitates; which in turn reflects the mean annual temperature at the time of
formation, with the carbonates becoming increasingly enriched with 18O with higher
mean annual temperatures and evaporation rates.
Additionally�����^ ���� � �����13C) levels in lacustrine carbonates are affected by the
carbon isotope composition of the lake waters from which they precipitated. �13C values
in lake carbonates are largely controlled by biogenic factors, whereby high rates of
organic productivity cause a decrease in dissolved 12C in the lake water, leading to an
enrichment of 12C in the precipitated lacustrine carbonates. However, �13C values can also
be affected by the type of vegetation cover surrounding the body of water and this factor
is more important in palustrine carbonates and calcretes than in any other lacustrine
setting. If C3 plants (trees, most shrubs, cool season grasses) are dominant in the area, the
waters of the drainage basin will be enriched in 12C and this too will be reflected in the
precipitated carbonates (Alonso-Zarza 2003). Similarly, numerous factors control the
carbon isotope composition of calcretes, including the C3/C4 vegetation ratio, the depth of
carbonate accumulation, the temperature of carbonate precipitation, the isotopic
composition of atmospheric carbon, and soil C productivity, which is largely dependent on
the climatic regime (Tanner 2010). The isotope values of palustrine carbonates however
can be very complex to interpret as soil processes and early meteoric diagenesis (vadose
109
or phreatic) contribute to the modification of the primary isotope values (Alonso-Zarza
2003).
4.1.3 Previous studies of soils in the region
The bulk of the studies conducted on soils of south-east SA was performed between 1940
and 1970; a review of these findings can be found in Blackburn (1983). In an earlier
publication, Blackburn et al. (1965) reported that the most widespread soils of this region
were derived either mainly from calcareous beach sands, or from estuarine and lacustrine
deposits; the former including podzol and terra rossa soils and the latter including
ground-water rendzina and solodized solonetz soils. All of these soil types exhibit textural
contrasts between the A (sand and clay textures) and B (calcareous) horizons, and it was
observed that a hard, dense capping of calcium carbonate occurred at the interface; this
was considered to be a secondary accumulation (Blackburn et al. 1965). A study of terra
rossa and rendzina soils from the south-east of SA by Norrish and Rogers (1956)
concluded that both soil types were residual from the underlying calcareous parent
material, based on the assessment of their mineralogy, amount of iron present and
particle size distributions. This theory was contradicted in a study by Giles (1960) who
concluded that the trace element content of the acid insoluble part of the calcareous
material was high enough to ensure that it could not have been the parent material of the
A horizon. In addition, a recent study by Krull et al. (2006) concluded that the organic and
inorganic history of texture contrast Red brown earths from the south-east region
indicate that two distinct depositional and soil forming episodes were probably
responsible for their stark texture contrast. Previous mineralogical studies of the A
horizon of a rendzina found illite and kaolinite to be the dominant clay minerals with the

110
iron oxides, goethite and haematite, also present. Reference was also made to an
unidentified clay mineral, presumed to be a randomly interstratified mica, which the
authors termed ‘hydrated mica’, although they acknowledge that this term was not
strictly correct (Norrish and Rogers 1956); ‘very little’ was detected in contrast to ‘much’
illite and ‘moderate’ amounts of kaolinite. In the underlying limestone (calcareous B
horizon), much calcite was detected, along with moderate amounts of illite and very little
smectite and hydrated mica. These mineralogical findings somewhat concur with those
reported in Chapter 2 of this thesis viz. some soils were dominated with illite and
kaolinite, however, in other analyses in this thesis, smectite was the dominant clay
mineral detected, in addition to sepiolite in some soils.
From the foregoing discussion it is evident that further investigation is required due to
contradictory conclusions about the origin of soils and range of clay minerals reported
here, together with recent advancement in our understanding of the different types of
continental carbonates. The aim of this study therefore was to characterise the
morphological, mineralogical and geochemical properties of contrasting soil profiles that
are representative of some common types found in the Keilira District. The carbonates
present were investigated through the study of their petrography and stable isotope
geochemistry. Mineralogical and elemental investigations of the bulk soil and isolated
clay sized (<2 μm) fraction was achieved using X-ray diffraction, X-ray florescence and
transmission electron microscopy. These investigations aimed to determine the genesis
and mode of alteration of clay and carbonate minerals in this landscape and their
subsequent effect on plant growth.
111
4.2 METHODS
The physicochemical properties of three key profiles (T1, T2 and T3) from the study site
were determined and reported previously (Chapter 3 of this thesis), however, some data
are also presented here for context (Table 4.1). The methods used for their determination
are reported in Chapter 3.
Mineralogy was estimated by X-ray diffraction (XRD) on both powder bulk samples and
the oriented clay fraction (carbonate free). Air dried samples of soil and indurated
horizons were initially ground to <100 μm in a Seib mill. A portion of the bulk powder
sample was ground to a very fine powder in an agate mortar and pestle and back-pressed
into welled-ingot sample holders. The mineralogy of the <2 μm fraction was determined
following dispersion by ultrasonic probe and separation from the coarse fractions by
sedimentation (Gee and Bauder 1986). The removal of carbonates from this fraction was
achieved by the addition of acetic acid until all frothing ceased. 10 ml of 1 M calcium
chloride was subsequently added to the clay fraction and, following centrifugation, the
supernatant was decanted and the process repeated before washing with deionised H2O
and subsequently with ethanol. A 0.04g sample of the isolated calcium-saturated clay
fraction was subsequently dispersed in deionised H2O using an ultrasonic probe and
oriented onto a porous filter membrane using a vacuum pump, solvated with 3 drops of
glycerol and allowed to drain. XRD patterns from the whole powdered and oriented clay
fractions were collected with a PANalytical X’Pert Pro Multi Purpose Diffractometer with a
cobalt XRD tube operating at 40kV and 45mA with a flat graphite monochromator and
programmable divergence slit. The mineralogical composition of the samples was derived
from the patterns, aided by the Xplot program (Mark Raven, CSIRO, pers. comm. 2009).
112
Total chemical analyses (expressed as percentage of oxides) were obtained of a <2 mm
fraction (carbonate free – removed with HCl) by X-ray fluorescence (XRF) spectroscopy
using a PANalytical Axios advanced, wavelength-dispersive X-ray spectrometer. Major and
trace elements were evaluated with beads produced by fusion with lithium borate
following the method of Norrish and Hutton (1969) for all samples. XRD analysis was also
obtained of the samples prepared for XRF, following the method for bulk powdered
samples outlined previously. Micromorphological investigations of the <2 μm fraction of
seven of the samples were conducted using a CM200 Phillips transmission electron
microscope (TEM). Samples were dispersed in distilled H2O and 1 drop of the suspension
was allowed to dry on carbon support film on a copper-mesh TEM grid. An EDAX DX4
energy dispersive X-ray (EDS) detector was used to determine the elemental composition
of some samples (Peter Self, CSIRO, pers. comm. 2010).
Petrographic and geochemical investigations were also performed, but only on the
carbonate component of the profile. Whole rock samples were collected for each of the
indurated horizons and thin sections were prepared from four of the samples. These
samples were collected from the 0.27 – 0.4 m, 0.95 – 1.1 m and 1.3 – 1.5 m zones of
profile T1 and from the highly indurated 0.7 – 1.3 m horizon of T3. Photomicrographs
were obtained and their petrography briefly described by Pontifex (2010). The
geochemistry of the carbonates in the soils was also determined, with �13C and �18O
stable isotope data acquired simultaneously on a Fisons Optima dual inlet mass
spectrometer attached to an Isocarb preparation device at the University of Adelaide,
South Australia. Approximately 3 mg of powder was reacted in a common, purified H3PO4
bath at 90oC for 420 seconds. Evolved CO2 was cryogenically distilled then measured
113
against an in-house reference gas. �18O was corrected for equilibrium with H2O during
reaction using the Craig equation (Craig 1957) and both �13C and �18O samples were
calibrated to VPDB using an in-house calcite standard. External error (1sd) based on
house standards was better than ± 0.05‰ for �13C and about ± 0.1‰ for �18O. All �13C
and �18O values are reported with respect to the VPDB as per mil deviations (‰) (Galen
Halverson, University of Adelaide, pers. comm. 2009).
4.3 RESULTS
Previous analysis showed there to be significant physicochemical differences between the
three key profiles T1, T2 and T3 (Table 4.1); T3 stands out as being distinctly different
from the other two profiles and was classified as a Vertosol. The soil here was deep, black
(dry colour 5Y 2.5/1), clay-rich, very strongly alkaline, had a high CEC and was strongly
sodic throughout. The exchange complexes of profiles T1 and T2, in comparison, were
dominated by magnesium, exhibiting a much greater exchangeable magnesium
percentage (EMP) than T3 (Table 4.1). Exchangeable potassium was also higher in these
profiles than in T3. Calcium carbonate was detected in all samples.
4.3.1 XRD patterns of the Powder Bulk Samples
The XRD plots of the powder bulk samples for profiles T1, T2 and T3 are shown in Figure
4.3. Patterns from these samples are presented at different intensities for the collection
angles 5 – 20 `� and 20 – 40 `� to enable greater resolution in the basal peak area for
layer silicates and also for primary minerals. The vertical bar ( ) represents 1000 counts
in each case (intensity).
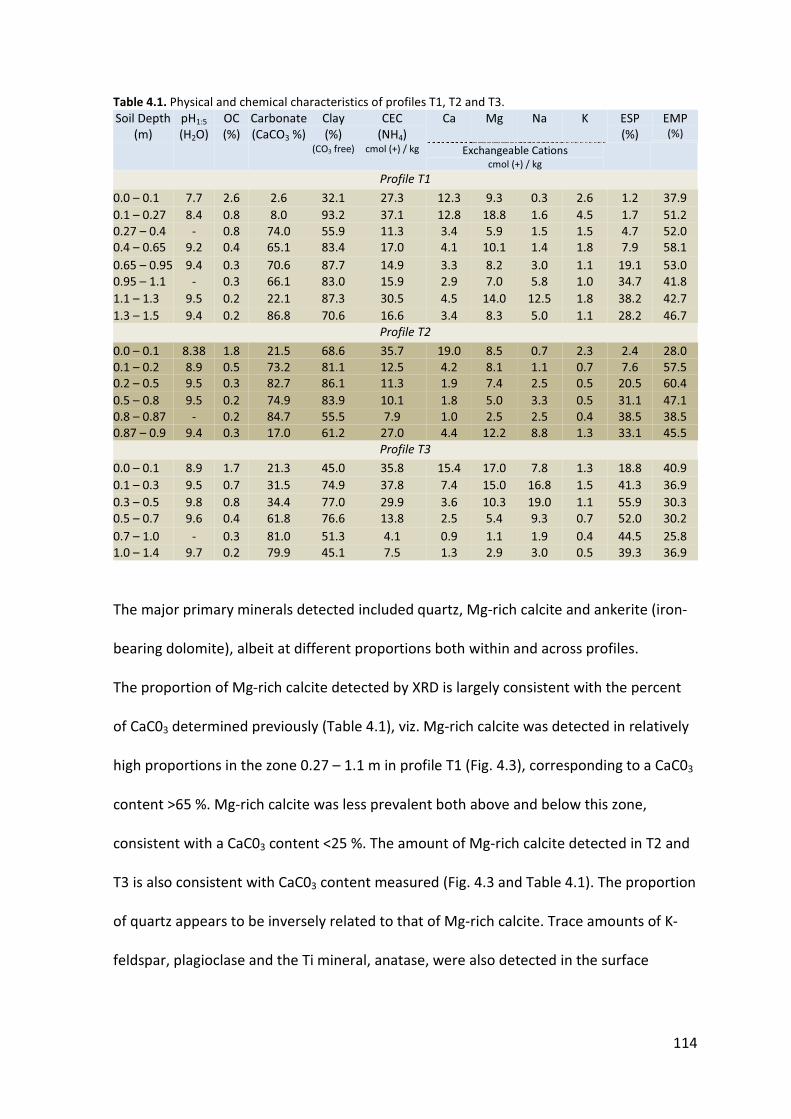
114
Table 4.1. Physical and chemical characteristics of profiles T1, T2 and T3. Soil Depth
(m) pH1:5 (H2O)
OC (%)
Carbonate (CaCO3 %)
Clay (%)
(CO3 free)
CEC (NH4)
cmol (+) / kg
Ca Mg Na K ESP (%)
EMP (%)
Exchangeable Cations cmol (+) / kg
Profile T1
0.0 – 0.1 7.7 2.6 2.6 32.1 27.3 12.3 9.3 0.3 2.6 1.2 37.9 0.1 – 0.27 8.4 0.8 8.0 93.2 37.1 12.8 18.8 1.6 4.5 1.7 51.2 0.27 – 0.4 - 0.8 74.0 55.9 11.3 3.4 5.9 1.5 1.5 4.7 52.0 0.4 – 0.65 9.2 0.4 65.1 83.4 17.0 4.1 10.1 1.4 1.8 7.9 58.1 0.65 – 0.95 9.4 0.3 70.6 87.7 14.9 3.3 8.2 3.0 1.1 19.1 53.0 0.95 – 1.1 - 0.3 66.1 83.0 15.9 2.9 7.0 5.8 1.0 34.7 41.8 1.1 – 1.3 9.5 0.2 22.1 87.3 30.5 4.5 14.0 12.5 1.8 38.2 42.7 1.3 – 1.5 9.4 0.2 86.8 70.6 16.6 3.4 8.3 5.0 1.1 28.2 46.7
Profile T2
0.0 – 0.1 8.38 1.8 21.5 68.6 35.7 19.0 8.5 0.7 2.3 2.4 28.0 0.1 – 0.2 8.9 0.5 73.2 81.1 12.5 4.2 8.1 1.1 0.7 7.6 57.5 0.2 – 0.5 9.5 0.3 82.7 86.1 11.3 1.9 7.4 2.5 0.5 20.5 60.4 0.5 – 0.8 9.5 0.2 74.9 83.9 10.1 1.8 5.0 3.3 0.5 31.1 47.1 0.8 – 0.87 - 0.2 84.7 55.5 7.9 1.0 2.5 2.5 0.4 38.5 38.5 0.87 – 0.9 9.4 0.3 17.0 61.2 27.0 4.4 12.2 8.8 1.3 33.1 45.5
Profile T3 0.0 – 0.1 8.9 1.7 21.3 45.0 35.8 15.4 17.0 7.8 1.3 18.8 40.9 0.1 – 0.3 9.5 0.7 31.5 74.9 37.8 7.4 15.0 16.8 1.5 41.3 36.9 0.3 – 0.5 9.8 0.8 34.4 77.0 29.9 3.6 10.3 19.0 1.1 55.9 30.3 0.5 – 0.7 9.6 0.4 61.8 76.6 13.8 2.5 5.4 9.3 0.7 52.0 30.2 0.7 – 1.0 - 0.3 81.0 51.3 4.1 0.9 1.1 1.9 0.4 44.5 25.8 1.0 – 1.4 9.7 0.2 79.9 45.1 7.5 1.3 2.9 3.0 0.5 39.3 36.9
The major primary minerals detected included quartz, Mg-rich calcite and ankerite (iron-
bearing dolomite), albeit at different proportions both within and across profiles.
The proportion of Mg-rich calcite detected by XRD is largely consistent with the percent
of CaC03 determined previously (Table 4.1), viz. Mg-rich calcite was detected in relatively
high proportions in the zone 0.27 – 1.1 m in profile T1 (Fig. 4.3), corresponding to a CaC03
content >65 %. Mg-rich calcite was less prevalent both above and below this zone,
consistent with a CaC03 content <25 %. The amount of Mg-rich calcite detected in T2 and
T3 is also consistent with CaC03 content measured (Fig. 4.3 and Table 4.1). The proportion
of quartz appears to be inversely related to that of Mg-rich calcite. Trace amounts of K-
feldspar, plagioclase and the Ti mineral, anatase, were also detected in the surface

115
horizons of all profiles. Ankerite is present in the 0.27 – 0.65 m zone of profile T1 and
throughout the profile of T2, but was only detected below 1 m in T3.
In the basal peak range of the XRD patterns from the powder bulk samples, the layer
silicate minerals sepiolite, palygorskite, illite, kaolinite and smectite were detected.
Sepiolite and palygorskite are two closely related fibrous clay minerals known to occur in
lacustrine environments, however, sepiolite was only rarely found in soils (Singer 2002).
In this study, sepiolite and palygorskite occur concurrently in most cases and were the
predominant layer silicates detected in the powder bulk samples from profile T2 (Fig. 4.3).
They also occur in zones of both low and high Mg-rich calcite/CaCO3 content, such as in
the clay-rich 1.1 – 1.3 m zone of T1 and the carbonate-rich 0.87 – 0.9 m zone of T2. Illite
and kaolinite were the predominant clay minerals detected in the surface A and B
horizons (0 – 0.27 m) of T1 that overlie indurated carbonate. The asymmetry of the
kaolinite peak in the 0 – 0.1 m horizon and the low angle rise in 0.1 – 0.27 m pattern
suggest that interstratified kaolinite/smectite minerals may also be present. Beneath this,
sepiolite and palygorskite were predominant, whereas T3, in comparison, exhibited
strong smectite peaks down to 0.5 m depth, with sepiolite and palygorskite detected
primarily below this zone (Fig. 4.3).
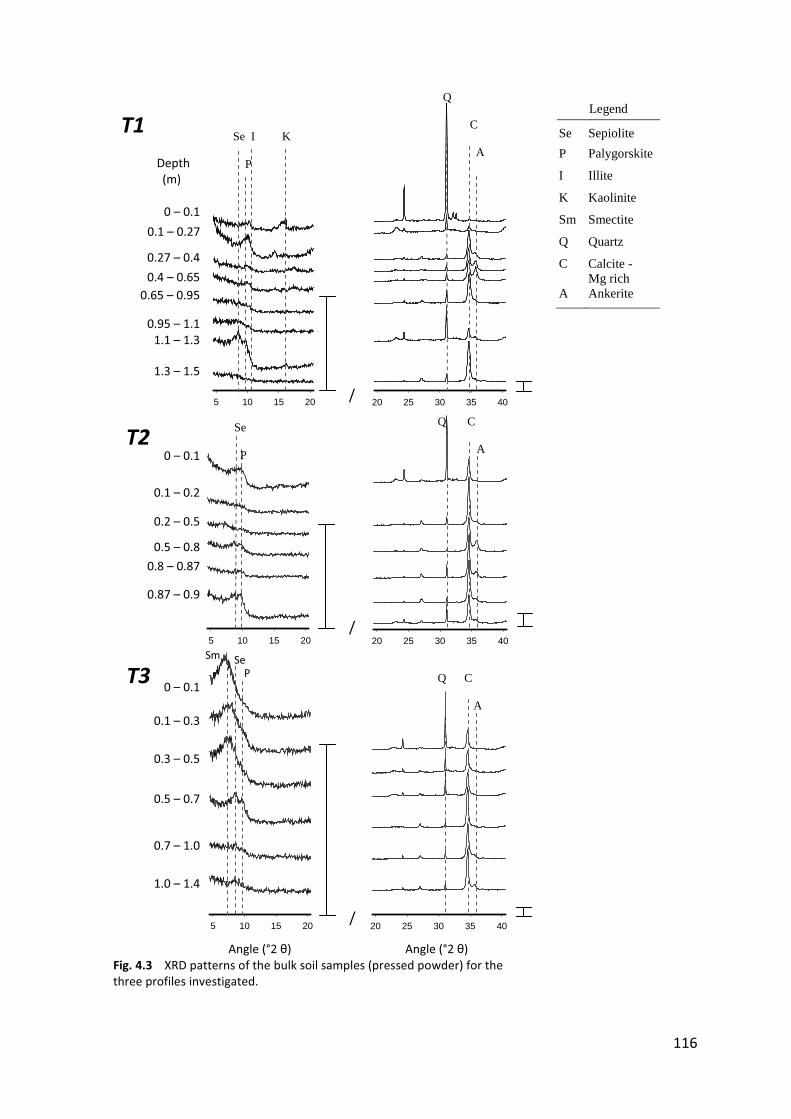
116
Legend
Se SepioliteP Palygorskite
I Illite
K Kaolinite
Sm Smectite
Q Quartz
C Calcite -Mg rich
A Ankerite
Depth (m)
0 – 0.1
0.1 – 0.27
0.27 – 0.4
0.4 – 0.650.65 – 0.95
0.95 – 1.11.1 – 1.3
1.3 – 1.5
0 – 0.1
0.1 – 0.2
0.2 – 0.5
0.5 – 0.8
0.8 – 0.87
0.87 – 0.9
0 – 0.1
0.1 – 0.3
0.3 – 0.5
0.5 – 0.7
0.7 – 1.0
1.0 – 1.4
{������`�� {������`��
Fig. 4.3 XRD patterns of the bulk soil samples (pressed powder) for the three profiles investigated.
5 10 15 20 20 25 30 35 40
5 10 15 20 20 25 30 35 40
5 10 15 20 20 25 30 35 40
T1 Se I K
P
/
T2 Se
P
Q C A
/
Sm
T3 P Se
Q C A
/
Q
C A

117
4.3.2 Elemental analysis
Quantitative analysis of the major elements (Si, Al, Fe, Mg, K, Ca and Na) was conducted
by XRF on a carbonate free fraction of bulk soil (Table 4.2) and pressed powder samples
of this fraction were also analysed by XRD.
Table 4.2. XRF Elemental and quartz XRD data for profile T1, T2 and T3 Soil Depth LOI SiO2 Al2O3 Fe203 MgO K20 CaO Na2O Cl Si:Al
Ratio Mg:Al Ratio
Quartz Intensity
(m) (%) Elemental composition expressed as oxides (%) (XRF fused beads)
% XRD CaCO3 free
Profile T1 0.0 – 0.1 35.0 42.1 7.0 3.5 3.8 1.4 2.4 1.2 2.9 6.0 0.5 11,700
0.1 – 0.27 34.2 36.7 13.5 6.5 3.4 3.3 0.8 0.6 0.2 2.7 0.3 9,200
0.27 – 0.4 35.4 41.4 11.1 5.5 2.5 2.6 0.3 0.3 0.3 3.7 0.2 10,800 0.4 – 0.65 35.1 41.0 10.5 5.2 3.2 2.5 0.6 0.5 0.7 3.9 0.3 9,800
0.65 – 0.95 36.5 41.3 6.1 3.1 4.3 1.4 2.1 1.5 3.1 6.8 0.7 10,000
0.95 – 1.1 34.7 48.4 6.9 3.2 3.5 1.3 0.6 0.4 0.5 7.0 0.5 21,800
1.1 – 1.3 37.8 40.6 6.2 2.9 6.1 1.0 0.9 0.3 3.7 6.6 1.0 30,500 1.3 – 1.5 35.0 32.2 4.9 2.5 5.0 0.9 7.6 0.3 11.0 6.5 1.0 11,000
Mean - 40.5 8.3 4.1 4.0 1.8 1.9 0.6 2.8 5.4 0.6 -
Profile T2 0.0 – 0.1 35.5 45.4 7.7 3.4 4.2 1.6 0.9 0.5 0.2 5.9 0.6 18,500
0.1 – 0.2 33.6 54.7 5.1 1.8 1.0 1.5 0.4 0.9 0.2 10.6 0.2 70,600 0.2 – 0.5 35.2 45.5 6.8 3.2 3.2 1.6 1.5 0.8 1.7 6.7 0.5 7,300
0.5 – 0.8 37.9 35.6 4.7 2.3 5.4 0.9 5.1 2.2 5.5 7.5 1.1 5,900
0.8 – 0.87 39.3 45.5 6.3 2.8 3.6 1.3 0.2 0.3 0.2 7.2 0.6 19,300
0.87 – 0.9 37.3 47.4 5.2 2.3 4.1 1.1 0.7 0.7 0.9 9.2 0.8 17,400 Mean - 45.7 6.0 2.7 3.6 1.3 1.5 0.9 1.4 7.9 0.6 -
Profile T3
0.0 – 0.1 34.4 42.9 5.0 2.0 11.5 0.9 2.0 0.4 0.4 8.5 2.3 33,900
0.1 – 0.3 35.2 39.2 5.8 2.6 14.0 1.0 1.0 0.3 0.4 6.8 2.4 12,000
0.3 – 0.5 39.0 41.0 4.8 2.4 8.6 1.0 0.8 0.6 1.1 8.6 1.8 16,000 0.5 – 0.7 40.3 34.6 3.5 1.7 5.4 0.7 4.6 2.4 6.3 9.9 1.5 7,300
0.7 – 1.0 33.4 52.8 5.2 2.1 2.9 1.2 0.7 0.5 0.6 10.2 0.6 36,000
1.0 – 1.4 33.4 50.1 6.9 2.9 3.4 1.3 0.6 0.4 0.4 7.3 0.5 26,500
Mean - 43.4 5.2 2.3 7.6 1.0 1.6 0.8 1.6 8.6 1.5 -
The major primary minerals detected by XRD on these samples included quartz,
orthoclase and albite, which account for the presence of some of the Si, Al, Na and K
detected in the samples. However, there were also peaks for layer silicate minerals in
virtually all of the samples. These were identified as sepiolite, palygorskite and /or
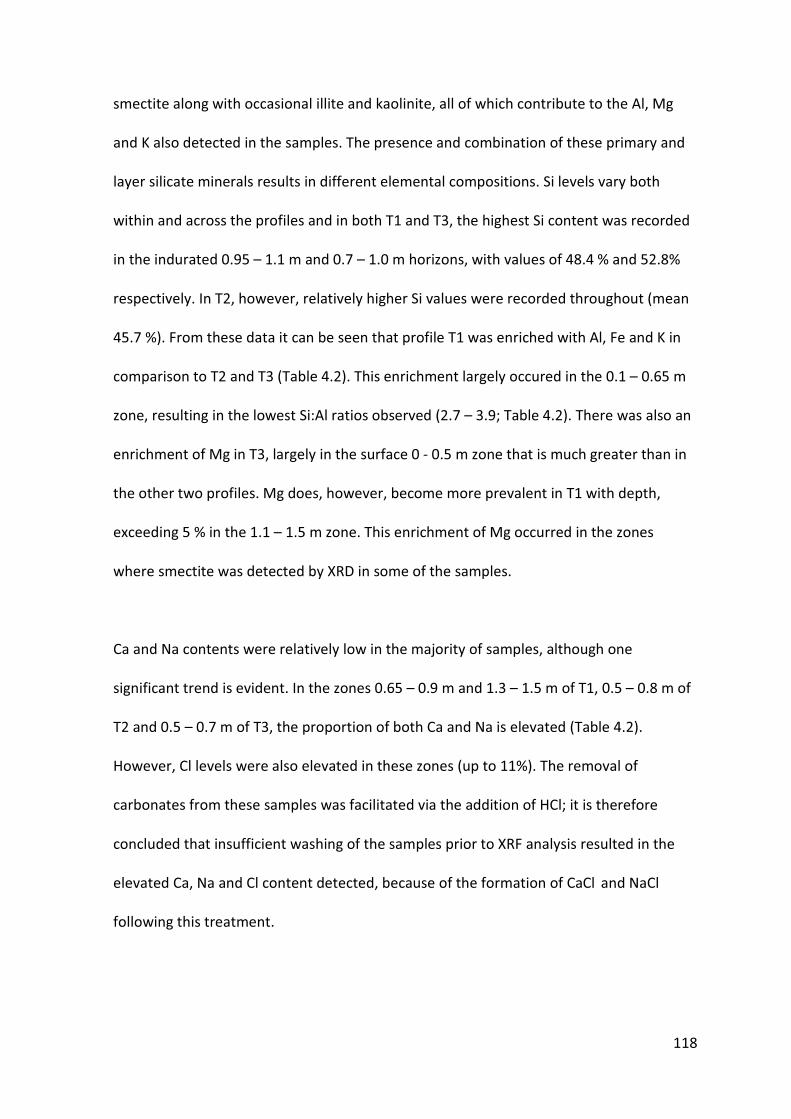
118
smectite along with occasional illite and kaolinite, all of which contribute to the Al, Mg
and K also detected in the samples. The presence and combination of these primary and
layer silicate minerals results in different elemental compositions. Si levels vary both
within and across the profiles and in both T1 and T3, the highest Si content was recorded
in the indurated 0.95 – 1.1 m and 0.7 – 1.0 m horizons, with values of 48.4 % and 52.8%
respectively. In T2, however, relatively higher Si values were recorded throughout (mean
45.7 %). From these data it can be seen that profile T1 was enriched with Al, Fe and K in
comparison to T2 and T3 (Table 4.2). This enrichment largely occured in the 0.1 – 0.65 m
zone, resulting in the lowest Si:Al ratios observed (2.7 – 3.9; Table 4.2). There was also an
enrichment of Mg in T3, largely in the surface 0 - 0.5 m zone that is much greater than in
the other two profiles. Mg does, however, become more prevalent in T1 with depth,
exceeding 5 % in the 1.1 – 1.5 m zone. This enrichment of Mg occurred in the zones
where smectite was detected by XRD in some of the samples.
Ca and Na contents were relatively low in the majority of samples, although one
significant trend is evident. In the zones 0.65 – 0.9 m and 1.3 – 1.5 m of T1, 0.5 – 0.8 m of
T2 and 0.5 – 0.7 m of T3, the proportion of both Ca and Na is elevated (Table 4.2).
However, Cl levels were also elevated in these zones (up to 11%). The removal of
carbonates from these samples was facilitated via the addition of HCl; it is therefore
concluded that insufficient washing of the samples prior to XRF analysis resulted in the
elevated Ca, Na and Cl content detected, because of the formation of CaCl and NaCl
following this treatment.

119
4.3.3 XRD patterns and TEM of the <2 μm fraction
The dominant layer silicate minerals detected by XRD in the <2 μm samples corresponded
to those identified in the powder bulk samples (smectite, sepiolite, palygorskite, illite and
kaolinite). Illite and kaolinite occur concurrently and were predominant in the shallow
grey (dry colour 10YR 5/1) surface soils (0 - 0.27 m) of profile T1 (Fig. 4.5) where TEM
investigations detected an abundance of primary minerals and unweathered material,
such as diatoms (Fig. 4.4a) and quartz grains. EDS (not shown) also confirmed the
presence of anatase (Fig. 4.4b) as identified in the powder bulk sample for this horizon
(Fig. 4.3). Despite the absence of sepiolite and palygorskite XRD peaks in this zone (from
both the powder bulk and <2 μm fraction), a few fibrous rods were evident in TEM images
in both horizons (Fig. 4.4 c and e).
Fig. 4.4 TEM images a, b and c from the 0 – 0.1 m horizon of T1; d and e from 0.1 – 0.27 m of T1; f 1.1 – 1.3 m of T1.
a b
d
e f
c
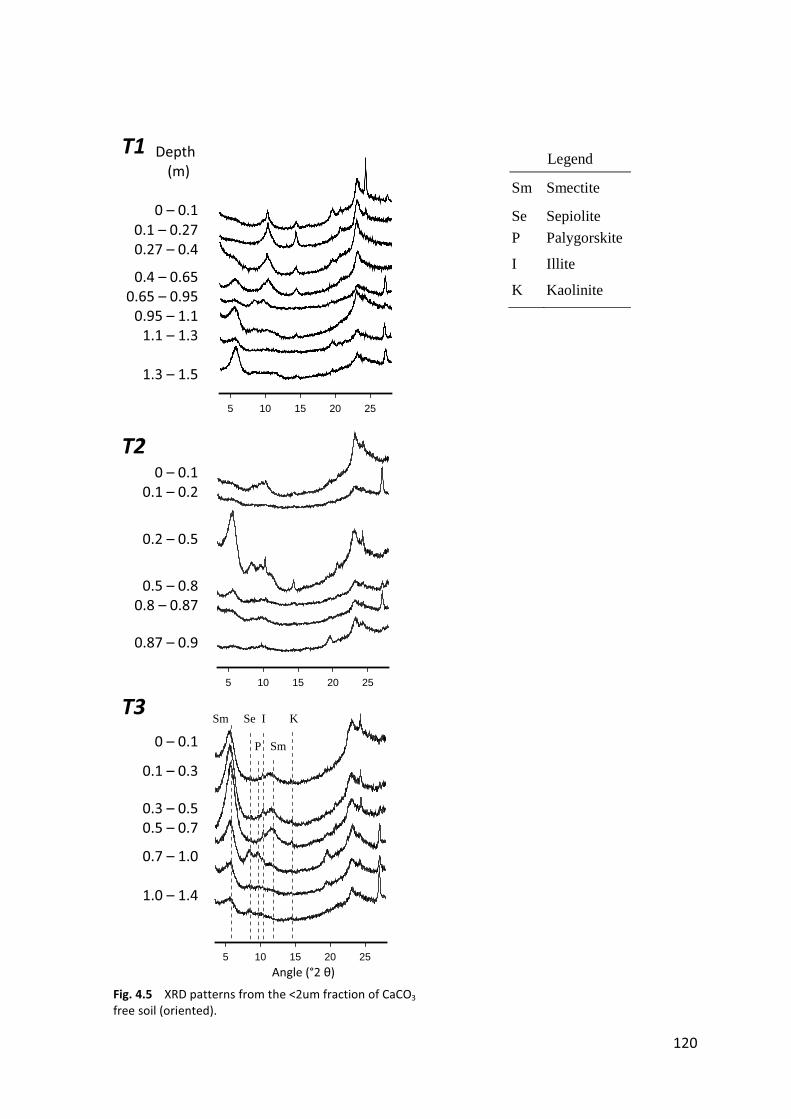
120
Legend
Sm Smectite
Se SepioliteP Palygorskite
I Illite
K Kaolinite
Depth (m)
0 – 0.1
0.1 – 0.270.27 – 0.4
0.4 – 0.65 0.65 – 0.95
0.95 – 1.1 1.1 – 1.3
1.3 – 1.5
0 – 0.1
0.1 – 0.2
0.2 – 0.5
0.5 – 0.8 0.8 – 0.87
0.87 – 0.9
0 – 0.1
0.1 – 0.3
0.3 – 0.5 0.5 – 0.7
0.7 – 1.0
1.0 – 1.4
Angle (°2 ) Fig. 4.5 XRD patterns from the <2um fraction of CaCO3 free soil (oriented).
5 10 15 20 25
5 10 15 20 25
5 10 15 20 25
T1
T2
T3 Sm Se I K
P Sm

121
Below 0.27 m, illite and kaolinite were still detected, but smectite becomes more
prevalent with depth. Sepiolite and palygorskite were detected in the 0.65 – 1.1 m
carbonate rich zone (Fig. 4.5). Below this depth, however, in the clay-rich 1.1 – 1.3 m
horizon, sepiolite and palygorskite were not detected by XRD in the <2 μm fraction,
despite the presence of small peaks for these minerals in the powder bulk sample (Fig.
4.6a) and the detection of fibrous rods by TEM (Fig. 4.4f). Whereas palygorskite and
sepiolite are generally unstable in acids, the presence of a palygorskite peak in the
carbonate-free powder bulk samples (Fig. 4.6c) suggests that it was not destroyed in this
case, despite being treated with HCl.
In view of earlier observations (Marshall 1964; Abdul - Latif and Weaver 1969) that
sepiolite is considerably less stable than palygorskite, it appears that sepiolite was
completely destroyed with HCl treatment, but palygorskite was not. This observation also
holds true for the samples from T2 0.5 – 0.8 m and for T3 0.7 – 1.0 m. The absence of
Fig. 4.6 XRD Peaks of T1 1.1 – 1.3 m zone indicating sepiolite (S) and palygorskite (P) in (a) bulk sample (b) the CaC03 free <2 μm sample and (c) CaC03 free bulk sample.
10.00
P S
c
b
a
`
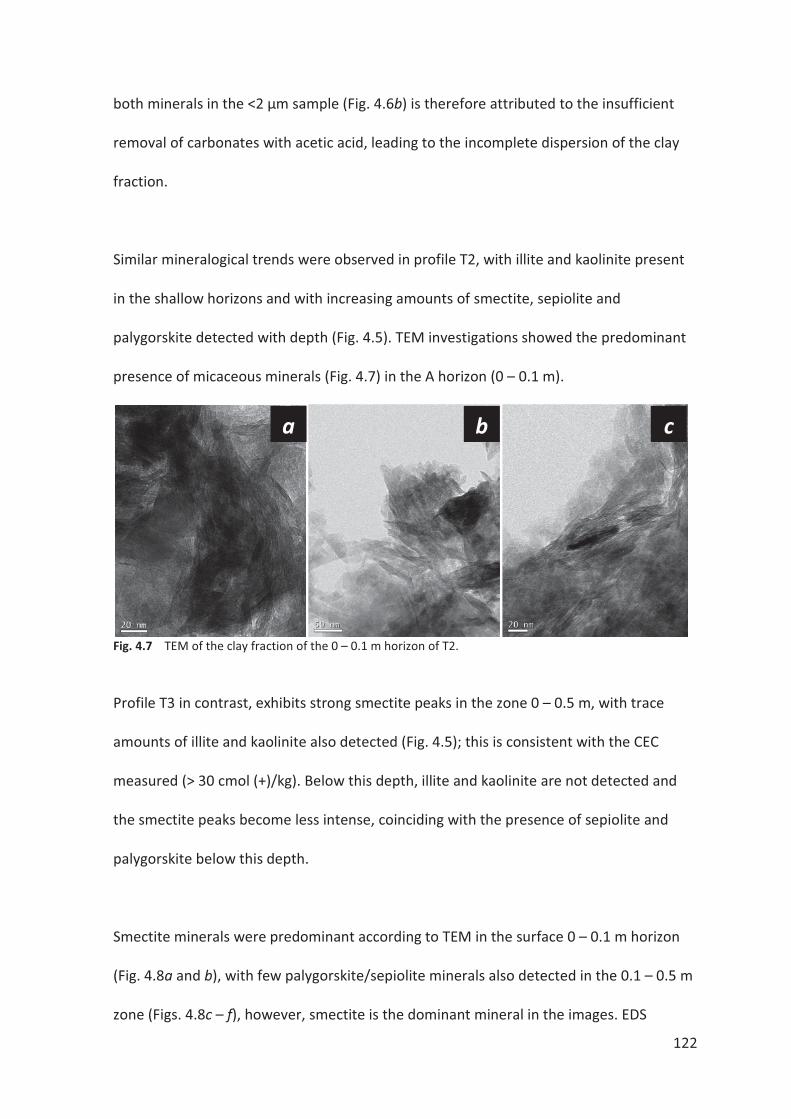
122
both minerals in the <2 μm sample (Fig. 4.6b) is therefore attributed to the insufficient
removal of carbonates with acetic acid, leading to the incomplete dispersion of the clay
fraction.
Similar mineralogical trends were observed in profile T2, with illite and kaolinite present
in the shallow horizons and with increasing amounts of smectite, sepiolite and
palygorskite detected with depth (Fig. 4.5). TEM investigations showed the predominant
presence of micaceous minerals (Fig. 4.7) in the A horizon (0 – 0.1 m).
Fig. 4.7 TEM of the clay fraction of the 0 – 0.1 m horizon of T2.
Profile T3 in contrast, exhibits strong smectite peaks in the zone 0 – 0.5 m, with trace
amounts of illite and kaolinite also detected (Fig. 4.5); this is consistent with the CEC
measured (> 30 cmol (+)/kg). Below this depth, illite and kaolinite are not detected and
the smectite peaks become less intense, coinciding with the presence of sepiolite and
palygorskite below this depth.
Smectite minerals were predominant according to TEM in the surface 0 – 0.1 m horizon
(Fig. 4.8a and b), with few palygorskite/sepiolite minerals also detected in the 0.1 – 0.5 m
zone (Figs. 4.8c – f), however, smectite is the dominant mineral in the images. EDS
b c a
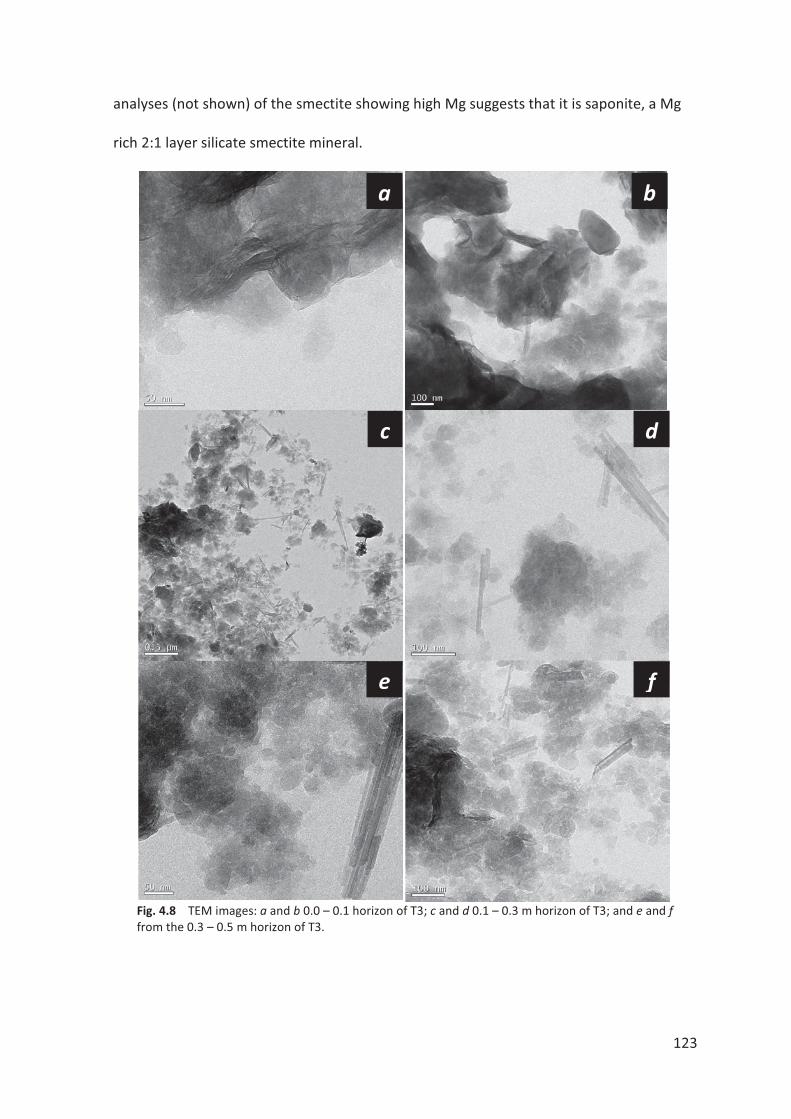
123
analyses (not shown) of the smectite showing high Mg suggests that it is saponite, a Mg
rich 2:1 layer silicate smectite mineral.
Fig. 4.8 TEM images: a and b 0.0 – 0.1 horizon of T3; c and d 0.1 – 0.3 m horizon of T3; and e and f from the 0.3 – 0.5 m horizon of T3.
c
f
a b
d
e
124
4.3.4 Petrographic examination
Three distinctive types of carbonate were detected in the studied profiles. These included
highly indurated zones (such as 0.27 – 0.4 m of T1), zones composed of powdery marl (0.1
– 0.8 m of T2) and powdery nodules within the soil matrix (0 – 0.5 m of T3). Petrographic
examination was only conducted on four samples of the indurated carbonate collected in
the study. Some were found to mainly contain peloids and intraclasts cemented in a
micrite (finely-textured microcrystalline calcite) matrix of varying colour and
heterogeneity, whereas others contained massive fabrics. Peloids are identified as more
or less rounded grains, up to several mm in width, coated with irregular micritic laminae.
Intraclasts are irregular fragments that can be rounded to angular in shape, ranging in size
from less than a mm to several cm long. Both peloids and intraclasts largely consist of
micrite; some clay may also be present. Desiccation cracks were also prominent in some
samples, whereas fossils were observed in others.
Examination of the photomicrograph from the 0.27 – 0.4 m horizon (Fig. 4.9) of T1 show it
to be largely heterogeneous. This sample is composed of loosely packed and weakly
layered stained peloids and intraclasts ranging in size from 0.2 to 5.0 mm, cemented in a
micritic matrix. Irregular and generally elongate desiccation cracks are prominent both
within the intraclasts and the intragranular pores. Numerous smaller rounded pores are
also present; much of the pore space is lined with an irregular clear carbonate and some
with clay minerals. The sample also contains mottled areas that are generally
concentrated around the desiccation cracks, indicating the oxidation of Fe; few small
quartz grains are also visible in the section.

125
Fig. 4.9 Photomicrograph of T1, 0.27 – 0.4 m horizon. Crossed nicols (Xnic).
Fig. 4.10 Photomicrograph of T1, 0.95 – 1.1 m section (Xnic).

126
The 0.95 – 1.1 m horizon of this profile is composed of an irregular micritic matrix with up
to 20% scattered porosity (Fig. 4.10). There are also many random irregular scalloped
patches that are optically clouded (up to 20 mm long). Pores are mostly rounded, ranging
in size from 0.5 to 3 mm; significantly larger than the elongate voids (generally 0.2 x 1.0
mm in size) observed in the shallower 0.27 – 0.4 m horizon (Fig. 4.10). Some elongate
voids are also present in the deeper sample and are mostly lined with a clear
microcrystalline secondary carbonate; however this lining is thicker than the lining seen in
the pores of the shallower sample.
Fig. 4.11 Photomicrograph of T1, 1.3 – 1.5 m horizon (Xnic).
Below this horizon, in the 1.3 – 1.5 m zone (Fig. 4.11), the matrix is highly indurated, fairly
homogenous and optically clouded, and can be described as a massive micrite
(Gierlowski-Kordesch 2010). A weak layering of discontinuous, streaky fissures, occupying

127
about 15% of the sample are also present; many of these are lined with clear secondary
carbonate, apparently so finely divided that it can be characterised as cryptocrystalline.
The top half of this thin section appears more nodular and exhibits greater porosity;
below the large fissure (lined on the upper-side by nodules, intraclasts and calcite) the
matrix is massive.
Fig. 4.12 Photomicrograph of T3, 0.7 – 1.0 m section (Xnic).
The carbonate intercepted in the 0.7 – 1.0 m zone of profile T3 was observed to be an
optically clouded, massive micrite that is essentially the same as that found in the 1.3 –
1.5 m zone of T1 (Fig. 4.12). This section, however, also incorporates scattered and
weakly layered microfossils and fossil fragments (molluscs). Few irregularly shaped pores
are present and are largely occupied by a thin layer of clear cryptocrystalline carbonate.
Many quartz sand grains are scattered throughout the sample and appear larger than
those seen in T1.

128
4.3.5 Isotopic analysis
Isotopic analysis of the carbonates showed a wide variation of signatures between the
profiles. In the upper 0.8m, |}�����|\��� ������������������������������������13�������18O
~���������������~�������13C of -7.42 and -�����������18O of -0.67 and +0.56 ‰
��������~�����|�~����������^������������� �������~�������13�������18O values of -6.85
and +0.06 ‰ respectively. The carbonates present in the upper 0.4 m of profile T1 were
isotopically lighter in both O and C than in profiles T2 and T3, with positive covariance of
�13�������18O values generally observed (Fig. 4.13).
In the mid section of all profiles (0.5 – @���������������13�������18O values were recorded.
Below 0.8 m, inverse covariance is observed in the indurated carbonate horizons of both
T1 (0.95 – 1.1 and 1.3 – 1.5 m) and T3 (0.7 – 1.0 m), with similar O and C isotope values
recorded for both profiles.
Dep
th (m
)
��13C ‰ ��18O ‰
Fig. 4.13 Isotopic signatures of the three key profiles, T1 ( ), T2 ( ) and T3 ( ).
-9 -8 -7 -6 -5 -40.0
0.2
0.4
0.6
0.8
1.0
1.2
1.4
-2 -1 0 1 20.0
0.2
0.4
0.6
0.8
1.0
1.2
1.4
129
4.4 DISCUSSION
The aim of this study was to investigate the mineralogy, morphology and geochemistry of
the clay and carbonate minerals that are present in the soils at Keilira and to attempt to
determine their genesis in the landscape. In regard to clay minerals, the dominant types
detected were smectite, sepiolite, palygorskite, illite and kaolinite. The carbonates were
Mg-rich calcite and ankerite; different morphologies were present, with indurated, marl,
and soft powdery forms occurring. Much quartz was also detected, both in the surface
and at depth. The proportions of these minerals was highly variable both within and
between profiles; it is likely that relationships between the clay and carbonate species
occur. The types and genesis of these minerals will be discussed here in further detail.
4.4.1 Genesis and types of clay minerals
Analysis of the clay minerals reveals three distinct mineralogical relationships: horizons
dominated by illite and kaolinite, horizons dominated by sepiolite and palygorskite in
addition to smectite, and horizons dominated by smectite alone.
Illite and kaolinite were detected in every profile, however they were most dominant in
the zone of shallow top soil in T1 (0 - 0.27 m). This zone contained only trace amounts of
Mg-rich calcite and ankerite, consistent with the CaC03 content <10 %. TEM investigations
of this zone revealed an abundance of primary minerals and unweathered materials, such
as diatoms and quartz grains (Fig. 4.4a and b); anatase was detected by EDS and both K-
feldspars and plagioclase were also detected by XRD. These observations are supported
by elemental data that show there to be the greatest proportions of both elemental Al
and K in this zone in comparison to profiles T2 and T3 (Tables 4.1 and 4.2). From these

130
observations we propose that kaolinite, in addition to the other primary minerals
detected here, is mostly detrital in origin, having been transported by the surface waters
that once seasonally inundated this landscape (Holmes and Waterhouse 1983). Despite
the indication of distinct illuviation in profile T1 (clay content increases to >90 % in the 0.1
– 0.27 m zone), these primary alluvial materials have mostly remained stratified due to
the presence of the indurated carbonate over which they lie (0.27 – 0.4 m). One anomaly
does occur, however, in respect to kaolinite. In the 0.1 – 0.27 m horizon of profile T1, a
relatively large sharp kaolinite peak is detected in the <2 μm pattern (Fig. 4.5), despite
this mineral being almost undetected in the bulk sample (Fig. 4.3). However, in the bulk
sample, a significant rise is seen in the pattern at low angle, although no smectite was
specifically detected. Chemical data for this horizon shows extremely high CEC for a soil
dominated by illite and kaolinite alone, high exchangeable Mg and the highest FeO2
content for any sample. The combination of these factors may indicate that kaolin-
smectite interstratification occurs in this horizon, brought about by the alteration by
weathering of smectite, which is known to produce kaolin and iron oxides as a result of
improved drainage (Borchardt 1989; Churchman et al. 1994).
The origin of illite is also difficult to conclusively establish. Fe-rich authigenic illite has
been identified in soils of lacustrine origin in Australia, and particularly in soils from
Willallooka in the USE, which is located only 40 km from this study site (Norrish and
Pickering 1983). These minerals were characterised by their very uniform shape and size
(~0.07 μm), which is much smaller than the minerals found here (Fig. 4.4). Therefore,
given the distinct lack of CaC03 in this zone and the non-uniform shape and size of the
clay minerals, it is unlikely that this material is the diagenetic product of a lacustrine

131
deposit. Also, as this mineral generally occurs concurrently with kaolinite, quartz and
feldspars, it is likely to also be of detrital origin. Illite and kaolinite were both detected in
profiles T2 and T3, albeit as minor components; their ubiquitous presence throughout
these profiles is the result of periodic surface water inundation in this region and the
absence of a shallow indurated horizon.
Mg-rich clays were also detected in this study. Non-carbonate minerals such as these are
known to precipitate directly from solution in lacustrine and palustrine environments,
(Akbulut and Kadir 2003; Bustillo and Alonso-Zarza 2007; Alonso-Zarza and Wright 2010a)
and whereas illite and kaolinite appear to be principally detrital in origin, as discussed, we
propose that smectite, palygorskite and sepiolite are authigenic lacustrine and palustrine
precipitates. However, further analysis reveals some distinct relationships. In profile T3,
EDS analysis of the clay minerals indicated that the smectite present was likely to be
saponite, which is a Mg-rich layer silicate mineral. To confirm this, further analysis of the
XRD patterns collected from the powder bulk samples (carbonate free) (Fig. 4.15) from
the 0 – 0.1 m layer of T3, shows a distinct peak at 71.5 `����� corresponds to the 060
peak of saponite, which being a trioctahedral smectite gives a 060 spacing between 1.525
and 1.54 Å (Fanning and Keramidas 1977).

132
` Fig. 4.14 XRD peaks for the 0 - 0.7m zone of profile T3, showing the presence of a trioctahedral (060) peak (t) in the 0 – 0.5 m horizons, and a dioctahedral (060) peak (d) in the 0.5 – 0.7 m horizon.
Another peak is also detected in some cases at �@���`��� ����� ������� ���-rich
saponite. This generally occurs as a shoulder on the high angle side of a sharp peak that
can be attributed to quartz. Furthermore, no peaks were detected for the 060 spacing of
dioctahedral smectites, which is close to 1.50 Å (Fanning and Keramidas 1977) in the 0 -
0.1 m horizon (Fig. 4.14), confirming the presence of smectite as saponite in this horizon.
This was also the case throughout the 0.1 – 0.5 m zone; however a slight, but broad peak
is also visible on the high angle side of the trioctahedral 060 peak. Below this, in the 0.5 –
0.7 m horizon, a trioctahedral 060 peak was not detected, but a dioctahedral 060 peak
was. Montmorillonite and beidelite are the two most common dioctahedral smectites
found in soils (Churchman 2000) ���������������������`�� ����� ����� ������@�@��}��@ Å
spacing for montmorillonite. XRD analysis of the <2 μm fraction shows a reduction in the
intensity of the smectite peaks in the 0.5 – 1.0 m zones (Fig. 4.5), corresponding with the
70.00 75.00
1
2
3
4
Inte
nsity
(Cou
nts)
X 1
000
0.1 – 0.2 m
0.3 – 0.5 m
0.5 – 0.7 m
0 – 0.1 m
d t
133
increased intensities of sepiolite and palygorskite peaks. Upon further investigation, it
appears that the 0 – 0.5 m zone of T3 is the only part of any of the profiles to contain
saponite (as confirmed by the trioctahedral 060 peak), and where this occurs, no sepiolite
and palygorskite were detected by XRD. In all other profiles, as in other parts of T3, where
a smectite peak is detected, in addition to sepiolite and palygorskite in the layer silicate
region, only a dioctahedral 060 peak was found, indicating that the smectite is
montmorillonite. In no cases were there strong peaks for both dioctahedral and
trioctahedral smectites. This relationship was also found in a study of a saline lacustrine
environment in Brazil; this feature was attributed to the position in the landscape,
wherein the smectite minerals in the upper zone of the landscape (outside the level of
seasonal lake variation) were found to be dioctahedral (ferribeidellite), and the smectites
in the lower zones (within the area of seasonal lake level variation) were trioctahedral
(stevensite and saponite) (Furquim et al. 2010).
Saponite, sepiolite and palygorskite have been shown to form either through direct
precipitation from alkaline lake waters or authigenically from interstitial pore-water
(Akbulut and Kadir 2003; Yeniyol 2007). Their formation commonly occurs in alkaline
lacustrine environments at high pH, and is considered to be controlled by the
concentration of Si, Mg, Al and Fe, rather than by mutual transformation. Palygorskite
has however been found as a diagenetic transformation product of other inherited clay
minerals where sepiolite and Mg-smectite were found as chemical precipitates in a
lacustrine environment (Torres-Ruiz et al. 1994). It has also been concluded that
palygorskite can feasibly form pedogenically from soil water, given the right elemental
composition (Singer 1974). As seen in table 4.3, saponite occured in the absence of

134
sepiolite, palygorskite and ankerite and contained very high elemental Mg. A similar
observation was made by Leguey et al. (2010), who reported that the concentration of
tri-octahedral smectites in a lacustrine sediment was the lowest when sepiolite was
present in the highest concentrations.
Table 4.3 Key properties of the layer silicate minerals detected. N.B. + = 0 – 3 %, ++ = 3 – 6 %, +++ = 6 – 9 %, ++++ >9 %, - = not present, P = present
Predominant minerals detected by XRD
pH1:5 (H2O)
Element composition as oxides (%) Other mins. detected by XRD
MgO Al3O2 Fe2O3 K2O Ankerite Sep. and Paly.
Saponite >9 ++++ ++ + + - - Montmorillonite >9 ++ ++ + + P P Sepiolite and Palygorskite
>9 ++ +++ ++ + P P
Illite and Kaolinite <9 ++ ++++ ++ ++ P trace
Regardless of their genesis by direct precipitation or diagenetic transformation, the
formation and stability of these minerals requires an alkaline environment and relatively
high activities of Si and Mg (Neaman and Singer 2004); palygorskite also requires the
input of Al. Nonetheless, ankerite is a (Fe-bearing) dolomite species and the observation
that this mineral is absent in the presence of saponite is intriguing, indicating that Mg in
solution is partitioned between carbonate and silicate phases. This phenomenon has
been reported previously, where the Mg content of authigenic clays is relatively low when
associated with widespread dolomite beds, and is much higher when only calcite is found
(Alonso-Zarza 2003; Deocampo 2010). Two scenarios for saponite formation are therefore
possible; the first is that saponite was a primary precipitate in the absence of ankerite,
and the second is that ankerite was present, but has undergone dissolution. In the first
scenario, highly evaporative conditions would predominate, first leading to the
precipitation of calcite; the remaining Mg is therefore sufficiently high enough to lead to
the precipitation of saponite. In the second scenario, Mg-rich calcite and ankerite were
135
primary precipitates that succumbed to dissolution, releasing Ca, Mg and C03 into the
system. This results in the formation of the nodular powdery carbonate that is ubiquitous
in the 0 – 0.7 m zone of T3, and in the presence of high Si, supplies the additional Mg that
is necessary for the neo-formation of saponite. Thus, saponite is either a primary
precipitate that has formed in areas of the landscape where water persisted the longest
i.e. in topographical lows on the western side of the Avenue Plain and in natural drainage
lines, or is a neo-formed mineral, affected by the dissolution of ankerite. Nonetheless,
both of these scenarios involve prolonged wetting and high Mg and Si activity in the
surface, ground and pore waters.
Sepiolite and palygorskite are considered to be authigenic primary minerals in this case
because of their ubiquitous presence in the profiles and their concomitant occurrence
with lacustrine carbonates. Dioctahedral smectites have been reported as the diagenetic
product of the dissolution of palygorskite when the mean annual rainfall exceeds 300 mm
(Neaman and Singer 2004). The presence of dioctahedral smectite in this case is therefore
attributed to the weathering of palygorskite and possibly also sepiolite. This conclusion is
supported by the occurrence of high exchangeable Mg (Table 4.1) which is known to
occur in soils where palygorskite has succumbed to weathering (Neaman and Singer
2004) .
4.4.2 Genesis of lacustrine, palustrine and calcrete carbonates on the Avenue Plain
Whereas the carbonate minerals detected in all of the samples were either Mg-rich
carbonate or ankerite, the stable isotope and petrographic features identify the
carbonates as being derived or altered in different climatic and environmental regimes.
136
Four main carbonate morphological types were intercepted in the profiles; these included
an indurated carbonate horizon within 0.3 m of the surface; zones of powdery marl that
often contained clay; indurated carbonates >0.7 m depth in the profile; and soft powdery
� �������������������������� �������������������� ��� ��13�������18O data for profiles T1, T2
and T3, stable isotope data were also collected for another five profiles from the study
trench. The data from these samples has been sorted into four groups, representing the 4
carbonate morphological types, and are presented in Figure 4.15.
4.4.2.1 Palustrine limestones
The indurated carbonate horizon present in profile T1 (0.27 – 0.40 m) is classified as
palustrine limestone. The minerals present in this horizon were identified by XRD as Mg-
rich calcite and ankerite (Fig. 4.3) and aside from Si and Al, this horizon contained
considerable Fe and K (Table 4.2). It is likely that a large part of the Fe was present as
oxides due to remobilisation and precipitation and changes in the Eh of oscillating
groundwater (Alonso-Zarza and Wright 2010a); this mechanism is supported by the
orange staining / mottling observed in thin section (Fig. 4.9). Petrographic examination
showed the section to be composed of peloids and intraclasts, cemented within a mottled
micrite with multiple curved desiccation cracks of variable shapes and sizes. The pores
were lined with clear carbonate of variable thickness, indicating the precipitation of
secondary calcite from vadose meteoric waters. These characteristics are consistent with
those observed in nodular and brecciated limestones (Freytet and Verrecchia 2002;
Alonso-Zarza 2003; Alonso-Zarza and Wright 2010a), hence the designation of this
horizon as a palustrine limestone.

137
The isotope values measured in this horizon may also support this conclusion. The
� ~������������18�������13C isotope data observed here (Fig. 4.15) suggests that these
carbonates were formed in a hydrologically closed system. Subsequent alteration by
diagenesis of the primary sediment and interaction with plants may account for the
lighter isotope values observed in this zone.
�18O ‰
�13C
‰
Fig. 4.15 �� �� ���13��~����18O for a range of different carbonate types found in the study area.
The range in carbon isotope values reported here reflect a change in climatic regime and/
��~������� ������������� ������������������|����13C content of carbonates is affected by
the proportions of plants that use C3 (trees, most shrubs, cool season grasses), C4 (warm
season grasses and a few shrubs) and CAM (cacti and other succulents) photosynthetic
pathways. When C3 ~������� ������ ����������������� ������������13C values are generally
observed in the carbonates due to their supply of highly negative carbon (- 32 to -25 ‰)
(Zhou and Chafetz 2010). Heavier carbon isotope values therefore represent carbon
inputs from C4 ���������������� ����13C values between -14 and -10 ‰), or greater
-9
-8.5
-8
-7.5
-7
-6.5
-6
-5.5
-5
-4.5
-4
-2 -1 0 1 2 3
Palustrine Limestone
Lacustrine Marl and Clay
Groundwater Calcrete
Pedogenic Calcrete
138
atmospheric carbon input, both of which are related to increasing aridity. The highly
������~���18�������13C values recorded in this carbonate type (palustrine limestone) may
suggest high biogenic activity in lacustrine waters, the input of highly negative plant
derived carbon and limited atmospheric input, which would be consistent with the
transition from a lacustrine to palustrine setting as plants colonise the exposed lacustrine
sediments. It therefore appears that the primary lacustrine mud from which this
limestone formed has undergone significant physical and chemical alteration due to sub-
aerial exposure of the sediments and the interaction with plants and vadose waters.
4.4.2.2 Lacustrine marl and clay
Beneath the indurated horizon of T1, throughout 0.1 – 0.8 m of profile T2 and 0.5 – 0.7 m
of T3, zones of unconsolidated marl were present that also contained considerable Al, Fe
and K (Table 4.2). Mg-rich calcite and ankerite were the predominant minerals detected
here, with CaC03 content ranging between 65 and 83 % and CEC values between 11 and
17 cmol (+) / kg (Table 4.1). There was more clay present in the marl of T1 than T2 and
the mineralogy transitions from predominately illite and kaolinite to increasing amounts
of smectite (as montmorillonite), palygorskite and sepiolite in all profiles (Figs. 4.3 and
4.5).
{������������ ���18�������13C values were recorded for these carbonate types, which
possibly reflects the alteration of this material through diagenetic2
2 Diagenetic processes refer to any chemical, physical or biological alteration of a sediment after its
deposition
and pedogenic

139
3processes. Whereas this marl was probably derived in a lacustrine setting (rather than
being groundwater-related), given the ephemeral nature of the flood waters that were
known to traverse this region seasonally (Holmes and Waterhouse 1983), the lack of
microfossils, range in isotope values and ubiquitous presence of root hairs and visible
pores in hand specimen, it is likely that this carbonate has undergone some form of
diagenesis and weathering4
4.4.2.3 Groundwater calcretes / silcretes
. The petrography of this zone was not studied due to the
unconsolidated nature of the material, therefore the degree of alteration of this sediment
cannot be determined.
Three horizons within the profiles have been identified as groundwater calcretes
/silcretes due to their proximity to the watertable and their similar isotopic and
mineralogical properties. However, their morphological properties differ significantly.
The highly indurated 0.95 – 1.1 m horizon of T1 was predominantly comprised of Mg-rich
calcite and smectite, with trace amounts of sepiolite, illite, kaolinite and quartz (Figs. 4.3
and 4.5). The multi-faceted nature of this material is demonstrated in thin section, being
characterised by intraclastic material embedded in a cloudy micrite matrix with up to 20%
scattered porosity (Fig. 4.10). The pores were coated with a clear secondary carbonate
that is mostly the same thickness in all directions, indicating their formation in a phreatic
3 Pedogenic processes refer to the alteration of near surface materials via their interaction with plants and
vadose and meteoric waters
4 Weathering refers to the alteration of near surface materials via their interaction with the atmosphere
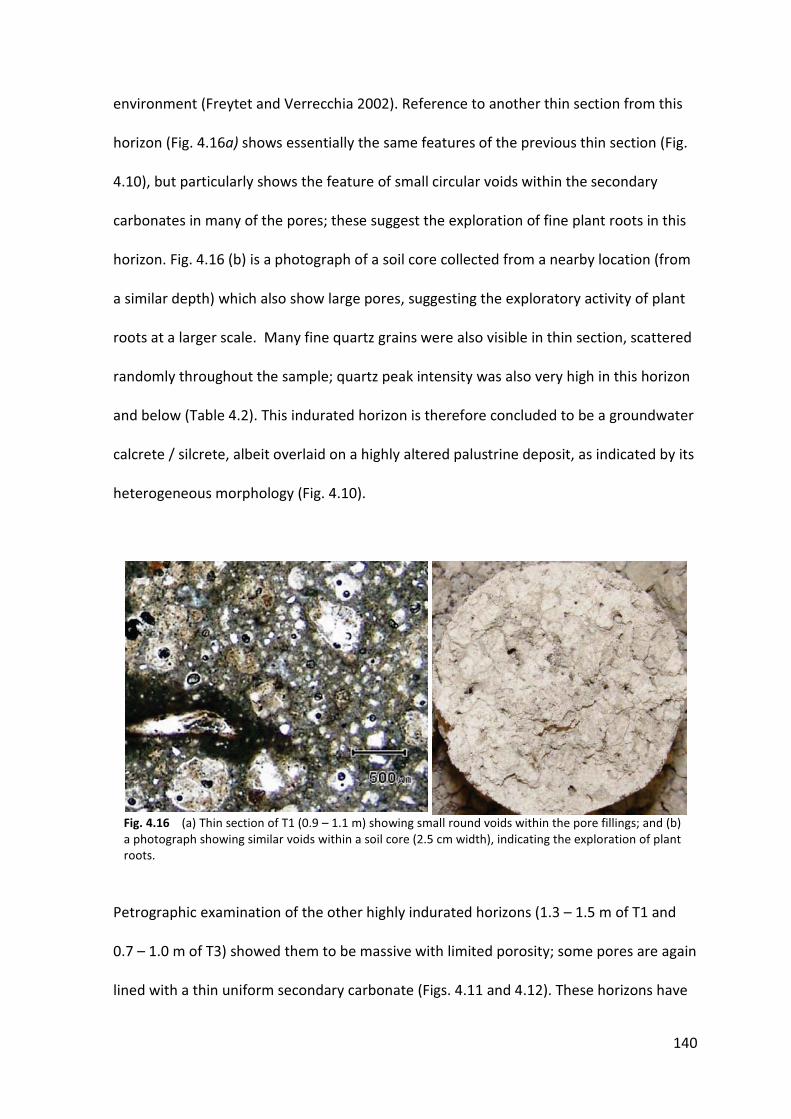
140
environment (Freytet and Verrecchia 2002). Reference to another thin section from this
horizon (Fig. 4.16a) shows essentially the same features of the previous thin section (Fig.
4.10), but particularly shows the feature of small circular voids within the secondary
carbonates in many of the pores; these suggest the exploration of fine plant roots in this
horizon. Fig. 4.16 (b) is a photograph of a soil core collected from a nearby location (from
a similar depth) which also show large pores, suggesting the exploratory activity of plant
roots at a larger scale. Many fine quartz grains were also visible in thin section, scattered
randomly throughout the sample; quartz peak intensity was also very high in this horizon
and below (Table 4.2). This indurated horizon is therefore concluded to be a groundwater
calcrete / silcrete, albeit overlaid on a highly altered palustrine deposit, as indicated by its
heterogeneous morphology (Fig. 4.10).
Fig. 4.16 (a) Thin section of T1 (0.9 – 1.1 m) showing small round voids within the pore fillings; and (b) a photograph showing similar voids within a soil core (2.5 cm width), indicating the exploration of plant roots.
Petrographic examination of the other highly indurated horizons (1.3 – 1.5 m of T1 and
0.7 – 1.0 m of T3) showed them to be massive with limited porosity; some pores are again
lined with a thin uniform secondary carbonate (Figs. 4.11 and 4.12). These horizons have

141
similar geochemical characteristics (especially isotopic values) and mineralogy; however,
T3 also contained fossil fragments (mollusc) (Fig. 4.12). Such features suggest that these
lacustrine sediments were subjected to only limited subaerial exposure and diagenesis;
hence they maintain a homogenous and massive ‘alpha’ structure.
Interaction with the watertable influences the C and O isotopic signatures of these
calcrete horizons; the range in values is consistent with those reported for calcretes
(Alonso-Zarza 2003). The enrichment of 18O seen here suggests increasing aridity in this
environment and the precipitation of carbonates driven through evaporative processes in
an open system (due to their inverse covariance). Whereas the groundwater calcretes are
enriched in 18����13C values remain in the range recorded for the lacustrine and palustrine
limestones (Fig. 4.15). Stable carbon isotope values are controlled by inputs of
atmospheric and soil CO2, which in turn is affected by the type and extent of local plant
cover. At these depths in the profile, however, it is unlikely that there is significant input
of atmospheric or soil C02, hence the groundwater calcretes retain the isotopic carbon
signature of the primary lacustrine sediment. In contrast, the oxygen isotope signature is
altered to reflect the composition of current meteoric waters and precipitation driven by
evaporative processes; this phenomenon has been reported previously (Leier et al. 2009).
Further indication of the complexity of these horizons is indicated by the presence of
many small white particles throughout the thin sections (Fig. 4.10, 4.11 and 4.12),
suggesting quite small crystals of quartz that would be consistent with an authigenic
origin, and may suggest silicification of the calcretes, contributing to the induration that is
observed. Calcrete – silcrete associations are commonly found in continental basins with
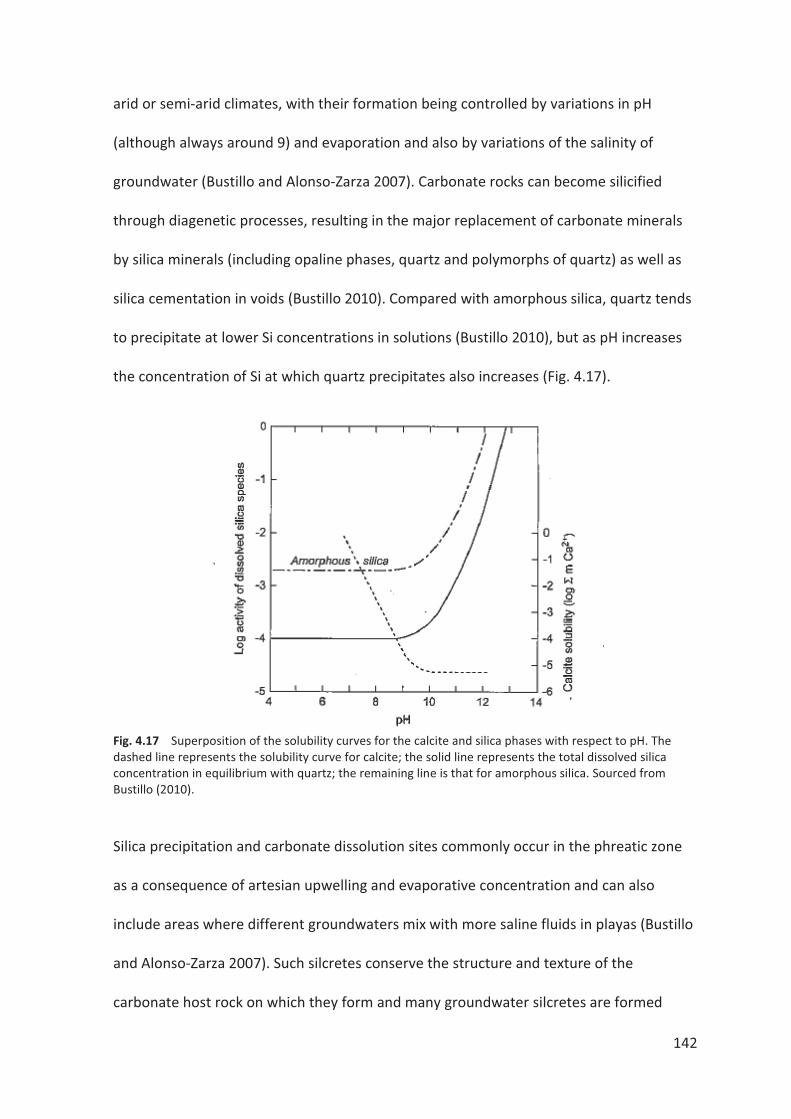
142
arid or semi-arid climates, with their formation being controlled by variations in pH
(although always around 9) and evaporation and also by variations of the salinity of
groundwater (Bustillo and Alonso-Zarza 2007). Carbonate rocks can become silicified
through diagenetic processes, resulting in the major replacement of carbonate minerals
by silica minerals (including opaline phases, quartz and polymorphs of quartz) as well as
silica cementation in voids (Bustillo 2010). Compared with amorphous silica, quartz tends
to precipitate at lower Si concentrations in solutions (Bustillo 2010), but as pH increases
the concentration of Si at which quartz precipitates also increases (Fig. 4.17).
Fig. 4.17 Superposition of the solubility curves for the calcite and silica phases with respect to pH. The dashed line represents the solubility curve for calcite; the solid line represents the total dissolved silica concentration in equilibrium with quartz; the remaining line is that for amorphous silica. Sourced from Bustillo (2010).
Silica precipitation and carbonate dissolution sites commonly occur in the phreatic zone
as a consequence of artesian upwelling and evaporative concentration and can also
include areas where different groundwaters mix with more saline fluids in playas (Bustillo
and Alonso-Zarza 2007). Such silcretes conserve the structure and texture of the
carbonate host rock on which they form and many groundwater silcretes are formed
143
directly from quartz without any intermediate opaline phase (Bustillo 2010). This process
was illustrated by Bustillo and Alonso-Zarza (2007) in a study of palustrine deposits that
indicated the psuedomorphic replacement of sepiolite by silica, with quartz subsequently
appearing as a result of cementation and ageing.
The soil chemical, mineralogical and hydrological characteristics observed in this study
therefore lend themselves to the silicification of groundwater calcretes. It is worthy to
note that in the 0.9 – 1.1 m zone of T1, CaC03 content was only 60% (Table 4.1) and in
XRD a significant quartz peak is detected in addition to Mg-rich calcite (Fig. 4.3); quartz
grains of varying size were also clearly visible in thin section (Figs. 4.9, 4.10 and 4.11). In
the 1.3 – 1.5 m horizon of T1 and 0.7 – 1.0 m horizon of T3, CaC03 content was 86.8 and
81.0 % respectively and quartz peak intensities also increased in these zones, and below,
in the CaCO3 free bulk samples that were analysed by XRD (Table 4.2). The hypothesis
arising from these observations is that silicification of groundwater calcretes has
occurred, albeit to different degrees in the three groundwater calcretes and is likely the
cause of significant induration in these horizons. Given the implementation of drainage
and recent period of declining rainfall, leading to the subsequent and continuing lowering
of groundwater (Chapter 2), silicification of these sediments may be an ongoing process
in this region.
4.4.2.4 Pedogenic calcretes
Soft white powdery carbonate nodules were found scattered throughout the profile in T3;
the CaCO3 content increases from 20 % in the surface, to >60 % in the 0.5 – 0.7 m zone.
The soil in T3 was black (dry colour 5Y 2.5/1) the white carbonate presented a stark
144
contrast. Due to its ubiquitous presence and soft powdery form, it is proposed that this
carbonate is of pedogenic origin. The isotope data recorded for this profile supports this
� ������ ��������������������~������18�������13C values among the carbonates indicate
highly evaporative conditions, a potential shift in vegetation types and increased inputs of
atmospheric CO2 which is consistent with the warm arid climate currently experienced in
this region.
4.4.3 Development of soil profiles
Given all of the information presented here, the variability among authigenic clay
minerals and carbonate types and their morphology are believed to be the result of
historic geological changes in the depositional basin and source waters of this region, in
addition to their current position in the landscape. Through our field observations, the
eastern side of the Avenue Plain predominantly featured soil profiles similar to T1
(Chromosols). In this profile there was a unique combination of minerals (detrital clays,
diatoms, feldspars) and distinct lack of CaC03 in the soil that overlies palustrine
limestones; the transition between these horizons was often abrupt.
These features suggest a significant change in hydrology and source of input waters
throughout this region since induration of the palustrine limestone occurred. Given the
geological and volcanic history of this region, groundwater levels would have
progressively dropped in association with the staged retreat of the ocean over the past
300 Ka (Huntley and Prescott 2001) and potentially is at least partly responsible for the
exposure of lacustrine sediments. The distinct interface between indurated palustrine
limestone and detrital alluvial materials may therefore represent a significant geological

145
event (such as uplift of the coastal plain and retreat of the ocean) that led to a change in
the hydrology of this interdunal plain, the sources and type of alluvial materials deposited
here and the residence time of water on the surface of the soil.
Stage I
Stage II
Stage III
Fig. 4.18 Diagram of three stages of deposition and alteration of lacustrine sediments in the USE of SA. The vertical dashed lines represent the zones of surface / ground water fluctuation during each of the stages.
This process is represented in Figure 4.18, whereby the sediments deposited during Stage
I were predominately lacustrine carbonates, marls and clays. When the areas of higher
topographical position became exposed (largely on the eastern side of the plains),
palustrine limestones formed through diagenetic and pedogenic alteration of the exposed
primary sediment.
Alluvial sediments and detrital clays
Palustrine limestone Lacustrine carbonates and clays
West
Avenue
East
Avenue
Clay and carbonate illuviation; lower EC and ESP (Profile T1)
Drying of Mg-rich clays. Increased EC and ESP through
evapo-concentration (ProfileT3)
Authigenic Mg-rich clays
Development of lunettes
Groundwater calcretes / silcretes develop

146
In Stage II it is proposed that the watertable retreated, facilitating the development of
lunettes and the further induration of exposed lacustrine sediments. It is well
documented that prevailing winds in this region were historically directed from the north-
west, which resulted in the formation of ‘lunettes’ on the Avenue Plain (Twidale et al.
1983). These localised, elevated crescentic ridges are composed of aeolian material
winnowed from the playa floors in areas where surface water inundation was prolonged
(Twidale et al. 1983). These features were documented and mapped by Blackburn (1952)
on the Avenue Plain and occur predominantly on the western side of the interdunal
corridors, due to their north-westerly gradient, and currently coincide with the areas that
feature soils similar to T3 (undulating, black, wet, poor plant cover, friable at the surface,
wide and deep cracks, absence of shallow palustrine limestone i.e. Vertosols). As a result
of these landscape features, the depressions that form on the windward side of the
lunettes and the natural drainage lines on the far western side of the plains rarely dry out
completely; the absence of palustrine limestone can be attributed to this factor, as these
areas do not undergo sub-aerial exposure and desiccation to the same extent as expected
for the sediments on the leeward side of the lunettes and across the flats. Mg-rich clays
are therefore precipitated in the zones with prolonged surface water inundation. The
alluvial materials subsequently transported into this area either remain stratified above
the palustrine limestones, or are incorporated into the unconsolidated zones that feature
Mg-rich clays.
In Stage III, the watertable retreats even further, exacerbated by European settlement
and the widespread implementation of artificial drainage. Salts are now leached from the
soils on the eastern side of the plain and those on the western side start to dry for the
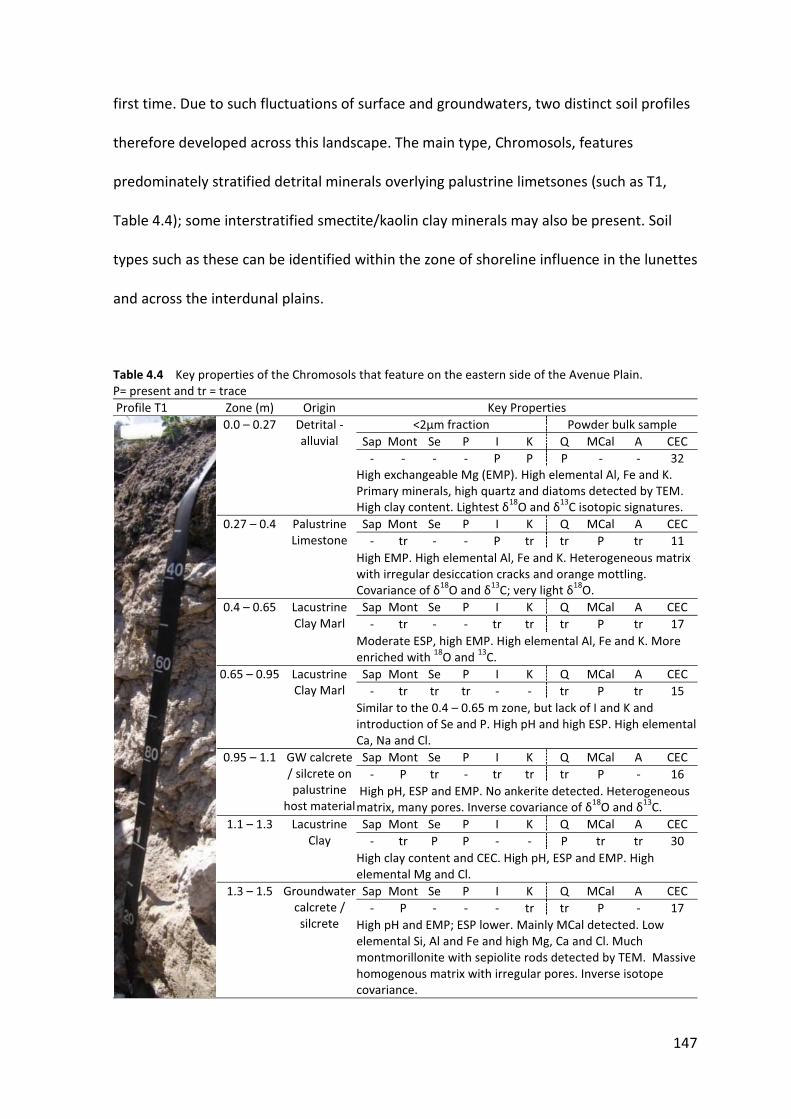
147
first time. Due to such fluctuations of surface and groundwaters, two distinct soil profiles
therefore developed across this landscape. The main type, Chromosols, features
predominately stratified detrital minerals overlying palustrine limetsones (such as T1,
Table 4.4); some interstratified smectite/kaolin clay minerals may also be present. Soil
types such as these can be identified within the zone of shoreline influence in the lunettes
and across the interdunal plains.
Table 4.4 Key properties of the Chromosols that feature on the eastern side of the Avenue Plain. P= present and tr = trace Profile T1 Zone (m) Origin Key Properties
0.0 – 0.27 Detrital - alluvial
<2μm fraction Powder bulk sample Sap Mont Se P I K Q MCal A CEC
- - - - P P P - - 32 High exchangeable Mg (EMP). High elemental Al, Fe and K. Primary minerals, high quartz and diatoms detected by TEM. ����������� �����������������18�������13C isotopic signatures.
0.27 – 0.4 Palustrine Limestone
Sap Mont Se P I K Q MCal A CEC - tr - - P tr tr P tr 11
High EMP. High elemental Al, Fe and K. Heterogeneous matrix with irregular desiccation cracks and orange mottling. � ~�������� ���18�������13���~�����������18O.
0.4 – 0.65 Lacustrine Clay Marl
Sap Mont Se P I K Q MCal A CEC - tr - - tr tr tr P tr 17
Moderate ESP, high EMP. High elemental Al, Fe and K. More enriched with 18O and 13C.
0.65 – 0.95 Lacustrine Clay Marl
Sap Mont Se P I K Q MCal A CEC - tr tr tr - - tr P tr 15
Similar to the 0.4 – 0.65 m zone, but lack of I and K and introduction of Se and P. High pH and high ESP. High elemental Ca, Na and Cl.
0.95 – 1.1 GW calcrete / silcrete on palustrine
host material
Sap Mont Se P I K Q MCal A CEC - P tr - tr tr tr P - 16
High pH, ESP and EMP. No ankerite detected. Heterogeneous �������������� �������~������ ~�������� ���18�������13C.
1.1 – 1.3 Lacustrine Clay
Sap Mont Se P I K Q MCal A CEC - tr P P - - P tr tr 30
High clay content and CEC. High pH, ESP and EMP. High elemental Mg and Cl.
1.3 – 1.5 Groundwater calcrete / silcrete
Sap Mont Se P I K Q MCal A CEC - P - - - tr tr P - 17
High pH and EMP; ESP lower. Mainly MCal detected. Low elemental Si, Al and Fe and high Mg, Ca and Cl. Much montmorillonite with sepiolite rods detected by TEM. Massive homogenous matrix with irregular pores. Inverse isotope covariance.
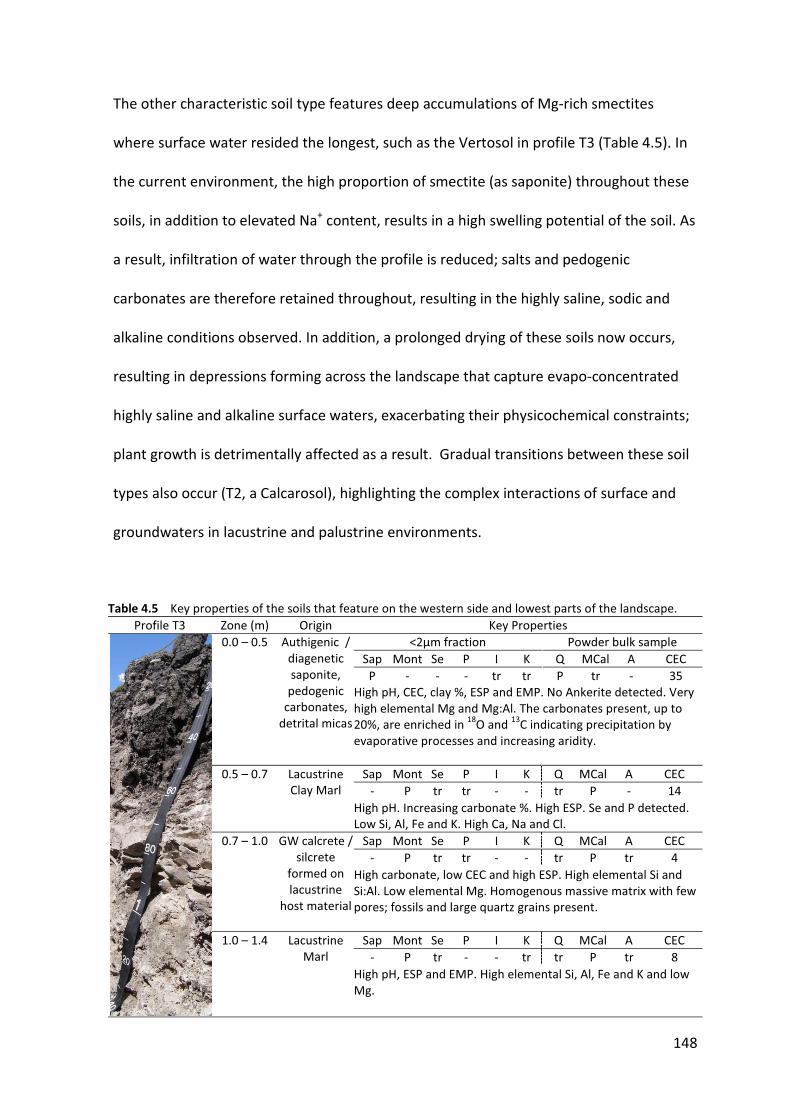
148
The other characteristic soil type features deep accumulations of Mg-rich smectites
where surface water resided the longest, such as the Vertosol in profile T3 (Table 4.5). In
the current environment, the high proportion of smectite (as saponite) throughout these
soils, in addition to elevated Na+ content, results in a high swelling potential of the soil. As
a result, infiltration of water through the profile is reduced; salts and pedogenic
carbonates are therefore retained throughout, resulting in the highly saline, sodic and
alkaline conditions observed. In addition, a prolonged drying of these soils now occurs,
resulting in depressions forming across the landscape that capture evapo-concentrated
highly saline and alkaline surface waters, exacerbating their physicochemical constraints;
plant growth is detrimentally affected as a result. Gradual transitions between these soil
types also occur (T2, a Calcarosol), highlighting the complex interactions of surface and
groundwaters in lacustrine and palustrine environments.
Table 4.5 Key properties of the soils that feature on the western side and lowest parts of the landscape. Profile T3 Zone (m) Origin Key Properties
0.0 – 0.5 Authigenic / diagenetic saponite,
pedogenic carbonates,
detrital micas
<2μm fraction Powder bulk sample Sap Mont Se P I K Q MCal A CEC
P - - - tr tr P tr - 35 High pH, CEC, clay %, ESP and EMP. No Ankerite detected. Very high elemental Mg and Mg:Al. The carbonates present, up to 20%, are enriched in 18O and 13C indicating precipitation by evaporative processes and increasing aridity.
0.5 – 0.7 Lacustrine Clay Marl
Sap Mont Se P I K Q MCal A CEC - P tr tr - - tr P - 14
High pH. Increasing carbonate %. High ESP. Se and P detected. Low Si, Al, Fe and K. High Ca, Na and Cl.
0.7 – 1.0 GW calcrete / silcrete
formed on lacustrine
host material
Sap Mont Se P I K Q MCal A CEC - P tr tr - - tr P tr 4
High carbonate, low CEC and high ESP. High elemental Si and Si:Al. Low elemental Mg. Homogenous massive matrix with few pores; fossils and large quartz grains present.
1.0 – 1.4 Lacustrine
Marl Sap Mont Se P I K Q MCal A CEC
- P tr - - tr tr P tr 8 High pH, ESP and EMP. High elemental Si, Al, Fe and K and low Mg.

149
These conclusions, however, do not entirely concur with those of previous studies
(Blackburn 1952; Norrish and Rogers 1956; Blackburn et al. 1965; Blackburn 1983) that
mostly reported the soils in this landscape to be derived from the underlying parent
material. In contrast, some of the minerals found here, such as sepiolite and palygorskite,
are primary precipitates, whereas illite and kaolinite are most likely detrital components
of the soil. Nonetheless, saponite may be an authigenic mineral. In addition, the dense
capping that was intercepted at the interface of the surface soil and underlying
limestones reported by previous authors (Blackburn et al. 1965) may in fact have been
the product of palustrine alteration and induration, in addition to secondary carbonate
accumulation.
4.5 CONCLUSION
Poor plant growth observed across isolated areas of this region is primarily the result of
the mineralogy of the underlying soils. Whereas illite and kaolinite clay minerals are
detrital in origin, the Mg-rich clay minerals: saponite, sepiolite and palygorskite, are
authigenic minerals. These minerals formed either through direct precipitation from
continental solutions and/or diagenesis, their formation and stability being related to the
position in the landscape and subsequently the degree of sub aerial exposure of
lacustrine sediments. In the zones that did not historically undergo a high degree of
subaerial exposure and diagenesis (the western side of the plains), saponite is the
dominant mineral present and shallow palustrine limestone is absent. There is however
up to 20% pedogenic calcrete scattered throughout this soil type. The presence of
saponite along with environmental solutions rich in NaCl, leads to high swelling in the
clays when wet. This creates soils that have a low leaching capacity and the salts of Na
150
and Ca are seen to accumulate throughout the profile. The topographical depressions
created during the drying of these soil types results in evapo-concentrated surface waters
accumulating in these soil types after periods of drying, intensifying the saline and sodic
conditions. These soils subsequently became highly alkaline, highly saline and strongly
sodic, adversely affecting plant growth.
In contrast, in the portion of the landscape that underwent the greatest degree of
subaerial exposure (the eastern side of the plains), induration of palustrine limestone
occurred which led to the stratification and preservation of detrital minerals. These soil
types now support good plant growth as salts are more readily leached through the
profile; in addition, the indurated horizons act as a barrier to capillary rise of saline
groundwater from below. Due to deep drainage in this region and the lower position of
the water table, some soils now support better plant growth than observed previously.
From these observations, it is concluded that the carbonates across this landscape are of
lacustrine, palustrine, pedogenic and groundwater origin and are not simply clay and
carbonate species formed on lacustrine parent materials, as once thought. Complex
interactions exist within this landscape between the carbonate and clay species; both
distinct and gradual boundaries between the types are observed across very small scales,
reflecting this complexity.

151
4.6 REFERENCE LIST
Abdul - Latif N, Weaver CE (1969) Kinetics and acid - dissolution of palygorskite (attapulgite) and sepiolite. Clays and Clay Minerals 17, 169 - 178. Akbulut A, Kadir S (2003). The geology and origin of sepiolite, palygorskite and saponite in Neogene lacustrine sediments of the Serinhisar-Acipayam basin, SW Turkey. Clays and Clay Minerals 51, 279-292. Alonso-Zarza AM (2003). Palaeoenvironmental significance of palustrine carbonates and calcretes in the geological record. Earth-Science Reviews 60, 261-298. Alonso-Zarza AM, Wright VP (2010a). Palustrine Carbonates. In 'Carbonates in Continental Settings: Facies, Environments and Processes'. Eds A. M. Alonso-Zarza and L. H. Tanner. 103 - 131. Elsevier: Amsterdam. Alonso-Zarza AM, Wright VP (2010b). Calcretes. In 'Carbonates in Continental Settings: Facies, Environments and Processes'. Eds A. M. Alonso-Zarza and L. H. Tanner. 225 - 267. Elsevier: Amsterdam. Blackburn G (1952). The Soils of the Kingston-Avenue Drainage Area, South Australia. CSIRO Division of Soils, Melbourne. Blackburn G (1983). Soils. In 'Natural history of the South East'. Eds M.J. Tyler, C.R. Twidale, J.K. Ling and J.W. Holmes. 39-48. Royal Society of South Australia Inc: Adelaide, SA. Blackburn G, Ludbrook NH, Clarke ARP, Bond RD (1965). 'Soil development associated with stranded beach ridges in south-east South Australia'. CSIRO: Melbourne. Borchardt G (1989). Smectites. In 'Minerals in Soil Environments'. Eds J. B. Dixon and S. B. Weed. 675 - 727. Soil Science Society of America: Madison, USA. Bustillo M (2010). Silicification of Continental Carbonates. In 'Carbonates in Continental Settings'. Eds A. M. Alonso Zarza and L. H. Tanner. 153 - 174. Elsevier: Amsterdam. Bustillo MA, Alonso-Zarza AM (2007). Overlapping of pedogenesis and meteoric diagenesis in distal alluvial and shallow lacustrine deposits in the Madrid Miocene Basin, Spain. Sedimentary Geology 198, 255-271. Churchman GJ (2000). The alteration and formation of soil minerals by weathering. In 'Handbook of soil science'. Ed M E Sumner. CRC Press: Boca Raton, USA. Churchman GJ, Slade PG, Self PG, Janik PG (1994). Nature of Interstratified Kaolin-smectites in some Australian soils. Australian Journal of Soil Research 32, 805 - 822.
152
Craig H (1957). Isotopic standards for carbon and oxygen and correction factors for mass-spectrometric analysis of carbon dioxide. Geochimica et Cosmochimica Acta 12, 133-149. Deocampo DC (2010). The Geochemistry of continental carbonates. In 'Carbonates in continental settings: Geochemistry, Diagenesis and Applications'. Eds A. M. Alonso-Zarza and L. H. Tanner. 1 - 59. Elsevier: Amsterdam. Fanning DV, Keramidas VZ (1977). Micas. In 'Minerals in Soil Environments'. Eds J. B. Dixon and S. B. Weed. 195-258. Soil Science Society of America: Madison, Wisconsin, USA. Firman JB (1973). 'Regional stratigraphy of surficial deposits in the Murray Basin and Gambier Embayment'. A. B. James, Govt. Printer: Adelaide. Freytet P, Verrecchia EP (2002). Lacustrine and palustrine carbonate petrography: an overview. Journal of Paleolimnology 27, 221-237. Furquim SAC, Graham RC, Barbiero L, Queiroz Neto JP, Vidal-Torrado P (2010). Soil mineral genesis and distribution in a saline landscape of the Pantanal Wetland, Brazil. Geoderma 154, 518 - 528. Gee GW, Bauder JW (1986). Particle-size Analysis. In 'Methods of Soil Analysis. Part 1'. Eds A Klute. 383 - 411. American Society of Agronomy Inc: Madison, WI, USA. Gierlowski-Kordesch EH (2010). Lacustrine Carbonates. In 'Carbonates in Continental Settings: Facies, Environments and Processes'. Eds A. M. Alonso-Zarza and L. H. Tanner. 2 - 101. Elsevier: Amsterdam. Giles JB (1960). Trace element profiles of some ground-water rendzina and terra rossa soils from County Grey, South Australia. CSIRO Australian Division of Soils. Divisional report 9/60, Melbourne. Halverson G (2008). Introduction to Stable Isotope Geochemistry (unpublished lecture notes). Adelaide, SA, The University of Adelaide. Holmes JW, Waterhouse JD (1983). Hydrology. In 'Natural History of the South East'. Eds M.J. Tyler, C.R. Twidale, J.K. Ling and J.W. Holmes. 49 - 59. Royal Society of South Australia Inc: Adelaide. Huntley DJ, Prescott JR (2001). Improved methodology and new thermoluminescence ages for the dune sequence in south-east South Australia. Quaternary Science Reviews 20, 687-699. Krull ES, Bestland EA, Skjemstad JO, Parr ����@@������ ������������13����15N, 13C NMR) and residence times (14C and OSL) of soil organic matter from Red-brown earths of South Australia: Implications for soil genesis. Geoderma 132, 344-360.
153
Leguey S, Ruiz De Leon D, Ruiz AI, Cuevas J (2010). The role of biomineralization in the origin of sepiolite and dolomite. American Journal of Science 310, 165 - 193. Leier A, Quade J, DeCelles P, Kapp P (2009). Stable isotopic results from paleosol carbonate in South Asia: Paleoenvironmental reconstructions and selective alteration. Earth and Planetary Science Letters 279, 242-254. Marshall CE (1964). The physical chemistry and mineralogy of soils. In 'Soil Materials'. Eds John Wiley & Sons. New York. Murray-Wallace CV, Belperio AP, Bourman RP, Cann JH, Price DM (1999). Facies architecture of a last interglacial barrier: a model for Quaternary barrier development from the Coorong to Mount Gambier Coastal Plain, southeastern Australia. Marine Geology 158, 177-195. Neaman A, Singer A (2004). The effects of palygorskite on chemical and physico-chemical properties of soils: A review. Geoderma 123, 297-303. Norrish K, Hutton JT (1969). An accurate X-ray spectrographic method for the analysis of a wide range of geological samples. Geochimica et Cosmochimica Acta 33, 431 - 453. Norrish K, Pickering JG (1983). Clay Minerals. In 'Soils: an Australian viewpoint'. Eds Division of Soils CSIRO. 281 - 308. CSIRO: Melbourne. Norrish K, Rogers LER (1956). The mineralogy of some Terra Rossas and Rendzinas of South Australia. Journal of Soil Science 7, 294 - 391 Pontifex IR (2010). Mineralogical Report No. 9693. Adelaide. Schwebel DA (1983). Quaternary Dune Systems. In 'Natural History of the South East'. Eds M. J. Tyler, C.R. Twidale, J.K. Ling and J.W. Holmes. 15 - 24. Royal Society of South Australia: Adelaide. Singer A (1974). Pedogenic palygorskite occurences in Australia. American Mineralogist 59, 508 - 517. Singer A (2002). Palygorskite and Sepiolite. In 'Soil Mineralogy with Environmental Applications'. Eds Soil Science Society of America. 555-571. SSSA: Madison, WI, USA. Tanner LH (2010). Continental Carbonates as Indicators of Paleoclimate. In 'Carbonates in Continental Settings: Geochemistry, diagenesis and applications'. Eds A. M. Alonso Zarza and L. H. Tanner. Elsevier: Amsterdam. Torres-Ruiz J, Lopez-Galindo A, Gonzalez-Lopez JM, Delgado A (1994). Geochemistry of Spanish sepiolite-palygorskite deposits: Genetic considerations based on trace elements and isotopes. Chemical Geology 112, 221 - 245.

154
Twidale CR, Campbell EM, Bourne JA (1983). Granite forms, Karst and Lunettes. In 'Natural History of the South East'. Eds J. Tyler, C.R. Twidale, J.K. Ling and J.W. Holmes. 25 - 37. Royal Society of South Australia: Adelaide. Yeniyol M (2007). Characterisation of a Mg-rich and low-charge saponite from the Neogene lacustrine basin of Eskisehir, Turkey. Clay Minerals 42, 541 - 548. Zhou J, Chafetz HS (2010). Pedogenic carbonates in Texas: Stable-isotope distributions and their implications for reconstructing region-wide paleoenvironments. Journal of Sedimentary Research 80, 137 - 150.
155
CHAPTER 5
ON-FARM RESEARCH IMPROVES FARMER KNOWLEDGE AND FACILITATES CHANGE
5.1 INTRODUCTION
In Australia and world-wide, the principles and practices of rural extension are often
employed to communicate the outcomes of agricultural research and development. The
goals of agricultural extension include the transfer of technology from researchers to
farmers, advising farmers in their decision making and educating farmers on how to make
better decisions, enabling them to clarify their own goals and possibilities and stimulating
desirable agricultural developments (Anderson and Feder 2003). More specifically, the
transfer of technology involves shifting new technical knowledge, ideas, inventions,
services and products from the place of their creation, to where they can be put into use
(Guerin 2000). Technology adoption is the application of this transferred knowledge and
should be the main objective of applied agricultural research. The resultant adoption of
technology, however, is governed by the research agency’s ability to change or influence
a farmer’s knowledge, skills, aspirations and practices, thereby building their capacity,
and is vital for the continued development of sustainable agricultural enterprise. The
processes employed for transfer of technology (ToT) from researcher to farmer are
therefore crucial for adoption to occur. The major emphasis of ToT, however, is on the
one-way transfer of knowledge and technology from research institutions through
extension to farmers and therefore contains some inherent limitations to uptake
(Christodoulou 2000). The primary limitation is that the information and technology are
156
developed by the research institutions and often delivered as generic products, without
considering that the farmer can also contribute to the development of knowledge and
technology. The information generated by such research therefore is often not site-or
problem-specific and the researcher may not have a thorough understanding of the
barriers to implementation within the farming system (economic, social, environmental),
resulting in minimal uptake. Participatory research, in contrast, is a mechanism that can
help catalyse the generation of new innovation in collaboration with farmers that is
necessary for the sustainable development of Australian agriculture (Christodoulou 2000).
Research conducted on-farm is one participatory method that can be utilised to
investigate local problems while also building relationships. On-farm research (OFR)
encourages two-way knowledge sharing and learning between researchers and farmers
to help them make better decisions (Lawrence et al. 2007). OFR sites can become the
meeting place for local growers to learn about a problem, discuss their own experiences
and help to identify solutions and lines of investigation. The farmer can provide the
researcher with the context to the problem and the limitations or opportunities of their
farming system and the researcher can design OFR with relevance and rigour, enabling all
parties to reach the desired outcome (Lawrence et al. 2007).
In 2005 a research project was initiated between the University of Adelaide and the
Keilira Farm Management Group (KFMG) to determine whether soil physicochemical
constraints were responsible for an observed decline in plant growth on their farms. The
project aim was to establish if the soils were affected by salinity and sodicity and if
artificial drainage was affecting the expression of these constraints. To complement this
157
research the local salt-land agronomist from the South East Natural Resource
Management Board (SENRM), Mr Jack England, also conducted OFR, with a range of
pasture species and gypsum application rates trialled. Our joint objective therefore was to
help the growers understand not only what the problem was, but also how to manage it
in their environment. The incorporation of an extension component into the project
therefore seemed crucial if we were to meet this objective. One of the hypotheses for the
project, therefore, was that farmer knowledge of the problem, and how to manage it,
could be improved.
5.2 METHODS AND ACTIVITIES
On-farm research was conducted on three properties initially, named South, Central and
North, and was subsequently concentrated solely on the South site. The farmers at each
site contributed to the selection of affected sites and provided valuable insight about land
management history and catchment hydrology. At each site, the agronomist assessed a
range of gypsum application rates and pasture species that were planted for
demonstration and redox probes were also installed in particularly degraded soils. Trench
excavation and soil sampling, analysis and interpretation was provided by the University.
Extension and communication activities associated with the project were conducted with
the KFMG, local consultants and the general public and included field walks at the three
OFR sites in September 2005 and June 2006 and again at the South site in November 2007
(Table 5.1).
In order to test the hypothesis that farmer knowledge of the problem and how to manage
it could be improved, a comprehensive evaluation was conducted with the three key
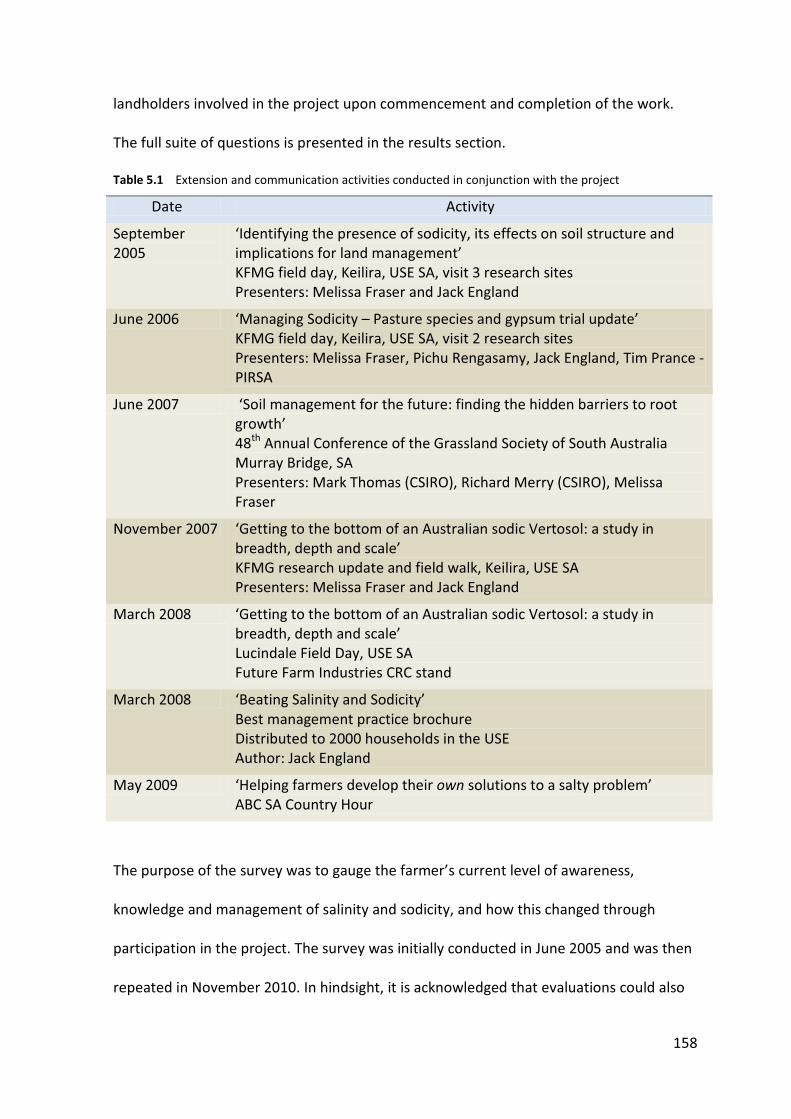
158
landholders involved in the project upon commencement and completion of the work.
The full suite of questions is presented in the results section.
Table 5.1 Extension and communication activities conducted in conjunction with the project
Date Activity
September 2005
‘Identifying the presence of sodicity, its effects on soil structure and implications for land management’ KFMG field day, Keilira, USE SA, visit 3 research sites Presenters: Melissa Fraser and Jack England
June 2006 ‘Managing Sodicity – Pasture species and gypsum trial update’ KFMG field day, Keilira, USE SA, visit 2 research sites Presenters: Melissa Fraser, Pichu Rengasamy, Jack England, Tim Prance -PIRSA
June 2007 ‘Soil management for the future: finding the hidden barriers to root growth’ 48th Annual Conference of the Grassland Society of South Australia Murray Bridge, SA Presenters: Mark Thomas (CSIRO), Richard Merry (CSIRO), Melissa Fraser
November 2007 ‘Getting to the bottom of an Australian sodic Vertosol: a study in breadth, depth and scale’ KFMG research update and field walk, Keilira, USE SA Presenters: Melissa Fraser and Jack England
March 2008 ‘Getting to the bottom of an Australian sodic Vertosol: a study in breadth, depth and scale’ Lucindale Field Day, USE SA Future Farm Industries CRC stand
March 2008 ‘Beating Salinity and Sodicity’ Best management practice brochure Distributed to 2000 households in the USE Author: Jack England
May 2009 ‘Helping farmers develop their own solutions to a salty problem’ ABC SA Country Hour
The purpose of the survey was to gauge the farmer’s current level of awareness,
knowledge and management of salinity and sodicity, and how this changed through
participation in the project. The survey was initially conducted in June 2005 and was then
repeated in November 2010. In hindsight, it is acknowledged that evaluations could also

159
have been conducted with participants attending each of the extension activities (field
days etc.), but this unfortunately was not done. The results gleaned from the farmers
involved with the project have been presented anonymously and are referred to as
Farmer 1, Farmer 2 and Farmer 3 for this purpose. In some cases their direct responses to
the survey questions, as recorded by them, have been presented here.
5.3 RESULTS AND DISCUSSION
The three farmers were first asked a series of questions in the surveys to gauge their
understanding of salinity and sodicity and how this had changed from 2005 to 2010,
ranking their responses accordingly as very low, low, moderate, high and very high. A
series of statements were also presented upon completion of the project, with the
farmers stating how strongly they agreed or disagreed with these (strongly disagree,
disagree, neither agree nor disagree, agree and strongly agree). In addition, a set of
questions to assess current management and amelioration strategies and how these had
changed throughout the life of the project were also asked. The effectiveness of the
extension and communication methods was also determined. The results from the
surveys are presented in the following sections: Knowledge of salinity and sodicity;
Management practices, productivity and sustainability; Community perception and the
drainage schemes; and On-farm research and extension methods.
5.3.1 Knowledge of salinity and sodicity
Whereas all of the farmers rated their understanding of salinity and sodicity as moderate
to high at the outset and completion of the project, every farmer also agreed/strongly
agreed that participation in this project had increased their knowledge of these
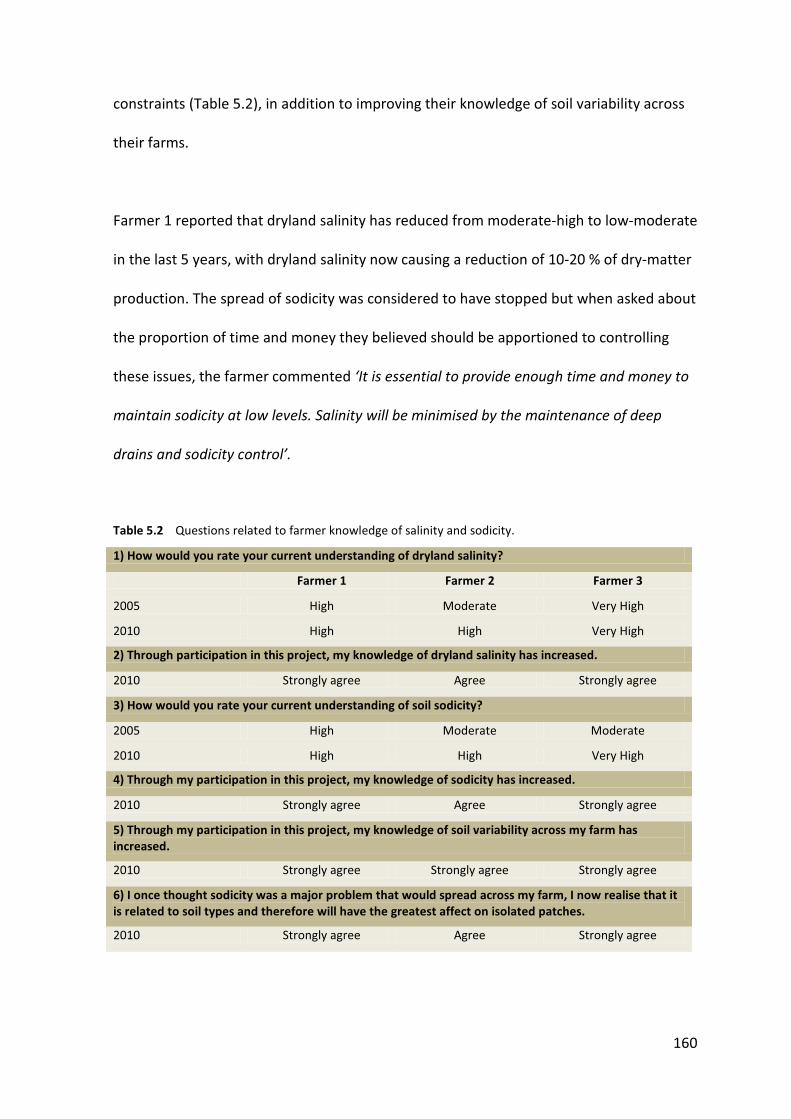
160
constraints (Table 5.2), in addition to improving their knowledge of soil variability across
their farms.
Farmer 1 reported that dryland salinity has reduced from moderate-high to low-moderate
in the last 5 years, with dryland salinity now causing a reduction of 10-20 % of dry-matter
production. The spread of sodicity was considered to have stopped but when asked about
the proportion of time and money they believed should be apportioned to controlling
these issues, the farmer commented ‘It is essential to provide enough time and money to
maintain sodicity at low levels. Salinity will be minimised by the maintenance of deep
drains and sodicity control’.
Table 5.2 Questions related to farmer knowledge of salinity and sodicity.
1) How would you rate your current understanding of dryland salinity?
Farmer 1 Farmer 2 Farmer 3
2005 High Moderate Very High
2010 High High Very High
2) Through participation in this project, my knowledge of dryland salinity has increased.
2010 Strongly agree Agree Strongly agree
3) How would you rate your current understanding of soil sodicity?
2005 High Moderate Moderate
2010 High High Very High
4) Through my participation in this project, my knowledge of sodicity has increased.
2010 Strongly agree Agree Strongly agree
5) Through my participation in this project, my knowledge of soil variability across my farm has increased.
2010 Strongly agree Strongly agree Strongly agree
6) I once thought sodicity was a major problem that would spread across my farm, I now realise that it is related to soil types and therefore will have the greatest affect on isolated patches.
2010 Strongly agree Agree Strongly agree
161
Farmer 2 reported that salinity affected approximately 30 % of their farm in 2005, but
that this area had not increased in the following 5 years; according to the farmer this was
probably brought about by successive years of drought and the natural lowering of
groundwater levels. Sodicity was also believed to exist in patches on the western side of
this farm in 2005, but at the time the farmer was not sure of the extent or if the problem
would spread. In 2010, however, he reported that sodicity was restricted to isolated
specific areas and had not spread across their farm as once feared, adding ‘the patches
become more conspicuous with grazing, and especially so when cattle pug those areas up.
The major effect of salinity and sodicity is to limit the range of pasture species that can be
grown and to reduce the length of the growing season’.
In 2005, Farmer 3, reported that salinity was restricting pasture growth on approximately
20% of their property and felt that sodicity was spreading dramatically. Through
involvement in this project and the conduct of OFR, the farmer commented that salinity
and sodicity are most prominent in the soils that do not have a shallow indurated
limestone horizon and that pasture productivity is severely affected in these areas.
Farmer 3 also added: ‘It will take many more years to ameliorate the bad saline sodic
patches and it is uneconomic to do so. We have focussed on establishing perennial
pastures on the rest of our property as they have been extremely profitable and will also
reduce the onset of sodic soils in other susceptible areas. The areas of sodicity are getting
bigger in other paddocks’.
The responses and observations made by each of the farmers confirm that their
knowledge of the interactions between salinity, sodicity and soil variability has been

162
improved through involvement in this project. Furthermore, the knowledge gained has
improved their capacity to identify these constraints on their farms and to understand the
resultant effects to soil health and pasture productivity and longevity.
5.3.2 Management practices, production and sustainability
In a set of questions asked about management practices, productivity and sustainability it
became evident that the new knowledge gained about salinity, sodicity, soil variability
and the benefits of perennial pastures had led to management and practice change on
the three farms (Table 5.3). At the outset of the project, the farmers were asked to
identify their objectives for farm management (question 10 a, b and c, Table 5.3).
Involvement in the project enabled the farmers to meet many of these objectives. The
establishment of perennial pasture species, application of gypsum or variations in gypsum
application rates and grazing/pasture practices were the most commonly reported
changes in management that resulted in meeting these objectives. The implementation of
these practices resulted in a perceived increase in productivity on tow out of three of the
properties, with Farmer 2 reporting that drought conditions in 2006 and 2007, followed
by significant inundation in 2009 resulted in pasture productivity remaining the same.
The increase in productivity is attributed to the establishment of summer active
perennials that capitalise on summer rainfall, prolonging the availability of green feed.
Each of the farmers also agreed that the sustainability of their enterprises had increased
as a result of participation in the project. Economically, it was noted that the increased
feed availability resulted in higher profitability as the need to source off-farm
supplemental feed is reduced. Environmentally it was recognised that soil health is
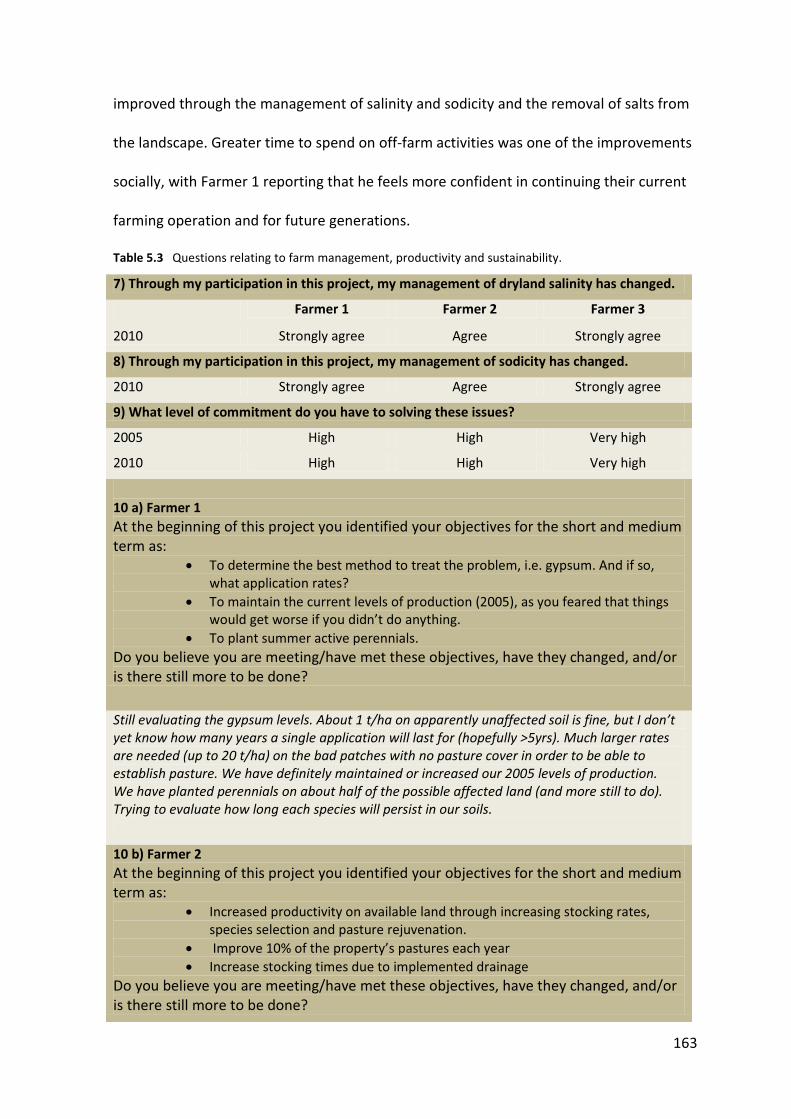
163
improved through the management of salinity and sodicity and the removal of salts from
the landscape. Greater time to spend on off-farm activities was one of the improvements
socially, with Farmer 1 reporting that he feels more confident in continuing their current
farming operation and for future generations.
Table 5.3 Questions relating to farm management, productivity and sustainability.
7) Through my participation in this project, my management of dryland salinity has changed.
Farmer 1 Farmer 2 Farmer 3
2010 Strongly agree Agree Strongly agree
8) Through my participation in this project, my management of sodicity has changed.
2010 Strongly agree Agree Strongly agree
9) What level of commitment do you have to solving these issues?
2005 High High Very high
2010 High High Very high
10 a) Farmer 1 At the beginning of this project you identified your objectives for the short and medium term as:
� To determine the best method to treat the problem, i.e. gypsum. And if so, what application rates?
� To maintain the current levels of production (2005), as you feared that things would get worse if you didn’t do anything.
� To plant summer active perennials. Do you believe you are meeting/have met these objectives, have they changed, and/or is there still more to be done?
Still evaluating the gypsum levels. About 1 t/ha on apparently unaffected soil is fine, but I don’t yet know how many years a single application will last for (hopefully >5yrs). Much larger rates are needed (up to 20 t/ha) on the bad patches with no pasture cover in order to be able to establish pasture. We have definitely maintained or increased our 2005 levels of production. We have planted perennials on about half of the possible affected land (and more still to do). Trying to evaluate how long each species will persist in our soils.
10 b) Farmer 2 At the beginning of this project you identified your objectives for the short and medium term as:
� Increased productivity on available land through increasing stocking rates, species selection and pasture rejuvenation.
� Improve 10% of the property’s pastures each year � Increase stocking times due to implemented drainage
Do you believe you are meeting/have met these objectives, have they changed, and/or is there still more to be done?

164
I still think that these provide the basis of our objectives; they have at times been varied due to tough seasonal conditions etc. I would also add that we are placing a higher emphasis on sustainable grazing. Increased internal fencing/paddock subdivision to allow better grazing pressure where they graze for less time before moving, rather than set-stocking.
10 c) Farmer 3 At the beginning of this project you identified your objectives for the short and medium term as:
� 12 months: identify good pasture species for affected areas � 2 years: persistence of those species and increased stocking rates � 5 and 10 years: soils stabilised and sodicity being managed. Regular soil tests to
check for further amendments required. Do you believe you are meeting/have met these objectives, have they changed, and/or is there still more to be done?
First two objectives met. Problem with third is that it is very costly to ameliorate the sodic soils. We have found that if 2.5 t/ha of gypsum is added at sowing time that most of the pasture species in our perennial composition have colonised the bad patches. Cattle are excluded for the first year and while these areas fail to produce even quarter as much as the surrounding good areas, this is better than what was previously there. Cattle simply need to be excluded in the winter time so they don’t mash the living perennials. No more work needs to be done.
11) What amelioration techniques are you currently using for salinity and sodicity and has this changed in the last 5 years?
Farmer 1:
� Gypsum and perennials. � Also trying to maintain soil cover on annual pasture land until
mid – late autumn. � Have had the same policy in place for at least the last 3 to 4
years.
Farmer 2: � Try to maintain adequate ground cover in sodic areas until well into autumn.
� Less set stocking. � Maintain our annual fertiliser program of 75 – 100 kg/ha of
single P super. � A ground water drain has now been dug across our farm.
Farmer 3: � Nothing has changed except we are not putting as much gypsum out on the worst saline/sodic patches but would rather use the funds to establish more perennial ground cover.
12) Has your cropping/grazing program changed in the last 5 years? If so, how, and was this due to your direct involvement in the project?
Farmer 1:
� Yes. � Planting summer perennials in increased levels. � Grazing management has been altered to try to manage
perennials to best suit production and longevity of stands.
165
Farmer 2: � More rotational type grazing i.e. large mob sizes with less time being spent in each paddock. However, as with all systems I have learned that it is important to be flexible and adaptable according to seasonal and environmental conditions.
� This change is due partially to what I have learned with sodic soils not being left bare, leaving pasture residue to reduce soil damage.
Farmer 3: � It hasn’t. We were already cleaning up grass and broadleaf weeds with a cropping rotation before sowing perennials. We have, however, stopped using perennial herbs in our pasture mix as they provide too much competition to sensitive perennial grasses during establishment and then doesn’t last/ remain productive for more than 5 years.
� The perennial herbs have been replaced with tall fescue which will grow if the Lucerne drowns in a wet year. The perennial pastures pay for the establishment cost in the first year and then increased production by up to $500/ha if 2-3 inches of summer rain is received (which has now happened in the last 4 years).
13) How has your productivity changed in the last 5 years as a result of these management changes?
Farmer 1:
� Considerably better due to green feed from perennials in summer/autumn, but still nearly the same winter production as before we planted perennials.
� Possibly the economic value is greater than the dry matter increase due to pastures of top quality being available to fill the ‘feed gap’ in an annual system.
Farmer 2: � Productivity is probably the same which is put down to a few poor seasons (2006/07 drought) and massive winter inundation that killed pastures July – late October in 2009 (the property was not yet drained).
Farmer 3: � Depends on summer rain. On average, DSE’s have increased from 10 to 19 and have even further increased with opportunistic grazing during summer rainfall events. Not only have stocking rates increased significantly, stock are not being supplementary fed and they are putting weight on where they otherwise wouldn’t on annual pastures.
14) Has this project helped to increase your triple bottom line sustainability (economic, social, environmental), and if so, how?
Farmer 1:
� Yes. � Definite improvement in economics of farm. � I believe a definite improvement in environmental sustainability,
but also think 5 yrs is way too short a time span for good evaluation. I think another 20 years is needed for proof.
� Socially? I feel much better in my ability to continue farming here and future generations and hope my efforts have helped
166
others see and attend to their problems.
Farmer 2: � Yes. It has given me a greater education and awareness of what salinity and sodicity are doing to our flats.
� At this stage I don’t know how to quantify or measure these, but now, post-drainage, I hope that this will be more significant as we hope to improve our overall grazing system.
Farmer 3: � Definitely. The environment wins with salts being removed by the drains which allows for perennial ground cover. The plants with deeper roots use more water to a greater depth which not only increases production significantly (especially with summer rainfall), it provides a bigger “water sponge” for the winter rainfall in the following years. More water for plant growth with less osmotic pressure equals more pasture = more money.
� Social life has improved as I can go to the pub instead of feeding weaner lambs on annual pastures. Lucerne provides out of season green feed. More time to socialise or do more work is more productive.
5.3.3 On-farm research and extension methods
The results of soil chemistry, gypsum applications and perennial pasture assessments
were primarily communicated through the conduct of field-walks/days and with the
distribution of written material. All of the farmers strongly agreed that the combination
of applied on-farm research and practical field-walks was beneficial to their learning.
Touring other properties, having scientists on hand, conducting on farm trials and having
an active Farmer group were also reportedly beneficial to helping the farmers investigate
and solve problems on their own farms. Jack England is now a local Keilira farmer himself,
and although no longer officially employed as the Salt-land Agronomist, he is still a key
contact for these farmers, in addition to staff from Primary Industries and Resources SA
(PIRSA) and the South Australian Research and Development Institute (SARDI) and other
local Agronomists.
167
Table 5.5 Evaluation of the methods used for research and extension of project outcomes.
19) The combination of applied on-farm research with practical field-walks and field-days was beneficial to my learning.
Farmer 1 Farmer 2 Farmer 3
2010 Strongly agree Strongly agree Strongly agree
20) Universities and other research institutions should make more effort to extend their research outcomes to farmers, and conduct more research on-farm.
2010 Agree Agree Strongly agree
21) What level of support do you believe is available for helping to solve these issues?
2005 Moderate High Moderate
2010 Moderate High High
22) In relation to this project, what approaches/activities do you believe helped in solving/exploring these problems?
Farmer 1:
� Farm tours of neighbouring properties with the same problems helped. � On-farm experiments with gypsum trials at 0 – 10 t/ha plus planting
perennials in association with expert advice from soil scientists.
Farmer 2: � An active farm management group. � Externally funded plot and paddock sized demonstrations. � Farm tours / workshops and having access on such days to experts in
geology, soils in the South East, plant experts etc all combine to bounce theories/ideas off each other.
� Postgraduate student passionate about their field of study – that find supportive theories to the local peculiarities that define our region.
Farmer 3: � Gypsum trials in conjunction with pasture species trials. � Redox electrodes which really identified the lack of ideal growing
conditions combined with soil testing and ground penetration radar all helped with the overall understanding.
� Having a PhD student really kicked things along as well.
23) How much do you think the field trials on yours and neighbouring properties have influenced your decision making and management of salinity and sodicity?
Farmer 1:
� Very big influence – to my knowledge the advice we got was not available readily by other avenues.
Farmer 2: � 100%
Farmer 3: � We had already started to sow perennials prior to the project but after the completion of the project and seeing the production figures of the perennials we were much more confident in striving ahead with sowing more. We are still cautious about a wet winter which is why varying pasture species have been selected. Lots of neighbours are now attempting to do the same thing as us which gives me confidence to keep going.
24) Who is currently your preferred contact to help you solve problems on your property?
Farmer 1: � PIRSA pasture agronomist and local agronomist.
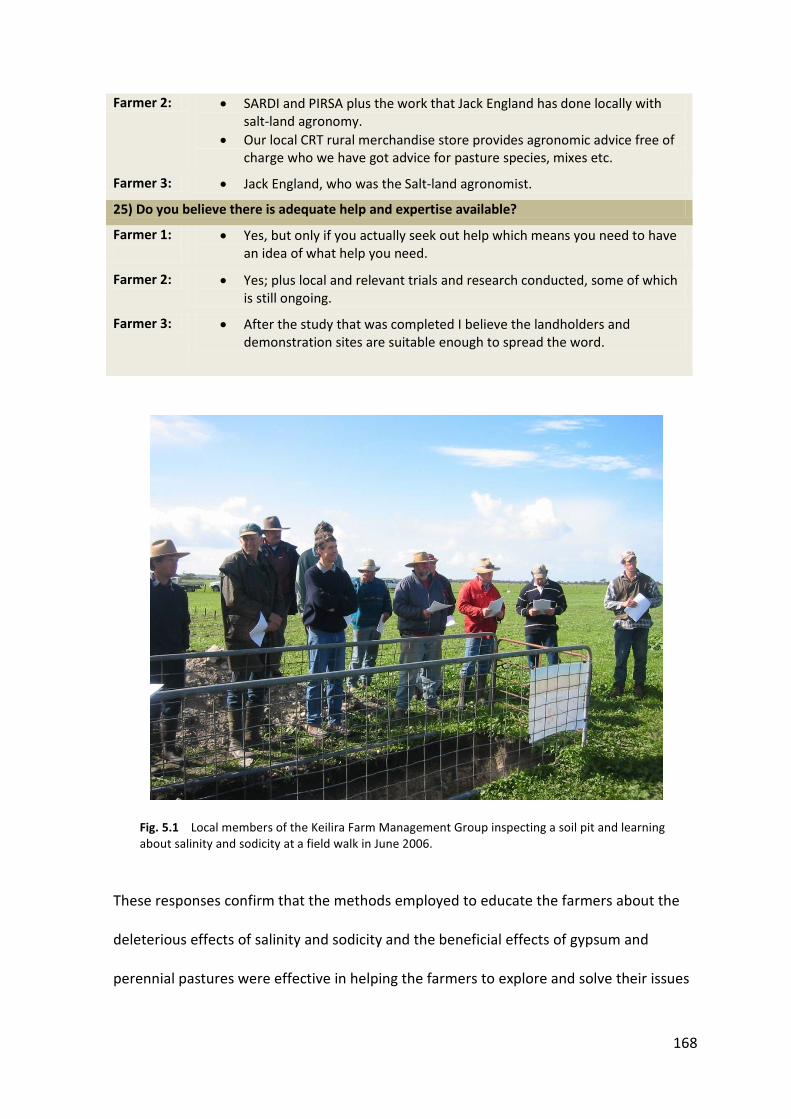
168
Farmer 2: � SARDI and PIRSA plus the work that Jack England has done locally with salt-land agronomy.
� Our local CRT rural merchandise store provides agronomic advice free of charge who we have got advice for pasture species, mixes etc.
Farmer 3: � Jack England, who was the Salt-land agronomist.
25) Do you believe there is adequate help and expertise available?
Farmer 1:
� Yes, but only if you actually seek out help which means you need to have an idea of what help you need.
Farmer 2: � Yes; plus local and relevant trials and research conducted, some of which is still ongoing.
Farmer 3: � After the study that was completed I believe the landholders and demonstration sites are suitable enough to spread the word.
Fig. 5.1 Local members of the Keilira Farm Management Group inspecting a soil pit and learning about salinity and sodicity at a field walk in June 2006.
These responses confirm that the methods employed to educate the farmers about the
deleterious effects of salinity and sodicity and the beneficial effects of gypsum and
perennial pastures were effective in helping the farmers to explore and solve their issues
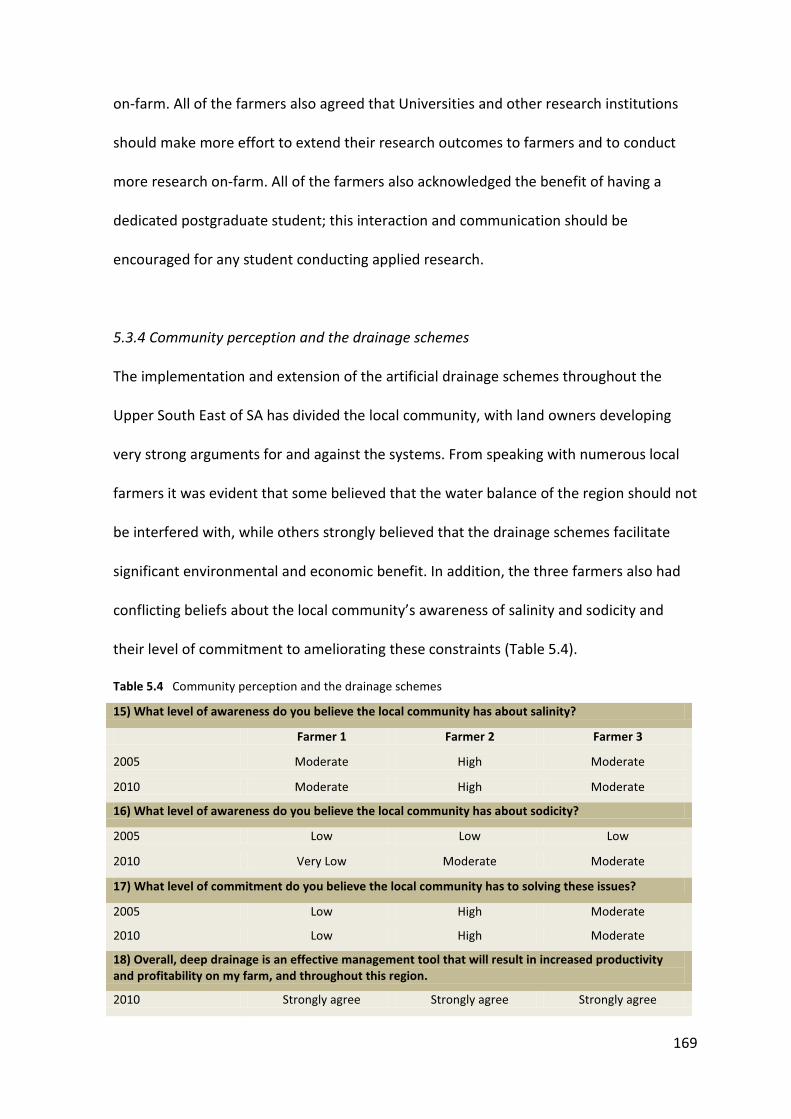
169
on-farm. All of the farmers also agreed that Universities and other research institutions
should make more effort to extend their research outcomes to farmers and to conduct
more research on-farm. All of the farmers also acknowledged the benefit of having a
dedicated postgraduate student; this interaction and communication should be
encouraged for any student conducting applied research.
5.3.4 Community perception and the drainage schemes
The implementation and extension of the artificial drainage schemes throughout the
Upper South East of SA has divided the local community, with land owners developing
very strong arguments for and against the systems. From speaking with numerous local
farmers it was evident that some believed that the water balance of the region should not
be interfered with, while others strongly believed that the drainage schemes facilitate
significant environmental and economic benefit. In addition, the three farmers also had
conflicting beliefs about the local community’s awareness of salinity and sodicity and
their level of commitment to ameliorating these constraints (Table 5.4).
Table 5.4 Community perception and the drainage schemes
15) What level of awareness do you believe the local community has about salinity?
Farmer 1 Farmer 2 Farmer 3
2005 Moderate High Moderate
2010 Moderate High Moderate
16) What level of awareness do you believe the local community has about sodicity?
2005 Low Low Low
2010 Very Low Moderate Moderate
17) What level of commitment do you believe the local community has to solving these issues?
2005 Low High Moderate
2010 Low High Moderate
18) Overall, deep drainage is an effective management tool that will result in increased productivity and profitability on my farm, and throughout this region.
2010 Strongly agree Strongly agree Strongly agree
170
The three farmers did, however, all strongly agree that artificial deep drainage is an
effective management tool that results in increased productivity and profitability on their
farms and throughout the region. These responses indicate that the Government
organisations such PIRSA, SARDI, the South East Natural Resources Management Board
and local Council all need to continue a community awareness and education program
that highlights the physicochemical constraints that exist in the soils of this region and
how the implementation of the drainage schemes can facilitate the removal of salts and
lower groundwater levels, thereby improving soil health and farm productivity.
5.4 CONCLUSIONS
An evaluation survey was conducted with three farmers that were involved with a
research project in Upper South East South Australia. The purpose of the survey was to
determine whether the suite of extension and communication activities associated with
the project were successful in improving farmer knowledge of soil constraints and how to
manage them on their farms. The survey revealed that all three farmers involved in the
project acquired a better understanding of salinity, sodicity and soil variability on their
farms. In addition, their management practices also changed as a result of their acquired
knowledge. The main practices employed were the application of gypsum and the
establishment of perennial pastures to ameliorate the effects of sodicity and to improve
the utilisation of soil water and to maintain cover on the surface of the soil. All of the
farmers agreed that the combination of on-farm research and extension activities was
beneficial to their learning and impacted on their decision making and management skills.

171
Clearly more work can be done to further educate the local community about the soil
constraints that exist in USE SA and the beneficial effects that artificial drainage can have
on soil and environmental health.
5.5 REFERENCES
Anderson JR, Feder G (2003). Policy Research Working Paper 2976: Rural Extension Services. World Bank, Washington, DC. Christodoulou N (2000). Learning to develop participative processes to improve farming systems in the Balonne Shire, Queensland. Sydney, NSW, University of Western Sydney. Master of Science Thesis: 150. Guerin TF (2000). Overcoming the Constraints to the Adoption of Sustainable Land Management Practices in Australia. Technological Forecasting and Social Change 65, 205-237. Lawrence D, Christodoulou N, Whish J (2007). Designing better on-farm research in Australia using a participatory workshop process. Field Crops Research 104, 157-164.
172
CHAPTER 6
GENERAL DISCUSSION AND CONCLUSIONS
6.1 INTRODUCTION
Soils in the Upper South East of South Australia have historically been saline. The
expression of salinity, coupled with seasonal inundation, had a detrimental effect on
agricultural productivity in some parts of the landscape. Mitigation strategies to
overcome this problem were instigated throughout the region primarily from the 1950s
to the late 1990s. Artificial drainage was one of the main tools employed, with the aim of
intercepting surface flood waters and lowering groundwater levels, thereby facilitating
the leaching of salts and lowering soil salinity. Across Australia’s agricultural land,
however, an equally important and more prevalent threat occurs: sodicity, which is
brought about by damaging concentrations of sodium as an exchange ion in the soil
(Rengasamy and Olsson 1991). When soils are both saline and sodic, the deleterious
effects of sodicity are often expressed when mitigation strategies for salinity are
employed. The lowering of soil EC can enable swelling to occur in smectitic soils, and in
the presence of high exchangeable Na, complete clay dispersion can occur in soils with a
wide range of mineralogies (Churchman et al. 1993). The presence and type of clay
minerals in soils can therefore affect the degree of degradation a sodic soil will undergo if
the salt load in the soil is reduced.
Since the Fairview drain was dug across the Avenue Plain in SA’s USE, local growers
noticed patches of declining plant growth and feared that the tracts of land adjacent to
the drains would become barren. However, areas of declining plant growth were also
173
being observed on sites that were not artificially drained. This study was instigated to
investigate the soils in the local district of Keilira to help the farmers understand what
was causing the decline in plant growth. The broad hypothesis of this research was that a
range of soil physicochemical constraints existed in the soils, including salinity, sodicity
and alkalinity, and that the artificial drains and resultant leaching had affected these soil
properties. By incorporating an extension and communication component into the work it
was also hypothesised that a change in knowledge, awareness and management of these
soil constraints could be achieved with the three farmers primarily involved in the project.
The work presented in this thesis was conducted to test these hypotheses.
6.2 SUMMARY OF RESEARCH AND CONTRIBUTION TO KNOWLEDGE
An initial study was conducted in 2005 on three separate properties in the Keilira District,
(named South, Central and North in this thesis) with the aim of determining the effects of
artificial drainage on groundwater levels and soil physicochemical condition. Deep drains
had been dug across the South and Central sites during the 1950s and late 1990s
respectively to lower groundwater levels and facilitate the leaching of salts, whereas no
artificial drainage had been implemented at the North site. Standing water levels (SWL) in
two observation wells from each site were assessed and soil pits were excavated across
zones of good and poor pasture growth. The data collected was compared with historic
soil samples (following re-analysis) that were retrieved from the CSIRO archives in
Canberra.
Results showed that SWL are highly responsive to artificial drainage and also to
fluctuations in annual rainfall. Data from wells surrounding the Blackford and Fairview
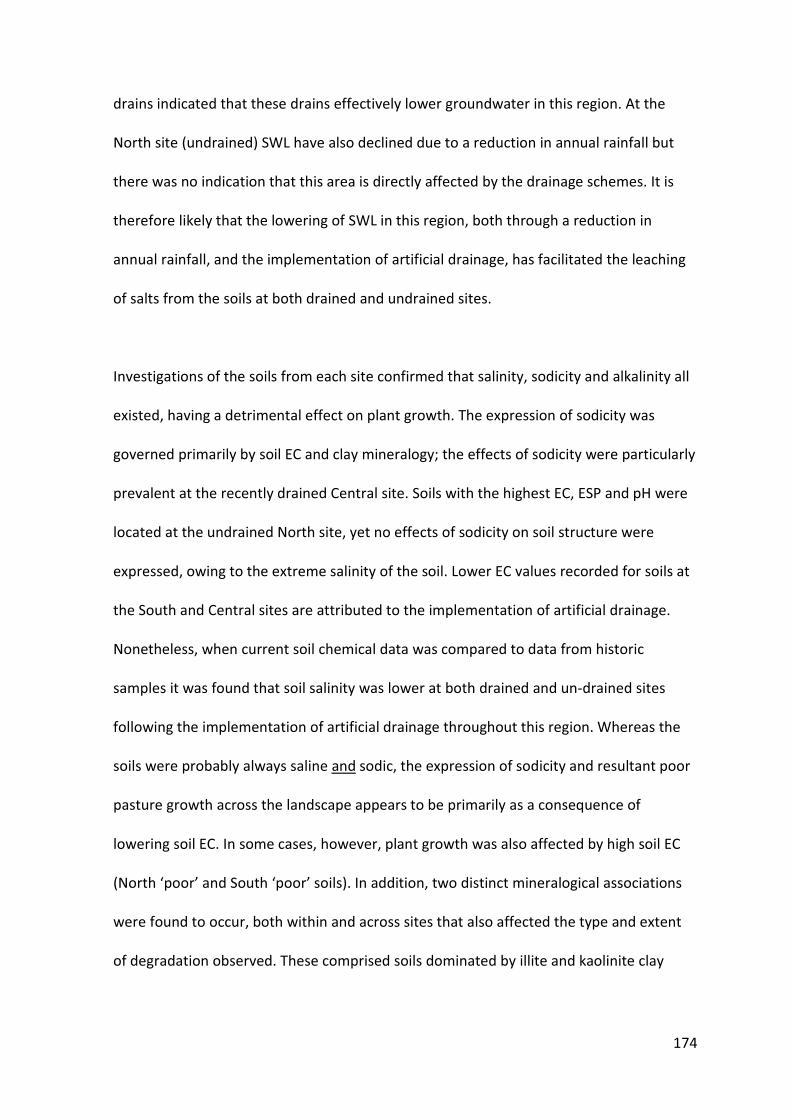
174
drains indicated that these drains effectively lower groundwater in this region. At the
North site (undrained) SWL have also declined due to a reduction in annual rainfall but
there was no indication that this area is directly affected by the drainage schemes. It is
therefore likely that the lowering of SWL in this region, both through a reduction in
annual rainfall, and the implementation of artificial drainage, has facilitated the leaching
of salts from the soils at both drained and undrained sites.
Investigations of the soils from each site confirmed that salinity, sodicity and alkalinity all
existed, having a detrimental effect on plant growth. The expression of sodicity was
governed primarily by soil EC and clay mineralogy; the effects of sodicity were particularly
prevalent at the recently drained Central site. Soils with the highest EC, ESP and pH were
located at the undrained North site, yet no effects of sodicity on soil structure were
expressed, owing to the extreme salinity of the soil. Lower EC values recorded for soils at
the South and Central sites are attributed to the implementation of artificial drainage.
Nonetheless, when current soil chemical data was compared to data from historic
samples it was found that soil salinity was lower at both drained and un-drained sites
following the implementation of artificial drainage throughout this region. Whereas the
soils were probably always saline and sodic, the expression of sodicity and resultant poor
pasture growth across the landscape appears to be primarily as a consequence of
lowering soil EC. In some cases, however, plant growth was also affected by high soil EC
(North ‘poor’ and South ‘poor’ soils). In addition, two distinct mineralogical associations
were found to occur, both within and across sites that also affected the type and extent
of degradation observed. These comprised soils dominated by illite and kaolinite clay

175
minerals that were prone to dispersion, and soils dominated by smectite clay minerals
that were moderately to extremely saline.
The aim of Chapter 3 was to investigate soil physicochemical variability on a larger scale
at a single site to better understand its cause. A study area (200 m x 200 m) was selected
in association with the managers of the South site, approximately 1 km from the soil pit
that was examined in the 2005 study (at this site). Patches of soil in this area were
starting to exhibit large cracks, micro-relief and salt-efflorescence and supported limited
plant growth; however, the majority of the area, especially the north-east quadrant,
supported good plant growth and a range of pasture species. A crescentic limestone ridge
colonised by eucalyptus trees was present in the far south-east corner of the study site.
Due to the size of the area and the high cost involved with traditional soil survey, a
preliminary electromagnetic induction and ground penetrating radar (GPR) survey of this
area was conducted to identify zones of greatest ECa and soil morphological variability.
Soil samples were also collected in conjunction with the surveys; analysis of this
information helped to locate a large study trench (60 m long and up to 1.8 m deep), that
intersected zones of low and high ECa and multiple radargram features.
Upon excavation it appeared that two distinct soil types occurred within the trench (Fig.
6.1). The majority of the trench featured Chromosols with shallow grey surface soils
overlying indurated carbonate; these soils supported good pasture growth (profile T1 was
selected as representative). The second distinct soil type was a deep Vertosol that was
extremely saline, strongly sodic and very strongly alkaline and supported only poor
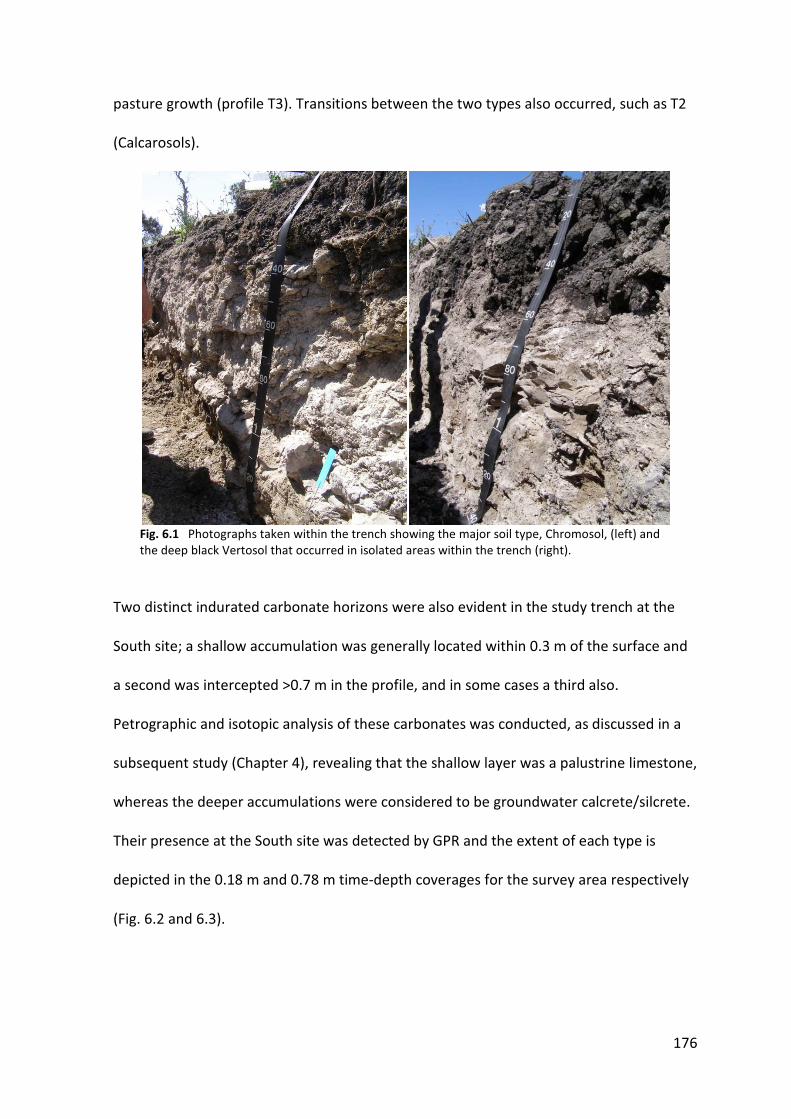
176
pasture growth (profile T3). Transitions between the two types also occurred, such as T2
(Calcarosols).
Fig. 6.1 Photographs taken within the trench showing the major soil type, Chromosol, (left) and the deep black Vertosol that occurred in isolated areas within the trench (right).
Two distinct indurated carbonate horizons were also evident in the study trench at the
South site; a shallow accumulation was generally located within 0.3 m of the surface and
a second was intercepted >0.7 m in the profile, and in some cases a third also.
Petrographic and isotopic analysis of these carbonates was conducted, as discussed in a
subsequent study (Chapter 4), revealing that the shallow layer was a palustrine limestone,
whereas the deeper accumulations were considered to be groundwater calcrete/silcrete.
Their presence at the South site was detected by GPR and the extent of each type is
depicted in the 0.18 m and 0.78 m time-depth coverages for the survey area respectively
(Fig. 6.2 and 6.3).
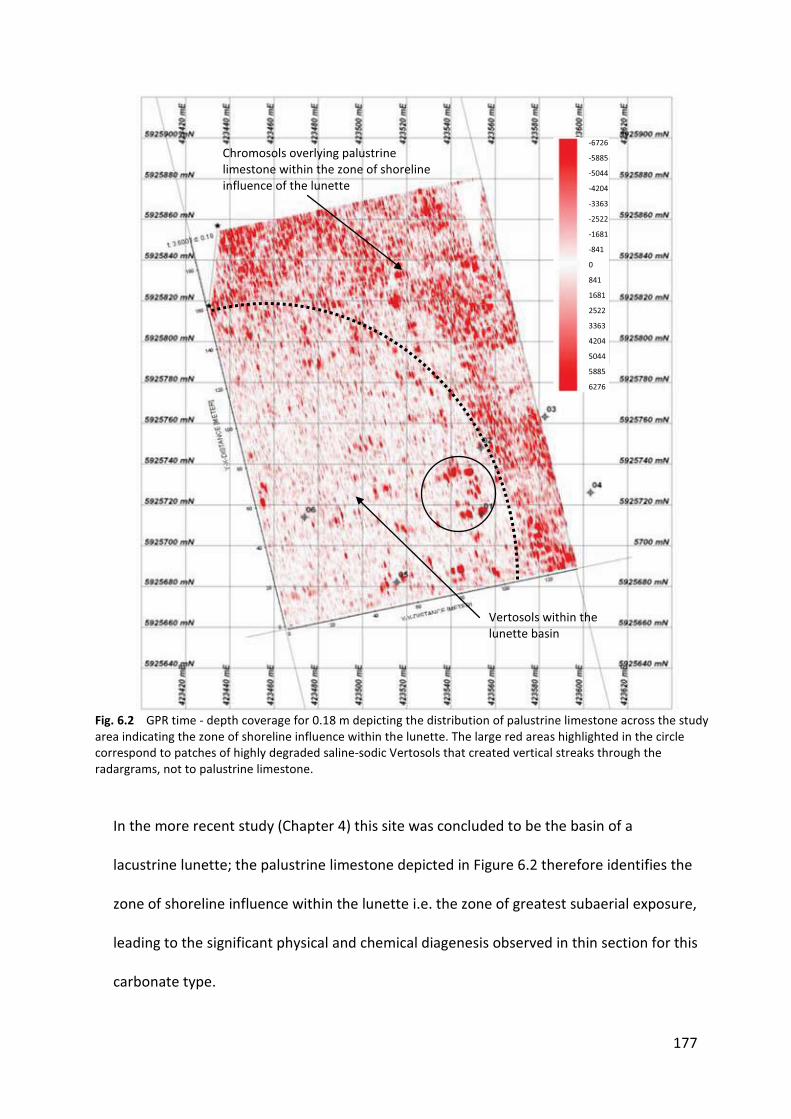
177
Fig. 6.2 GPR time - depth coverage for 0.18 m depicting the distribution of palustrine limestone across the study area indicating the zone of shoreline influence within the lunette. The large red areas highlighted in the circle correspond to patches of highly degraded saline-sodic Vertosols that created vertical streaks through the radargrams, not to palustrine limestone.
In the more recent study (Chapter 4) this site was concluded to be the basin of a
lacustrine lunette; the palustrine limestone depicted in Figure 6.2 therefore identifies the
zone of shoreline influence within the lunette i.e. the zone of greatest subaerial exposure,
leading to the significant physical and chemical diagenesis observed in thin section for this
carbonate type.
-6726
-5885
-5044
-4204
-3363
-2522
-1681
-841
0
841
1681
2522
3363
4204
5044
5885
6276
Vertosols within the lunette basin
Chromosols overlying palustrine limestone within the zone of shoreline influence of the lunette
178
Fig. 6.3 GPR time - depth coverage for 0.78 m depicting thick accumulations of groundwater calcrete/silcrete.
This feature extends in an arc from the south-east corner to the north-west corner of the
survey area (Fig. 6.2), flanked on the eastern side by the lunette ridge. Field observations
and data collected in conjunction with the geophysical surveys (soil samples 1 – 6, Tables
6.1 and 6.2) showed that the characteristics of the soils located within the zone of
shoreline influence (samples 2, 3 and 4) in the lunette were consistent with the physical
-6726
-5885
-5044
-4204
-3363
-2522
-1681
-841
0
841
1681
2522
3363
4204
5044
5885
6276
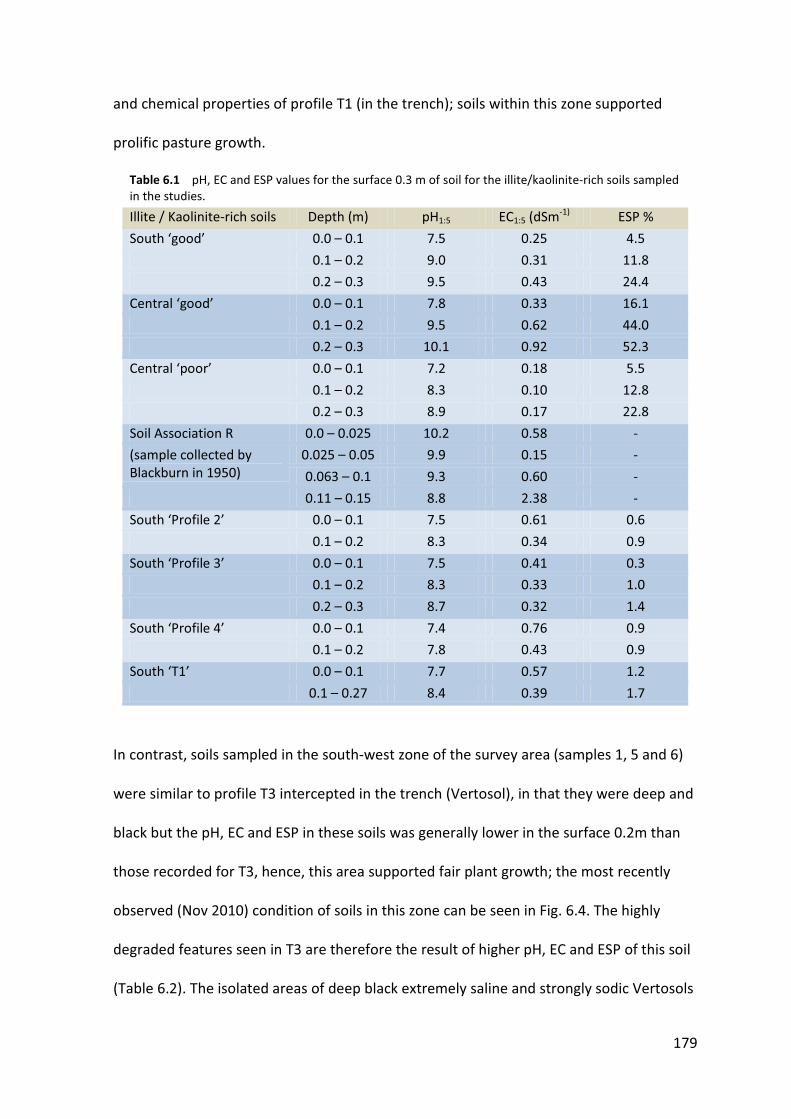
179
and chemical properties of profile T1 (in the trench); soils within this zone supported
prolific pasture growth.
Table 6.1 pH, EC and ESP values for the surface 0.3 m of soil for the illite/kaolinite-rich soils sampled in the studies.
Illite / Kaolinite-rich soils Depth (m) pH1:5 EC1:5 (dSm-1) ESP %
South ‘good’ 0.0 – 0.1 7.5 0.25 4.5
0.1 – 0.2 9.0 0.31 11.8
0.2 – 0.3 9.5 0.43 24.4
Central ‘good’ 0.0 – 0.1 7.8 0.33 16.1
0.1 – 0.2 9.5 0.62 44.0
0.2 – 0.3 10.1 0.92 52.3
Central ‘poor’ 0.0 – 0.1 7.2 0.18 5.5
0.1 – 0.2 8.3 0.10 12.8
0.2 – 0.3 8.9 0.17 22.8
Soil Association R 0.0 – 0.025 10.2 0.58 -
(sample collected by Blackburn in 1950)
0.025 – 0.05 9.9 0.15 -
0.063 – 0.1 9.3 0.60 -
0.11 – 0.15 8.8 2.38 -
South ‘Profile 2’ 0.0 – 0.1 7.5 0.61 0.6
0.1 – 0.2 8.3 0.34 0.9
South ‘Profile 3’ 0.0 – 0.1 7.5 0.41 0.3
0.1 – 0.2 8.3 0.33 1.0
0.2 – 0.3 8.7 0.32 1.4
South ‘Profile 4’ 0.0 – 0.1 7.4 0.76 0.9
0.1 – 0.2 7.8 0.43 0.9
South ‘T1’ 0.0 – 0.1 7.7 0.57 1.2
0.1 – 0.27 8.4 0.39 1.7
In contrast, soils sampled in the south-west zone of the survey area (samples 1, 5 and 6)
were similar to profile T3 intercepted in the trench (Vertosol), in that they were deep and
black but the pH, EC and ESP in these soils was generally lower in the surface 0.2m than
those recorded for T3, hence, this area supported fair plant growth; the most recently
observed (Nov 2010) condition of soils in this zone can be seen in Fig. 6.4. The highly
degraded features seen in T3 are therefore the result of higher pH, EC and ESP of this soil
(Table 6.2). The isolated areas of deep black extremely saline and strongly sodic Vertosols
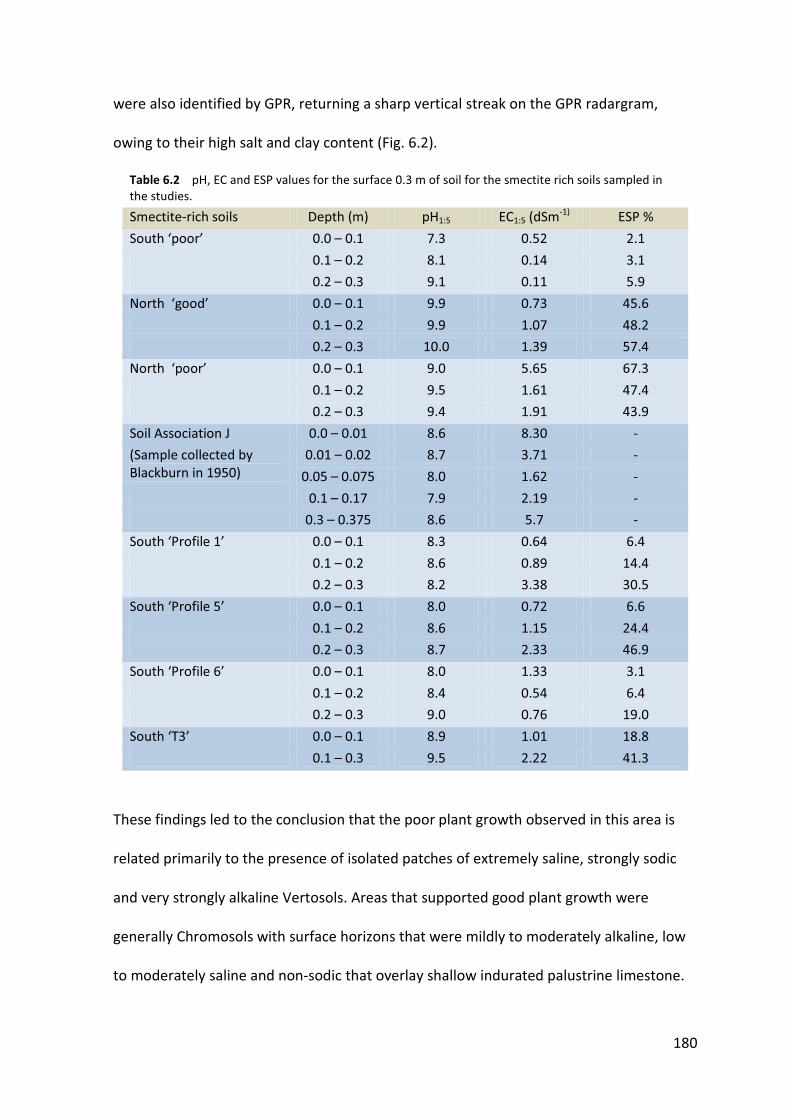
180
were also identified by GPR, returning a sharp vertical streak on the GPR radargram,
owing to their high salt and clay content (Fig. 6.2).
Table 6.2 pH, EC and ESP values for the surface 0.3 m of soil for the smectite rich soils sampled in the studies.
Smectite-rich soils Depth (m) pH1:5 EC1:5 (dSm-1) ESP %
South ‘poor’ 0.0 – 0.1 7.3 0.52 2.1
0.1 – 0.2 8.1 0.14 3.1
0.2 – 0.3 9.1 0.11 5.9
North ‘good’ 0.0 – 0.1 9.9 0.73 45.6
0.1 – 0.2 9.9 1.07 48.2
0.2 – 0.3 10.0 1.39 57.4
North ‘poor’ 0.0 – 0.1 9.0 5.65 67.3
0.1 – 0.2 9.5 1.61 47.4
0.2 – 0.3 9.4 1.91 43.9
Soil Association J 0.0 – 0.01 8.6 8.30 -
(Sample collected by Blackburn in 1950)
0.01 – 0.02 8.7 3.71 -
0.05 – 0.075 8.0 1.62 -
0.1 – 0.17 7.9 2.19 -
0.3 – 0.375 8.6 5.7 -
South ‘Profile 1’ 0.0 – 0.1 8.3 0.64 6.4
0.1 – 0.2 8.6 0.89 14.4
0.2 – 0.3 8.2 3.38 30.5
South ‘Profile 5’ 0.0 – 0.1 8.0 0.72 6.6
0.1 – 0.2 8.6 1.15 24.4
0.2 – 0.3 8.7 2.33 46.9
South ‘Profile 6’ 0.0 – 0.1 8.0 1.33 3.1
0.1 – 0.2 8.4 0.54 6.4
0.2 – 0.3 9.0 0.76 19.0
South ‘T3’ 0.0 – 0.1 8.9 1.01 18.8
0.1 – 0.3 9.5 2.22 41.3
These findings led to the conclusion that the poor plant growth observed in this area is
related primarily to the presence of isolated patches of extremely saline, strongly sodic
and very strongly alkaline Vertosols. Areas that supported good plant growth were
generally Chromosols with surface horizons that were mildly to moderately alkaline, low
to moderately saline and non-sodic that overlay shallow indurated palustrine limestone.
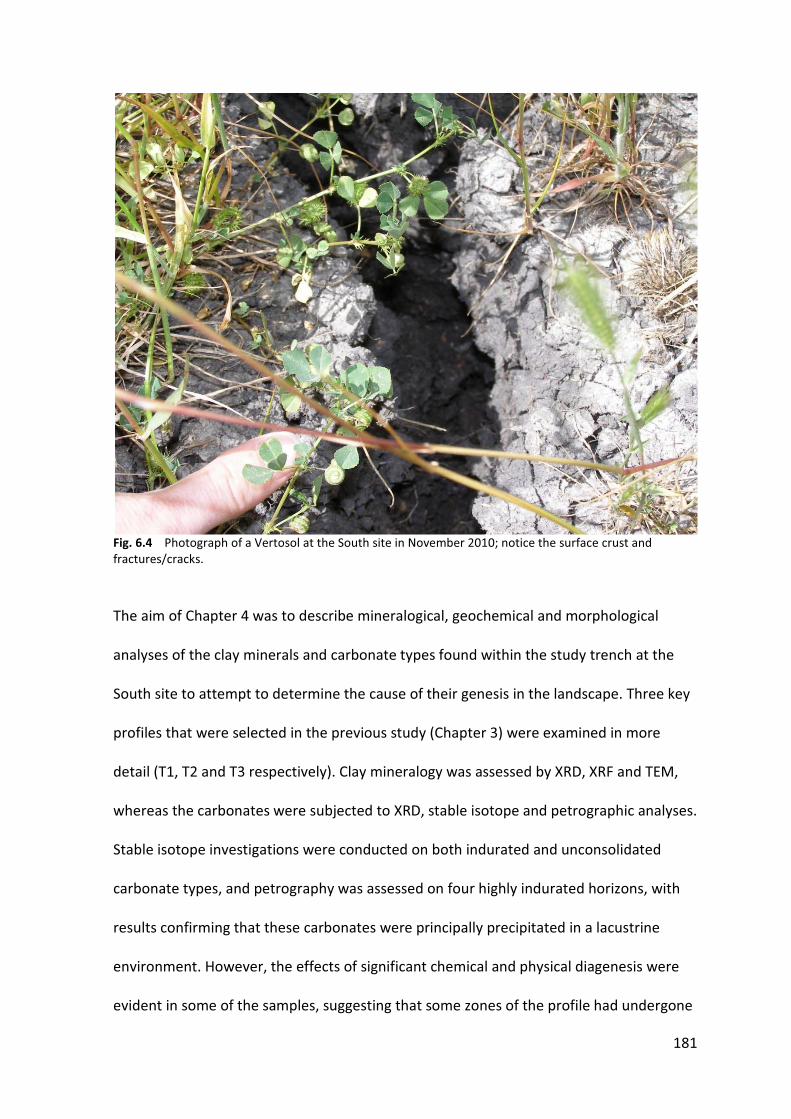
181
Fig. 6.4 Photograph of a Vertosol at the South site in November 2010; notice the surface crust and fractures/cracks.
The aim of Chapter 4 was to describe mineralogical, geochemical and morphological
analyses of the clay minerals and carbonate types found within the study trench at the
South site to attempt to determine the cause of their genesis in the landscape. Three key
profiles that were selected in the previous study (Chapter 3) were examined in more
detail (T1, T2 and T3 respectively). Clay mineralogy was assessed by XRD, XRF and TEM,
whereas the carbonates were subjected to XRD, stable isotope and petrographic analyses.
Stable isotope investigations were conducted on both indurated and unconsolidated
carbonate types, and petrography was assessed on four highly indurated horizons, with
results confirming that these carbonates were principally precipitated in a lacustrine
environment. However, the effects of significant chemical and physical diagenesis were
evident in some of the samples, suggesting that some zones of the profile had undergone
182
subaerial exposure and alteration, resulting in the development of palustrine limestones.
This carbonate type was intercepted in profile T1, and throughout much of the study
area, as previously discussed, but was noticeably absent in profile T3. The indurated
carbonates intercepted in the lower zones of all profiles were identified as groundwater
calcretes, with silicification also likely to be occurring. The unconsolidated carbonates
scattered throughout profile T3 were concluded to be pedogenic due to their soft nodular
form, their ubiquitous presence throughout the profile and their heavier oxygen and
carbon isotopic signatures.
Mineralogical results for the clay fraction of the soils confirmed that similar associations
existed as those found in the initial investigations of this project, viz. the Chromosols
were dominated by illite and kaolinite clay minerals at the surface, whereas the Vertosols
were smectite-dominant throughout. XRD and TEM analysis of Profile T1 from the South
site, however, also revealed the presence of sepiolite and palygorskite in the soil profiles,
two clay minerals that are rich in Mg and are known to form in lacustrine environments.
These minerals were detected in the highest proportions below palustrine limestone and
occurred concurrently with the carbonates Mg-rich calcite and ankerite; minor
concentrations of dioctahedral smectite (montmorillonite) were also detected. Sepiolite
was also previously detected in the profiles at the Central and North study sites (2005). It
was concluded that sepiolite and palygorskite are authigenic minerals that were directly
precipitated in a lacustrine environment, whereas illite and kaolinite were considered to
be mostly detrital in origin. However, the asymmetry of XRD peaks for both illite and
kaolinite in some samples, coupled with CECs that are abnormally high for these mineral
types, may indicate the occurrence of interstratification, which also supports the
183
formation of these minerals through diagenesis of other clay minerals (smectite,
palygorskite and/or sepiolite).
An interesting aspect of Vertosol at the South site (T3), was the occurrence of the Mg-rich
trioctahedral smectite mineral saponite; it occurs in the absence of sepiolite, palygorskite,
ankerite and montmorillonite in this case, indicating that Mg in solution is partitioned
between carbonate and silicate phases. In lacustrine environments saponite has been
found to form through both direct precipitation and by diagenetic transformation; the
genesis of saponite cannot be conclusively established in this case. Nonetheless, the
formation and stability of saponite requires an alkaline environment with prolonged
wetting and high activities of Si and Mg. These conditions prevail in the lowest parts of
the landscape; hence, saponite can be expected to be found within the basins of lunettes
that are prevalent on the western side of the Avenue Plain and throughout natural
drainage lines that do not succumb to extensive subaerial exposure. The site selected for
this study was concluded to be a lacustrine lunette.
These findings led to the conclusion that poor plant growth observed in isolated areas
throughout the South site are primarily the result of the underlying mineralogy of the
soils, which in turn is related to their position in the landscape and the hydrological
regime of this region. Areas of the landscape that underwent the greatest degree of
subaerial exposure supported the development of moderately to highly indurated
palustrine limestone which has led to the stratification and preservation of detrital
minerals at the surface. These soil types are typically identified as Chromosols. In
contrast, in portions of the landscape that supported prolonged surface water inundation,
184
smectite minerals were found to predominate throughout the solum; the physical and
chemical properties of these soils can be unfavourable for pasture growth.
The aim of Chapter 5 was to determine whether farmer knowledge and management of
soil physicochemical constraints could be improved through active participation in this
project. The three farmers principally involved with the project (owners of the South,
Central and North study sites) were surveyed upon commencement of the project to
determine their level of knowledge of soil physicochemical constraints and their
management and aspirations at that time. Throughout the project a range of extension
activities were conducted and an active dialogue was maintained between researcher and
farmer. A second survey was conducted with the farmers upon completion of the project
to determine how their understanding of soil issues and management had changed
through involvement in the project.
Results from the survey confirmed that all three farmers involved in the project acquired
a better understanding of salinity, sodicity and soil variability on their farms. In addition,
their management practices also changed as a result of their acquired knowledge. The
main practices employed were the application of gypsum and the establishment of
perennial pastures to ameliorate the effects of sodicity and to improve the utilisation of
soil water and to maintain cover on the surface of the soil. All of the farmers agreed that
the combination of on-farm research and extension activities was beneficial to their
learning and impacted on their decision making and management skills.

185
6.3 GENERAL DISCUSSION
Given the conclusions made in each of the studies discussed above, it has become
apparent that two distinct soils types exist in this landscape which are primarily a function
of their position in the landscape and the historic hydrological regime of the region. Given
the current physicochemical condition of these soils and the existing and proposed
expansion of the artificial drainage network throughout the USE, some important
implications for management should be considered for each of these soil types.
6.3.1 Illite- and Kaolinite-rich soils
Soils with surface horizons dominated with illite and kaolinite clay minerals were found at
the South site in the preliminary study and also across the sampling area and within the
trench in the main Study. They were also the only soils intercepted and investigated at
the Central study site in the preliminary study. Typical profiles for these soil types exhibit
shallow grey surface soils 0.2 – 0.3 m deep with an increasing clay content with depth,
that overlie moderately to highly indurated palustrine limestone; their physical and
morphological properties are consistent with the major soil type identified in the central
region of the Avenue Plain by Blackburn (1952) prior to broad scale agricultural
development (Soil Association R). In Blackburn’s study these soils were flanked by Soil
Association S on the far eastern side of the plain, which were identified as ‘variable soils
of the plains’ and Soil Association J on the western side of the plains, which were ‘variable
grey and black soils, mainly saline, of the uneven lagoon-lunette areas’. They can be
classified as Chromosols, Sodosols or Calcarosols depending on their physicochemical
properties.
186
These soil types exhibit a range of pH, EC and ESP values and have been affected by
artificial drainage (Table 6.1). Soils at the South site were less sodic in the surface 0.3 m
than the soils at the Central site which is attributed to >50 years of artificial drainage and
the regular application of gypsum. Due to the mineralogy, soil structure at the Central site
was particularly unstable and dense surface soils were encountered due to clay
dispersion.
In addition to clay mineralogy, the leaching of salts and soil structural decline of these soil
types may also be affected by the morphology of the underlying carbonate. When highly
indurated forms were present (South ‘good’ and Central ‘poor’) the EC of the overlying
soil was generally lower than when the carbonate was fractured and marly (Central
‘good’). The highly indurated forms are not conducive to the capillary rise of saline
groundwater; hence the leaching of salts is enhanced in these soil types, resulting in the
expression of sodicity through lowering soil EC. The recently drained soil at the Central
site with these morphological characteristics exhibited a highly compacted form and
columnar structure at the surface due to dispersion (Central ‘poor’). An example of this
can be seen in Figure 6.5 which is a photograph of the soil in close vicinity to the Central
‘poor’ profile. It shows dense soil structure at the surface and large columns that
intergrades to sub-angular blocky smaller peds as the EC of the soil increases with depth;
the boundary to palustrine limestone is sharp.
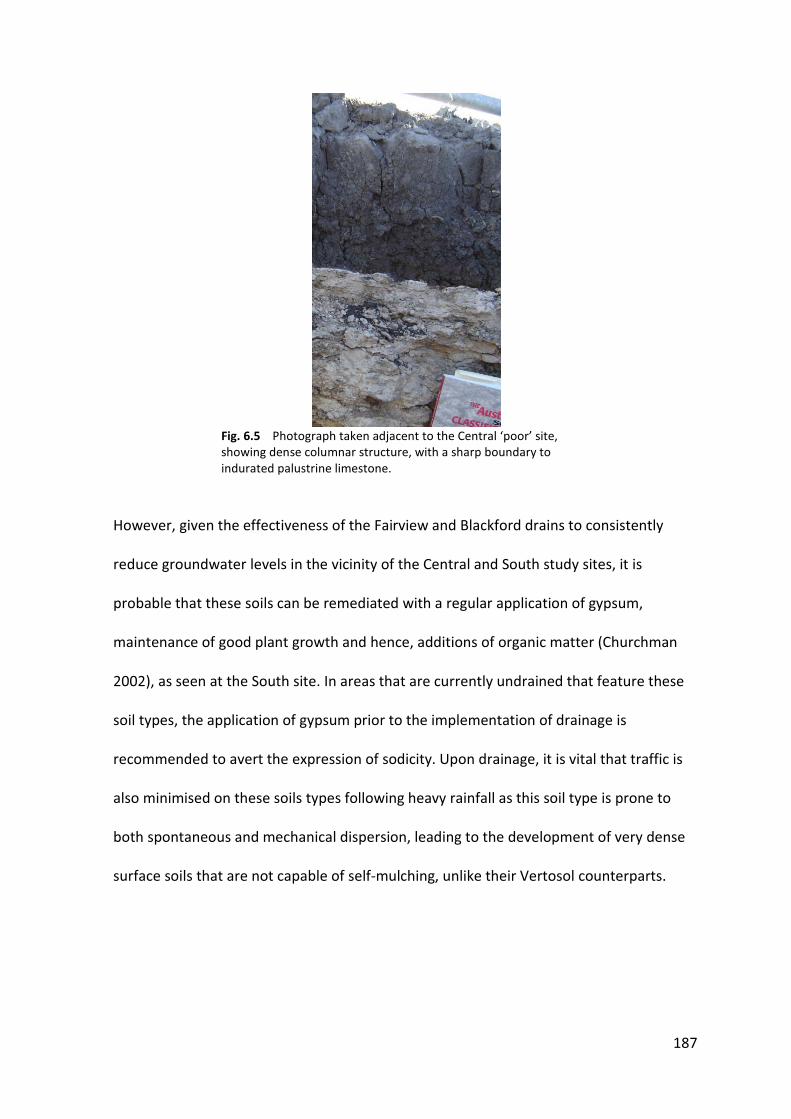
187
Fig. 6.5 Photograph taken adjacent to the Central ‘poor’ site, showing dense columnar structure, with a sharp boundary to indurated palustrine limestone.
However, given the effectiveness of the Fairview and Blackford drains to consistently
reduce groundwater levels in the vicinity of the Central and South study sites, it is
probable that these soils can be remediated with a regular application of gypsum,
maintenance of good plant growth and hence, additions of organic matter (Churchman
2002), as seen at the South site. In areas that are currently undrained that feature these
soil types, the application of gypsum prior to the implementation of drainage is
recommended to avert the expression of sodicity. Upon drainage, it is vital that traffic is
also minimised on these soils types following heavy rainfall as this soil type is prone to
both spontaneous and mechanical dispersion, leading to the development of very dense
surface soils that are not capable of self-mulching, unlike their Vertosol counterparts.

188
6.3.2 Smectite-rich soils
Soils that were dominated by smectite clay minerals were intercepted and investigated at
both the South and North study sites; they have also subsequently been found at the
Central site. These soils were generally much deeper than the illite- and kaolinite-rich
soils, owing to the absence of shallow palustrine limestone. Artificial drainage appeared
to have a large impact on the EC, ESP and pH of these soils in the preliminary study when
great variability was observed between the drained soils at the South site and the
undrained soils at the North. However isolated areas that were extremely saline and
strongly sodic and very strongly alkaline were also detected at the South site in the main
study. ESPs were lower at the South site, however, which is most likely due to the regular
application of gypsum at this site and the long-term employment of artificial drainage.
The undrained smectite soils (North site), were extremely saline, strongly sodic (ESP>40 %
in all cases) and very strongly alkaline (Table 6.2), yet exhibited good aggregation and
prolific root exploration; this factor is attributed at least partly to its extreme salinity and
the presence of salt tolerant vegetation at this site.
One of the major concerns of the farmers at the outset of this project was that their
whole farms would become barren as a result of artificial drainage. This proposal can be
thoroughly disregarded, as the degradation observed has been found to be primarily
related to clay mineralogy and not directly to the implementation of the drainage
schemes. The variability in soil types has always existed across these farms; however, the
current managers were not fully aware of such variability or the consequence for pasture
production. This is mostly brought about as the low lying areas (basins of the lunettes and
natural drainage lines) are typically inundated with surface water in the winter and spring
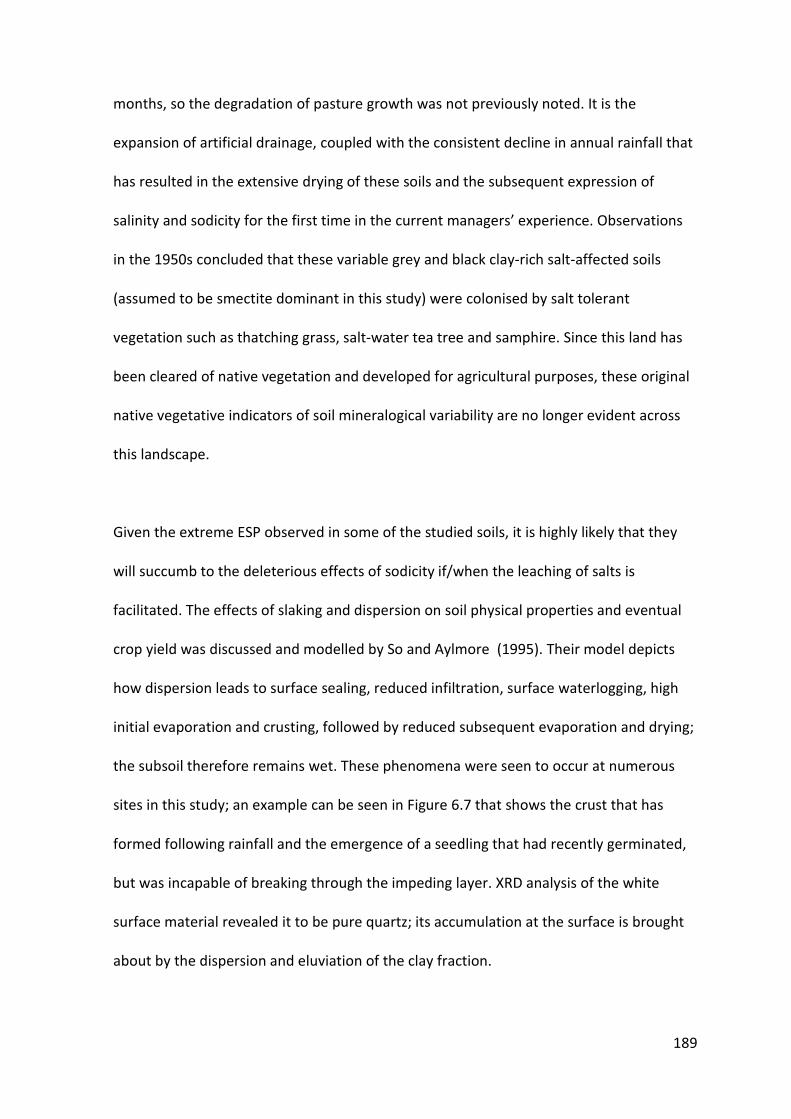
189
months, so the degradation of pasture growth was not previously noted. It is the
expansion of artificial drainage, coupled with the consistent decline in annual rainfall that
has resulted in the extensive drying of these soils and the subsequent expression of
salinity and sodicity for the first time in the current managers’ experience. Observations
in the 1950s concluded that these variable grey and black clay-rich salt-affected soils
(assumed to be smectite dominant in this study) were colonised by salt tolerant
vegetation such as thatching grass, salt-water tea tree and samphire. Since this land has
been cleared of native vegetation and developed for agricultural purposes, these original
native vegetative indicators of soil mineralogical variability are no longer evident across
this landscape.
Given the extreme ESP observed in some of the studied soils, it is highly likely that they
will succumb to the deleterious effects of sodicity if/when the leaching of salts is
facilitated. The effects of slaking and dispersion on soil physical properties and eventual
crop yield was discussed and modelled by So and Aylmore (1995). Their model depicts
how dispersion leads to surface sealing, reduced infiltration, surface waterlogging, high
initial evaporation and crusting, followed by reduced subsequent evaporation and drying;
the subsoil therefore remains wet. These phenomena were seen to occur at numerous
sites in this study; an example can be seen in Figure 6.7 that shows the crust that has
formed following rainfall and the emergence of a seedling that had recently germinated,
but was incapable of breaking through the impeding layer. XRD analysis of the white
surface material revealed it to be pure quartz; its accumulation at the surface is brought
about by the dispersion and eluviation of the clay fraction.
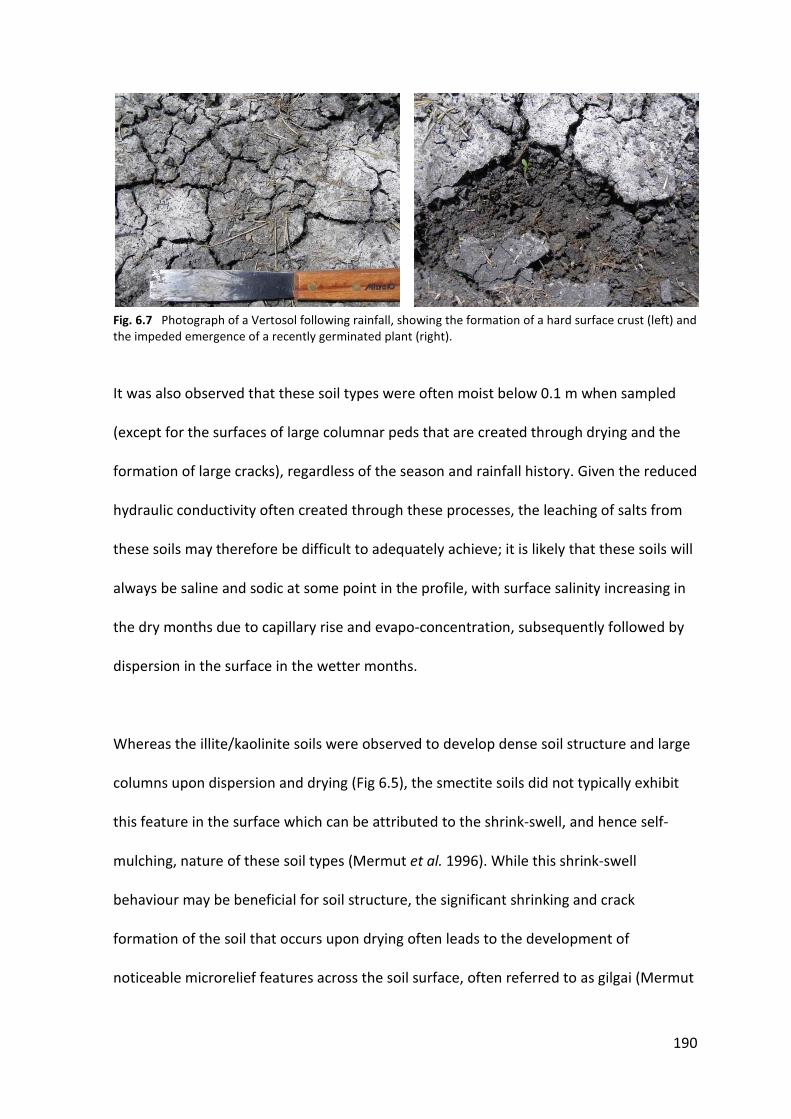
190
Fig. 6.7 Photograph of a Vertosol following rainfall, showing the formation of a hard surface crust (left) and the impeded emergence of a recently germinated plant (right).
It was also observed that these soil types were often moist below 0.1 m when sampled
(except for the surfaces of large columnar peds that are created through drying and the
formation of large cracks), regardless of the season and rainfall history. Given the reduced
hydraulic conductivity often created through these processes, the leaching of salts from
these soils may therefore be difficult to adequately achieve; it is likely that these soils will
always be saline and sodic at some point in the profile, with surface salinity increasing in
the dry months due to capillary rise and evapo-concentration, subsequently followed by
dispersion in the surface in the wetter months.
Whereas the illite/kaolinite soils were observed to develop dense soil structure and large
columns upon dispersion and drying (Fig 6.5), the smectite soils did not typically exhibit
this feature in the surface which can be attributed to the shrink-swell, and hence self-
mulching, nature of these soil types (Mermut et al. 1996). While this shrink-swell
behaviour may be beneficial for soil structure, the significant shrinking and crack
formation of the soil that occurs upon drying often leads to the development of
noticeable microrelief features across the soil surface, often referred to as gilgai (Mermut
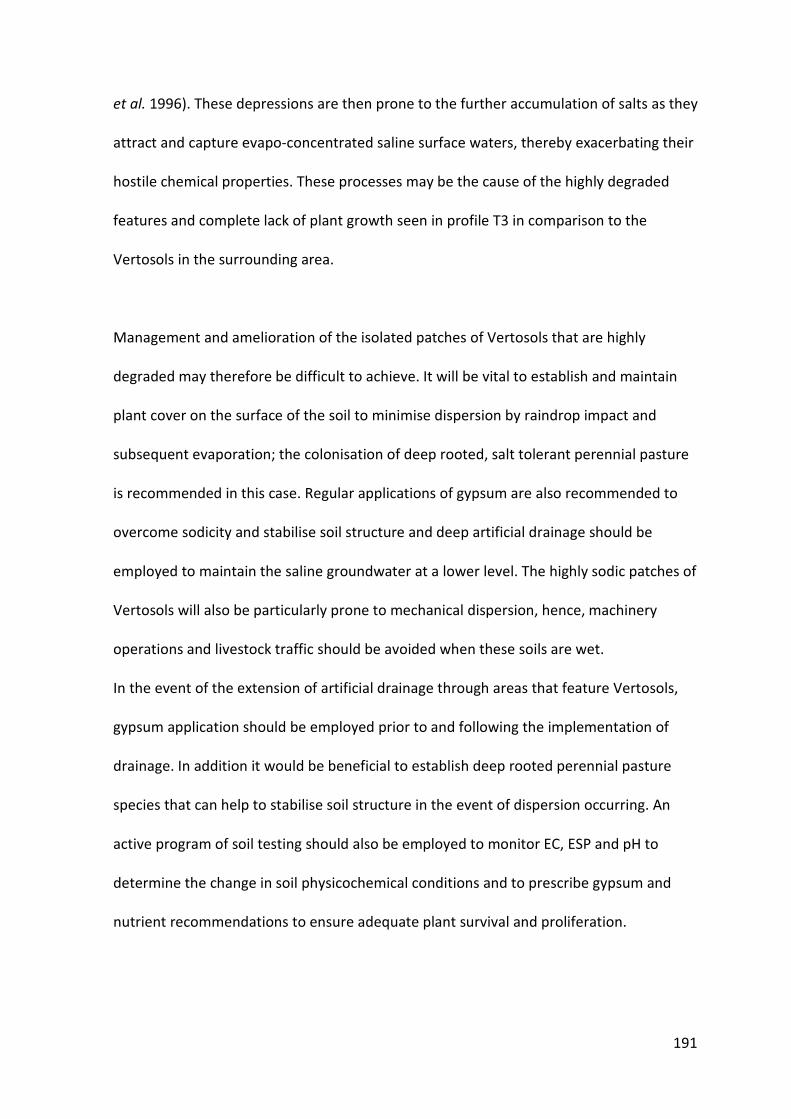
191
et al. 1996). These depressions are then prone to the further accumulation of salts as they
attract and capture evapo-concentrated saline surface waters, thereby exacerbating their
hostile chemical properties. These processes may be the cause of the highly degraded
features and complete lack of plant growth seen in profile T3 in comparison to the
Vertosols in the surrounding area.
Management and amelioration of the isolated patches of Vertosols that are highly
degraded may therefore be difficult to achieve. It will be vital to establish and maintain
plant cover on the surface of the soil to minimise dispersion by raindrop impact and
subsequent evaporation; the colonisation of deep rooted, salt tolerant perennial pasture
is recommended in this case. Regular applications of gypsum are also recommended to
overcome sodicity and stabilise soil structure and deep artificial drainage should be
employed to maintain the saline groundwater at a lower level. The highly sodic patches of
Vertosols will also be particularly prone to mechanical dispersion, hence, machinery
operations and livestock traffic should be avoided when these soils are wet.
In the event of the extension of artificial drainage through areas that feature Vertosols,
gypsum application should be employed prior to and following the implementation of
drainage. In addition it would be beneficial to establish deep rooted perennial pasture
species that can help to stabilise soil structure in the event of dispersion occurring. An
active program of soil testing should also be employed to monitor EC, ESP and pH to
determine the change in soil physicochemical conditions and to prescribe gypsum and
nutrient recommendations to ensure adequate plant survival and proliferation.
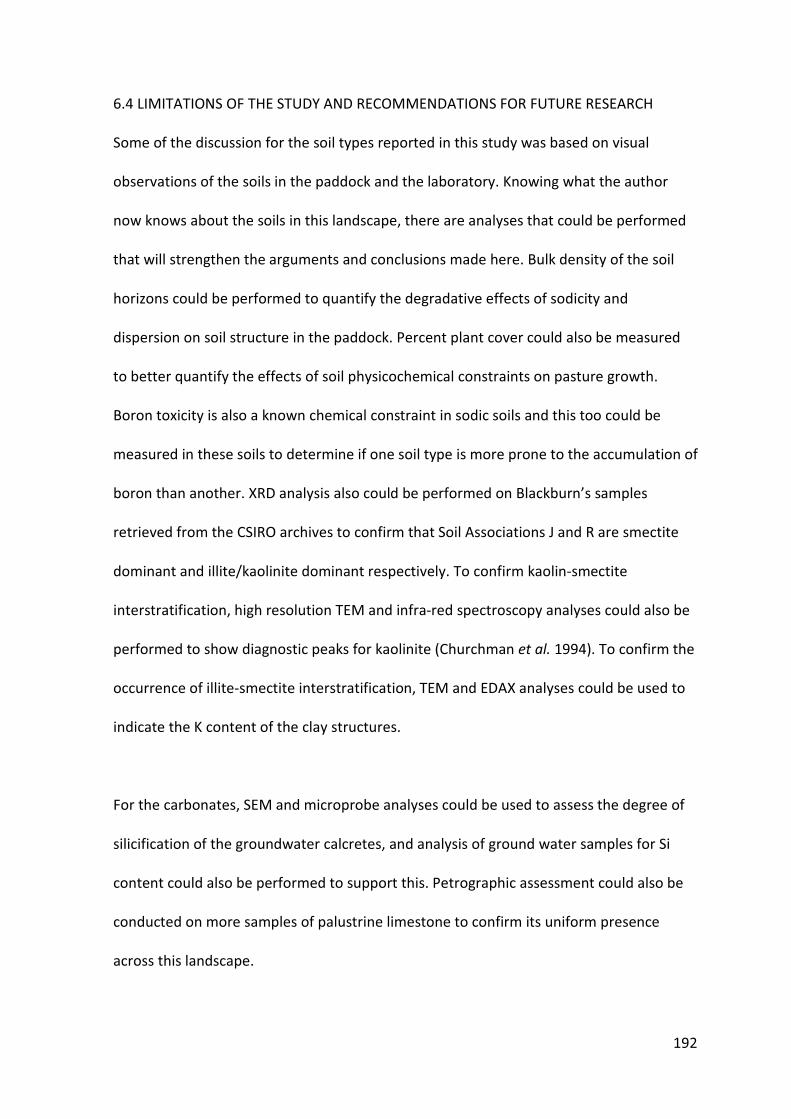
192
6.4 LIMITATIONS OF THE STUDY AND RECOMMENDATIONS FOR FUTURE RESEARCH
Some of the discussion for the soil types reported in this study was based on visual
observations of the soils in the paddock and the laboratory. Knowing what the author
now knows about the soils in this landscape, there are analyses that could be performed
that will strengthen the arguments and conclusions made here. Bulk density of the soil
horizons could be performed to quantify the degradative effects of sodicity and
dispersion on soil structure in the paddock. Percent plant cover could also be measured
to better quantify the effects of soil physicochemical constraints on pasture growth.
Boron toxicity is also a known chemical constraint in sodic soils and this too could be
measured in these soils to determine if one soil type is more prone to the accumulation of
boron than another. XRD analysis also could be performed on Blackburn’s samples
retrieved from the CSIRO archives to confirm that Soil Associations J and R are smectite
dominant and illite/kaolinite dominant respectively. To confirm kaolin-smectite
interstratification, high resolution TEM and infra-red spectroscopy analyses could also be
performed to show diagnostic peaks for kaolinite (Churchman et al. 1994). To confirm the
occurrence of illite-smectite interstratification, TEM and EDAX analyses could be used to
indicate the K content of the clay structures.
For the carbonates, SEM and microprobe analyses could be used to assess the degree of
silicification of the groundwater calcretes, and analysis of ground water samples for Si
content could also be performed to support this. Petrographic assessment could also be
conducted on more samples of palustrine limestone to confirm its uniform presence
across this landscape.
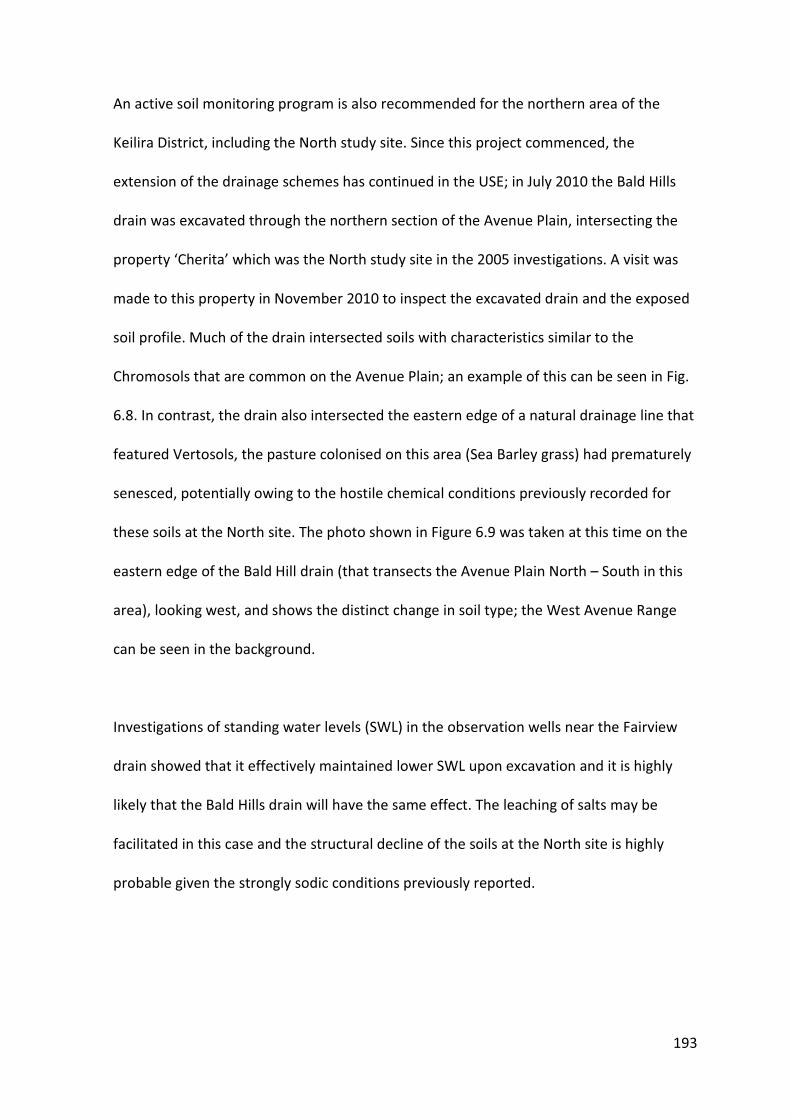
193
An active soil monitoring program is also recommended for the northern area of the
Keilira District, including the North study site. Since this project commenced, the
extension of the drainage schemes has continued in the USE; in July 2010 the Bald Hills
drain was excavated through the northern section of the Avenue Plain, intersecting the
property ‘Cherita’ which was the North study site in the 2005 investigations. A visit was
made to this property in November 2010 to inspect the excavated drain and the exposed
soil profile. Much of the drain intersected soils with characteristics similar to the
Chromosols that are common on the Avenue Plain; an example of this can be seen in Fig.
6.8. In contrast, the drain also intersected the eastern edge of a natural drainage line that
featured Vertosols, the pasture colonised on this area (Sea Barley grass) had prematurely
senesced, potentially owing to the hostile chemical conditions previously recorded for
these soils at the North site. The photo shown in Figure 6.9 was taken at this time on the
eastern edge of the Bald Hill drain (that transects the Avenue Plain North – South in this
area), looking west, and shows the distinct change in soil type; the West Avenue Range
can be seen in the background.
Investigations of standing water levels (SWL) in the observation wells near the Fairview
drain showed that it effectively maintained lower SWL upon excavation and it is highly
likely that the Bald Hills drain will have the same effect. The leaching of salts may be
facilitated in this case and the structural decline of the soils at the North site is highly
probable given the strongly sodic conditions previously reported.
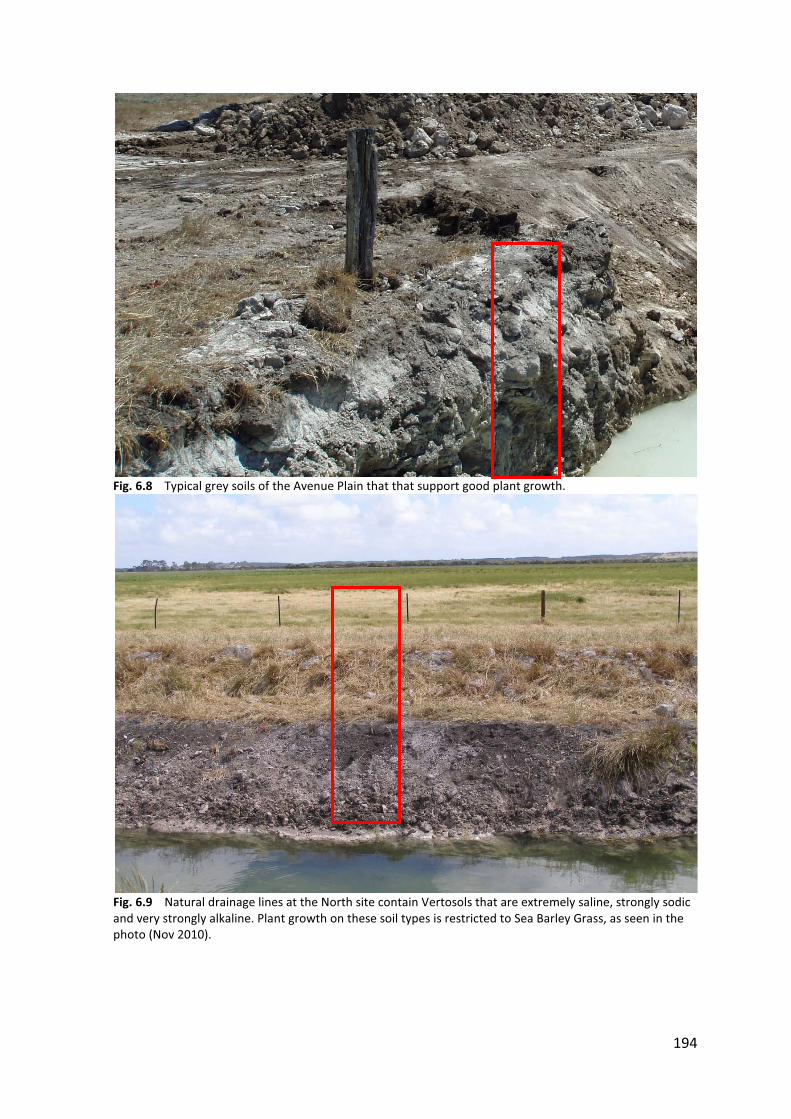
194
Fig. 6.8 Typical grey soils of the Avenue Plain that that support good plant growth.
Fig. 6.9 Natural drainage lines at the North site contain Vertosols that are extremely saline, strongly sodic and very strongly alkaline. Plant growth on these soil types is restricted to Sea Barley Grass, as seen in the photo (Nov 2010).
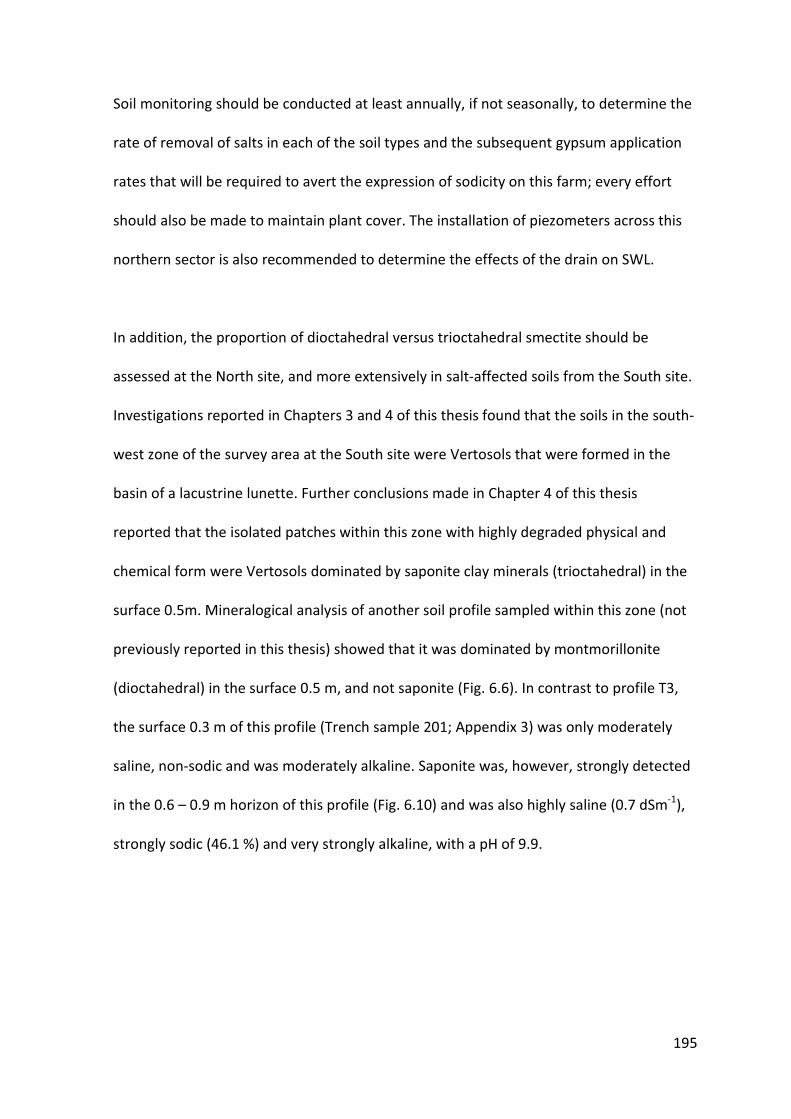
195
Soil monitoring should be conducted at least annually, if not seasonally, to determine the
rate of removal of salts in each of the soil types and the subsequent gypsum application
rates that will be required to avert the expression of sodicity on this farm; every effort
should also be made to maintain plant cover. The installation of piezometers across this
northern sector is also recommended to determine the effects of the drain on SWL.
In addition, the proportion of dioctahedral versus trioctahedral smectite should be
assessed at the North site, and more extensively in salt-affected soils from the South site.
Investigations reported in Chapters 3 and 4 of this thesis found that the soils in the south-
west zone of the survey area at the South site were Vertosols that were formed in the
basin of a lacustrine lunette. Further conclusions made in Chapter 4 of this thesis
reported that the isolated patches within this zone with highly degraded physical and
chemical form were Vertosols dominated by saponite clay minerals (trioctahedral) in the
surface 0.5m. Mineralogical analysis of another soil profile sampled within this zone (not
previously reported in this thesis) showed that it was dominated by montmorillonite
(dioctahedral) in the surface 0.5 m, and not saponite (Fig. 6.6). In contrast to profile T3,
the surface 0.3 m of this profile (Trench sample 201; Appendix 3) was only moderately
saline, non-sodic and was moderately alkaline. Saponite was, however, strongly detected
in the 0.6 – 0.9 m horizon of this profile (Fig. 6.10) and was also highly saline (0.7 dSm-1),
strongly sodic (46.1 %) and very strongly alkaline, with a pH of 9.9.

196
Fig. 6.10 XRD peaks for the clay fraction and bulk soil of a Vertosol within the lunette basin at the South site.
Another observation made was that when saponite was present (as indicated by the
trioctahedral peak), strong smectite peaks were recorded in the absence of sepiolite and
palygorskite, as demonstrated in Fig. 6.10 (and also Fig 4.5). In contrast, when smaller
broad peaks were observed, dioctahedral smectites (montmorillonite) were present,
often in addition to sepiolite and palygorskite, suggesting that dioctahedral smectites are
interstratified with other clay minerals such as illite and/or kaolinite. In addition, it is now
also observed that the ESP is often higher when the soils are dominated by saponite, than
when dominated by montmorillonite. This is brought about not only by an increase in
exchangeable sodium, but also is often due to a decrease in exchangeable Mg. This
phenomenon may at least partly be attributed to the mineralogy of the soil, whereby a
greater proportion of Mg is present in the structure of the clay minerals (saponite)
therefore resulting in less Mg being available on the exchange complex, thereby
increasing the ESP. The proportion of dioctahedral versus trioctahedral smectite in the
5 10 15 20 2570.00
1
2
3
Inte
nsity
(Cou
nts)
X 1
000
Depth (m) 0.0 - 0.1 0.1 - 0.3 0.3 - 0.6
0.6 - 0.9
0.9 -
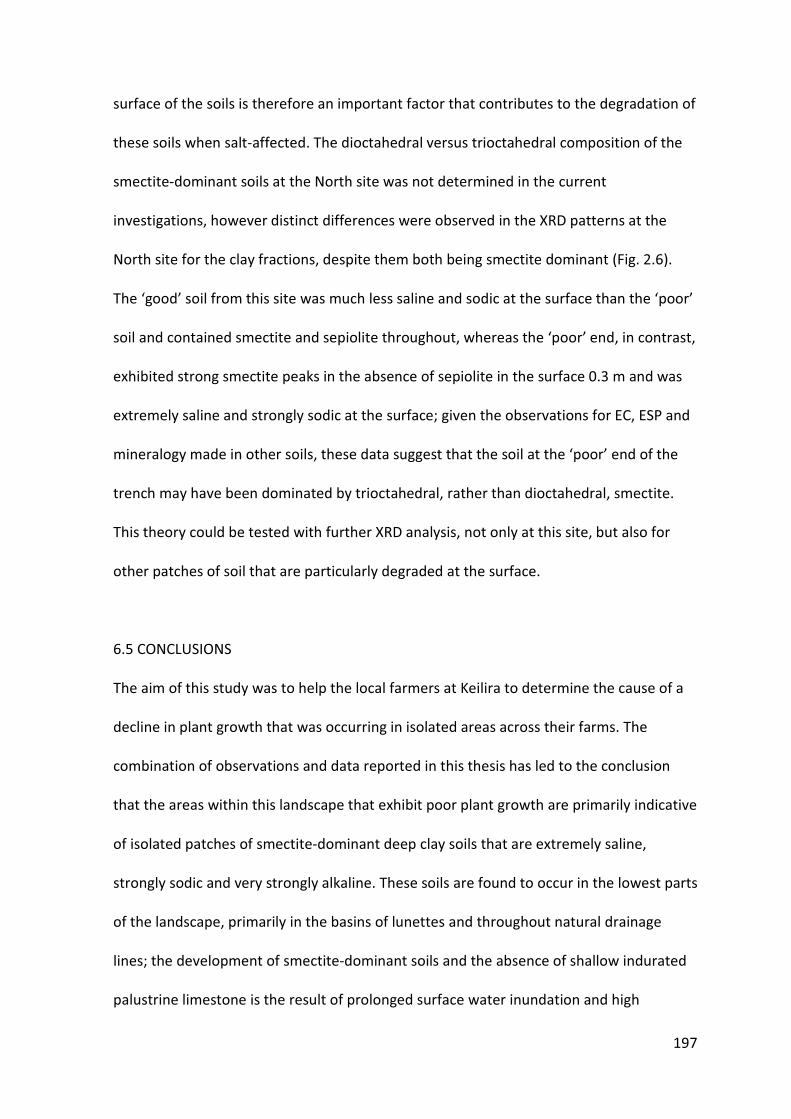
197
surface of the soils is therefore an important factor that contributes to the degradation of
these soils when salt-affected. The dioctahedral versus trioctahedral composition of the
smectite-dominant soils at the North site was not determined in the current
investigations, however distinct differences were observed in the XRD patterns at the
North site for the clay fractions, despite them both being smectite dominant (Fig. 2.6).
The ‘good’ soil from this site was much less saline and sodic at the surface than the ‘poor’
soil and contained smectite and sepiolite throughout, whereas the ‘poor’ end, in contrast,
exhibited strong smectite peaks in the absence of sepiolite in the surface 0.3 m and was
extremely saline and strongly sodic at the surface; given the observations for EC, ESP and
mineralogy made in other soils, these data suggest that the soil at the ‘poor’ end of the
trench may have been dominated by trioctahedral, rather than dioctahedral, smectite.
This theory could be tested with further XRD analysis, not only at this site, but also for
other patches of soil that are particularly degraded at the surface.
6.5 CONCLUSIONS
The aim of this study was to help the local farmers at Keilira to determine the cause of a
decline in plant growth that was occurring in isolated areas across their farms. The
combination of observations and data reported in this thesis has led to the conclusion
that the areas within this landscape that exhibit poor plant growth are primarily indicative
of isolated patches of smectite-dominant deep clay soils that are extremely saline,
strongly sodic and very strongly alkaline. These soils are found to occur in the lowest parts
of the landscape, primarily in the basins of lunettes and throughout natural drainage
lines; the development of smectite-dominant soils and the absence of shallow indurated
palustrine limestone is the result of prolonged surface water inundation and high

198
activities of Si and Mg in an alkaline environment. The clay minerals and carbonate types
studied here are consistent with those of lacustrine and palustrine origin.
Poor plant growth may also be observed in soils that are dominated by illite and kaolinite
clay minerals. If sodic, these soil types are prone to dispersion and the development of
dense soil structure when the soil EC is reduced through leaching. Given the effectiveness
of the drainage schemes and the morphology of the underlying limestone, these soil
types can be remediated with the regular application of gypsum, as seen at the South
site, provided saline ground waters do not breach the shallow limestone.
In the areas that feature Vertosols, a management program that includes the
establishment of salt-tolerant perennial pastures and sustained applications of gypsum
should help to stabilise these soils and lead to better physicochemical condition, albeit
complete amelioration may take longer to achieve than for the Chromosols. It is
important that local farmers at Keilira and across the Avenue Plain conduct thorough
surveys of their farms to determine the areas of each soil type and individually manage
each of these areas appropriately.
In addition, the combination of on-farm research and extension activities enabled the
three farmers involved in this project to improve their knowledge of salinity, sodicity and
soil variability across their farms. This acquired knowledge led to the implementation of
new management practices on each of the farms, with all of the farmers reporting
increased triple bottom line sustainability as a result of their participation in the project.
199
6.6 REFERENCES
Blackburn G (1952). The Soils of the Kingston-Avenue Drainage Area, South Australia. CSIRO Division of Soils, Melbourne. Churchman GJ (2002). Sodic Soils, reclamation of. In 'Encyclopedia of Soil Science'. Eds R. Lal. Marcel Dekker Inc: New York, USA. Churchman GJ, Skemstad JO, Oades JM (1993). Influence of Clay Minerals and Organic Matter on Effects of Sodicity on Soils. Australian Journal of Soil Research 31, 779 - 800. Churchman GJ, Slade PG, Self PG, Janik PG (1994). Nature of Interstratified Kaolin-smectites in some Australian soils. Australian Journal of Soil Research 32, 805 - 822. Mermut AR, Dasog GS, Dowuona GN (1996). Soil Morphology. In 'Vertisols and technologies for their management'. Eds N. Ahmad and A. R. Mermut. 89 - 114. ElsevierScience: Amsterdam. Rengasamy P, Olsson KA (1991). Sodicity and Soil Structure. Australian Journal of Soil Research 29, 935 - 952. So HB, Aylmore LAG (1995). The effect of sodicity on soil physical behaviour. In 'Australian Sodic Soils: Distribution, properties and management'. Eds R Naidu, P Rengasamy and M E Sumner. 71-79. CSIRO: East Melbourne, Vic.

200

201
APPENDIX 1
Appendix 1.1 Map of key geological features of South East South Australia. Source: SECWMB (2003).
NOTE: This map is included on page 201 of the print copy of the thesis held in the University of Adelaide Library.

202
Appendix 1.2 Surface water flow paths in South East South Australia. Source: SECWMB (2003).
NOTE: This map is included on page 202 of the print copy of the thesis held in the University of Adelaide Library.

203
Appendix 1.3 Flooding and inundation experienced prior to drainage. Source: SECWMB (2003)
NOTE: This map is included on page 203 of the print copy of the thesis held in the University of Adelaide Library.
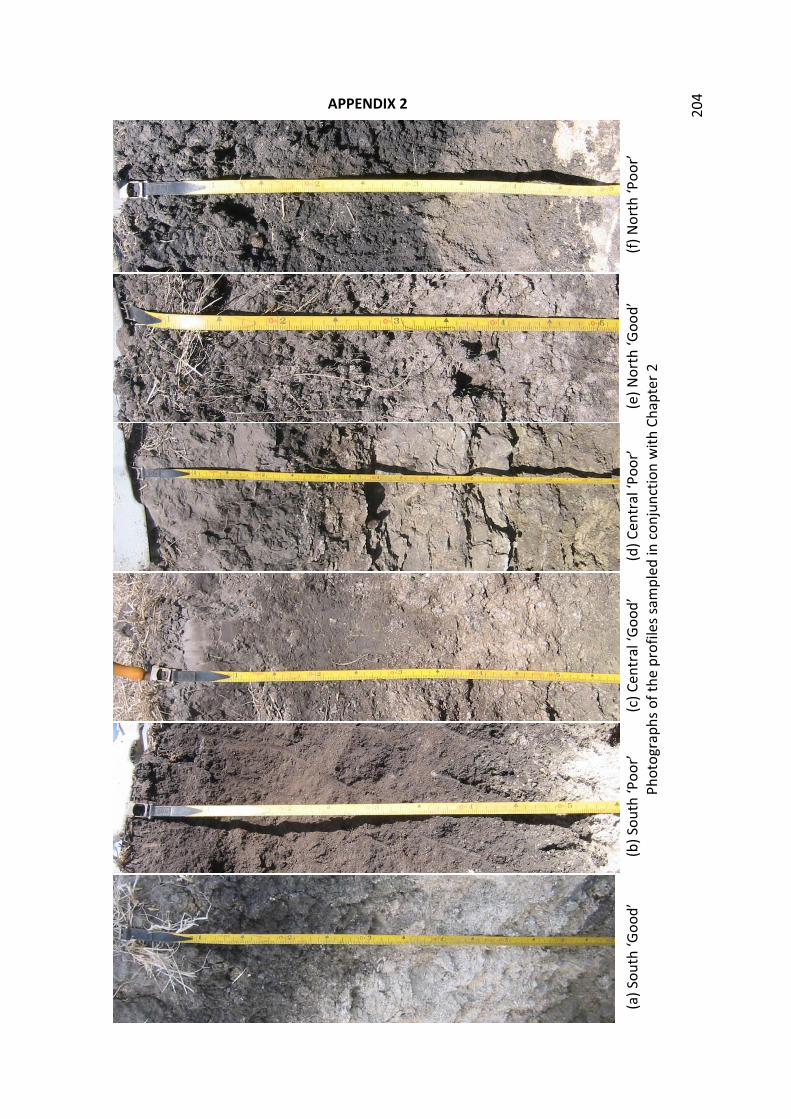
20
4 APPENDIX 2
(a) S
outh
‘Goo
d’
(b) S
outh
‘Poo
r’
(c) C
entr
al ‘G
ood’
(d
) Cen
tral
‘Poo
r’
(e) N
orth
‘Goo
d’
(f) N
orth
‘Poo
r’
Ph
otog
raph
s of
the
prof
iles
sam
pled
in c
onju
nctio
n w
ith C
hapt
er 2
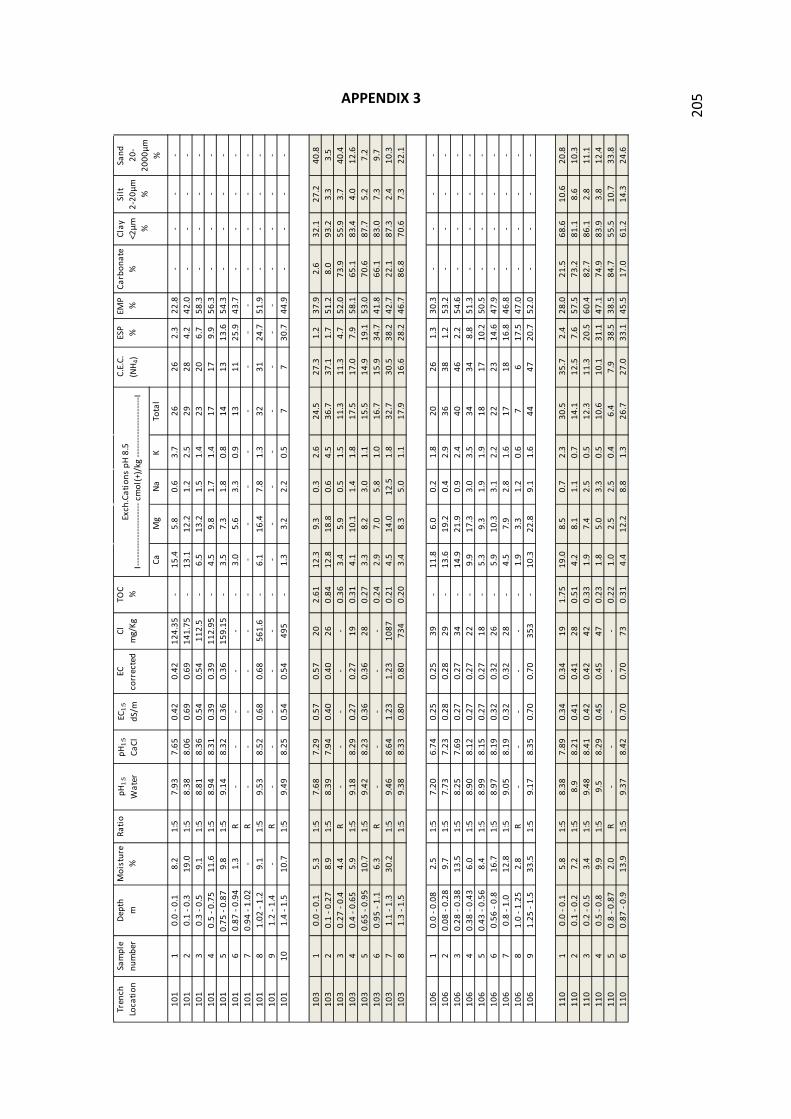
20
5
APPENDIX 3 D
epth
m
CaM
gN
aK
Tota
l
101
10.
0 - 0
.18.
21:
57.
937.
650.
420.
4212
4.35
-15
.45.
80.
63.
726
262.
322
.8-
--
-10
12
0.1
- 0.3
19.0
1:5
8.38
8.06
0.69
0.69
141.
75-
13.1
12.2
1.2
2.5
2928
4.2
42.0
--
--
101
30.
3 - 0
.59.
11:
58.
818.
360.
540.
5411
2.5
-6.
513
.21.
51.
423
206.
758
.3-
--
-10
14
0.5
- 0.7
511
.61:
58.
948.
310.
390.
3911
2.95
-4.
59.
81.
71.
417
179.
956
.3-
--
-10
15
0.75
- 0.
87
9.8
1:5
9.14
8.32
0.36
0.36
159.
15-
3.5
7.3
1.8
0.8
1413
13.6
54.3
--
--
101
60.
87 -
0.94
1.3
R-
--
--
-3.
05.
63.
30.
913
1125
.943
.7-
--
-10
17
0.94
- 1.
02-
R-
--
--
--
--
--
--
--
--
-10
18
1.02
- 1.
29.
11:
59.
538.
520.
680.
6856
1.6
-6.
116
.47.
81.
332
3124
.751
.9-
--
-10
19
1.2
- 1.4
-R
--
--
--
--
--
--
--
--
--
101
101.
4 - 1
.510
.71:
59.
498.
250.
540.
5449
5-
1.3
3.2
2.2
0.5
77
30.7
44.9
--
--
103
10.
0 - 0
.15.
31:
57.
687.
290.
570.
5720
2.61
12.3
9.3
0.3
2.6
24.5
27.3
1.2
37.9
2.6
32.1
27.2
40.8
103
20.
1 - 0
.27
8.9
1:5
8.39
7.94
0.40
0.40
260.
8412
.818
.80.
64.
536
.737
.11.
751
.28.
093
.23.
33.
510
33
0.27
- 0.
44.
4R
--
--
-0.
363.
45.
90.
51.
511
.311
.34.
752
.073
.955
.93.
740
.410
34
0.4
- 0.6
55.
91:
59.
188.
290.
270.
2719
0.31
4.1
10.1
1.4
1.8
17.5
17.0
7.9
58.1
65.1
83.4
4.0
12.6
103
50.
65 -
0.95
10.7
1:5
9.42
8.23
0.36
0.36
280.
273.
38.
23.
01.
115
.514
.919
.153
.070
.687
.75.
27.
210
36
0.95
- 1.
16.
3R
--
--
-0.
242.
97.
05.
81.
016
.715
.934
.741
.866
.183
.07.
39.
710
37
1.1
- 1.3
30.2
1:5
9.46
8.64
1.23
1.23
1087
0.21
4.5
14.0
12.5
1.8
32.7
30.5
38.2
42.7
22.1
87.3
2.4
10.3
103
81.
3 - 1
.51:
59.
388.
330.
800.
8073
40.
203.
48.
35.
01.
117
.916
.628
.246
.786
.870
.67.
322
.1
106
10.
0 - 0
.08
2.5
1:5
7.20
6.74
0.25
0.25
39-
11.8
6.0
0.2
1.8
2026
1.3
30.3
--
--
106
20.
08 -
0.28
9.7
1:5
7.73
7.23
0.28
0.28
29-
13.6
19.2
0.4
2.9
3638
1.2
53.2
--
--
106
30.
28 -
0.38
13.5
1:5
8.25
7.69
0.27
0.27
34-
14.9
21.9
0.9
2.4
4046
2.2
54.6
--
--
106
40.
38 -
0.43
6.0
1:5
8.90
8.12
0.27
0.27
22-
9.9
17.3
3.0
3.5
3434
8.8
51.3
--
--
106
50.
43 -
0.56
8.4
1:5
8.99
8.15
0.27
0.27
18-
5.3
9.3
1.9
1.9
1817
10.2
50.5
--
--
106
60.
56 -
0.8
16.7
1:5
8.97
8.19
0.32
0.32
26-
5.9
10.3
3.1
2.2
2223
14.6
47.9
--
--
106
70.
8 - 1
.012
.81:
59.
058.
190.
320.
3228
-4.
57.
92.
81.
617
1816
.846
.8-
--
-10
68
1.0
- 1.2
52.
8R
--
--
--
1.9
3.3
1.2
0.6
76
17.5
47.0
--
--
106
91.
25 -
1.5
33.5
1:5
9.17
8.35
0.70
0.70
353
-10
.322
.89.
11.
644
4720
.752
.0-
--
-
110
10.
0 - 0
.15.
81:
58.
387.
890.
340.
3419
1.75
19.0
8.5
0.7
2.3
30.5
35.7
2.4
28.0
21.5
68.6
10.6
20.8
110
20.
1 - 0
.27.
21:
58.
98.
210.
410.
4128
0.51
4.2
8.1
1.1
0.7
14.1
12.5
7.6
57.5
73.2
81.1
8.6
10.3
110
30.
2 - 0
.53.
41:
59.
488.
410.
420.
4242
0.33
1.9
7.4
2.5
0.5
12.3
11.3
20.5
60.4
82.7
86.1
2.8
11.1
110
40.
5 - 0
.89.
91:
59.
58.
290.
450.
4547
0.23
1.8
5.0
3.3
0.5
10.6
10.1
31.1
47.1
74.9
83.9
3.8
12.4
110
50.
8 - 0
.87
2.0
R-
--
--
0.22
1.0
2.5
2.5
0.4
6.4
7.9
38.5
38.5
84.7
55.5
10.7
33.8
110
60.
87 -
0.9
13.9
1:5
9.37
8.42
0.70
0.70
730.
314.
412
.28.
81.
326
.727
.033
.145
.517
.061
.214
.324
.6
Rati
opH
1:5
Wat
erpH
1:5
CaCl
EC1:
5
dS/m
Carb
onat
e %
Clay
<2
μm
%
Silt
2-20
μm
%
Sand
20-
2000
μm
%
EC
corr
ecte
dCl
mg/
KgTO
C
%
C.E
.C.
(NH
4)ES
P
%EM
P %
Exch
.Cat
ions
pH
8.5
I-
----
----
----
----
----
- cm
ol(+
)/kg
----
----
----
----
----
-I
Tren
ch
Loca
tion
Sam
ple
num
ber
Moi
stur
e %
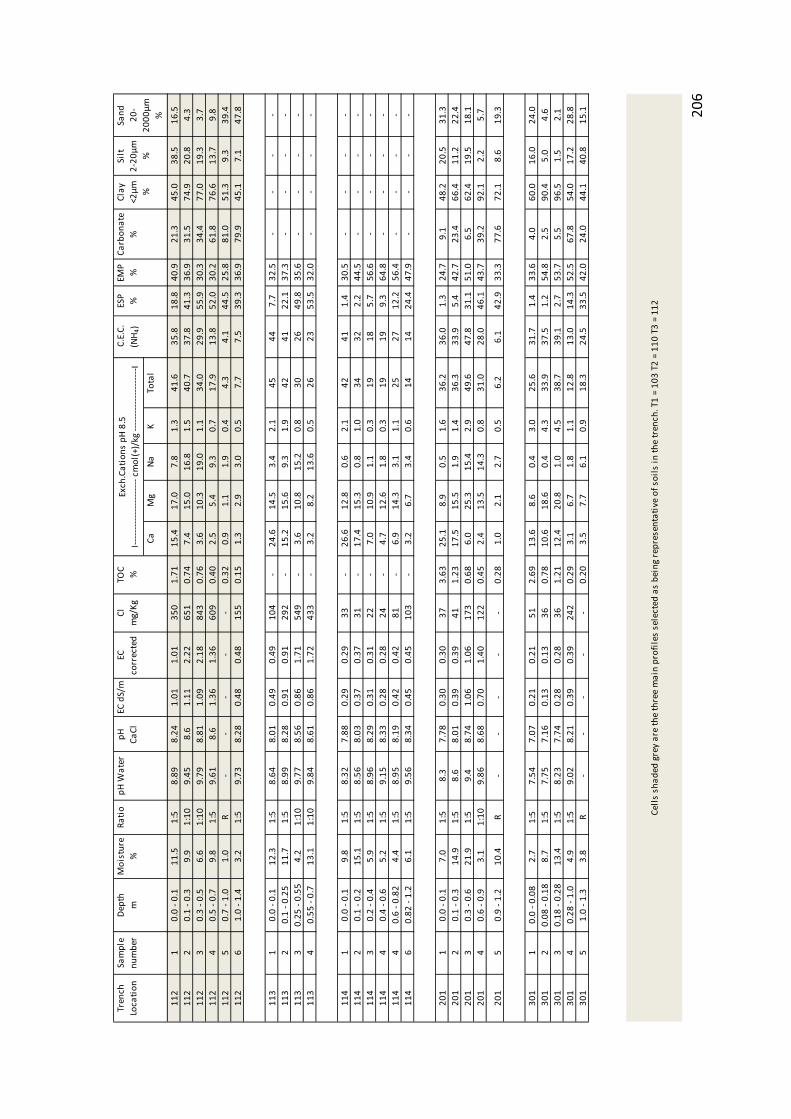
20
6
Dep
th
m
CaM
gN
aK
Tota
l
112
10.
0 - 0
.111
.51:
58.
898.
241.
011.
0135
01.
7115
.417
.07.
81.
341
.635
.818
.840
.921
.345
.038
.516
.511
22
0.1
- 0.3
9.9
1:10
9.45
8.6
1.11
2.22
651
0.74
7.4
15.0
16.8
1.5
40.7
37.8
41.3
36.9
31.5
74.9
20.8
4.3
112
30.
3 - 0
.56.
61:
109.
798.
811.
092.
1884
30.
763.
610
.319
.01.
134
.029
.955
.930
.334
.477
.019
.33.
711
24
0.5
- 0.7
9.8
1:5
9.61
8.6
1.36
1.36
609
0.40
2.5
5.4
9.3
0.7
17.9
13.8
52.0
30.2
61.8
76.6
13.7
9.8
112
50.
7 - 1
.01.
0R
--
--
-0.
320.
91.
11.
90.
44.
34.
144
.525
.881
.051
.39.
339
.411
26
1.0
- 1.4
3.2
1:5
9.73
8.28
0.48
0.48
155
0.15
1.3
2.9
3.0
0.5
7.7
7.5
39.3
36.9
79.9
45.1
7.1
47.8
113
10.
0 - 0
.112
.31:
58.
648.
010.
490.
4910
4-
24.6
14.5
3.4
2.1
4544
7.7
32.5
--
--
113
20.
1 - 0
.25
11.7
1:5
8.99
8.28
0.91
0.91
292
-15
.215
.69.
31.
942
4122
.137
.3-
--
-11
33
0.25
- 0.
554.
21:
109.
778.
560.
861.
7154
9-
3.6
10.8
15.2
0.8
3026
49.8
35.6
--
--
113
40.
55 -
0.7
13.1
1:10
9.84
8.61
0.86
1.72
433
-3.
28.
213
.60.
526
2353
.532
.0-
--
-
114
10.
0 - 0
.19.
81:
58.
327.
880.
290.
2933
-26
.612
.80.
62.
142
411.
430
.5-
--
-11
42
0.1
- 0.2
15.1
1:5
8.56
8.03
0.37
0.37
31-
17.4
15.3
0.8
1.0
3432
2.2
44.5
--
--
114
30.
2 - 0
.45.
91:
58.
968.
290.
310.
3122
-7.
010
.91.
10.
319
185.
756
.6-
--
-11
44
0.4
- 0.6
5.2
1:5
9.15
8.33
0.28
0.28
24-
4.7
12.6
1.8
0.3
1919
9.3
64.8
--
--
114
40.
6 - 0
.82
4.4
1:5
8.95
8.19
0.42
0.42
81-
6.9
14.3
3.1
1.1
2527
12.2
56.4
--
--
114
60.
82 -
1.2
6.1
1:5
9.56
8.34
0.45
0.45
103
-3.
26.
73.
40.
614
1424
.447
.9-
--
-
201
10.
0 - 0
.17.
01:
58.
37.
780.
300.
3037
3.63
25.1
8.9
0.5
1.6
36.2
36.0
1.3
24.7
9.1
48.2
20.5
31.3
201
20.
1 - 0
.314
.91:
58.
68.
010.
390.
3941
1.23
17.5
15.5
1.9
1.4
36.3
33.9
5.4
42.7
23.4
66.4
11.2
22.4
201
30.
3 - 0
.621
.91:
59.
48.
741.
061.
0617
30.
686.
025
.315
.42.
949
.647
.831
.151
.06.
562
.419
.518
.120
14
0.6
- 0.9
3.1
1:10
9.86
8.68
0.70
1.40
122
0.45
2.4
13.5
14.3
0.8
31.0
28.0
46.1
43.7
39.2
92.1
2.2
5.7
201
50.
9 - 1
.210
.4R
--
--
-0.
281.
02.
12.
70.
56.
26.
142
.933
.377
.672
.18.
619
.3
301
10.
0 - 0
.08
2.7
1:5
7.54
7.07
0.21
0.21
512.
6913
.68.
60.
43.
025
.631
.71.
433
.64.
060
.016
.024
.030
12
0.08
- 0.
188.
71:
57.
757.
160.
130.
1336
0.78
10.6
18.6
0.4
4.3
33.9
37.5
1.2
54.8
2.5
90.4
5.0
4.6
301
30.
18 -
0.28
13.4
1:5
8.23
7.74
0.28
0.28
361.
2112
.420
.81.
04.
538
.739
.12.
753
.75.
596
.51.
52.
130
14
0.28
- 1.
04.
91:
59.
028.
210.
390.
3924
20.
293.
16.
71.
81.
112
.813
.014
.352
.567
.854
.017
.228
.830
15
1.0
- 1.3
3.8
R-
--
--
0.20
3.5
7.7
6.1
0.9
18.3
24.5
33.5
42.0
24.0
44.1
40.8
15.1
Cell
s sh
aded
gre
y ar
e th
e th
ree
mai
n pr
ofil
es s
elec
ted
as b
eing
rep
rese
ntat
ive
of s
oils
in th
e tr
ench
. T1
= 10
3 T2
= 1
10 T
3 =
112
Tren
ch
Loca
tion
Sam
ple
num
ber
Moi
stur
e %
Rati
opH
Wat
erpH
Ca
ClEC
dS/
mEC
co
rrec
ted
Cl
m
g/Kg
TOC
%Ex
ch.C
atio
ns p
H 8
.5
I---
----
----
----
----
--- c
mol
(+)/
kg --
----
----
----
----
---I
C.E
.C.
(NH
4)ES
P
%EM
P %
Carb
onat
e %
Clay
<2
μm
%
Silt
2-20
μm
%
Sand
20-
2000
μm
%