Embed Size (px)
Citation preview
Software Fault Inference Based on Expert Opinion
Ezgi Erturk 1*, Ebru A. Sezer2
1 Software Technologies Research Institute, Scientific and Technological Research Council of Turkey, Ankara, Turkey. 2 Department of Computer Engineering, Hacettepe University, Ankara, Turkey. * Corresponding author. Email: [email protected]. Manuscript submitted August 6, 2014; accepted May 28, 2015. doi: 10.17706/jsw.10.6.757-766
Abstract: Software fault prediction is a process which predicts that the software modules are faulty or not
by using the software metrics and some soft computing methods. Software metrics are divided into two
main categories such as object-oriented and method-level metrics. While class relationships and
dependencies are covered by object-oriented metrics, behaviors of the classes can be also measured by
method-level metrics. Actually, the complementary relationship between these metric groups is focused in
this study and different predictive models are built by using different parameter sets. Each parameter set
includes some object-oriented and some method-level metrics. Furthermore, Mamdani style fuzzy inference
system (FIS) is employed here to predict faultiness. In contrast to data-driven methods, FIS does not require
historical or previous data for modeling. In fact, it is a rule-based approach and rules are extracted with the
help of domain experts. In this study, the dataset which consists of the method-level and the class-level
metrics’ values that are collected from KC1 project of PROMISE repository is employed and most successful
model whose performance is 0.8181 according to the evaluation criteria (the area under receiver operating
characteristics (ROC) curve (AUC)) is built with the parameters of “coupling between object”, “line of code”
and, “cyclomatic complexity”.
Key words: Software fault prediction, fuzzy inference systems, object-oriented metrics, method-level metrics.
1. Introduction
Nowadays, software projects are enormous and they consist of a great deal of modules which have a lot of
business rules; additionally there are many developers who work for these software projects. So, it is
difficult to manage the projects and produce qualified products. The qualified software products must
produce expected results. For this reason, the software products must be faultless as far as possible. At
present, while developers are coding, the testing activities or code reviews are performed to reduce the
fault amount of the software. The testing activities and code reviews are time consuming tasks for the large
software projects and require more resource such as developers and testers. It is not possible to test every
path of the software or review the whole code with the current resource of the project. So, the modules
which are fault-prone must be specified. At this point, software fault prediction systems have critical role to
determine whether software module is fault-prone or not. Thus, it makes easier for the project team to
detect the fault-prone modules before faults occur. In addition to this, software fault prediction provides to
identify software parts which are candidate for refactoring. In other words, software fault prediction
systems can find complex or badly coded modules by using software metrics such as cyclomatic complexity,
757 Volume 10, Number 6, June 2015
Journal of Software
coupling between objects etc. So that, these software parts can be re-written and simplified. In this way,
software fault prediction helps allocate more effort and time on these specified modules.
Up to now, to perform fault detection, many intelligent methods have been used like Artificial Neural
Networks - ANN (i.e. [1], [2]), Support Vector Machines – SVM (i.e. [3]), Naive Bayes – NB (i.e. [4], [5], [6], [7])
and Random Forests – RF (i.e. [5], [8], [6]). The common point of the methods mentioned above is that all of
them are data driven and used for classification problems like software fault prediction. Although there are
some differences between them, the obtained model can be accepted as a mathematical function which
associates inputs with the corresponding outputs. Actually, each model has the ability of learning by using
its free parameters and training samples are used to adjust values of them. Since the learning stage is
guided by the training samples, this approach can be called as learning from examples. As a result, model
can learn only what it can learn from training samples. Thus, it can be said that data driven methods aim to
make predictions by using domain dependent data. This means that there must be a dataset about the same
or similar project to build software prediction system. Afterwards, dataset is split into train and test sets,
model is built, training and testing process of the model are performed and, the performance of the model is
evaluated. These methods which are mentioned above produce successful results as shown in the
referenced studies because they learn the all rules from data automatically. However, they are not clear. In
other words, they learn the rules but they don’t represent them to the users. The models which are built
with the data-driven methods provide only the faultiness information of the modules and hide the reasons
of the faultiness. So, the project team cannot know how to prevent the faulty codes. In contrast to this, the
rules of the FIS model are explicit and adjusted by the domain experts.
In this application path, resulted predictive models are customized according to the employed training
dataset. For this reason, a prediction model which is built on a selected project may not be able to be used
for another project because the model learns specific context of the project, not the general context of the
projects. As a result, the prediction model must be trained again and again for each project. Also, the
training phase is a time-consuming process. But more importantly, the data driven methods needs the
historical or previous data to perform their task. However, it is not possible every time to collect the data of
the software modules especially at the beginning of the project because of unavailability of the source code.
In this study, we aimed to overcome these drawbacks by using Mamdani-style FIS which uses fuzzy rules
to represent general context of the faultiness in software projects. In other words, we implemented
software fault prediction by using expert opinion presented in the “if-then” rules. To perform the
experiment, we used the object-oriented software metrics and the method-level software metrics together
to observe complementary relationship between them. The KC1 project [9] of PROMISE repository [10] was
used as the dataset and AUC which is very popular for this research area [11], [12] is utilized as the
evaluation criteria.
2. Related Works
Several studies which are about software fault prediction and use different soft computing methods are summarized below.
Vandecruys et al. aimed to predict the software faults by mining the software [13]. For this purpose, they
used AntMiner+ which is a kind of data mining technique. After using the some data preprocessing methods
such as oversampling, discretization and input selection, they applied AntMiner+ and then compared the
performance of the model with the performances of the models which were built with C4.5, logistic
regression and SVM. In the study of Czibula, Marian and Czibula; relational association rules mining which
was a kind of classification method was used for defect prediction [14]. The irrelevant metrics were
eliminated by preprocessing. Catal and Diri investigated the effect of the dataset size, metrics sets, and
feature selection techniques on software fault prediction problem [5]. The methods which they investigated
758 Volume 10, Number 6, June 2015
Journal of Software
can be given as NB, RF, J48, Immunos1, Immunos2, CLONALG, AIRS1, AIRS2 and AIRSParallel. The metrics
which they used were McCabe’s, Halstead’s and object-oriented metrics. Finally, they claimed that the most
important factor was the soft computing method which was used to build the software fault prediction
model. Moreover, the performance of the prediction algorithm was affected by the dataset size. The most
meaningful object-oriented metric was coupling between objects and the most irrelevant object-oriented
metric was the depth of the inheritance tree. Mahaweerawat, Sophatsathit, Lursinsap and Musilek
developed a novel model named MASP to determine the faults in the object-oriented software systems and
achieved accuracy as 90% [15]. Gondra researched which software metric was more important for fault
prediction by using ANN and SVM [16]. In addition to this, he compared the results of the ANN and SVM
models. According to the study, SVM classified the software modules correctly with the rate of 87.4% while
ANN did the same job with the rate of 72.61%. Zimmermann, Premraj and Zeller predicted the software
faults on Eclipse which was an integrated development environment by using file-level, method-level and
class-level metrics [17]. The accuracy values which they achieved in the study were between 0.612 and
0.789. Zhou and Leung made software fault prediction experiments on KC1 dataset of NASA by employing
NB, RF and Nearest Neighbor algorithms [6]. They found that the metric of coupling between object was the
most useful metric for the fault prediction and the metrics of inheritance depth and lack of cohesion in
methods were the most meaningless metrics. Menzies, DiStefano, Orrego and Chapman made an
experiment on dataset of PROMISE repository by using NB and method-level metrics for the software fault
prediction [18]. The achieved recall value for the model was 55%. Catal surveyed 90 papers about software
fault prediction [11]. According to this survey, the software metrics were separated into 6 groups:
method-level, class-level, file-level, component-level, process-level and different quantitative values level
metrics. Between the years 1990 and 2007, the method-level metrics were used mostly. The most popular
evaluation criteria was AUC. Like the same manner, Radjenovic, Hericko, Torkar and Zivkovic investigated
the studies which were about software fault prediction [19]. The survey involved the studies which are
between 1991 and 2011. To investigate the software metrics and to discuss the suitability of them for the
fault prediction were the goals of this survey. According to survey, class-level metrics were more successful
than the method-level metrics. Thwin and Quah applied ANN by using the object-oriented metrics for
software quality prediction [1]. The object-oriented metrics were quite suitable for software quality and
maintenance effort prediction. Kanmani, Uthariaraj, Sankaranarayanan and Thambidurai made a software
fault prediction application of regression neural network with the object-oriented metrics [2]. Basili, Briand
and Melo investigated the suitability of Chidamber-Kemerer’s metrics set for the software fault prediction
[20]. They concluded that the metric set was suitable. In addition to this, coupling between objects,
response for a class and weighted methods per class were the most significant metrics in the
object-oriented metrics for the software fault prediction problem. Erturk and Sezer used FIS to predict
software faults for the first time [21]. They used datasets in PROMISE repository and McCabe’s metrics set.
They found that the effect of essential complexity metric wasn’t important for the software fault prediction
model and achieved AUC value as 0.7304. Erturk and Sezer used FIS with the object-oriented metrics to
predict software faults for the first time [22]. Although the size of the dataset (KC1) was small, the model
produced a successful AUC result (0.8047). Moreover, it was shown that lack of cohesion in methods and
depth of inheritance were not as significant as coupling between objects, response for a class and weighted
methods per class.
3. Method and Experiments
FIS presents a rule-based approach and the rules are extracted with the help of fuzzy logic and the
domain experts. According to fuzzy logic, each element belongs to a set with a particular membership
759 Volume 10, Number 6, June 2015
Journal of Software
degree [23]. The basic element of FIS is linguistic variables which can have linguistic values and fuzzy rules
are organized with linguistic variables by domain expert. Actually, each linguistic value corresponds to a
fuzzy set. Generally, measured or observed input parameters are in crisp format and they are mapped to
fuzzy sets by using a membership function. The output of membership function is a membership degree
(µA(x)) which denotes belonging degree of crisp value “x” to fuzzy set “A” and its value can be in the interval
of values between 0 and 1. Because of overlapping between fuzzy sets, some crisp values may belong to two
fuzzy sets at the same time and this enables us to be close with style of human thinking. For example, if the
threshold to be accepted as “tall” person is specified as “170 cm”, we cannot accept the “169 cm” as a “short”
absolutely. In this example, “height” is a linguistic variable, “tall” and “short” are fuzzy sets (linguistic
values), “170 cm” and “169 cm” are crisp values and, µtall(169) and µshort(169) are the belonging degrees
of “169 cm” to the “tall” and “short” fuzzy sets.
In our study, the values of the software metrics were used as crisp inputs and collected from PROMISE
repository; the software metrics were accepted as input linguistic variables and they have 3 possible
linguistic values or fuzzy sets: low(L), moderate(M) and high(H). The faultiness is accepted as output
linguistic variable and it has 2 possible linguistic values: low(L) and high(H). To handle fuzziness at the
maximum level, membership function of faultiness is organized with maximum overlapping between fuzzy
sets. The domain experts are the two authors who have experience on software engineering. They specify
the ranges of fuzzy sets (ranges of linguistic values of the metrics) and the fuzzy rules.
The phases of FIS can be changed according to the type of the FIS model. In this experiment,
Mamdani-style FIS [24] is used. Mamdani-style FIS comprises of four phases: fuzzification, rule evaluation,
aggregation and defuzzification.
1) Fuzzification: The crisp inputs are mapped with the fuzzy inputs by using the membership
functions. The membership function has some properties like shape, ranges which should be
adjusted by the domain experts. In the experiment, the triangle-shaped membership function is used
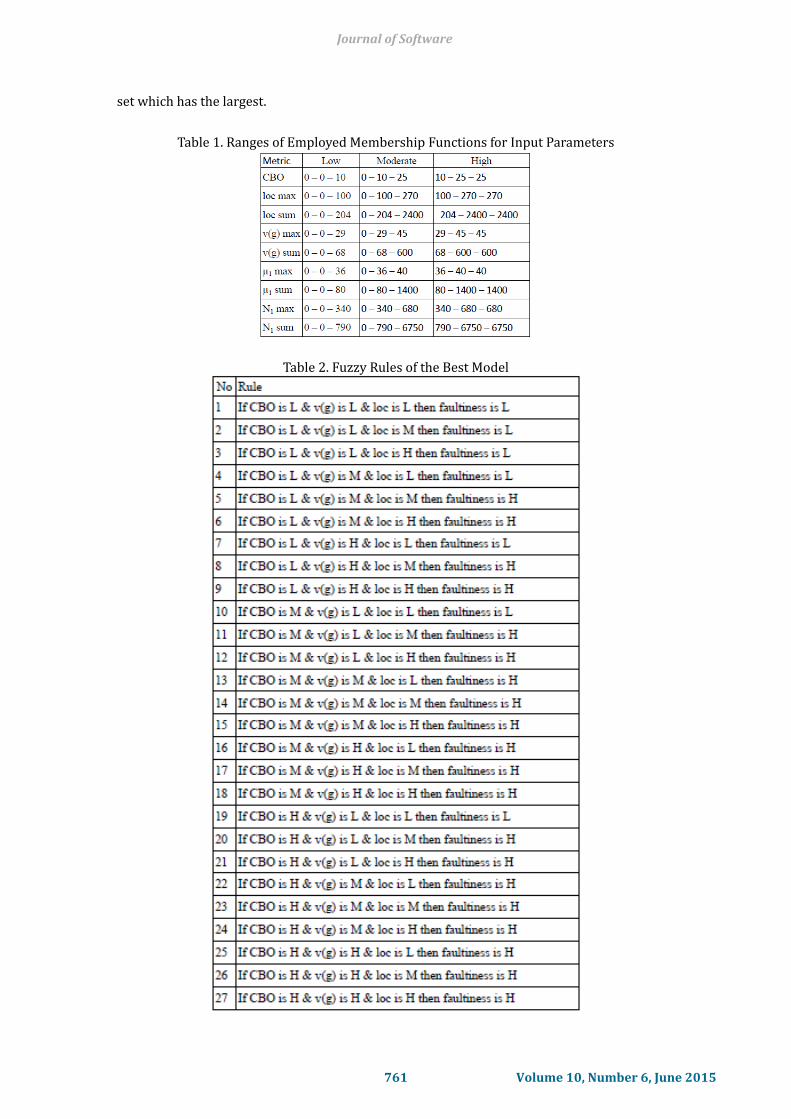
and the ranges of the fuzzy sets can be obtained from Table 1. The zero values (the first two points of
L fuzzy sets and the first points of M fuzzy sets) are standard for the lowest values of the metrics. The
last points of M fuzzy sets and the last two points of H fuzzy sets are the maximum values of the
metrics approximately. Finally, the other metric values (the middle points of the M fuzzy sets and the
first points of the H fuzzy sets) are the optimum values which separate the faulty and faultless
modules.
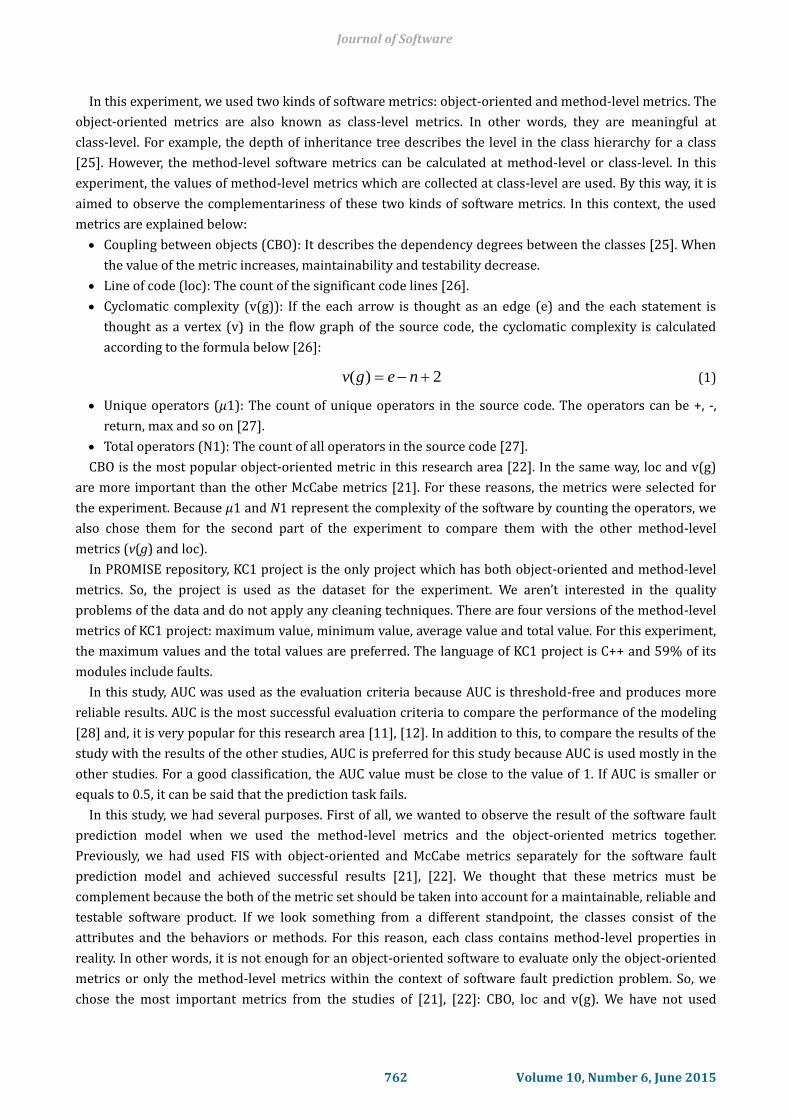
2) Rule evaluation: In this phase, fuzzy rules which are constituted by the domain experts are fired.
The typical fuzzy rule base resembles classical “If-Then” rules. They can include logical operators
such as “and-or-not” and fuzzy output of each rule is calculated here. In other words, firing strength
of each rule is calculated in this phase and we used “min” operator for this purpose. The rule set of
the most successful model of the study is given in Table 2. The rules are generated according to the
domain experts who have experience on the software metrics. The generated rules are transferable
from one project to another because the rules are general for the all software projects. For example;
if a class is high coupled with the other classes (CBO is high) and has too many lines (loc is high), it
has high risk to be faulty (faultiness is high).
3) Aggregation: The individual fuzzy outputs which are calculated in the second phase are aggregated
to produce single fuzzy output of the model. For this purpose, the “max” operator is applied in this
phase.
4) Defuzzification: The produced single fuzzy output is converted to the crisp output. The centroid
technique – center of gravity (COG) is used for this task in this study. Other methods could be
employed such as max method which calculates the crisp output as the membership degree of fuzzy
760 Volume 10, Number 6, June 2015
Journal of Software
set which has the largest.
Table 1. Ranges of Employed Membership Functions for Input Parameters
Table 2. Fuzzy Rules of the Best Model
761 Volume 10, Number 6, June 2015
Journal of Software
In this experiment, we used two kinds of software metrics: object-oriented and method-level metrics. The
object-oriented metrics are also known as class-level metrics. In other words, they are meaningful at
class-level. For example, the depth of inheritance tree describes the level in the class hierarchy for a class
[25]. However, the method-level software metrics can be calculated at method-level or class-level. In this
experiment, the values of method-level metrics which are collected at class-level are used. By this way, it is
aimed to observe the complementariness of these two kinds of software metrics. In this context, the used
metrics are explained below:
Coupling between objects (CBO): It describes the dependency degrees between the classes [25]. When
the value of the metric increases, maintainability and testability decrease.
Line of code (loc): The count of the significant code lines [26].
Cyclomatic complexity (v(g)): If the each arrow is thought as an edge (e) and the each statement is
thought as a vertex (v) in the flow graph of the source code, the cyclomatic complexity is calculated
according to the formula below [26]:
2)( negv (1)
Unique operators (µ1): The count of unique operators in the source code. The operators can be +, -,
return, max and so on [27].
Total operators (N1): The count of all operators in the source code [27].
CBO is the most popular object-oriented metric in this research area [22]. In the same way, loc and v(g)
are more important than the other McCabe metrics [21]. For these reasons, the metrics were selected for
the experiment. Because µ1 and N1 represent the complexity of the software by counting the operators, we
also chose them for the second part of the experiment to compare them with the other method-level
metrics (v(g) and loc).
In PROMISE repository, KC1 project is the only project which has both object-oriented and method-level
metrics. So, the project is used as the dataset for the experiment. We aren’t interested in the quality
problems of the data and do not apply any cleaning techniques. There are four versions of the method-level
metrics of KC1 project: maximum value, minimum value, average value and total value. For this experiment,
the maximum values and the total values are preferred. The language of KC1 project is C++ and 59% of its
modules include faults.
In this study, AUC was used as the evaluation criteria because AUC is threshold-free and produces more
reliable results. AUC is the most successful evaluation criteria to compare the performance of the modeling
[28] and, it is very popular for this research area [11], [12]. In addition to this, to compare the results of the
study with the results of the other studies, AUC is preferred for this study because AUC is used mostly in the
other studies. For a good classification, the AUC value must be close to the value of 1. If AUC is smaller or
equals to 0.5, it can be said that the prediction task fails.
In this study, we had several purposes. First of all, we wanted to observe the result of the software fault
prediction model when we used the method-level metrics and the object-oriented metrics together.
Previously, we had used FIS with object-oriented and McCabe metrics separately for the software fault
prediction model and achieved successful results [21], [22]. We thought that these metrics must be
complement because the both of the metric set should be taken into account for a maintainable, reliable and
testable software product. If we look something from a different standpoint, the classes consist of the
attributes and the behaviors or methods. For this reason, each class contains method-level properties in
reality. In other words, it is not enough for an object-oriented software to evaluate only the object-oriented
metrics or only the method-level metrics within the context of software fault prediction problem. So, we
chose the most important metrics from the studies of [21], [22]: CBO, loc and v(g). We have not used
762 Volume 10, Number 6, June 2015
Journal of Software
Halstead’s method-level metrics so far. Thus, we also chose Halstead’s operator metrics which are primitive
metrics, and related to the logical complexity. The chosen Halstead’s metrics are the closest ones to the
cyclomatic complexity metric because the operator metrics count the operators like “or”, “and”, “+”, “-”, “max”,
“min” which can be used in the statements like “if”, “while” that effect the cyclomatic complexity. We didn’t
think of using derived Halstead’s metrics because the derived metrics don’t provide more information than
the primitive ones provide and also using primitive and derived Halstead’s metrics together could cause
correlation. In this way, we wanted to perform two experiments whose the metric sets were: CBO-loc-v(g)
and CBO-loc-µ1-N1. However, KC1 dataset has 4 values for method-level metrics to transform them to
class-level as we have mentioned before. For example, the values of v(g) for a class is calculated for each
method of the class and the minimum, the maximum, the average and the sum v(g) values of the methods
are collected for the class. The calculation is done for the all method-level metrics to transform them to
class-level in the KC1 dataset. We thought that the maximum or sum values could be useful because
minimum and average metric values provide less information. And finally we decided to make 4
experiments for software fault prediction:
1) FIS model with CBO – sum loc – sum v(g)
2) FIS model with CBO – max loc – max v(g)
3) FIS model with CBO – sum loc – sum µ1 – sum N1
4) FIS model with CBO – max loc – max µ1 – max N1
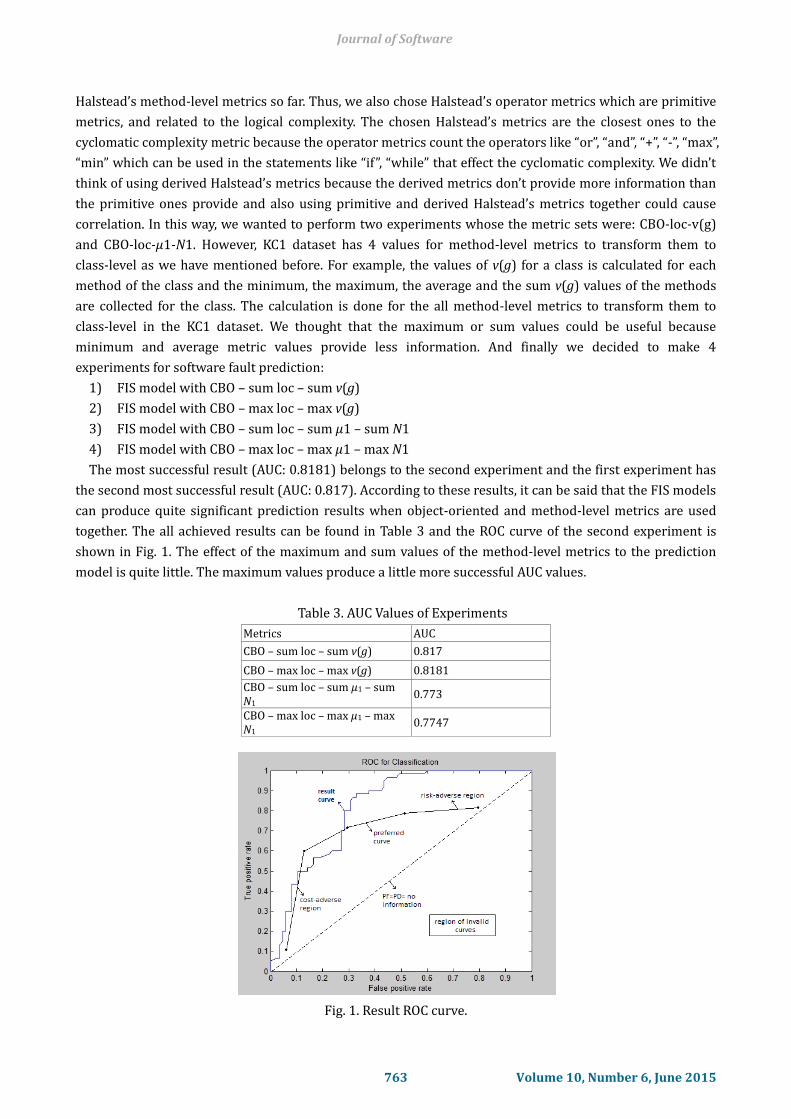
The most successful result (AUC: 0.8181) belongs to the second experiment and the first experiment has
the second most successful result (AUC: 0.817). According to these results, it can be said that the FIS models
can produce quite significant prediction results when object-oriented and method-level metrics are used
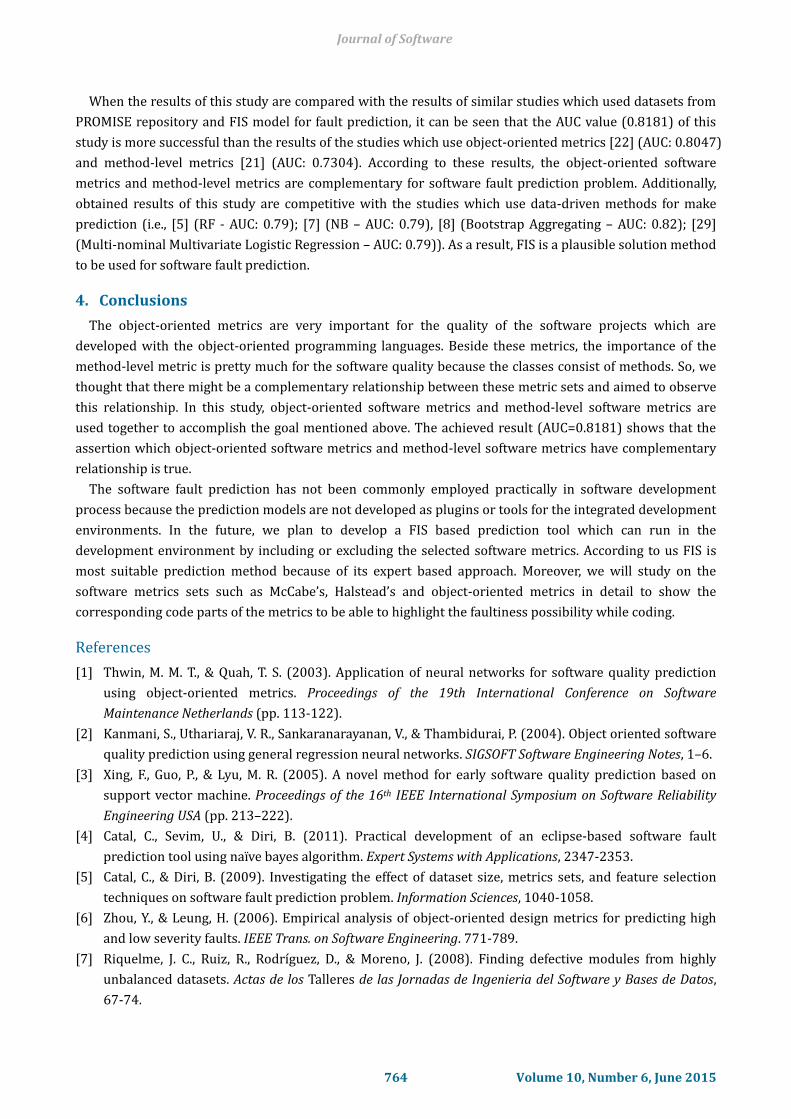
together. The all achieved results can be found in Table 3 and the ROC curve of the second experiment is
shown in Fig. 1. The effect of the maximum and sum values of the method-level metrics to the prediction
model is quite little. The maximum values produce a little more successful AUC values.
Table 3. AUC Values of Experiments
Metrics AUC
CBO – sum loc – sum v(g) 0.817
CBO – max loc – max v(g) 0.8181
CBO – sum loc – sum µ1 – sum N1
0.773
CBO – max loc – max µ1 – max N1
0.7747
Fig. 1. Result ROC curve.
763 Volume 10, Number 6, June 2015
Journal of Software
When the results of this study are compared with the results of similar studies which used datasets from
PROMISE repository and FIS model for fault prediction, it can be seen that the AUC value (0.8181) of this
study is more successful than the results of the studies which use object-oriented metrics [22] (AUC: 0.8047)
and method-level metrics [21] (AUC: 0.7304). According to these results, the object-oriented software
metrics and method-level metrics are complementary for software fault prediction problem. Additionally,
obtained results of this study are competitive with the studies which use data-driven methods for make
prediction (i.e., [5] (RF - AUC: 0.79); [7] (NB – AUC: 0.79), [8] (Bootstrap Aggregating – AUC: 0.82); [29]
(Multi-nominal Multivariate Logistic Regression – AUC: 0.79)). As a result, FIS is a plausible solution method
to be used for software fault prediction.
4. Conclusions
The object-oriented metrics are very important for the quality of the software projects which are
developed with the object-oriented programming languages. Beside these metrics, the importance of the
method-level metric is pretty much for the software quality because the classes consist of methods. So, we
thought that there might be a complementary relationship between these metric sets and aimed to observe
this relationship. In this study, object-oriented software metrics and method-level software metrics are
used together to accomplish the goal mentioned above. The achieved result (AUC=0.8181) shows that the
assertion which object-oriented software metrics and method-level software metrics have complementary
relationship is true.
The software fault prediction has not been commonly employed practically in software development
process because the prediction models are not developed as plugins or tools for the integrated development
environments. In the future, we plan to develop a FIS based prediction tool which can run in the
development environment by including or excluding the selected software metrics. According to us FIS is
most suitable prediction method because of its expert based approach. Moreover, we will study on the
software metrics sets such as McCabe’s, Halstead’s and object-oriented metrics in detail to show the
corresponding code parts of the metrics to be able to highlight the faultiness possibility while coding.
References
[1] Thwin, M. M. T., & Quah, T. S. (2003). Application of neural networks for software quality prediction
using object-oriented metrics. Proceedings of the 19th International Conference on Software
Maintenance Netherlands (pp. 113-122).
[2] Kanmani, S., Uthariaraj, V. R., Sankaranarayanan, V., & Thambidurai, P. (2004). Object oriented software
quality prediction using general regression neural networks. SIGSOFT Software Engineering Notes, 1–6.
[3] Xing, F., Guo, P., & Lyu, M. R. (2005). A novel method for early software quality prediction based on
support vector machine. Proceedings of the 16th IEEE International Symposium on Software Reliability
Engineering USA (pp. 213–222).
[4] Catal, C., Sevim, U., & Diri, B. (2011). Practical development of an eclipse-based software fault
prediction tool using naïve bayes algorithm. Expert Systems with Applications, 2347-2353.
[5] Catal, C., & Diri, B. (2009). Investigating the effect of dataset size, metrics sets, and feature selection
techniques on software fault prediction problem. Information Sciences, 1040-1058.
[6] Zhou, Y., & Leung, H. (2006). Empirical analysis of object-oriented design metrics for predicting high
and low severity faults. IEEE Trans. on Software Engineering. 771-789.
[7] Riquelme, J. C., Ruiz, R., Rodríguez, D., & Moreno, J. (2008). Finding defective modules from highly
unbalanced datasets. Actas de los Talleres de las Jornadas de Ingenieria del Software y Bases de Datos,
67-74.
764 Volume 10, Number 6, June 2015
Journal of Software
[8] Mende, T., & Koschke, R. (2009). Revisiting the evaluation of defect prediction models. Proceedings of
the 5th International Conference on Predictor Models in Software Engineering Canada.
[9] Retrieved, 2014, from http://www.
promise.site.uottawa.ca/SERepository/datasets/kc1-class-Level-defectiveornot.arff
[10] Retrieved, 2014, from http://promise.site.uottawa.ca/SERepository/datasets-page.html
[11] Catal, C. (2011). Software fault prediction: A literature review and current trends. Expert Systems with
Applications, 4626-4636.
[12] Catal, C. (2012). Performance evaluation metrics for software fault prediction studies. Acta Polytechnica
Hungarica, 193-206.
[13] Vandecruys, O., Martens, D., Baesens, B., Mues, C., Backer, M. D., & Haesen, R. (2008). Mining software
repositories for comprehensible software fault prediction models. Journal Systems and Software,
823–839.
[14] Czibula, G., Marian, Z., & Czibula, I. G. (2014). Software defect prediction using relational association
rule mining. Information Sciences, 260-278.
[15] Mahaweerawat, A., Sophatsathit, P., Lursinsap, C., & Musilek, P., (2006). MASP-An enhanced model of
fault type identification in object-oriented software engineering. Journal Advanced Computational
Intelligence and Intelligent Informatics, 312-322.
[16] Gondra, I. (2008). Applying machine learning to software fault-proneness prediction. Journal Systems
and Software, 186-195.
[17] Zimmermann, T., Premraj, R., & Zeller, A. (2007). Predicting defects for eclipse. Proceedings of the 3rd
International Workshop on Predictor Models in Software Engineering USA.
[18] Menzies, T., DiStefano, J., Orrego, A., & Chapman, R. (2004). Assessing predictors of software defects.
Proceedings of the 5th International Conference on Predictor Models in Software Engineering USA.
[19] Radjenovic, D., Hericko, M., Torkar, R., & Zivkovic, A. (2013). Software fault prediction metrics: A
systematic literature review. Information and Software Technology, 1397-1418.
[20] Basili, V. R., Briand, L., & Melo, W. L. (1996). A validation of object-oriented metrics as quality indicators.
IEEE Trans. on Software Engineering, 751-761.
[21] Erturk, E., & Sezer, E. A. (2013). Software fault prediction using Mamdani type fuzzy inference system.
Proceedings of the 3rd International Fuzzy Systems Symposium Turkey.
[22] Erturk, E., & Sezer, E. A. (2014). Software fault prediction using fuzzy inference system and
object-oriented metrics. Proceedings of the 13th IASTED International Conference on Software
Engineering Austria (pp. 101-108).
[23] Zadeh, L. A. (1965). Fuzzy sets, Information and Control, 338-353.
[24] Mamdani, E. H., & Assilian, S. (1975). An experiment in linguistic synthesis with a fuzzy logic controller.
International Journal Man-Machine Studies, 1-13.
[25] Chidamber, S. R., & Kemerer, C. F. (1994). A metrics suite for object oriented design. IEEE Trans. on
Software Engineering, 476-493.
[26] McCabe, T. (1976). A complexity measure. IEEE Trans. on Software Engineering, 308–320.
[27] Halstead, M. (1977). Elements of Software Science, New York: Elsevier North-Holland.
[28] Hall, T., Beecham, S., Bowes, D., Gray, D., & Counsell, S. (2012). A systematic literature review on fault
prediction performance in software engineering. IEEE Trans. on Software Engineerig, 1276-1304.
[29] Shatnawi, R., & Li, W. (2008). The effectiveness of software metrics in identifying error-prone classes in
post-release software evolution process. Journal Systems and Software, 1868-1882.
765 Volume 10, Number 6, June 2015
Journal of Software

Ezgi Erturk was born in Izmir from Turkey in 1987. She received her BSc in computer
engineering from the University of Hacettepe, Department of Computer Engineering in
2010. She is currently studying towards the degree of PhD in computer engineering from
the University of Hacettepe, Department of Computer Engineering. Her research
interests include software engineering, software metrics and fuzzy logic and she has
published several international conference proceedings about these subjects.
She is studying at the Scientific and Technological Research Council of Turkey, Software Technologies
Research Institute as a software engineer.
Ebru A. Sezer was born in Ankara from Turkey in 1974. She received her BSc, MSc and
PhD degrees from the University of Hacettepe, Department of Computer Engineering in
Turkey. Between 1997 and 2006, she was with the Department of Computer Engineering
at the University of Hacettepe, first as a Research Assistant, later as an Instructor.
She is presently an associate professor at Computer Engineering Department of the
University of Hacettepe. She has published around 30 articles about intelligent systems,
fuzzy logic, and susceptibility analysis and, two books chapters on soft computing
modeling and semantic information retrieval.
766 Volume 10, Number 6, June 2015
Journal of Software