Embed Size (px)
Citation preview

Software Design Manual Computer Code to Estimate Future Activity and Air Emissions from Electric Generating Units (EGUs)
Prepared by:
MACTEC Engineering and Consulting, Inc. 21740 Beaumeade Circle, Suite 150 Ashburn, VA 20147 Prepared for:
Mid-Atlantic Regional Air Management Association, Inc. 8600 Lasalle Road, Suite 636 Towson, MD 21286 April 21, 2011
Software Design Document for ERTAC EGU Projection Methodology April 21, 2011 Page i
Table of Contents
1.0 INTRODUCTION................................................................................................................... 1
2.0 SOFTWARE AND HARDWARE ......................................................................................... 3
2.1 FEATURES OVERVIEW .................................................................................................. 3
2.2 SOFTWARE REQUIREMENTS ....................................................................................... 3
2.2.1 Linux Operating System .............................................................................................. 4
2.2.2 Python Programming Language ................................................................................. 4
2.2.3 SQLite Database Management System ....................................................................... 4
2.3 HARDWARE REQUIREMENTS ...................................................................................... 5
3.0 FUNCTIONAL DESIGN CONCEPTS................................................................................. 6
4.0 NARRATIVE OUTLINE OF DECISION RULES ............................................................. 9
4.1 DEFINITIONS .................................................................................................................... 9
4.2 GROWTH IMPLEMENTATION .................................................................................... 10
4.3 CAPACITY ASSIGNMENTS .......................................................................................... 15
4.4 CONTROL INSTALLATION TO MEET EMISSION CAPS ......................................... 18
4.5 OUTPUTS AND REPORTING ........................................................................................ 20
5.0 PROCESSING OVERVIEW ............................................................................................... 21
5.1 PRE-PROCESSING ......................................................................................................... 21
5.2 MAIN PROCESSING ....................................................................................................... 21
5.3 POST-PROCESSING ....................................................................................................... 21
6.0 PRE-PROCESSING MODULE .......................................................................................... 23
6.1 PRE-PROCESSING OVERVIEW ................................................................................... 23
6.2 RAW INPUT DATA FILE FORMATS ............................................................................ 28
6.3 PRE-PROCESSING OUTPUT DATA FILE FORMATS ................................................ 41
6.4 PS-0 RAW INPUT DATA FILE DATA VALIDATION ................................................. 54
6.4.1 PS-0.1 Perform Initial Processing of Hourly Data Files ......................................... 54
6.4.2 PS-0.2 Perform Initial Processing of Unit Availability File..................................... 55
6.4.3 PS-0.3 Perform Initial Processing of Growth Rate File ........................................... 56
6.4.4 PS-0.4 Perform Initial Processing of Input Variables File ...................................... 56
6.4.5 PS-0.5 Perform Initial Processing of Control and Emissions File ........................... 57
6.4.6 PS-0.6 Perform Referential Integrity of Raw Input Data Files ................................ 57
6.5 PS-1 HOURLY DATA INPUT FILE PRE-PROCESSING .............................................. 59
6.5.1 PS-1.1 Perform Initial Processing of CAMD Hourly Data File ............................... 59
Software Design Document for ERTAC EGU Projection Methodology April 21, 2011 Page ii
6.5.2 PS-1.2 Perform Initial Processing of ERTAC Hourly Data File .............................. 61
6.5.3 PS-1.3 Calculate Base Year Unit Parameters .......................................................... 62
6.5.4 PS-1.4 Calculate Unit Hierarchy for Existing Units ................................................ 64
6.5.5 PS-1.5 Update Unit Availability File and Unit Hierarchy for New Units ................ 64
6.5.6 PS-1.6 Calculate Hourly Hierarchies ....................................................................... 65
6.5.7 PS-1.7 Calculate Proxy Generation for New Units .................................................. 66
6.5.8 PS-1.8 Calculate Generation Parameters ................................................................ 67
7.0 MAIN PROCESSING MODULE ....................................................................................... 71
7.1 MAIN PROCESSING OVERVIEW ................................................................................ 71
7.2 PROCESS 2 – INITIALIZE DATABASE ........................................................................ 76
7.3 PROCESS 3 – POWER CAPACITY DEFICIT CHECK .................................................. 76
7.3.1 Process 3.5: Power Capacity Deficit Check ............................................................ 76
7.3.2 Process 3.5Y.1: Addition of New Generic Units ...................................................... 76
7.3.3 Process 3.5Y.2: Generic Units ................................................................................. 76
7.3.4 Process 3.6: Recalculation of the unit allocation order .......................................... 76
7.4 PROCESSES 4 TO 9: ALLOCATE HOURLY GENERATION TO UNITS .................. 77
7.4.1 Process 4.1: Check Adjusted Future Year Growth Rate ........................................... 77
7.4.2 Process 4Y.1: Flag Excess New Capacity ................................................................ 77
7.4.3 Process 4Y2 and 4.5: Assign Generation to New Units ........................................... 77
7.4.4 Process 4Y.2a and 5: Initial Growth of Existing Units to Future Year ................... 77
7.4.5 Process 4Y.3: Checking End of the Hour Hierarchy ............................................... 77
7.4.6 Process 6: Initial Capacity Check ........................................................................... 78
7.4.7 Process 7: Utilization of the Unit ............................................................................ 78
7.4.8 Process 8: Summing the ExGenPool ....................................................................... 78
7.5 PROCESSES 10 TO 18: ALLOCATE THE EXCESS GENERATION POOL ................ 79
7.5.1 Process 10.5: Allocation .......................................................................................... 79
7.5.2 Process 12 and 14Y.2: Checking for the Unit Optimal Load Threshold ................. 79
7.5.3 Process 16: Allocate Generation and Check Maximum Rated Capacity ................ 79
7.6 PROCESSES 19 TO 24: SPINNING RESERVE CHECKS ............................................ 80
7.6.1 Process 19: List Demand Deficits............................................................................ 80
7.6.2 Processes 20 and 21: Determine Required Reserve Capacity................................. 80
7.6.3 Process 22 to 24: Identify When/Where More Capacity Is Needed ......................... 80
7.7 PROCESSES 25 TO 31: EMISSION CALCULATIONS ................................................ 81
7.7.1 Process 26: Calculation of Emission Rates ............................................................. 81
7.7.2 Process 26.5: Addition of Controls .......................................................................... 81
7.7.3 Process 27: Criteria Pollutant Policy Check ........................................................... 81
7.7.4 Process 27.5: Assignment of “generic” emissions controls .................................... 81
Software Design Document for ERTAC EGU Projection Methodology April 21, 2011 Page iii
7.7.5 Process 29 and 30: Climate change checks ............................................................. 81
8.0 POST-PROCESSING MODULE ........................................................................................ 82
8.1 EXCESS GENERATION IN A REGION BY STATE AND ERTAC FUEL/UNIT TYPE
BIN 82
8.2 GENERATION CAPACITY DEMAND DEFICIT REPORT ......................................... 82
8.3 GENERATION REPORT ................................................................................................. 83
8.4 GENERATION CAPACITY RESERVE DEFICIT REPORT ......................................... 83
8.5 HOURLY GENERATION DATABASE BY UNIT ........................................................ 84
8.6 CRITERIA POLLUTANT CONTROL EQUIPMENT INSTALLATION REPORT ...... 84
8.7 SIP REPORT ..................................................................................................................... 84
8.8 AQ MODELING DATABASE ........................................................................................ 85
8.9 CLIMATE CHANGE CAP COMPLIANCE REPORT .................................................... 85
9.0 REFERENCES ...................................................................................................................... 86
Software Design Document for ERTAC EGU Projection Methodology April 21, 2011 Page iv
List of Exhibits
Exhibit 2.1 Example of Hour Specific Growth Rates
Exhibit 5.1 Logical Level Data Flow Diagram
Exhibit 6.1 Pre-Processing Overview Diagram
Exhibit 6.2 Raw Input Data Files for Pre-processing
Exhibit 6.3 Lookup Tables for Pre-processing
Exhibit 6.4 Output Database Tables from Pre-processing
Exhibit 6.5 Record Estimates for Input Files
Exhibit 6.6 Format for CAMD_HOURLY_BASE
Exhibit 6.7 Format for ERTAC_HOURLY_NONCAMD
Exhibit 6.8 Format for ERTAC_INTIAL_UAF
Exhibit 6.9 Format for ERTAC_GROWTH_RATES
Exhibit 6.10 Format for ERTAC_INPUT_VARIABLES
Exhibit 6.11 Format for ERTAC_CONTROL_EMISSIONS
Exhibit 6.12 Record Estimates for Pre-processing Output Files
Exhibit 6.13 Format for CALC_HOURLY_BASE
Exhibit 6.14 Format for CALC_UPDATED_UAF
Exhibit 6.15 Format for CALC_UNIT_HIERARCHY
Exhibit 6.16 Format for CALC_1HOUR_HIERARCHY
Exhibit 6.17 Format for CALC_6HOUR_HIERARCHY
Exhibit 6.18 Format for CALC_24HOUR_HIERARCHY
Exhibit 6.19 Format for CALC_GENERATION_PROXY
Exhibit 6.20 Format for CALC_GENERATION_PARMS
Exhibit 6.21 Pre-Processing Module Data Flow Diagram
Exhibit 7.1 Main Processing Module Data Flow Diagram

Software Design Document for ERTAC EGU Projection Methodology April 21, 2011 Page v
Acronyms and Abbreviations
Acronym Description
AEO Annual Energy Outlook
Btu British Thermal Unit
CAMD Clean Air Markets Division (USEPA)
CAP Criteria Air Pollutant
CEM Continuous Emission Monitor
CO Carbon Monoxide
CO2 Carbon Dioxide
CO2e Carbon Dioxide equivalent
EGU Electric Generating Unit
EIA Energy Information Administration
ERTAC Eastern Regional Technical Advisory Committee
FIPS Federal Information Processing Standard
IPM Integrated Planning Model
KW Kilowatt
LADCO Lake Michigan Air Directors Consortium
MARAMA Mid-Atlantic Regional Air Management Association
MJO Multi-Jurisdictional Organization
mmBtu Million British Thermal Units
MW Megawatt
NAAQS National Ambient Air Quality Standards
NEEDS National Electric Energy Data System
NEMS National Energy Modeling System
NERC North American Electric Reliability Corporation
NH3 Ammonia
NOx Oxides of nitrogen
ORL One-record-per-line (SMOKE Format)
OTAQ Office of Transportation and Air Quality (USEPA)
PM-CON Primary PM, Condensable portion only ( < 1 micron)
PM-FIL Primary PM, Filterable portion only
PM-PRI Primary PM, includes filterables and condensables PM-PRI= PM-FIL + PM-CON
PM10-FIL Primary PM10, Filterable portion only
PM10-PRI Primary PM10, includes filterables and condensables, PM10- PRI = PM0-FIL + PM-CON
PM25-FIL Primary PM2.5, Filterable portion only
PM25-PRI Primary PM2.5, includes filterables and condensables PM25-PRI= PM25-FIL + PM-CON

Software Design Document for ERTAC EGU Projection Methodology April 21, 2011 Page vi
Acronym Description
RPO Regional Planning Organization
SCC Source Classification Code
SNCR Selective non-Catalytic Reduction
SCR Selective Catalytic Reduction
SIP State Implementation Plan
S/L State/local
SMOKE Sparse Matrix Operator Kernel Emissions
SO2 Sulfur Dioxide
USEPA U.S Environmental Protection Agency
VOC Volatile Organic Compounds

Software Design Document for ERTAC EGU Projection Methodology April 21, 2011 Page 1
1.0 INTRODUCTION
The Eastern Regional Technical Advisory Committee (ERTAC) for the electric generating unit
(EGU) growth methodology is a collaborative effort among the Northeastern, Mid-Atlantic,
Southeastern, and Lake Michigan area states; other member states; industry representatives; and
multi-jurisdictional planning organization (MJO) representatives. The purpose of the committee
is to craft an emissions modeling methodology for use by state and regional air quality planning
entities to grow base year hourly EGU inventories into future projection years for air quality
impact assessment on both an annual and episodic peak basis.
Development of future year emissions inventories for the EGU sector is an important step in the
identification of attainment strategies for areas that experience poor air quality and for
maintenance strategies for areas that need to maintain acceptable air quality levels of ozone and
PM2.5. The EGU sector is a significant component of the emissions inventory used in regional air
quality forecasting. For example, the EGU units that report to the Clean Air Markets Division
(CAMD) in the Mid Atlantic Regional Air Management Association’s (MARAMA) region
accounted for approximately 14 percent of all NOx emissions and 78 percent of all SO2
emissions in 2007.
In the last round of planning the Integrated Planning Model (IPM) was used to estimate future
EGU emissions. EGU emissions estimates were key inputs to air quality modeling designed to
demonstrate compliance with the 1997 ozone and PM2.5 National Ambient Air Quality Standards
(NAAQS) and the Regional Haze requirements. IPM is proprietary software, the cost for each
model run was high, and each model run required between three and six months of time to
complete.
Since the model is proprietary, states found it difficult to provide the required level of clarity in
Clean Air Act (CAA) submittals. States experienced difficulty in accounting for model results
that appeared to be contrary to the information available to the states and MJOs. Due to these
issues, state and MJO staff are developing an alternative to IPM for future year CAMD EGU
data projections, and the ERTAC Growth Committee was formed to develop this alternative
methodology for forecasting activity in the CAMD EGU sector.
The charge for the ERTAC Growth Committee is to craft an emissions modeling methodology
for use by state and regional air quality planning entities to grow base hourly EGU inventories
into future projection years for air quality impact assessment on both an annual and episodic
peak basis. Results should be easy to compare to CAMD unit-level emissions data, easy to
understand, well-documented, and flexible. The inventories must account for fuel-specific
generation trends and constraints for at least a 20 year projection period. Unit operations may
not be grown past the installed capacity limits, and operational reserve requirements must be

Software Design Document for ERTAC EGU Projection Methodology April 21, 2011 Page 2
respected on a regional basis. The results must be robust enough to enable emission reduction
strategy policy assessments for the CAMD EGU fleet.
MARAMA issued a contract to MACTEC Engineering and Consulting, Inc. to obtain assistance
in developing the code to implement growth and control projections for the existing EGU fleet
for all facilities in the lower 48 states.
The code will be used by states, multi-jurisdictional organizations (MJOs), and potentially other
organizations to estimate EGU activity and emissions in the regional inventory. These
inventories are critical inputs to an integrated, one-atmosphere air quality modeling platform to
support state air quality attainment demonstrations and will be used in inventories needed for
State Implementation Plan (SIP) development.

Software Design Document for ERTAC EGU Projection Methodology April 21, 2011 Page 3
2.0 SOFTWARE AND HARDWARE
2.1 FEATURES OVERVIEW
The ERTAC EGU growth committee requested that the software development be done using
languages readily available on common Linux distributions and that the system code be open
source and available to the states. Since the EGU hourly datasets contain many gigabytes of
data, there is a need to use database management software to effectively handle the large amount
of information needed for growth projections. An additional need for this system is the
capability to create reports and data exports in an easily-read format such as CSV (comma-
separated values) that can be used by spreadsheet programs such as Microsoft Excel and by other
databases such as Microsoft Access. Finally, it is expected that many different people in
separate organizations will want to install and use this system, so the necessary software should
be readily available, and not too complex to setup and operate.
2.2 SOFTWARE REQUIREMENTS
We have proposed using the SQLite database software to manage the data, and the Python
programming language to perform the various processing steps. These choices were influenced
by the following factors. We selected SQLite for the database component rather than MySQL or
PostgreSQL primarily because SQLite is simpler to install and administer. This system will not
require the capabilities of a multi-user client-server database, so there is no need to burden the
users with that kind of complexity.
We suggested the Python language because it is a widely-used programming language which
will allow ERTAC to modify their growth projection system in the future, and the Python
database API supports database bindings for all of MySQL, PostgreSQL, and SQLite, as well as
other database management software. Both SQLite and Python also include good support for
reading and writing data in CSV format to allow transfer to other systems.
This system will be developed to run under Linux, using Python and SQLite. The main software
components shall be as follows:
A recent version (within 5 years, say) of Linux from either the developer community or a
commercial enterprise.
A recent version of Python and
A recent version of SQLite should both be available in the distributor's standard software
repositories, if not already installed.

Software Design Document for ERTAC EGU Projection Methodology April 21, 2011 Page 4
As an example software configuration, MACTEC is currently using Python version 2.5.2 and
SQLite3 version 3.4.2 installed on a development system running Ubuntu 8.04 LTS (long-term
support) which was released in April 2008.
It may be possible to run the growth projection system under Microsoft Windows, as well.
Python and SQLite are both available for Windows, so the same ERTAC model might run on a
Windows computer with little or no modification required.
Here is some additional background information about Linux, Python, and SQLite.
2.2.1 Linux Operating System
Linux is a Unix-like operating system kernel originally developed by Linus Torvalds in 1991,
and updated since then with contributed code from thousands of programmers. It is distributed
under the licensing terms of the GPL, which allows the software to be used and modified by
anyone. The Linux kernel is frequently packaged with utility and application programs to make
up what is called a "Linux distribution" by developer communities and by commercial
enterprises. Some widely-used Linux distributions with community and/or commercial support
include Debian GNU/Linux, Fedora Linux and Red Hat Enterprise Linux (both from Red Hat),
openSUSE and SUSE Linux Enterprise (both from Novell), Oracle Linux (from Oracle), and
Ubuntu (from Canonical Ltd). Programs developed under Linux can be ported readily to other
Unix and Unix-like operating systems, such as AIX, FreeBSD, HP-UX, Mac OS X, and Solaris.
Versions of Linux run on a wide variety of systems, ranging from Android smartphones and Tivo
digital video recorders up to IBM mainframes and some of the largest and fastest supercomputers
in the world.
2.2.2 Python Programming Language
Python is a programming language originally developed by Guido van Rossum in 1991, which
runs on Linux, Mac OS X, and other Unix-like operating systems, and on Microsoft Windows.
Python has a royalty-free open-source license which grants the rights for it to be freely usable
and distributable, even for commercial use. Python has a fairly compact language core that was
designed to be easily extensible, and comes with a large standard library suitable for many
different types of usage. Python is included as an embedded language in many software
products; for example, it is the preferred scripting language for use within ESRI's ArcGIS.
2.2.3 SQLite Database Management System
SQLite is an embedded database management system originally developed by Richard Hipp in
2000, which is implemented as a library which is linked into an application instead of requiring a
separate client-server database engine. SQLite source code has been explicitly put into the
public domain by its authors, requiring no license to use it for any purpose. The developers

Software Design Document for ERTAC EGU Projection Methodology April 21, 2011 Page 5
continue to enhance SQLite and provide support for the software. SQLite has precompiled
binaries available to install on Linux, Mac OS X, and Microsoft Windows, and available source
code written in C which can be compiled for other operating systems.
2.3 HARDWARE REQUIREMENTS
While it might be possible to run this software on something as low-end as an old Pentium III
laptop with 192 MB RAM and a 20 GB hard drive, model performance on such hardware would
be quite sluggish. We expect that there is a broad range of computer hardware currently being
used to run other models by the same users who will want to run ERTAC's growth projection
system. Here are some guidelines about how different hardware options are likely to affect
performance:
All else being equal, newer faster CPUs will improve model speed (naturally), but
hyperthreading, multi-core CPUs, and multiple-CPU systems are unlikely to provide
much improvement since the ERTAC algorithm is inherently not parallel. Decisions
about load levels for a particular unit must be made before any units that fall later in the
assignment hierarchy, so the entire model is made up of several sequential iterative
phases. Still, having other cores or CPUs available to handle other tasks would still be
somewhat beneficial, since other processes will be running on the same computers as the
ERTAC model.
There is not much benefit expected from possibly running in 64-bit mode instead of 32-
bit mode, except for the secondary effect that 64-bit addressing does allow use of more
than 4GB of RAM. Having a lot of RAM available is generally helpful, provided that it
is properly configured. We have seen systems that performed poorly because they had
slow mismatched memory modules installed, and when matched sets of faster modules
were installed in a fully-interleaved mode the measured RAM bandwidth improved by
nearly three-fold.
The amount of disk storage needed will depend on how many different scenarios any
particular person or agency wants to keep available, since each dataset will occupy many
gigabytes of disk space. Higher-speed drives, and multiple drives configured in some
kind of striping arrangement (such as RAID 0, RAID 5, and RAID 1+0) will improve the
I/O performance while reading these large datasets.

Software Design Document for ERTAC EGU Projection Methodology April 21, 2011 Page 6
3.0 FUNCTIONAL DESIGN CONCEPTS
The functional scope of the ERTAC EGU projection system can be summarized as follows:
Geography: The program addresses emission units in the lower 48 States and the District of
Columbia. The model does not include power generating resources in Canada or Mexico.
Time Spans: The model is designed to project generation and emissions from a base year to
a single future year. It will rely on actual base year hourly data (initially 2007), and future
EGU forecasts will reflect the meteorology and other factors used in regional air quality
analyses and plans. Each execution of the model will perform projections for a specific year.
All generation and emission values are calculated on an hourly basis.
Emission Units: The model is designed to include emission units that are subject to Volume
40 Part 75 of the Code of Federal Regulations (CFR). This rule requires an hourly
accounting of the emissions from each affected unit - i.e., sources participating in an
emissions cap and trade program under the Acid Rain Control Program, the NOx Budget
Trading Program, or the Clean Air Interstate Rule. States have to identify lists of units
subject to the reporting rule that are not “true EGUs” and will not be included in the ERTAC
methodology for projecting emissions using factors associated with electrical production.
Unit Types: Each unit is assigned to a fuel and combustion type bin. Five bins are used:
coal units, oil units, natural gas combined cycle units, natural gas simple cycle units, and
natural gas boilers.
Partial Year Reporters: Most, but not all, units are full-year reporters with 8,760 hours of
data. Partial year reporters are generally required to report to EPA for the 5-month ozone
season (May to September). Hourly data for nonozone season can be derived in one of three
ways: 1) a state can provide the non-reported time period’s hourly data in the appropriate
format so that the unit becomes an ersatz full year reporter; 2) a state can provide the
annual_hi_partials for the unit, and for the nonreported months, a 24/7 profile of continuous
operations will be assumed for the non-ozone season and used to create hourly nonreported
data, and the program will treat the partial year reporter like an ersatz full year reporter; 3) if
no annual heat input or hourly non-reported time period data is provided, the unit is assumed
to not operate in the non-reported time period, and is assumed to not operate in the future
year during that time period as well.
Power Pools: Each unit is assigned to a geographic region used to dispatch generation in the
model. The ERTAC model regions are approximately consistent with the configuration of
the North American Reliability Council (NERC) control areas regions used in the Energy
Software Design Document for ERTAC EGU Projection Methodology April 21, 2011 Page 7
Information Administration’s (EIA’s) National Energy Model System (NEMS) which is the
basis for EIA’s Annual Energy Outlook (AEO) reports. As presently configured, the model
does not allow the transfer of generating resources between regions.
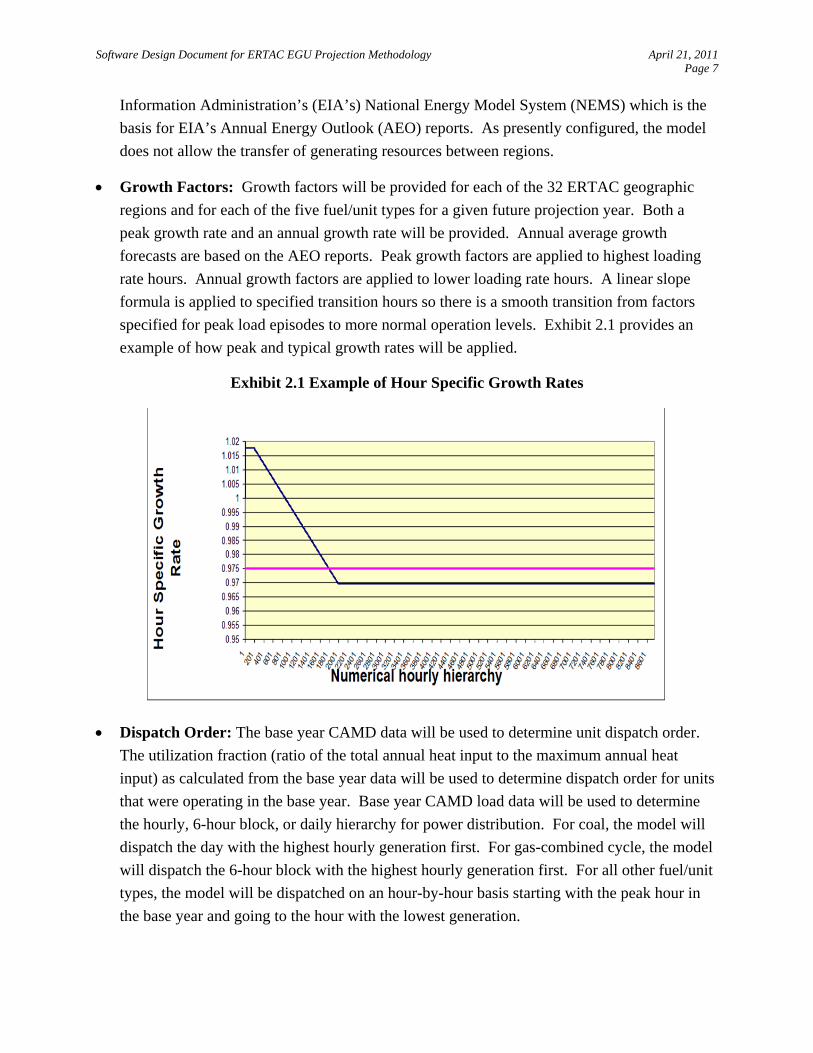
Growth Factors: Growth factors will be provided for each of the 32 ERTAC geographic
regions and for each of the five fuel/unit types for a given future projection year. Both a
peak growth rate and an annual growth rate will be provided. Annual average growth
forecasts are based on the AEO reports. Peak growth factors are applied to highest loading
rate hours. Annual growth factors are applied to lower loading rate hours. A linear slope
formula is applied to specified transition hours so there is a smooth transition from factors
specified for peak load episodes to more normal operation levels. Exhibit 2.1 provides an
example of how peak and typical growth rates will be applied.
Exhibit 2.1 Example of Hour Specific Growth Rates
Dispatch Order: The base year CAMD data will be used to determine unit dispatch order.
The utilization fraction (ratio of the total annual heat input to the maximum annual heat
input) as calculated from the base year data will be used to determine dispatch order for units
that were operating in the base year. Base year CAMD load data will be used to determine
the hourly, 6-hour block, or daily hierarchy for power distribution. For coal, the model will
dispatch the day with the highest hourly generation first. For gas-combined cycle, the model
will dispatch the 6-hour block with the highest hourly generation first. For all other fuel/unit
types, the model will be dispatched on an hour-by-hour basis starting with the peak hour in
the base year and going to the hour with the lowest generation.

Software Design Document for ERTAC EGU Projection Methodology April 21, 2011 Page 8
New Capacity Assignments: Assignment of new units is based on state input and federal
data for units that are firmly in the post-2007 pipeline. If known new units are not sufficient
to meet future demands, a “grow in place” strategy will be used to assign new generic
generation to each region for each ERTAC fuel/unit type bin category based on reasonable
default unit sizes. For example, the first new generic unit will be “located” at the facility in
the region that has the largest total (all fuels) capacity and burns that type of fuel. The
second new unit will be “located” at the facility in that region that has the second largest
capacity and burns that type of fuel, etc. Emission rates for new units will be set at level that
represents the cleanest units for that region.
Future Year SO2, NOx, and CO2 Emission Rates: The base year emission rates
(lbs/mmBtu) for SO2, NOx, and CO2 will be used for the future year unless otherwise
specified by the user. Because some units had seasonal controls in the base year, two base
year emission rates will be calculated for each unit and pollutant: a 7-month winter season
(Jan-Apr, Oct-Dec) rate and a 5-month ozone season (May-Dec) rate. If the user desires to
change the base year emission rates (for installed or planned control systems, for example),
the user is required to provide relevant information (new emission rate or percent reduction
from the base year) via the emission control file.
Future Year Emission Rates for Other Pollutants: If the user desires that emissions be
calculated for pollutants other than SO2, NOx, and CO2, the user must supply emission
factors for each unit and pollutant via the emission control file.
Future Year Emission Constraints: The model may consider an array of emission
constraints for SO2, NOx, and CO2. The scope, timing, and definition of the emission
constraints depend on the required analysis. If there is insufficient control of a pollutant in a
region to meet the requirements of a regulatory program being examined given the future
year emission rates provided by the user, the user will assign additional controls in an
iterative process to meet any required emission constraint. As a future enhancement to the
code, the model may have the capability to intelligently assign generic controls to individual
units to meet regulatory requirements.
Model Outputs: The primary output of this model will be a file ready for either direct use in
the photochemical model or merging with other inventory files for use in the model.
Reports: The model will output reports that identify deficiencies in generation and emissions
controls to allow informed intervention by State staff. The model will also output a file
identifying the units, peak hourly generation or heat input, and annual generation or heat
input.

Software Design Document for ERTAC EGU Projection Methodology April 21, 2011 Page 9
4.0 NARRATIVE OUTLINE OF DECISION RULES
This section contains the ERTAC EGU Growth Implementation Subgroup’s Narrative Outline of
Decisions and Rules for the Model, dated 12/20/2010.
4.1 DEFINITIONS
A. Power Pool – the smallest region used to dispatch generation in the model. This
may be equivalent to a NERC Region, ISO/RTO Region or other logical dispatch
area.
B. Growth Pool – the generation needs above the base inventory based on projected
growth over the base period and the generation supplied by any units retired
between the base period and the projection year.
C. Base Inventory – The normalized hourly inventory used for the base case
modeling. This inventory may be adjusted by the user to remove inconsistencies
such as annual outage events on a unit or overly conservative missing data
substitution alorithms. The data required includes emissions, hourly generation,
and hourly heat input.
D. Spinning Reserve – The minimum reserve required is equal to the maximum
single contingency or 6% of the combined load and generation in the power pool.
For purposes of this exercise it shall be defined as 100% of the largest unit of any
type in the power pool being modeled.
E. Excess Generation Pool – The accumulation of the generation in excess of the
capacity of the units of a given fuel/unit type in a power pool. This generation
will preferentially be allocated to units with remaining capacity in the power pool
of origin, but it may also be allocated to units in adjacent power pools if
generating and transmission capacity is available. The algorithm may not initially
have the capability to allocate power from more than one region to the same unit.
That feature may be added later in the process of development.
F. Anomalous Units – Those units that are off line or operating at a very low
capacity when normally that unit would be on line and operating at a significantly
higher capacity. Examples of anomalous units are an unforeseen shutdown of a
unit due to malfunction or a unit that is dispatched in a fashion that is unusual
during the base inventory period.
G. Filled Emission Records – In some cases the data in CAMD records was not
collected by a continuous emission monitor. There are several reasons why that
Software Design Document for ERTAC EGU Projection Methodology April 21, 2011 Page 10
might occur including: the continuous emission monitor might be off-line,
malfunctioning or out of calibration. In these cases, CAMD has established
protocols for how the data can be filled. In general, the filled data is conservative,
meaning the reported concentrations are higher than might reasonably be expected
to be emitted.
4.2 GROWTH IMPLEMENTATION
A. Units will only be retired through a manual process led by the State in which that
unit is located. Generation attributed to retired capacity will be added to the
growth pool for the given fuel type to be dispatched over the generating fleet in
the projection year.
B. Overall generation for a region will be dispatched with renewables and nuclear
units first, then coal, gas, and oil units depending on the relative fuel costs
between coal, gas, and oil. This model will not deal with renewables and nuclear
units explicitly. Changes in generation from these sources will impact generation
predictions in coal, gas, and oil.
C. All future generation in a region will be met by units located in that region; that
is, transfer of generation from one region to another is not allowed because of the
complexity of accounting for the transmission from one region to another. As a
futue enhancement, the model may allow a generating unit in one power pool
dispatched by another pool if a long term agreement is in place and properly
documented by either the State receiving the energy or the State hosting the unit.
This may be a functionality that is added to a later version of the model.
D. Unit Dispatch Order Issues
1. The base year hourly data will be used to determine unit dispatch order.
2. Use of actual load data in determining dispatch order implicitly sets the
cost relationship between the fuels (coal-gas-oil-nuclear-renewable) based
on the base year relationships. Changes in the future are implicitly
included by changes in the growth factors in the power pool.
3. The utilization fraction as calculated from the base year data will be used
to determine dispatch order for units that were operating in the base year.
Utilization fraction is the ratio of the total annual to maximum annual heat
input for a unit: (total annual heat input/(maximum hourly rated capacity
* 8,760 hours/year).

Software Design Document for ERTAC EGU Projection Methodology April 21, 2011 Page 11
E. Hourly Hierarchy Issues
1. Base year CAMD load data will be used to determine the hourly, 6-hour
block, or daily hierarchy for power distribution.
2. For all fuel/unit types except coal and gas-combined cycle, the model
will be dispatched on an hour-by-hour basis starting with the peak hour in
the base year and going to the hour with the lowest generation.
3. For coal, the model will dispatch the day with the highest hourly
generation first. The model will dispatch the hours in that day from 0 to
23, in order. The next day to be dispatched will be the day with the
highest hourly generation where that hour has not yet been allotted
generation. This methodology is used to prevent coal fired units from
being frequently turned on and off.
4. For gas-combined cycle, the model will dispatch the 6-hour block with
the highest hourly generation first. The model will dispatch the hours in
that block from 0 to 5, in order. The next to be dispatched will be the
block with the next highest hourly generation where that hour has not yet
been allotted generation. In this methodology, each day is divided into
four blocks of 6 hours: 0-5, 6-11, 12-17, 18-23. This methodology is to
prevent natural gas-combined cycle units from being frequently turned on
and off.
5. Input variables may be set to allow any of the three hourly hierarchy
methods (hourly, 6-hour block, or 24-hour block) to be applied to any
ERTAC fuel/unit type bin.
6. By establishing the dispatch order on a per hour, a per 6-hour block, or per
day basis, the entire fleet will be grown in a more representative fashion,
including the “anomalous units”.
7. Future year new units
a) Future year new units will be added primarily by a manual process
led by the State in which the unit is situated.
b) Future year new units will be added by ERTAC fuel/unit type bin
and will be assumed to be proxy loaded for the start of the first
year of operation by assigning generation to the new unit from the
overall pool and inserting the new unit into the inventory as
follows:
Software Design Document for ERTAC EGU Projection Methodology April 21, 2011 Page 12
(1) New coal fired units (includes IGCC)
(a) The proxy loading for these units will be equivalent
to a 50% load factor (50% of maximum rated
capacity) for hourly operations. This represents the
unit being inserted into the dispatch order at a
nominal minimum load rate and then absorbing
growth and additional generation from the excess
generation pool up to its full load rating.
(b) New coal fired units will be inserted into the coal
fired dispatch order after the unit representing the
top 5% of the coal fired units in the power pool.
IGCC units will be inserted into the inventory after
the unit representing the top 2% of coal fired units’
power pool.
(c) The maximum ERTAC annual utilization fraction
for that ERTAC fuel/unit type bin will be applied.
(1) Gas Combined Cycle
(a) The initial hourly percent load profile for a new unit
will match that of the GCC unit immediately
beneath it in the dispatch order prior to the
application of that year’s growth.
(b) New units will be added to the dispatch order after
the unit representing top 5% of the GCC fired units
in the power pool unless otherwise specified by
State staff.
(c) The max ERTAC annual utilization fraction for that
ERTAC fuel/unit type bin will be applied.
(3) Simple Cycle Gas and Boilers
(a) Initial hourly percent load profile for a new unit
shall match that of the simple cycle gas unit or
boiler immediately beneath it in the dispatch order
prior to the application of that year’s growth.
(b) New units will be added after the unit representing
top 2% of the simple cycle gas units or boilers in
Software Design Document for ERTAC EGU Projection Methodology April 21, 2011 Page 13
the power pool, unless otherwise specified by State
staff.
(c) The maximum ERTAC annual utilization fraction
for that ERTAC fuel/unit type bin will be applied.
(4) Oil Fired Units
(a) Initial hourly percent load profile for a new unit will
match that of the oil unit immediately beneath it in
the dispatch order prior to the application of that
year’s growth.
(b) New units will be added after the unit representing
top 2% of the oil units in the power pool, unless
otherwise specified by State staff.
(c) The maximum ERTAC annual utilization fraction
for that ERTAC fuel/unit type bin will be applied.
(5) The new unit defaults listed above for each ERTAC region
and fuel/unit type bin may be modified in the Input
Variables worksheet.
b) Unit optimal load thresholds for new units will match the
percentage unit optimal load threshold for the existing unit
immediately beneath it in the dispatch order.
B. General Growth Methodology
1. After new units receive proxy loadings, the remaining growth within an
ERTAC region and fuel/unit type bin will be allocated uniformly across
the units in that bin.
2. Next, a comparison with the maximum capacity will be done on a unit by
unit basis starting with the first unit in the dispatch order to determine if
units have been grown beyond their maximum capacity.
3. If a unit has been grown beyond its maximum capacity on an hourly basis
or annual basis, the excess shall be removed from the unit and placed in an
excess generation pool.
4. Each hour of the year shall be processed as noted above prior to allocating
generation from the excess generation pool to the units in the fuel/unit
type bin and ERTAC region.
Software Design Document for ERTAC EGU Projection Methodology April 21, 2011 Page 14
5. Emptying the excess generation pool:
a) Power in the excess generation pool will be distributed in two
passes. The first pass will add generation to a unit up to its
maximum optimal load threshold. Maximum optimal load
threshold is calculated by a percentile of the unit’s hourly base
year data. The current default for this is the 90th percentile. This is
a variable that may be adjusted in the Input Variables spreadsheet.
b) During the first pass, some units may already be at or near their
maximum rated capacity due to the uniform distribution of growth.
These units will not have generation removed. However, since
they are already estimated to operate at levels above the unit
maximum optimal load threshold, they will not receive additional
generation during the first pass.
c) If the excess generation pool is not empty after all units have been
elevated to their unit maximum optimal load threshold, a second
pass through the unit hierarchy will be performed, where
generation will be allotted up to each unit’s maximum capacity
(either on an hourly or an annual basis).
d) Maximum hourly capacity utilization shall be no greater than
100% of unit capability.
e) Annual ERTAC utilization fractions may be input as a variable,
but shall be no greater than 0.90 for coal units, 0.60 for gas
combined cycle, and 0.18 for simple cycle gas and oil units. Base
year utilization is calculated, and a unit’s
max_annual_ERTAC_utilization_fraction that is larger than these
defaults will be used in place of these defaults. These defaults may
be adjusted in the Input Variables spreadsheet.
f) Units in the future year that have power generation constraints
significantly different than those in the base year may have a “Y”
in the “Capacity-Limited Unit Flag” field. For these units, rather
than comparing the annual utilization to the
max_annual_ERTAC_utilization_fraction, the annual utilization
should be compared to the data in the “Unit Annual Capacity
Limit” field.

Software Design Document for ERTAC EGU Projection Methodology April 21, 2011 Page 15
g) If a given fuel type cannot absorb the growth assigned to it, a flag
shall be thrown indicating that additional generation resources of
the ERTAC fuel/unit type bin are required to meet the growth
requirements of the power pool. As a futue enhancement, the
model may allow a generating unit in one power pool to be
dispatched by another pool if a long term agreement is in place and
properly documented by either the State receiving the energy or the
State hosting the unit.
h) If the total needed capacity in a power pool exceeds the total
installed capacity of all types minus the mandatory reserve margin
for the power pool, the model shall throw a flag indicating that the
power pool is in a deficit condition and that additional generation
resources are required.
6. In future iterations of the algorithm, enhancements may be made to allow
power to flow from one region to another.
a) If there is additional power in the excess generation pool, an
examination shall be made to see if additional generation is
available in an adjacent power pool to resolve the deficit in
generation resources condition.
b) The resolution of the deficit will need to account for the ability of
the transmission system to handle the interchange flow.
4.3 CAPACITY ASSIGNMENTS
A. If new unit information from the State is not sufficient to meet future demands, a
“grow in place” strategy will be used to assign new generic generation to each
ERTAC region and fuel/unit type bin.
B. The amount of new generation needed for the region will be determined based on
demand requirements.
1. For demand requirements, after a certain number of hours are run in an
ERTAC fuel/unit type bin and region, the algorithm checks for hours that
need additional capacity. Since hours are assigned generation in order of
most demand to least demand, the initial hours calculated should indicate
whether or not a deficit in capacity exists. The default for this number of
hours is 400. The value can be changed in the Input Variables
spreadsheet. This will prevent the algorithm from running through 8,760
Software Design Document for ERTAC EGU Projection Methodology April 21, 2011 Page 16
hours prior to determining if a new unit needs to be generated. Generating
a new unit will necessitate rerunning the algorithm from the beginning.
2. In the Input Variables spreadsheet, a demand cushion variable can be
changed to reflect a multiplication factor for the demand deficit in an
ERTAC region and fuel/unit type bin. The default is 1.00.
C. No new generic units will be created for reserve capacity deficits, at least for the
initial development of the algorithm. A report will be generated detailing the
reserve deficits.
D. For capacity needed to meet demand in an ERTAC region and fuel/unit type bin:
1. New units will be created based on the capacity needed and the minimum
and maximum sizes listed in the Input Variables spreadsheet.
a) Coal new unit size defaults: 300 MW minimum, 600 MW
maximum.
b) Combined cycle new unit size defaults: 250 MW minimum, 500
MW maximum.
c) Simple cycle-gas new unit size defaults: 80 MW minimum, 160
MW maximum.
d) Boiler-gas new unit size defaults: 50 MW minimum, 150 MW
maximum.
e) Oil new unit size defaults: 50 MW minimum, 150 MW maximum.
2. Capacity will be created to minimize the number of new units in the
ERTAC region and fuel/unit type bin. The amount of new capacity must
exceed the deficit plus the demand cushion.
a) Example: In a given region for the coal ERTAC fuel/unit type bin,
the algorithm runs for 400 hours and determines that the maximum
deficit is 1,202.7 MW-hrs. The demand cushion is set at 1.1, so
that 1,323.0 MW-hrs is needed to meet the deficit. Therefore, in
that region, two 600 MW and one 300 MW coal fired units would
be created.
b) Example: In a region for the simple cycle-gas ERTAC fuel/unit
type bin, the algorithm runs for 400 hours and determines that the
maximum deficit is 75 MW-hrs. The demand cushion is set at 1.05

Software Design Document for ERTAC EGU Projection Methodology April 21, 2011 Page 17
so that 78.8 MW-hrs are needed. Therefore, in that region, one
new simple cycle gas unit is created with a size of 80 MW.
3. The first new generic unit will be “located” at the facility in that region
that has the largest total (all fuels) capacity and burns that fuel type. The
second new unit will be “located” at the facility in that region that has the
second largest capacity and burns that fuel type, etc. Default data may be
created by rank ordering the size of each facility. The top 10 facilities for
each ERTAC region and fuel/unit type bin are input variables. This data
may be modified in the Input Variable spreadsheet.
4. All generic new unit assignments will be documented in a report for that
ERTAC region, to include size, location, fuel/unit type, hours when
additional generation is needed, and why the additional generation is
needed (either demand growth or reserve requirements).
5. If new generic units are needed, they will be added to the unit availability
file in the same manner as State-specified units, with generic emissions
factors for NOx, SO2, and CO2e in the Emissions and Controls file. The
generic emission factors will be the 90th percentile NOx, SO2, and CO2e
emission rates documented in that region for that fuel and unit type from
CAMD data. (The units will be in the top 10th percentile in terms of
cleanliness.) This percentile may be changed in the Input Variables
spreadsheet. The new generic units will be treated identically to State-
specified units in terms of proxy capacity, position in unit hierarchy, etc.
The program will need to be rerun with this data in the Unit Availability
File and Controls and Emissions File to obtain final outputs.
E. For capacity needed to meet reserve requirements in a region:
1. At this time, no new generic units will be created to meet reserve capacity
requirements. Creation of generic units to meet reserve capacity
requirements may be a future enhancement to the algorithm.
2. The algorithm will create a report to provide data on the regions where
reserve requirements are not met. The report should include hours of the
year when reserve requirements are not met, the size of the deficit, and the
status of demand and reserve requirements in neighboring regions for the
same hours.

Software Design Document for ERTAC EGU Projection Methodology April 21, 2011 Page 18
4.4 CONTROL INSTALLATION TO MEET EMISSION CAPS
A. Leadership
1. Addition of control equipment will be led by the States.
2. If it is necessary to add controls, the procedure described in Section 4.4 B
will be used to assign controls. The assignments will then be reviewed by
the States where the unit(s) is located to determine if they appear
reasonable.
3. It should be noted that model-assigned controls, even if deemed
reasonable during the previous step, may not reflect actual compliance
decisions of individual entities with compliance obligations under a future
program due to their individual analysis of the economic and other drivers
of a control installation decision.
B. Control Assignment Methodology
1. The primary source for the addition of emission control equipment will be
information supplied by the State agency where the source is located.
2. Emission levels used in the inventory will be transmitted with the control
assignment by the State agency.
3. If there is insufficient pollutant control in a region from existing control
devices and known new controls identified in steps one and two of this
section to meet the requirements of a regulatory program being examined,
the following process will be used to close the gap in the inventory.
a) SO2 Control Programs
(1) Units older than 50 years old will not be assigned controls
to allow a minimum of 15 year payback period for the
capital costs on units larger than 200 MW.
(2) Control will be assigned using the earliest dispatch ordered
unit meeting the age criteria that will not be retired in the
future year and that does not have an emission control
already installed.
(3) Controls will be assumed to meet the proposed regulatory
limit on the unit where the control is assigned or a 0.20
lb/MMBtu emission limit for SO2 or a 93% reduction
efficiency. IPM documentation indicated that SO2 controls
Software Design Document for ERTAC EGU Projection Methodology April 21, 2011 Page 19
applied by IPM have a 98% reduction efficiency or a 93%
reduction efficiency, depending on control type. Since IPM
assumed a base rate of 3 lbs SO2/mmbtu, a 93% reduction
efficiency equates to approximately 0.2 lbs SO2/mmbtu.
The percent reduction value may be modified in the Input
Variables spreadsheet.
(4) Specific control types (wet or dry scrubber, or other SO2
control device) will not be prescribed, only the emission
rate.
(5) If the above steps do not reach the program limitations, the
criteria in item 1 above will be relaxed to 55 years and 150
MW and the process repeated.
(6) If this does not generate sufficient reductions to meet the
requirements of the control program, a report will be
written indicating the area where the program requirements
are not being met and the remaining units in the area that
are not controlled.
b) NOx Control Programs
(1) The process used will assign both SCR and SNCR to units
based on the criteria identified in the following sections
(2) Uncontrolled units older than 50 years old and smaller than
200 MW will not be assigned SCR equipment, but will be
assigned SNCR if they are less than 58 (50?) years old,
larger than 100 MW, and not retired in the future year.
(3) Uncontrolled fluidized bed boilers meeting the
requirements in (2) above will only be assigned SNCR.
(4) Control assignment will be done using the earliest dispatch
ordered unit meeting the age and size criteria that does not
have an emission control already installed. If a unit already
equipped with SNCR meets the criteria for SCR, it will not
be upgraded to SCR unless a second pass is needed under
step 6.
(5) Specific control types (SCR or SNCR) will be prescribed
based on the above criteria.

Software Design Document for ERTAC EGU Projection Methodology April 21, 2011 Page 20
(6) If the above steps do not reach the program limitations, the
criteria for SCR in item 1 above will be relaxed to 55 years
and 150 MW and the process repeated, along with the
assigning of SCR to any SNCR equipped unit that meets
the SCR criteria.
(7) If the above steps do not reach the program limitations, the
emission rate for SNCR retrofits of circulating fluidized
bed boilers will be reduced to 0.07 lbs NOx/mmbtu.
(8) If this does not generate sufficient reductions to meet the
requirements of the control program, a report will be
written indicating the area where program requirements are
not being met and the remaining units in the area that are
not controlled.
(9) The controlled values for SNCR and SCR may be modified
in the Input Variables spreadsheet.
4.5 OUTPUTS AND REPORTING
A. Outputs
1. The primary output of this model will be a file ready for either direct use
in the photochemical model or merging with other inventory files for use
in the photochemical model.
2. Secondary outputs may quantify criteria and climate change pollutants on
either an hourly or an annual basis.
B. Reporting
1. The model will output reports that identify deficiencies in generation and
emissions controls in regions to allow informed intervention by State staff.
2. The model will also output a file identifying the units, peak hourly
generation or heat input, and annual generation or heat input.
Software Design Document for ERTAC EGU Projection Methodology April 21, 2011 Page 21
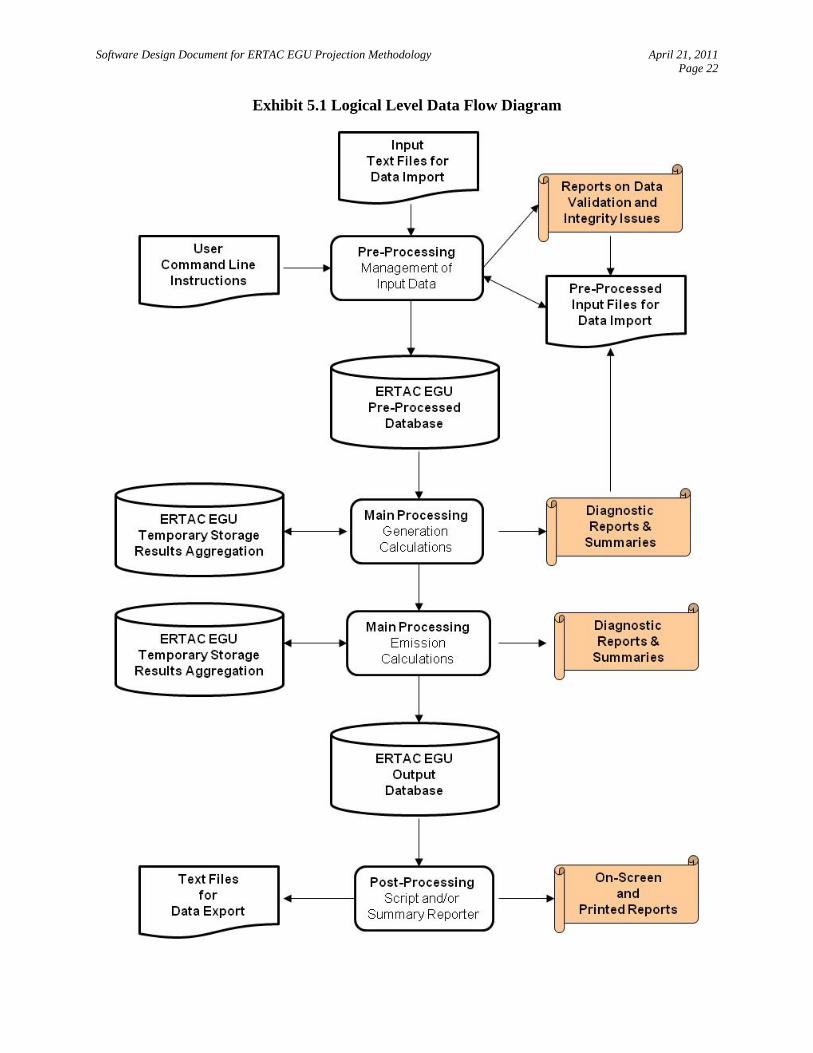
5.0 PROCESSING OVERVIEW
Exhibit 5.1 illustrates the logical flow of data and control with the ERTAC EGU software. It is
anticipated that multiple iterations of the pre-processing and main processing modules will be
needed to calculate an acceptable result for a given year.
5.1 PRE-PROCESSING
Before beginning a model run, the user must prepare input files for data import. These files will
typically be developed by the user in EXCEL and must be converted to “comma separated
value” (.csv) text files for input to the pre-processing module.
A simple command line interface is used to create a run specification identifying the file names
and locations for input and output data files. Control is passed to the pre-processing module,
which performs edit checks of the input files and produces an error report identifying data
validation issues that must be corrected by the user prior to continuing the run. The pre-
processing module performs calculations to fill in data fields in the input files and generates
updated versions of the user input files with the results of the calculations.
The output files from pre-processing will likely be edited iteratively by States to correct or adjust
inputs. Once all edit check issues are resolved and the user accepts the updated inputs, the pre-
processing module creates a database with the necessary input data and parameters used to
execute the main processing module.
5.2 MAIN PROCESSING
The main processing module is the “core” portion of the model and consumes much of its
execution time. The main processing module receives the principal input from the pre-processed
database, but other tables may also be needed for specialized calculations. It performs the
growth and emission projection calculations. Diagnostic reports are created to flag generation
and capacity issues. The main module writes its results to an output database.
5.3 POST-PROCESSING
Following the model run, the user can invoke additional “post-processing” functions to report on
the results and convert the database into formats needed for modeling or further analysis. Several
post-processing scripts are provided with the model and users may add to these if further
customization of output is desired. The post-processer allows the user to further aggregate the
output results, produce summary on-screen or printed reports, and/or text files of selected results.
These are suitable for importing into other software, such as spreadsheets, for further display and
analysis.
Software Design Document for ERTAC EGU Projection Methodology April 21, 2011 Page 22
Exhibit 5.1 Logical Level Data Flow Diagram

Software Design Document for ERTAC EGU Projection Methodology April 21, 2011 Page 23
6.0 PRE-PROCESSING MODULE
A number of pre-processing steps must be executed to initialize the files that will be input to the
main processing algorithm. These pre-processing steps include both manual and automated
steps, with several opportunities for the user to review, correct, and revise the input files prior to
executing the main processing algorithm. This section describes the input files, explains the
functions (including calculations), and describes the output database tables created during the
pre-processing module.
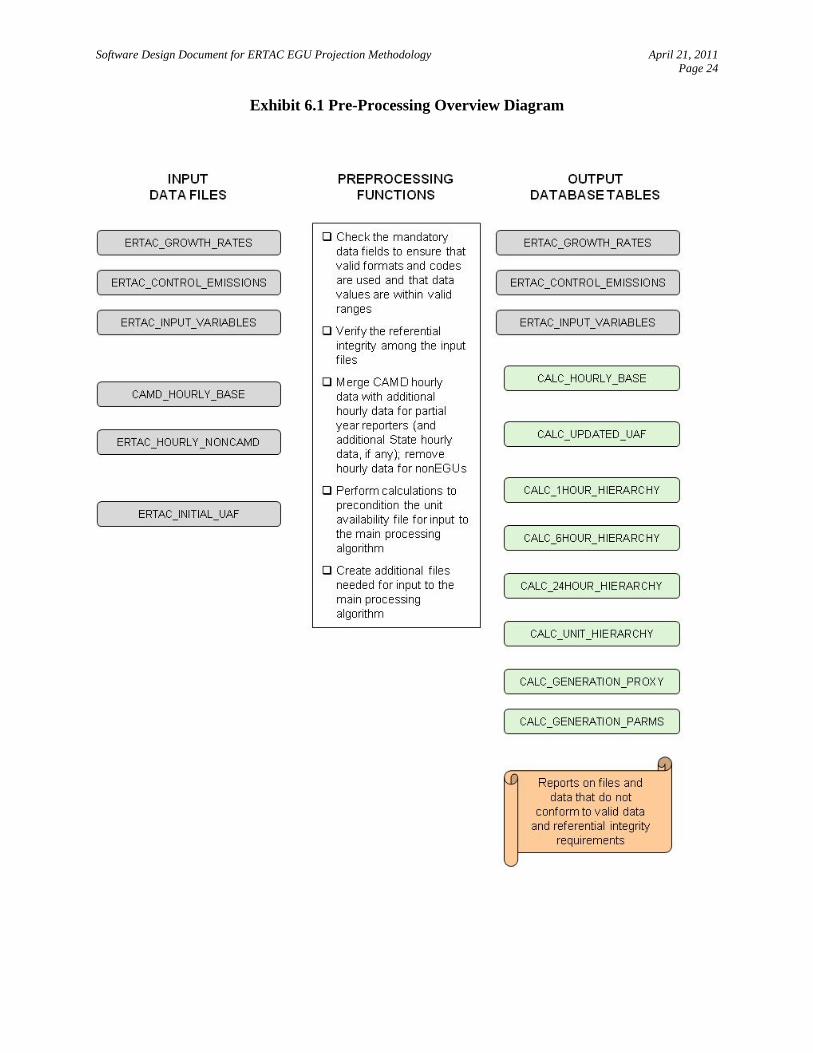
6.1 PRE-PROCESSING OVERVIEW
Exhibit 6.1 illustrates the input data files, primary functions, and output data tables associated
with the pre-processing module. The primary functions are to:
Check mandatory data fields to ensure that valid formats and codes are used and that
data values are within valid ranges
Verify referential integrity among the input files
Merge CAMD hourly data with additional hourly data for partial year reporters (and
additional State hourly data, if any); remove hourly data for nonEGUs
Perform calculations to precondition the unit availabilility file for input to the main
processing algorithm
Create additional files needed for input to the main processing algorithm
At this time, the processing order for the specific processes is in question. We intend to run a
series of benchmark tests to determine the most efficient processing order. However, the
functionality and data handling internal to each of the processing steps remains the same.
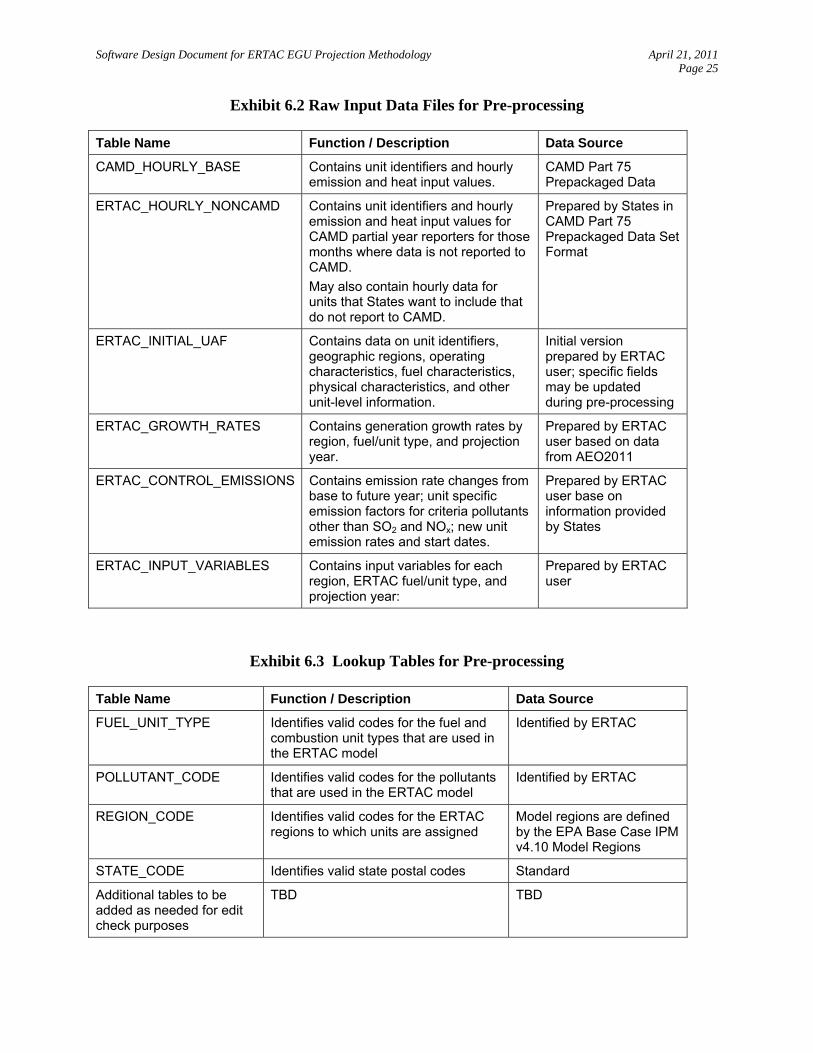
Exhibit 6.2 lists the raw input files to the pre-processing routine. Exhibit 6.3 lists the lookup
tables that are used to ensure that valid formats and codes are used and that data values are
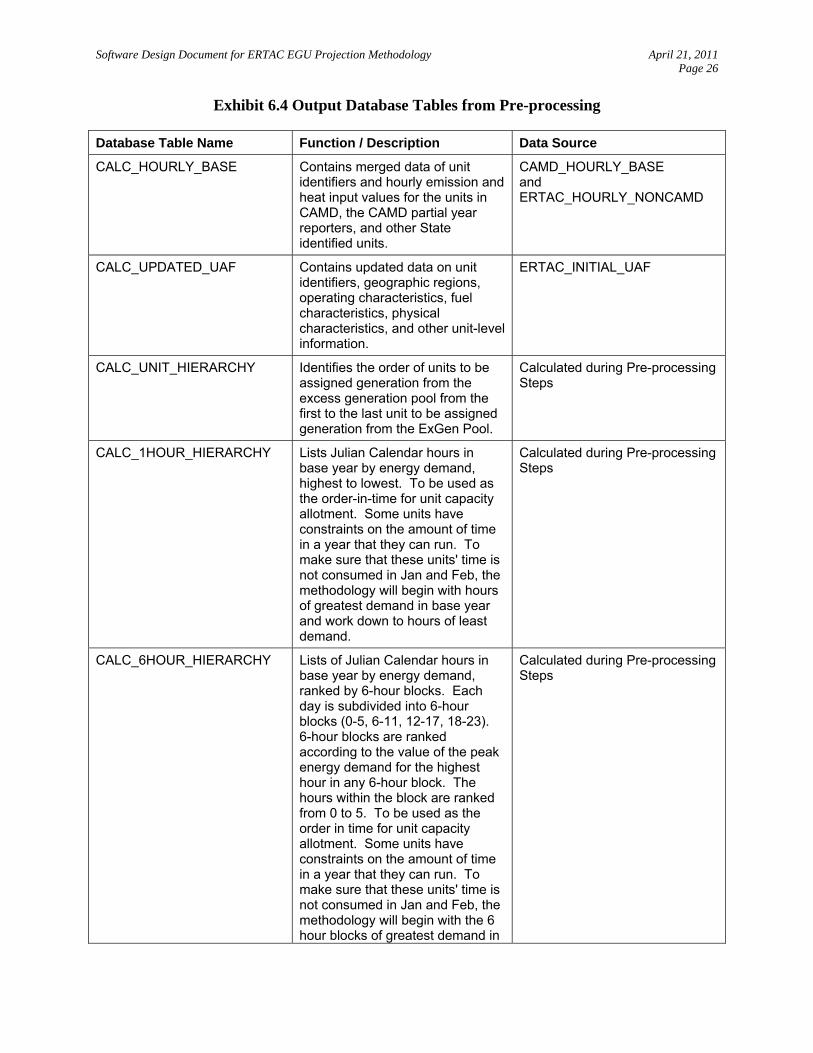
within valid ranges. Exhibit 6.4 lists the output files from the pre-processing module that are
input to the main processing algorithm.
Software Design Document for ERTAC EGU Projection Methodology April 21, 2011 Page 24
Exhibit 6.1 Pre-Processing Overview Diagram
Software Design Document for ERTAC EGU Projection Methodology April 21, 2011 Page 25
Exhibit 6.2 Raw Input Data Files for Pre-processing
Table Name Function / Description Data Source
CAMD_HOURLY_BASE Contains unit identifiers and hourly emission and heat input values.
CAMD Part 75 Prepackaged Data
ERTAC_HOURLY_NONCAMD Contains unit identifiers and hourly emission and heat input values for CAMD partial year reporters for those months where data is not reported to CAMD.
May also contain hourly data for units that States want to include that do not report to CAMD.
Prepared by States in CAMD Part 75 Prepackaged Data Set Format
ERTAC_INITIAL_UAF Contains data on unit identifiers, geographic regions, operating characteristics, fuel characteristics, physical characteristics, and other unit-level information.
Initial version prepared by ERTAC user; specific fields may be updated during pre-processing
ERTAC_GROWTH_RATES Contains generation growth rates by region, fuel/unit type, and projection year.
Prepared by ERTAC user based on data from AEO2011
ERTAC_CONTROL_EMISSIONS Contains emission rate changes from base to future year; unit specific emission factors for criteria pollutants other than SO2 and NOx; new unit emission rates and start dates.
Prepared by ERTAC user base on information provided by States
ERTAC_INPUT_VARIABLES Contains input variables for each region, ERTAC fuel/unit type, and projection year:
Prepared by ERTAC user
Exhibit 6.3 Lookup Tables for Pre-processing
Table Name Function / Description Data Source
FUEL_UNIT_TYPE Identifies valid codes for the fuel and combustion unit types that are used in the ERTAC model
Identified by ERTAC
POLLUTANT_CODE Identifies valid codes for the pollutants that are used in the ERTAC model
Identified by ERTAC
REGION_CODE Identifies valid codes for the ERTAC regions to which units are assigned
Model regions are defined by the EPA Base Case IPM v4.10 Model Regions
STATE_CODE Identifies valid state postal codes Standard
Additional tables to be added as needed for edit check purposes
TBD TBD
Software Design Document for ERTAC EGU Projection Methodology April 21, 2011 Page 26
Exhibit 6.4 Output Database Tables from Pre-processing
Database Table Name Function / Description Data Source
CALC_HOURLY_BASE Contains merged data of unit identifiers and hourly emission and heat input values for the units in CAMD, the CAMD partial year reporters, and other State identified units.
CAMD_HOURLY_BASE and ERTAC_HOURLY_NONCAMD
CALC_UPDATED_UAF Contains updated data on unit identifiers, geographic regions, operating characteristics, fuel characteristics, physical characteristics, and other unit-level information.
ERTAC_INITIAL_UAF
CALC_UNIT_HIERARCHY Identifies the order of units to be assigned generation from the excess generation pool from the first to the last unit to be assigned generation from the ExGen Pool.
Calculated during Pre-processing Steps
CALC_1HOUR_HIERARCHY Lists Julian Calendar hours in base year by energy demand, highest to lowest. To be used as the order-in-time for unit capacity allotment. Some units have constraints on the amount of time in a year that they can run. To make sure that these units' time is not consumed in Jan and Feb, the methodology will begin with hours of greatest demand in base year and work down to hours of least demand.
Calculated during Pre-processing Steps
CALC_6HOUR_HIERARCHY Lists of Julian Calendar hours in base year by energy demand, ranked by 6-hour blocks. Each day is subdivided into 6-hour blocks (0-5, 6-11, 12-17, 18-23). 6-hour blocks are ranked according to the value of the peak energy demand for the highest hour in any 6-hour block. The hours within the block are ranked from 0 to 5. To be used as the order in time for unit capacity allotment. Some units have constraints on the amount of time in a year that they can run. To make sure that these units' time is not consumed in Jan and Feb, the methodology will begin with the 6 hour blocks of greatest demand in
Calculated during Pre-processing Steps

Software Design Document for ERTAC EGU Projection Methodology April 21, 2011 Page 27
Database Table Name Function / Description Data Source
BY and work down to the 6 hour blocks of least demand. 6 hour blocks are used for gas-combined cycle in the hierarchy ranking rather than hours since CC units generally cannot turn off and on in an hour.
CALC_24HOUR_HIERARCHY Lists Julian Calandar hours in base year by energy demand, ranked by day. Days are ranked according to the value of the peak energy demand for the highest hour in any day. The hours within the day are ranked from 0 to 23. To be used as the order in time for unit capacity allotment. Some units have constraints on the amount of time in a year that they can run. To make sure that these units' time is not consumed in Jan and Feb, the methodology will begin with days of greatest demand in BY and work down to days of least demand. Days are used for coal in the hierarchy ranking rather than hours since coal units generally cannot turn off and on in an hour.
Calculated during Pre-processing Steps
CALC_GENERATION_PROXY Contains hourly generation data for new units
Calculated during Pre-processing Steps
CALC_GENERATION_PARMS Contains aggregated base year, proxy, and future generation parameters
Calculated during Pre-processing Steps
Software Design Document for ERTAC EGU Projection Methodology April 21, 2011 Page 28
6.2 RAW INPUT DATA FILE FORMATS
The file formats are based on the ERTAC EGU Growth Implementation Subgroup’s file formats
(Data Files Needed April 8 2011.xlsx, dated 4/8/2011). The six raw data input files and expected
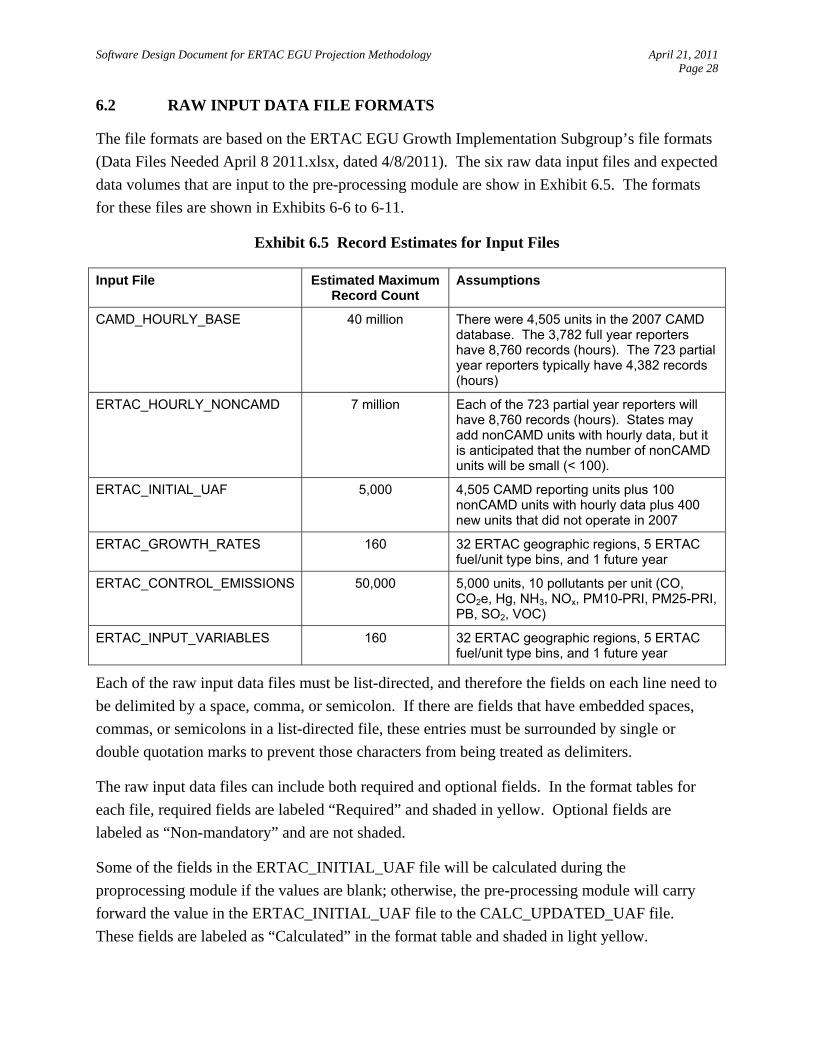
data volumes that are input to the pre-processing module are show in Exhibit 6.5. The formats
for these files are shown in Exhibits 6-6 to 6-11.
Exhibit 6.5 Record Estimates for Input Files
Input File Estimated MaximumRecord Count
Assumptions
CAMD_HOURLY_BASE 40 million There were 4,505 units in the 2007 CAMD database. The 3,782 full year reporters have 8,760 records (hours). The 723 partial year reporters typically have 4,382 records (hours)
ERTAC_HOURLY_NONCAMD 7 million Each of the 723 partial year reporters will have 8,760 records (hours). States may add nonCAMD units with hourly data, but it is anticipated that the number of nonCAMD units will be small (< 100).
ERTAC_INITIAL_UAF 5,000 4,505 CAMD reporting units plus 100 nonCAMD units with hourly data plus 400 new units that did not operate in 2007
ERTAC_GROWTH_RATES 160 32 ERTAC geographic regions, 5 ERTAC fuel/unit type bins, and 1 future year
ERTAC_CONTROL_EMISSIONS 50,000 5,000 units, 10 pollutants per unit (CO, CO2e, Hg, NH3, NOx, PM10-PRI, PM25-PRI, PB, SO2, VOC)
ERTAC_INPUT_VARIABLES 160 32 ERTAC geographic regions, 5 ERTAC fuel/unit type bins, and 1 future year
Each of the raw input data files must be list-directed, and therefore the fields on each line need to
be delimited by a space, comma, or semicolon. If there are fields that have embedded spaces,
commas, or semicolons in a list-directed file, these entries must be surrounded by single or
double quotation marks to prevent those characters from being treated as delimiters.
The raw input data files can include both required and optional fields. In the format tables for
each file, required fields are labeled “Required” and shaded in yellow. Optional fields are
labeled as “Non-mandatory” and are not shaded.
Some of the fields in the ERTAC_INITIAL_UAF file will be calculated during the
proprocessing module if the values are blank; otherwise, the pre-processing module will carry
forward the value in the ERTAC_INITIAL_UAF file to the CALC_UPDATED_UAF file.
These fields are labeled as “Calculated” in the format table and shaded in light yellow.
Software Design Document for ERTAC EGU Projection Methodology April 21, 2011 Page 29
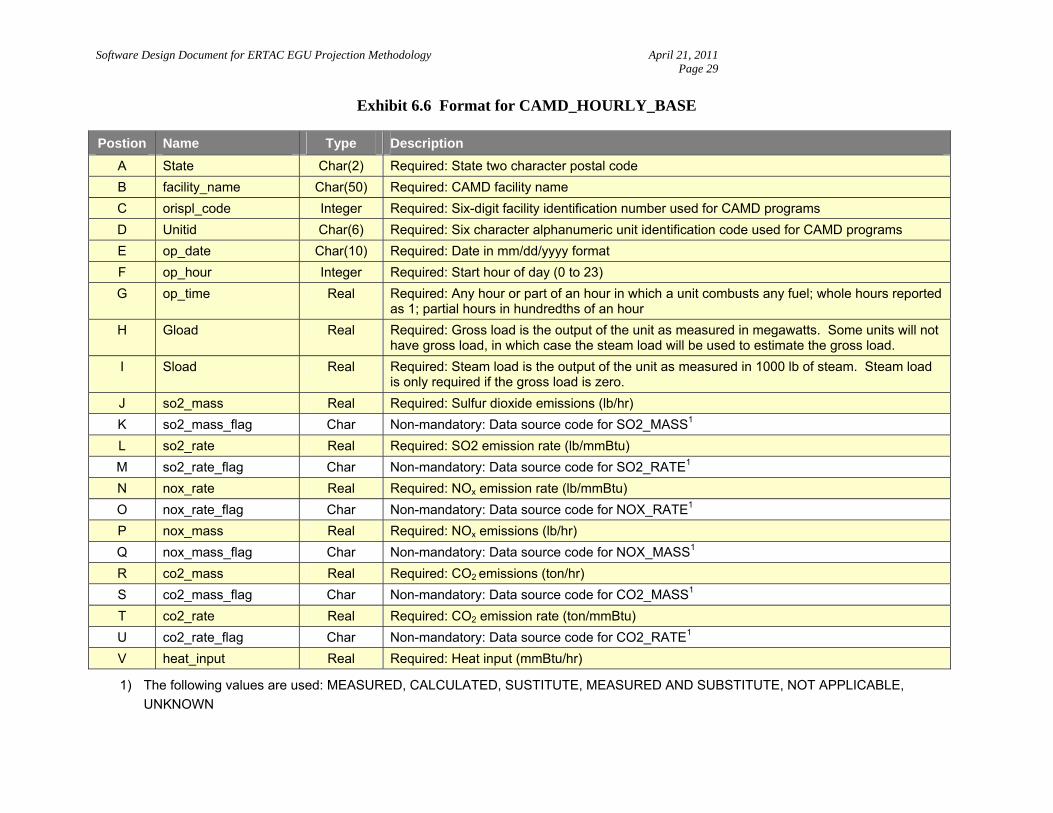
Exhibit 6.6 Format for CAMD_HOURLY_BASE
Postion Name Type Description
A State Char(2) Required: State two character postal code
B facility_name Char(50) Required: CAMD facility name
C orispl_code Integer Required: Six-digit facility identification number used for CAMD programs
D Unitid Char(6) Required: Six character alphanumeric unit identification code used for CAMD programs
E op_date Char(10) Required: Date in mm/dd/yyyy format
F op_hour Integer Required: Start hour of day (0 to 23)
G op_time Real Required: Any hour or part of an hour in which a unit combusts any fuel; whole hours reported as 1; partial hours in hundredths of an hour
H Gload Real Required: Gross load is the output of the unit as measured in megawatts. Some units will not have gross load, in which case the steam load will be used to estimate the gross load.
I Sload Real Required: Steam load is the output of the unit as measured in 1000 lb of steam. Steam load is only required if the gross load is zero.
J so2_mass Real Required: Sulfur dioxide emissions (lb/hr)
K so2_mass_flag Char Non-mandatory: Data source code for SO2_MASS1
L so2_rate Real Required: SO2 emission rate (lb/mmBtu)
M so2_rate_flag Char Non-mandatory: Data source code for SO2_RATE1
N nox_rate Real Required: NOx emission rate (lb/mmBtu)
O nox_rate_flag Char Non-mandatory: Data source code for NOX_RATE1
P nox_mass Real Required: NOx emissions (lb/hr)
Q nox_mass_flag Char Non-mandatory: Data source code for NOX_MASS1
R co2_mass Real Required: CO2 emissions (ton/hr)
S co2_mass_flag Char Non-mandatory: Data source code for CO2_MASS1
T co2_rate Real Required: CO2 emission rate (ton/mmBtu)
U co2_rate_flag Char Non-mandatory: Data source code for CO2_RATE1
V heat_input Real Required: Heat input (mmBtu/hr)
1) The following values are used: MEASURED, CALCULATED, SUSTITUTE, MEASURED AND SUBSTITUTE, NOT APPLICABLE,
UNKNOWN
Software Design Document for ERTAC EGU Projection Methodology April 21, 2011 Page 30
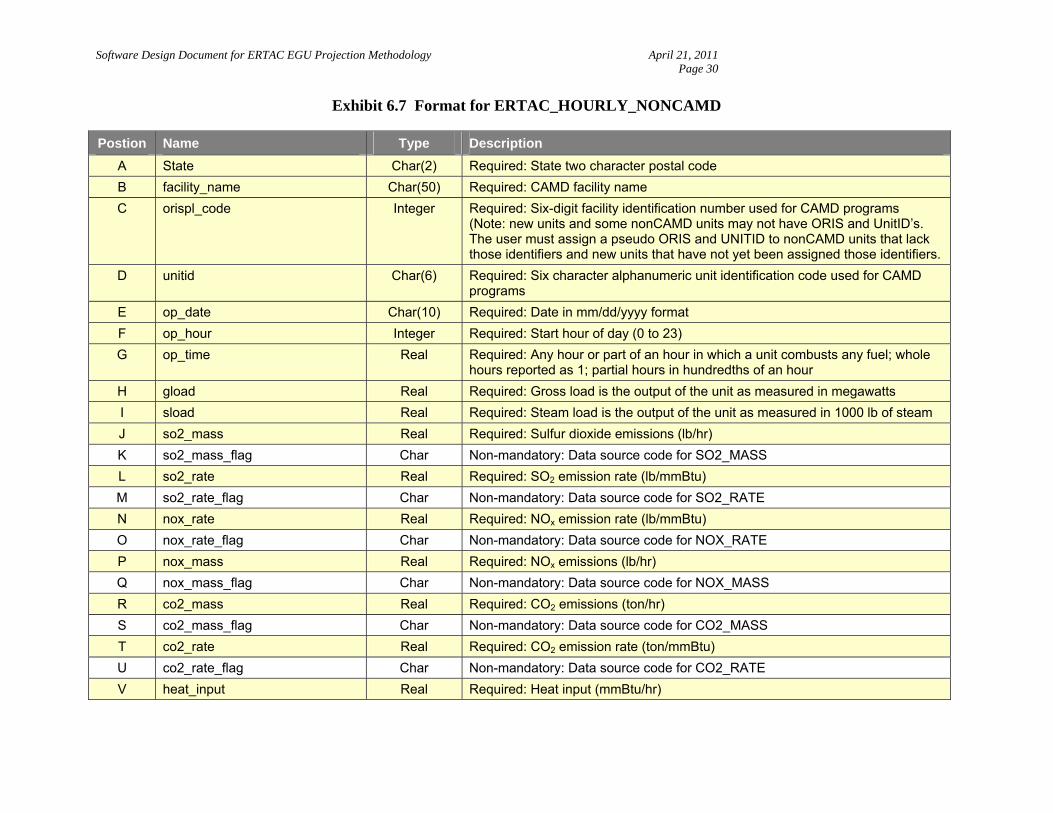
Exhibit 6.7 Format for ERTAC_HOURLY_NONCAMD
Postion Name Type Description
A State Char(2) Required: State two character postal code
B facility_name Char(50) Required: CAMD facility name
C orispl_code Integer Required: Six-digit facility identification number used for CAMD programs (Note: new units and some nonCAMD units may not have ORIS and UnitID’s. The user must assign a pseudo ORIS and UNITID to nonCAMD units that lack those identifiers and new units that have not yet been assigned those identifiers.
D unitid Char(6) Required: Six character alphanumeric unit identification code used for CAMD programs
E op_date Char(10) Required: Date in mm/dd/yyyy format
F op_hour Integer Required: Start hour of day (0 to 23)
G op_time Real Required: Any hour or part of an hour in which a unit combusts any fuel; whole hours reported as 1; partial hours in hundredths of an hour
H gload Real Required: Gross load is the output of the unit as measured in megawatts
I sload Real Required: Steam load is the output of the unit as measured in 1000 lb of steam
J so2_mass Real Required: Sulfur dioxide emissions (lb/hr)
K so2_mass_flag Char Non-mandatory: Data source code for SO2_MASS
L so2_rate Real Required: SO2 emission rate (lb/mmBtu)
M so2_rate_flag Char Non-mandatory: Data source code for SO2_RATE
N nox_rate Real Required: NOx emission rate (lb/mmBtu)
O nox_rate_flag Char Non-mandatory: Data source code for NOX_RATE
P nox_mass Real Required: NOx emissions (lb/hr)
Q nox_mass_flag Char Non-mandatory: Data source code for NOX_MASS
R co2_mass Real Required: CO2 emissions (ton/hr)
S co2_mass_flag Char Non-mandatory: Data source code for CO2_MASS
T co2_rate Real Required: CO2 emission rate (ton/mmBtu)
U co2_rate_flag Char Non-mandatory: Data source code for CO2_RATE
V heat_input Real Required: Heat input (mmBtu/hr)
Software Design Document for ERTAC EGU Projection Methodology April 21, 2011 Page 31
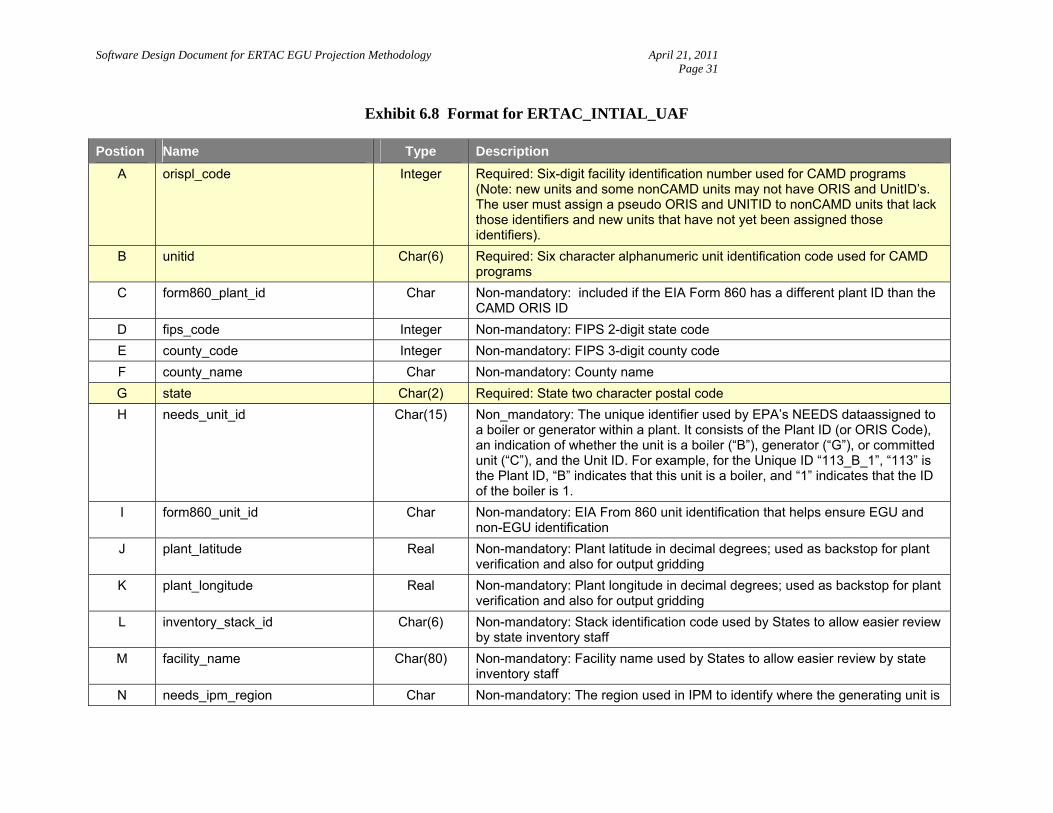
Exhibit 6.8 Format for ERTAC_INTIAL_UAF
Postion Name Type Description
A orispl_code Integer Required: Six-digit facility identification number used for CAMD programs (Note: new units and some nonCAMD units may not have ORIS and UnitID’s. The user must assign a pseudo ORIS and UNITID to nonCAMD units that lack those identifiers and new units that have not yet been assigned those identifiers).
B unitid Char(6) Required: Six character alphanumeric unit identification code used for CAMD programs
C form860_plant_id Char Non-mandatory: included if the EIA Form 860 has a different plant ID than the CAMD ORIS ID
D fips_code Integer Non-mandatory: FIPS 2-digit state code
E county_code Integer Non-mandatory: FIPS 3-digit county code
F county_name Char Non-mandatory: County name
G state Char(2) Required: State two character postal code
H needs_unit_id Char(15) Non_mandatory: The unique identifier used by EPA’s NEEDS dataassigned to a boiler or generator within a plant. It consists of the Plant ID (or ORIS Code), an indication of whether the unit is a boiler (“B”), generator (“G”), or committed unit (“C”), and the Unit ID. For example, for the Unique ID “113_B_1”, “113” is the Plant ID, “B” indicates that this unit is a boiler, and “1” indicates that the ID of the boiler is 1.
I form860_unit_id Char Non-mandatory: EIA From 860 unit identification that helps ensure EGU and non-EGU identification
J plant_latitude Real Non-mandatory: Plant latitude in decimal degrees; used as backstop for plant verification and also for output gridding
K plant_longitude Real Non-mandatory: Plant longitude in decimal degrees; used as backstop for plant verification and also for output gridding
L inventory_stack_id Char(6) Non-mandatory: Stack identification code used by States to allow easier review by state inventory staff
M facility_name Char(80) Non-mandatory: Facility name used by States to allow easier review by state inventory staff
N needs_ipm_region Char Non-mandatory: The region used in IPM to identify where the generating unit is
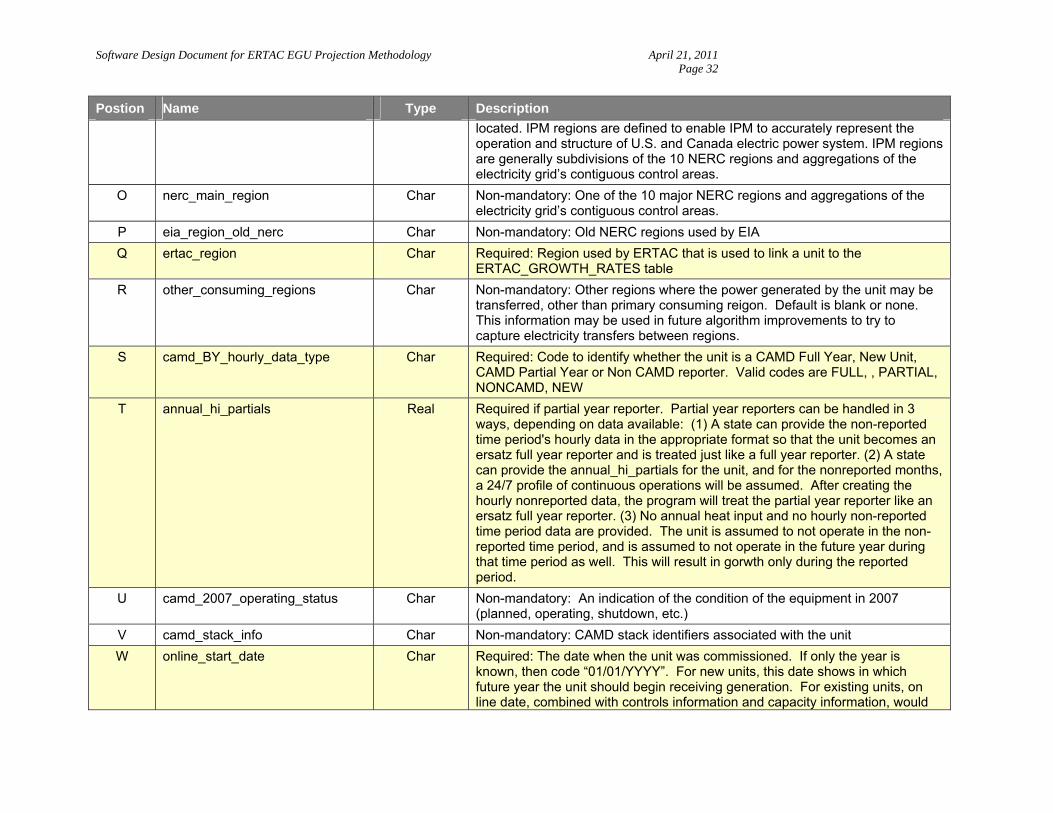
Software Design Document for ERTAC EGU Projection Methodology April 21, 2011 Page 32
Postion Name Type Description
located. IPM regions are defined to enable IPM to accurately represent the operation and structure of U.S. and Canada electric power system. IPM regions are generally subdivisions of the 10 NERC regions and aggregations of the electricity grid’s contiguous control areas.
O nerc_main_region Char Non-mandatory: One of the 10 major NERC regions and aggregations of the electricity grid’s contiguous control areas.
P eia_region_old_nerc Char Non-mandatory: Old NERC regions used by EIA
Q ertac_region Char Required: Region used by ERTAC that is used to link a unit to the ERTAC_GROWTH_RATES table
R other_consuming_regions Char Non-mandatory: Other regions where the power generated by the unit may be transferred, other than primary consuming reigon. Default is blank or none. This information may be used in future algorithm improvements to try to capture electricity transfers between regions.
S camd_BY_hourly_data_type Char Required: Code to identify whether the unit is a CAMD Full Year, New Unit, CAMD Partial Year or Non CAMD reporter. Valid codes are FULL, , PARTIAL, NONCAMD, NEW
T annual_hi_partials Real Required if partial year reporter. Partial year reporters can be handled in 3 ways, depending on data available: (1) A state can provide the non-reported time period's hourly data in the appropriate format so that the unit becomes an ersatz full year reporter and is treated just like a full year reporter. (2) A state can provide the annual_hi_partials for the unit, and for the nonreported months, a 24/7 profile of continuous operations will be assumed. After creating the hourly nonreported data, the program will treat the partial year reporter like an ersatz full year reporter. (3) No annual heat input and no hourly non-reported time period data are provided. The unit is assumed to not operate in the non-reported time period, and is assumed to not operate in the future year during that time period as well. This will result in gorwth only during the reported period.
U camd_2007_operating_status Char Non-mandatory: An indication of the condition of the equipment in 2007 (planned, operating, shutdown, etc.)
V camd_stack_info Char Non-mandatory: CAMD stack identifiers associated with the unit
W online_start_date Char Required: The date when the unit was commissioned. If only the year is known, then code “01/01/YYYY”. For new units, this date shows in which future year the unit should begin receiving generation. For existing units, on line date, combined with controls information and capacity information, would
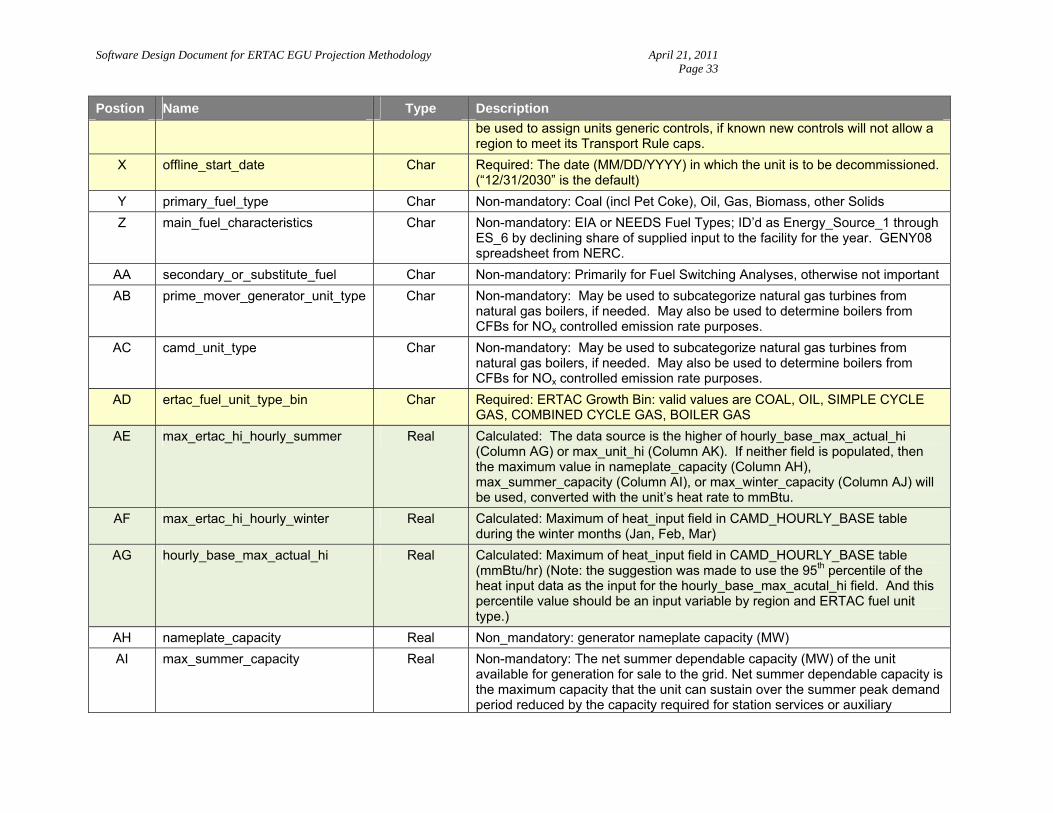
Software Design Document for ERTAC EGU Projection Methodology April 21, 2011 Page 33
Postion Name Type Description
be used to assign units generic controls, if known new controls will not allow a region to meet its Transport Rule caps.
X offline_start_date Char Required: The date (MM/DD/YYYY) in which the unit is to be decommissioned. (“12/31/2030” is the default)
Y primary_fuel_type Char Non-mandatory: Coal (incl Pet Coke), Oil, Gas, Biomass, other Solids
Z main_fuel_characteristics Char Non-mandatory: EIA or NEEDS Fuel Types; ID’d as Energy_Source_1 through ES_6 by declining share of supplied input to the facility for the year. GENY08 spreadsheet from NERC.
AA secondary_or_substitute_fuel Char Non-mandatory: Primarily for Fuel Switching Analyses, otherwise not important
AB prime_mover_generator_unit_type Char Non-mandatory: May be used to subcategorize natural gas turbines from natural gas boilers, if needed. May also be used to determine boilers from CFBs for NOx controlled emission rate purposes.
AC camd_unit_type Char Non-mandatory: May be used to subcategorize natural gas turbines from natural gas boilers, if needed. May also be used to determine boilers from CFBs for NOx controlled emission rate purposes.
AD ertac_fuel_unit_type_bin Char Required: ERTAC Growth Bin: valid values are COAL, OIL, SIMPLE CYCLE GAS, COMBINED CYCLE GAS, BOILER GAS
AE max_ertac_hi_hourly_summer Real Calculated: The data source is the higher of hourly_base_max_actual_hi (Column AG) or max_unit_hi (Column AK). If neither field is populated, then the maximum value in nameplate_capacity (Column AH), max_summer_capacity (Column AI), or max_winter_capacity (Column AJ) will be used, converted with the unit’s heat rate to mmBtu.
AF max_ertac_hi_hourly_winter Real Calculated: Maximum of heat_input field in CAMD_HOURLY_BASE table during the winter months (Jan, Feb, Mar)
AG hourly_base_max_actual_hi Real Calculated: Maximum of heat_input field in CAMD_HOURLY_BASE table (mmBtu/hr) (Note: the suggestion was made to use the 95th percentile of the heat input data as the input for the hourly_base_max_acutal_hi field. And this percentile value should be an input variable by region and ERTAC fuel unit type.)
AH nameplate_capacity Real Non_mandatory: generator nameplate capacity (MW)
AI max_summer_capacity Real Non-mandatory: The net summer dependable capacity (MW) of the unit available for generation for sale to the grid. Net summer dependable capacity is the maximum capacity that the unit can sustain over the summer peak demand period reduced by the capacity required for station services or auxiliary
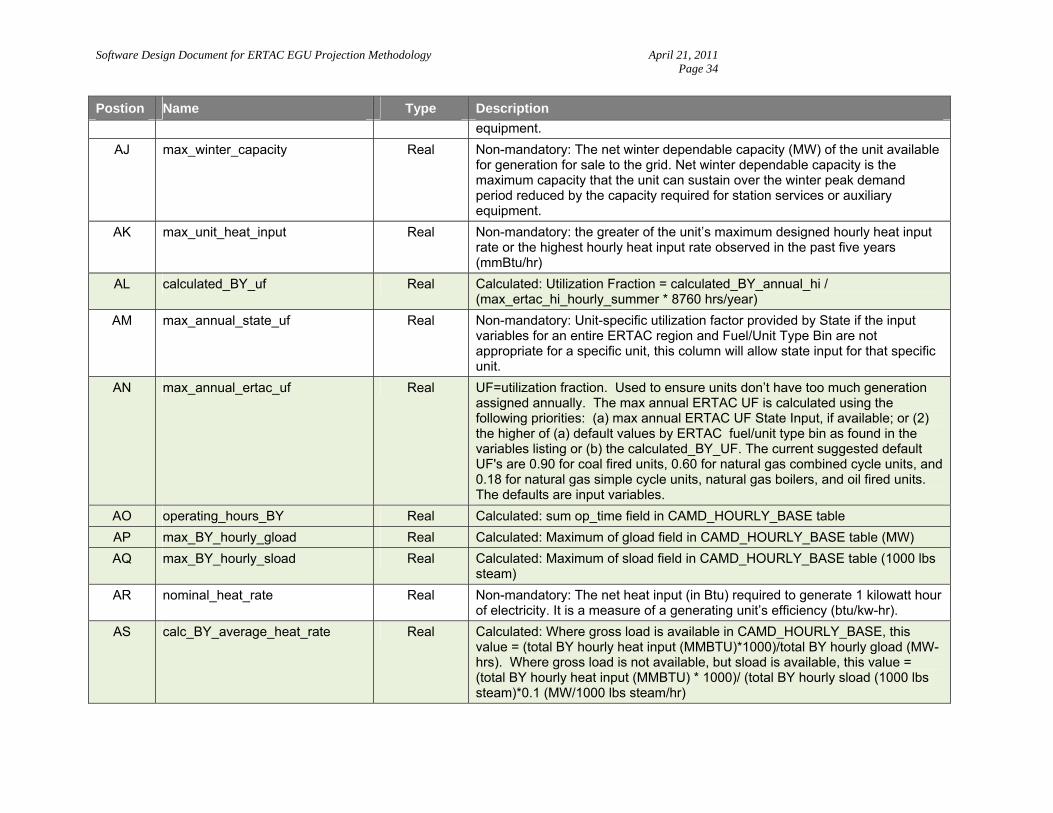
Software Design Document for ERTAC EGU Projection Methodology April 21, 2011 Page 34
Postion Name Type Description
equipment.
AJ max_winter_capacity Real Non-mandatory: The net winter dependable capacity (MW) of the unit available for generation for sale to the grid. Net winter dependable capacity is the maximum capacity that the unit can sustain over the winter peak demand period reduced by the capacity required for station services or auxiliary equipment.
AK max_unit_heat_input Real Non-mandatory: the greater of the unit’s maximum designed hourly heat input rate or the highest hourly heat input rate observed in the past five years (mmBtu/hr)
AL calculated_BY_uf Real Calculated: Utilization Fraction = calculated_BY_annual_hi / (max_ertac_hi_hourly_summer * 8760 hrs/year)
AM max_annual_state_uf Real Non-mandatory: Unit-specific utilization factor provided by State if the input variables for an entire ERTAC region and Fuel/Unit Type Bin are not appropriate for a specific unit, this column will allow state input for that specific unit.
AN max_annual_ertac_uf Real UF=utilization fraction. Used to ensure units don’t have too much generation assigned annually. The max annual ERTAC UF is calculated using the following priorities: (a) max annual ERTAC UF State Input, if available; or (2) the higher of (a) default values by ERTAC fuel/unit type bin as found in the variables listing or (b) the calculated_BY_UF. The current suggested default UF's are 0.90 for coal fired units, 0.60 for natural gas combined cycle units, and 0.18 for natural gas simple cycle units, natural gas boilers, and oil fired units. The defaults are input variables.
AO operating_hours_BY Real Calculated: sum op_time field in CAMD_HOURLY_BASE table
AP max_BY_hourly_gload Real Calculated: Maximum of gload field in CAMD_HOURLY_BASE table (MW)
AQ max_BY_hourly_sload Real Calculated: Maximum of sload field in CAMD_HOURLY_BASE table (1000 lbs steam)
AR nominal_heat_rate Real Non-mandatory: The net heat input (in Btu) required to generate 1 kilowatt hour of electricity. It is a measure of a generating unit’s efficiency (btu/kw-hr).
AS calc_BY_average_heat_rate Real Calculated: Where gross load is available in CAMD_HOURLY_BASE, this value = (total BY hourly heat input (MMBTU)*1000)/total BY hourly gload (MW-hrs). Where gross load is not available, but sload is available, this value = (total BY hourly heat input (MMBTU) * 1000)/ (total BY hourly sload (1000 lbs steam)*0.1 (MW/1000 lbs steam/hr)
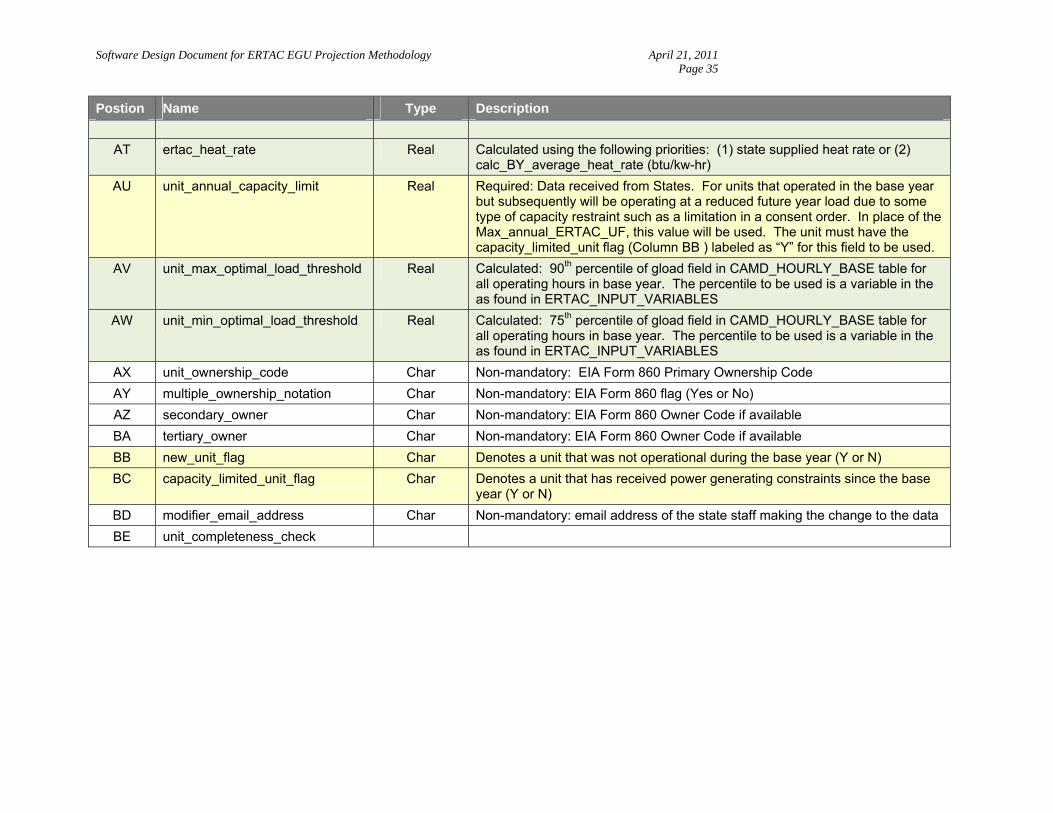
Software Design Document for ERTAC EGU Projection Methodology April 21, 2011 Page 35
Postion Name Type Description
AT ertac_heat_rate Real Calculated using the following priorities: (1) state supplied heat rate or (2) calc_BY_average_heat_rate (btu/kw-hr)
AU unit_annual_capacity_limit Real Required: Data received from States. For units that operated in the base year but subsequently will be operating at a reduced future year load due to some type of capacity restraint such as a limitation in a consent order. In place of the Max_annual_ERTAC_UF, this value will be used. The unit must have the capacity_limited_unit flag (Column BB ) labeled as “Y” for this field to be used.
AV unit_max_optimal_load_threshold Real Calculated: 90th percentile of gload field in CAMD_HOURLY_BASE table for all operating hours in base year. The percentile to be used is a variable in the as found in ERTAC_INPUT_VARIABLES
AW unit_min_optimal_load_threshold Real Calculated: 75th percentile of gload field in CAMD_HOURLY_BASE table for all operating hours in base year. The percentile to be used is a variable in the as found in ERTAC_INPUT_VARIABLES
AX unit_ownership_code Char Non-mandatory: EIA Form 860 Primary Ownership Code
AY multiple_ownership_notation Char Non-mandatory: EIA Form 860 flag (Yes or No)
AZ secondary_owner Char Non-mandatory: EIA Form 860 Owner Code if available
BA tertiary_owner Char Non-mandatory: EIA Form 860 Owner Code if available
BB new_unit_flag Char Denotes a unit that was not operational during the base year (Y or N)
BC capacity_limited_unit_flag Char Denotes a unit that has received power generating constraints since the base year (Y or N)
BD modifier_email_address Char Non-mandatory: email address of the state staff making the change to the data
BE unit_completeness_check
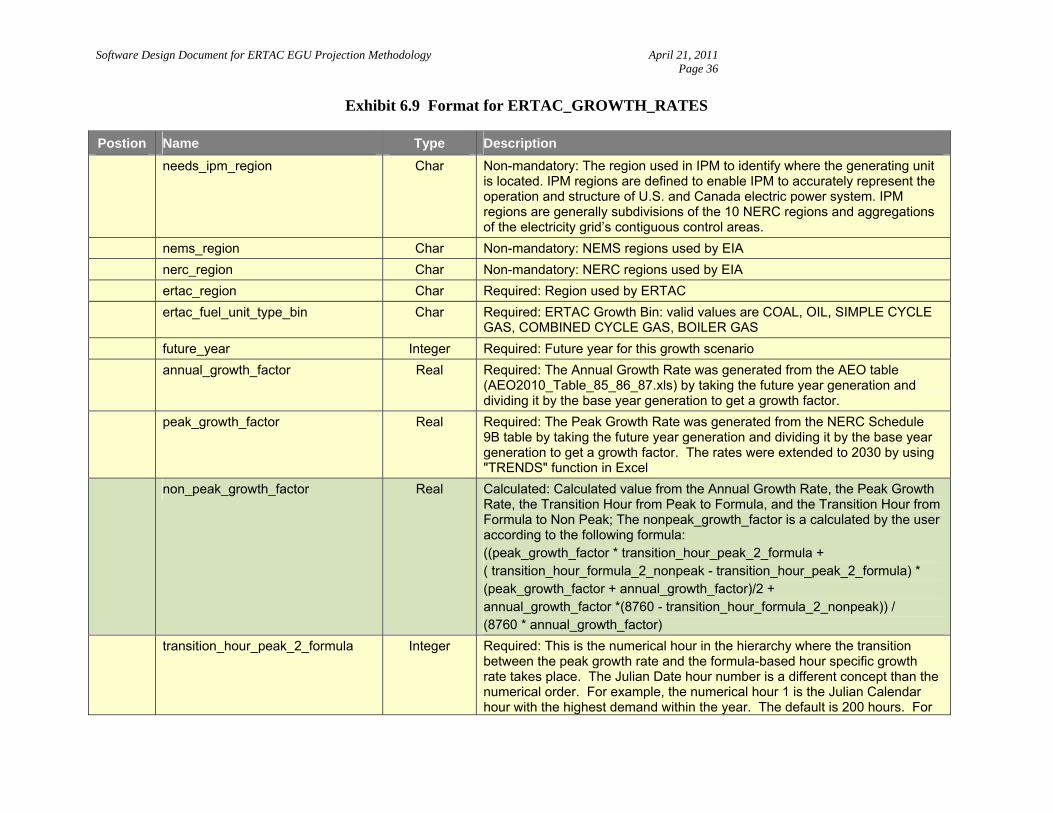
Software Design Document for ERTAC EGU Projection Methodology April 21, 2011 Page 36
Exhibit 6.9 Format for ERTAC_GROWTH_RATES
Postion Name Type Description
needs_ipm_region Char Non-mandatory: The region used in IPM to identify where the generating unit is located. IPM regions are defined to enable IPM to accurately represent the operation and structure of U.S. and Canada electric power system. IPM regions are generally subdivisions of the 10 NERC regions and aggregations of the electricity grid’s contiguous control areas.
nems_region Char Non-mandatory: NEMS regions used by EIA
nerc_region Char Non-mandatory: NERC regions used by EIA
ertac_region Char Required: Region used by ERTAC
ertac_fuel_unit_type_bin Char Required: ERTAC Growth Bin: valid values are COAL, OIL, SIMPLE CYCLE GAS, COMBINED CYCLE GAS, BOILER GAS
future_year Integer Required: Future year for this growth scenario
annual_growth_factor Real Required: The Annual Growth Rate was generated from the AEO table (AEO2010_Table_85_86_87.xls) by taking the future year generation and dividing it by the base year generation to get a growth factor.
peak_growth_factor Real Required: The Peak Growth Rate was generated from the NERC Schedule 9B table by taking the future year generation and dividing it by the base year generation to get a growth factor. The rates were extended to 2030 by using "TRENDS" function in Excel
non_peak_growth_factor Real Calculated: Calculated value from the Annual Growth Rate, the Peak Growth Rate, the Transition Hour from Peak to Formula, and the Transition Hour from Formula to Non Peak; The nonpeak_growth_factor is a calculated by the user according to the following formula: ((peak_growth_factor * transition_hour_peak_2_formula + ( transition_hour_formula_2_nonpeak - transition_hour_peak_2_formula) * (peak_growth_factor + annual_growth_factor)/2 + annual_growth_factor *(8760 - transition_hour_formula_2_nonpeak)) / (8760 * annual_growth_factor)
transition_hour_peak_2_formula Integer Required: This is the numerical hour in the hierarchy where the transition between the peak growth rate and the formula-based hour specific growth rate takes place. The Julian Date hour number is a different concept than the numerical order. For example, the numerical hour 1 is the Julian Calendar hour with the highest demand within the year. The default is 200 hours. For
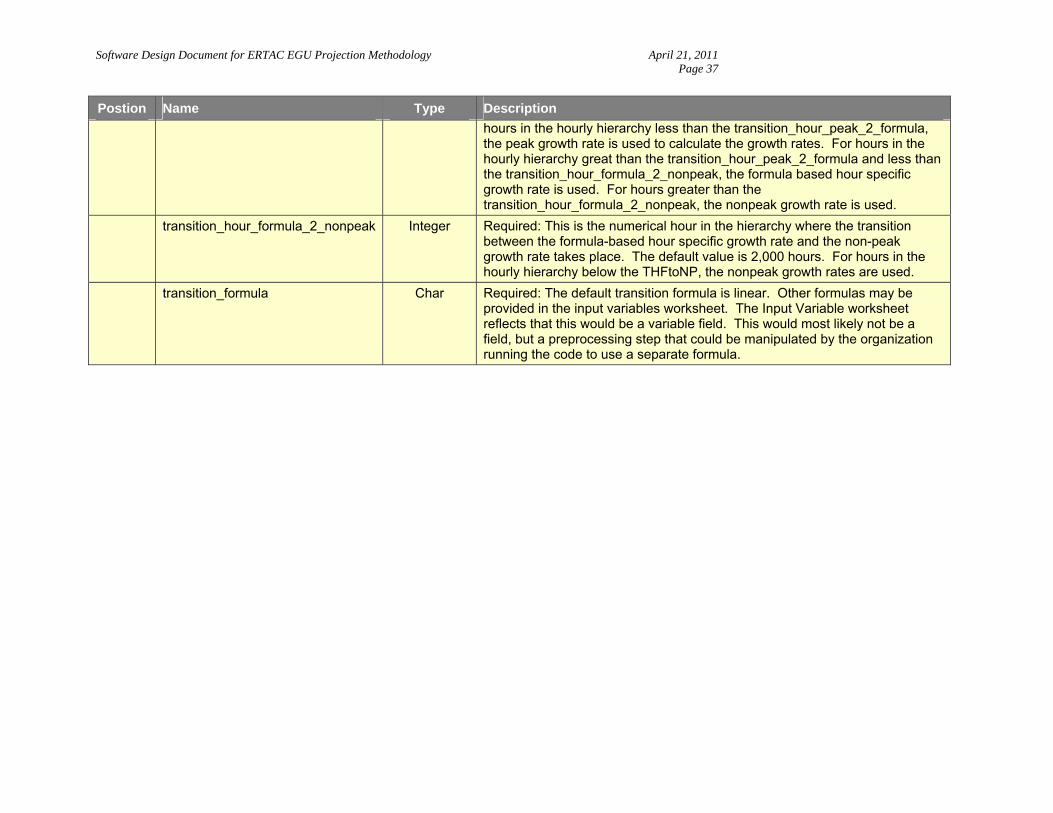
Software Design Document for ERTAC EGU Projection Methodology April 21, 2011 Page 37
Postion Name Type Description
hours in the hourly hierarchy less than the transition_hour_peak_2_formula, the peak growth rate is used to calculate the growth rates. For hours in the hourly hierarchy great than the transition_hour_peak_2_formula and less than the transition_hour_formula_2_nonpeak, the formula based hour specific growth rate is used. For hours greater than the transition_hour_formula_2_nonpeak, the nonpeak growth rate is used.
transition_hour_formula_2_nonpeak Integer Required: This is the numerical hour in the hierarchy where the transition between the formula-based hour specific growth rate and the non-peak growth rate takes place. The default value is 2,000 hours. For hours in the hourly hierarchy below the THFtoNP, the nonpeak growth rates are used.
transition_formula Char Required: The default transition formula is linear. Other formulas may be provided in the input variables worksheet. The Input Variable worksheet reflects that this would be a variable field. This would most likely not be a field, but a preprocessing step that could be manipulated by the organization running the code to use a separate formula.
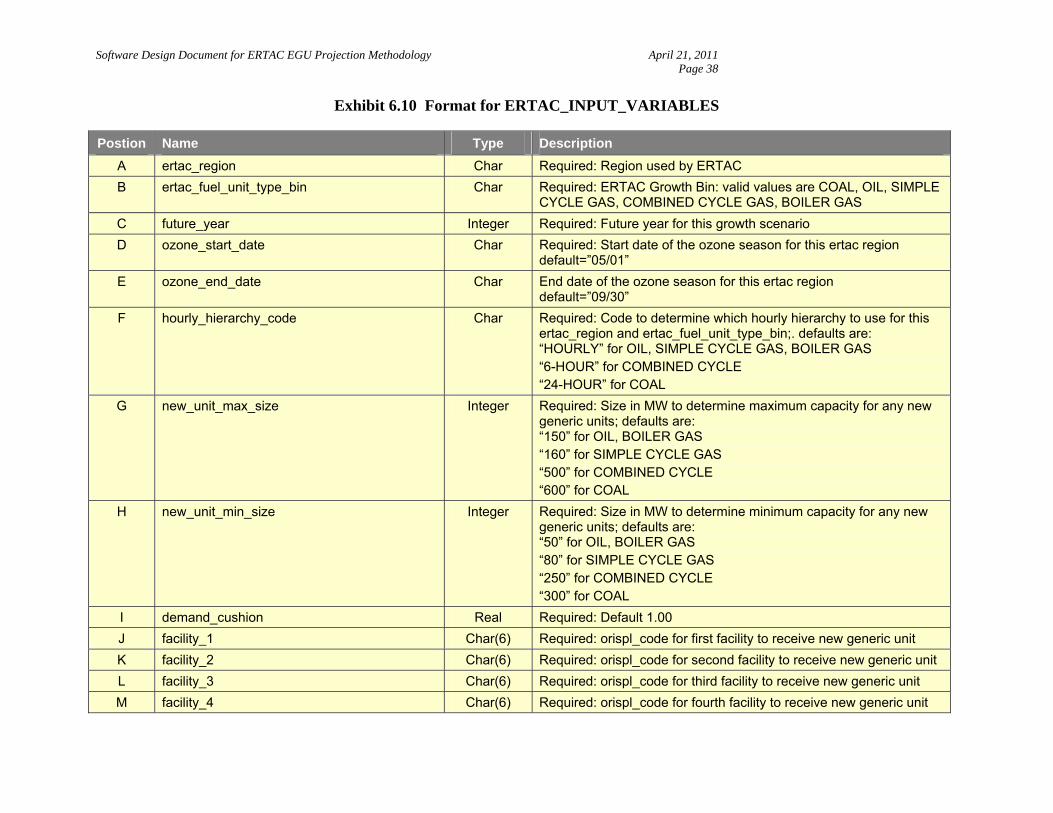
Software Design Document for ERTAC EGU Projection Methodology April 21, 2011 Page 38
Exhibit 6.10 Format for ERTAC_INPUT_VARIABLES
Postion Name Type Description
A ertac_region Char Required: Region used by ERTAC
B ertac_fuel_unit_type_bin Char Required: ERTAC Growth Bin: valid values are COAL, OIL, SIMPLE CYCLE GAS, COMBINED CYCLE GAS, BOILER GAS
C future_year Integer Required: Future year for this growth scenario
D ozone_start_date Char Required: Start date of the ozone season for this ertac region default=”05/01”
E ozone_end_date Char End date of the ozone season for this ertac region default=”09/30”
F hourly_hierarchy_code Char Required: Code to determine which hourly hierarchy to use for this ertac_region and ertac_fuel_unit_type_bin;. defaults are: “HOURLY” for OIL, SIMPLE CYCLE GAS, BOILER GAS “6-HOUR” for COMBINED CYCLE “24-HOUR” for COAL
G new_unit_max_size Integer Required: Size in MW to determine maximum capacity for any new generic units; defaults are: “150” for OIL, BOILER GAS “160” for SIMPLE CYCLE GAS “500” for COMBINED CYCLE “600” for COAL
H new_unit_min_size Integer Required: Size in MW to determine minimum capacity for any new generic units; defaults are: “50” for OIL, BOILER GAS “80” for SIMPLE CYCLE GAS “250” for COMBINED CYCLE “300” for COAL
I demand_cushion Real Required: Default 1.00
J facility_1 Char(6) Required: orispl_code for first facility to receive new generic unit
K facility_2 Char(6) Required: orispl_code for second facility to receive new generic unit
L facility_3 Char(6) Required: orispl_code for third facility to receive new generic unit
M facility_4 Char(6) Required: orispl_code for fourth facility to receive new generic unit
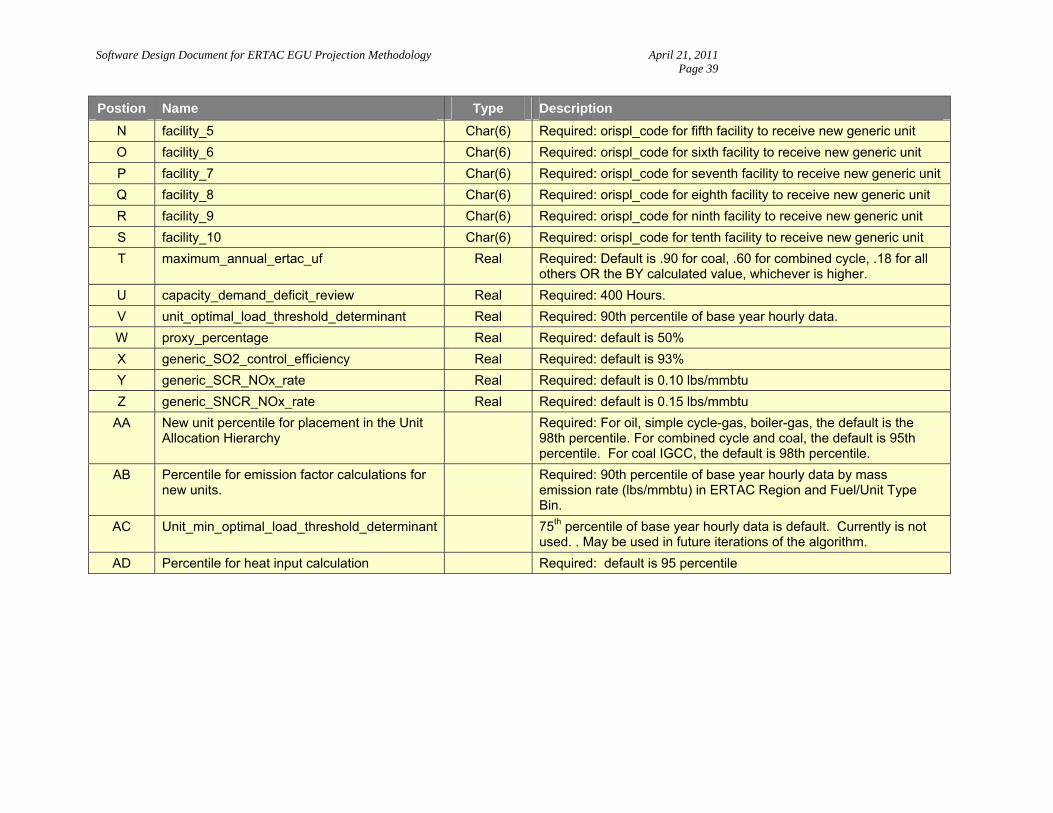
Software Design Document for ERTAC EGU Projection Methodology April 21, 2011 Page 39
Postion Name Type Description
N facility_5 Char(6) Required: orispl_code for fifth facility to receive new generic unit
O facility_6 Char(6) Required: orispl_code for sixth facility to receive new generic unit
P facility_7 Char(6) Required: orispl_code for seventh facility to receive new generic unit
Q facility_8 Char(6) Required: orispl_code for eighth facility to receive new generic unit
R facility_9 Char(6) Required: orispl_code for ninth facility to receive new generic unit
S facility_10 Char(6) Required: orispl_code for tenth facility to receive new generic unit
T maximum_annual_ertac_uf Real Required: Default is .90 for coal, .60 for combined cycle, .18 for all others OR the BY calculated value, whichever is higher.
U capacity_demand_deficit_review Real Required: 400 Hours.
V unit_optimal_load_threshold_determinant Real Required: 90th percentile of base year hourly data.
W proxy_percentage Real Required: default is 50%
X generic_SO2_control_efficiency Real Required: default is 93%
Y generic_SCR_NOx_rate Real Required: default is 0.10 lbs/mmbtu
Z generic_SNCR_NOx_rate Real Required: default is 0.15 lbs/mmbtu
AA New unit percentile for placement in the Unit Allocation Hierarchy
Required: For oil, simple cycle-gas, boiler-gas, the default is the 98th percentile. For combined cycle and coal, the default is 95th percentile. For coal IGCC, the default is 98th percentile.
AB Percentile for emission factor calculations for new units.
Required: 90th percentile of base year hourly data by mass emission rate (lbs/mmbtu) in ERTAC Region and Fuel/Unit Type Bin.
AC Unit_min_optimal_load_threshold_determinant 75th percentile of base year hourly data is default. Currently is not used. . May be used in future iterations of the algorithm.
AD Percentile for heat input calculation Required: default is 95 percentile
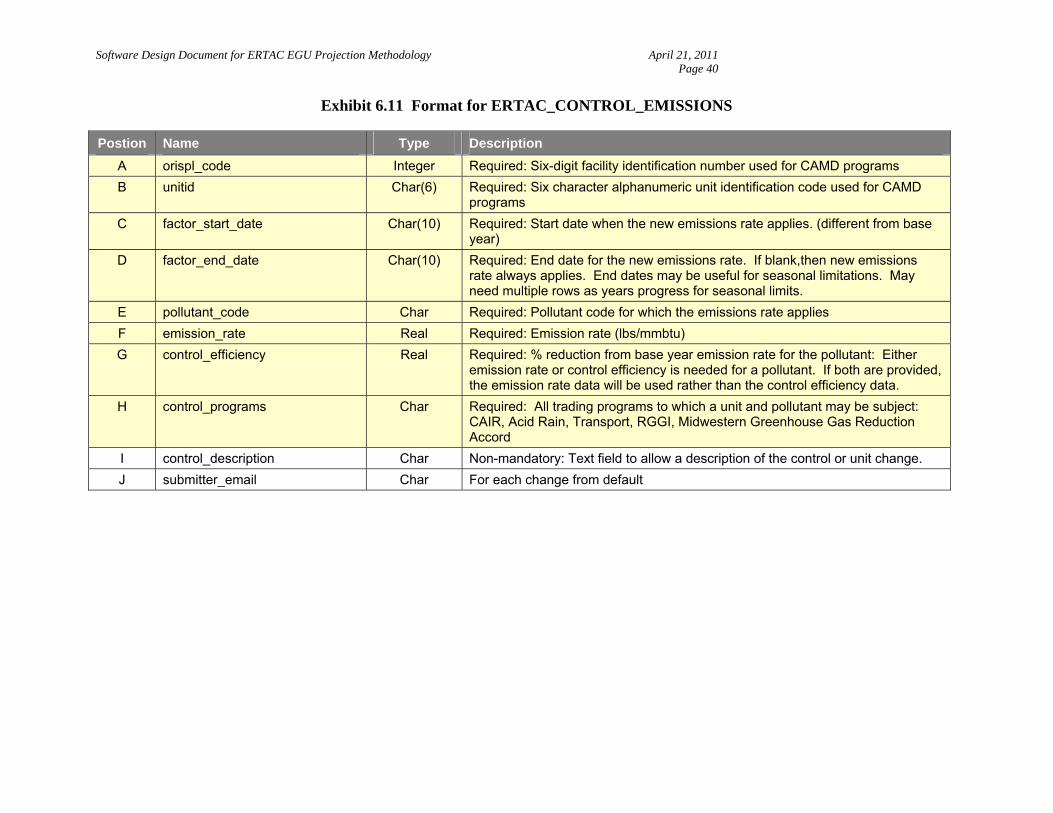
Software Design Document for ERTAC EGU Projection Methodology April 21, 2011 Page 40
Exhibit 6.11 Format for ERTAC_CONTROL_EMISSIONS
Postion Name Type Description
A orispl_code Integer Required: Six-digit facility identification number used for CAMD programs
B unitid Char(6) Required: Six character alphanumeric unit identification code used for CAMD programs
C factor_start_date Char(10) Required: Start date when the new emissions rate applies. (different from base year)
D factor_end_date Char(10) Required: End date for the new emissions rate. If blank,then new emissions rate always applies. End dates may be useful for seasonal limitations. May need multiple rows as years progress for seasonal limits.
E pollutant_code Char Required: Pollutant code for which the emissions rate applies
F emission_rate Real Required: Emission rate (lbs/mmbtu)
G control_efficiency Real Required: % reduction from base year emission rate for the pollutant: Either emission rate or control efficiency is needed for a pollutant. If both are provided, the emission rate data will be used rather than the control efficiency data.
H control_programs Char Required: All trading programs to which a unit and pollutant may be subject: CAIR, Acid Rain, Transport, RGGI, Midwestern Greenhouse Gas Reduction Accord
I control_description Char Non-mandatory: Text field to allow a description of the control or unit change.
J submitter_email Char For each change from default
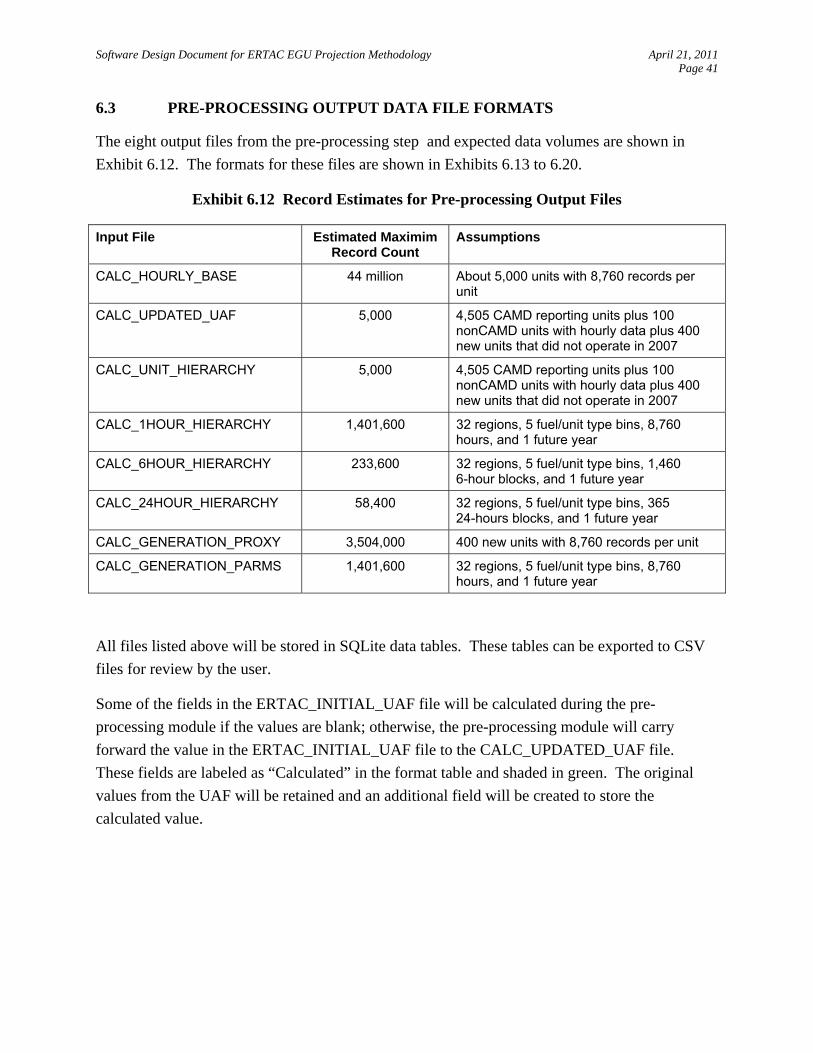
Software Design Document for ERTAC EGU Projection Methodology April 21, 2011 Page 41
6.3 PRE-PROCESSING OUTPUT DATA FILE FORMATS
The eight output files from the pre-processing step and expected data volumes are shown in
Exhibit 6.12. The formats for these files are shown in Exhibits 6.13 to 6.20.
Exhibit 6.12 Record Estimates for Pre-processing Output Files
Input File Estimated MaximimRecord Count
Assumptions
CALC_HOURLY_BASE 44 million About 5,000 units with 8,760 records per unit
CALC_UPDATED_UAF 5,000 4,505 CAMD reporting units plus 100 nonCAMD units with hourly data plus 400 new units that did not operate in 2007
CALC_UNIT_HIERARCHY 5,000 4,505 CAMD reporting units plus 100 nonCAMD units with hourly data plus 400 new units that did not operate in 2007
CALC_1HOUR_HIERARCHY 1,401,600 32 regions, 5 fuel/unit type bins, 8,760 hours, and 1 future year
CALC_6HOUR_HIERARCHY 233,600 32 regions, 5 fuel/unit type bins, 1,460 6-hour blocks, and 1 future year
CALC_24HOUR_HIERARCHY 58,400 32 regions, 5 fuel/unit type bins, 365 24-hours blocks, and 1 future year
CALC_GENERATION_PROXY 3,504,000 400 new units with 8,760 records per unit
CALC_GENERATION_PARMS 1,401,600 32 regions, 5 fuel/unit type bins, 8,760 hours, and 1 future year
All files listed above will be stored in SQLite data tables. These tables can be exported to CSV
files for review by the user.
Some of the fields in the ERTAC_INITIAL_UAF file will be calculated during the pre-
processing module if the values are blank; otherwise, the pre-processing module will carry
forward the value in the ERTAC_INITIAL_UAF file to the CALC_UPDATED_UAF file.
These fields are labeled as “Calculated” in the format table and shaded in green. The original
values from the UAF will be retained and an additional field will be created to store the
calculated value.
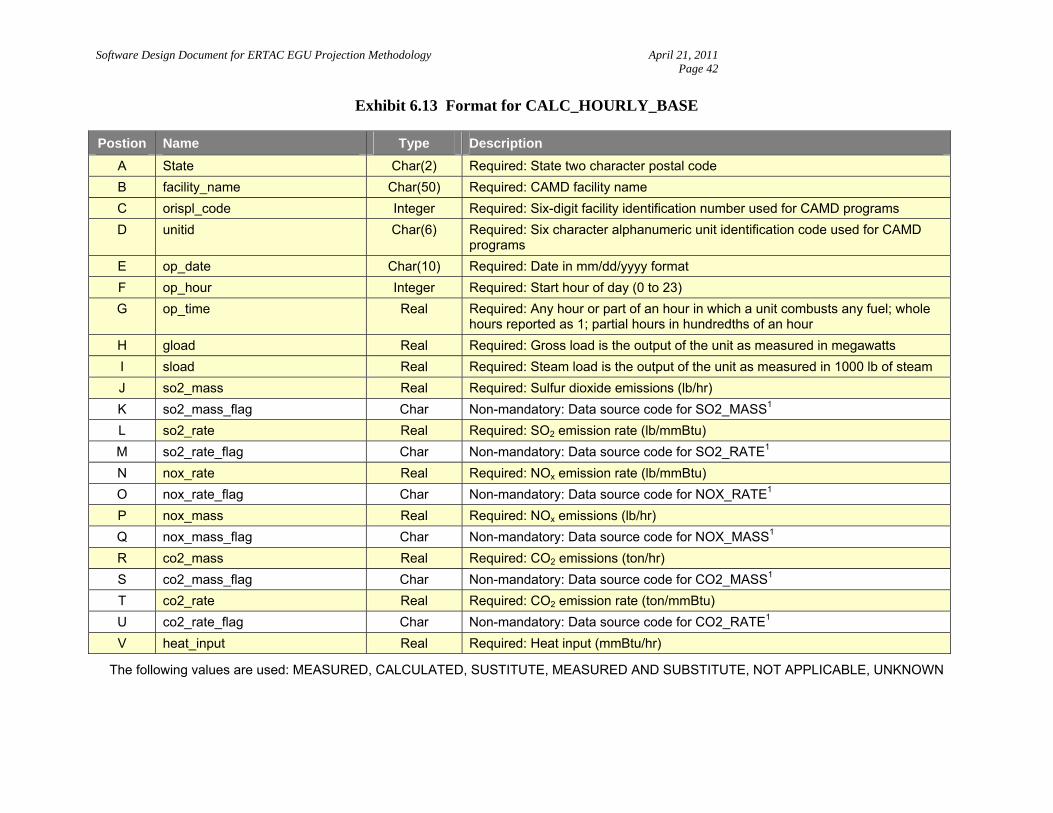
Software Design Document for ERTAC EGU Projection Methodology April 21, 2011 Page 42
Exhibit 6.13 Format for CALC_HOURLY_BASE
Postion Name Type Description
A State Char(2) Required: State two character postal code
B facility_name Char(50) Required: CAMD facility name
C orispl_code Integer Required: Six-digit facility identification number used for CAMD programs
D unitid Char(6) Required: Six character alphanumeric unit identification code used for CAMD programs
E op_date Char(10) Required: Date in mm/dd/yyyy format
F op_hour Integer Required: Start hour of day (0 to 23)
G op_time Real Required: Any hour or part of an hour in which a unit combusts any fuel; whole hours reported as 1; partial hours in hundredths of an hour
H gload Real Required: Gross load is the output of the unit as measured in megawatts
I sload Real Required: Steam load is the output of the unit as measured in 1000 lb of steam
J so2_mass Real Required: Sulfur dioxide emissions (lb/hr)
K so2_mass_flag Char Non-mandatory: Data source code for SO2_MASS1
L so2_rate Real Required: SO2 emission rate (lb/mmBtu)
M so2_rate_flag Char Non-mandatory: Data source code for SO2_RATE1
N nox_rate Real Required: NOx emission rate (lb/mmBtu)
O nox_rate_flag Char Non-mandatory: Data source code for NOX_RATE1
P nox_mass Real Required: NOx emissions (lb/hr)
Q nox_mass_flag Char Non-mandatory: Data source code for NOX_MASS1
R co2_mass Real Required: CO2 emissions (ton/hr)
S co2_mass_flag Char Non-mandatory: Data source code for CO2_MASS1
T co2_rate Real Required: CO2 emission rate (ton/mmBtu)
U co2_rate_flag Char Non-mandatory: Data source code for CO2_RATE1
V heat_input Real Required: Heat input (mmBtu/hr)
The following values are used: MEASURED, CALCULATED, SUSTITUTE, MEASURED AND SUBSTITUTE, NOT APPLICABLE, UNKNOWN
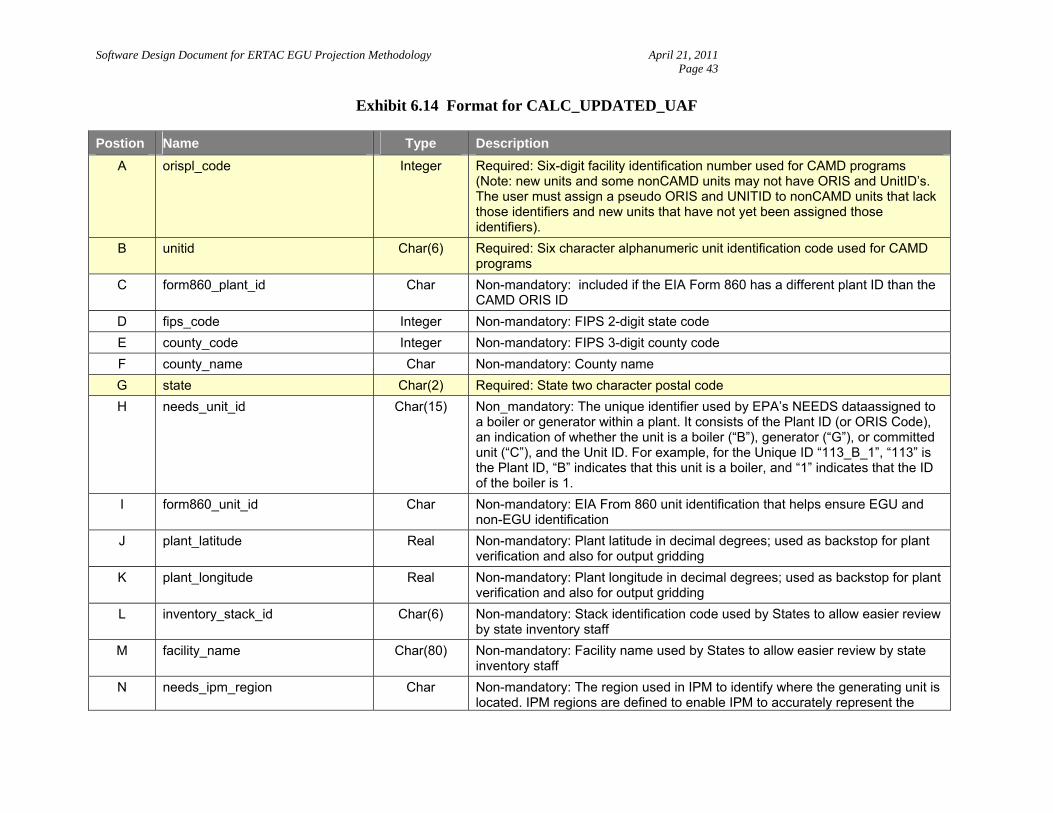
Software Design Document for ERTAC EGU Projection Methodology April 21, 2011 Page 43
Exhibit 6.14 Format for CALC_UPDATED_UAF
Postion Name Type Description
A orispl_code Integer Required: Six-digit facility identification number used for CAMD programs (Note: new units and some nonCAMD units may not have ORIS and UnitID’s. The user must assign a pseudo ORIS and UNITID to nonCAMD units that lack those identifiers and new units that have not yet been assigned those identifiers).
B unitid Char(6) Required: Six character alphanumeric unit identification code used for CAMD programs
C form860_plant_id Char Non-mandatory: included if the EIA Form 860 has a different plant ID than the CAMD ORIS ID
D fips_code Integer Non-mandatory: FIPS 2-digit state code
E county_code Integer Non-mandatory: FIPS 3-digit county code
F county_name Char Non-mandatory: County name
G state Char(2) Required: State two character postal code
H needs_unit_id Char(15) Non_mandatory: The unique identifier used by EPA’s NEEDS dataassigned to a boiler or generator within a plant. It consists of the Plant ID (or ORIS Code), an indication of whether the unit is a boiler (“B”), generator (“G”), or committed unit (“C”), and the Unit ID. For example, for the Unique ID “113_B_1”, “113” is the Plant ID, “B” indicates that this unit is a boiler, and “1” indicates that the ID of the boiler is 1.
I form860_unit_id Char Non-mandatory: EIA From 860 unit identification that helps ensure EGU and non-EGU identification
J plant_latitude Real Non-mandatory: Plant latitude in decimal degrees; used as backstop for plant verification and also for output gridding
K plant_longitude Real Non-mandatory: Plant longitude in decimal degrees; used as backstop for plant verification and also for output gridding
L inventory_stack_id Char(6) Non-mandatory: Stack identification code used by States to allow easier review by state inventory staff
M facility_name Char(80) Non-mandatory: Facility name used by States to allow easier review by state inventory staff
N needs_ipm_region Char Non-mandatory: The region used in IPM to identify where the generating unit is located. IPM regions are defined to enable IPM to accurately represent the
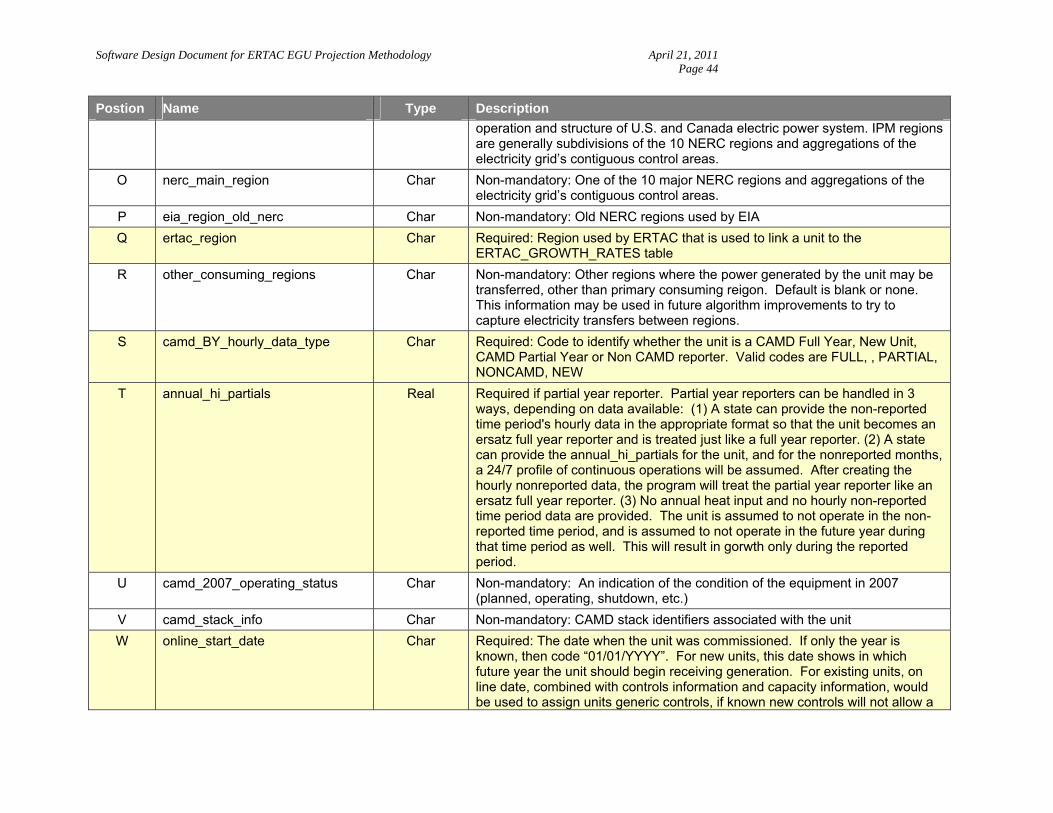
Software Design Document for ERTAC EGU Projection Methodology April 21, 2011 Page 44
Postion Name Type Description
operation and structure of U.S. and Canada electric power system. IPM regions are generally subdivisions of the 10 NERC regions and aggregations of the electricity grid’s contiguous control areas.
O nerc_main_region Char Non-mandatory: One of the 10 major NERC regions and aggregations of the electricity grid’s contiguous control areas.
P eia_region_old_nerc Char Non-mandatory: Old NERC regions used by EIA
Q ertac_region Char Required: Region used by ERTAC that is used to link a unit to the ERTAC_GROWTH_RATES table
R other_consuming_regions Char Non-mandatory: Other regions where the power generated by the unit may be transferred, other than primary consuming reigon. Default is blank or none. This information may be used in future algorithm improvements to try to capture electricity transfers between regions.
S camd_BY_hourly_data_type Char Required: Code to identify whether the unit is a CAMD Full Year, New Unit, CAMD Partial Year or Non CAMD reporter. Valid codes are FULL, , PARTIAL, NONCAMD, NEW
T annual_hi_partials Real Required if partial year reporter. Partial year reporters can be handled in 3 ways, depending on data available: (1) A state can provide the non-reported time period's hourly data in the appropriate format so that the unit becomes an ersatz full year reporter and is treated just like a full year reporter. (2) A state can provide the annual_hi_partials for the unit, and for the nonreported months, a 24/7 profile of continuous operations will be assumed. After creating the hourly nonreported data, the program will treat the partial year reporter like an ersatz full year reporter. (3) No annual heat input and no hourly non-reported time period data are provided. The unit is assumed to not operate in the non-reported time period, and is assumed to not operate in the future year during that time period as well. This will result in gorwth only during the reported period.
U camd_2007_operating_status Char Non-mandatory: An indication of the condition of the equipment in 2007 (planned, operating, shutdown, etc.)
V camd_stack_info Char Non-mandatory: CAMD stack identifiers associated with the unit
W online_start_date Char Required: The date when the unit was commissioned. If only the year is known, then code “01/01/YYYY”. For new units, this date shows in which future year the unit should begin receiving generation. For existing units, on line date, combined with controls information and capacity information, would be used to assign units generic controls, if known new controls will not allow a
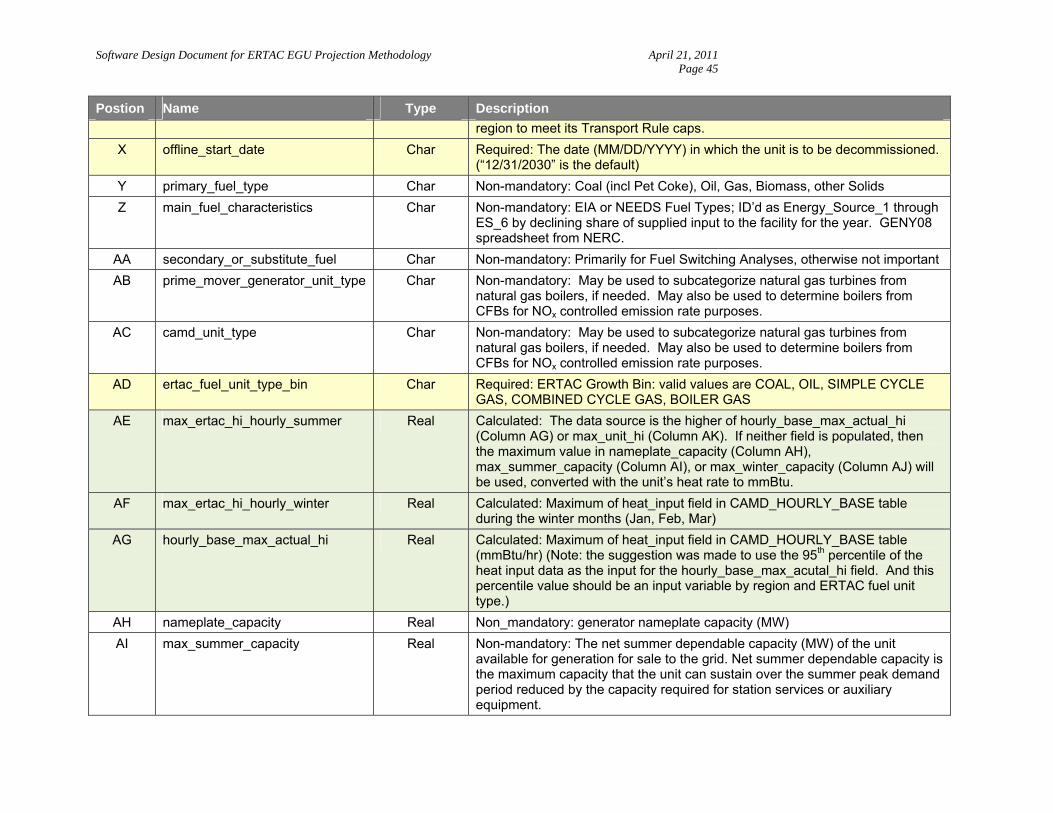
Software Design Document for ERTAC EGU Projection Methodology April 21, 2011 Page 45
Postion Name Type Description
region to meet its Transport Rule caps.
X offline_start_date Char Required: The date (MM/DD/YYYY) in which the unit is to be decommissioned. (“12/31/2030” is the default)
Y primary_fuel_type Char Non-mandatory: Coal (incl Pet Coke), Oil, Gas, Biomass, other Solids
Z main_fuel_characteristics Char Non-mandatory: EIA or NEEDS Fuel Types; ID’d as Energy_Source_1 through ES_6 by declining share of supplied input to the facility for the year. GENY08 spreadsheet from NERC.
AA secondary_or_substitute_fuel Char Non-mandatory: Primarily for Fuel Switching Analyses, otherwise not important
AB prime_mover_generator_unit_type Char Non-mandatory: May be used to subcategorize natural gas turbines from natural gas boilers, if needed. May also be used to determine boilers from CFBs for NOx controlled emission rate purposes.
AC camd_unit_type Char Non-mandatory: May be used to subcategorize natural gas turbines from natural gas boilers, if needed. May also be used to determine boilers from CFBs for NOx controlled emission rate purposes.
AD ertac_fuel_unit_type_bin Char Required: ERTAC Growth Bin: valid values are COAL, OIL, SIMPLE CYCLE GAS, COMBINED CYCLE GAS, BOILER GAS
AE max_ertac_hi_hourly_summer Real Calculated: The data source is the higher of hourly_base_max_actual_hi (Column AG) or max_unit_hi (Column AK). If neither field is populated, then the maximum value in nameplate_capacity (Column AH), max_summer_capacity (Column AI), or max_winter_capacity (Column AJ) will be used, converted with the unit’s heat rate to mmBtu.
AF max_ertac_hi_hourly_winter Real Calculated: Maximum of heat_input field in CAMD_HOURLY_BASE table during the winter months (Jan, Feb, Mar)
AG hourly_base_max_actual_hi Real Calculated: Maximum of heat_input field in CAMD_HOURLY_BASE table (mmBtu/hr) (Note: the suggestion was made to use the 95th percentile of the heat input data as the input for the hourly_base_max_acutal_hi field. And this percentile value should be an input variable by region and ERTAC fuel unit type.)
AH nameplate_capacity Real Non_mandatory: generator nameplate capacity (MW)
AI max_summer_capacity Real Non-mandatory: The net summer dependable capacity (MW) of the unit available for generation for sale to the grid. Net summer dependable capacity is the maximum capacity that the unit can sustain over the summer peak demand period reduced by the capacity required for station services or auxiliary equipment.
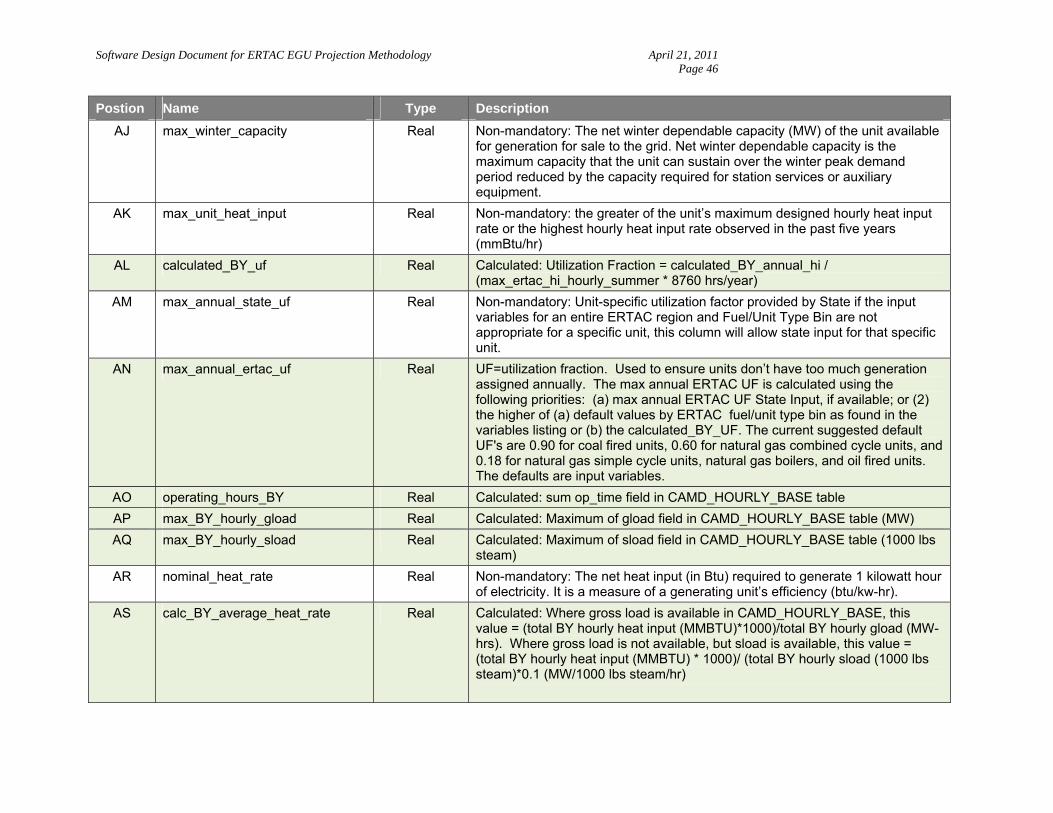
Software Design Document for ERTAC EGU Projection Methodology April 21, 2011 Page 46
Postion Name Type Description
AJ max_winter_capacity Real Non-mandatory: The net winter dependable capacity (MW) of the unit available for generation for sale to the grid. Net winter dependable capacity is the maximum capacity that the unit can sustain over the winter peak demand period reduced by the capacity required for station services or auxiliary equipment.
AK max_unit_heat_input Real Non-mandatory: the greater of the unit’s maximum designed hourly heat input rate or the highest hourly heat input rate observed in the past five years (mmBtu/hr)
AL calculated_BY_uf Real Calculated: Utilization Fraction = calculated_BY_annual_hi / (max_ertac_hi_hourly_summer * 8760 hrs/year)
AM max_annual_state_uf Real Non-mandatory: Unit-specific utilization factor provided by State if the input variables for an entire ERTAC region and Fuel/Unit Type Bin are not appropriate for a specific unit, this column will allow state input for that specific unit.
AN max_annual_ertac_uf Real UF=utilization fraction. Used to ensure units don’t have too much generation assigned annually. The max annual ERTAC UF is calculated using the following priorities: (a) max annual ERTAC UF State Input, if available; or (2) the higher of (a) default values by ERTAC fuel/unit type bin as found in the variables listing or (b) the calculated_BY_UF. The current suggested default UF's are 0.90 for coal fired units, 0.60 for natural gas combined cycle units, and 0.18 for natural gas simple cycle units, natural gas boilers, and oil fired units. The defaults are input variables.
AO operating_hours_BY Real Calculated: sum op_time field in CAMD_HOURLY_BASE table
AP max_BY_hourly_gload Real Calculated: Maximum of gload field in CAMD_HOURLY_BASE table (MW)
AQ max_BY_hourly_sload Real Calculated: Maximum of sload field in CAMD_HOURLY_BASE table (1000 lbs steam)
AR nominal_heat_rate Real Non-mandatory: The net heat input (in Btu) required to generate 1 kilowatt hour of electricity. It is a measure of a generating unit’s efficiency (btu/kw-hr).
AS calc_BY_average_heat_rate Real Calculated: Where gross load is available in CAMD_HOURLY_BASE, this value = (total BY hourly heat input (MMBTU)*1000)/total BY hourly gload (MW-hrs). Where gross load is not available, but sload is available, this value = (total BY hourly heat input (MMBTU) * 1000)/ (total BY hourly sload (1000 lbs steam)*0.1 (MW/1000 lbs steam/hr)
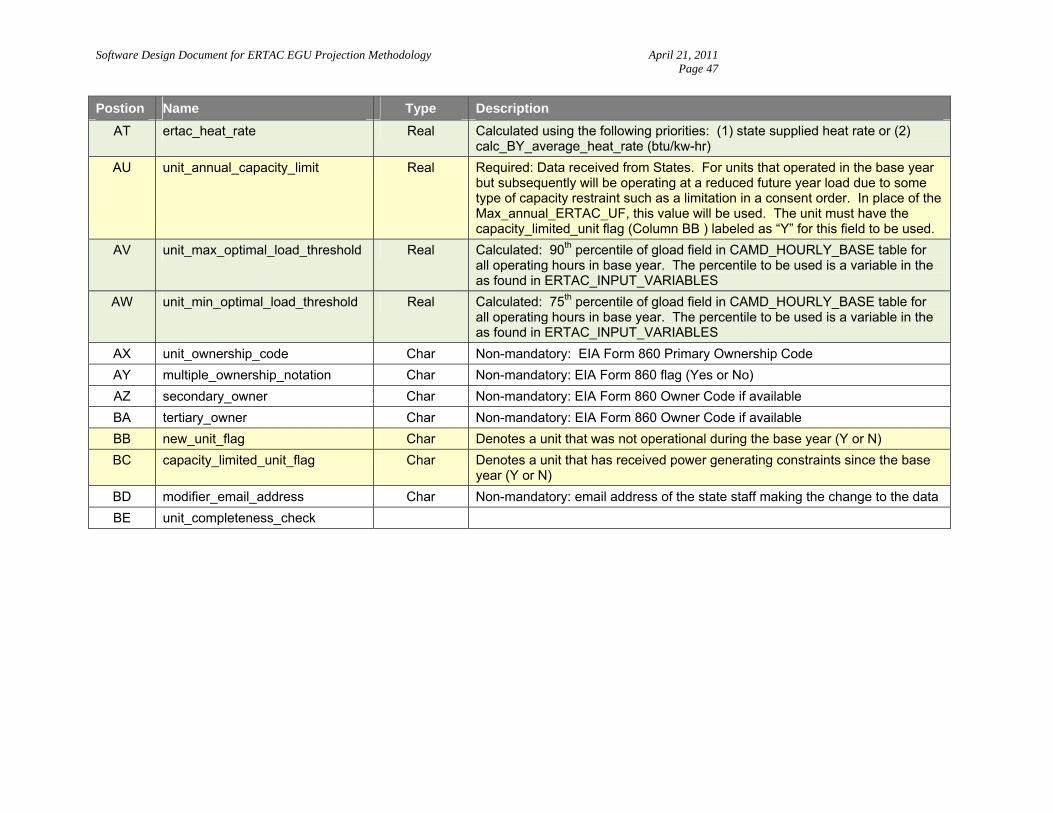
Software Design Document for ERTAC EGU Projection Methodology April 21, 2011 Page 47
Postion Name Type Description
AT ertac_heat_rate Real Calculated using the following priorities: (1) state supplied heat rate or (2) calc_BY_average_heat_rate (btu/kw-hr)
AU unit_annual_capacity_limit Real Required: Data received from States. For units that operated in the base year but subsequently will be operating at a reduced future year load due to some type of capacity restraint such as a limitation in a consent order. In place of the Max_annual_ERTAC_UF, this value will be used. The unit must have the capacity_limited_unit flag (Column BB ) labeled as “Y” for this field to be used.
AV unit_max_optimal_load_threshold Real Calculated: 90th percentile of gload field in CAMD_HOURLY_BASE table for all operating hours in base year. The percentile to be used is a variable in the as found in ERTAC_INPUT_VARIABLES
AW unit_min_optimal_load_threshold Real Calculated: 75th percentile of gload field in CAMD_HOURLY_BASE table for all operating hours in base year. The percentile to be used is a variable in the as found in ERTAC_INPUT_VARIABLES
AX unit_ownership_code Char Non-mandatory: EIA Form 860 Primary Ownership Code
AY multiple_ownership_notation Char Non-mandatory: EIA Form 860 flag (Yes or No)
AZ secondary_owner Char Non-mandatory: EIA Form 860 Owner Code if available
BA tertiary_owner Char Non-mandatory: EIA Form 860 Owner Code if available
BB new_unit_flag Char Denotes a unit that was not operational during the base year (Y or N)
BC capacity_limited_unit_flag Char Denotes a unit that has received power generating constraints since the base year (Y or N)
BD modifier_email_address Char Non-mandatory: email address of the state staff making the change to the data
BE unit_completeness_check
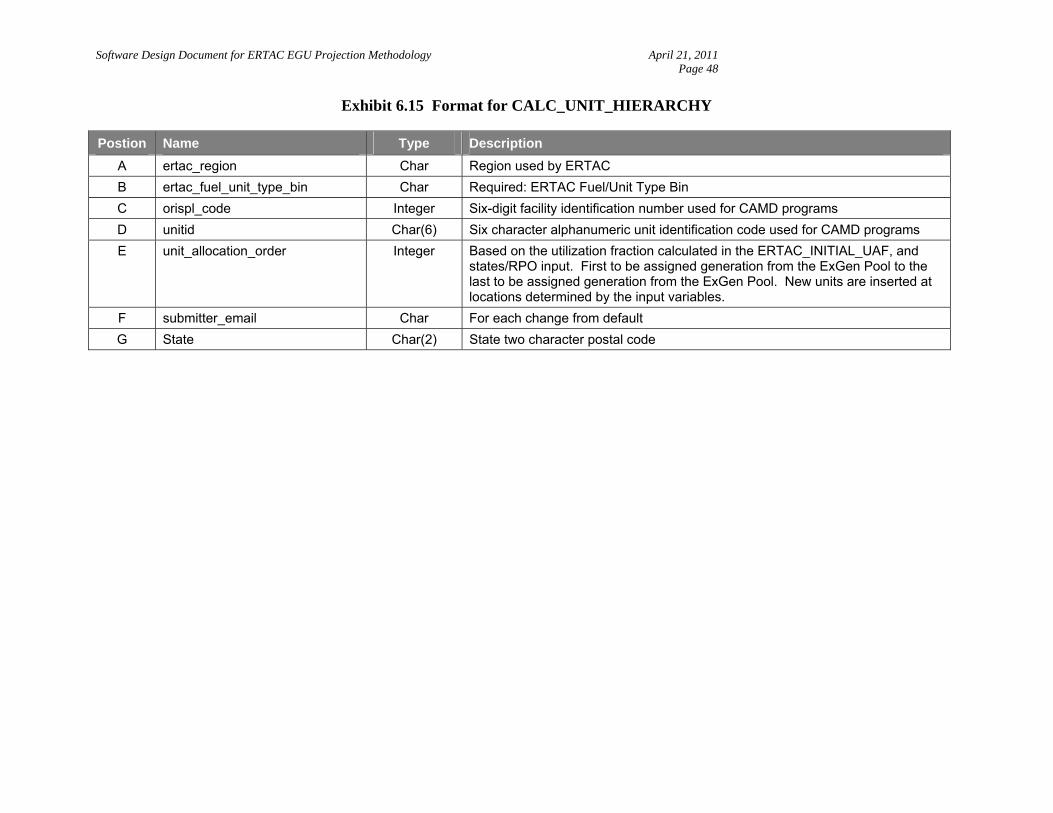
Software Design Document for ERTAC EGU Projection Methodology April 21, 2011 Page 48
Exhibit 6.15 Format for CALC_UNIT_HIERARCHY
Postion Name Type Description
A ertac_region Char Region used by ERTAC
B ertac_fuel_unit_type_bin Char Required: ERTAC Fuel/Unit Type Bin
C orispl_code Integer Six-digit facility identification number used for CAMD programs
D unitid Char(6) Six character alphanumeric unit identification code used for CAMD programs
E unit_allocation_order Integer Based on the utilization fraction calculated in the ERTAC_INITIAL_UAF, and states/RPO input. First to be assigned generation from the ExGen Pool to the last to be assigned generation from the ExGen Pool. New units are inserted at locations determined by the input variables.
F submitter_email Char For each change from default
G State Char(2) State two character postal code
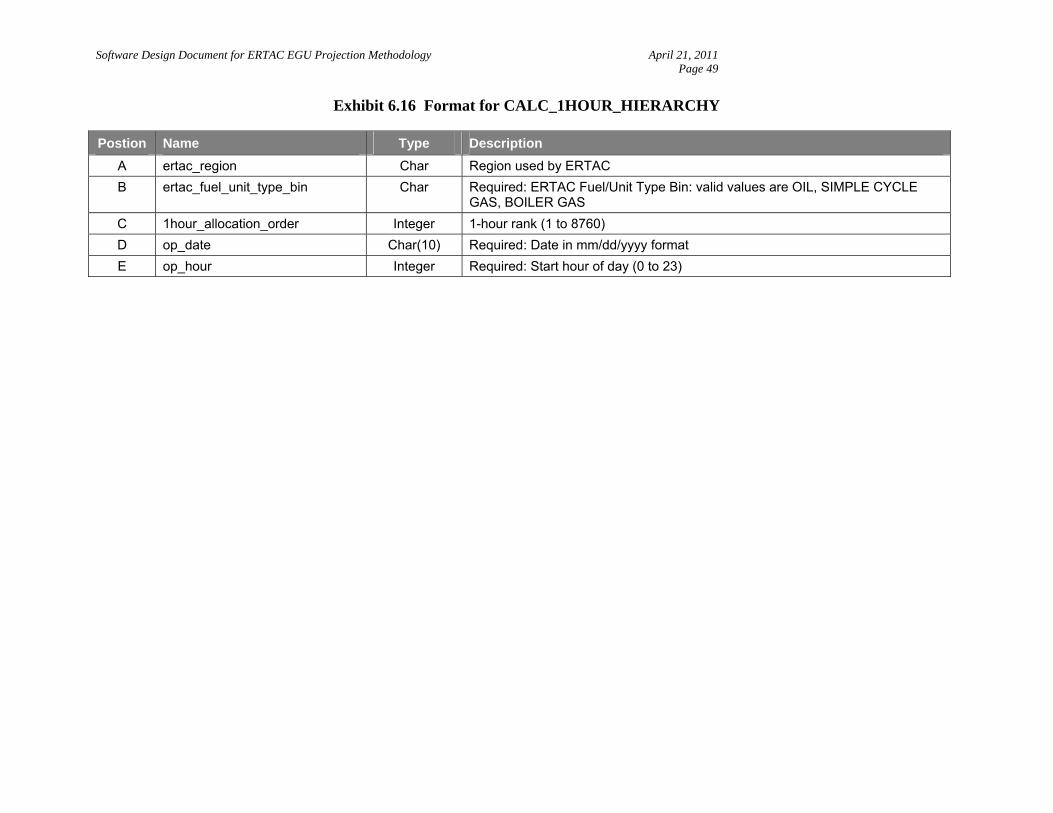
Software Design Document for ERTAC EGU Projection Methodology April 21, 2011 Page 49
Exhibit 6.16 Format for CALC_1HOUR_HIERARCHY
Postion Name Type Description
A ertac_region Char Region used by ERTAC
B ertac_fuel_unit_type_bin Char Required: ERTAC Fuel/Unit Type Bin: valid values are OIL, SIMPLE CYCLE GAS, BOILER GAS
C 1hour_allocation_order Integer 1-hour rank (1 to 8760)
D op_date Char(10) Required: Date in mm/dd/yyyy format
E op_hour Integer Required: Start hour of day (0 to 23)
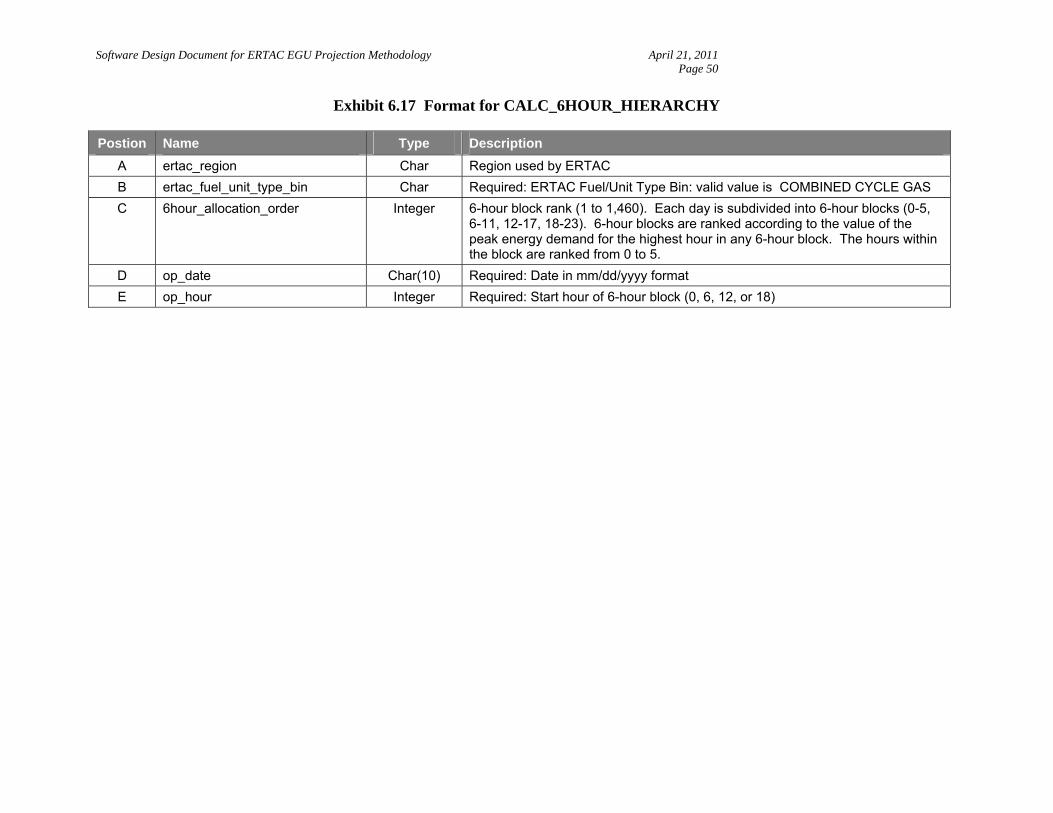
Software Design Document for ERTAC EGU Projection Methodology April 21, 2011 Page 50
Exhibit 6.17 Format for CALC_6HOUR_HIERARCHY
Postion Name Type Description
A ertac_region Char Region used by ERTAC
B ertac_fuel_unit_type_bin Char Required: ERTAC Fuel/Unit Type Bin: valid value is COMBINED CYCLE GAS
C 6hour_allocation_order Integer 6-hour block rank (1 to 1,460). Each day is subdivided into 6-hour blocks (0-5, 6-11, 12-17, 18-23). 6-hour blocks are ranked according to the value of the peak energy demand for the highest hour in any 6-hour block. The hours within the block are ranked from 0 to 5.
D op_date Char(10) Required: Date in mm/dd/yyyy format
E op_hour Integer Required: Start hour of 6-hour block (0, 6, 12, or 18)
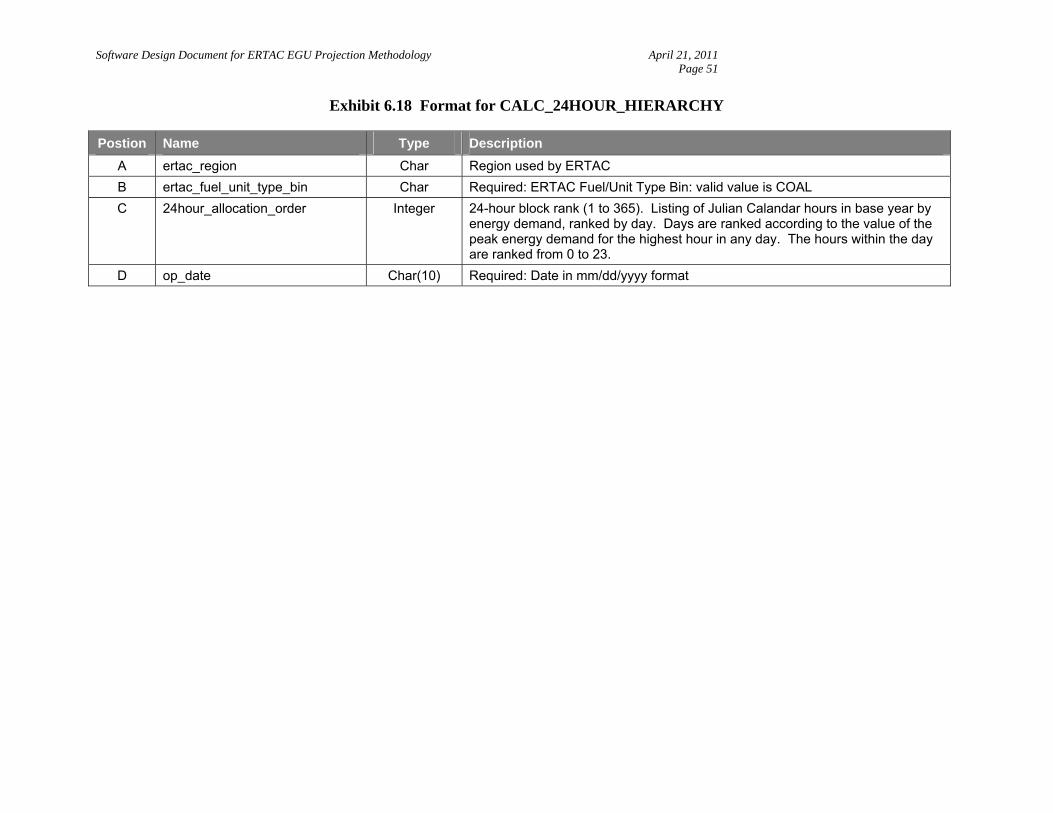
Software Design Document for ERTAC EGU Projection Methodology April 21, 2011 Page 51
Exhibit 6.18 Format for CALC_24HOUR_HIERARCHY
Postion Name Type Description
A ertac_region Char Region used by ERTAC
B ertac_fuel_unit_type_bin Char Required: ERTAC Fuel/Unit Type Bin: valid value is COAL
C 24hour_allocation_order Integer 24-hour block rank (1 to 365). Listing of Julian Calandar hours in base year by energy demand, ranked by day. Days are ranked according to the value of the peak energy demand for the highest hour in any day. The hours within the day are ranked from 0 to 23.
D op_date Char(10) Required: Date in mm/dd/yyyy format
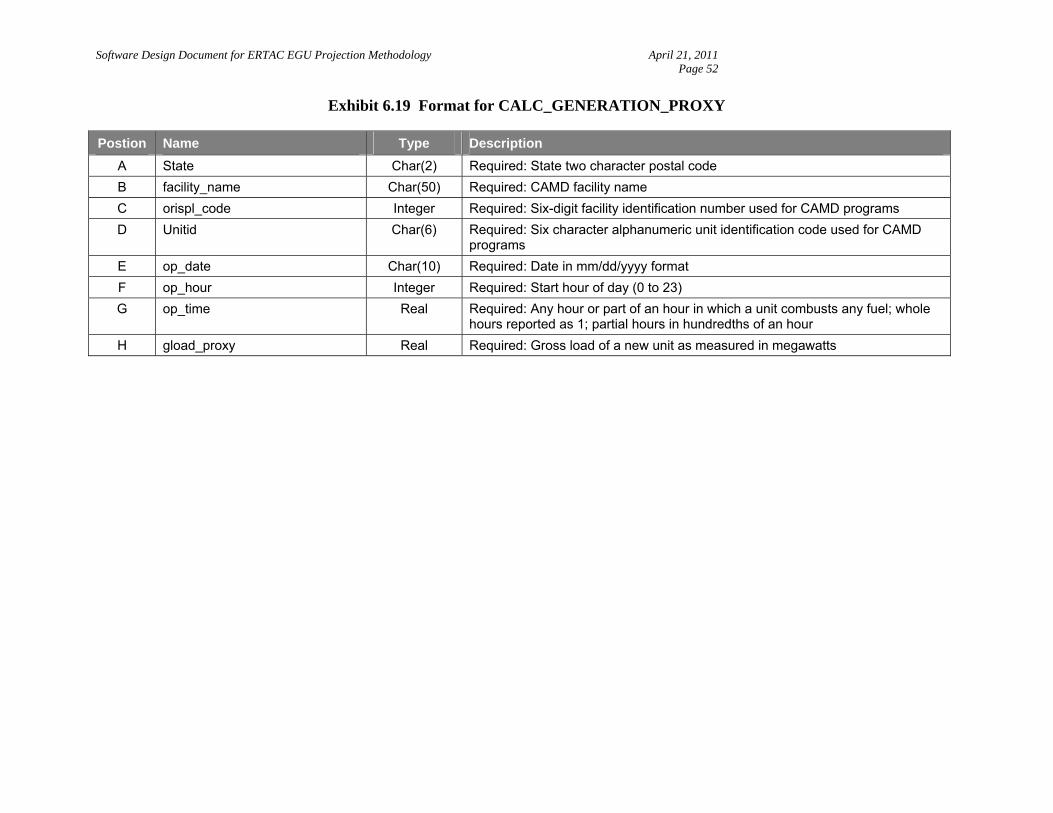
Software Design Document for ERTAC EGU Projection Methodology April 21, 2011 Page 52
Exhibit 6.19 Format for CALC_GENERATION_PROXY
Postion Name Type Description
A State Char(2) Required: State two character postal code
B facility_name Char(50) Required: CAMD facility name
C orispl_code Integer Required: Six-digit facility identification number used for CAMD programs
D Unitid Char(6) Required: Six character alphanumeric unit identification code used for CAMD programs
E op_date Char(10) Required: Date in mm/dd/yyyy format
F op_hour Integer Required: Start hour of day (0 to 23)
G op_time Real Required: Any hour or part of an hour in which a unit combusts any fuel; whole hours reported as 1; partial hours in hundredths of an hour
H gload_proxy Real Required: Gross load of a new unit as measured in megawatts
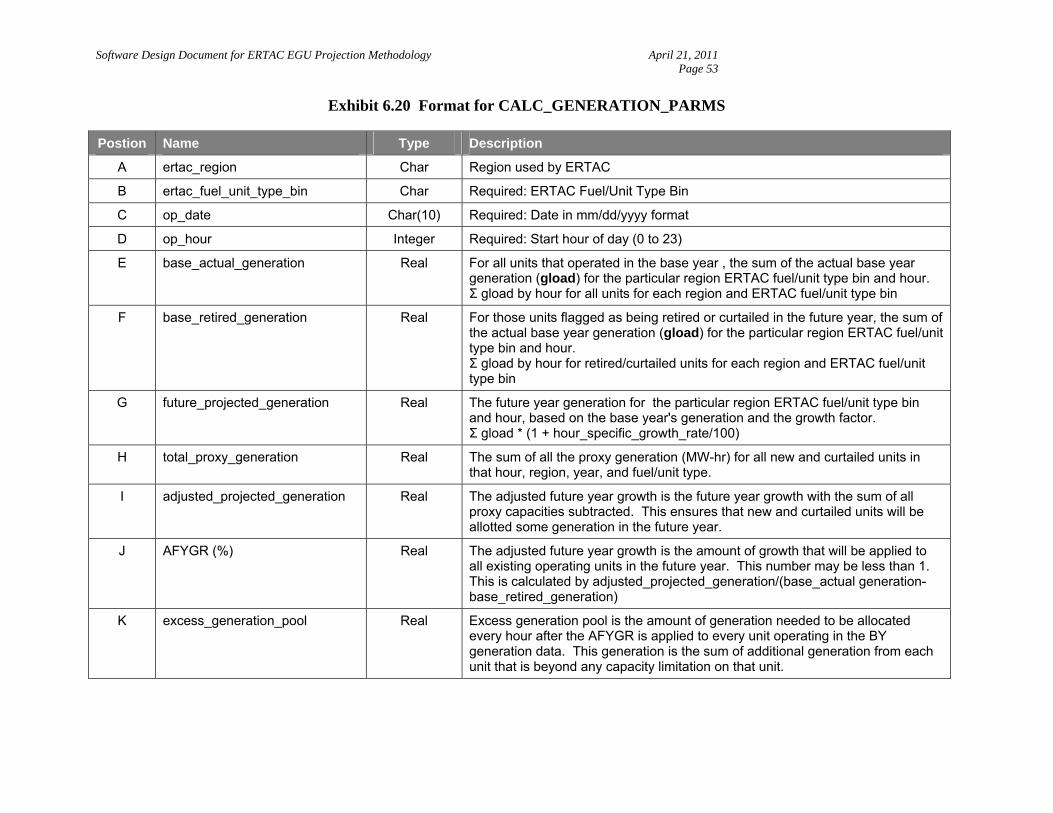
Software Design Document for ERTAC EGU Projection Methodology April 21, 2011 Page 53
Exhibit 6.20 Format for CALC_GENERATION_PARMS
Postion Name Type Description
A ertac_region Char Region used by ERTAC
B ertac_fuel_unit_type_bin Char Required: ERTAC Fuel/Unit Type Bin
C op_date Char(10) Required: Date in mm/dd/yyyy format
D op_hour Integer Required: Start hour of day (0 to 23)
E base_actual_generation Real For all units that operated in the base year , the sum of the actual base year generation (gload) for the particular region ERTAC fuel/unit type bin and hour. Σ gload by hour for all units for each region and ERTAC fuel/unit type bin
F base_retired_generation Real For those units flagged as being retired or curtailed in the future year, the sum of the actual base year generation (gload) for the particular region ERTAC fuel/unit type bin and hour. Σ gload by hour for retired/curtailed units for each region and ERTAC fuel/unit type bin
G future_projected_generation Real The future year generation for the particular region ERTAC fuel/unit type bin and hour, based on the base year's generation and the growth factor. Σ gload * (1 + hour_specific_growth_rate/100)
H total_proxy_generation Real The sum of all the proxy generation (MW-hr) for all new and curtailed units in that hour, region, year, and fuel/unit type.
I adjusted_projected_generation Real The adjusted future year growth is the future year growth with the sum of all proxy capacities subtracted. This ensures that new and curtailed units will be allotted some generation in the future year.
J AFYGR (%) Real The adjusted future year growth is the amount of growth that will be applied to all existing operating units in the future year. This number may be less than 1. This is calculated by adjusted_projected_generation/(base_actual generation-base_retired_generation)
K excess_generation_pool Real Excess generation pool is the amount of generation needed to be allocated every hour after the AFYGR is applied to every unit operating in the BY generation data. This generation is the sum of additional generation from each unit that is beyond any capacity limitation on that unit.
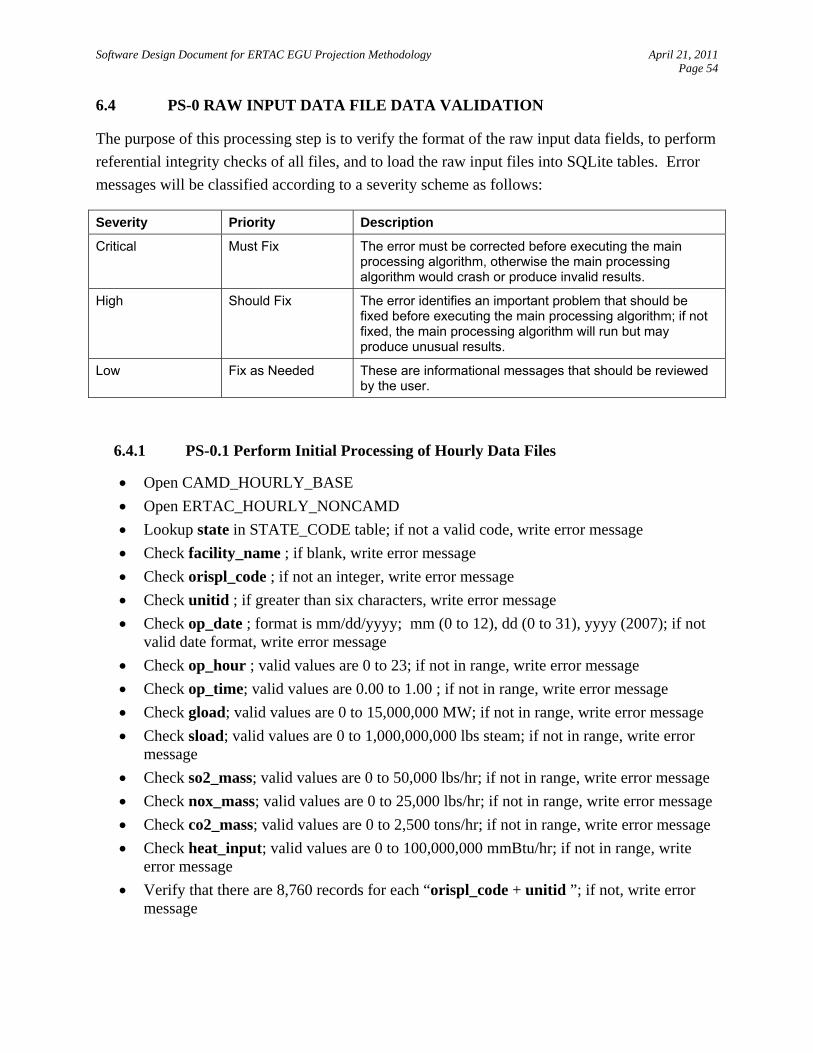
Software Design Document for ERTAC EGU Projection Methodology April 21, 2011 Page 54
6.4 PS-0 RAW INPUT DATA FILE DATA VALIDATION
The purpose of this processing step is to verify the format of the raw input data fields, to perform
referential integrity checks of all files, and to load the raw input files into SQLite tables. Error
messages will be classified according to a severity scheme as follows:
Severity Priority Description
Critical Must Fix The error must be corrected before executing the main processing algorithm, otherwise the main processing algorithm would crash or produce invalid results.
High Should Fix The error identifies an important problem that should be fixed before executing the main processing algorithm; if not fixed, the main processing algorithm will run but may produce unusual results.
Low Fix as Needed These are informational messages that should be reviewed by the user.
6.4.1 PS-0.1 Perform Initial Processing of Hourly Data Files
Open CAMD_HOURLY_BASE
Open ERTAC_HOURLY_NONCAMD
Lookup state in STATE_CODE table; if not a valid code, write error message
Check facility_name ; if blank, write error message
Check orispl_code ; if not an integer, write error message
Check unitid ; if greater than six characters, write error message
Check op_date ; format is mm/dd/yyyy; mm (0 to 12), dd (0 to 31), yyyy (2007); if not valid date format, write error message
Check op_hour ; valid values are 0 to 23; if not in range, write error message
Check op_time; valid values are 0.00 to 1.00 ; if not in range, write error message
Check gload; valid values are 0 to 15,000,000 MW; if not in range, write error message
Check sload; valid values are 0 to 1,000,000,000 lbs steam; if not in range, write error message
Check so2_mass; valid values are 0 to 50,000 lbs/hr; if not in range, write error message
Check nox_mass; valid values are 0 to 25,000 lbs/hr; if not in range, write error message
Check co2_mass; valid values are 0 to 2,500 tons/hr; if not in range, write error message
Check heat_input; valid values are 0 to 100,000,000 mmBtu/hr; if not in range, write error message
Verify that there are 8,760 records for each “orispl_code + unitid ”; if not, write error message
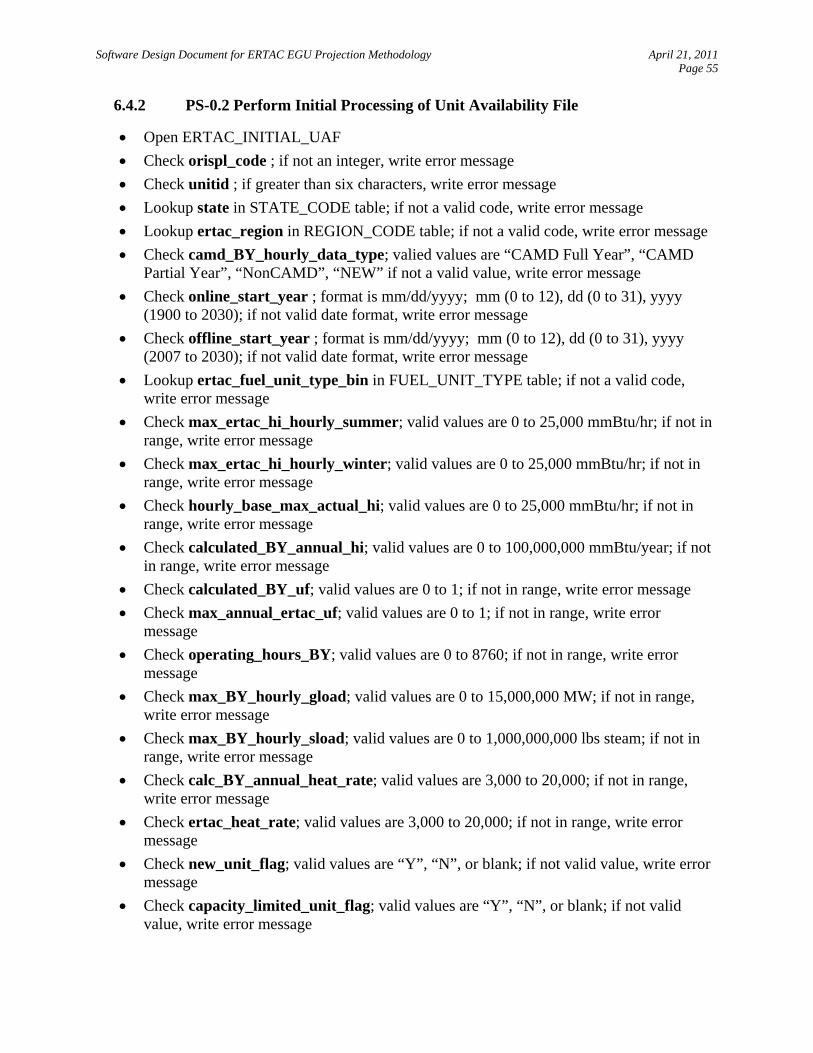
Software Design Document for ERTAC EGU Projection Methodology April 21, 2011 Page 55
6.4.2 PS-0.2 Perform Initial Processing of Unit Availability File
Open ERTAC_INITIAL_UAF
Check orispl_code ; if not an integer, write error message
Check unitid ; if greater than six characters, write error message
Lookup state in STATE_CODE table; if not a valid code, write error message
Lookup ertac_region in REGION_CODE table; if not a valid code, write error message
Check camd_BY_hourly_data_type; valied values are “CAMD Full Year”, “CAMD Partial Year”, “NonCAMD”, “NEW” if not a valid value, write error message
Check online_start_year ; format is mm/dd/yyyy; mm (0 to 12), dd (0 to 31), yyyy (1900 to 2030); if not valid date format, write error message
Check offline_start_year ; format is mm/dd/yyyy; mm (0 to 12), dd (0 to 31), yyyy (2007 to 2030); if not valid date format, write error message
Lookup ertac_fuel_unit_type_bin in FUEL_UNIT_TYPE table; if not a valid code, write error message
Check max_ertac_hi_hourly_summer; valid values are 0 to 25,000 mmBtu/hr; if not in range, write error message
Check max_ertac_hi_hourly_winter; valid values are 0 to 25,000 mmBtu/hr; if not in range, write error message
Check hourly_base_max_actual_hi; valid values are 0 to 25,000 mmBtu/hr; if not in range, write error message
Check calculated_BY_annual_hi; valid values are 0 to 100,000,000 mmBtu/year; if not in range, write error message
Check calculated_BY_uf; valid values are 0 to 1; if not in range, write error message
Check max_annual_ertac_uf; valid values are 0 to 1; if not in range, write error message
Check operating_hours_BY; valid values are 0 to 8760; if not in range, write error message
Check max_BY_hourly_gload; valid values are 0 to 15,000,000 MW; if not in range, write error message
Check max_BY_hourly_sload; valid values are 0 to 1,000,000,000 lbs steam; if not in range, write error message
Check calc_BY_annual_heat_rate; valid values are 3,000 to 20,000; if not in range, write error message
Check ertac_heat_rate; valid values are 3,000 to 20,000; if not in range, write error message
Check new_unit_flag; valid values are “Y”, “N”, or blank; if not valid value, write error message
Check capacity_limited_unit_flag; valid values are “Y”, “N”, or blank; if not valid value, write error message
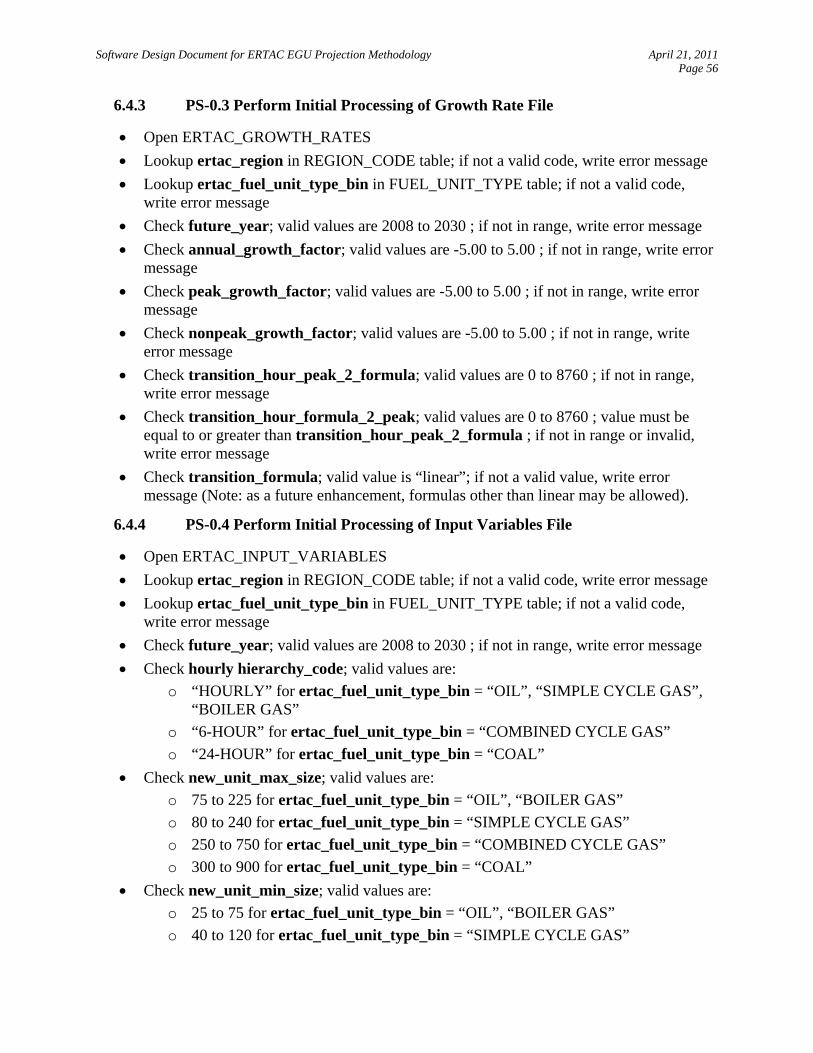
Software Design Document for ERTAC EGU Projection Methodology April 21, 2011 Page 56
6.4.3 PS-0.3 Perform Initial Processing of Growth Rate File
Open ERTAC_GROWTH_RATES
Lookup ertac_region in REGION_CODE table; if not a valid code, write error message
Lookup ertac_fuel_unit_type_bin in FUEL_UNIT_TYPE table; if not a valid code, write error message
Check future_year; valid values are 2008 to 2030 ; if not in range, write error message
Check annual_growth_factor; valid values are -5.00 to 5.00 ; if not in range, write error message
Check peak_growth_factor; valid values are -5.00 to 5.00 ; if not in range, write error message
Check nonpeak_growth_factor; valid values are -5.00 to 5.00 ; if not in range, write error message
Check transition_hour_peak_2_formula; valid values are 0 to 8760 ; if not in range, write error message
Check transition_hour_formula_2_peak; valid values are 0 to 8760 ; value must be equal to or greater than transition_hour_peak_2_formula ; if not in range or invalid, write error message
Check transition_formula; valid value is “linear”; if not a valid value, write error message (Note: as a future enhancement, formulas other than linear may be allowed).
6.4.4 PS-0.4 Perform Initial Processing of Input Variables File
Open ERTAC_INPUT_VARIABLES
Lookup ertac_region in REGION_CODE table; if not a valid code, write error message
Lookup ertac_fuel_unit_type_bin in FUEL_UNIT_TYPE table; if not a valid code, write error message
Check future_year; valid values are 2008 to 2030 ; if not in range, write error message
Check hourly hierarchy_code; valid values are:
o “HOURLY” for ertac_fuel_unit_type_bin = “OIL”, “SIMPLE CYCLE GAS”, “BOILER GAS”
o “6-HOUR” for ertac_fuel_unit_type_bin = “COMBINED CYCLE GAS”
o “24-HOUR” for ertac_fuel_unit_type_bin = “COAL”
Check new_unit_max_size; valid values are:
o 75 to 225 for ertac_fuel_unit_type_bin = “OIL”, “BOILER GAS”
o 80 to 240 for ertac_fuel_unit_type_bin = “SIMPLE CYCLE GAS”
o 250 to 750 for ertac_fuel_unit_type_bin = “COMBINED CYCLE GAS”
o 300 to 900 for ertac_fuel_unit_type_bin = “COAL”
Check new_unit_min_size; valid values are:
o 25 to 75 for ertac_fuel_unit_type_bin = “OIL”, “BOILER GAS”
o 40 to 120 for ertac_fuel_unit_type_bin = “SIMPLE CYCLE GAS”
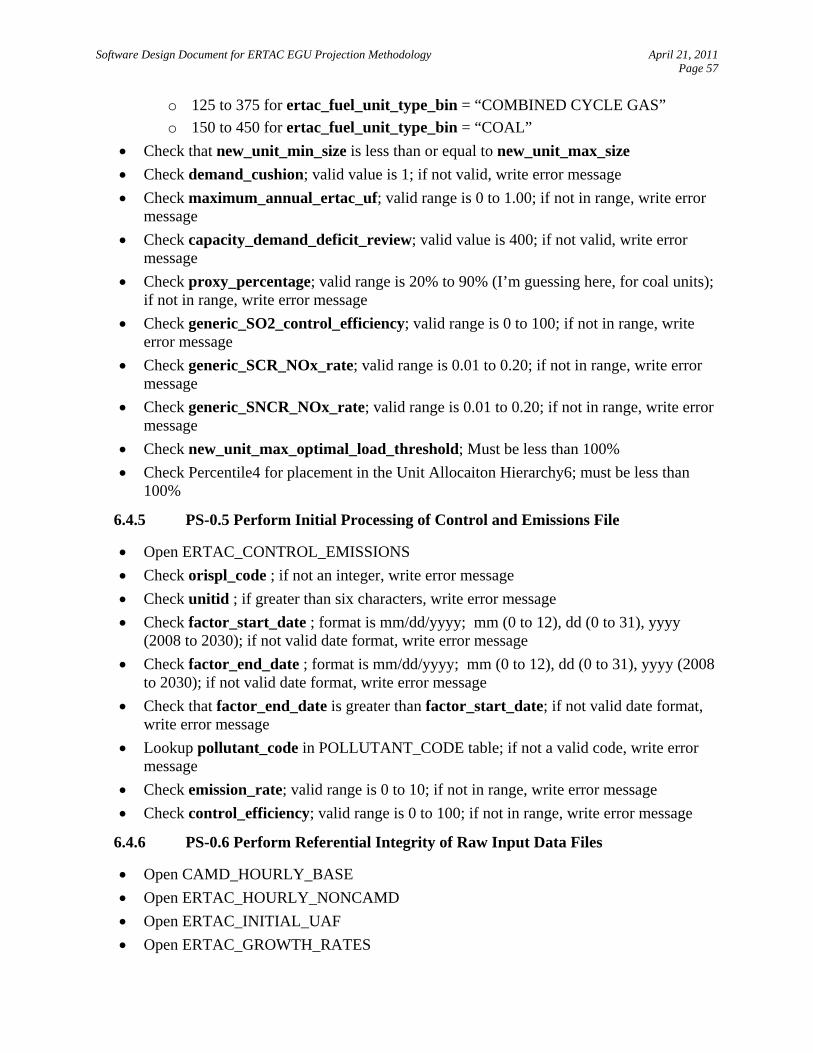
Software Design Document for ERTAC EGU Projection Methodology April 21, 2011 Page 57
o 125 to 375 for ertac_fuel_unit_type_bin = “COMBINED CYCLE GAS”
o 150 to 450 for ertac_fuel_unit_type_bin = “COAL”
Check that new_unit_min_size is less than or equal to new_unit_max_size
Check demand_cushion; valid value is 1; if not valid, write error message
Check maximum_annual_ertac_uf; valid range is 0 to 1.00; if not in range, write error message
Check capacity_demand_deficit_review; valid value is 400; if not valid, write error message
Check proxy_percentage; valid range is 20% to 90% (I’m guessing here, for coal units); if not in range, write error message
Check generic_SO2_control_efficiency; valid range is 0 to 100; if not in range, write error message
Check generic_SCR_NOx_rate; valid range is 0.01 to 0.20; if not in range, write error message
Check generic_SNCR_NOx_rate; valid range is 0.01 to 0.20; if not in range, write error message
Check new_unit_max_optimal_load_threshold; Must be less than 100%
Check Percentile4 for placement in the Unit Allocaiton Hierarchy6; must be less than 100%
6.4.5 PS-0.5 Perform Initial Processing of Control and Emissions File
Open ERTAC_CONTROL_EMISSIONS
Check orispl_code ; if not an integer, write error message
Check unitid ; if greater than six characters, write error message
Check factor_start_date ; format is mm/dd/yyyy; mm (0 to 12), dd (0 to 31), yyyy (2008 to 2030); if not valid date format, write error message
Check factor_end_date ; format is mm/dd/yyyy; mm (0 to 12), dd (0 to 31), yyyy (2008 to 2030); if not valid date format, write error message
Check that factor_end_date is greater than factor_start_date; if not valid date format, write error message
Lookup pollutant_code in POLLUTANT_CODE table; if not a valid code, write error message
Check emission_rate; valid range is 0 to 10; if not in range, write error message
Check control_efficiency; valid range is 0 to 100; if not in range, write error message
6.4.6 PS-0.6 Perform Referential Integrity of Raw Input Data Files
Open CAMD_HOURLY_BASE
Open ERTAC_HOURLY_NONCAMD
Open ERTAC_INITIAL_UAF
Open ERTAC_GROWTH_RATES

Software Design Document for ERTAC EGU Projection Methodology April 21, 2011 Page 58
Open ERTAC_INPUT_VARIABLES
Open ERTAC_CONTROL_EMISSIONS
Check for duplicate records in CAMD_HOURLY_BASE using orispl_code + unitid + op_date + op_hour key; if duplicates exist, write error message
Check for duplicate records in ERTAC_HOURLY_BASE using orispl_code + unitid + op_date + op_hour key; if duplicates exist, write error message
Check for duplicate records in ERTAC_INITIAL_UAF using orispl_code + unitid key; if duplicates exist, write error message
Check for duplicate records in ERTAC_GROWTH_RATES using ertac_region + ertac_fuel_unit_type_bin key; if duplicates exist, write error message
Check for duplicate records in ERTAC_INPUT_VARIABLES using ertac_region + ertac_fuel_unit_type_bin key; if duplicates exist, write error message
Check for duplicate records in ERTAC_CONTROL_EMISSIONS using orispl_code + unitid + pollutant_code key; if duplicates exist, write error message
Check that every orispl_code + unitid in CAMD_HOURLY_BASE has a matching orispl_code + unitid in ERTAC_INITIAL_UAF; if no match, write error message
Check that every orispl_code + unitid in ERTAC_INITIAL_UAF has a matching orispl_code + unitid in CAMD_HOURLY_BASE; if no match, if new_unit_flag = “N” or blank, write error message
Check that every ertac_region + ertac_fuel_unit_type_bin in ERTAC_GROWTH_RATES has a matching ertac_region + ertac_fuel_unit_type_bin in ERTAC_INITIAL_UAF; if no match, write error message
Check that every ertac_region + ertac_fuel_unit_type_bin in ERTAC_INITIAL_UAF has a matching ertac_region + ertac_fuel_unit_type_bin in ERTAC_GROWTH_RATES; if no match, write error message
Check that every ertac_region + ertac_fuel_unit_type_bin in ERTAC_INPUT_VARIABLES has a matching ertac_region + ertac_fuel_unit_type_bin in ERTAC_INITIAL_UAF; if no match, write error message

Software Design Document for ERTAC EGU Projection Methodology April 21, 2011 Page 59
Check that every ertac_region + ertac_fuel_unit_type_bin in ERTAC_INITIAL_UAF has a matching ertac_region + ertac_fuel_unit_type_bin in ERTAC_INPUT_VARIABLES; if no match, write error message
Check that every orispl_code + unitid in ERTAC_CONTROL_EMISSIONS has a matching orispl_code + unitid in ERTAC_INITIAL_UAF; if no match, write error message
6.5 PS-1 HOURLY DATA INPUT FILE PRE-PROCESSING
The purpose of this processing step is to use the hourly data files to calculate parameters needed
for the main processing module. Exhibit 6.19 illustrates the logical flow of data and processing
within the hourly data pre-processing routine.
6.5.1 PS-1.1 Perform Initial Processing of CAMD Hourly Data File
This step creates the hourly data file to be used by the main processing module. There are two
input files (CAMD_HOURLY_BASE and ERTAC_HOURLY_NONCAMD) used to create a
complete set of hourly data for all units.
The first hourly input file - CAMD_HOURLY_BASE - is the standard hourly data set available
from the USEPA, commonly referred to as the “Part 75 Prepackaged Data Sets.” CAMD
implements USEPA’s rule found in Volume 40 Part 75 of the CFR, which requires an hourly
accounting of the emissions from each affected unit - i.e., sources participating in an emissions
cap and trade program under the Acid Rain Control Program, the NOx Budget Trading Program,
or the Clean Air Interstate Rule.
For the initial ERTAC modeling effort, the base year will be 2007. In future endeavors, the base
year may change. The USEPA CAMD hourly data files have been subjected to extensive
QA/QC by both EPA and the reporting facilities and can be found on the EPA ftp site at:
ftp://ftp.epa.gov/dmdnload/emissions/hourly/quarterly/2007 .
States or MJOs may want to manipulate the standard CAMD hourly data sets to account for
anomalous unit behavior. States are responsible for adjusting the base year hourly data for
anomalous unit behavior with the same high quality and level of detail as CAMD data. In
addition, states are responsible for the replacement of filled CAMD record data with more
representative data, as necessary. The methodology for adjusting hourly data for anamolous
behaviour is left up to each State.
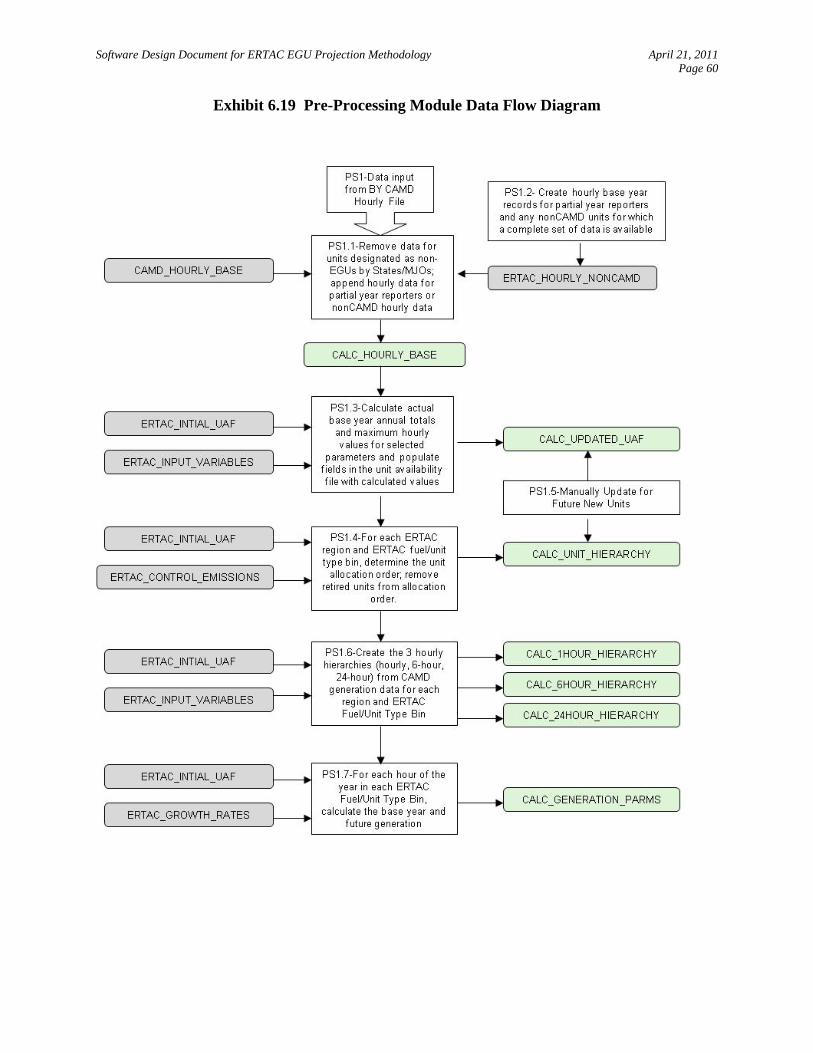
Software Design Document for ERTAC EGU Projection Methodology April 21, 2011 Page 60
Exhibit 6.19 Pre-Processing Module Data Flow Diagram
Software Design Document for ERTAC EGU Projection Methodology April 21, 2011 Page 61
The CAMD database contains data for EGUs and other large combustion sources that are
required to report emissions. The CAMD_HOURLY_BASE file contains data for all CAMD-
reporting units, including nonEGUs such as petroleum refinery process heaters and cement kilns.
ERTAC has decided to exclude nonEGUs from the projection model. States have developed
lists of units reporting to CAMD that should not be grown using factors associated with electrical
production. These units should have their data removed from the CAMD_HOURLY_BASE file.
The ERTAC_INITIAL_UAF contains a field (camd_BY_hourly_data_type) that identifies
whether a unit is a “NONEGU” and must be removed from the CAMD_HOURLY_BASE file.
Some units are required to submit hourly emissions data to CAMD for the entire 12 month
reporting period for all relevant parameters (heat input, gross load or steam load, and NOx, SO2,
and CO2 emissions). These units are identified as “FULL” reporters in the
ERTAC_INITIAL_UAF camd_BY_hourly_data_type field. The hourly data for these units
must be retained from CAMD_HOURLY_BASE file.
Other units are required to submit hourly emissions data only for NOx for the 6-month ozone
season. The CAMD_HOURLY_BASE file for these units contains only NOx emissions, heat
input, and gross or steam load for those hours for which the unit is required to report (generally
4,392 hours). SO2 and CO2 emissions are not reported for any hours. These units are identified
as “PARTIAL” reporters in the ERTAC_INITIAL_UAF camd_BY_hourly_data_type field.
6.5.2 PS-1.2 Perform Initial Processing of ERTAC Hourly Data File
The second hourly input file – ERTAC_HOURLY_NONCAMD – contains the full year of data
for partial year reporters for all required parameters. States are responsible for preparing the
base year hourly data for partial reporterswith the same high quality and level of detail as
CAMD data. The methodology for simulating the unreported hourly data is left up to each State.
Partial year reporters can be handled 3 ways:
A state can provide the non-reported time period’s hourly data in the appropriate format so that the unit becomes an ersatz full year reporter and is treated just like a full year reporter.
A state can provide the annual_hi_partials for the unit, and for the nonreported months, a 24/7 profile of continuous operations will be assumed. After creating the hourly nonreported data, the program will treat the partial year reporter like an ersatz full year reporter.
If no annual yeat input or hourly non-reported time period data is provided, the unit is assumed to not operate in the non-reported time period, and is assumed to not operate in the future year during that time period as well. This will result in growth only during the reported period.
Software Design Document for ERTAC EGU Projection Methodology April 21, 2011 Page 62
This step may also encompass pulling in hourly data from units that do not report to CAMD but
for which States may have hourly data available. If States wish to include additional units that
do not report to CAMD, then it is the States responsibility to provide the base year hourly data
for those units in the ERTAC_HOURLY_NONCAMD file and to provide the other information
needed for the process as listed in the ERTAC_INITIAL_UAF. States are responsible for
preparing the base year hourly data for nonCAMD reporterswith the same high quality and
level of detail as CAMD data.
The PS-1.2 processing steps are:
Open ERTAC_HOURLY_BASE
Lookup the corresponding orispl_code + unitid in the ERTAC_INITIAL_UAF
o If no match found, write error message
o If match found, append record to CALC_HOURLY_BASE
6.5.3 PS-1.3 Calculate Base Year Unit Parameters
Several fields in the ERTAC_INITIAL_UAF need to be calculated from the base year hourly
data file:
Heat Rate. The heat rate is taken from State supplied information or derived from the
base year heat input total and generation total If steam load is reported, a value of 0.1
MW-hr/1000 lbs steam should be used to convert the steam load to MW-hrs. For new
units, it is best if States provide unit specific data for this value.
Maximum Hourly Heat Input. The maximum hourly heat input is the higher of the
actual hourly 95th percentile heat input that is pulled from the hourly data, or the
maximum heat input provided by the user in the unit availability file. If neither of these
data is available, then the maximum value in the nameplate capacity, maximum summer
capacity or maximum winter capacity fields provided by the user in the unit availability
file. For new units, this data should be supplied by States.
Optimal Load Threshold. For existing units, this value is a percentile (90th is default)
of the base year hourly generation data. For new units, this value mimics the Optimal
Load Threshold (in terms of percent utilization) of the unit beneath the new unit in the
Unit Allocation Order, developed in PS1.08.
Utilization Fraction. Units cannot operate every hour of the year at maximum capacity
since they need maintenance. The utilization fraction ensures that units are not over-
allocated. For existing units, the UF may be set by the State/MJO. Otherwise, it is the
higher of the fraction used in the base year calculated from actual CAMD data or the

Software Design Document for ERTAC EGU Projection Methodology April 21, 2011 Page 63
default data found in the input variables worksheet. The utilization fraction is calculated
by summing the base year heat input and dividing by the product of 8,760 times that
maximum hourly heat input. For new units, the UF is supplied by State/MJO personnel
or is the default data in the input variables worksheet.
The following fields need to be calculated for each unit using the data in
CALC_HOURLY_BASE:
calc_operating_hours – sum the hourly values of the op_time field
calc_annual_hi – sum the hourly value of the heat_input field
calc_max_hourly_hi – find the 95th percentile??hourly value of the heat_input field
calc_max_hourly_hi_summer - find the maximum hourly value of the heat_input field during the summer months of June, July, August
calc_max_hourly_winter - find the maximum hourly value of the heat_input field during the winter months of January, Feruary, March
calc_annual_gload – sum the hourly value of the gload field; if gload is null and sload>0, calculate gload using a value of 0.1 MW-hr/1000 lbs steam to convert the sload to MW-hrs.
calc_max_hourly_gload – find the maximum hourly value of the gload field; if gload is null and sload>0, calculate gload using a value of 0.1 MW-hr/1000 lbs steam convert the steam load to MW-hrs.
calc_max_optimal_load_threshold – calculate the 90th percentile of the gload field
calc_min_optimal_load_threshold – calculate the 75th percentile of the gload field
calc_annual_sload – sum the hourly value of the sload field
calc_max_hourly_sload – find the 95th percentile? hourly value of the sload field
Store each of these values in the CALC_UPDATED_UAF file.
The values calculated above from the base year hourly data file are used with values input from
the ERTAC_INITIAL_UAF to calculate the following fields in the CALC_UPDATED_UAF:
max_ertac_hi_hourly_summer – – if user inputs a value, keep that value; otherwise:
o if calc_max_hourly_hi greater than max_unit_heat_input, set equal to calc_max_hourly_hi
o otherwise, set equal to max_unit_heat_input
max_ertac_hi_hourly_winter – if user inputs a value, keep that value; otherwise set equal to calc_max_hourly_hi_winter
hourly_base_max_actual_hi – if user inputs a value, keep that value; otherwise set equal to calc_max_hourly_hi
calculated_BY_uf – equals calc_annual_hi / (max_ertac_hi_hourly_summer * 8760)
Software Design Document for ERTAC EGU Projection Methodology April 21, 2011 Page 64
max_annual_ertac_uf – equals the maximum of max_annual_state_uf in ERTAC INITIAL_UAF, calculated_BY_uf, or the maximum_annual_ertac_uf in the ERTAC_INPUT_VARIABLES file for new units
operating_hours_BY - if user inputs a value, keep that value; otherwise set equal to calc_operating_hours
max_BY_hourly_gload - if user inputs a value, keep that value; otherwise set equal to calc_max_hourly_gload
max_BY_hourly_sload - if user inputs a value, keep that value; otherwise set equal to calc_max_hourly_sload
calc_BY_average_heat_rate – equals (calc_annual_hi / calc_annual_gload)
ertac_heat_rate – use calc_BY_average_heat_rate provided by user, if available; otherwise use calc_BY_average_heat_rate
6.5.4 PS-1.4 Calculate Unit Hierarchy for Existing Units
The unit allocation order for each ERTAC Region and Fuel/Unit Type Bin must be developed.
The utilization fraction calculated from base year data will be used to determine dispatch order
for units operated in the base year. The utilization fraction is the ratio of the total annual to the
maximum heat input for a unit. The unit hierarchy will be based on base year utilization
fractions for each unit in the region and unit/fuel type.
The CALC_UNIT_HIERARCHY file is created by sorting the CALC_UPDATED_UAF by
ERTAC REGION, Fuel/Unit Type Bin, and utilization fraction. Any unit that is flagged in the
ERTAC_CONTROL_EMISSIONS file as being retired will be excluded from the
CALC_UNIT_HIERARCHY.
6.5.5 PS-1.5 Update Unit Availability File and Unit Hierarchy for New Units
New units are assumed to be more efficient and economical to run, and therefore they should be
very high on the unit allocation hierarchy. Future year new units will be added primarily by a
manual process led by the State in which the unit is situated. Future year new units will be added
by ERTAC fuel/unit type bin and will be assumed to be proxy loaded for the start of the first
year of operation by assigning generation to these units from the overall pool and inserting it into
the inventory as follows:
New Coal-fired Units (includes IGCC)
o The proxy loading for these units will be equivalent to a 50% load factor (50% of maximum rated capacity) (an input variable) for hourly operations. This represents the unit being inserted into the dispatch order at a nominal minimum load rate and then absorbing growth and additional generation from the excess generation pool up to its full load rating.

Software Design Document for ERTAC EGU Projection Methodology April 21, 2011 Page 65
o New coal fired units will be inserted into the coal fired dispatch order after the unit representing the top 5% of the coal fired units in the power pool. IGCC units will be inserted into the inventory after the unit representing the top 2% of coal fired units’ power pool.
o The max ERTAC annual utilization fraction for that ERTAC fuel/unit type bin will be applied.
New Combined Cycle Gas
o The initial hourly percent load profile for a new unit shall match that of the GCC unit immediately beneath it in the dispatch order prior to the application of that year’s growth.
o New units will be added to the dispatch order after the unit representing the top 5% of the GCC fired units in the power pool unless otherwise specified by State staff.
o The max ERTAC annual utilization fraction for that ERTAC fuel/unit type bin will be applied.
New Simple Cycle Gas and Boiler Gas Units
o Initial hourly percent load profile for a new unit shall match that of the simple cycle gas unit or boiler immediately beneath it in the dispatch order prior to the application of that year’s growth.
o New units will be added after the unit representing the top 2% of the simple cycle gas units or boilers in the power pool, unless otherwise specified by State staff.
o The max ERTAC annual utilization fraction for that ERTAC fuel/unit type bin will be applied.
Oil Units
o Initial hourly percent load profile for a new unit shall match that of the oil unit immediately beneath it in the dispatch order prior to the application of that year’s growth.
o New units will be added after the unit representing the top 2% of the oil units in the power pool, unless otherwise specified by State staff.
o The max ERTAC annual utilization fraction for that ERTAC fuel/unit type bin will be applied.
The new unit defaults listed above for each ERTAC region and fuel/unit type bin may be
modified in the ERTAC_INPUT_VARIABLES. Optimal load thresholds for new units will
match the percentage optimal load threshold for the existing unit immediately beneath it in the
dispatch order.
6.5.6 PS-1.6 Calculate Hourly Hierarchies
The hourly base year generation data will be used to calculate hourly, 6-hour block, or daily
generation hierarchies for each ERTAC region. The hierarchies are used by the main processing
Software Design Document for ERTAC EGU Projection Methodology April 21, 2011 Page 66
module to determine the order in which units are dispatched to meet future generation demand.
By establishing the dispatch order by an hourly, 6-hour block, or daily basis, the entire fleet will
be grown in a representative fashion.
Assignment of the methodology for hour hierarchies is an input field in the
ERTAC_INPUT_VARIABLES table to allow modelers to choose one of the three options for
each ERTAC fuel/unit type bin by ERTAC region. The default methodology for fuel/unit type
bin is as follows:
For ertac_fuel_unit_type_bin = OIL, SIMPLE CYCLE GAS, or BOILER GAS, the
model will dispatch units in a given ERTAC region on an hour-by-hour basis starting
with the peak hour in the base year and going to the hour with the lowest generation.
For ertac_fuel_unit_type_bin = COMBINED CYCLE GAS, the model will dispatch the
6-hour block with the highest hourly generation first. The model will dispatch units in a
given ERTAC region the hours in that block from 0 to 5, in that order. The next block to
be dispatched will be the block with the next highest hourly generation and where that
hour has not yet been allotted generation. In this methodology, each day is divided into
four blocks of 6 hours: 0-5, 6-11, 12-17, 18-23. This methodology is designed to prevent
natural gas-combined cycle units from being frequently turned on and off.
For ertac_fuel_unit_type_bin = COAL, the model will dispatch units in a given ERTAC
region based on the day with the highest hourly generation first. The model will dispatch
the hours in that day from 0 to 23, in that order. The next day to be dispatched will be the
day with the second highest hourly generation and where that hour has not yet been
allotted generation. This methodology is used to prevent coal fired units from being
frequently turned on and off. Days are used for coal in the hierarchy ranking rather than
hours since coal units generally cannot turn off and on in an hour.
6.5.7 PS-1.7 Calculate Proxy Generation for New Units
For new units that did not operate in the base year, there is no historical generation data and there
must be an estimation of the hourly generation at which a new unit is assumed to be running in
the future. This assumed future generation for new units is referred to as “proxy” generation.
The methodology for initially determining the future hourly generation is as follows:
For coal fired new units:
o The proxy generation for each hour is a straight percentage of the maximum hourly generation for the unit
Software Design Document for ERTAC EGU Projection Methodology April 21, 2011 Page 67
o the percentage is specified in the proxy_percentage field of the ERTAC_INPUT VARIABLES table
o For each hour, calculate gload_proxy = max_ERTAC_hi_hourly_summer * ertac_heat_rate * proxy_percentage
o Write record to CALC_GENERATION_PROXY
For non-coal new units, the proxy generation is based on the percent utilization of the first existing unit just beneath it in the unit allocation hierarchy. Therefore, for non-coal new units, this value may change hourly. The new unit will have the same hourly generation temporal profile as the unit just below it in the unit allocation order.
o For each unit, locate the surrogate unit (by ERTAC region and fuel/unit type) in the CALC_UNIT_HIERARCHY that is one rank lower in the allocation order.
o The hourly proxy_percentage for the new unit is the ratio of the actual generation for the surrogate unit (gload) divided by the max_2007_hourly_gload
o For each hour, calculate gload_proxy = max_ERTAC_hi_hourly_summer * proxy_percentage
o Write record to CALC_GENERATION_PROXY
6.5.8 PS-1.8 Calculate Generation Parameters
The first step is to calculate the hour specific growth rate for each hour by ERTAC region and
fuel/unit type bin. This value is calculated based on four data inputs: the hour’s calculated
hierarchy rank, the peak growth rate, the non-peak growth rate, and an input variable in the form
of a calculation or function that relates the three previous data points.
For ERTAC fuel/unit type bin = OIL, SIMPLE CYCLE GAS, or BOILER GAS:
Open CALC_1HOUR_HIERARCHY
Open CALC_HOURLY_BASE
Open CALC_UPDATED_UAF
Open ERTAC_GROWTH_RATES
For 1hour_allocation_order = 0 to transition_hour_peak_2_formula, for each unit:
o Sum gload into base_actual_generation
o For capacity_limited_unit_flag = Y , sum gload into base_retired_generation
o For retired_unit_flag = Y, sum gload into base_retired_generation
o Set hour_specific_growth_rate = peak_growth_factor
o Calculate temp_projected_generation = gload * hour_specific_growth_rate
o Sum temp_projected_generation into future_projected_generation
o After all units of this type processed for the hour, write record to CALC_GENERATION_PARMS
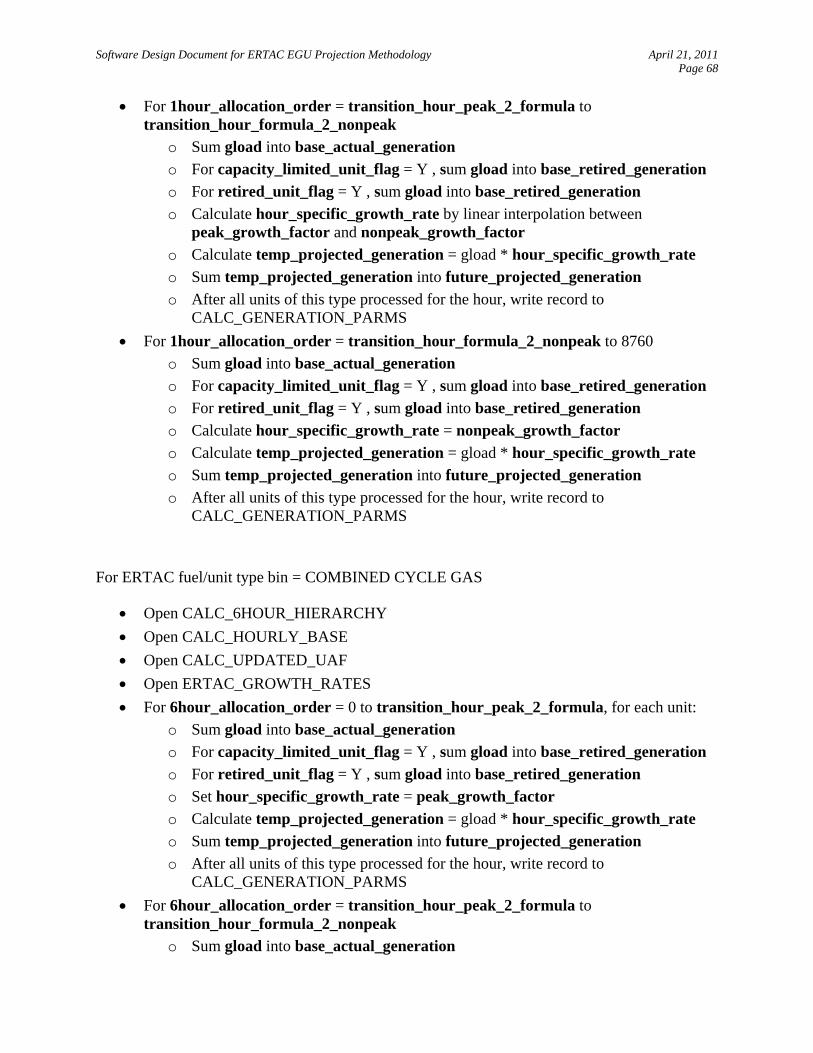
Software Design Document for ERTAC EGU Projection Methodology April 21, 2011 Page 68
For 1hour_allocation_order = transition_hour_peak_2_formula to transition_hour_formula_2_nonpeak
o Sum gload into base_actual_generation
o For capacity_limited_unit_flag = Y , sum gload into base_retired_generation
o For retired_unit_flag = Y , sum gload into base_retired_generation
o Calculate hour_specific_growth_rate by linear interpolation between peak_growth_factor and nonpeak_growth_factor
o Calculate temp_projected_generation = gload * hour_specific_growth_rate
o Sum temp_projected_generation into future_projected_generation
o After all units of this type processed for the hour, write record to CALC_GENERATION_PARMS
For 1hour_allocation_order = transition_hour_formula_2_nonpeak to 8760
o Sum gload into base_actual_generation
o For capacity_limited_unit_flag = Y , sum gload into base_retired_generation
o For retired_unit_flag = Y , sum gload into base_retired_generation
o Calculate hour_specific_growth_rate = nonpeak_growth_factor
o Calculate temp_projected_generation = gload * hour_specific_growth_rate
o Sum temp_projected_generation into future_projected_generation
o After all units of this type processed for the hour, write record to CALC_GENERATION_PARMS
For ERTAC fuel/unit type bin = COMBINED CYCLE GAS
Open CALC_6HOUR_HIERARCHY
Open CALC_HOURLY_BASE
Open CALC_UPDATED_UAF
Open ERTAC_GROWTH_RATES
For 6hour_allocation_order = 0 to transition_hour_peak_2_formula, for each unit:
o Sum gload into base_actual_generation
o For capacity_limited_unit_flag = Y , sum gload into base_retired_generation
o For retired_unit_flag = Y , sum gload into base_retired_generation
o Set hour_specific_growth_rate = peak_growth_factor
o Calculate temp_projected_generation = gload * hour_specific_growth_rate
o Sum temp_projected_generation into future_projected_generation
o After all units of this type processed for the hour, write record to CALC_GENERATION_PARMS
For 6hour_allocation_order = transition_hour_peak_2_formula to transition_hour_formula_2_nonpeak
o Sum gload into base_actual_generation
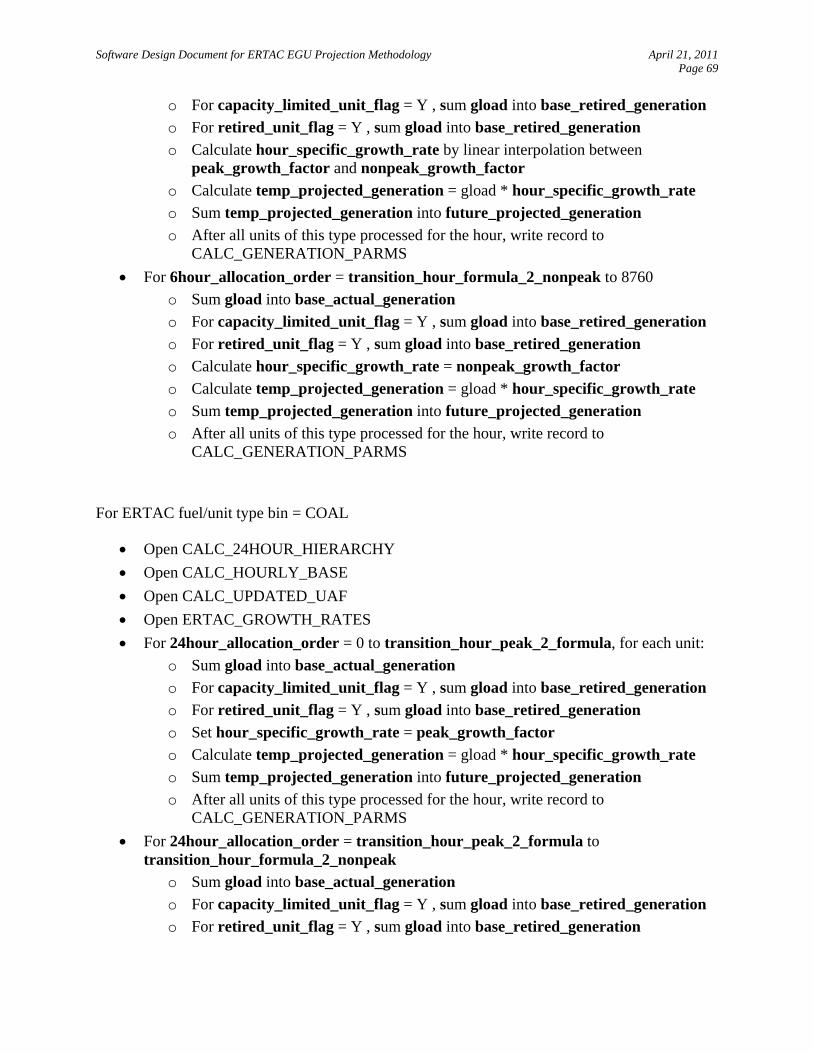
Software Design Document for ERTAC EGU Projection Methodology April 21, 2011 Page 69
o For capacity_limited_unit_flag = Y , sum gload into base_retired_generation
o For retired_unit_flag = Y , sum gload into base_retired_generation
o Calculate hour_specific_growth_rate by linear interpolation between peak_growth_factor and nonpeak_growth_factor
o Calculate temp_projected_generation = gload * hour_specific_growth_rate
o Sum temp_projected_generation into future_projected_generation
o After all units of this type processed for the hour, write record to CALC_GENERATION_PARMS
For 6hour_allocation_order = transition_hour_formula_2_nonpeak to 8760
o Sum gload into base_actual_generation
o For capacity_limited_unit_flag = Y , sum gload into base_retired_generation
o For retired_unit_flag = Y , sum gload into base_retired_generation
o Calculate hour_specific_growth_rate = nonpeak_growth_factor
o Calculate temp_projected_generation = gload * hour_specific_growth_rate
o Sum temp_projected_generation into future_projected_generation
o After all units of this type processed for the hour, write record to CALC_GENERATION_PARMS
For ERTAC fuel/unit type bin = COAL
Open CALC_24HOUR_HIERARCHY
Open CALC_HOURLY_BASE
Open CALC_UPDATED_UAF
Open ERTAC_GROWTH_RATES
For 24hour_allocation_order = 0 to transition_hour_peak_2_formula, for each unit:
o Sum gload into base_actual_generation
o For capacity_limited_unit_flag = Y , sum gload into base_retired_generation
o For retired_unit_flag = Y , sum gload into base_retired_generation
o Set hour_specific_growth_rate = peak_growth_factor
o Calculate temp_projected_generation = gload * hour_specific_growth_rate
o Sum temp_projected_generation into future_projected_generation
o After all units of this type processed for the hour, write record to CALC_GENERATION_PARMS
For 24hour_allocation_order = transition_hour_peak_2_formula to transition_hour_formula_2_nonpeak
o Sum gload into base_actual_generation
o For capacity_limited_unit_flag = Y , sum gload into base_retired_generation
o For retired_unit_flag = Y , sum gload into base_retired_generation
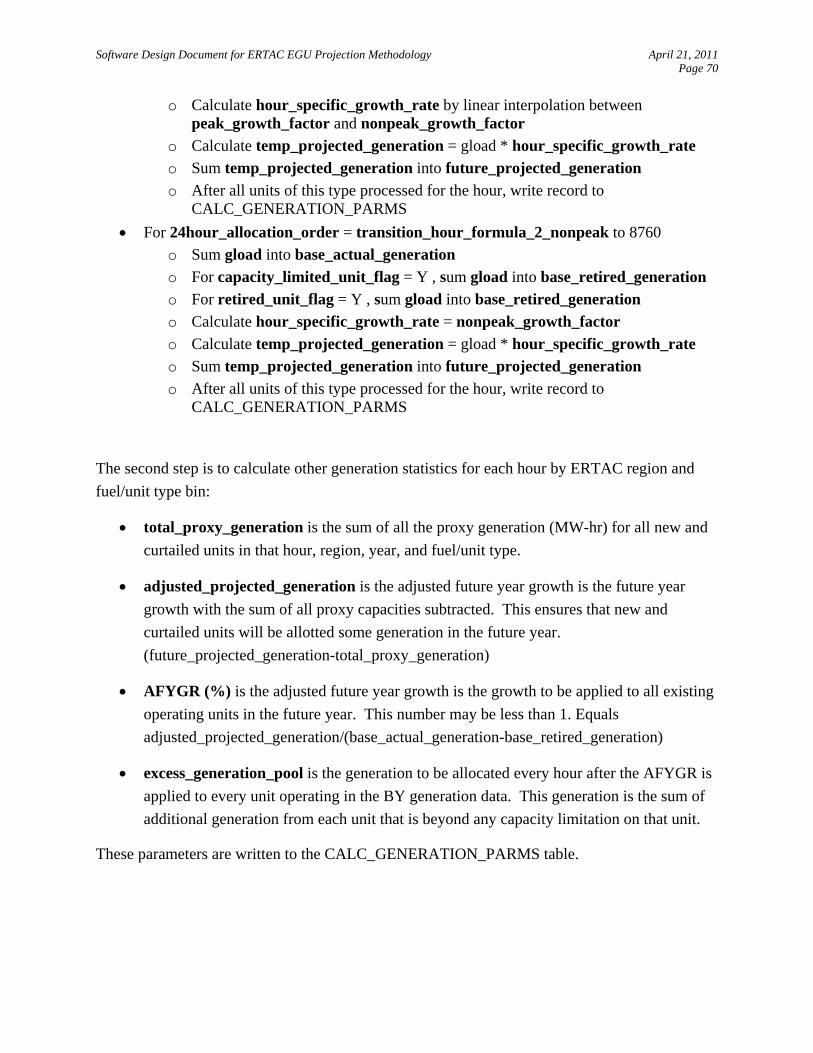
Software Design Document for ERTAC EGU Projection Methodology April 21, 2011 Page 70
o Calculate hour_specific_growth_rate by linear interpolation between peak_growth_factor and nonpeak_growth_factor
o Calculate temp_projected_generation = gload * hour_specific_growth_rate
o Sum temp_projected_generation into future_projected_generation
o After all units of this type processed for the hour, write record to CALC_GENERATION_PARMS
For 24hour_allocation_order = transition_hour_formula_2_nonpeak to 8760
o Sum gload into base_actual_generation
o For capacity_limited_unit_flag = Y , sum gload into base_retired_generation
o For retired_unit_flag = Y , sum gload into base_retired_generation
o Calculate hour_specific_growth_rate = nonpeak_growth_factor
o Calculate temp_projected_generation = gload * hour_specific_growth_rate
o Sum temp_projected_generation into future_projected_generation
o After all units of this type processed for the hour, write record to CALC_GENERATION_PARMS
The second step is to calculate other generation statistics for each hour by ERTAC region and
fuel/unit type bin:
total_proxy_generation is the sum of all the proxy generation (MW-hr) for all new and
curtailed units in that hour, region, year, and fuel/unit type.
adjusted_projected_generation is the adjusted future year growth is the future year
growth with the sum of all proxy capacities subtracted. This ensures that new and
curtailed units will be allotted some generation in the future year.
(future_projected_generation-total_proxy_generation)
AFYGR (%) is the adjusted future year growth is the growth to be applied to all existing
operating units in the future year. This number may be less than 1. Equals
adjusted_projected_generation/(base_actual_generation-base_retired_generation)
excess_generation_pool is the generation to be allocated every hour after the AFYGR is
applied to every unit operating in the BY generation data. This generation is the sum of
additional generation from each unit that is beyond any capacity limitation on that unit.
These parameters are written to the CALC_GENERATION_PARMS table.

Software Design Document for ERTAC EGU Projection Methodology April 21, 2011 Page 71
7.0 MAIN PROCESSING MODULE
This section is based on the ERTAC EGU Growth Implementation Subgroup’s Growth
Algorithm Process Elements (Process Elements Draft 03-04-11.doc, dated 03/04/2011) and the
Draft-Version #17 flowcharts (ERTAC Implementation #17.ppt, dated 12/20/10).
7.1 MAIN PROCESSING OVERVIEW
Exhibit 7.1 illustrates the flow of data and the calculations to be performed by the main
processing algorithm. The primary functions are to:
Calculates future generation and allocated future generation to each unit, by ERTAC
region and fuel/unit type.
Accumulates the generation in excess of the capacity of the units of a given ERTAC
region and fuel/unit type in a power pool. This excess generation is allocated to units
with remaining capacity in the ERTAC region of origin. (At the present time, the
algorithm will not have the capability to allocate power from more than one ERTAC
region to the same unit. That feature may be added later in the development process).
Ensures that spinning reserve requirements for each ERTAC region are met. The
spinning reserve is the extra generating capacity that must be available to meet
demand in case a generator goes down or there is another disruption to the supply.
For purposes of this exercise it shall be defined as 100% of the largest unit of any
type in the power pool being modeled.
Calculates emissions based on the projected generation and checks to see if the
expected controls, new generation, future year generation, and other system changes
allow the universe of units to meet the environmental caps.
Each of the main processing routines listed in Exhibit 7.1 are described in the remainder of this
section.
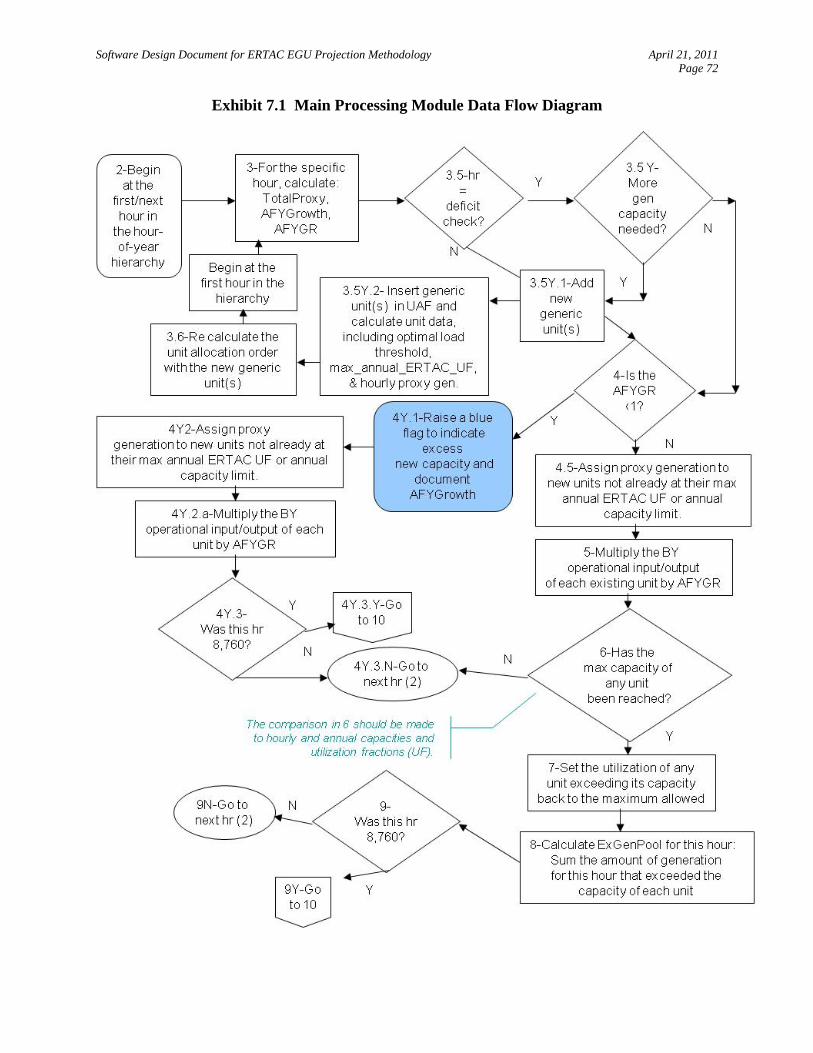
Software Design Document for ERTAC EGU Projection Methodology April 21, 2011 Page 72
Exhibit 7.1 Main Processing Module Data Flow Diagram
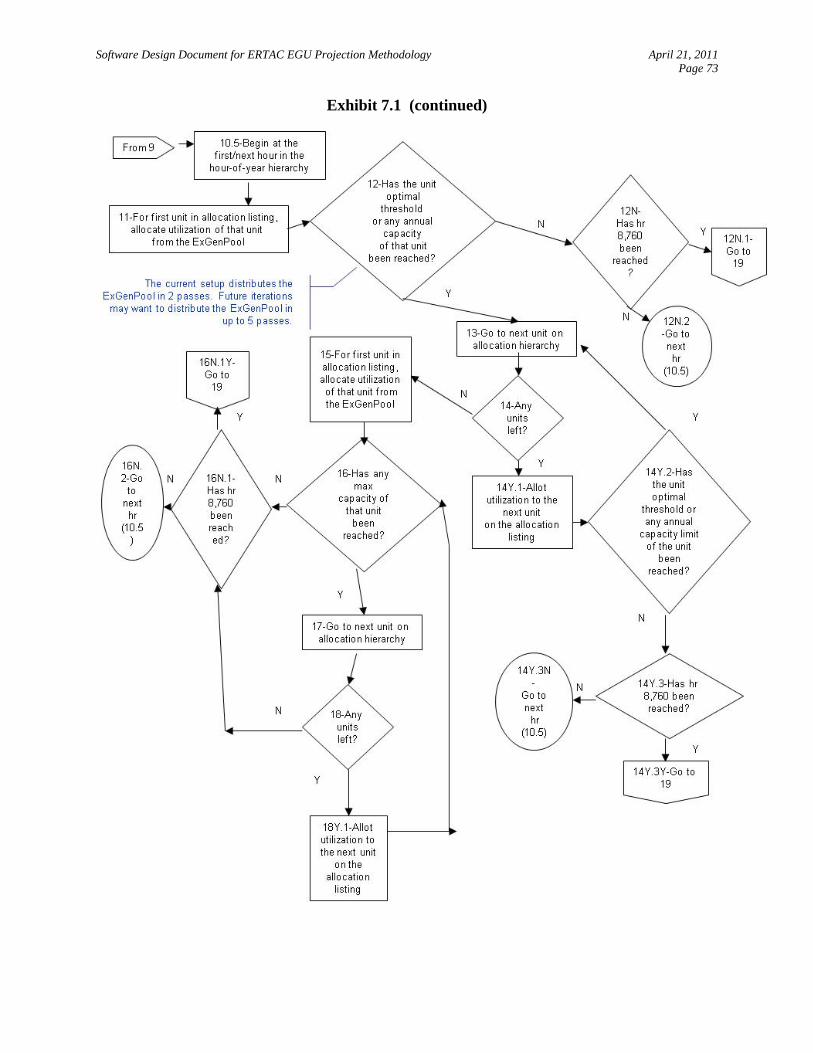
Software Design Document for ERTAC EGU Projection Methodology April 21, 2011 Page 73
Exhibit 7.1 (continued)
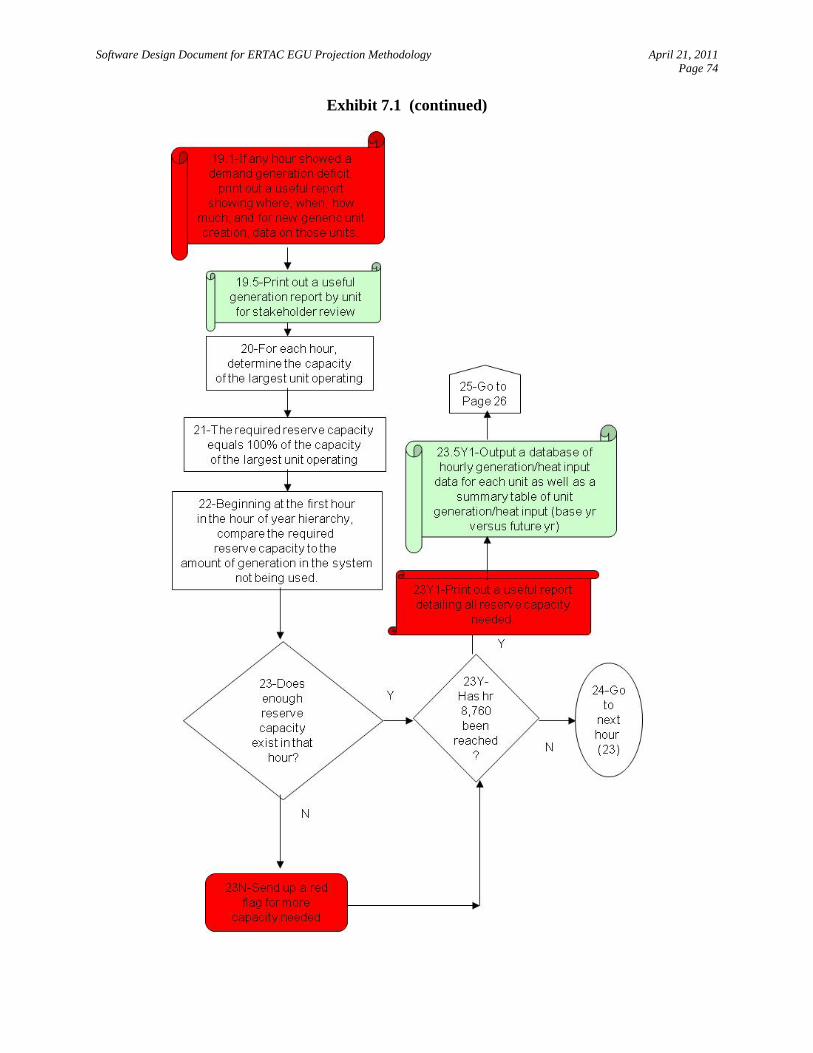
Software Design Document for ERTAC EGU Projection Methodology April 21, 2011 Page 74
Exhibit 7.1 (continued)
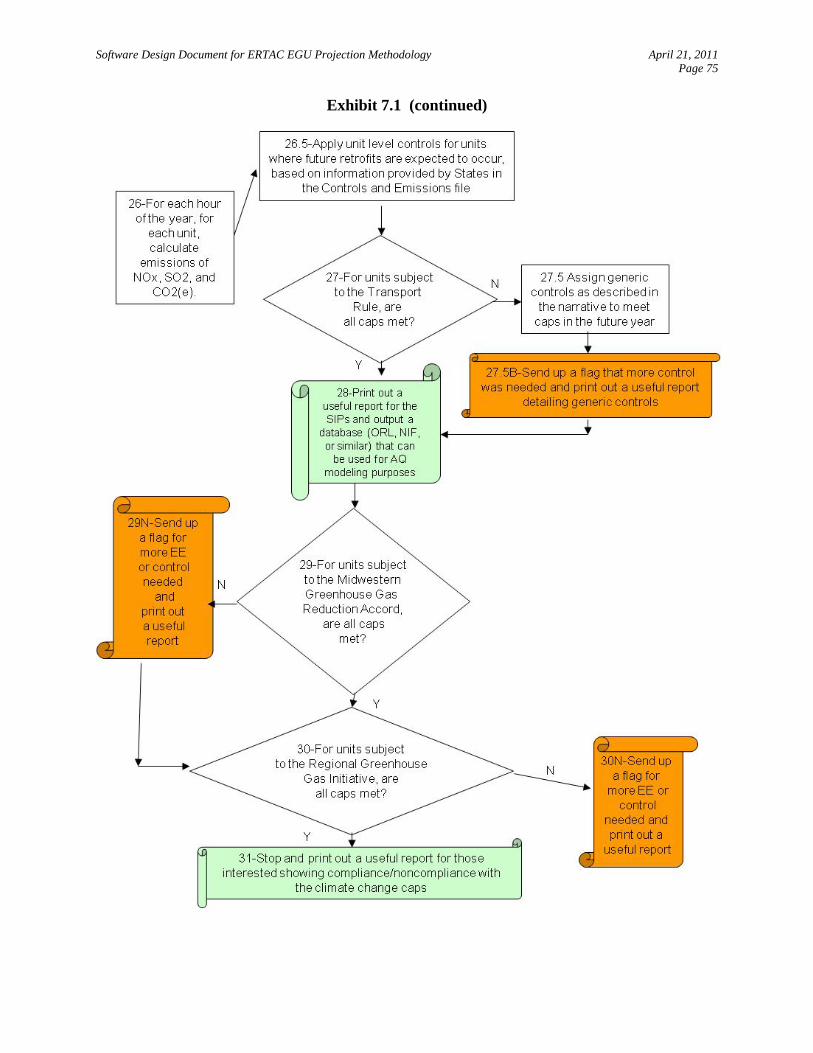
Software Design Document for ERTAC EGU Projection Methodology April 21, 2011 Page 75
Exhibit 7.1 (continued)

Software Design Document for ERTAC EGU Projection Methodology April 21, 2011 Page 76
7.2 PROCESS 2 – INITIALIZE DATABASE
This step will establish the relationships between tables in the pre-processed database, so that all
input information is available for the main processing module and can be efficiently retrieved.
This step may also accept inputs from the user to select a subset of the database to be run through
the main processing module. For example, the user may desire to run a single ERTAC region, a
single state, or a single fuel/unit type to diagnose the inputs and results for the region, state, or
fuel/unit type.
7.3 PROCESS 3 – POWER CAPACITY DEFICIT CHECK
This step will determine whether there is sufficient capacity available to meet the future demand.
The check is done on an hourly basis for each ERTAC region and fuel/unit types using the
hourly allocation hierarchy applicable to the fuel/unit type.
7.3.1 Process 3.5: Power Capacity Deficit Check
Since hours with highest demand requirements are evaluated first, after the top hours are calculated, the algorithm should be able to determine if more capacity to meet future year demand is needed.
After a certain number of hours, which is an input variable, the program should evaluate whether or not enough capacity exists to satisfy demand. If so, the algorithm continues. If not, then new generic capacity must be created, and the algorithm, starting with the basic calculations, must be re-run. The new generic capacity unit(s) will be treated as new units in all calculations.
7.3.2 Process 3.5Y.1: Addition of New Generic Units
This process will be used to meet the highest capacity demand deficit in the hours previously processed. A demand cushion may be applied (a multiplication factor to inflate or deflate the highest capacity demand deficit), as listed in the Input Variable worksheet. The default demand cushion is 1.0.
A new unit (or more than one) will be added manually to the Unit Availability File as described in PS1-5 and Section 4.
7.3.3 Process 3.5Y.2: Generic Units
Data for the new generic unit must be gathered and inputted into the Unit Availability File.
7.3.4 Process 3.6: Recalculation of the unit allocation order
When a new generic unit is created, the unit allocation order must be recreated to account for this unit. The generic unit also will receive proxy generation, which will necessitate the recalculation of the TotalProxy, AFYGrowth, and AFYGR.
Software Design Document for ERTAC EGU Projection Methodology April 21, 2011 Page 77
7.4 PROCESSES 4 TO 9: ALLOCATE HOURLY GENERATION TO UNITS
7.4.1 Process 4.1: Check Adjusted Future Year Growth Rate
Check if the adjusted future year growth rate is less than one.
If true, go to Process 4.5; otherwise go to Process 4Y.1
7.4.2 Process 4Y.1: Flag Excess New Capacity
Raise a blue flag to indicate excess new capacity and document AFYGrowth
7.4.3 Process 4Y2 and 4.5: Assign Generation to New Units
New units in the Unit Availability File that did not operate in the base year and therefore do not have CAMD data but are expected to be operating in the future year must have generation assigned to them.
These new units are expected to be very efficient and therefore are expected to be very economical to operate.
Each hour, they will be initially assigned a certain amount of generation, their proxy load, as described in the implementation outline. These units will still need to have their annual generation totals tracked so that they don’t exceed the Max _annual_ERTAC_UF for that ERTAC fuel/unit type bin.
Initially the algorithm will be designed to assume that new units will be fully operational at the start of the future year. Future enhancements may want to allow for units to begin operating commercially in the midst of a future year.
7.4.4 Process 4Y.2a and 5: Initial Growth of Existing Units to Future Year
Multiply the BY operational input/output of each existing unit by AFYGR. For 4Y.2, the growth rate is < 1 so that generation decreases. For 5, the growth is >1 so that generation increases and there may be an excess generation pool.
Some units will have steam load rather than MW-hrs. Those units will need to have steam load converted to MW-hrs.
7.4.5 Process 4Y.3: Checking End of the Hour Hierarchy
Rather than assigning generation from hour 1 to hour 8,760, the algorithm assigns generation in order of highest to lowest demand. This way, units will receive generation in a manner that is more representative of how units are actually dispatched. If a unit has a limitation on capacity, this method also ensures that the unit would operate on the highest demand days rather than other days.
To determine the order in which hours are allotted generation, three methods are used, one for coal, one for combined cycle, and one for all other unit/fuel types. See Process PS1.04.
Software Design Document for ERTAC EGU Projection Methodology April 21, 2011 Page 78
The algorithm will assign hourly growth and calculate the necessary ExGenPool using the AFYGR for each hour of the year. All hours will be grown with the AFYGR before generation from each hour’s ExGenPool is distributed.
7.4.6 Process 6: Initial Capacity Check
For each unit, there are a variety of capacities that need to be consulted with each calculation.
There are short term maximum generation/capacity values for every unit, which the hourly assigned generation cannot exceed. For example, this would be the max_ERTAC_heat_input_hourly_summer.
There are also annual capacities for every unit, since units cannot be operated 100% of the year due to maintenance and repair concerns. A unit’s annual utilization fraction is calculated by using the capacity factors assigned in the Unit Availability File (field name max_annual_ERTAC_UF). If a unit’s annual utilization fraction is reached, no more generation can be assigned to that unit in the following hours. Generation above that limitation would go in the excess generation pool.
States may manipulate annual capacities to account for future year limitations in the field named Unit_Annual_Capacity_Limit. This field is for units with future year capacity constraints that were not in place in the base year. Such units are identified by a “Y” in the field named Capacity-Limited_Unit_Flag.
At this point, the algorithm may need to use heat rates to facilitate conversion of maximum rated heat input capacity of units, expressed as mmbtu/hr, and generation, expressed as MW-hr.
7.4.7 Process 7: Utilization of the Unit
For hourly generation, a unit may be allotted generation up to its max_ERTAC heat_input_hourly_summer capacity. The unit may be allotted more generation the next hour even if this hourly capacity for the previous hour has been reached.
Each unit may be allotted up to its annual capacity or utilization fraction, as well as its hourly rates. After the unit has used up its annual capacity or utilization fraction, no more generation for the rest of the year may be assigned to it.
Future iteration of the coding could possibly allow trading between peak and annual hour capacities for each unit.
7.4.8 Process 8: Summing the ExGenPool
After each existing unit is grown using the AFYGR, any unit that is above maximum capacity must have its generation set back to the maximum capacity (either hourly or annual), and the additional generation should be added to the Excess Generation Pool (ExGenPool).
If an hour has generation in the ExGenPool, it will be assigned to units in the hierarchy after all hours are grown using the AFYGR.

Software Design Document for ERTAC EGU Projection Methodology April 21, 2011 Page 79
Use of the unit specific heat rate for conversion purposes between heat input and generation output will be critical.
7.5 PROCESSES 10 TO 18: ALLOCATE THE EXCESS GENERATION POOL
7.5.1 Process 10.5: Allocation
After all hours of the future year are grown using the AFYGR, then the ExGenPool for each hour must be distributed to units able to increase hourly generation.
Processes 10.5 through 18 only needs to be performed for hours that have an ExGenPool.
7.5.2 Process 12 and 14Y.2: Checking for the Unit Optimal Load Threshold
Each unit in the unit availability file will have an optimal load threshold assigned. For the first pass of generation distribution from the excess generation pool, units should only receive generation from the pool if they are not yet operating at their optimal load threshold.
If they are at or above their optimal load threshold, they get no additional generation assigned to them in the first pass.
Annual capacity limits and max ERTAC UFs must also be checked to ensure that additional hourly generation is assigned to units with the ability to accept the additional generation.
The algorithm must keep track of total annual generation for each unit to check annual capacity limits and the max ERTAC UFs. This information would be a good report to determine how close each unit gets to the annual capacity (stress on system).
Unit optimal load threshold defaults are calculated based on a percentile rank of the unit’s base year operation. The default for this value is 90th percentile of the hourly generation for that unit. This default may be changed in the input variable spreadsheet. Also, a State may choose to set a unit-specific unit optimal load threshold. For new units, the new unit optimal load threshold should mimic the unit optimal load threshold (as percent utilization) calculated for the unit beneath the new unit in the unit allocation hierarchy.
This algorithm allows the excess generation to be distributed in two passes. Future modifications to the algorithm may distribute the generation in more than two passes.
7.5.3 Process 16: Allocate Generation and Check Maximum Rated Capacity
If there is still generation in the pool after distribution of the energy to all units up to the units’ optimal thresholds, the generation will be distributed in a second pass.
The second pass will allot generation up to a unit’s maximum rated capacity.
Some units may be at maximum rated capacity before any generation is assigned from the pool due to the application of the AFYGR in process box 5. These units do not receive any generation from the pool beyond their maximum hourly rated capacity.
Units may be at the annual capacity or the utilization fraction, in which case that unit also does not receive additional generation.

Software Design Document for ERTAC EGU Projection Methodology April 21, 2011 Page 80
The Unit Availability File also has a Unit Optimal Minimum Load Threshold. This is currently not being used. A future enhancement would use this value to turn off units dropping below this threshold on days when generation is expected to decrease and reassign the generation from those units to other, more frequently used units. This may be a future enhancement of the algorithm.
7.6 PROCESSES 19 TO 24: SPINNING RESERVE CHECKS
This set of processes checks to ensure that spinning reserve requirements for each region of the
system are met. This portion of the work is performed after the generation calculation and
allocations have been performed for all hours, ERTAC regions, and fuel/unit types. The
spinning reserve for an hour can be satisfied by any extra capacity in any fuel/unit type, but must
be in the same ERTAC region. The amount needed is calculated by finding the maximum
capacity of the largest single unit running in any hour using any fuel and multiplying by 100%.
7.6.1 Process 19: List Demand Deficits
If any hour showed a demand generation deficit, print out a useful report showing where, when, how much, and for new generic unit creation, data on those units. How is the program going to create the new generic units where demand exceeds capacity? See page 6 of the Narrative Outline of Decisions and Rules for the Model..
Print out a useful generation report by unit for stakeholder review
7.6.2 Processes 20 and 21: Determine Required Reserve Capacity
For each hour, determine the capacity of the largest unit operating
The required reserve capacity equals 100% of the capacity of the largest unit operating
7.6.3 Process 22 to 24: Identify When/Where More Capacity Is Needed
Beginning at the first hour in the hour of year hierarchy, compare the required reserve capacity to the amount of generation in the system not being used.
Check if enough reserve capacity exists in that hour
If no, send up a red flag for more needed capacity
If yes, go to next hour
When all hours have been processed
o Print out a useful report detailing all reserve capacity needed.
o Output a database of hourly generation/heat input data for each unit as well as a summary table of unit generation/heat input (base yr versus future yr)

Software Design Document for ERTAC EGU Projection Methodology April 21, 2011 Page 81
7.7 PROCESSES 25 TO 31: EMISSION CALCULATIONS
7.7.1 Process 26: Calculation of Emission Rates
Extract base year emission rates for NOx, SO2, and CO2e for that hour from CAMD data.
For new units supplied by States, the emission rates will be supplied in the Controls and Emissions file.
For new generic units inserted by the program to meet generation requirements, default emission rates should be calculated. These emission rates should be the 90th percentile of NOx, SO2, and CO2(e) rates in lbs/mmbtu for that ERTAC fuel/unit type bin and region. These facilities will need PSD permits, at a minimum, and therefore will be subject to BACT and will be very clean. Assuming they are the 10th percentile cleanest units should be a conservative estimate. This value may be varied in the Input Variables worksheet.
If unit level emission rates for other criteria pollutants exist in the Controls and Emissions file for a particular unit, the future year emissions of those pollutants should be calculated on an hourly and annual basis.
7.7.2 Process 26.5: Addition of Controls
This applies control efficiency or controlled emission rates to units that States believe will be controlled by the future year date.
7.7.3 Process 27: Criteria Pollutant Policy Check
Since the final version of the transport rule is not yet available, it is hard to say how this process will work exactly.
7.7.4 Process 27.5: Assignment of “generic” emissions controls
If the TR caps are not met after application of all known controls provided by States, then additional controls must be applied. These are called “generic” controls.
Assignment of generic controls should be performed as described in the Implementation Outline.
7.7.5 Process 29 and 30: Climate change checks
These are informational. No “controls” are assigned to meet climate change requirements, nor are additional EE/RE programs assumed to be put in place. Another run may be created using updated growth factors adjusted for RPS and other programs not included in AEO. A comparison could be made by state personnel of CO2(e) emissions. However, the model will not generate “generic” CO2(e) reductions to meet cap levels.
Needed are lists of units, caps, and what accord the units belong to.
Software Design Document for ERTAC EGU Projection Methodology April 21, 2011 Page 82
8.0 POST-PROCESSING MODULE
The output directly available from the main processing module is in the form of a SQLite
database. The post-processing function makes it easy to produce reports or text files
summarizing this information. A primary output of this model will be a file ready for either
direct use in the photochemical model or merging with other inventory files for use in the
photochemical model. Secondary outputs may quantify criteria and climate change pollutants on
either an hourly or an annual basis. The model will output reports that identify deficiencies in
generation and emissions controls in regions to allow informed intervention by State staff. The
model will also output a file identifying the units, peak hourly generation or heat input, and
annual generation or heat input. The following paragraphs the types of reports and data files that
will be generated.
8.1 EXCESS GENERATION IN A REGION BY STATE AND ERTAC
FUEL/UNIT TYPE BIN
Amount of unused capacity in MW for each region, for each hour of the year, for each
ERTAC fuel/unit type bin where existing units are predicted to generate less power than
in the base year.
Minimum data in the report are the hours, the ERTAC fuel/unit type bin, the region, the
hour specific growth rate (HSGR), the AFYGR, the base year generation, and the
AFYGrowth.
A condensed, overview version of this report will be needed for State review and
potential inclusion in SIP TSDs.
8.2 GENERATION CAPACITY DEMAND DEFICIT REPORT
Sorted by region, ERTAC fuel/unit type bin, and hour. Should detail the amount of any
demand deficit. For every hour for every region where there exists a demand deficit,
there should be a record in this table. Also, the report should note if any hours exist
where demand is not met after new generic unit creation.
This report will be a key notification to regions and states.
The model must assure adequate generation in the future year, so information in the
deficit report will be used to evaluate the new “generic” units assigned to a region and
unit/fuel type. This report will document the creation of generic generating units as
described in the Implementation Outline.
Data in the report needs to include region, unit/fuel type, region’s total capacity as run in
the model, the percent capacity increase needed, the hour specific growth rates, peak and
annual growth rates, the location of the new generic units, the size of new generic units,
Software Design Document for ERTAC EGU Projection Methodology April 21, 2011 Page 83
the top 10 facilities of that unit/fuel type, capacity of the top 10 facilities, and the county
location of those facilities. Location of the top 10 facilities to receive new units may be
set as part of the Input Variables spreadsheet.
Creation of generic units to meet demand deficits will necessitate the reordering of the
unit hierarchy in Process 3.6 and will affect the excess generation pool since the new
generic unit will receive proxy generation as noted in Processes 4.5 and 4Y2.
For units in the UAF and the Control and Emissions File, this report should detail the
amount of mass from units in the BY that was not able to be grown due to lack of
important fields.
8.3 GENERATION REPORT
The stakeholder report on generation needs to list each unit in the region and ERTAC
fuel/unit type bin, as well as base and future year generation data.
Number of hours when generation exceeded optimal thresholds in base and future year.
Number of hours in the year where units were driven up to their maximum threshold.
Units and the rank-ordered hour of the year where a unit is driven to optimal threshold,
max hourly capacity, and annual capacity.
Data from the Unit Availability File describing physical limitations of the unit such as
optimal threshold, and maximum threshold. Data from the growth file such as hour
specific growth rate. For each unit, the mmbtu allocated and MW generated from base to
future year.
Sorted by region, ERTAC fuel/unit type bin, state ID, county ID, ORIS facility ID, and
unit ID.
Will not contain every hour of the year.
Should be sortable by unit, ERTAC Region, and Fuel/Unit Type Bin
8.4 GENERATION CAPACITY RESERVE DEFICIT REPORT
This is a very important report, however, it will not trigger the creation of generic
combined cycle units in a region. That process may be part of a future enhancement, but
for this iteration, deficits for reserve capacity will only generate reports.
Information in the report is hour of year, region, amount of capacity needed to meet
reserve requirements (% and MW), the location of the top 10 facilities that are combined
cycle/natural gas units in the region, and neighboring regions’ utilization as compared to
capacity. This will allow a comparison between regions to determine if reserve capacity
could be bought.
Software Design Document for ERTAC EGU Projection Methodology April 21, 2011 Page 84
8.5 HOURLY GENERATION DATABASE BY UNIT
This report will be the main product for LADCO.
The database should include each region, each ERTAC fuel/unit type bin, each hour, heat
input data and generation data for both the base year and the growth year, and the total
amount of excess generation distributed for that hour. Data will be used by some MJOs to
create the hourly inventory data for each unit.
Every hour for every unit with no generation or heat input, the database should contain
zeros so that there is a complete year for each unit.
Data should be in heat input (mmbtu) and MW to facilitate emissions calculations.
A summary table should also be included to show annual changes from base year to
future year in heat input for each unit.
A separate summary table by state and by region should also be supplied to show growth.
BY generation by hour, across the board growth, and excess generation by hour for each
ERTAC Region and Fuel/Unit Type Bin.
8.6 CRITERIA POLLUTANT CONTROL EQUIPMENT INSTALLATION
REPORT
State level report that will show a comparison of cap versus estimated emissions.
This report prints out the units that must have additional control equipment installed
beyond the state specified controls to allow the area to demonstrate compliance with
policy caps. The report should contain the particular area’s pollutant cap, how far over
the cap are the calculated emissions, which units received what controls, and the new
total calculated emissions level.
For each ERTAC Region, the report should also detail existing units that will be
receiving State specified controls.
8.7 SIP REPORT
For SIP purposes, the report should detail by State each unit’s BY annual and seasonal
heat input, generation, and emissions; FY annual and seasonal heat input, generation, and
emissions; the regional annual and seasonal caps for SO2 and NOx under which the unit
operates; and the FY annual and seasonal SO2, CO2e, and NOx totals for that state and
region. Also, the report should include monthly total values for heat input, generation,
and emissions for ozone season calculations. The timeframe for the ozone season would
be set for each region in the input variables spreadsheet.

Software Design Document for ERTAC EGU Projection Methodology April 21, 2011 Page 85
8.8 AQ MODELING DATABASE
The database needs to have hourly data for each unit for modeling purposes. Provides for
each unit SO2, NOx, and CO2e, and any other pollutants that can be calculated based on
information in the control and emissions file.
8.9 CLIMATE CHANGE CAP COMPLIANCE REPORT
The report should list the climate change cap values.
The report should also list the amount a region is over the climate change cap values in
the future year. The report should be done by state, by climate change program, and
should also provide emission totals for CO2e by program codes (Midwest Accord and
RGGI).
As a future enhancement, the emission caps may be a input variable to assist in
determining compliance.
Software Design Document for ERTAC EGU Projection Methodology April 21, 2011 Page 86
9.0 REFERENCES
TO BE COMPLETED
EIA 2010. U.S. Department of Energy, Energy Information Administration. Annual Energy
Outlook with Projections to 2035 (AEO2010); DOE/EIA-0383(2010). April 2010.
http://www.eia.doe.gov/oiaf/aeo/assumption/pdf/0554(2010).pdf
USEPA 2009. U.S. Environmental Protection Agency. Clean Air Markets – Data and Maps
Web Site; Unit Level Emissions Query for 2007. File downloaded on September 9, 2009.
http://camddataandmaps.epa.gov/gdm/index.cfm?fuseaction=emissions.wizard