Embed Size (px)
Citation preview

Cerebral Cortex, 2017; 1–16
doi: 10.1093/cercor/bhx131Original Article
O R I G I NA L ART I C L E
Socioeconomic Status and Reading Disability:Neuroanatomy and Plasticity in Responseto InterventionRachel R. Romeo1,2,†, Joanna A. Christodoulou2,3,4,†, Kelly K. Halverson2,Jack Murtagh2, Abigail B. Cyr2, Carly Schimmel2, Patricia Chang2,Pamela E. Hook3 and John D.E. Gabrieli2,4,5
1Division of Medical Sciences, Harvard Medical School and Harvard University, Boston, MA 02115, USA,2McGovern Institute for Brain Research and Department of Brain and Cognitive Sciences, MassachusettsInstitute of Technology, Cambridge, MA 02139, USA, 3Department of Communication Sciences and Disorders,MGH Institute of Health Professions, Boston, MA 02129, USA, 4Harvard Graduate School of Education,Cambridge, MA 02138, USA and 5MIT Integrated Learning Initiative, Cambridge, MA 02139, USA†Rachel R. Romeo and Joanna A. Christodoulou are contributed equally to this work.Address correspondence to Rachel Romeo, MIT (Office 46-4037), 43 Vassar Street, Cambridge, MA 02139, USA. Email: [email protected] and JoannaChristodoulou, 36 First Avenue, Boston, MA 02129, USA. Email: [email protected]
AbstractAlthough reading disability (RD) and socioeconomic status (SES) are independently associated with variation in readingability and brain structure/function, the joint influence of SES and RD on neuroanatomy and/or response to intervention isunknown. In total, 65 children with RD (ages 6–9) with diverse SES were assigned to an intensive, 6-week summer readingintervention (n = 40) or to a waiting-list control group (n = 25). Before and after, all children completed standardized readingassessments and magnetic resonance imaging to measure cortical thickness. At baseline, higher SES correlated with greatervocabulary and greater cortical thickness in bilateral perisylvian and supramarginal regions—especially in left parsopercularis. Within the intervention group, lower SES was associated with both greater reading improvement and greatercortical thickening across broad, bilateral occipitotemporal and temporoparietal regions following the intervention.Additionally, treatment responders (n = 20), compared with treatment nonresponders (n = 19), exhibited significantly greatercortical thickening within similar regions. The waiting control and nonresponder groups exhibited developmentally typical,nonsignificant cortical thinning during this time period. These findings indicate that effective summer reading interventionis coupled with cortical growth, and is especially beneficial for children with RD who come from lower-SES homeenvironments.
Key words: cortical thickness, dyslexia, longitudinal, neuroimaging, SES
IntroductionReading is the bedrock of early education, and difficulty inreading has widespread and long-term consequences. Twomajor factors associated with difficulty in learning to read are
reading disability (RD) and socioeconomic status (SES). RD isthe most prevalent type of learning disability (Shaywitz et al.2008), and is estimated to affect about 10% of school-age chil-dren (Shaywitz 1998). Developmental dyslexia describes
© The Author 2017. Published by Oxford University Press. All rights reserved. For Permissions, please e-mail: [email protected]
Downloaded from https://academic.oup.com/cercor/advance-article-abstract/doi/10.1093/cercor/bhx131/3862191by Harvard Law School Library useron 22 January 2018
children with RD who demonstrate difficulty with single wordreading accuracy or fluency in the context of intact cognitiveskills and adequate educational opportunity (Lyon et al. 2003).SES is a common conceptualization of the social and economicstatus of an individual or group that is often measured by somecombination of parental educational attainment, income, andoccupation. Higher SES is associated with better reading out-comes (Peterson and Pennington 2015), but unlike RD, SES isassociated with environmental factors such as home languageenvironment (Hoff et al. 2002) and quality of school instruction(Lee and Burkam 2002). Here we asked whether there areneuroanatomical brain differences in young children (ages 6–9)with RD from varying SES backgrounds, and whether a readingintervention yields similar or dissimilar reading benefits andbrain plasticity in children across the SES continuum.
Neuroimaging studies of children and adults with RD haverevealed both structural and functional differences as com-pared with typical readers (Norton et al. 2015). Structurally, RDis typically associated with cortical gray matter reductions inbilateral temporoparietal regions underlying phonological pro-cessing (Brown et al. 2001; Eckert 2004; Silani et al. 2005;Vinckenbosch et al. 2005; Hoeft et al. 2007) and left occipitotem-poral regions underlying visual whole-word recognition (Eckert2004; Silani et al. 2005; Kronbichler et al. 2008; Steinbrink et al.2008), as well as parts of the cerebellum bilaterally (Brown et al.2001; Eckert et al. 2003; Brambati et al. 2004; Kronbichler et al. 2008;for meta-analyses, see Linkersdörfer et al. 2012; Richlan et al. 2013).These gray matter disparities are evident even in young childrenwith a family history of dyslexia who have yet to learn how toread (Raschle et al. 2011), suggesting that these differences arenot purely a consequence of reading difficulty. Some studieshave found additional gray matter reductions in canonical lan-guage regions, including left inferior frontal cortex (includingBroca’s area) and left superior temporal cortex (includingWernicke’s area) in both children with RD (Eckert et al. 2003;Hoeft et al. 2007) and adults with RD (Brown et al. 2001; Brambatiet al. 2004; Steinbrink et al. 2008). These neuroanatomical differ-ences in left-hemisphere language areas are consistent withevidence that a weakness in a specific component of language,namely some aspects of phonological processing, is one of themost common prereading predictors and continuing correlatesof RD (Melby-Lervåg et al. 2012).
There is also evidence for brain plasticity following inter-vention in both children and adults with RD. Most neuroimag-ing studies examining intervention-induced plasticity havemeasured functional changes, and often report normalizationof preintervention hypoactivation in left-hemisphere regionsassociated with reading and language, as well as increased acti-vation in right-hemisphere homologues interpreted as com-pensatory plasticity (Gabrieli et al. 2010; Barquero et al. 2014).The 2 studies examining intervention-induced structural plas-ticity have reported bilateral changes in the hippocampalregion, left precuneus, and right cerebellum (Krafnick et al.2011) and in white-matter microstructure of the left anteriorcentrum semiovale that correlated with improvement in pho-nological decoding ability (Keller and Just 2009).
SES is also strongly associated with reading skill (White1982; Bowey 1995; Hecht et al. 2000). The disproportionate influ-ence of SES on reading and language skills, as compared withother cognitive domains (Farah et al. 2006; Noble et al. 2005,2007), is thought to arise from variation in the quantity andcomplexity of early language exposure (Hoff 2006; Perkins et al.2013; Schwab and Lew-Williams 2016). SES-related differencesin brain structure are evident as early as 1 month of age
(Betancourt et al. 2016), and appear to increase with age (Nobleet al. 2012; Hanson et al. 2013). Specifically, lower SES is correlatedwith reduced activation in left perisylvian regions duringlanguage-related tasks (Raizada et al. 2008) and reduced gray mat-ter in both left perisylvian regions (Noble et al. 2012, 2015) andbilateral occipitotemporal regions (Jednorog et al. 2012; Mackeyet al. 2015), among many other regions (Brito and Noble 2014).
Although separate lines of evidence have revealed neuroan-atomical differences in left-hemisphere language areas in rela-tion to RD and SES, these 2 lines of evidence have yet to beintegrated. This is an important gap in knowledge to address,because children from lower-SES backgrounds disproportion-ately meet RD criteria (Peterson and Pennington 2015) and arediagnosed with specific learning disabilities at significantlyhigher rates than children from higher SES backgrounds(Shifrer et al. 2011). In 2015, fourth and eighth grade studentseligible for the National School Lunch Program (indicating lowfamily income) were 2.5 times more likely to read at a “belowproficient” level than students from higher-income families(U.S. Department of Education 2015). This may be related togene × environment interactions, such that a genetic risk forRD is amplified by decreased access to reading/literaryresources in lower-SES environments (Mascheretti et al. 2013),and/or that potentially typical-readers are not achieving theirpotential due to decreased resources (Friend et al. 2008).Therefore, it is important to understand whether RD arisesfrom similar brain differences and responds similarly or dif-ferently to interventions for lower- and higher-SES students.
There are currently no studies examining RD and SES inter-actions in regard to brain structure, but 2 functional magneticresonance imaging (fMRI) studies examining this interactionhave yielded conflicting results. One study investigated theeffects of SES on the relationship between phonological aware-ness, word decoding, and brain activation in children (Nobleet al. 2006). Participants (6–9 years old) were recruited based ona history of reading difficulty and, on average, scored in thelow- to below-average range on standardized assessments ofpseudoword reading skills and phonological awareness. Amongchildren with the lowest phonological awareness scores,higher-SES children exhibited an increased response, versuslower-SES children, in left fusiform and perisylvian regionswhile viewing pseudowords versus a fixation cross (Noble et al.2006). The other study investigated the effects of SES on brainactivation while both typical readers and children with a diag-nosis of dyslexia (8–10 years old) viewed words (vs. houses,faces, checkerboard, and blank screen) and listened to speech(vs. foreign language and silence) (Monzalvo et al. 2012).Although there were SES-related activation differences for thespeech task in right-hemisphere perisylvian regions, therewere no SES-related differences during the visual word task(Monzalvo et al. 2012). These 2 functional studies reached con-flicting conclusions about the relation between SES and func-tional activation in response to print, which could be explainedby any number of methodological differences, including lan-guage (English vs. French), participant age (6–9 vs. 8–10 years),sample size (38 vs. 23 noncontrol children), inclusion criteria(history of reading difficulty vs. externally diagnosed dyslexia),SES measurement (continuous variable based on parental edu-cation, occupation, income-to-needs ratio vs. categorical variablebased on school districts), and/or print stimuli (pseudowords vs.short familiar real words).
The most important goal of understanding RD is to helppeople overcome reading difficulties, to the extent possible,through educational intervention. Although SES is relatively
2 | Cerebral Cortex
Downloaded from https://academic.oup.com/cercor/advance-article-abstract/doi/10.1093/cercor/bhx131/3862191by Harvard Law School Library useron 22 January 2018

easy to measure and known to be associated with reading skill,very few studies have asked whether participant response toan intervention varies in relation to SES. A review of 14 studiesreported behavioral factors predicting responsiveness to liter-acy interventions (Lam and McMaster 2014). Although themajority of studies collected some sort of SES information, only4 studies analyzed SES as a predictive factor; of these, 2 foundthat higher SES predicted better treatment response on readingoutcome measures (Hatcher et al. 2006; Morris et al. 2012). Theother studies either treated SES as a nuisance variable or as adescriptive characterization of their overall sample. Similarly,neuroimaging studies examining brain plasticity associatedwith intervention rarely consider the SES of participants. In areview of functional neuroimaging studies of reading interven-tions (Barquero et al. 2014), only 4 of 22 studies reported partici-pant SES information. Of these, only one study (Bach et al.2013) examined the relationship between SES and interventionoutcomes, albeit only in behavioral outcomes. Although thisspecific study of Swiss-German children did not reveal SES aspredictive of intervention efficacy, relationships between SESand academic achievement appear to be stronger in individualsfrom the United States (Tucker-Drob and Bates 2016), poten-tially due to greater SES variability in educational quality in theUnited States. Given how strong the effects of US SES are onboth children’s reading ability and their neural architecture, itmay be that SES is related to behavioral and neuroanatomicalintervention response sensitivity in US children.
In the present study, we recruited young children with RDfrom a broad SES range and assigned them either to an intensivereading intervention during the school summer break or to awaiting-list control group. First, we asked whether cortical thick-ness varied by SES at baseline, because it is unknown whetherthere is such a relation between RD and SES neuroanatomically.Based on the literature linking SES to brain structure in typicallydeveloping children (Brito and Noble 2014), we hypothesizedthat higher-SES children with RD would exhibit thicker cortex,especially in inferior frontal and posterior temporal regionscanonically associated with language and reading. Second, weasked whether SES was related to intervention efficacy in rela-tion to reading outcomes and structural brain plasticity. Whilethere is some evidence of structural brain plasticity associatedwith reading intervention (Keller and Just 2009; Krafnick et al.2011), the specific effect on cortical thickness and the relationsof plasticity to SES and treatment response are unknown.Behaviorally, we hypothesized that higher-SES children wouldrespond more positively to the intervention, based on previousintervention response findings (Torgesen et al. 1999; Hatcheret al. 2006; Morris et al. 2012). Furthermore, we predicted thatthe children who exhibited greater behavioral improvementwould also exhibit greater gains in cortical thickness.
Materials and MethodsParticipants
Children (n = 65, 22 females) with RD who were between theages of 6 and 9 years (M = 7.75 years, SD = 0.64 years) and com-pleting grade one or 2 were recruited from communities in anSES-diverse Northeast region around a major urban center.Specifically, children were recruited both from the communityat-large (n = 50) and from a local partner school (n = 15), whichwas an SES-diverse urban charter school.
Inclusion criteria required participants to have a history of read-ing difficulty based on parental report, a current demonstration of
reading difficulty, and no neurological or psychiatric impairmentsor associated medications with the exception of attention deficithyperactivity disorder (ADHD). Eleven children carried a diagnosisof ADHD, a disorder highly comorbid with RD (Germano et al. 2010),and 6 of these children received daily medication. However, theydid not differ from the remaining participants on any behavioralmeasures or demographic variables (all P > 0.13), so all 11 wereincluded in the final sample. Additionally, all participants werenative English speakers, although 6 participants were simultaneousbilinguals (natively acquired English and another language frombirth), and 5 others had exposure to a second language outside oftypical foreign language class at school. There was no relationshipbetween bilingualism and any demographic variable, assessmentscore, group assignment, or intervention response (all P > 0.05).Behavioral findings from a subset of these children (n = 47) whoparticipated in the first phase of the intervention study were previ-ously reported (Christodoulou et al. 2017). Findings reported hereare from all children who participated in the intervention studyexcept for those whose neuroimaging data were problematic(described below). Written informed consent was obtained fromparents, and written assent was obtained from all child partici-pants. All procedures were approved by the Institutional ReviewBoard at the Massachusetts Institute of Technology.
Demographics
Participants’ SES was determined by a composite of maternaleducation and occupational prestige, as calculated by the“Barratt Simplified Measure of Social Status” (BSMSS; Barratt2006). Maternal factors were chosen because they are the mostfrequently used SES measure (Ensminger and Fothergill 2003),are considered to have stronger relation than paternal factorsto cognitive development in younger children (Mercy andSteelman 1982), and because 13 participants lived in single-mother homes. For the 4 participants whose mothers were full-time homemakers, paternal occupation was substituted andcombined with maternal education. The BSMSS scale yieldspossible scores ranging from 8 (lower SES) to 66 (higher SES);participants’ scores ranged from 17 to 66 (M = 47.35, SD =11.75). Maternal education and occupation scores were highlycorrelated (Pearson’s r = 0.76, P < 1−12), supporting their combi-nation into a composite measure. Additionally, 48 participants(74%) optionally reported their annual gross family income,which ranged from $15 000 to >$120 000 (M = $77 400, SD =$33 550). Income was highly correlated with maternal education(r = 0.53, P < 0.001), maternal occupation (r = 0.47, P < 0.001),and total BSMSS scores (r = 0.51, P < 0.001); thus, BSMSS scoreswere judged to be a valid index of SES. Unless otherwise noted,SES was treated as a continuous variable for all analyses.
Behavioral Assessments
Screening SessionParticipants were first invited to a screening session, at whichthey completed a battery of tests. Nonverbal cognition wasassessed with the Matrices subtest of the “Kaufman BriefIntelligence Test, 2nd edition” (KBIT-2; Kaufman and Kaufman2004). Core reading subskills were assessed with the Elision andNonword Repetition subtests of the “Comprehensive Test ofPhonological Processing” (CTOPP; Wagner et al. 1999), and theObjects, Letters, and 2-set Letters and Numbers subtests of the“Rapid Automatized Naming and Rapid Alternating StimulusTests” (RAN/RAS; Wolf and Denckla 2005). Reading wasassessed by the Oral Reading Fluency subtest of the “Dynamic
SES and Neuroanatomy in Reading Disability Romeo et al. | 3
Downloaded from https://academic.oup.com/cercor/advance-article-abstract/doi/10.1093/cercor/bhx131/3862191by Harvard Law School Library useron 22 January 2018

Indicators of Basic Early Literacy Skills” (DIBELS; Good andKaminski 2002).
Participants were included in the final RD sample (n = 65) ifthey (1) scored “At Risk” or “Some Risk” on the DIBELS (Good andKaminski 2002), a criterion-referenced benchmark assessment (n= 56), and/or (2) scored below the 25th percentile on at least 3 of 5phonological processing (CTOPP; Wagner et al. 1999) and rapidnaming (RAN/RAS; Wolf and Denckla 2005) subtests—skills thatare highly associated with reading ability (n = 32). In total, 23 par-ticipants met both criteria, and there were no demographic differ-ences between the 2 inclusion criteria (all P > 0.23). Additionally,all participants were required to score at or above the 16thpercentile on a measure of nonverbal cognitive ability (Matricessubtest, KBIT-2; Kaufman and Kaufman 2004). Overall, 24 partici-pants (37%) possessed an external diagnosis of dyslexia or areading-based learning disability.
Preintervention CharacterizationAfter meeting inclusion criteria, participants completed addi-tional assessments of language skills. Two additional CTOPPsubtests (Blending Words and Memory for Digits) were admin-istered to better characterize phonological processing (Wagneret al. 1999). Receptive vocabulary was assessed with the“Peabody Picture Vocabulary Test, 4th edition” (PPVT-4; Dunnand Dunn 2007).
Pre- and Postintervention Outcome MeasuresFour a priori outcome measures were administered before (pre-test) and after (post-test) the intervention/waiting period:untimed word reading [Word Identification subtest (Word ID),“Woodcock Reading Mastery Test, 3rd edition” (WRMT-3);Woodcock 2011], untimed pseudoword reading [Word Attacksubtest (Word Attack), WRMT-3; Woodcock 2011], timed wordreading [Sight Word Efficiency subtest (SWE), “Test of WordReading Efficiency, 2nd edition” (TOWRE-2); Torgesen et al.2012], and timed pseudoword reading [Phonemic DecodingEfficiency subtest (PDE), TOWRE-2; Torgesen et al. 2012]. For all4 subtests, Form A was administered at pretest, and Form Bwas administered at post-test to avoid practice/familiarityeffects. High alternate form reliability has been reported forstandardized tests scores on both the WRMT-3 subtests (WordID r = 0.93, Word Attack r = 0.76; Woodcock 2011) and theTOWRE-2 subtests (SWE r = 0.90, PDE r = 0.92; Torgesen et al.2012). Thus we report changes in standard scores, becausechanges in raw scores are difficult to interpret. The primaryoutcome measure was a composite reading score obtained byaveraging the standard scores from all 4 subtests.
Confirming inclusion criteria from screening, all participantseither (1) scored below the 25th percentile on at least 2 of the 4reading subtests (n = 52), and/or (2) possessed a discrepancy of15 or more standard points between the reading compositescore and the nonverbal cognitive ability score (n = 43). A totalof 30 participants met both descriptions. There were no demo-graphic differences (including age, grade, gender, bilingual sta-tus, diagnoses, and SES) between these 2 descriptions (all |t| <1.15, all χ2 < 1.71, all P > 0.17).
Group Assignment
After all pretest assessments were completed, the fifty childrenrecruited from the community at-large were randomly assignedto either receive an intensive summer reading intervention (n = 25)or to a waiting-list control group (n = 25), who receivedequal access to services after post-test assessments. For the
intervention-assigned participants in this community sample,intervention was based in Cambridge, MA in dedicated space atMIT (“Site 1”). Children recruited from the local partner school (n =15), were all assigned to the intervention group as a condition ofschool participation, and instruction was delivered on-site at theschool (“Site 2”). The overall intervention group was therefore over-subscribed with 15 nonrandomly assigned students, which allowedfor better investigation of individual differences in response totreatment. After pretest, one participant from the community at-large who had been randomly assigned to the intervention did notcontinue study participation, leaving 39 participants in the inter-vention group.
Intervention and control groups did not differ significantlyon any demographic or assessment measures, including age,grade, gender, portion with comorbid ADHD, bilingualism, SES,nonverbal cognition, vocabulary, and all reading skills (all |t| <0.76, all χ2 < 1.93, all P > 0.16). Within the full treatment group(n = 39), there was a marginal difference in SES by site [t(37) =1.87, P = 0.07], which was driven by one outlier from the partnerschool with an SES 2.6 standard deviations below the samplemean. If excluded, no significant SES difference remainedbetween assignment sites [Site 1 M = 48, SD = 12.6, Site 2 M =42, SD = 11.4, t(36) < 1.50, P > 0.14]. There were no differencesbetween sites on any other demographics (age, grade, gender,ADHD, bilingualism), pretest reading scores (all |t| < 0.26, all χ2 <0.83, all P > 0.36), or intervention response (see Results). Thus,participants from both sites who completed the interventionwere combined into a single treatment group (n = 39).
Intervention
The intervention is described in detail in a prior publication(Christodoulou et al. 2017). In brief, intervention participants (atboth sites) received an intensive version of the Lindamood-Bell“Seeing Stars: Symbol Imagery for Fluency, Orthography, SightWords, and Spelling” (Bell 2007) program in small groups (3–5children) by trained Lindamood-Bell teaching staff. “SeeingStars” is a multisensory remedial approach with a primaryfocus on training orthographic and phonological processing toimprove reading accuracy, fluency, and comprehension. Theprogram was held 4 h per day, 5 days per week, for 6 weeks dur-ing the summer break from school, with a high rate of atten-dance (M = 113 total hours, SD = 7.5). Total number of hours ofattendance was not correlated with any demographic variable,intervention site, pretest or post-test assessment score, ortreatment response (all |r| < 0.23, all P > 0.20).
Neuroimaging Data Acquisition
Participants completed neuroimaging sessions at pretest andpost-test. First, children were acclimated to the MRI environ-ment and practiced lying still in a mock MRI scanner. Datawere then acquired on a 3 T Siemens MAGNETOM Trio Timscanner equipped for echo planar imaging (EPI; Siemens,Erlangen, Germany) with a 32-channel phased array head coil.First, an automated scout image was acquired, and shimmingprocedures were performed to optimize field homogeneity.Then a whole-head, high-resolution T1-weighted multiechoMPRAGE (Van Der Kouwe et al. 2008) structural image wasacquired using a protocol optimized for movement-prone pedi-atric populations (TR = 2530ms, TE = 1.64ms, FoV = 220mm,and flip angle = 7°); yielding 176 slices with 1-mm isotropic res-olution (Tisdall et al. 2012). All neuroimaging took place at theAthinoula A. Martinos Imaging Center at the McGovern
4 | Cerebral Cortex
Downloaded from https://academic.oup.com/cercor/advance-article-abstract/doi/10.1093/cercor/bhx131/3862191by Harvard Law School Library useron 22 January 2018

Institute for Brain Research, at the Massachusetts Institute ofTechnology.
Assessment Timeline
Behavioral testing and MRI scanning took place on 2 separatedays to avoid child fatigue. All pretest behavioral assessmentsoccurred within the 5 weeks prior to the start of the interven-tion (M = 18 days prior to start of intervention, SD = 12 days).Given constraints of MRI availability during early summer,baseline neuroimaging occurred over a longer timespan withinthe 10 weeks prior to the start of intervention (M = 39 days priorto start of intervention, SD = 19 days). There were no differ-ences in the timing of pretest assessments or scanningbetween intervention and control groups [t(59) = 0.82, P > 0.4]nor was there a relationship with any demographic variable (all|r| < 0.19, all P > 0.14). Similarly, all post-test assessments (bothbehavioral and MRI scanning) occurred within the 6 weeksimmediately following the conclusion of the intervention(behavioral: M = 15 days after intervention conclusion, SD = 8days; MRI: M = 11 days after intervention conclusion, SD = 8days). The average time difference between pre and postbehavioral assessments was 2.16 months (SD = 0.32), and theaverage time difference between pre- and post-MRI scanningwas 2.71 months (SD = 0.69). Again, there was no relationshipbetween date of post-testing and any demographic variable (all|r| < 0.13, all P > 0.3). Unintentionally, intervention and controlgroups differed marginally in the timespan between interven-tion conclusion and post-test MRI scanning [t(56) = 1.99, P =0.052], although the average difference between groups wasonly 4.3 days (intervention group M = 11.4 days after conclu-sion; control group M = 15.7 days after conclusion), which is anegligible amount of time for confounding cortical changes tooccur. However, to ensure correction for potential timing differ-ences, the time interval between intervention conclusion andpostscanning was added as a nuisance variable to betweengroup longitudinal cortical thickness analysis, which did notaffect results.
Behavioral Analyses
Change scores were computed individually for each of the 4assessments chosen a priori as outcome measures. Additionally,a composite change score was computed subtracting the aver-age pretest standard score from the average post-test standardscore. Repeated measures ANOVAs were used to determine thegroup effect of the reading intervention, and multiple regres-sions were used to determine which participant-level factorswere associated with treatment response.
Structural Image Analyses
T1-weighted images were visually inspected for image quality.Two trained observers, who were blind to participant SES andbehavioral measures, rated each image on a scale of 1 (perfect)to 5 (unusable) based on a visual guide of artifacts associatedwith motion created in-house. If ratings differed, the 2 obser-vers discussed their ratings until a consensus was reached.Three participants were excluded from pretest neuroimaginganalyses because of poor image quality (pretest n = 62), and 6additional participants (3 from each assigned group) had unus-able images at post-test. The remaining 55 participants [19waiting control, 36 intervention (18 each treatment responders/nonresponders)] had images of equivalent quality at both time
points, which is necessary for accurate measurement of corticalchanges. Quality ratings were not correlated with SES, anybehavioral measures, or intervention group (all P > 0.2).
Cortical reconstruction was conducted with FreeSurferVersion 5.3.0 (Fischl 2012). First, a semi-automated processingstream (recon-all) with default parameters completed motionand intensity correction, surface-based registration, spatialsmoothing, subcortical segmentation, and parcellation of corti-cal white and gray matter boundaries. Pial and white mattersurfaces were then manually edited as needed. An observerblind to participant SES and behavioral measures confirmedthe accuracy of the final surfaces.
All T1 images from both time points were resampled to astandard brain (fsaverage) and smoothed with a 10-mm full-width half-maximum kernel. Cortical thickness was defined ateach location as the distance between the white and pial sur-faces (Dale et al. 1999; Fischl and Dale 2000). To examine cross-sectional differences at the pretest time point, general linearmodels were constructed to test the whole brain for correla-tions between cortical thickness and SES, with participant gen-der and age as nuisance variables. Whole-brain analyses werecorrected for multiple comparisons using a Monte Carlo simu-lation with 10 000 repetitions and Bonferroni adjusted for bothhemispheres (cluster-forming P < 0.05, cluster-wise P < 0.05;Hagler et al. 2006). Volumetric analyses were conducted on the35 parcellations of the Desikan–Killiany Atlas (Desikan et al.2006) automatically segmented in FreeSurfer. All volumetricanalyses were controlled for gender, age, and estimated intra-cranial volume (ICV; Buckner et al. 2004) and Bonferroni-corrected for multiple comparisons.
Both T1 images from all participants with 2 usable imageswere processed with FreeSurfer’s longitudinal stream (Reuteret al. 2012). This process estimates average participant anat-omy by creating an unbiased within-participant template space(Reuter and Fischl 2011) using a robust, inverse consistent reg-istration (Reuter et al. 2010). After all templates were manuallyedited and checked (as above), information from both the tem-plates and individual T1 images were combined to calculatelongitudinal changes in individual anatomy, and surfaces wereagain resampled to a standard brain and smoothed with a 10-mm full-width half-maximum kernel. General linear modelswere constructed with symmetrized percent change (SPC) asthe dependent variable and controlled for gender. SPC is therate of change at each location with respect to the averagethickness across both time points. This approach is morerobust than rate of change or simple percent change, whichrefer to change only in terms of the first measurement.Whole-brain analyses were cluster-corrected for multiplecomparisons using a Monte Carlo simulation with 10 000repetitions and were Bonferroni adjusted for both hemi-spheres (cluster-forming P < .05, cluster-wise P < .05; Hagleret al. 2006).
ResultsRelation of SES to Behavioral Measures at Pretest
At pretest, participants scores on tests of phonological aware-ness, phonological memory, and rapid naming ranged fromaverage to below-average (Table 1). Single word and pseudo-word reading skills clustered at borderline low average to belowaverage scores. Higher SES correlated significantly with higherscores on vocabulary (PPVT-4, Pearson’s r = 0.37, P = 0.002) andmarginally with higher nonverbal cognitive ability scores
SES and Neuroanatomy in Reading Disability Romeo et al. | 5
Downloaded from https://academic.oup.com/cercor/advance-article-abstract/doi/10.1093/cercor/bhx131/3862191by Harvard Law School Library useron 22 January 2018

(KBIT-2, r = .023, P = 0.065), despite these mean standard scoresbeing within or above the average range. SES was not correlatedwith scores on any subtests assessing phonological awareness,phonological memory, or rapid naming (all |r| < 0.08, all P >0.50). Higher SES was only correlated with higher scores on oneof the 4 single-word reading subtests (WRMT-3 Word Attack:r = 0.26, P = 0.036; all other reading subtests r < 0.17, P > 0.2),and consequently was marginally correlated with higherreading-composite scores (r = 0.24, P = 0.05). Neither of theseSES-reading relationships retained significance when control-ling for KBIT-2 scores (both r < 0.2, both P > 0.1). In contrast,when controlling for reading scores, SES and vocabulary main-tained a relationship as strong as the zero-order correlation (r =0.36, P = 0.003).
Relation of SES to Cortical Thickness and ReadingScores at Pretest
Confirming our hypothesis, higher SES correlated significantlywith greater pretest cortical thickness in several clustersspanning both hemispheres (Fig. 1, Table 2). In the left hemi-sphere, these clusters included parts of (1) pars opercularis(the posterior portion of Broca’s area), (2) supramarginal andpostcentral regions, and (3) insula, transverse temporal gyrus,and superior and middle temporal regions. In the right hemi-sphere, significant clusters included (1) middle and superiortemporal regions, (2) surpramarginal and postcentral regions,(3) lateral occipital/fusiform regions, and (4) paracentralregions (Supplementary Fig. 1 for scatterplots by region).Nearly identical clusters emerged when additionally control-ling for composite reading score. While cortical thickness andSES showed significant associations, cortical thickness was
not correlated with any individual reading assessment scoresor the reading composite score.
Although the smallest by area, the left opercular cluster’scortical thickness exhibited the strongest correlation with SES(P = 10−6). Using the predefined cortical parcellations, higherSES also correlated significantly with greater volume of theentire left pars opercularis (lpOp, partial r = 0.33, P = 0.005).Given that SES was also strongly correlated with receptivevocabulary scores, we undertook a mediation analysis (Fig. 2).By adding lpOp to the regression model, the relationshipbetween SES and vocabulary scores was rendered insignificant,indicating a full mediation. To confirm, a bootstrapping methodwith 10 000 iterations (Hayes 2013) was employed. There was asignificant indirect effect of SES on vocabulary score throughlpOp volume, (indirect effect = 0.15, bootstrapped 95% CI [0.06,0.29], indirect/total effect = 0.37). This indicates that the volumeof the left pars opercularis could account for 37% of the totaleffect of SES on vocabulary scores.
Effect of Remediation Program on Reading Scores
When examining changes on behavioral assessments (i.e.,response to intervention), repeated measures ANOVAs revealedgroup by time-point interactions on the composite reading score(F[62,1] = 21.87, P < 0.001) and on 3 of the 4 reading subtests(meeting a Bonferroni-adjusted significance criterion), indicatinga benefit of the intervention (Table 3 and Fig. 3). These includeduntimed word reading (WRMT-3 Word Identification, F[62,1] =8.00, P = 0.006), untimed psedoword reading (WRMT-3 WordAttack, F[61,1] = 10.97, P = 0.002), and timed pseudoword reading(TOWRE-2 Phonemic Decoding Efficiency, F[56,1] = 12.27, P =0.001). Post hoc paired t-tests for all significant interactionsrevealed that children with RD who received intervention
Table 1 List of standardized assessments administered before intervention, participants’ average standard scores, and correlations with SES.Partial correlations between SES and reading scores control for standardized KBIT-2 scores.
Assessment M (SD) Zero-order correlation with SES Partial correlation with SES
Nonverbal cognitionKBIT-2 matrices 103.09 (14.05) r = 0.23*** N/A
Oral languagePPVT-4 (receptive vocabulary) 107.03 (12.50) r = 0.37** r = 0.32**
Phonological awarenessCTOPP elision 8.49 (2.02) r = 0.02 r = −0.02CTOPP blending words 10.12 (2.27) r = −0.08 r = −0.13
Phonological memoryCTOPP nonword repetition 7.92 (1.18) r = −0.02 r = −0.07CTOPP memory for digits 9.23 (2.33) r = 0.05 r = 0.02
Rapid automatized namingRAN/RAS objects 89.79 (13.65) r = 0.02 r = 0.07RAN/RAS letters 95.33 (11.49) r = 0.08 r = 0.09RAN/RAS 2-set letters and numbers 96.23 (11.90) r = −0.03 r = −0.04
Single word/nonword reading accuracyWRMT-3 word identification 85.11 (9.82) r = 0.13 r = 0.04WRMT-3 word attack 86.72 (11.69) r = 0.26* r = 0.15
Single word/nonword reading fluencyTOWRE-2 sight word efficiency 84.54 (10.67) r = 0.09 r = 0.05TOWRE-2 phonemic decoding efficiency 80.80 (9.89) r = 0.17 r = 0.11
Reading composite 84.08 (8.71) r = 0.24*** r = 0.19
Note: All assessments have a mean standard score of 100, with a standard deviation of 15, except CTOPP which has a mean scaled score of 10 and a standard devia-
tion of 3. KBIT-2 = Kaufman Brief Intelligence Test, second edition, PPVT-4 = Peabody Picture Vocabulary Test, fourth edition, CTOPP = Comprehensive Test of
Phonological Processing, RAN/RAS = Rapid Automatized Naming and Rapid Alternating Stimulus Tests, WRMT-3 = Woodcock Reading Mastery Test, third edition,
TOWRE-2 = Test of Word Reading Efficiency, second edition.
*P < 0.05, **P < 0.01, ***P < 0.1.
6 | Cerebral Cortex
Downloaded from https://academic.oup.com/cercor/advance-article-abstract/doi/10.1093/cercor/bhx131/3862191by Harvard Law School Library useron 22 January 2018

maintained their scores across time points (all P > 0.6), whilechildren with RD in the waiting control group significantlydeclined (all P < 0.001). Both groups declined on the TOWRE-2Sight Word Efficiency subtest (both P < 0.005). Overall, the rela-tive benefit of the intervention was expressed as maintenanceof scores for the intervention group relative to a loss of skillsfor the control group (see Christodoulou et al. 2017 for furtherinformation).
Differences Between Children Who Responded Moreor Less to Intervention
To examine variation within the intervention group, we classi-fied participants based on the change in composite scores(Fig. 4). Of the 39 participants who completed the intervention,approximately half had positive composite change scores(“responders”: n = 20, M = 4.28, SD = 3.41), indicating pre-to-post improvement, and half had negative composite changescores (“nonresponders”: n = 19, M = −4.91, SD = 4.74). For
comparison, the waiting control group had a mean changescore of −6.72 (SD = 4.02). Independent t-tests revealed thatnonresponders did not differ from waiting controls on pre-to-post change scores for the composite or any subtest (all P >0.17), whereas responders differed from both nonrespondersand waiting controls on all pre-to-post change scores withexception of the Sight Word Efficiency subtest from theTOWRE-2 (all P < 0.006; Table 3 and Fig. 3).
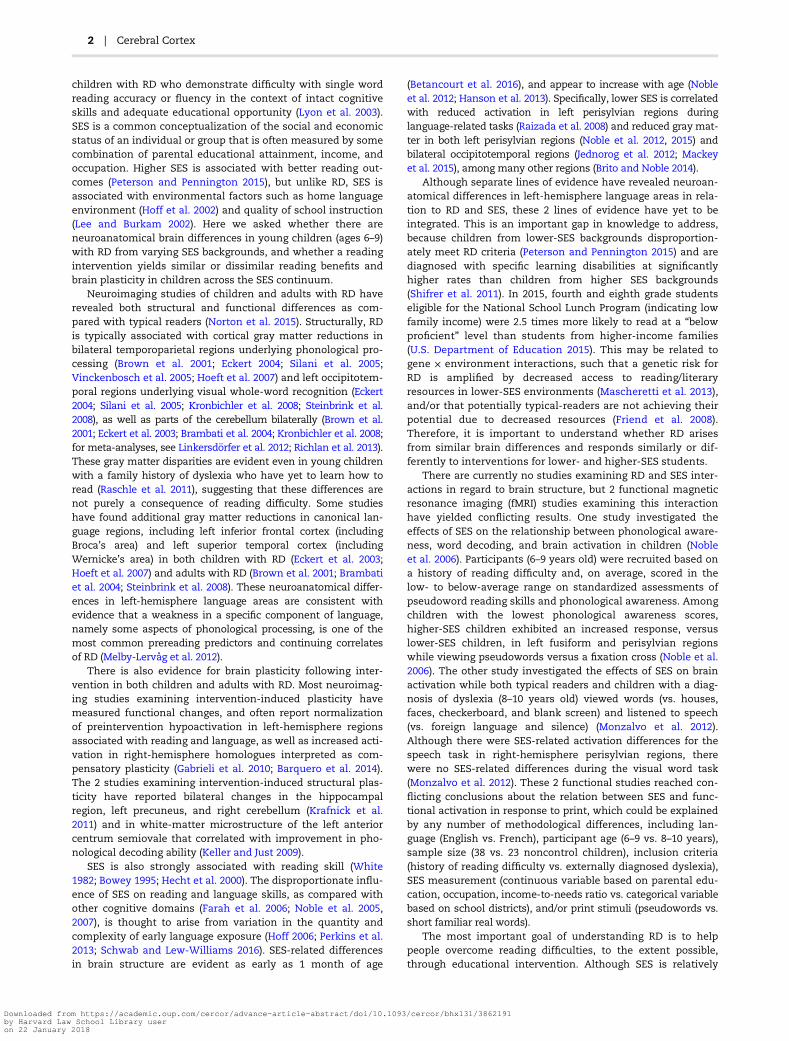
Contrary to our hypothesis, responders had a significantlylower SES (M = 39.9, SD = 12.7) than nonresponders (M = 51.2,SD = 11.1; t[37] = 2.96, P = 0.005; Fig. 5a). When children weredivided by median SES, 14 of the 20 responders were in thelower-SES half, and 13 of the 19 nonresponders were in thehigher-SES half [χ2(1, n = 39) = 5.76, P = .016]. Treatmentresponse was not significantly related to any other demo-graphic variable, including age, grade, gender, bilingualism,presence of an ADHD diagnosis and/or use of ADHD medica-tion, vocabulary scores, nonverbal cognitive ability scores,hours of intervention attendance, timing of pretest or post-test
Figure 1. Correlation between SES and cortical thickness, controlling for age and gender. Colored regions exhibited significantly thicker cortex with higher SES at base-
line. Outlines represent the cortical parcellations from the Desikan–Killiany gyral-based atlas.
Table 2 Regions where SES was significantly correlated with cortical thickness, controlling for age and gender
Region of cluster ApproximateBrodmann areas
Area ofcluster (mm2)
Peak significance(–log10 P)
Peak MNI coordinates Cluster-wise P
x y z
Left pars opercularis 44 916.13 6.262 −46.9 12.0 18.2 0.04547Left supramarginal +postcentral
40, 3, 1, 2 2581.86 4.782 −53.5 −42.4 45.6 0.00020
Left insula + superior/middle temporal
41, 42, 21, 22 1710.62 4.056 −36.1 −15.6 11.3 0.00020
Right middle/superiortemporal
21, 22 1927.57 4.134 56.0 1.1 −29.4 0.00020
Right supramarginal +postcentral
40, 3, 1, 2 2486.63 3.388 44.7 −17.7 20.0 0.00020
Right lateral occipital +fusiform
18, 19, 37 1526.07 3.042 35.2 −80.2 −12.0 0.00080
Right paracentral 4, 3, 1, 2 139 722 2.951 9.4 −32.3 51.4 0.02504
Note: MNI = Montreal Neurological Institute.
SES and Neuroanatomy in Reading Disability Romeo et al. | 7
Downloaded from https://academic.oup.com/cercor/advance-article-abstract/doi/10.1093/cercor/bhx131/3862191by Harvard Law School Library useron 22 January 2018

assessments, or whether participants met a low score or dis-crepancy inclusion criterion (all |t| < 1.4, all P > 0.17).
At baseline, responders also had significantly lower compos-ite reading scores than nonresponders [responders: M = 80.28,SD = 6.64; nonresponders: M = 87.54, SD = 10.01; t(37) = 2.68, P =0.01]. To control for the effect of baseline scores, a regressionanalysis was performed to examine the relative relations of allpotential predictive variables to intervention response. A modelincluding age, grade, gender, bilingual status, ADHD diagnosis,ADHD medication, which inclusion criterion was met, totalhours of intervention attendance, intervention site, SES, andRD severity (reverse of pretest composite score) revealed thatonly SES and RD severity were significant predictors of binary-coded improvement, with SES explaining 26% of the variance inimprovement (β = −0.019, P < 0.003;) and RD severity explaining14% of the variance in improvement (β = 0.022, P < 0.05).Removing all nonsignificant predictors yielded the same pat-tern (SES: β = −0.015, P = 0.01, R2 = 0.17; RD severity: β = 0.019,P = 0.02, R2 = 0.14), and these results held when using changescores as the dependent variable instead (Fig. 5b; SES: β =−0.164, P = 0.02, R2 = 0.14; RD severity: β = 0.248, P = 0.01, R2 =0.16). These findings indicate that both more severe RD and
lower SES, 2 risk factors, were independently associated withgreater response to intervention.
Analogous results were seen in pre-to-post cortical thick-ness changes. On average, there were no significant differencesin thickness changes between the intervention and waitingcontrol groups. However, there were large differences in thick-ness changes within the intervention group. Responders exhib-ited significantly greater thickening than nonrespondersbilaterally in several large clusters spanning (1) middle/inferiortemporal regions (extending into fusiform region on the right),(2) supramarginal/angular regions, (3) precentral regions, and(4) paracentral/posterior cingulate regions (Fig. 6 and Table 4,see Supplementary Fig. 2 for group differences by region). Anadditional cluster spanned a large portion of the right superiortemporal gyrus extending into insula. The greatest longitudinalbetween-group difference occurred in the left middle temporalcluster, where responders’ cortices thickened by an averageof 31 μm per month (1% gain), and nonresponders’ corticesthinned by an average of 11 μm per month (0.37% loss). Forcomparison, the waiting control group on average exhibited7 μm of thinning per month (0.26% loss) in this region, althoughthis thinning was not statistically significant. There were noclusters in which nonresponders exhibited greater thickeningor thinning than the waiting-control group. When the 3 partici-pant groups (responders, nonresponders, and controls) wereanalyzed separately, responders exhibited significant thicken-ing over most of the cortical surface, whereas nonrespondersand controls exhibited no regions of significant thickening orthinning.
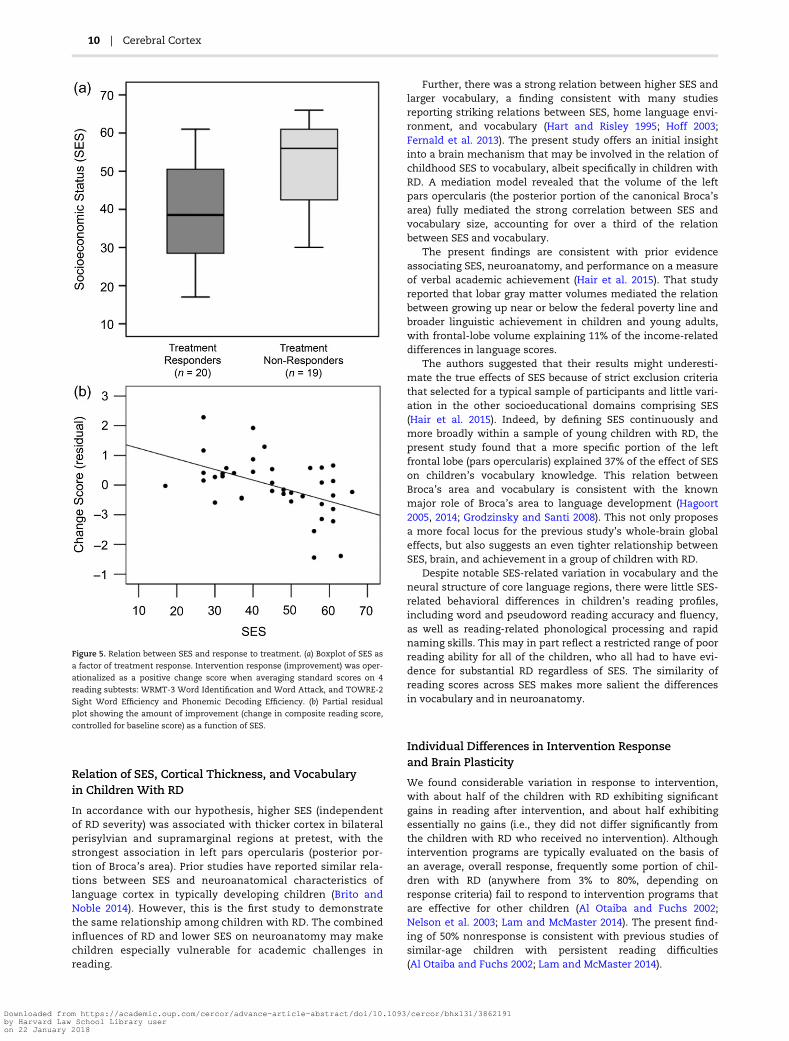
Also commensurate with behavioral results, lower SES andgreater RD severity were independently correlated with corticalthickening in neighboring but nonoverlapping regions. LowerSES (controlling for RD severity) correlated with greater thick-ening in the bilateral middle temporal and paracentral/cingu-late regions, as well as left precentral and right lateralorbitofrontal/pars orbitalis regions (Fig. 7, cool colors andTable 5). Greater RD severity (controlling for SES) correlatedwith greater thickening in a right lateral occipital cluster (Fig. 7,warm colors and Table 5). To further evaluate whether theapparent neuroanatomical dissociations in cortical thickeningrelated to lower SES and greater RD severity were independentas opposed to being secondary to statistical thresholding, weexamined in several main clusters the correlations between
Figure 2. Mediation model showing the effect of SES on vocabulary scores as
mediated by the volume of the left pars opercularis. Solid arrows represent
direct paths, whereas the dotted arrow represents the indirect (mediated) path.
β coefficients represent standardized regression coefficients. Each regression
controls for participant age and gender, and all models involving the left pars
opercularis (lpOp) also control for head size (estimated intracranial volume).
Thus, vocabulary is represented by raw scores on the “Peabody Picture
Vocabulary Test, 4th edition” (PPVT-4), to avoid adjusting for age twice. *P < 0.05,
**P < 0.01.
Table 3. Group means (and standard deviations) of reading assessment standard scores at post-test. All assessments have a mean standardscore of 100, with a standard deviation of 15. Change scores are post-test minus pretest scores, averaged across participants, with indicatedsignificance from paired t-tests. Word Identification and Word Attack are subtests of the “Woodcock Reading Mastery Test, 3rd edition”(WRMT-3). Sight Word Efficiency and Phonemic Decoding Efficiency are subtests of the “Test of Word Reading Efficiency, 2nd edition”(TOWRE-2). Reading Composite is the average of standard scores on all 4 subtests
Post-test assessment Waiting control(n = 25)
Interventiontotal (n = 39)
Interventionnonresponders (n = 19)
Interventionresponders (n = 20)
Word identification 80.08 (8.22) 84.69 (9.76) 84.32 (10.22) 85.05 (9.55)Change score −5.32 (6.26)*** −0.46 (6.97) −4.32 (5.38)** 3.20 (6.39)*
Word attack 79.96 (9.83) 87.67 (9.79) 87.16 (10.07) 88.15 (9.75)Change score −7.32 (8.61)*** 0.66 (9.81) −3.58 (9.34) 4.89 (8.52)*
Sight word efficiency 79.16 (11.28) 80.34 (12.79) 79.44 (14.09) 81.15 (11.81)Change score −5.48 (6.88)*** −4.32 (8.63)** −7.06 (8.17)** −1.85 (8.48)
Phonemic decoding eff. 73.35 (9.36) 79.87 (8.81) 78.44 (9.90) 81.15 (7.73)Change score −8.90 (6.12)*** −0.22 (10.37) −5.67 (9.66)* 4.95 (8.30)*
Reading composite 78.13 (8.53) 83.62 (8.55) 82.63 (9.33) 84.56 (7.86)Change score −6.72 (4.02)*** −0.20 (6.17) −4.91 (4.74)*** 4.28 (3.41)***
*P < 0.05, **P < 0.01, ***P < 0.001.
8 | Cerebral Cortex
Downloaded from https://academic.oup.com/cercor/advance-article-abstract/doi/10.1093/cercor/bhx131/3862191by Harvard Law School Library useron 22 January 2018

changes in cortical thickness and both baseline SES and RD.These analyses supported the conclusion that regional changesin cortical thickness were related distinctly to either SES or RD(Supplementary Fig. 3). There were no significant correlationsbetween thickness changes and SES or RD severity in the wait-ing control group.
DiscussionThe present study yielded 3 novel discoveries about the rela-tions between SES and RD, including behavioral and neuroan-atomical responses to reading intervention. First, among agroup of children with RD, higher SES was associated withthicker cortex in multiple neocortical regions, including bilat-eral perisylvian and supramarginal regions associated withlanguage and reading; this extends, for the first time, the well-documented SES–neuroanatomy relationship to children withRD. Moreover, the strongest correlation occurred in Broca’sarea in left inferior frontal cortex, the volume of which fullymediated the relationship between SES and vocabulary, com-monly known as the “vocabulary gap.” Second, whereas chil-dren who did not receive intervention or who did not respondto intervention exhibited no significant cortical changes, chil-dren who responded to intervention (i.e., whose readingimproved) exhibited pre-to-post thickening of cortex acrossbroad bilateral occipitotemporal and temporoparietal regions,most notably in the middle temporal gyri. Third, childrenfrom lower-SES families and children with more severe RDwere more likely to benefit from the intervention than chil-dren from higher-SES families or children with less severe RD,both behaviorally and neurally.
Figure 3. Pre-to-post changes in standard scores on reading composite and subtests and composite by group. Positive scores indicate a score increase, while negative
scores indicate a score decrease. “Intervention Total” combines intervention nonresponders and intervention responders. Reading Composite is the average of stan-
dard scores on all 4 subtests. Word Identification and Word Attack are subtests of the “Woodcock Reading Mastery Test, 3rd edition” (WRMT-3). Sight word efficiency
and phonemic decoding efficiency are subtests of the “Test of Word Reading Efficiency, 2nd edition” (TOWRE-2). Error bars represent standard errors. **P < 0.01.
Figure 4. Histogram of pre-to-post changes in the composite reading score for
all participants in the intervention group only (n = 39). Positive scores indicate a
score increase and classification as an intervention “Responder,” while negative
scores indicate a score decrease and classification as an intervention
“Nonresponder.”
SES and Neuroanatomy in Reading Disability Romeo et al. | 9
Downloaded from https://academic.oup.com/cercor/advance-article-abstract/doi/10.1093/cercor/bhx131/3862191by Harvard Law School Library useron 22 January 2018
Relation of SES, Cortical Thickness, and Vocabularyin Children With RD
In accordance with our hypothesis, higher SES (independentof RD severity) was associated with thicker cortex in bilateralperisylvian and supramarginal regions at pretest, with thestrongest association in left pars opercularis (posterior por-tion of Broca’s area). Prior studies have reported similar rela-tions between SES and neuroanatomical characteristics oflanguage cortex in typically developing children (Brito andNoble 2014). However, this is the first study to demonstratethe same relationship among children with RD. The combinedinfluences of RD and lower SES on neuroanatomy may makechildren especially vulnerable for academic challenges inreading.
Further, there was a strong relation between higher SES andlarger vocabulary, a finding consistent with many studiesreporting striking relations between SES, home language envi-ronment, and vocabulary (Hart and Risley 1995; Hoff 2003;Fernald et al. 2013). The present study offers an initial insightinto a brain mechanism that may be involved in the relation ofchildhood SES to vocabulary, albeit specifically in children withRD. A mediation model revealed that the volume of the leftpars opercularis (the posterior portion of the canonical Broca’sarea) fully mediated the strong correlation between SES andvocabulary size, accounting for over a third of the relationbetween SES and vocabulary.
The present findings are consistent with prior evidenceassociating SES, neuroanatomy, and performance on a measureof verbal academic achievement (Hair et al. 2015). That studyreported that lobar gray matter volumes mediated the relationbetween growing up near or below the federal poverty line andbroader linguistic achievement in children and young adults,with frontal-lobe volume explaining 11% of the income-relateddifferences in language scores.
The authors suggested that their results might underesti-mate the true effects of SES because of strict exclusion criteriathat selected for a typical sample of participants and little vari-ation in the other socioeducational domains comprising SES(Hair et al. 2015). Indeed, by defining SES continuously andmore broadly within a sample of young children with RD, thepresent study found that a more specific portion of the leftfrontal lobe (pars opercularis) explained 37% of the effect of SESon children’s vocabulary knowledge. This relation betweenBroca’s area and vocabulary is consistent with the knownmajor role of Broca’s area to language development (Hagoort2005, 2014; Grodzinsky and Santi 2008). This not only proposesa more focal locus for the previous study’s whole-brain globaleffects, but also suggests an even tighter relationship betweenSES, brain, and achievement in a group of children with RD.
Despite notable SES-related variation in vocabulary and theneural structure of core language regions, there were little SES-related behavioral differences in children’s reading profiles,including word and pseudoword reading accuracy and fluency,as well as reading-related phonological processing and rapidnaming skills. This may in part reflect a restricted range of poorreading ability for all of the children, who all had to have evi-dence for substantial RD regardless of SES. The similarity ofreading scores across SES makes more salient the differencesin vocabulary and in neuroanatomy.
Individual Differences in Intervention Responseand Brain Plasticity
We found considerable variation in response to intervention,with about half of the children with RD exhibiting significantgains in reading after intervention, and about half exhibitingessentially no gains (i.e., they did not differ significantly fromthe children with RD who received no intervention). Althoughintervention programs are typically evaluated on the basis ofan average, overall response, frequently some portion of chil-dren with RD (anywhere from 3% to 80%, depending onresponse criteria) fail to respond to intervention programs thatare effective for other children (Al Otaiba and Fuchs 2002;Nelson et al. 2003; Lam and McMaster 2014). The present find-ing of 50% nonresponse is consistent with previous studies ofsimilar-age children with persistent reading difficulties(Al Otaiba and Fuchs 2002; Lam and McMaster 2014).
Figure 5. Relation between SES and response to treatment. (a) Boxplot of SES as
a factor of treatment response. Intervention response (improvement) was oper-
ationalized as a positive change score when averaging standard scores on 4
reading subtests: WRMT-3 Word Identification and Word Attack, and TOWRE-2
Sight Word Efficiency and Phonemic Decoding Efficiency. (b) Partial residual
plot showing the amount of improvement (change in composite reading score,
controlled for baseline score) as a function of SES.
10 | Cerebral Cortex
Downloaded from https://academic.oup.com/cercor/advance-article-abstract/doi/10.1093/cercor/bhx131/3862191by Harvard Law School Library useron 22 January 2018

There were striking developmental differences in brain plas-ticity between the children with RD who did respond to theintervention versus the other 2 groups of children with RD whoeither did not respond to the intervention or who received nointervention. Responders exhibited greater cortical thickeningacross broad bilateral occipitotemporal and temporoparietalregions. The greatest group difference was evident in the mid-dle temporal gyrus, where responders’ cortices thickened by anaverage of 31 μm/month, and nonresponders’ and waiting con-trols’ cortices thinned by 11 and 7 μm/month, respectively. Forreference, this region thins by an average of 5 μm/month in typ-ically developing, similarly aged children (Sowell et al. 2004).This suggests that nonresponders and waiting controls exhib-ited a typical cortical trajectory of developmental thinning dur-ing this study, whereas children with RD who responded byimproving their reading exhibited a noteworthy thickening ofcortex.
Two other studies have examined neuroanatomical plastic-ity, one in gray matter and one in white matter, following read-ing intervention with children. Our left hemisphere findings
are consistent with a study that used the same “Seeing Stars”intervention in 11 children ages 7–11 years and found increasedgray matter volume in left occipitotemporal and medial parietalregions (Krafnick et al. 2011). Another study reported interven-tion related changes in white matter microstructure in childrenages 8–12 (Keller and Just 2009). A difference between the priorand present studies is that only the present study reports aspecific relation between individual differences in treatmentresponse and structural plasticity.
Several prior studies have reported functional brain differ-ences between individuals with RD who did or did not respondto intervention at either a single preintervention (Odegard et al.2008; Davis et al. 2011; Farris et al. 2011; Molfese et al. 2013) orpostintervention time point (Rezaie et al. 2011a, 2011b),although few have reported longitudinal neural changes. Onestudy using magnetic source imaging (MSI) found that respon-ders, but not nonresponders, exhibited increased duration ofactivity and a shift in activation timing in a broad left temporo-parietal region during a phonological decoding task, such thattheir neural profiles matched typical readers postintervention
Figure 6. Regions where treatment responders exhibited significantly greater cortical thickening versus treatment nonresponders following an intensive summer
intervention, controlling for gender. Outlines represent the cortical parcellations from the Desikan–Killiany gyral-based atlas.
Table 4. Regions exhibiting significant differences in cortical thickness changes between children whose reading scores improved after inter-vention versus children whose scores did not improve. Comparisons are controlled for age and gender.
Region of cluster ApproximateBrodmann areas
Area ofcluster (mm2)
Peak significance(–log10 P)
Peak MNI coordinates Cluster-wise P
x y z
Left middle/inferior temporal 21, 37 1548.41 5.359 −60.1 −29.2 −12.2 0.00020Left supramarginal 40 1401.52 3.035 −56.3 −24.6 27.5 0.00020Left precentral 4 691.94 3.070 −31.7 −12.9 57.6 0.01514Left paracentral + cingulate 4, 3, 1, 2, 31, 24 773.27 3.857 −7.5 −27.0 53.4 0.00619Right middle/inferior temporal + fusiform 21, 37, 19 3302.67 4.546 47.8 −59.7 3.1 0.00020Right supramarginal + angular 39, 40 926.53 3.490 59.0 −42.5 17.1 0.00140Right superior temporal + insula 22 1836.93 3.239 44.0 −33.7 −0.8 0.00020Right precentral 4 730.29 3.095 22.1 −10.1 53.0 0.01236Right paracentral + posterior cingulate 4, 3, 1, 2, 31 1544.20 4.753 7.4 −20.1 56.3 0.00020
Note: MNI = Montreal Neurological Institute.
SES and Neuroanatomy in Reading Disability Romeo et al. | 11
Downloaded from https://academic.oup.com/cercor/advance-article-abstract/doi/10.1093/cercor/bhx131/3862191by Harvard Law School Library useron 22 January 2018
(Simos et al. 2007). Another study used evoked response poten-tials (ERPs) during a German phonological lexical decision taskto compare functional plasticity between responders and non-responders (Hasko et al. 2014). Treatment responders, but notnonresponders, exhibited an increase in the post-test ampli-tude of the N400 component, thought to underlie orthographicprocessing. Although locating the source of ERP components isdifficult, the N400 is thought to arise from bilateral superior/middle temporal gyri and temporoparietal regions (Kutas andFedermeier 2011). Thus, the prior functional studies align withthe present structural study in suggesting that plasticity intemporoparietal regions distinguishes children with RD who doversus do not respond to specific interventions.
Relation of SES and RD Severity to InterventionResponse and Plasticity
Contrary to our hypotheses, both lower SES and greater RDseverity at baseline were independently associated with greater
response to intervention in regard to both reading ability andbrain plasticity. Importantly, because analysis models con-trolled for baseline reading scores, this result cannot solely beattributed to a regression-to-the-mean explanation. SES and RDseverity, however, appeared to have differential relationsbetween reading gains and structural plasticity, suggesting thatthe 2 factors influenced treatment response via cortical growthin different brain regions. Children from lower SES familiesexhibited greater thickening across broad bilateral occipitotem-poral regions, largely corresponding with the left hemispherereading network and its right hemisphere homologues.Children with more severe RD exhibited greater thickening in aright lateral occipital region that may provide compensatorysupport for the visual component of reading.
The finding that children with lower SES and more severeRD responded more strongly to this specific intervention is anotable difference from prior studies. Most reading interven-tion studies examining these factors have largely found thatlower-SES children (Torgesen et al. 1999; Hatcher et al. 2006;
Figure 7. Regions exhibiting significant correlations between changes in cortical thickness and SES (cool colors) or RD severity (warm colors) among all children who
received intervention, controlling for gender. Outlines represent the cortical parcellations from the Desikan–Killiany gyral-based atlas.
Table 5. Regions exhibiting significant correlations between changes in cortical thickness and SES (controlling for RD severity and gender) orwith RD severity (controlling for SES and gender) among all children who received intervention
Region of cluster ApproximateBrodmann areas
Area ofcluster (mm2)
Peak significance(–log10 P)
Peak MNIcoordinates
Cluster-wise P
x y z
Correlation with SES, controlling for RD severityLeft middle temporal (anterior) 21, 20 2705.29 −3.755 −64.5 −26.4 −14.8 0.00020Left middle temporal (posterior) 21, 20 623.14 −3.311 −60.6 −54.9 0.0 0.03017Left precentral 4 774.27 −3.783 −33.0 −18.2 39.3 0.00619Left posterior cingulate + paracentral 31, 4, 5, 3, 1, 2 611.57 −3.345 −6.4 −17.7 39.1 0.03469Right middle/superior temporal 21, 22 3913.28 −5.150 52.4 −24.5 −12.8 0.00020Right paracentral 11, 47 963.37 −3.770 8.4 −10.6 61.3 0.00060Right lateral orbitofrontal + pars orbitalis 4, 3, 1, 2 704.96 −3.671 37.5 30.0 −14.5 0.01732
Correlation with RD severity, controlling for SESRight lateral occipital 18, 19 726.64 −5.205 41.2 −73.2 −1.5 0.01276
Note: MNI = Montreal Neurological Institute.
12 | Cerebral Cortex
Downloaded from https://academic.oup.com/cercor/advance-article-abstract/doi/10.1093/cercor/bhx131/3862191by Harvard Law School Library useron 22 January 2018

Morris et al. 2012) and children with lower word-reading anddecoding skills (Hatcher et al. 2006; Vellutino et al. 2007;Compton et al. 2012) tended to exhibit a worse response tointerventions. However, these studies largely utilized in-schoolremediation programs focused on phonological awareness withshort instructional sessions distributed across many weeksduring the academic year, whereas the present study employedan intensive, short-term intervention with a small teacher tostudent ratio (1:3–5) during the nonacademic summer.
Several interpretations are possible for the greater effect ofthe intervention on lower-SES than higher-SES children withRD. One possibility concerns the nature of the present interven-tion; specifically, the pronounced focus on visual and ortho-graphic imagery. Given that lower-SES, above-average readersexhibit greater white matter tract coherence in the right infe-rior longitudinal fasciculus (Gullick et al. 2016), which supportsvisuospatial processing, it is possible that this visual approachstimulated greater neural plasticity in right hemisphere areas,and, in turn, a more positive treatment response. Another pos-sibility is that the combination of intervention intensity, dura-tion, and small group size (all of which predict greater responsefrequency (Denton 2012), was particularly potent for lower-SESchildren. A limitation on interpretation of these findings is thatthe waiting-control group served as a passive control condition,thus precluding the separate effects of intensive, small-groupattention and interaction from the specific academic content ofthe intervention.
In any case, another possible explanation concerns the tim-ing of the intervention. The particular benefits of the readingintervention during summer for the lower-SES children withRD may be related to evidence that lower-SES children in gen-eral are vulnerable to academic regression during the summer,a phenomenon known as “summer slump” or “summer slide.”During the summer months, lower-SES students tend to regressin their reading skills, while higher-SES students tend to main-tain or gain reading skills (Cooper et al. 1996; McCoach et al.2006; Alexander et al. 2007). This is frequently attributed todecreased access to books and reduced experiences with oremphasis on literacy in the homes of lower-SES children. Thusit is plausible that the present access to an intensive readingprogram provided the lower-SES children with precisely the lit-eracy access they would otherwise be missing, and presumablyhad missed in previous summers.
Finally, the better intervention response for lower-SES parti-cipants could be related to variations in RD etiology. Readingdeficits can occur for many reasons, and it is possible that theorigins of RDs could vary in relation to SES. Differences in envi-ronmental factors, such as home literacy, access to readingmaterial, and school quality may be responsible for systematicheterogeneity in the root cause of RD across children fromvarying SES (Ursache and Noble 2016). Consistent with this pos-sibility is the finding that higher-SES and lower-SES environ-ments interact differently with genetic factors related to RD(Friend et al. 2008; Mascheretti et al. 2013). A large study oftwins with reading difficulty revealed differences in the herita-bility of RD across SES, such that environmental factorsaccounted for more of the variance in reading deficits in chil-dren from lower-SES families than higher-SES families (Friendet al. 2008; but see Kirkpatrick et al. 2011 for conflicting find-ings). This raises the possibility that the neurobiological basesof RD could vary with SES. In such a case, environmentallydriven neurobiological differences in children from lower-SESfamilies may be more amenable to an (environmental) treatmentintervention. In contrast, genetically driven neurobiological
differences in children from higher-SES families may be moreresistant to treatment intervention. By this view, children withRD of varying SES could respond differently to interventions dueto variation in environmental versus genetic contributions to theetiologies of their behaviorally similar RD.
Several limitations of the present study are noted. One limi-tation involves the nonrandom treatment group assignment of15 participants, as a condition of school participation. Ideallyall participants would have been randomly assigned to thetreatment or control group, so that the postinterventionresponse can only be explained by the intervention itself. It is,however, unlikely that alternative participant characteristics(such as school or intervention site) contributed to eitherbetween-group or within-group treatment differences, becauseparticipants were similar across sites in their demographics,assessment scores, and treatment response. A second limita-tion is that we lacked information to characterize the quality ofschool reading instruction for all participants. On average, it islikely that lower-SES children may receive less high-qualityinstruction in lower performing schools, though this was notevaluated in our current study. In order to promote SES diver-sity of children in this study, the children attended a wide vari-ety of public, private, and public-charter schools from a largemetro region. Future studies may attempt to control for this byenrolling participants from a single school with a SES-diversepopulation, or characterizing the quality of reading instructionin diverse schools. Third, we could not dissociate potentiallyseparable effects of SES dimensions of parental education,parental occupation, and income on any outcomes. There isevidence for dissociations among these dimensions on bothbehavioral (Duncan and Magnuson 2012) and neural (Brito andNoble 2014) child outcomes. In our sample, parental education,parental occupation, and parental income were highly corre-lated, which precluded any dissociations. Future research withlarger, more diverse participant samples will be required tountangle these correlated dimensions of SES when consideringtreatment response in children with RD.
In summary, this study investigated how the brain structureof young students with RD varies by SES, and explored SES-related differences in their behavioral and neural response tointervention. Despite reduced cortical thickness in canonicallanguage regions at baseline, lower-SES children respondedmore favorably to an intensive summer reading invention thantheir higher-SES peers, both in terms of reading scores andstructural plasticity throughout the neural reading networks.Taken as a whole, this suggests that intensive summer readingintervention might be even more effective for these dually at-risk children.
Supplementary MaterialSupplementary material is available at Cerebral Cortex online.
FundingEllison Medical Foundation (to J.D.E.G.), the Halis FamilyFoundation (to J.D.E.G.), Lindamood-Bell Learning Processes(which supported the intervention) and the National Institutesof Health (T32-DC000038 and F31-HD086957 to R.R.R.).
NotesWe thank the participants and their families. We thank theAthinoula A. Martinos Imaging Center at the McGovern
SES and Neuroanatomy in Reading Disability Romeo et al. | 13
Downloaded from https://academic.oup.com/cercor/advance-article-abstract/doi/10.1093/cercor/bhx131/3862191by Harvard Law School Library useron 22 January 2018

Institute for Brain Research (MIT) and Atshusi Takahashi, SteveShannon, and Sheeba Arnold for data collection technical sup-port. We thank Allyson Mackey for assistance with corticalthickness analyses, and we thank Camila Caballero for com-ments on the manuscript. Conflict of Interest: None declared.
ReferencesAl Otaiba S, Fuchs D. 2002. Characteristics of children who are
unresponsive to early literacy intervention: a review of theliterature. Rem Spec Educ. 23:300–316.
Alexander KL, Entwisle DR, Linda SO. 2007. Lasting conse-quences of the summer learning gap. Am Sociol Rev. 72:167–180.
Bach S, Richardson U, Brandeis D, Martin E, Brem S. 2013. Print-specific multimodal brain activation in kindergartenimproves prediction of reading skills in second grade.Neuroimage. 82:605–615.
Barquero LA, Davis N, Cutting LE. 2014. Neuroimaging of read-ing intervention: a systematic review and activation likeli-hood estimate meta-analysis. PLoS One. 9:e83668.
Barratt W 2006. Barratt simplified measure of social status(BSMSS). Indiana State University.
Bell N. 2007. Seeing stars. San Luis Obispo, CA: Gander.Betancourt LM, Avants B, Farah MJ, Brodsky NL, Wu J, Ashtari
M, Hurt H. 2016. Effect of socioeconomic status (SES) dispar-ity on neural development in female African-Americaninfants at age 1 month. Dev Sci. 19(6):947–956.
Bowey JA. 1995. Socioeconomic status differences in preschoolphonological sensitivity and first-grade reading achieve-ment. J Educ Psychol. 87:476–487.
Brambati SM, Termine C, Ruffino M, Stella G, Fazio F, Cappa SF,Perani D. 2004. Regional reductions of gray matter volume infamilial dyslexia. Neurology. 63:742–745.
Brito NH, Noble KG. 2014. Socioeconomic status and structuralbrain development. Front Neurosci. 8:276.
Brown WE, Eliez S, Menon V, Rumsey JM, White CD, Reiss AL.2001. Preliminary evidence of widespread morphologicalvariations of the brain in dyslexia. Neurology. 56:781–783.
Buckner RL, Head D, Parker J, Fotenos AF, Marcus D, Morris JC,Snyder AZ. 2004. A unified approach for morphometric andfunctional data analysis in young, old, and demented adultsusing automated atlas-based head size normalization: reli-ability and validation against manual measurement of totalintracranial volume. Neuroimage. 23:724–38.
Christodoulou JA, Cyr A, Murtagh J, Chang P, Lin J, Guarino AJ,Hook P, Gabrieli JD. 2017. Impact of intensive summer read-ing intervention for children with reading disabilities anddifficulties in early elementary school. J Learn Disabil. 50(2):115–127.
Compton DL, Gilbert JK, Jenkins JR, Fuchs D, Fuchs LS, Cho E,Barquero LA, Bouton B. 2012. Accelerating chronically unre-sponsive children to tier 3 instruction: what level of data isnecessary to ensure selection accuracy? J Learn Disabil. 45:204–216.
Cooper H, Nye B, Charlton K, Lindsay J, Greathouse S. 1996. Theeffects of summer vacation on achievement test scores: anarrative and meta-analytic review. Rev Educ Res. 66:227–268.
Dale AM, Fischl B, Sereno MI. 1999. Cortical surface-based anal-ysis. I. Segmentation and surface reconstruction. Neuroimage.9:179–194.
Davis N, Barquero L, Compton DL, Fuchs LS, Fuchs D, Gore JC,Anderson AW. 2011. Functional correlates of children’s
responsiveness to intervention. Dev Neuropsychol. 36:288–301.
Denton CA. 2012. Response to intervention for reading difficul-ties in the primary grades: some answers and lingeringquestions. J Learn Disabil. 45:232–243.
Desikan RS, Segonne F, Fischl B, Quinn BT, Dickerson BC,Blacker D, Buckner RL, Dale AM, Maguire RP, Hyman BT,et al. 2006. An automated labeling system for subdividingthe human cerebral cortex on MRI scans into gyral basedregions of interest. Neuroimage. 31:968–980.
Duncan GJ, Magnuson K. 2012. Socioeconomic status and cogni-tive functioning: moving from correlation to causation.WIREs Cogn Sci. 3:377–386.
Dunn LM, Dunn DM. 2007. Peabody picture vocabulary test. 4thed. Bloomington, MN: NCS Pearson Inc.
Eckert MA. 2004. Neuroanatomical markers for dyslexia: areview of dyslexia structural imaging studies.Neuroscientist. 10:362–371.
Eckert MA, Leonard CM, Richards TL, Aylward EH, Thomson J,Berninger VW. 2003. Anatomical correlates of dyslexia: fron-tal and cerebellar findings. Brain. 126:482–494.
Ensminger ME, Fothergill K. 2003. A decade of measuring SES:what it tells us and where to go from here. In: Bradley MH,Bornstein RH, editors. Socioeconomic status, parenting, andchild development. Mahwah, NJ: Lawrence ErlbaumAssociates. p. 13–27.
Farah MJ, Shera DM, Savage JH, Betancourt L, Giannetta JM,Brodsky NL, Malmud EK, Hurt H. 2006. Childhood poverty:specific associations with neurocognitive development.Brain Res. 1110:166–174.
Farris EA, Odegard TN, Miller HL, Ring J, Allen G, Black J. 2011.Functional connectivity between the left and right inferiorfrontal lobes in a small sample of children with and withoutreading difficulties. Neurocase. 17:425–439.
Fernald A, Marchman VA, Weisleder A. 2013. SES differences inlanguage processing skill and vocabulary are evident at 18months. Dev Sci. 16:234–248.
Fischl B. 2012. FreeSurfer. Neuroimage. 62:774–781.Fischl B, Dale AM. 2000. Measuring the thickness of the human
cerebral cortex from magnetic resonance images. Proc NatlAcad Sci USA. 97:11050–11055.
Friend A, DeFries JC, Olson RK. 2008. Parental education moder-ates genetic influences on reading disability. Psychol Sci. 19:1124–1130.
Gabrieli JD, Christodoulou JA, O’Loughlin T, Eddy MD. 2010. Thereading brain: cognitive neuroscience of reading developmentand difficulty. In: Sousa DA, editor. Mind, brain, & education:neuroscience implications for the classroom. Bloomington, IN:Solution Tree. p. 113–138.
Germano E, Gagliano A, Curatolo P. 2010. Comorbidity of ADHDand dyslexia. Dev Neuropsychol. 35:475–493.
Good RH, Kaminski RAE. 2002. Dynamic indicators of basic early lit-eracy skills Eugene, OR: Institute for the Development ofEducational Achievement.
Grodzinsky Y, Santi A. 2008. The battle for Broca’s region.Trends Cogn Sci. 12:474–480.
Gullick MM, Demir-Lira OE, Booth JR. 2016. Reading skill-fractionalanisotropy relationships in visuospatial tracts diverge depend-ing on socioeconomic status. Dev Sci. 19:673–685.
Hagler DJ Jr., Saygin AP, Sereno MI. 2006. Smoothing and clusterthresholding for cortical surface-based group analysis offMRI data. Neuroimage. 33:1093–1103.
Hagoort P. 2005. On Broca, brain, and binding: a new frame-work. Trends Cogn Sci. 9:416–423.
14 | Cerebral Cortex
Downloaded from https://academic.oup.com/cercor/advance-article-abstract/doi/10.1093/cercor/bhx131/3862191by Harvard Law School Library useron 22 January 2018
Hagoort P. 2014. Nodes and networks in the neural architecturefor language: Broca’s region and beyond. Curr OpinNeurobiol. 28:136–141.
Hair NL, Hanson JL, Wolfe BL, Pollak SD. 2015. Association ofchild poverty, brain development, and academic achieve-ment. JAMA Pediatr. 169:822–829.
Hanson JL, Hair N, Shen DG, Shi F, Gilmore JH, Wolfe BL, PollakSD. 2013. Family poverty affects the rate of human infantbrain growth. PLoS One. 8:e80954.
Hart B, Risley T. 1995. Meaningful differences in the everydayexperience of young American children. Baltimore: P.H.Brookes.
Hasko S, Groth K, Bruder J, Bartling J, Schulte-Korne G. 2014.What does the brain of children with developmental dys-lexia tell us about reading improvement? ERP evidence froman intervention study. Front Hum Neurosci. 8:441.
Hatcher PJ, Hulme C, Miles JN, Carroll JM, Hatcher J, Gibbs S,Smith G, Bowyer-Crane C, Snowling MJ. 2006. Efficacy ofsmall group reading intervention for beginning readers withreading-delay: a randomised controlled trial. J Child PsycholPsychiatry. 47:820–827.
Hayes AF. 2013. Introduction to mediation, moderation, andconditional process analysis: a regression-based approach.New York, NY: The Guilford Press.
Hecht SA, Burgess SR, Torgesen JK, Wagner RK, Rashotte CA.2000. Explaining social class differences in growth of readingskills from beginning kindergarten through fourth-grade:the role of phonological awareness, rate of access, and printknowledge. Read Writ. 12:99–127.
Hoeft F, Meyler A, Hernandez A, Juel C, Taylor-Hill H,Martindale JL, McMillon G, Kolchugina G, Black JM, Faizi A,et al. 2007. Functional and morphometric brain dissociationbetween dyslexia and reading ability. Proc Natl Acad SciUSA. 104:4234–4239.
Hoff E. 2003. The specificity of environmental influence: socio-economic status affects early vocabulary development viamaternal speech. Child Dev. 74:1368–1378.
Hoff E. 2006. How social contexts support and shape languagedevelopment. Dev Rev. 26:55–88.
Hoff E, Laursen B, Tardif T. 2002. Socioeconomic status and par-enting. In: Bornstein MH, editor. Handbook of parenting,Vol. 2: Biology and ecology of parenting. 2nd ed.. Mahway,NJ: Lawrence Erlbaum Associates. p. 231–252.
Jednorog K, Altarelli I, Monzalvo K, Fluss J, Dubois J, Billard C,Dehaene-Lambertz G, Ramus F. 2012. The influence of socio-economic status on children’s brain structure. PLoS One. 7:e42486.
Kaufman AS, Kaufman NL. 2004. Kaufman brief intelligencetest. 2nd ed. Minneapolis, MN: Pearson.
Keller TA, Just MA. 2009. Altering cortical connectivity:remediation-induced changes in the white matter of poorreaders. Neuron. 64:624–631.
Kirkpatrick RM, Legrand LN, Iacono WG, Mcgue M. 2011. A twinand adoption study of reading achievement: Exploration ofshared-environmental and gene-environment-interactioneffects. Learn Individ Differ. 21:368–375.
Krafnick AJ, Flowers DL, Napoliello EM, Eden GF. 2011. Graymatter volume changes following reading intervention indyslexic children. Neuroimage. 57:733–741.
Kronbichler M, Wimmer H, Staffen W, Hutzler F, Mair A,Ladurner G. 2008. Developmental dyslexia: gray matterabnormalities in the occipitotemporal cortex. Hum BrainMapp. 29:613–625.
Kutas M, Federmeier KD. 2011. Thirty years and counting: find-ing meaning in the N400 component of the event relatedbrain potential (ERP). Annu Rev Psychol. 62:621–647.
Lam EA, McMaster KL. 2014. Predictors of responsiveness toearly literacy intervention: a 10-year update. LearnDisability Q. 37:134–147.
Lee VE, Burkam DT. 2002. Social disadvantage and school qual-ity. Inequality at the starting gate: Social background differ-ences in achievement as children begin school, Chapter 4.Washington, DC: Economic Policy Institute.
Linkersdörfer J, Lonnemann J, Lindberg S, Hasselhorn M,Fiebach CJ. 2012. Grey matter alterations co-localize withfunctional abnormalities in developmental dyslexia: an ALEmeta-analysis. Plos One. 7:e43122.
Lyon GR, Shaywitz SE, Shaywitz BA. 2003. A definition of dys-lexia. Ann Dyslexia. 53:1–14.
Mackey AP, Finn AS, Leonard JA, Jacoby-Senghor DS, West MR,Gabrieli CF, Gabrieli JD. 2015. Neuroanatomical correlates ofthe income-achievement gap. Psychol Sci. 26:925–933.
Mascheretti S, Bureau A, Battaglia M, Simone D, Quadrelli E,Croteau J, Cellino MR, Giorda R, Beri S, Maziade M, et al.2013. An assessment of gene-by-environment interactionsin developmental dyslexia-related phenotypes. Genes BrainBehav. 12:47–55.
McCoach DB, O’Connell AA, Reis SM, Levitt HA. 2006. Growingreaders: a hierarchical linear model of children’s readinggrowth during the first 2 years of school. J Educ Psychol. 98:14–28.
Melby-Lervåg M, Lyster S-AH, Hulme C. 2012. Phonological skillsand their role in learning to read: a meta-analytic review.Psychol Bull. 138:322–352.
Mercy JA, Steelman LC. 1982. Familial influence on the intellec-tual attainment of children. Am Sociol Rev. 47:532–542.
Molfese PJ, Fletcher JM, Denton CA. 2013. Adequate versusinadequate response to reading intervention: an event-related potentials assessment. Dev Neuropsychol. 38:534–549.
Monzalvo K, Fluss J, Billard C, Dehaene S, Dehaene-Lambertz G.2012. Cortical networks for vision and language in dyslexicand normal children of variable socio-economic status.Neuroimage. 61:258–274.
Morris RD, Lovett MW, Wolf M, Sevcik RA, Steinbach KA,Frijters JC, Shapiro MB. 2012. Multiple-component remedia-tion for developmental reading disabilities: IQ, socioeco-nomic status, and race as factors in remedial outcome.J Learn Disabil. 45:99–127.
Nelson JR, Benner GJ, Gonzalez J. 2003. Learner characteristicsthat Influence the treatment effectiveness of early literacyinterventions: a meta-analytic review. Learn Disabil ResPract. 18:255–267.
Noble KG, Farah MJ, McCandliss BD. 2006. Socioeconomic back-ground modulates cognition-achievement relationships inreading. Cogn Dev. 21:349–368.
Noble KG, Houston SM, Brito NH, Bartsch H, Kan E, KupermanJM, Akshoomoff N, Amaral DG, Bloss CS, Libiger O, et al.2015. Family income, parental education and brain structurein children and adolescents. Nat Neurosci. 18:773–778.
Noble KG, Houston SM, Kan E, Sowell ER. 2012. Neural corre-lates of socioeconomic status in the developing humanbrain. Dev Sci. 15:516–527.
Noble KG, McCandliss BD, Farah MJ. 2007. Socioeconomic gradi-ents predict individual differences in neurocognitive abili-ties. Dev Sci. 10:464–480.
SES and Neuroanatomy in Reading Disability Romeo et al. | 15
Downloaded from https://academic.oup.com/cercor/advance-article-abstract/doi/10.1093/cercor/bhx131/3862191by Harvard Law School Library useron 22 January 2018
Noble KG, Norman MF, Farah MJ. 2005. Neurocognitive corre-lates of socioeconomic status in kindergarten children. DevSci. 8:74–87.
Norton ES, Beach SD, Gabrieli JDE. 2015. Neurobiology of dys-lexia. Curr Opin Neurobiol. 30:73–78.
Odegard TN, Ring J, Smith S, Biggan J, Black J. 2008.Differentiating the neural response to intervention in chil-dren with developmental dyslexia. Ann Dyslexia. 58:1–14.
Perkins SC, Finegood ED, Swain JE. 2013. Poverty and languagedevelopment: roles of parenting and stress. Innov ClinNeurosci. 10:10–19.
Peterson RL, Pennington BF. 2015. Developmental dyslexia.Annu Rev Clin Psychol. 11:283–307.
Raizada RD, Richards TL, Meltzoff A, Kuhl PK. 2008. Socioeconomicstatus predicts hemispheric specialisation of the left inferiorfrontal gyrus in young children. Neuroimage. 40:1392–1401.
Raschle NM, Chang M, Gaab N. 2011. Structural brain altera-tions associated with dyslexia predate reading onset.Neuroimage. 57:742–749.
Reuter M, Fischl B. 2011. Avoiding asymmetry-induced bias inlongitudinal image processing. Neuroimage. 57:19–21.
Reuter M, Rosas HD, Fischl B. 2010. Highly accurate inverse con-sistent registration: a robust approach. NeuroImage. 53:1181–1196.
Reuter M, Schmansky NJ, Rosas HD, Fischl B. 2012. Within-subject template estimation for unbiased longitudinal imageanalysis. Neuroimage. 61:1402–1418.
Rezaie R, Simos PG, Fletcher JM, Cirino PT, Vaughn S,Papanicolaou AC. 2011a. Engagement of temporal loberegions predicts response to educational interventions inadolescent struggling readers. Dev Neuropsychol. 36:869–888.
Rezaie R, Simos PG, Fletcher JM, Cirino PT, Vaughn S,Papanicolaou AC. 2011b. Temporo-parietal brain activity asa longitudinal predictor of response to educational interven-tions among middle school struggling readers. J IntNeuropsychol Soc. 17:875–885.
Richlan F, Kronbichler M, Wimmer H. 2013. Structural abnormal-ities in the dyslexic brain: a meta-analysis of voxel-basedmorphometry studies. Hum Brain Mapp. 34:3055–3065.
Schwab JF, Lew-Williams C. 2016. Language learning, socioeco-nomic status, and child-directed speech. Wiley InterdiscipRev Cogn Sci. 7:264–275.
Shaywitz SE. 1998. Dyslexia. New Engl J Med. 338:307–312.Shaywitz SE, Morris R, Shaywitz BA. 2008. The education of dys-
lexic children from childhood to young adulthood. AnnuRev Psychol. 59:451–475.
Shifrer D, Muller C, Callahan R. 2011. Disproportionality andlearning disabilities: parsing apart race, socioeconomic sta-tus, and language. J Learn Disabil. 44:246–257.
Silani G, Frith U, Demonet JF, Fazio F, Perani D, Price C, FrithCD, Paulesu E. 2005. Brain abnormalities underlying alteredactivation in dyslexia: a voxel based morphometry study.Brain. 128:2453–2461.
Simos PG, Fletcher JM, Sarkari S, Billingsley RL, Denton C,Papanicolaou AC. 2007. Altering the brain circuits for read-ing through intervention: a magnetic source imaging study.Neuropsychology. 21:485–496.
Sowell ER, Thompson PM, Leonard CM, Welcome SE, Kan E,Toga AW. 2004. Longitudinal mapping of cortical thicknessand brain growth in normal children. J Neurosci. 24:8223–8231.
Steinbrink C, Vogt K, Kastrup A, Müller HP, Juengling FD,Kassubek J, Riecker A. 2008. The contribution of white andgray matter differences to developmental dyslexia: insightsfrom DTI and VBM at 3.0 T. Neuropsychologia. 46:3170–3178.
Tisdall MD, Hess AT, Reuter M, Meintjes EM, Fischl B, van derKouwe AJ. 2012. Volumetric navigators for prospectivemotion correction and selective reacquisition in neuroana-tomical MRI. Magn Reson Med. 68:389–399.
Torgesen JK, Wagner R, Rashotte C. 2012. Test of word readingefficiency. 2nd ed.. Austin, TX: PRO-ED.
Torgesen JK, Wagner RK, Rashotte CA, Rose E, Lindamood P,Conway T, Garvan C. 1999. Preventing reading failure inyoung children with phonological processing disabilities:Group and individual responses to instruction. J EducPsychol. 91:579–593.
Tucker-Drob EM, Bates TC. 2016. Large cross-national differ-ences in gene x socioeconomic status interaction on intelli-gence. Psychol Sci. 27:138–149.
Ursache A, Noble KG. 2016. Neurocognitive development insocioeconomic context: multiple mechanisms and implica-tions for measuring socioeconomic status. Psychophysiology.53:71–82.
U.S. Department of Education. 2015. Institute of EducationSciences, National Center for Education Statistics. Nationalassessment of educational progress (NAEP).
van der Kouwe AJ, Benner T, Salat DH, Fischl B. 2008. Brainmorphometry with multiecho MPRAGE. Neuroimage. 40:559–569.
Vellutino FR, Scanlon DM, Zhang H, Schatschneider C. 2007.Using response to kindergarten and first grade interventionto identify children at-risk for long-term reading difficulties.Read Writ. 21:437–480.
Vinckenbosch E, Robichon F, Eliez S. 2005. Gray matter alter-ation in dyslexia: converging evidence from volumetric andvoxel-by-voxel MRI analyses. Neuropsychologia. 43:324–331.
Wagner R, Torgesen JK, Rashotte C. 1999. Comprehensive testof phonological processing. Austin, TX: PRO-ED.
White KR. 1982. The relation between socioeconomic statusand academic achievement. Psychol Bull. 91:461–481.
Wolf M, Denckla MB. 2005. Rapid automatized naming andrapid alternating stimulus tests (RAN/RAS). Austin, TX:PRO-ED.
Woodcock RW. 2011. Woodcock reading mastery tests. 4th ed.Minneapolis, MN: Pearson.
16 | Cerebral Cortex
Downloaded from https://academic.oup.com/cercor/advance-article-abstract/doi/10.1093/cercor/bhx131/3862191by Harvard Law School Library useron 22 January 2018