Embed Size (px)
Citation preview
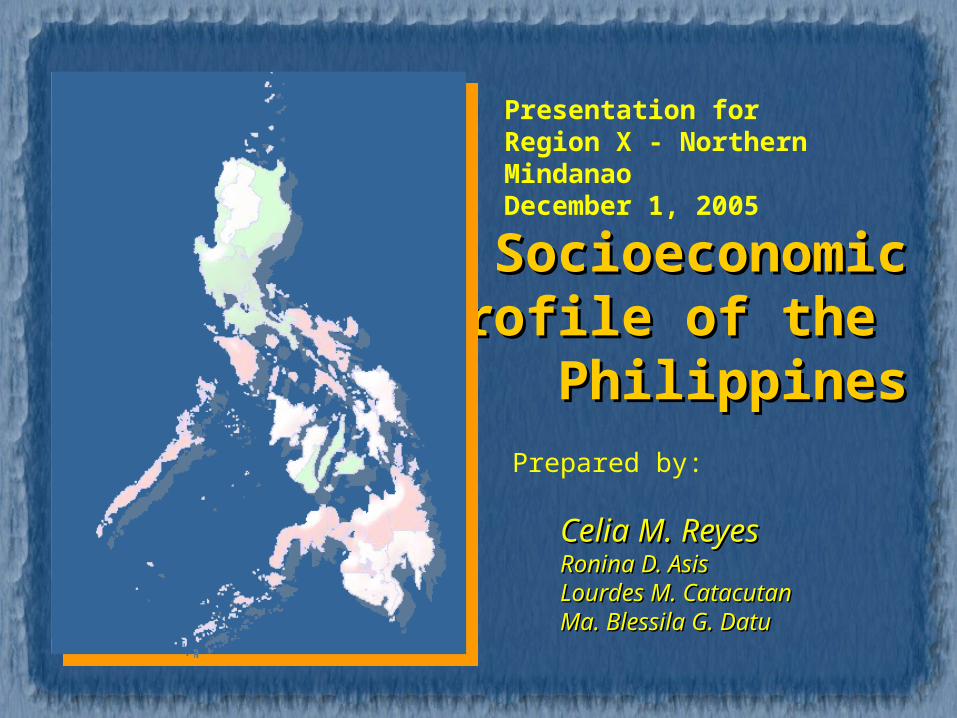
SocioeconomicSocioeconomicProfile of the Profile of the
PhilippinesPhilippinesPrepared by:
Celia M. ReyesCelia M. ReyesRonina D. AsisRonina D. AsisLourdes M. Lourdes M. CatacutanCatacutanMa. Blessila G. DatuMa. Blessila G. Datu
Presentation for Region X - Northern MindanaoDecember 1, 2005
OutlineOutline
Objectives Profile Decomposition of poverty Summary
Objective of the PresentationObjective of the Presentation
Present the poverty profile using the PIDS online database
List of IndicatorsList of Indicators
Poverty Incidence Magnitude of Poor Subsistence Incidence GDP Growth Rate Population Population Density Unemployment Rate Access to Safe Water Access to Sanitary Toilet Facilities Access to Electricity
List of IndicatorsList of Indicators
Proportion of Families living in Makeshift Housing Materials
Infant Mortality Prevalence of Malnutrition among 0-5 Year-
old Children, 2001 (International Standard) Elementary Participation Rate Secondary Participation Rate Elementary Cohort Survival Rate Secondary Cohort Survival Rate Functional Literacy Rate
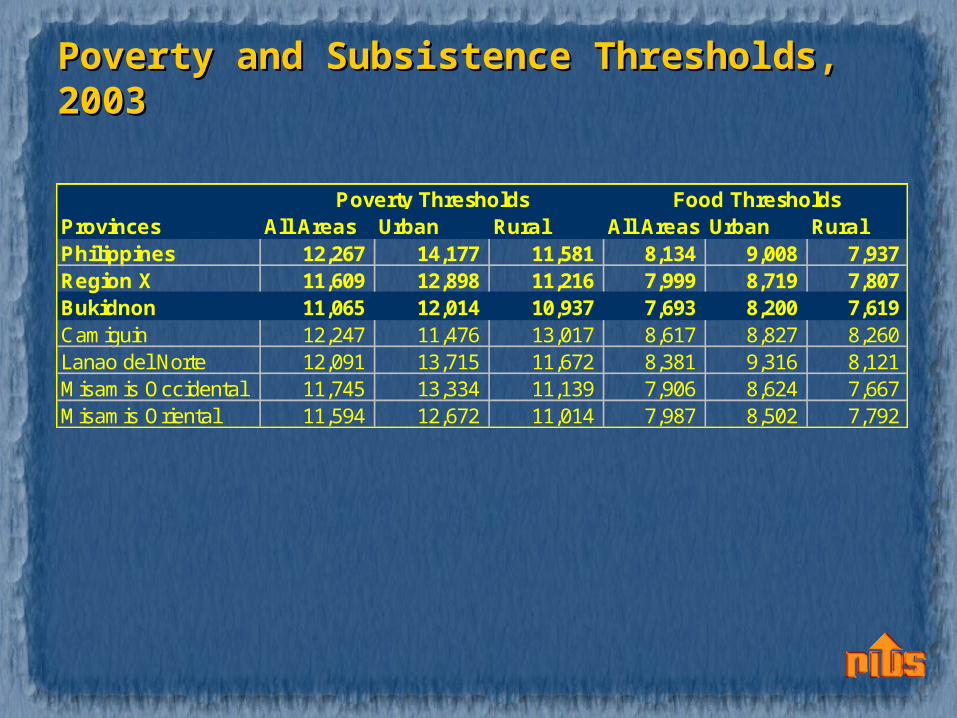
Poverty and Subsistence Thresholds, Poverty and Subsistence Thresholds, 20032003
Provinces All Areas Urban Rural All Areas Urban RuralPhilippines 12,267 14,177 11,581 8,134 9,008 7,937 Region X 11,609 12,898 11,216 7,999 8,719 7,807 Bukidnon 11,065 12,014 10,937 7,693 8,200 7,619 Camiguin 12,247 11,476 13,017 8,617 8,827 8,260 Lanao del Norte 12,091 13,715 11,672 8,381 9,316 8,121 Misamis Occidental 11,745 13,334 11,139 7,906 8,624 7,667 Misamis Oriental 11,594 12,672 11,014 7,987 8,502 7,792
Poverty Thresholds Food Thresholds
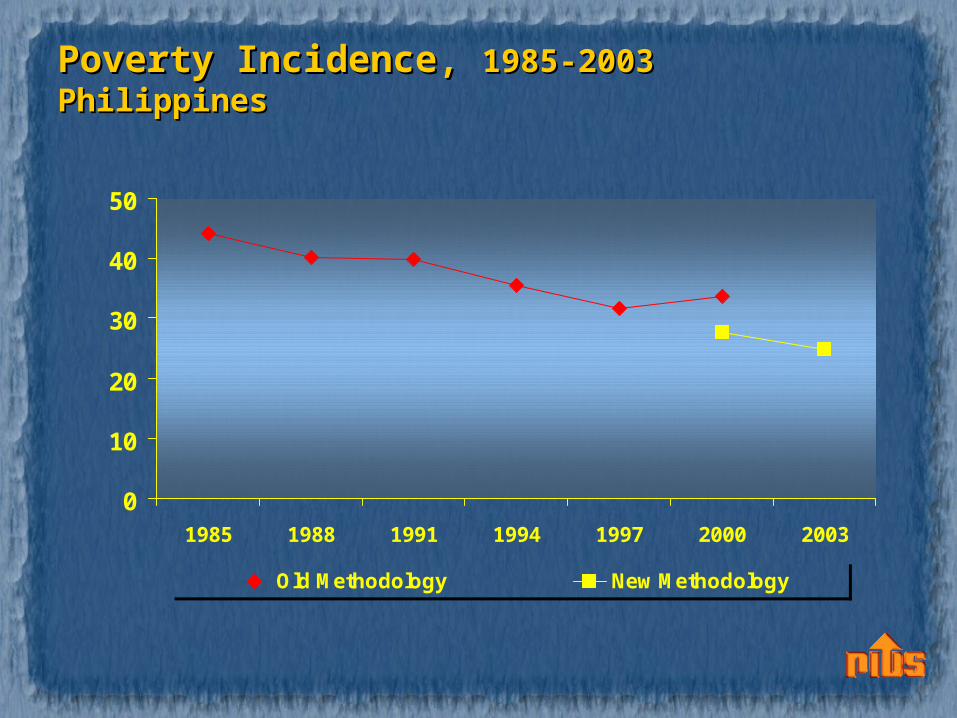
Poverty Incidence, Poverty Incidence, 1985-20031985-2003PhilippinesPhilippines
0
10
20
30
40
50
1985 1988 1991 1994 1997 2000 2003
Old Methodology New Methodology
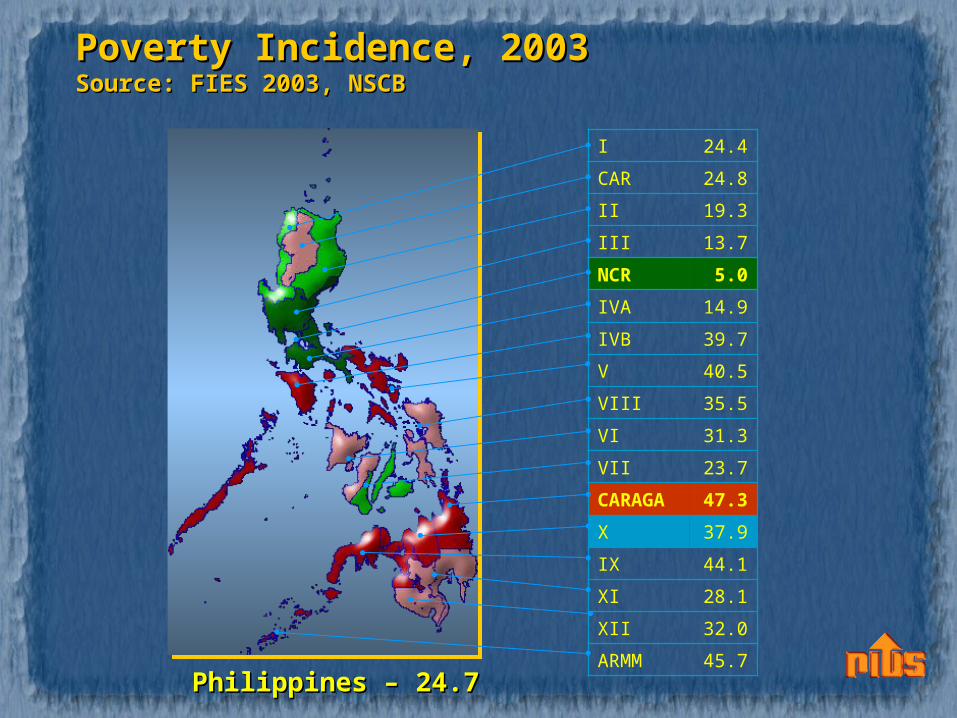
Poverty Incidence, 2003Poverty Incidence, 2003Source: FIES 2003, NSCBSource: FIES 2003, NSCB
Philippines – 24.7Philippines – 24.7
I 24.4
CAR 24.8
II 19.3
III 13.7
NCR 5.0
IVA 14.9
IVB 39.7
V 40.5
VIII 35.5
VI 31.3
VII 23.7
CARAGA
47.3
X 37.9
IX 44.1
XI 28.1
XII 32.0
ARMM 45.7
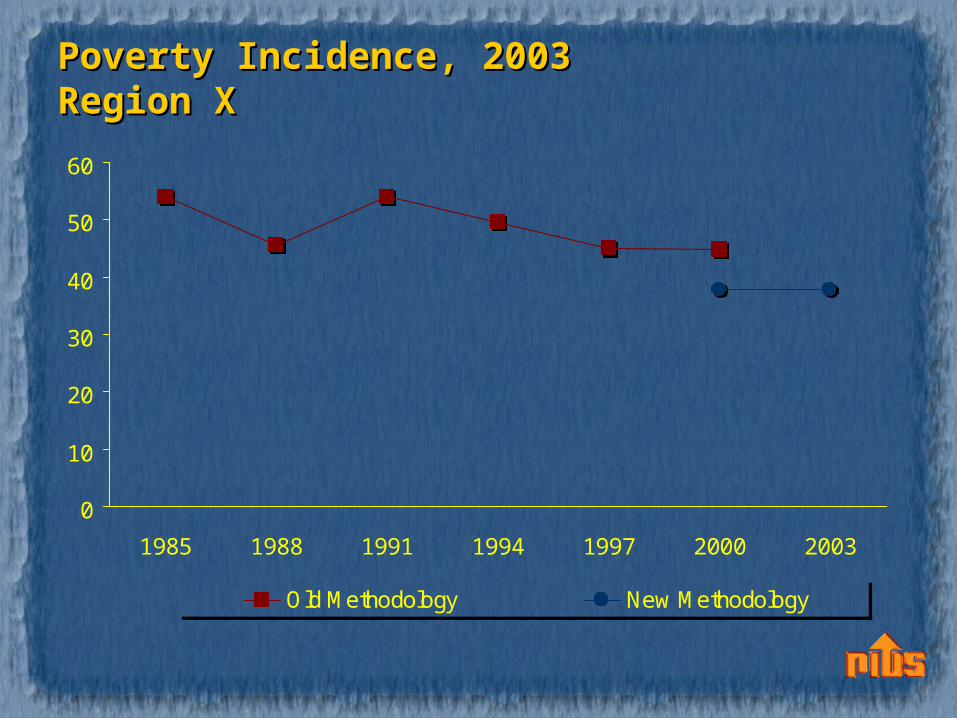
Poverty Incidence, 2003Poverty Incidence, 2003Region XRegion X
0
10
20
30
40
50
60
1985 1988 1991 1994 1997 2000 2003
Old Methodology New Methodology
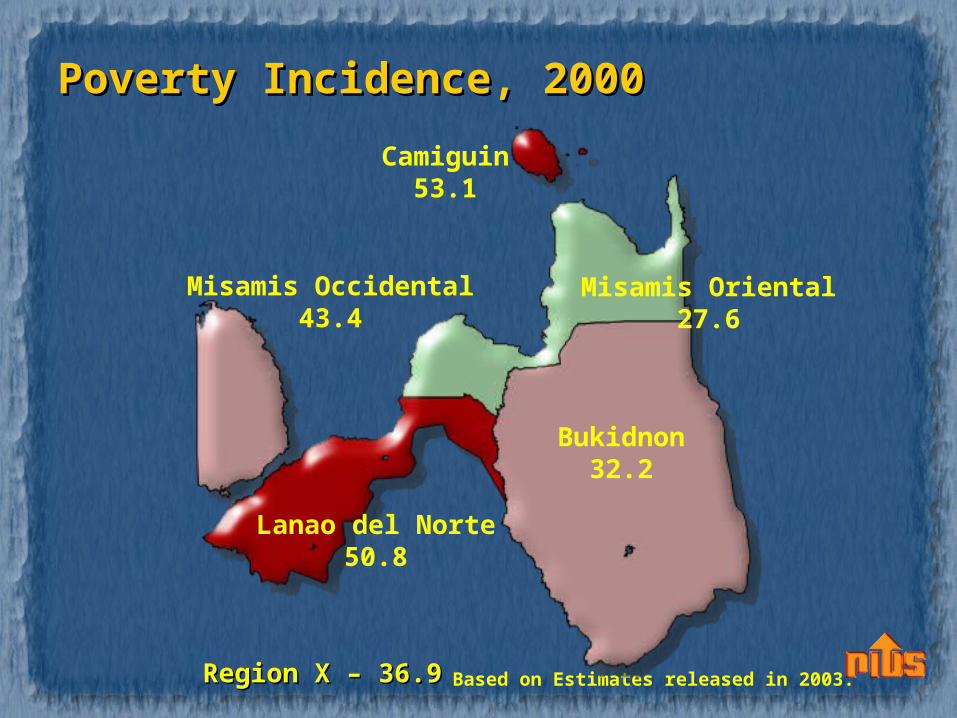
Poverty Incidence, 2000Poverty Incidence, 2000
Based on Estimates released in 2003.
Camiguin53.1
Misamis Occidental43.4
Misamis Oriental27.6
Bukidnon32.2
Lanao del Norte50.8
Region X – 36.9Region X – 36.9
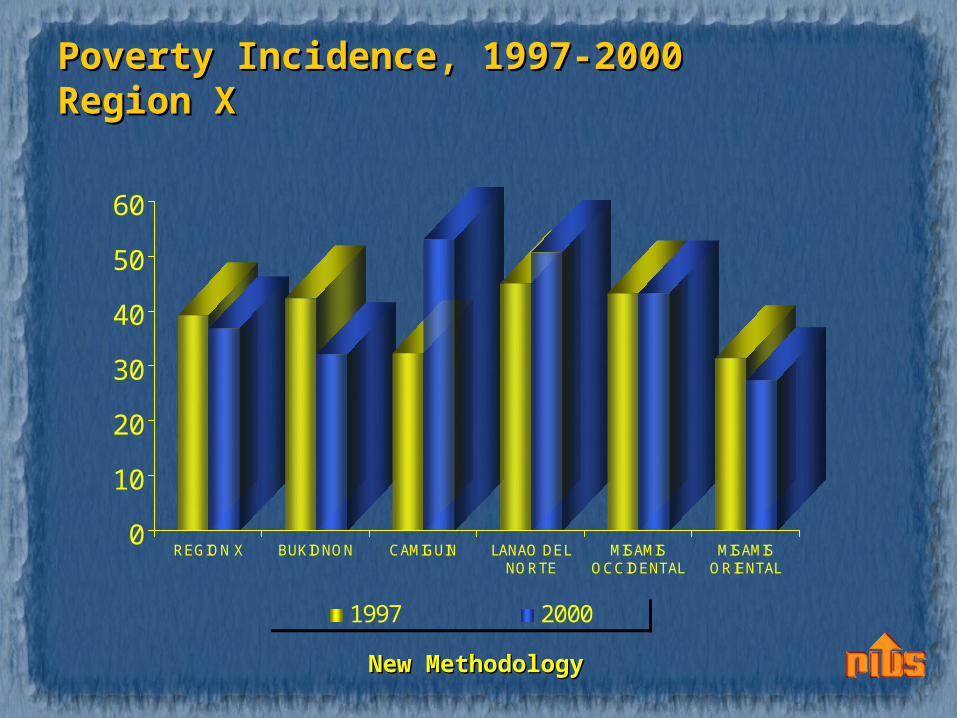
Poverty Incidence, 1997-2000Poverty Incidence, 1997-2000Region XRegion X
0
10
20
30
40
50
60
REGION X BUKIDNON CAMIGUIN LANAO DELNORTE
MISAMISOCCIDENTAL
MISAMISORIENTAL
1997 2000
New MethodologyNew Methodology
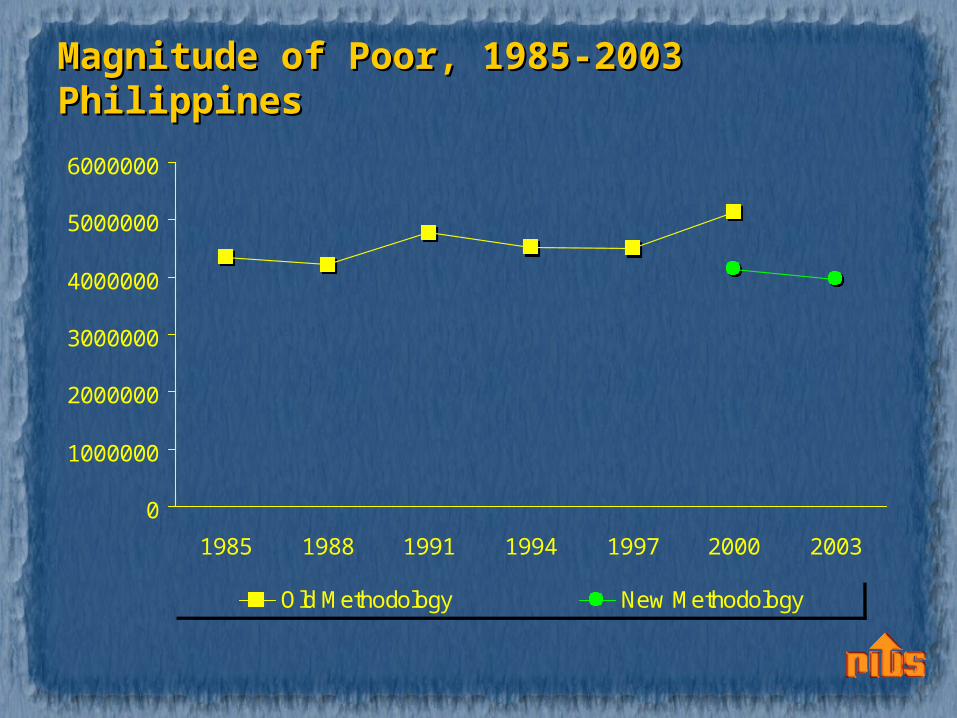
Magnitude of Poor, 1985-2003Magnitude of Poor, 1985-2003PhilippinesPhilippines
0
1000000
2000000
3000000
4000000
5000000
6000000
1985 1988 1991 1994 1997 2000 2003
Old Methodology New Methodology
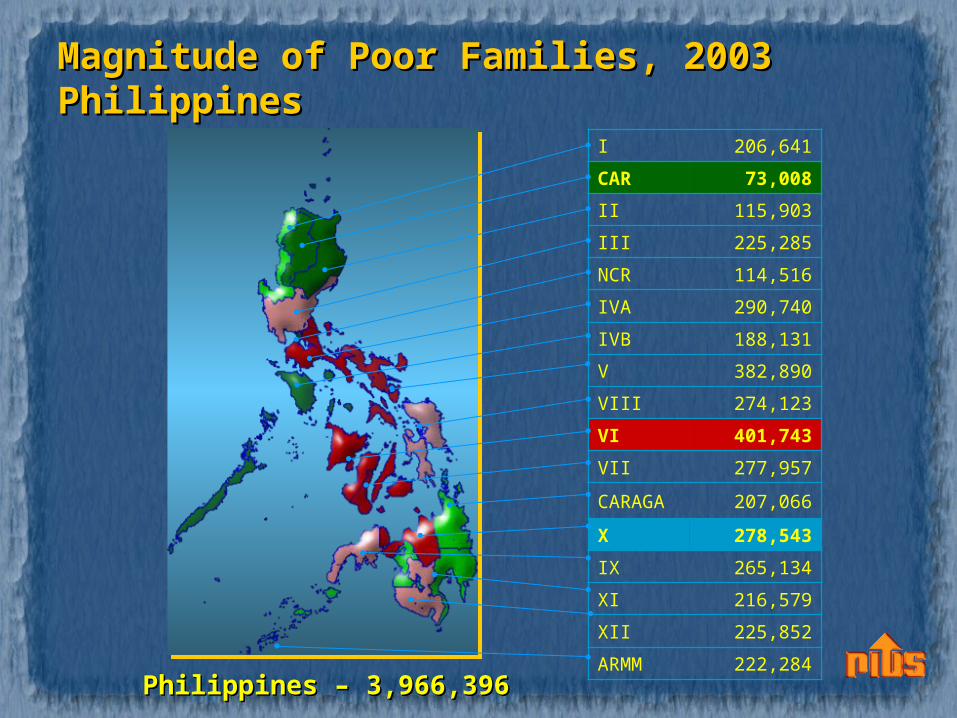
Magnitude of Poor Families, 2003Magnitude of Poor Families, 2003PhilippinesPhilippines
Philippines – 3,966,396Philippines – 3,966,396
I 206,641
CAR 73,008
II 115,903
III 225,285
NCR 114,516
IVA 290,740
IVB 188,131
V 382,890
VIII 274,123
VI 401,743
VII 277,957
CARAGA 207,066
X 278,543
IX 265,134
XI 216,579
XII 225,852
ARMM 222,284
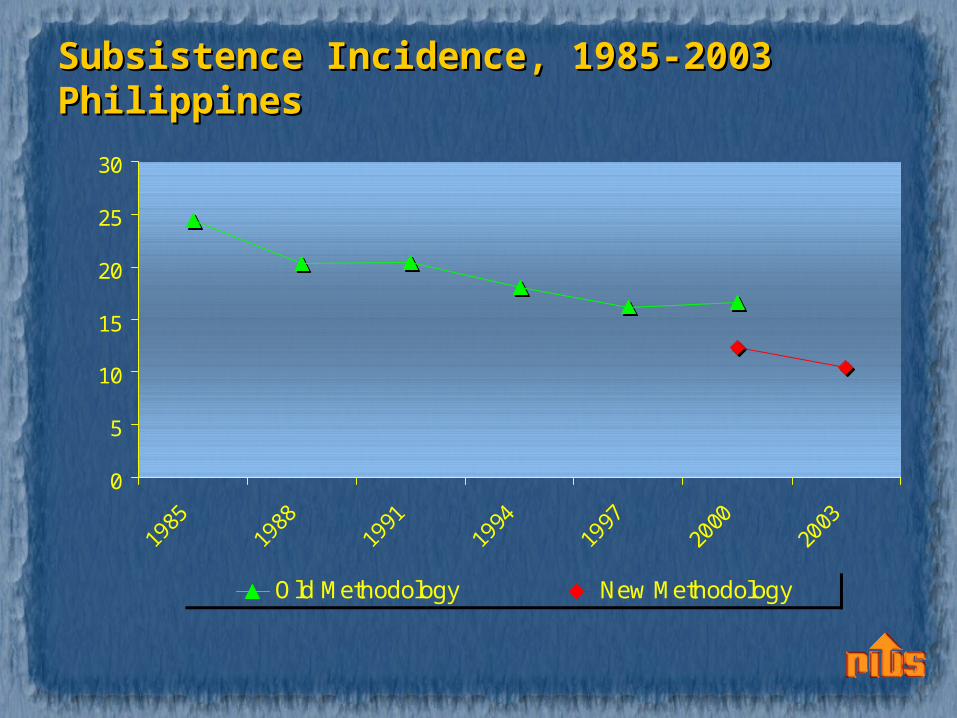
Subsistence Incidence, 1985-2003Subsistence Incidence, 1985-2003PhilippinesPhilippines
0
5
10
15
20
25
30
1985
1988
1991
1994
1997
2000
2003
Old Methodology New Methodology
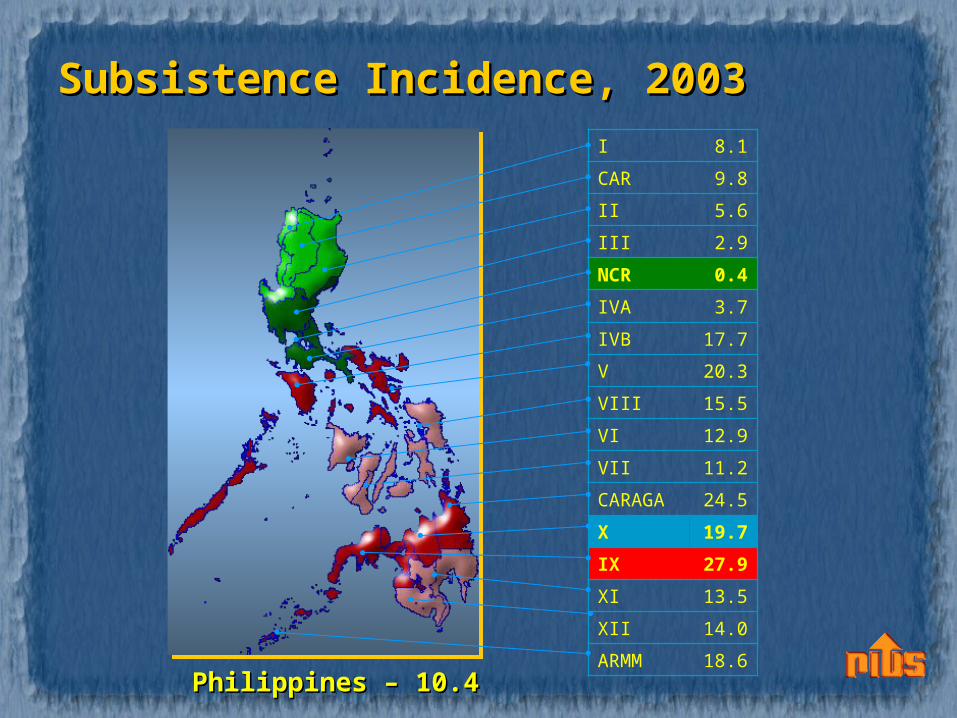
Subsistence Incidence, 2003Subsistence Incidence, 2003
Philippines – 10.4Philippines – 10.4
I 8.1
CAR 9.8
II 5.6
III 2.9
NCR 0.4
IVA 3.7
IVB 17.7
V 20.3
VIII 15.5
VI 12.9
VII 11.2
CARAGA 24.5
X 19.7
IX 27.9
XI 13.5
XII 14.0
ARMM 18.6
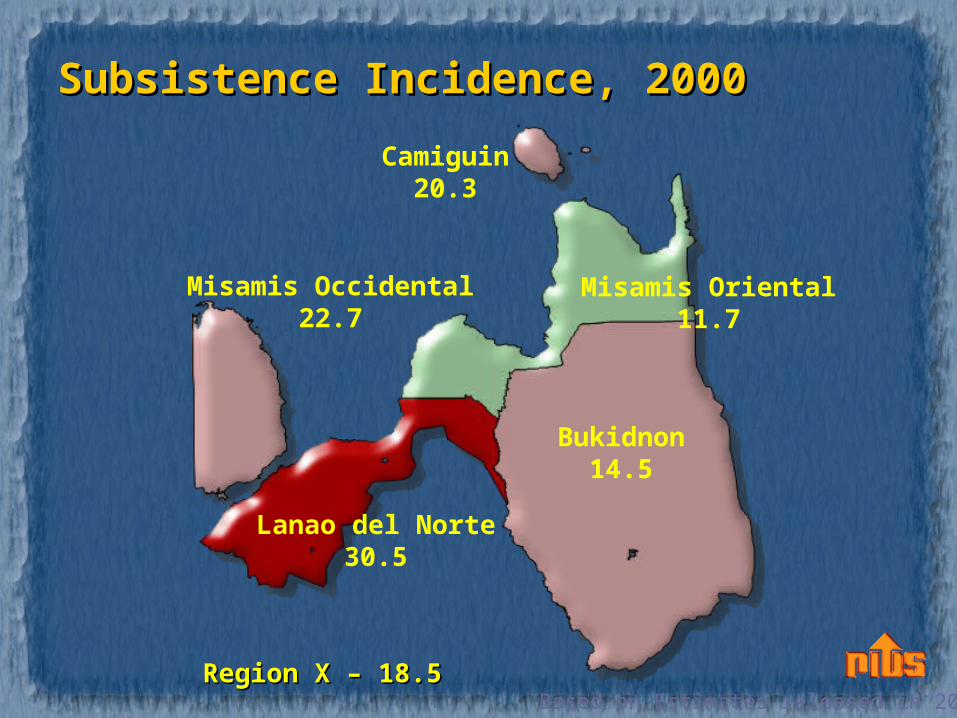
Subsistence Incidence, 2000Subsistence Incidence, 2000
Camiguin20.3
Misamis Occidental22.7
Misamis Oriental11.7
Bukidnon14.5
Lanao del Norte30.5
Based on Estimates released in 2003.Region X – 18.5Region X – 18.5
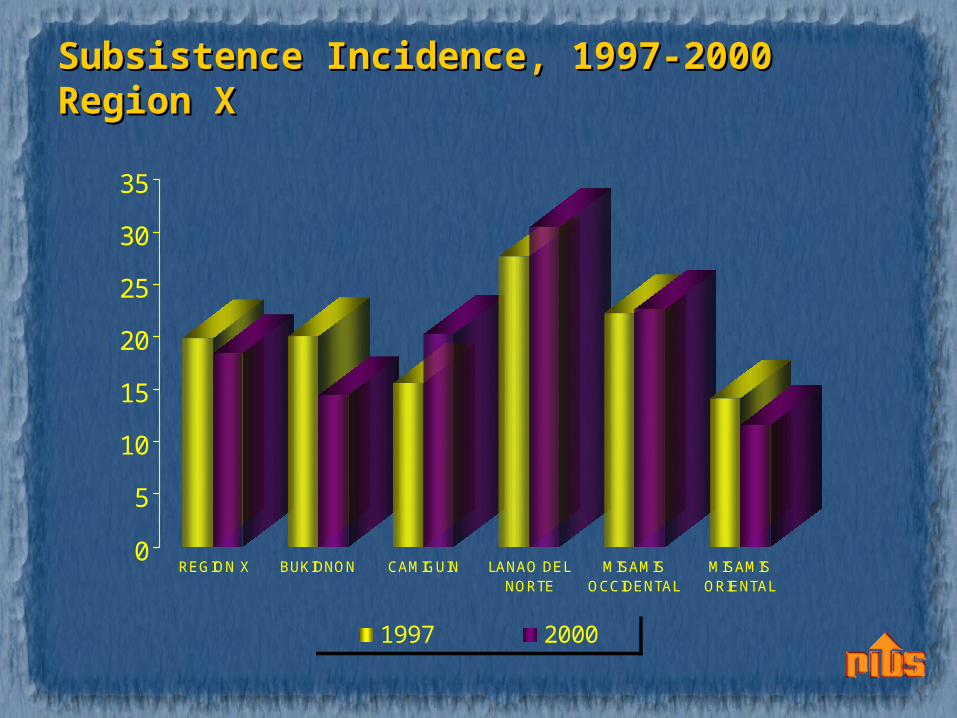
Subsistence Incidence, 1997-2000Subsistence Incidence, 1997-2000Region XRegion X
0
5
10
15
20
25
30
35
REGION X BUKIDNON CAMIGUIN LANAO DELNORTE
MISAMISOCCIDENTAL
MISAMISORIENTAL
1997 2000

Annual Population Growth Rate, 1960-Annual Population Growth Rate, 1960-2000 Philippines2000 Philippines
3.082.78 2.71
2.35 2.32 2.36
0
0.5
1
1.5
2
2.5
3
3.5
1960-1970 1970-1975 1975-1980 1980-1990
1990-1995 1995-2000
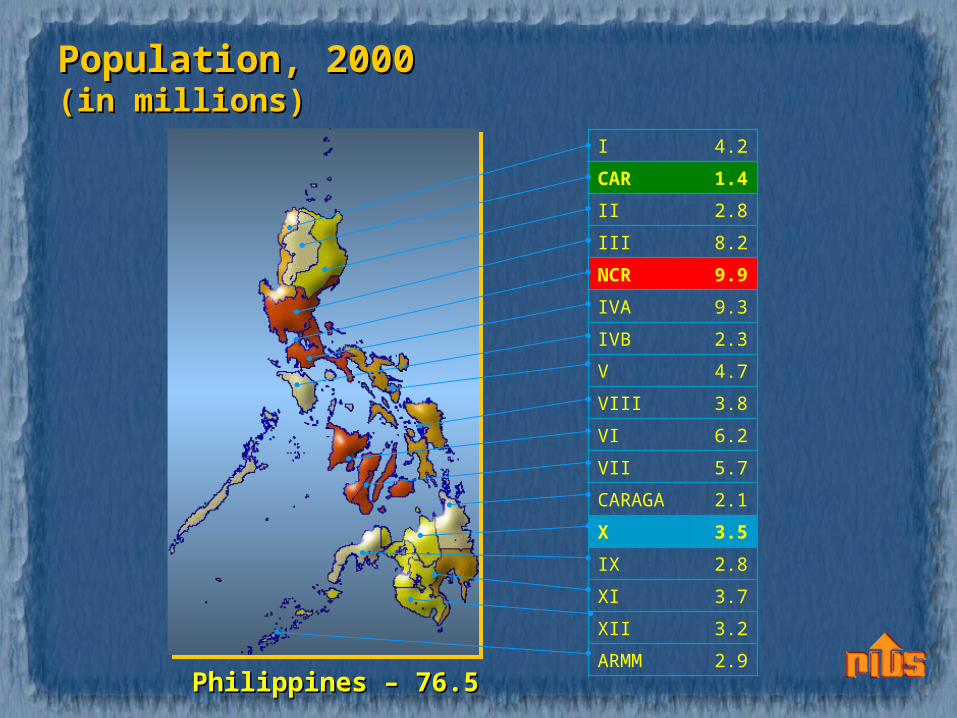
Population, 2000Population, 2000(in millions)(in millions)
I 4.2
CAR 1.4
II 2.8
III 8.2
NCR 9.9
IVA 9.3
IVB 2.3
V 4.7
VIII 3.8
VI 6.2
VII 5.7
CARAGA 2.1
X 3.5
IX 2.8
XI 3.7
XII 3.2
ARMM 2.9Philippines – 76.5Philippines – 76.5
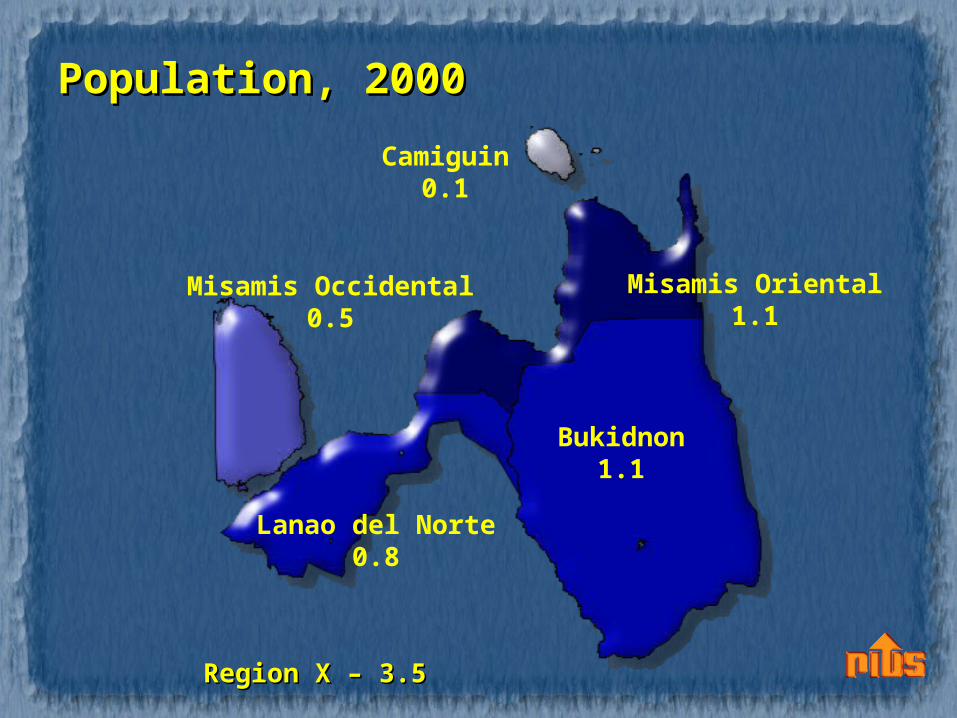
Population, 2000Population, 2000
Region X – 3.5Region X – 3.5
Camiguin0.1
Misamis Occidental0.5
Misamis Oriental1.1
Bukidnon1.1
Lanao del Norte0.8
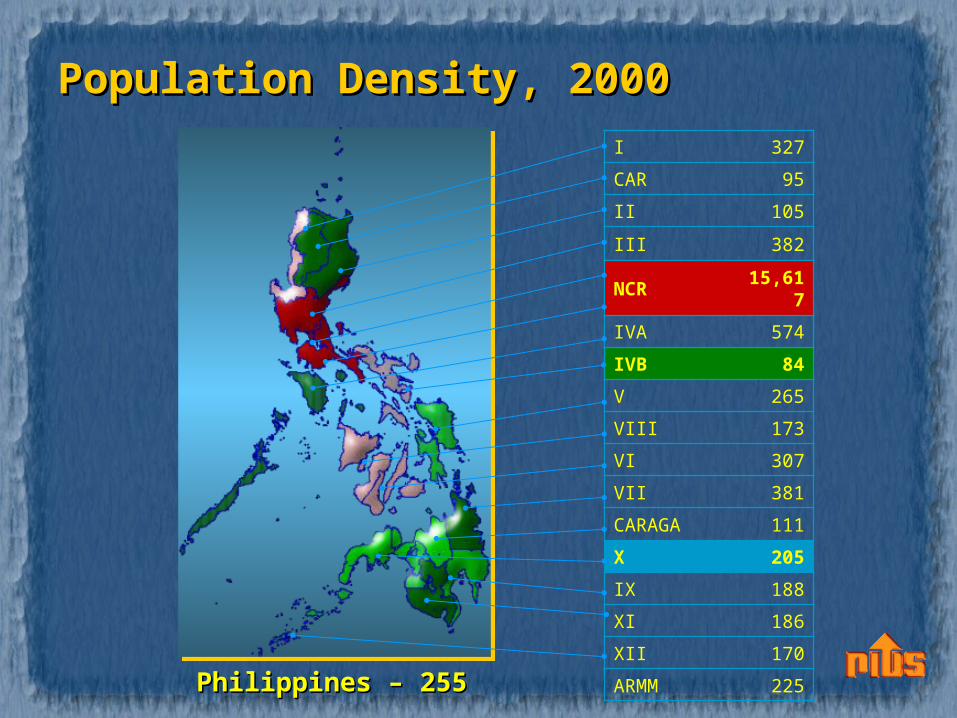
Population Density, 2000Population Density, 2000I 327
CAR 95
II 105
III 382
NCR 15,61
7
IVA 574
IVB 84
V 265
VIII 173
VI 307
VII 381
CARAGA 111
X 205
IX 188
XI 186
XII 170
ARMM 225Philippines – 255Philippines – 255
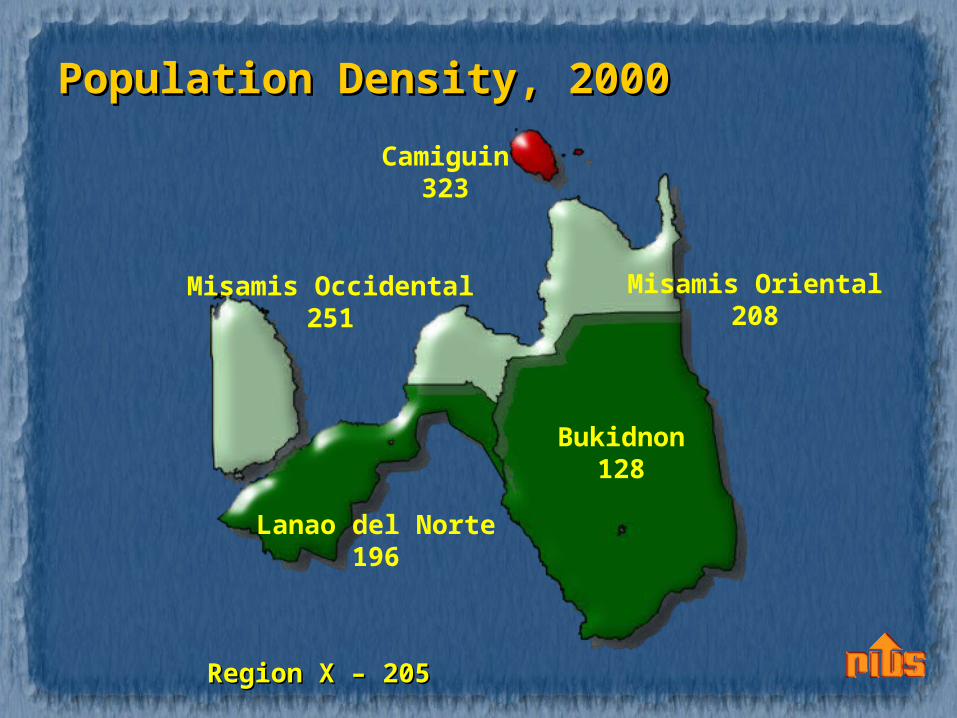
Population Density, 2000Population Density, 2000
Camiguin323
Misamis Occidental251
Bukidnon128
Lanao del Norte196
Misamis Oriental208
Region X – 205Region X – 205
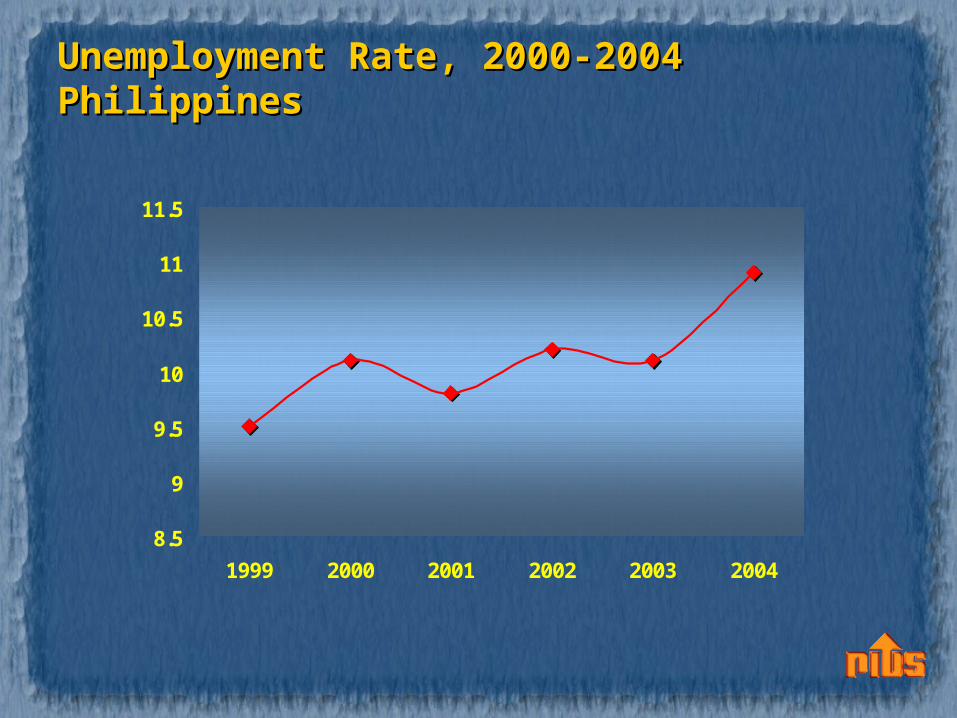
Unemployment Rate, 2000-2004Unemployment Rate, 2000-2004PhilippinesPhilippines
8.5
9
9.5
10
10.5
11
11.5
1999 2000 2001 2002 2003 2004
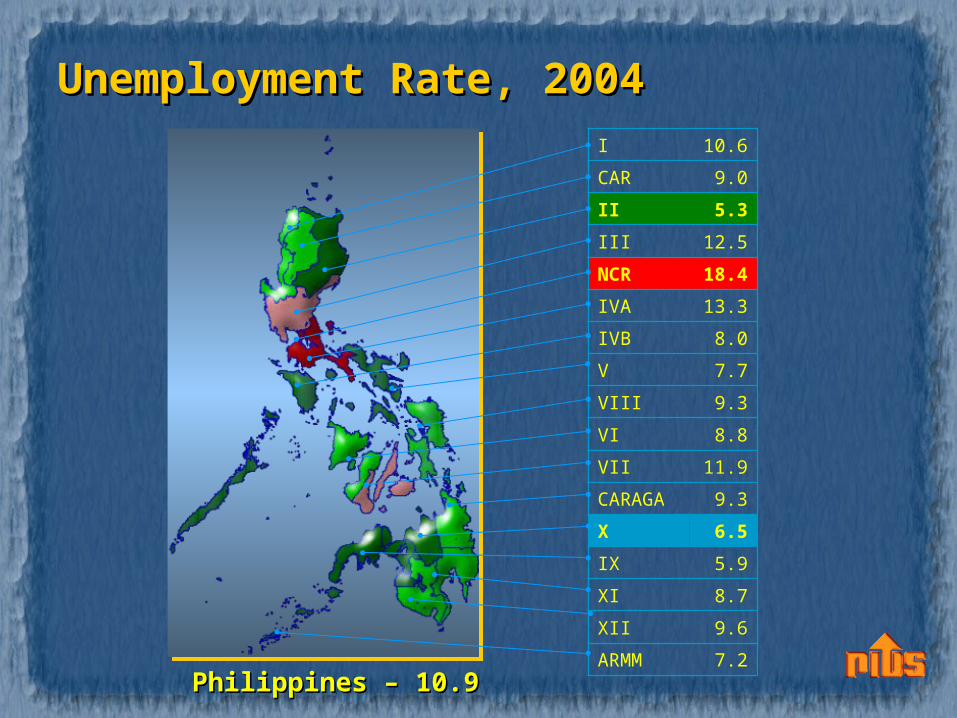
Unemployment Rate, 2004Unemployment Rate, 2004I 10.6
CAR 9.0
II 5.3
III 12.5
NCR 18.4
IVA 13.3
IVB 8.0
V 7.7
VIII 9.3
VI 8.8
VII 11.9
CARAGA 9.3
X 6.5
IX 5.9
XI 8.7
XII 9.6
ARMM 7.2Philippines – 10.9Philippines – 10.9
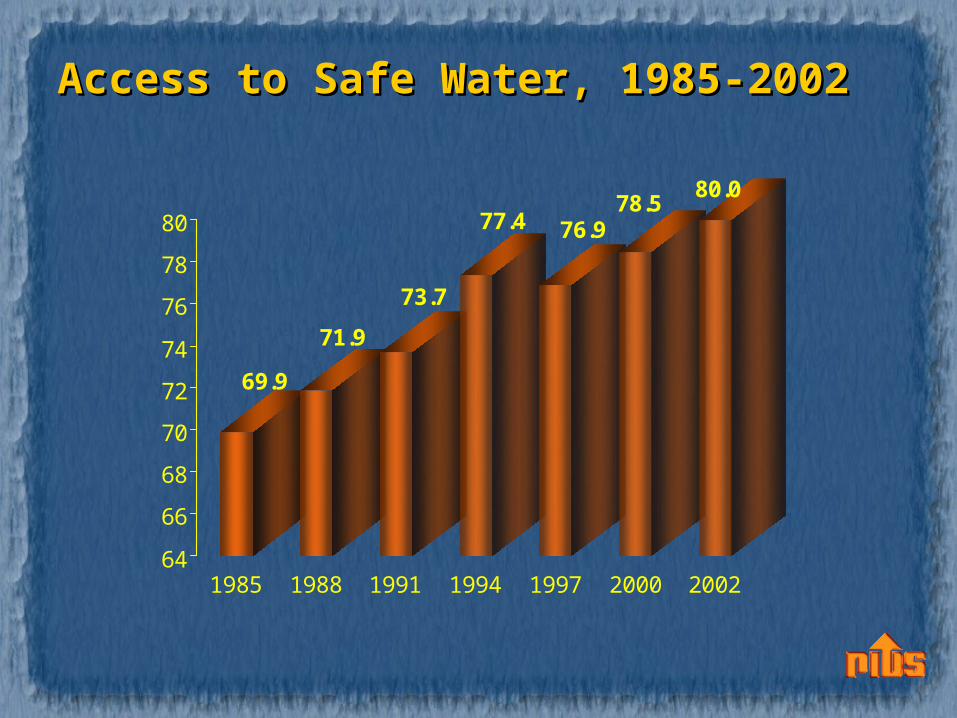
Access to Safe Water, 1985-2002Access to Safe Water, 1985-2002
69.9
71.9
73.7
77.4 76.978.5
80.0
64
66
68
70
72
74
76
78
80
1985 1988 1991 1994 1997 2000 2002
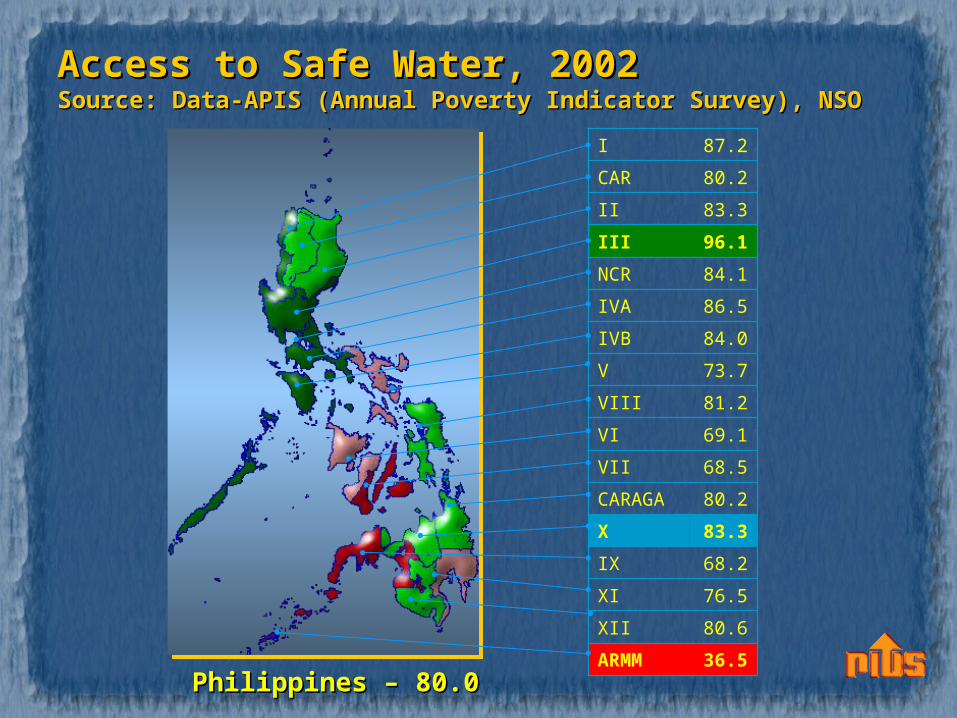
Access to Safe Water, 2002Access to Safe Water, 2002Source: Data-APIS (Annual Poverty Indicator Survey), NSOSource: Data-APIS (Annual Poverty Indicator Survey), NSO
I 87.2
CAR 80.2
II 83.3
III 96.1
NCR 84.1
IVA 86.5
IVB 84.0
V 73.7
VIII 81.2
VI 69.1
VII 68.5
CARAGA 80.2
X 83.3
IX 68.2
XI 76.5
XII 80.6
ARMM 36.5Philippines – 80.0Philippines – 80.0
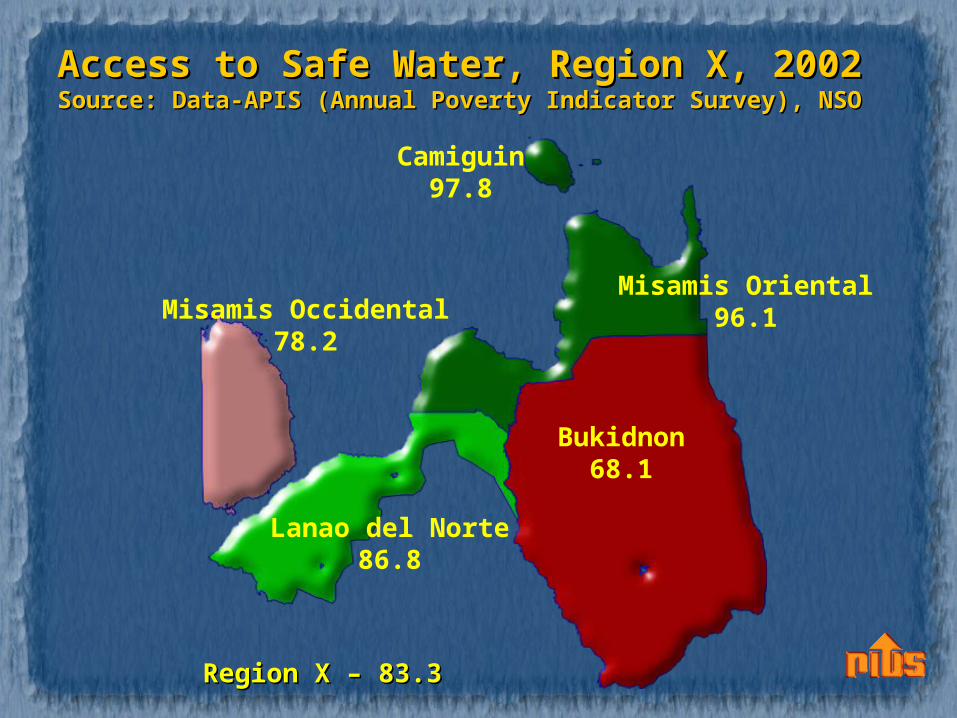
Access to Safe Water, Region X, 2002Access to Safe Water, Region X, 2002Source: Data-APIS (Annual Poverty Indicator Survey), NSOSource: Data-APIS (Annual Poverty Indicator Survey), NSO
Camiguin97.8
Misamis Occidental78.2
Misamis Oriental96.1
Bukidnon68.1
Lanao del Norte86.8
Region X – 83.3Region X – 83.3
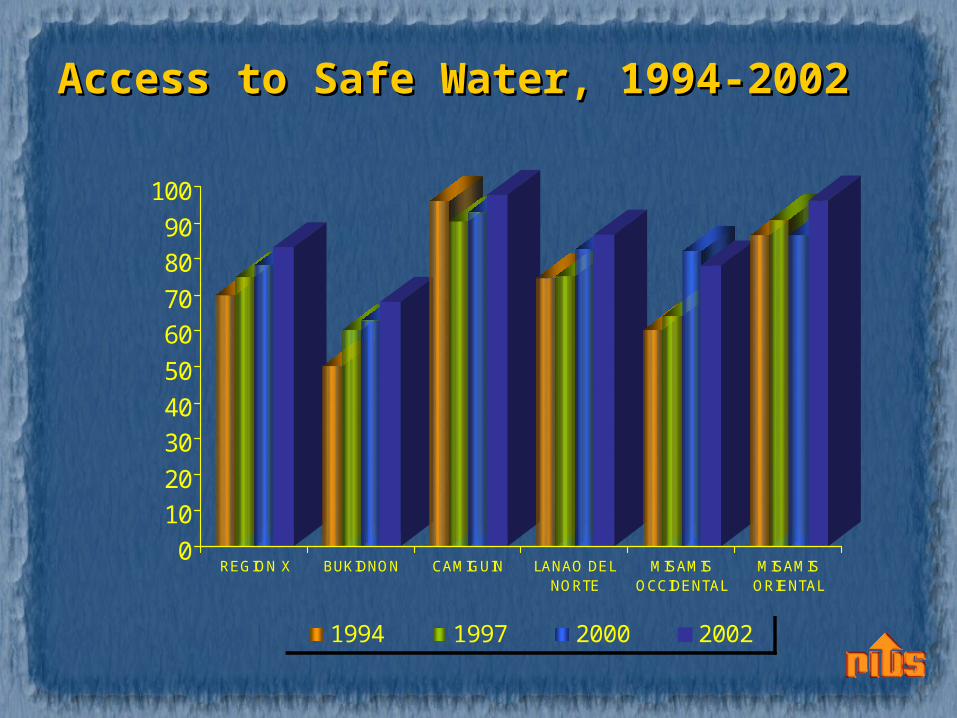
0
10
20
30
40
50
60
70
80
90
100
REGION X BUKIDNON CAMIGUIN LANAO DELNORTE
MISAMISOCCIDENTAL
MISAMISORIENTAL
1994 1997 2000 2002
Access to Safe Water, 1994-2002Access to Safe Water, 1994-2002
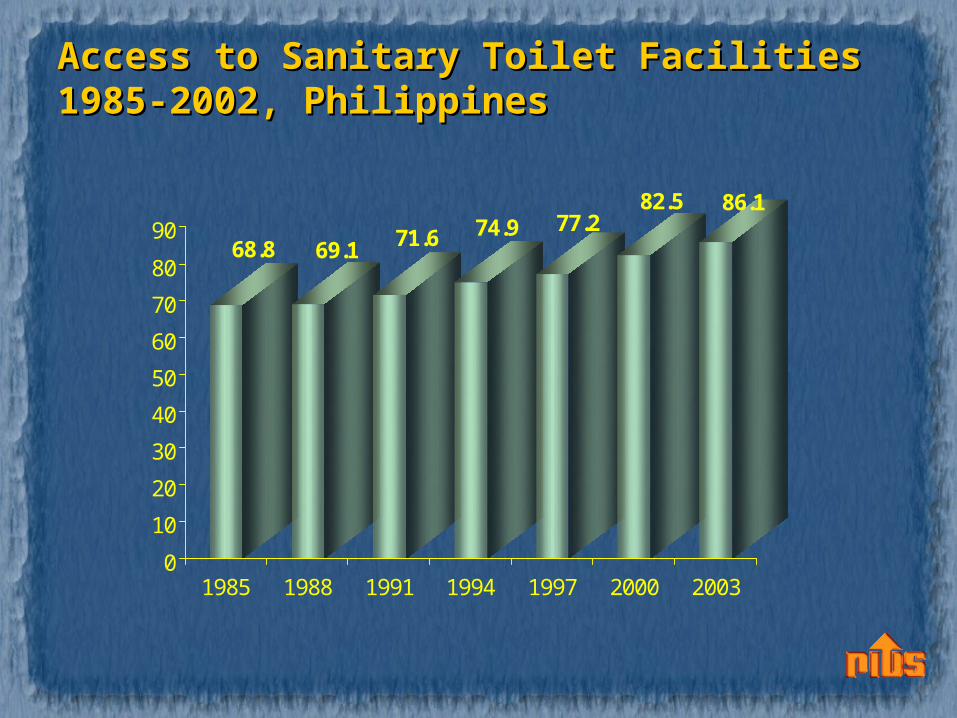
Access to Sanitary Toilet Facilities Access to Sanitary Toilet Facilities 1985-2002, Philippines1985-2002, Philippines
68.8 69.1 71.6 74.9 77.282.5 86.1
0
10
20
30
40
50
60
70
80
90
1985 1988 1991 1994 1997 2000 2003
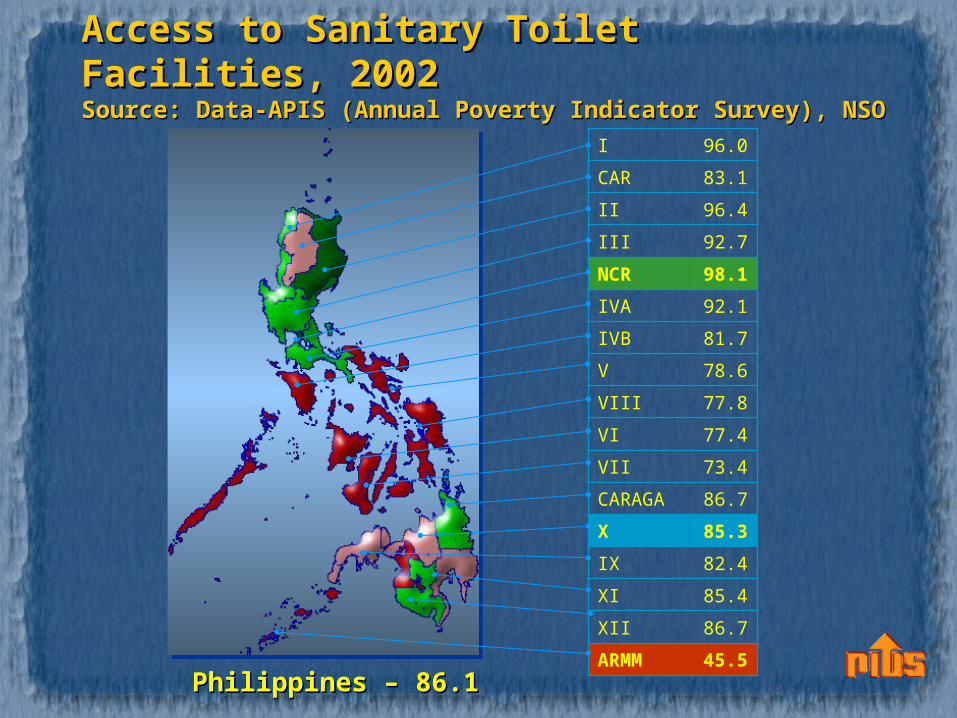
Access to Sanitary Toilet Facilities, Access to Sanitary Toilet Facilities, 20022002Source: Data-APIS (Annual Poverty Indicator Survey), NSOSource: Data-APIS (Annual Poverty Indicator Survey), NSO
I 96.0
CAR 83.1
II 96.4
III 92.7
NCR 98.1
IVA 92.1
IVB 81.7
V 78.6
VIII 77.8
VI 77.4
VII 73.4
CARAGA 86.7
X 85.3
IX 82.4
XI 85.4
XII 86.7
ARMM 45.5Philippines – 86.1Philippines – 86.1
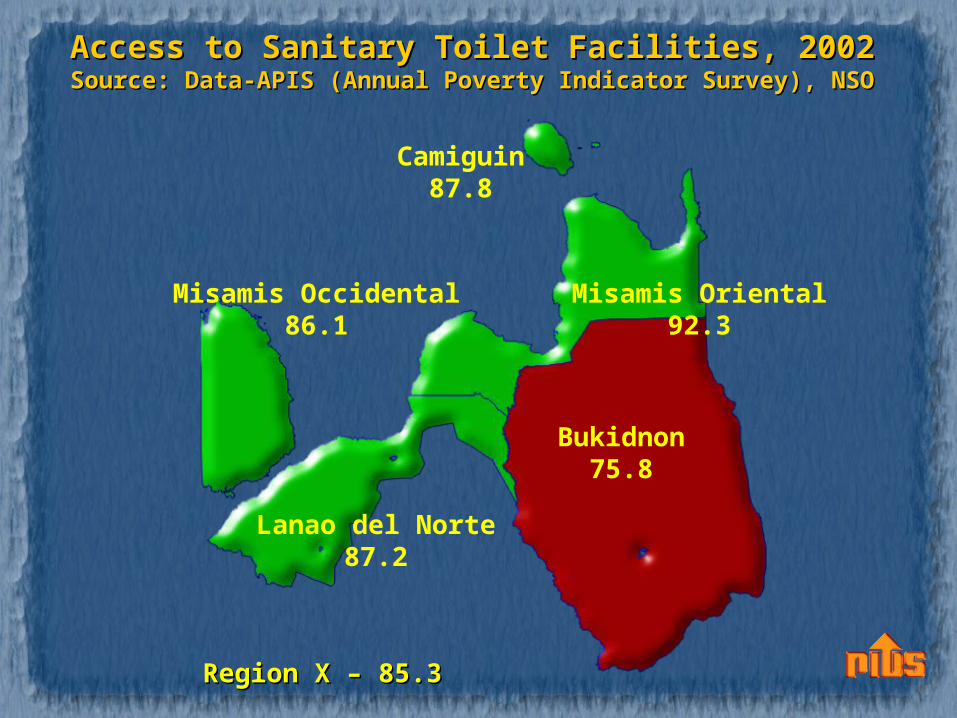
Access to Sanitary Toilet Facilities, 2002Access to Sanitary Toilet Facilities, 2002Source: Data-APIS (Annual Poverty Indicator Survey), NSOSource: Data-APIS (Annual Poverty Indicator Survey), NSO
Camiguin87.8
Misamis Occidental86.1
Misamis Oriental92.3
Bukidnon75.8
Lanao del Norte87.2
Region X – 85.3Region X – 85.3
0
10
20
30
40
50
60
70
80
90
100
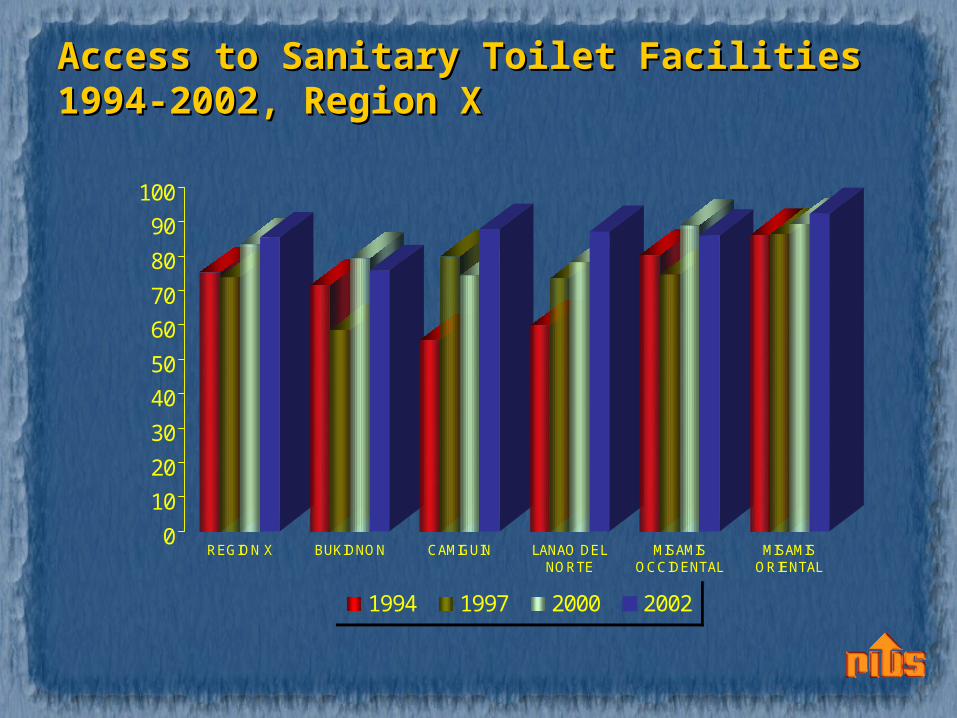
REGION X BUKIDNON CAMIGUIN LANAO DELNORTE
MISAMISOCCIDENTAL
MISAMISORIENTAL
1994 1997 2000 2002
Access to Sanitary Toilet FacilitiesAccess to Sanitary Toilet Facilities1994-2002, Region X1994-2002, Region X
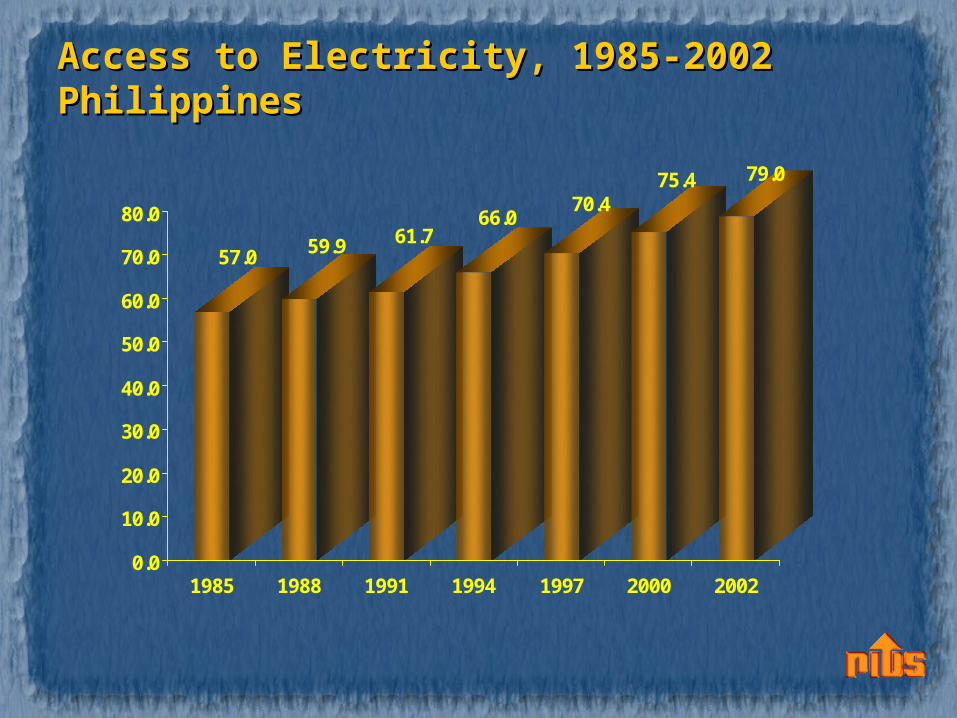
Access to Electricity, 1985-2002Access to Electricity, 1985-2002PhilippinesPhilippines
57.0 59.9 61.766.0
70.475.4 79.0
0.0
10.0
20.0
30.0
40.0
50.0
60.0
70.0
80.0
1985 1988 1991 1994 1997 2000 2002
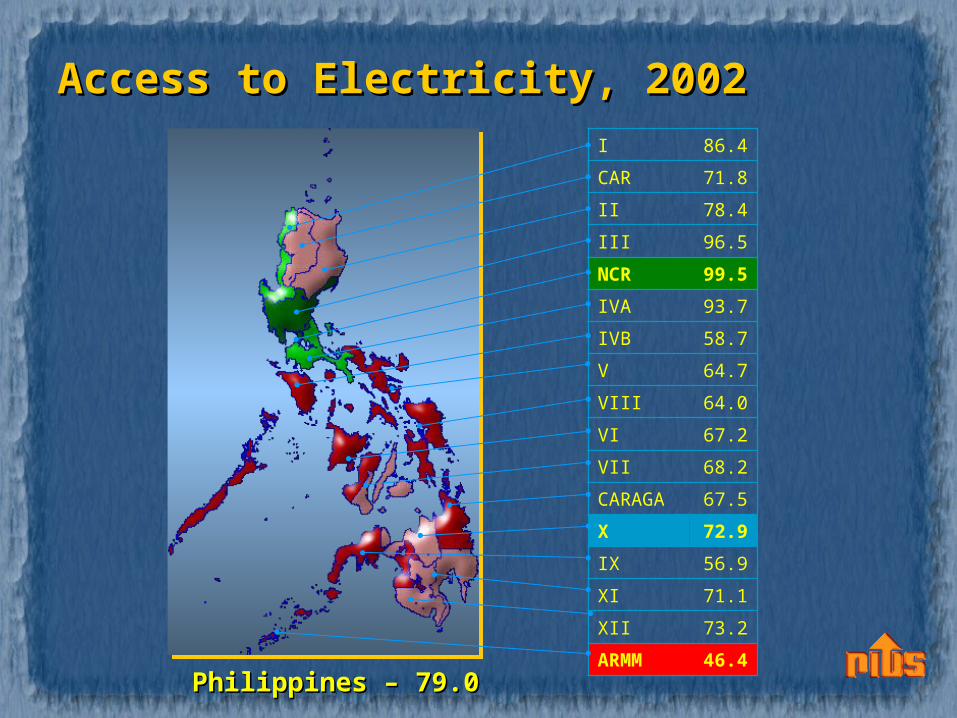
Access to Electricity, 2002Access to Electricity, 2002I 86.4
CAR 71.8
II 78.4
III 96.5
NCR 99.5
IVA 93.7
IVB 58.7
V 64.7
VIII 64.0
VI 67.2
VII 68.2
CARAGA 67.5
X 72.9
IX 56.9
XI 71.1
XII 73.2
ARMM 46.4Philippines – 79.0Philippines – 79.0
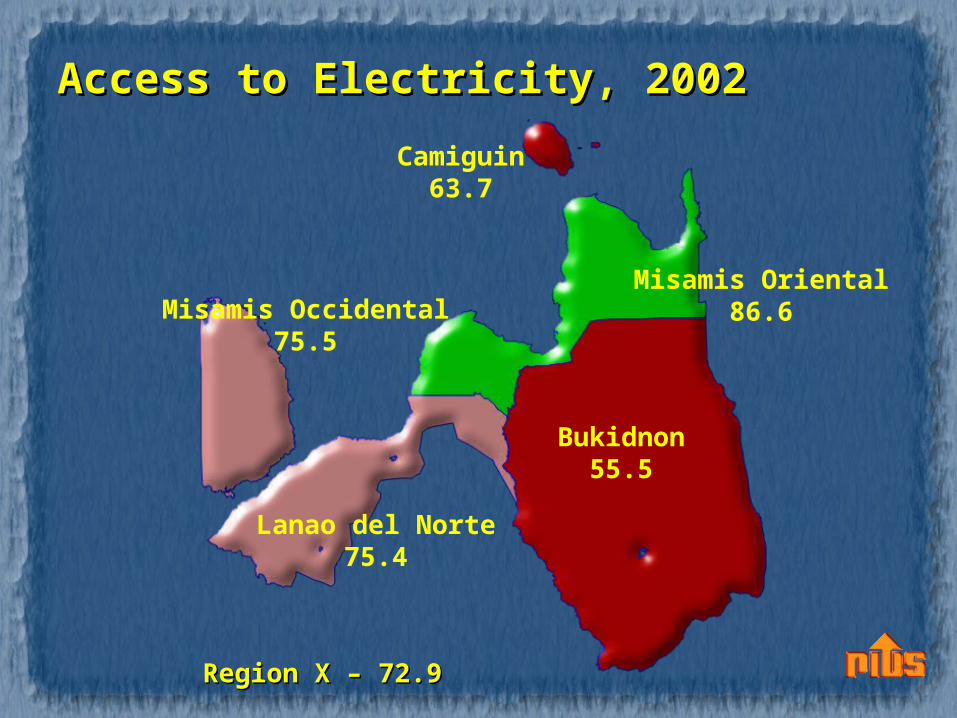
Access to Electricity, 2002Access to Electricity, 2002
Camiguin63.7
Misamis Occidental75.5
Misamis Oriental86.6
Bukidnon55.5
Lanao del Norte75.4
Region X – 72.9Region X – 72.9

0
10
20
30
40
50
60
70
80
90
REGION X BUKIDNON CAMIGUIN LANAO DELNORTE
MISAMISOCCIDENTAL
MISAMISORIENTAL
1994 1997 2000 2002
Access to Electricity, 1994-2002Access to Electricity, 1994-2002Region XRegion X
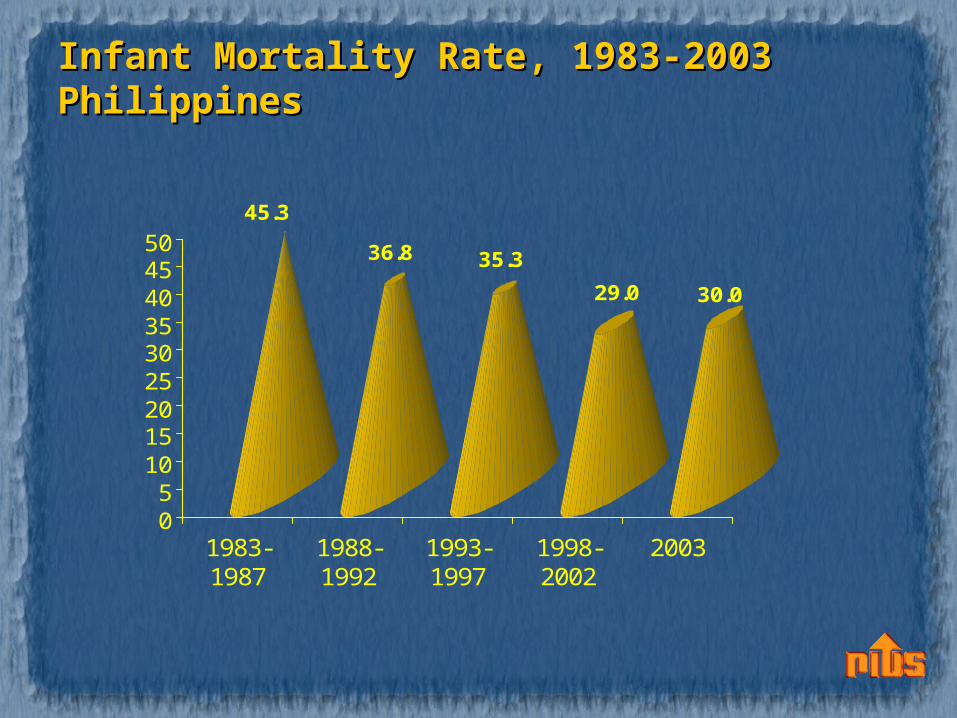
Infant Mortality Rate, 1983-2003Infant Mortality Rate, 1983-2003PhilippinesPhilippines
45.3
36.8 35.3
29.0 30.0
05
101520253035404550
1983-1987
1988-1992
1993-1997
1998-2002
2003
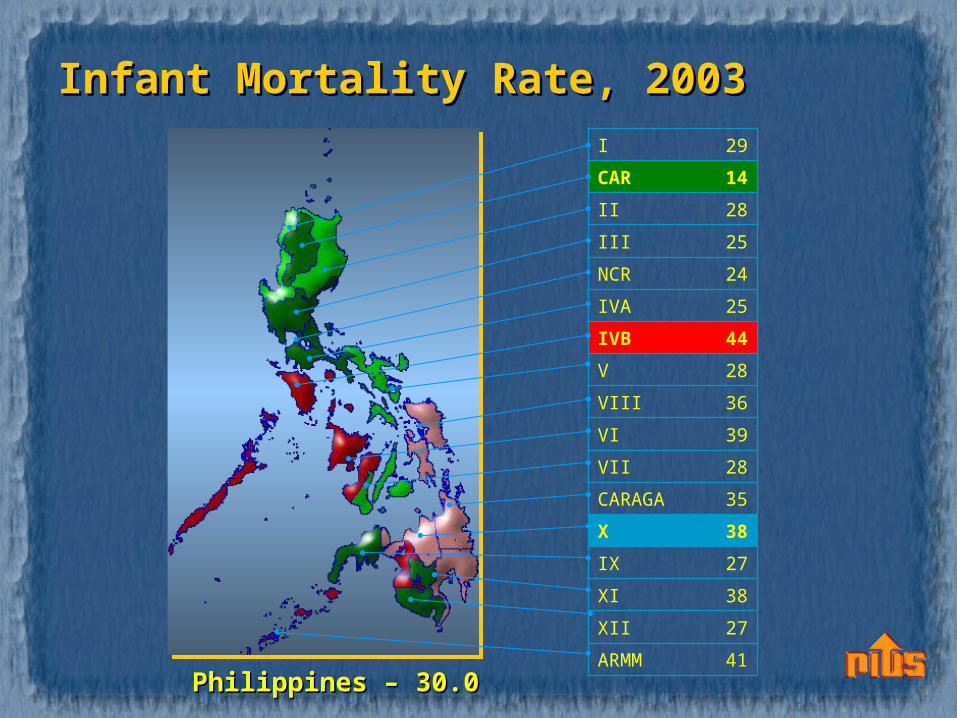
Infant Mortality Rate, 2003Infant Mortality Rate, 2003I 29
CAR 14
II 28
III 25
NCR 24
IVA 25
IVB 44
V 28
VIII 36
VI 39
VII 28
CARAGA 35
X 38
IX 27
XI 38
XII 27
ARMM 41Philippines – 30.0Philippines – 30.0
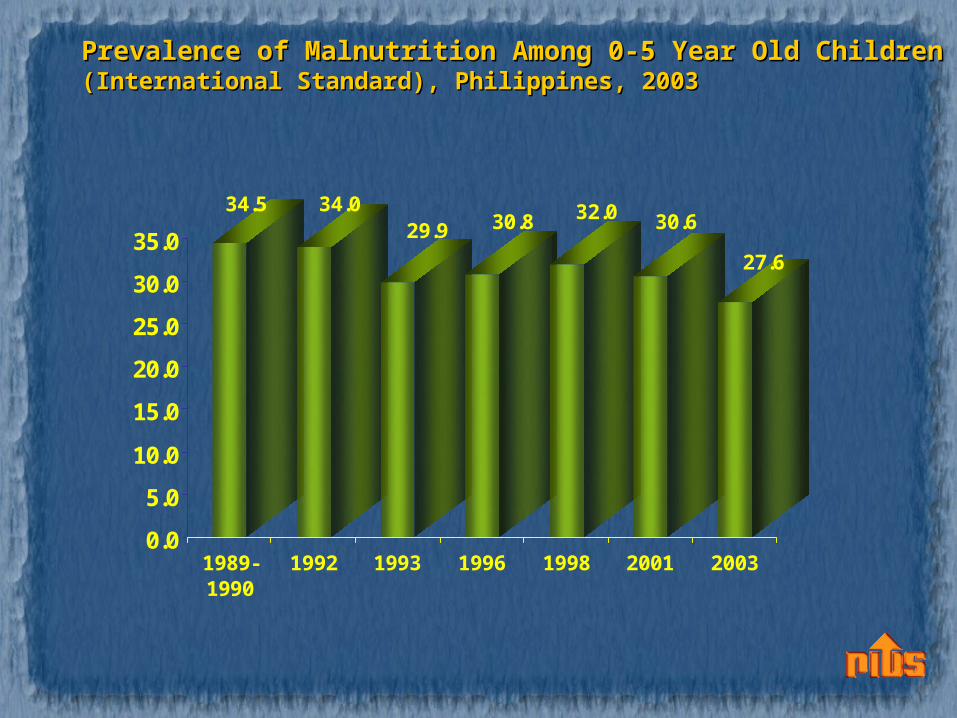
Prevalence of Malnutrition Among 0-5 Year Old ChildrenPrevalence of Malnutrition Among 0-5 Year Old Children(International Standard), Philippines, 2003(International Standard), Philippines, 2003
34.5 34.029.9 30.8 32.0 30.6
27.6
0.0
5.0
10.0
15.0
20.0
25.0
30.0
35.0
1989-1990
1992 1993 1996 1998 2001 2003
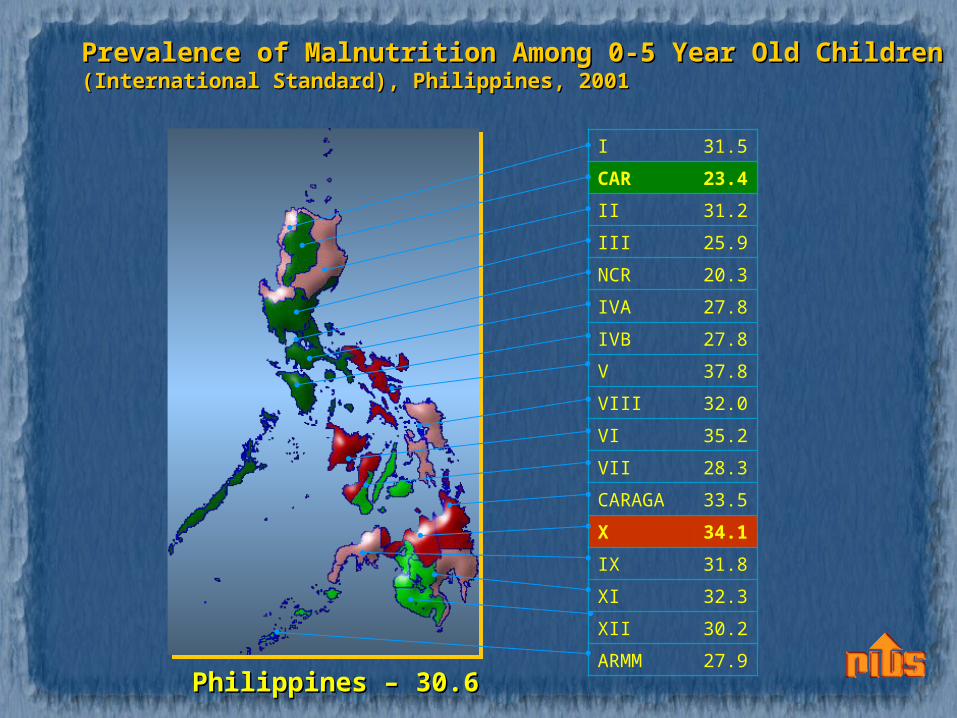
Prevalence of Malnutrition Among 0-5 Year Old ChildrenPrevalence of Malnutrition Among 0-5 Year Old Children(International Standard), Philippines, 2001(International Standard), Philippines, 2001
I 31.5
CAR 23.4
II 31.2
III 25.9
NCR 20.3
IVA 27.8
IVB 27.8
V 37.8
VIII 32.0
VI 35.2
VII 28.3
CARAGA 33.5
X 34.1
IX 31.8
XI 32.3
XII 30.2
ARMM 27.9Philippines – 30.6Philippines – 30.6
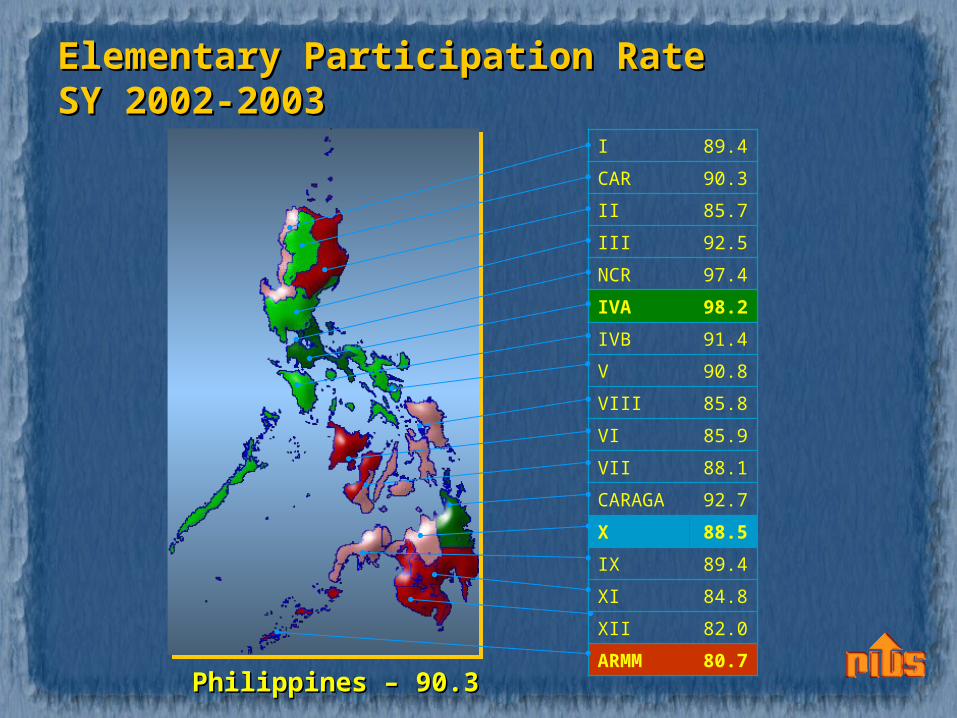
Elementary Participation RateElementary Participation RateSY 2002-2003SY 2002-2003
I 89.4
CAR 90.3
II 85.7
III 92.5
NCR 97.4
IVA 98.2
IVB 91.4
V 90.8
VIII 85.8
VI 85.9
VII 88.1
CARAGA 92.7
X 88.5
IX 89.4
XI 84.8
XII 82.0
ARMM 80.7Philippines – 90.3Philippines – 90.3
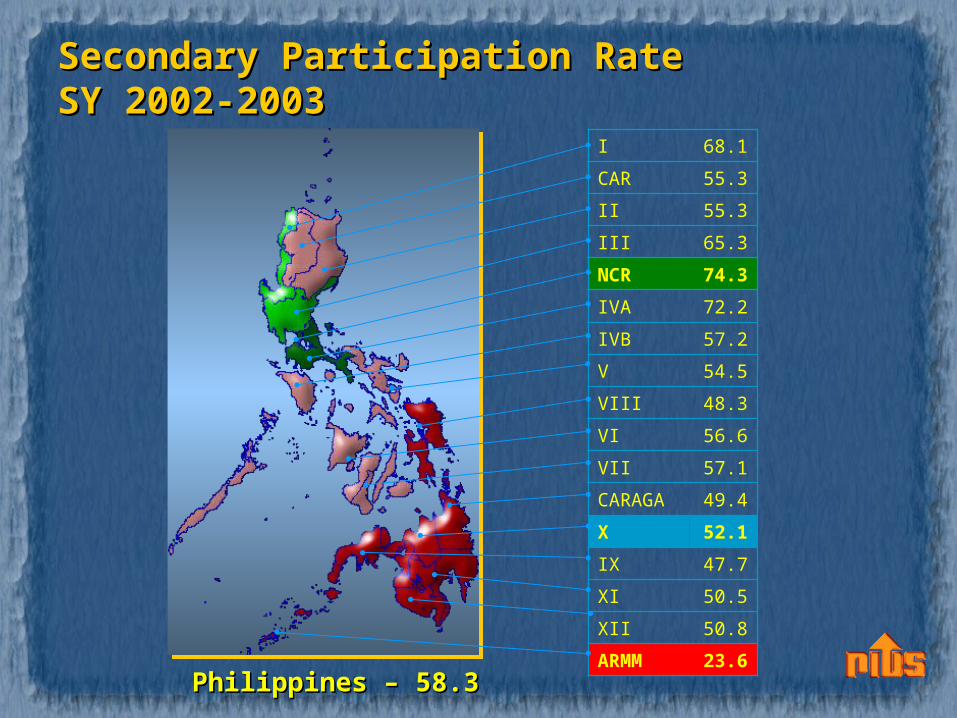
Secondary Participation RateSecondary Participation RateSY 2002-2003SY 2002-2003
I 68.1
CAR 55.3
II 55.3
III 65.3
NCR 74.3
IVA 72.2
IVB 57.2
V 54.5
VIII 48.3
VI 56.6
VII 57.1
CARAGA 49.4
X 52.1
IX 47.7
XI 50.5
XII 50.8
ARMM 23.6Philippines – 58.3Philippines – 58.3
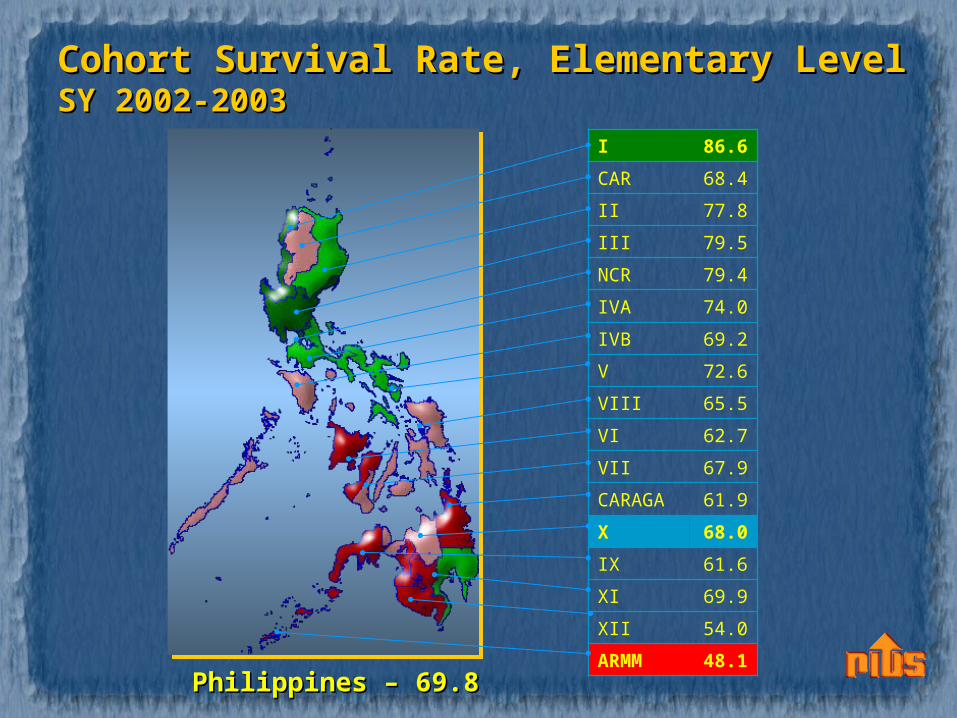
Cohort Survival Rate, Elementary LevelCohort Survival Rate, Elementary LevelSY 2002-2003SY 2002-2003
I 86.6
CAR 68.4
II 77.8
III 79.5
NCR 79.4
IVA 74.0
IVB 69.2
V 72.6
VIII 65.5
VI 62.7
VII 67.9
CARAGA 61.9
X 68.0
IX 61.6
XI 69.9
XII 54.0
ARMM 48.1Philippines – 69.8Philippines – 69.8
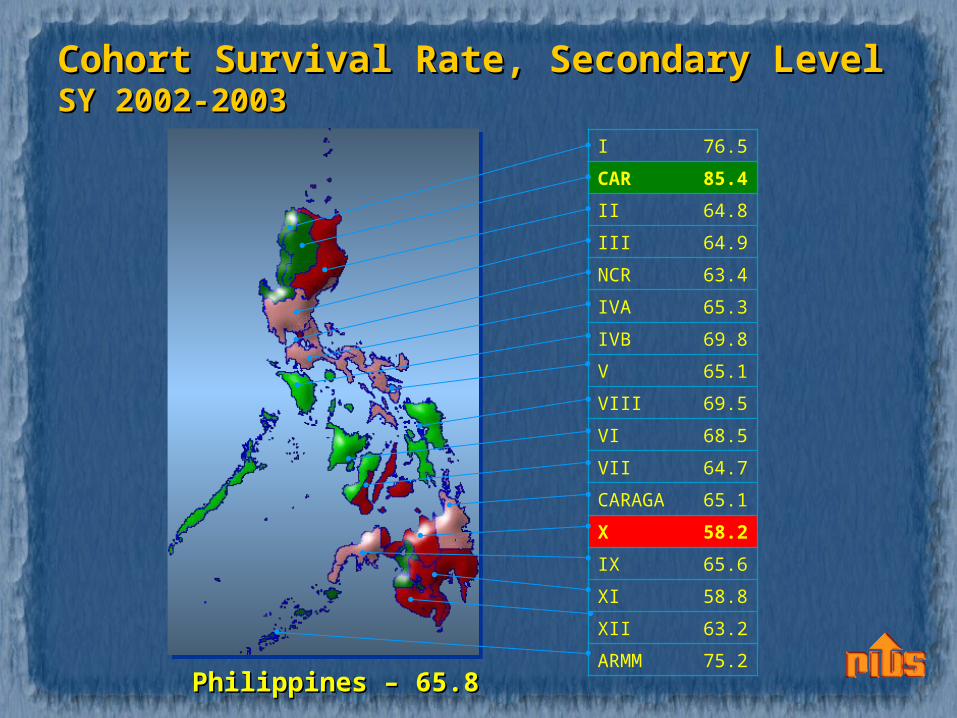
Cohort Survival Rate, Secondary LevelCohort Survival Rate, Secondary LevelSY 2002-2003SY 2002-2003
I 76.5
CAR 85.4
II 64.8
III 64.9
NCR 63.4
IVA 65.3
IVB 69.8
V 65.1
VIII 69.5
VI 68.5
VII 64.7
CARAGA 65.1
X 58.2
IX 65.6
XI 58.8
XII 63.2
ARMM 75.2Philippines – 65.8Philippines – 65.8
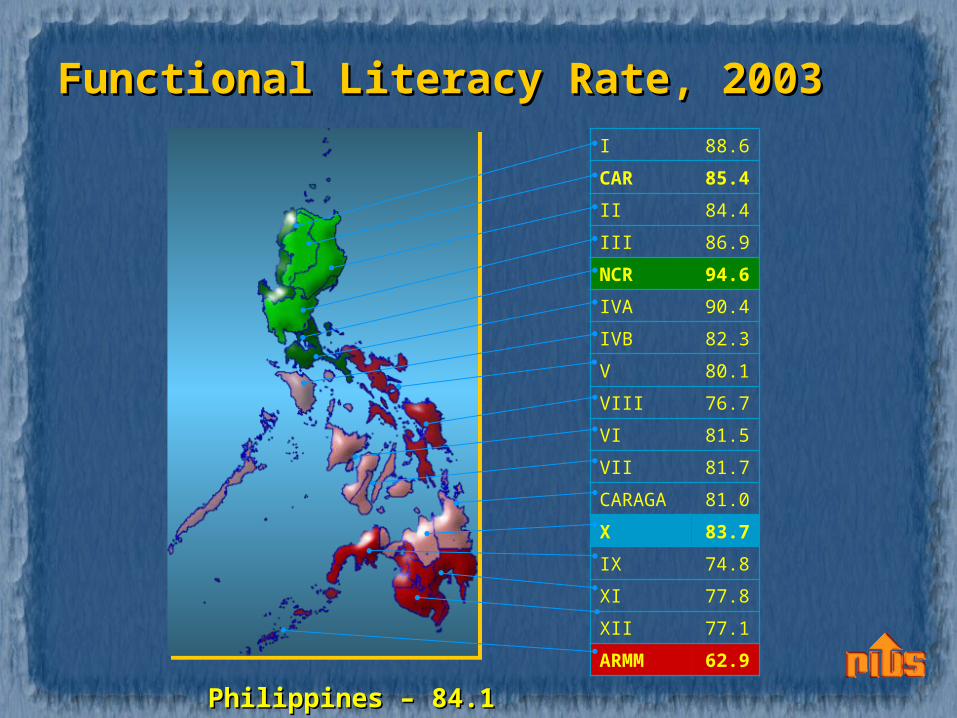
Functional Literacy Rate, 2003Functional Literacy Rate, 2003I 88.6
CAR 85.4
II 84.4
III 86.9
NCR 94.6
IVA 90.4
IVB 82.3
V 80.1
VIII 76.7
VI 81.5
VII 81.7
CARAGA 81.0
X 83.7
IX 74.8
XI 77.8
XII 77.1
ARMM 62.9
Philippines – 84.1Philippines – 84.1
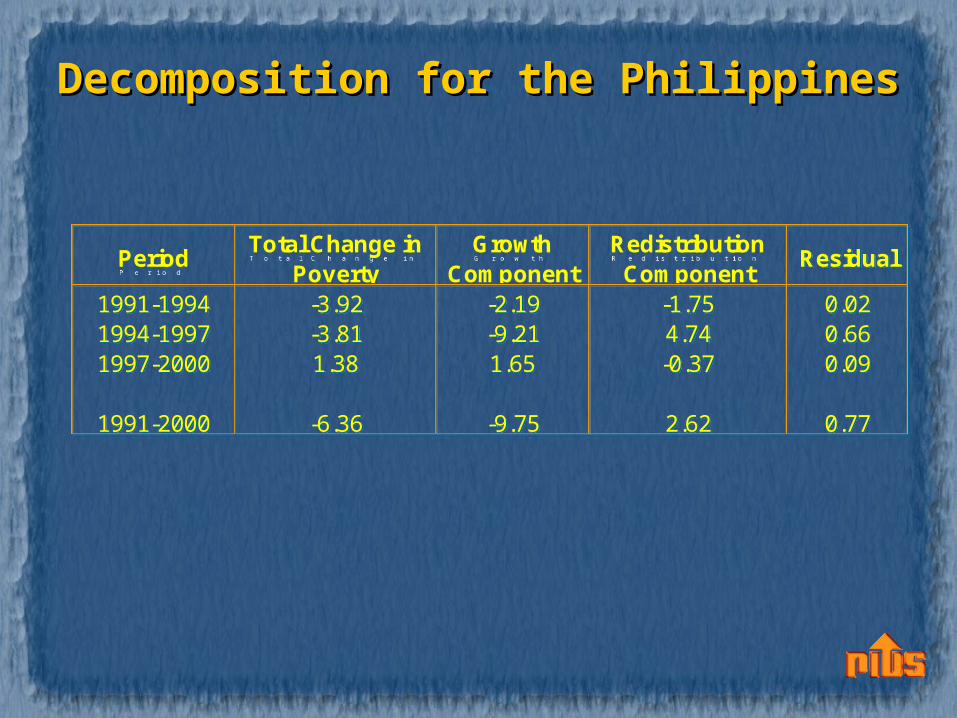
Decomposition for the PhilippinesDecomposition for the Philippines
1991-1994 -3.92 -2.19 -1.75 0.021994-1997 -3.81 -9.21 4.74 0.661997-2000 1.38 1.65 -0.37 0.09
1991-2000 -6.36 -9.75 2.62 0.77
ResidualPeriodTotal Change in
Poverty Growth
ComponentRedistribution Component
1991-1994 -3.92 -2.19 -1.75 0.021994-1997 -3.81 -9.21 4.74 0.661997-2000 1.38 1.65 -0.37 0.09
1991-2000 -6.36 -9.75 2.62 0.77
ResidualPeriodTotal Change in
Poverty Growth
ComponentRedistribution Component

Decomposition of Poverty Decomposition of Poverty IncidenceIncidencePhilippinesPhilippines
-3.9
-2.2-1.8
-3.8
-9.2
4.7
1.4 1.7
-0.4
-6.4
-9.7
2.6
-10.00
-8.00
-6.00
-4.00
-2.00
0.00
2.00
4.00
6.00
1991-1994 1994-1997 1997-2000 1991-2000
total change in poverty incidence
growth component
redistribution component
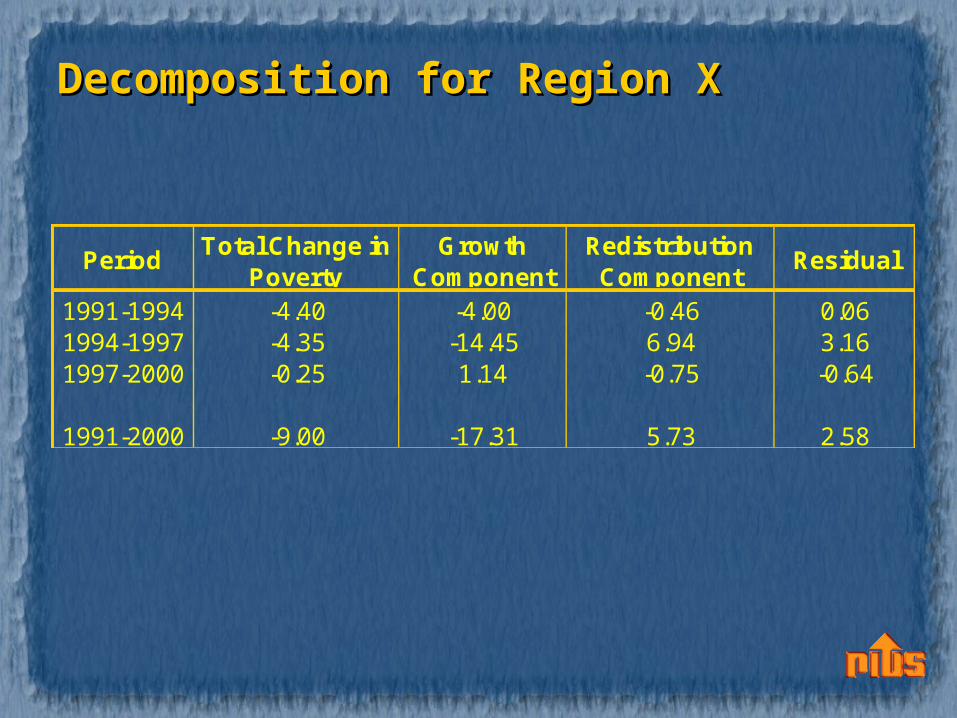
Decomposition for Region XDecomposition for Region X
1991-1994 -4.40 -4.00 -0.46 0.061994-1997 -4.35 -14.45 6.94 3.161997-2000 -0.25 1.14 -0.75 -0.64
1991-2000 -9.00 -17.31 5.73 2.58
ResidualPeriod Total Change in Poverty
Growth Component
Redistribution Component
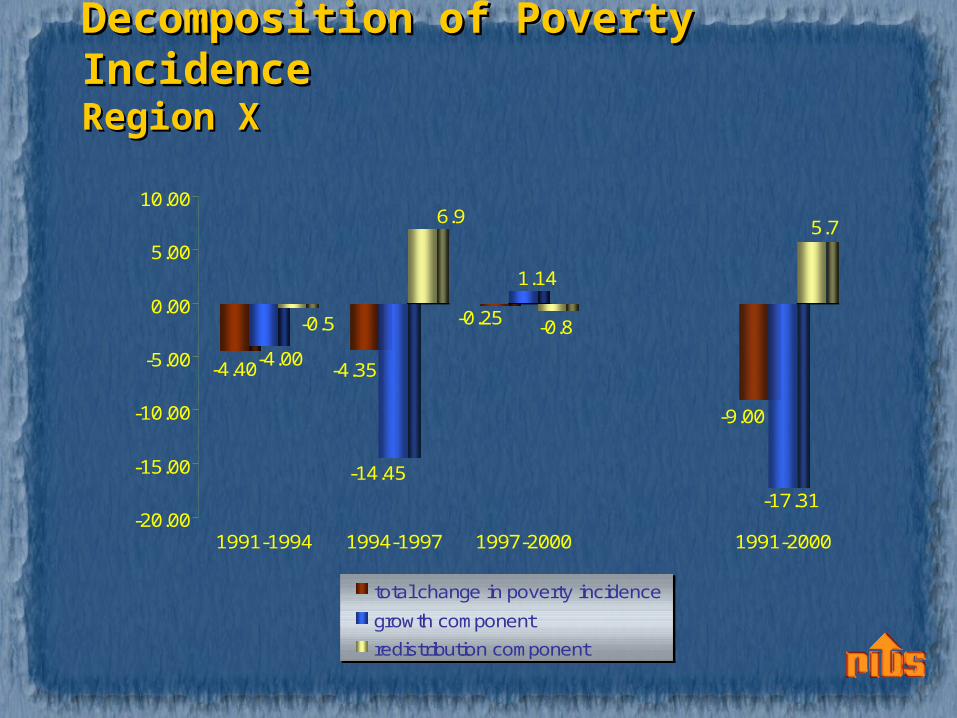
Decomposition of Poverty IncidenceDecomposition of Poverty IncidenceRegion XRegion X
-4.40-4.00
-0.5
-4.35
-14.45
6.9
-0.25
1.14
-0.8
-9.00
-17.31
5.7
-20.00
-15.00
-10.00
-5.00
0.00
5.00
10.00
1991-1994 1994-1997 1997-2000 1991-2000
total change in poverty incidence
growth component
redistribution component
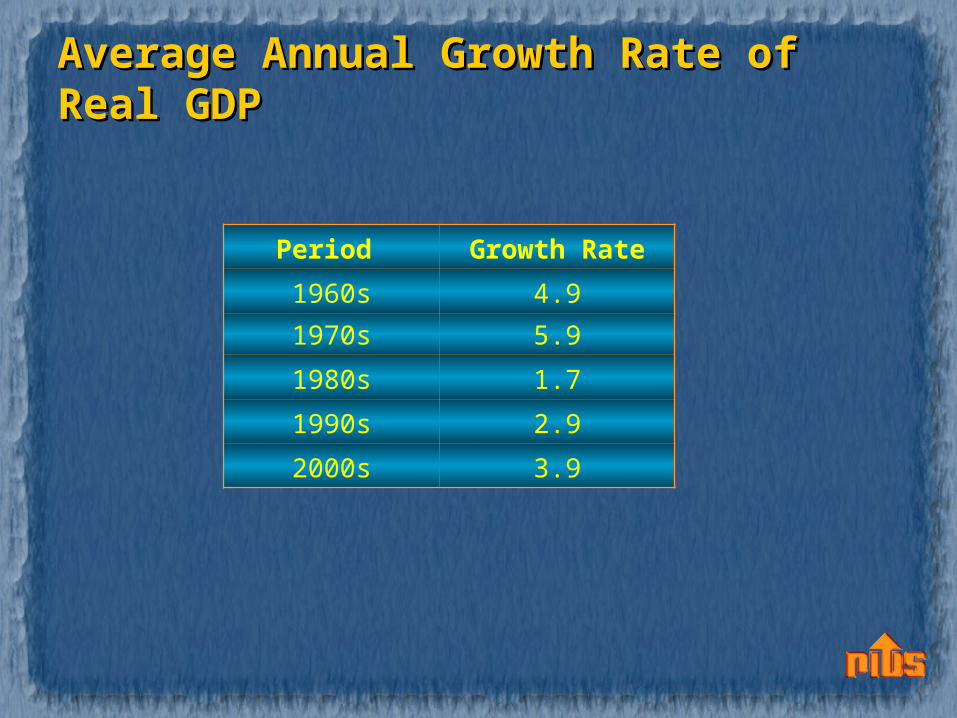
Average Annual Growth Rate of Average Annual Growth Rate of Real GDP Real GDP
Period Growth Rate
1960s 4.9
1970s 5.9
1980s 1.7
1990s 2.9
2000s 3.9
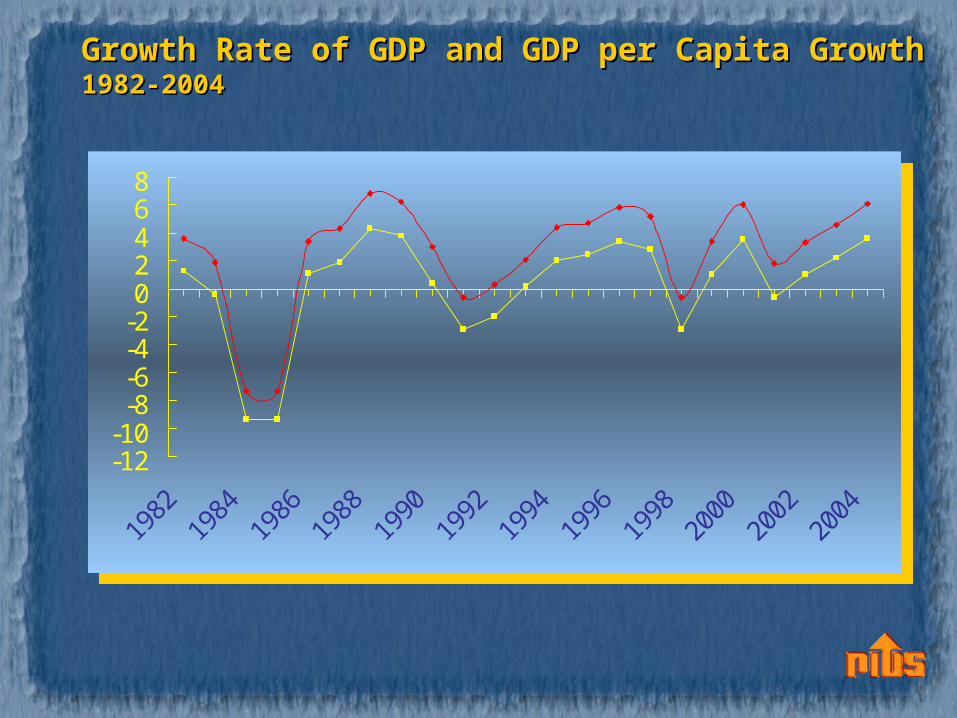
Growth Rate of GDP and GDP per Capita GrowthGrowth Rate of GDP and GDP per Capita Growth1982-20041982-2004
-12-10-8-6-4-202468
-12-10-8-6-4-202468

Per Capita GRDP, 2004Per Capita GRDP, 2004(at Constant 1985 Prices In Pesos)(at Constant 1985 Prices In Pesos)
0
5000
10000
15000
20000
25000
30000
35000
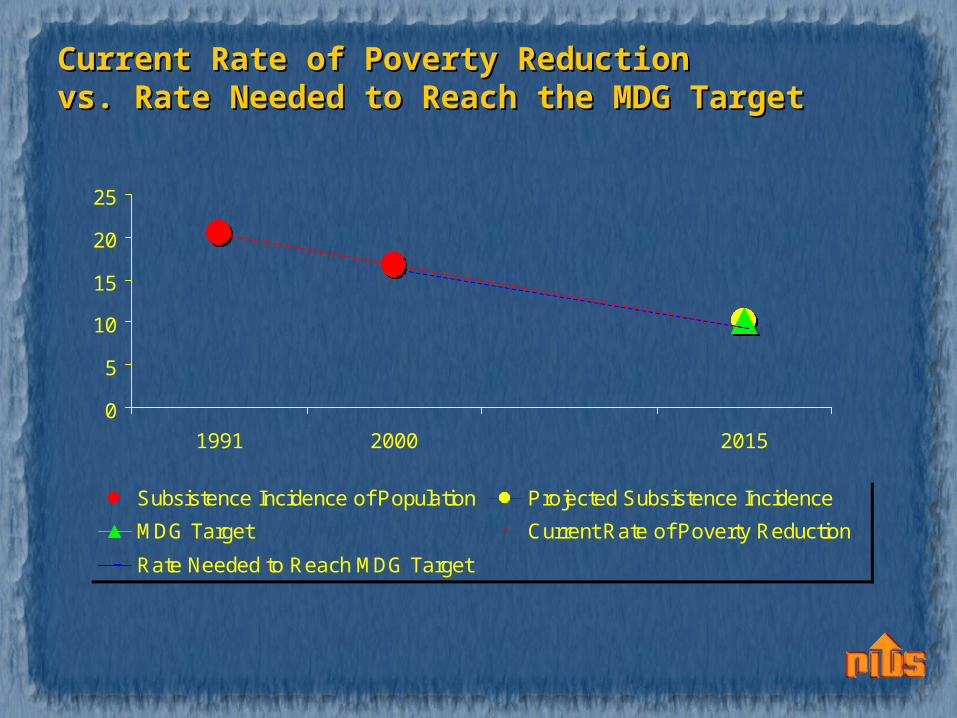
Current Rate of Poverty ReductionCurrent Rate of Poverty Reductionvs. Rate Needed to Reach the MDG Targetvs. Rate Needed to Reach the MDG Target
0
5
10
15
20
25
1991 2000 2015
Subsistence Incidence of Population Projected Subsistence Incidence
MDG Target Current Rate of Poverty Reduction
Rate Needed to Reach MDG Target