Embed Size (px)
Citation preview
Winter School on
Inequality & Social Welfare Theory
Socioeconomic Gradient in Health:
Description & Causes
Owen O’Donnell
Erasmus University Rotterdam
Tinbergen Institute
University of Lausanne
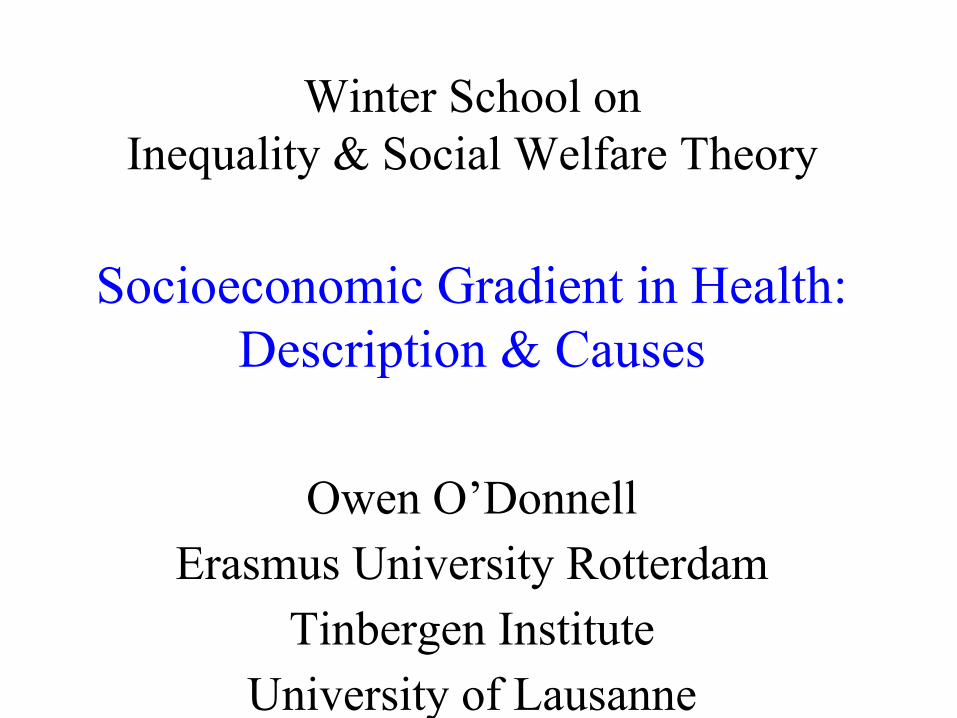
Outline
• Description of gradient
• Trends in gradient
• (Economic) Theory
• Causal evidence: SES health
• Causal evidence: Health SES
Description of the gradient
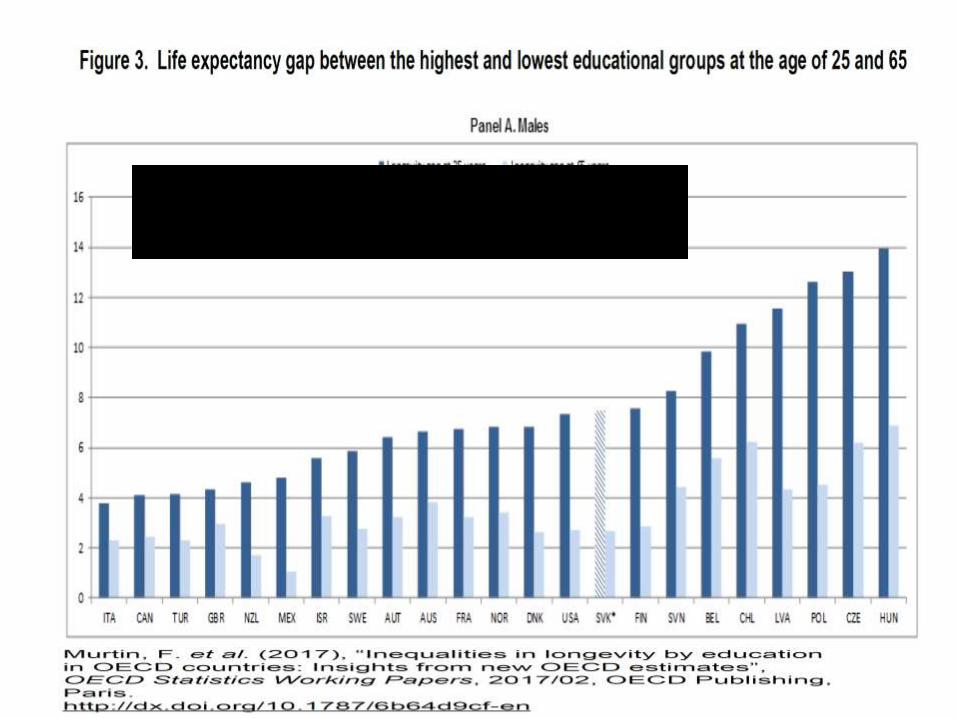
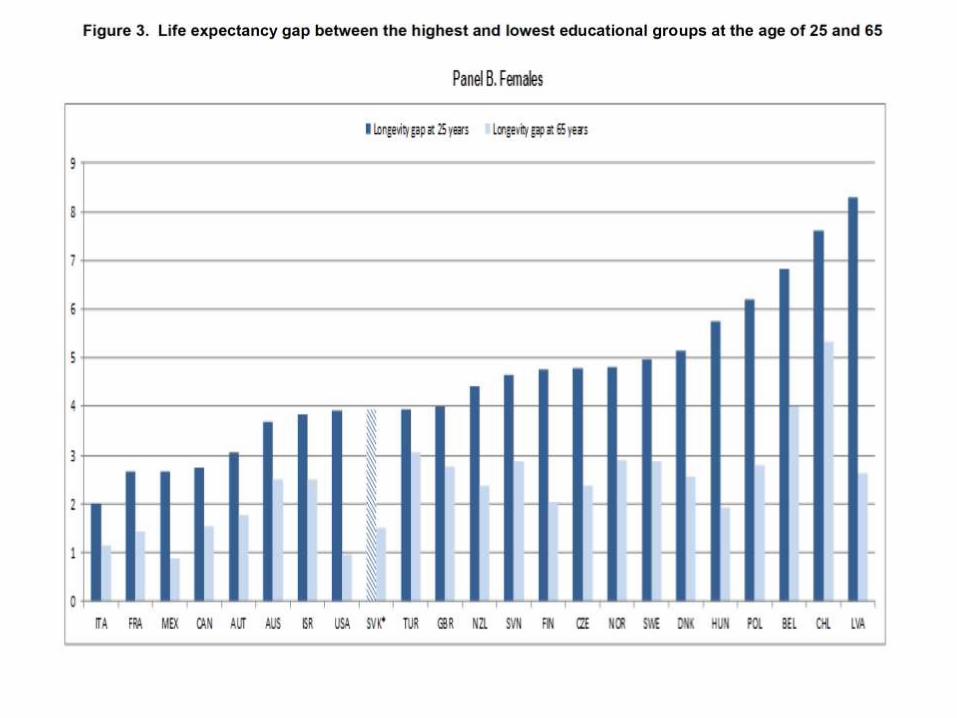
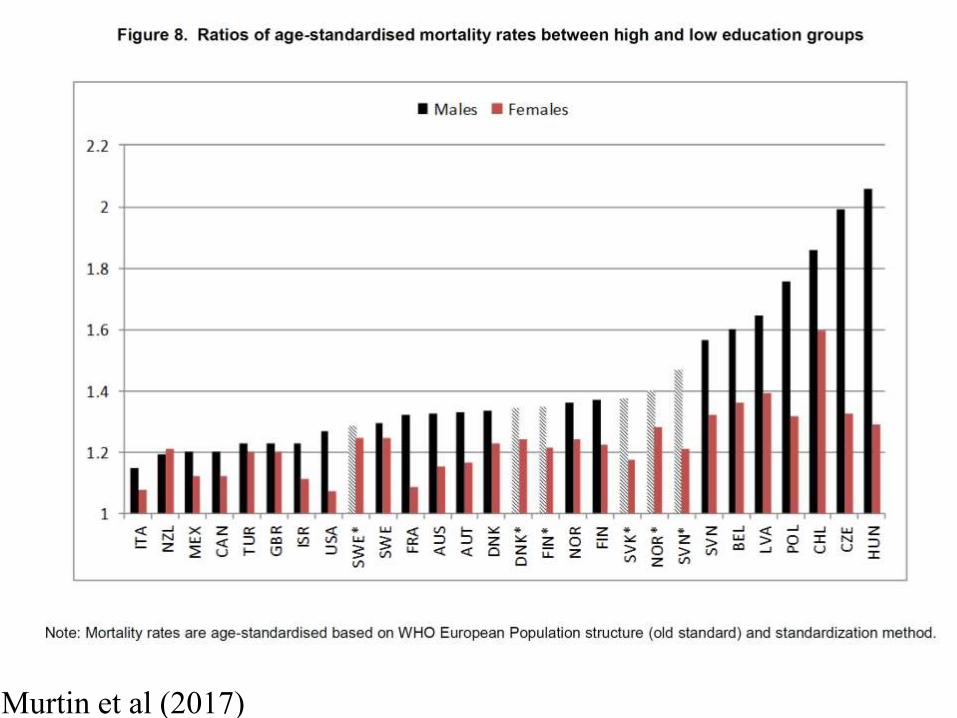
Murtin et al (2017)

UNITED STATES
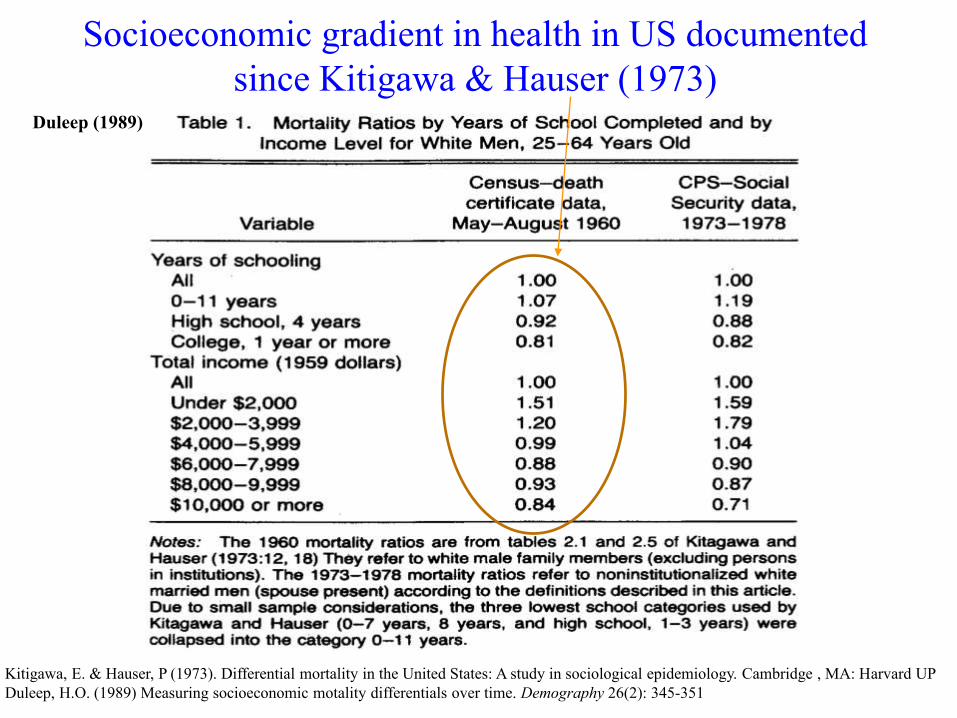
Socioeconomic gradient in health in US documented
since Kitigawa & Hauser (1973)
Kitigawa, E. & Hauser, P (1973). Differential mortality in the United States: A study in sociological epidemiology. Cambridge , MA: Harvard UP
Duleep, H.O. (1989) Measuring socioeconomic motality differentials over time. Demography 26(2): 345-351
Duleep (1989)
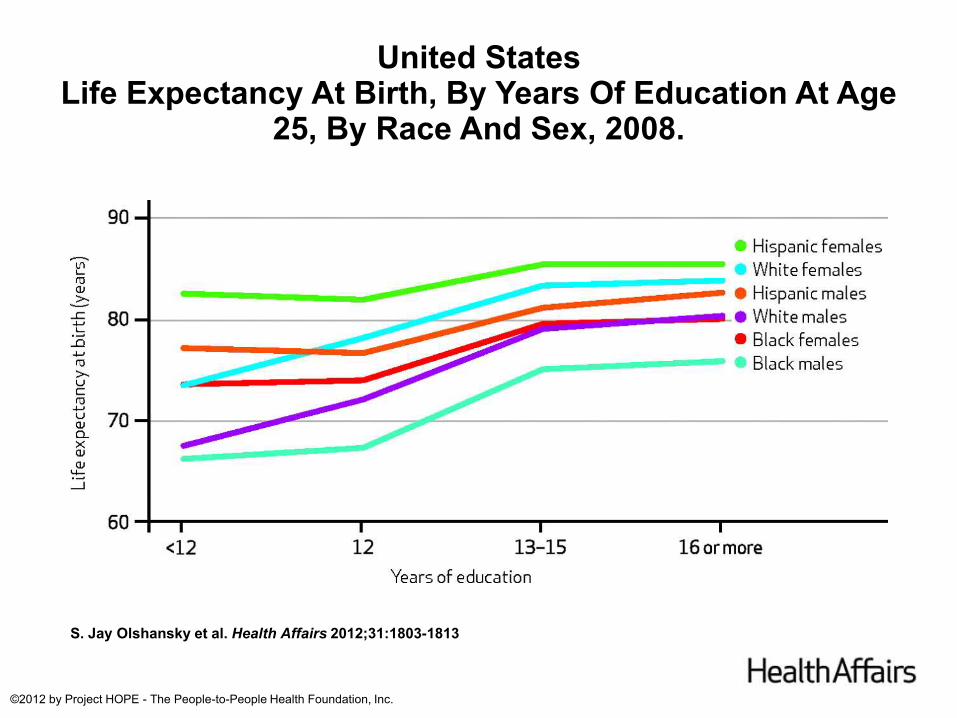
United StatesLife Expectancy At Birth, By Years Of Education At Age
25, By Race And Sex, 2008.
S. Jay Olshansky et al. Health Affairs 2012;31:1803-1813
©2012 by Project HOPE - The People-to-People Health Foundation, Inc.
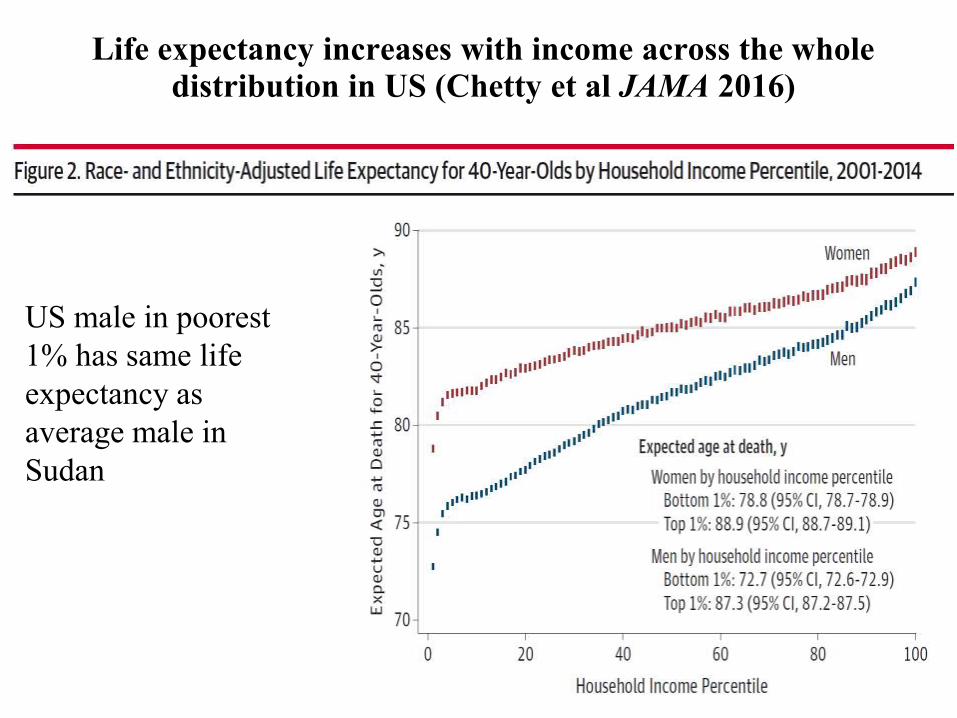
Life expectancy increases with income across the whole distribution in US (Chetty et al JAMA 2016)
US male in poorest
1% has same life
expectancy as
average male in
Sudan
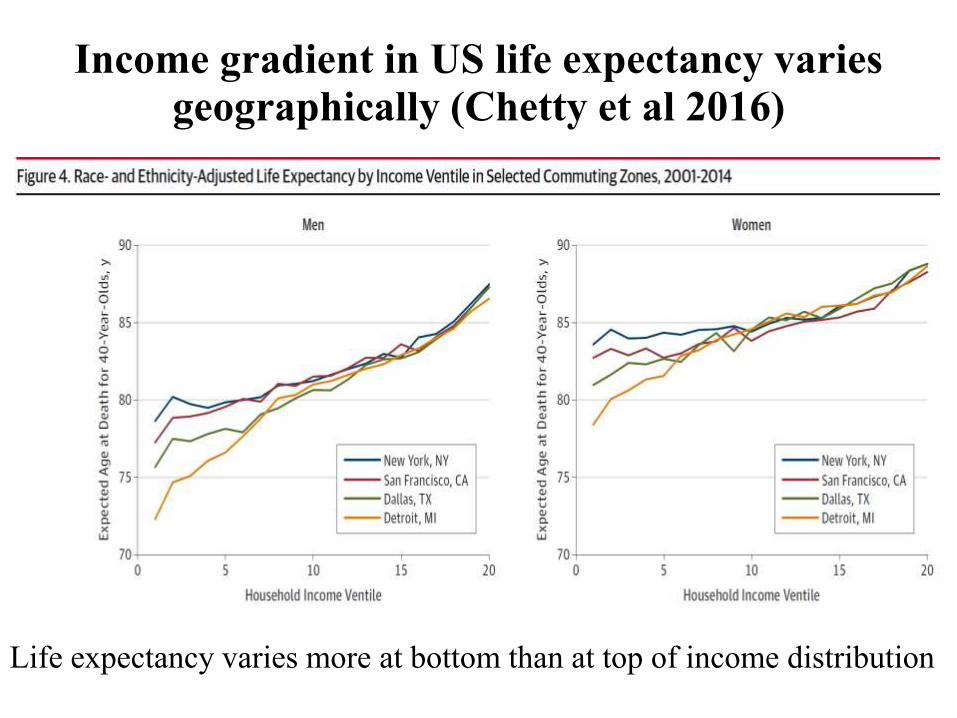
Income gradient in US life expectancy varies geographically (Chetty et al 2016)
Life expectancy varies more at bottom than at top of income distribution
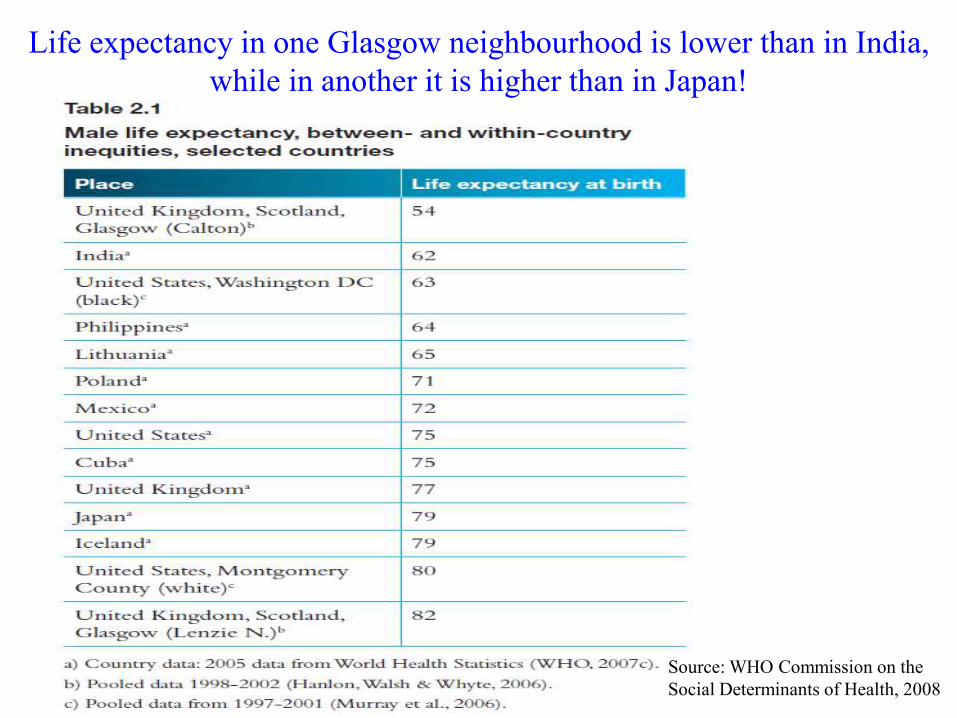
Life expectancy in one Glasgow neighbourhood is lower than in India,
while in another it is higher than in Japan!
Source: WHO Commission on the
Social Determinants of Health, 2008
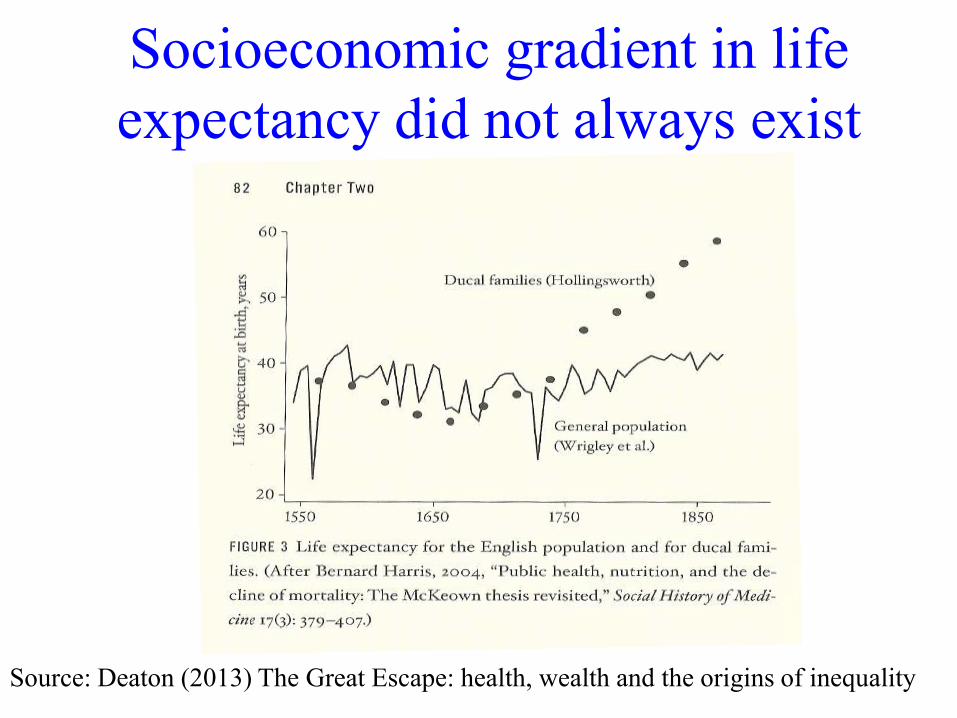
Socioeconomic gradient in life
expectancy did not always exist
Source: Deaton (2013) The Great Escape: health, wealth and the origins of inequality
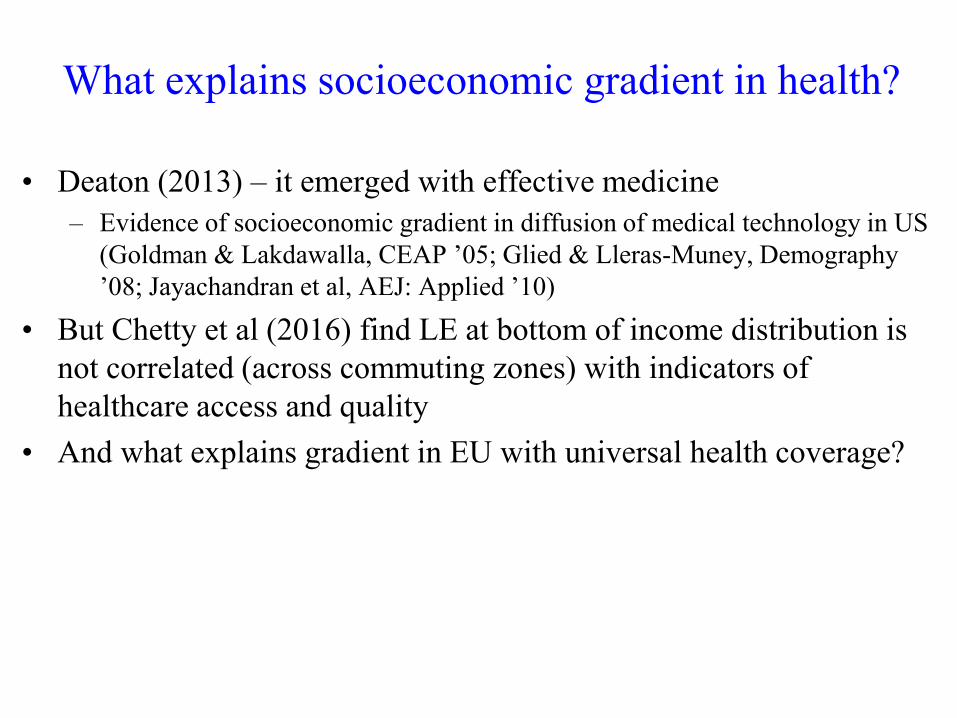
What explains socioeconomic gradient in health?
• Deaton (2013) – it emerged with effective medicine
– Evidence of socioeconomic gradient in diffusion of medical technology in US
(Goldman & Lakdawalla, CEAP ’05; Glied & Lleras-Muney, Demography
’08; Jayachandran et al, AEJ: Applied ’10)
• But Chetty et al (2016) find LE at bottom of income distribution is
not correlated (across commuting zones) with indicators of
healthcare access and quality
• And what explains gradient in EU with universal health coverage?
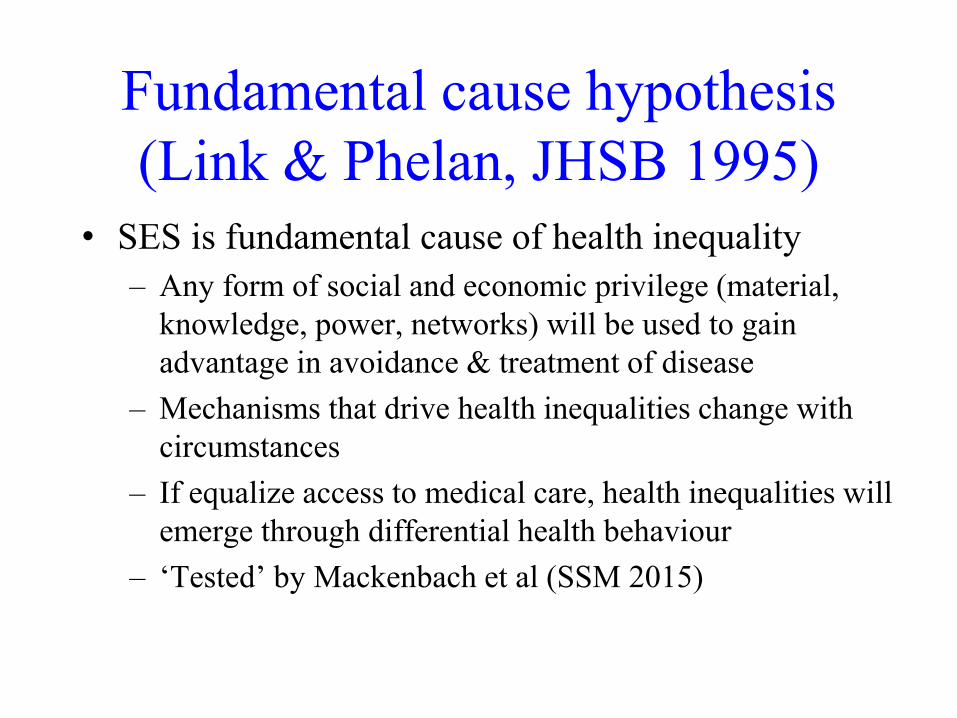
Fundamental cause hypothesis
(Link & Phelan, JHSB 1995)
• SES is fundamental cause of health inequality
– Any form of social and economic privilege (material,
knowledge, power, networks) will be used to gain
advantage in avoidance & treatment of disease
– Mechanisms that drive health inequalities change with
circumstances
– If equalize access to medical care, health inequalities will
emerge through differential health behaviour
– ‘Tested’ by Mackenbach et al (SSM 2015)
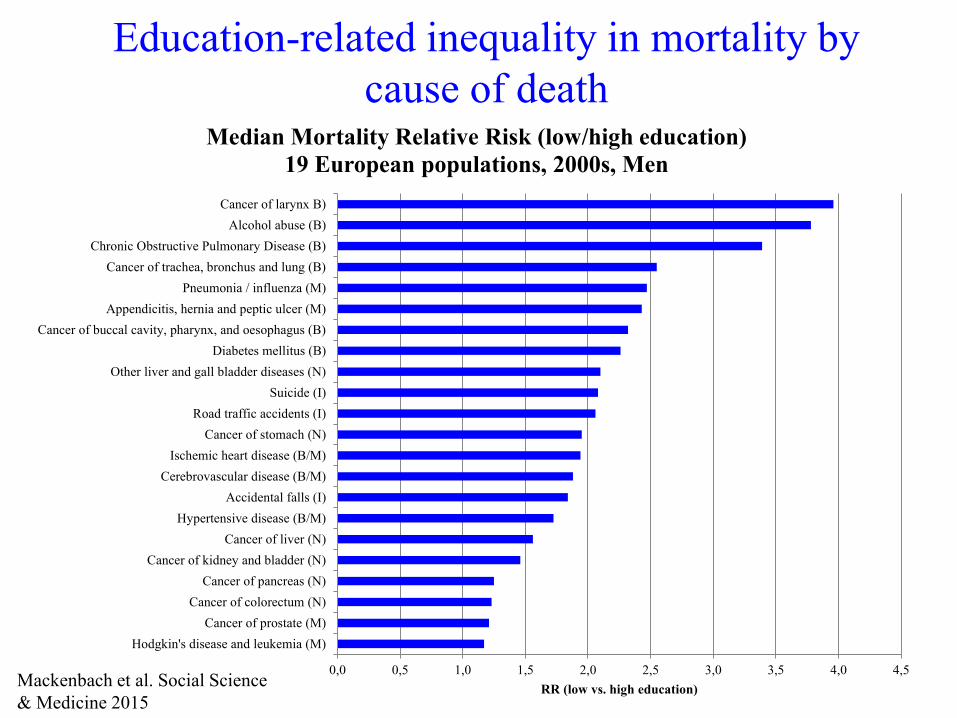
Education-related inequality in mortality by
cause of death
0,0 0,5 1,0 1,5 2,0 2,5 3,0 3,5 4,0 4,5
Hodgkin's disease and leukemia (M)
Cancer of prostate (M)
Cancer of colorectum (N)
Cancer of pancreas (N)
Cancer of kidney and bladder (N)
Cancer of liver (N)
Hypertensive disease (B/M)
Accidental falls (I)
Cerebrovascular disease (B/M)
Ischemic heart disease (B/M)
Cancer of stomach (N)
Road traffic accidents (I)
Suicide (I)
Other liver and gall bladder diseases (N)
Diabetes mellitus (B)
Cancer of buccal cavity, pharynx, and oesophagus (B)
Appendicitis, hernia and peptic ulcer (M)
Pneumonia / influenza (M)
Cancer of trachea, bronchus and lung (B)
Chronic Obstructive Pulmonary Disease (B)
Alcohol abuse (B)
Cancer of larynx B)
RR (low vs. high education)
Median Mortality Relative Risk (low/high education)
19 European populations, 2000s, Men
Mackenbach et al. Social Science
& Medicine 2015
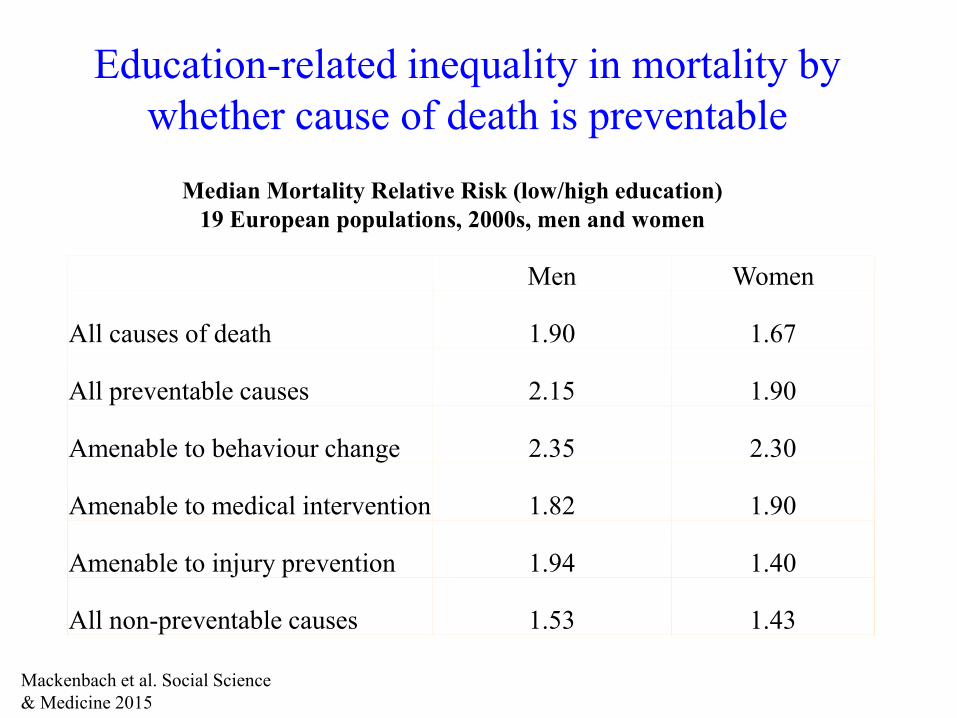
Education-related inequality in mortality by
whether cause of death is preventable
Men Women
All causes of death 1.90 1.67
All preventable causes 2.15 1.90
Amenable to behaviour change 2.35 2.30
Amenable to medical intervention 1.82 1.90
Amenable to injury prevention 1.94 1.40
All non-preventable causes 1.53 1.43
Median Mortality Relative Risk (low/high education)
19 European populations, 2000s, men and women
Mackenbach et al. Social Science
& Medicine 2015
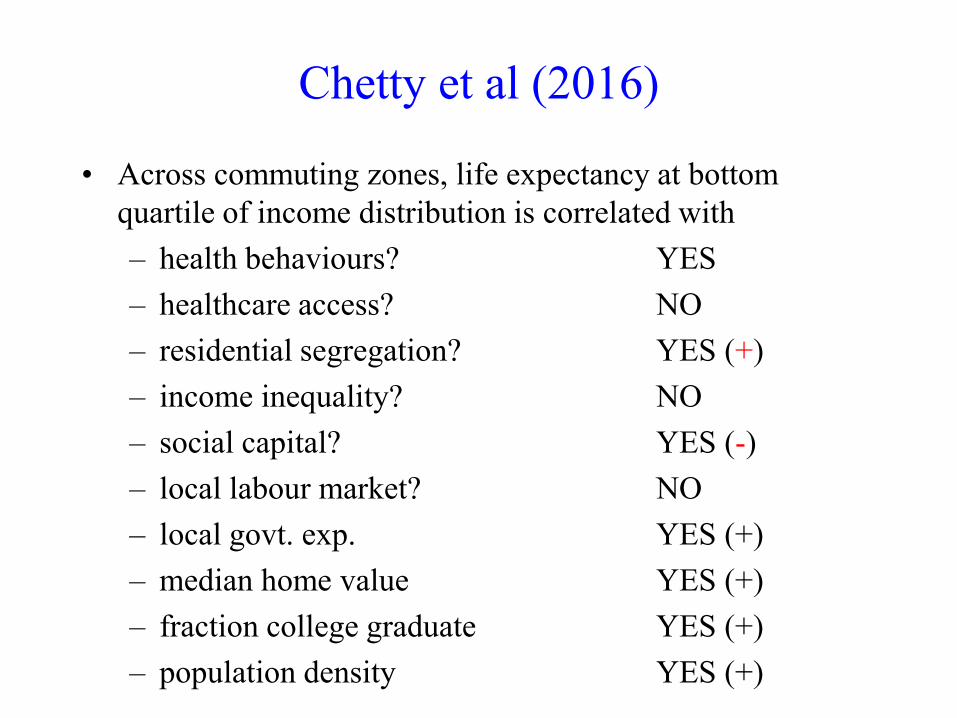
Chetty et al (2016)
• Across commuting zones, life expectancy at bottom
quartile of income distribution is correlated with
– health behaviours? YES
– healthcare access? NO
– residential segregation? YES (+)
– income inequality? NO
– social capital? YES (-)
– local labour market? NO
– local govt. exp. YES (+)
– median home value YES (+)
– fraction college graduate YES (+)
– population density YES (+)
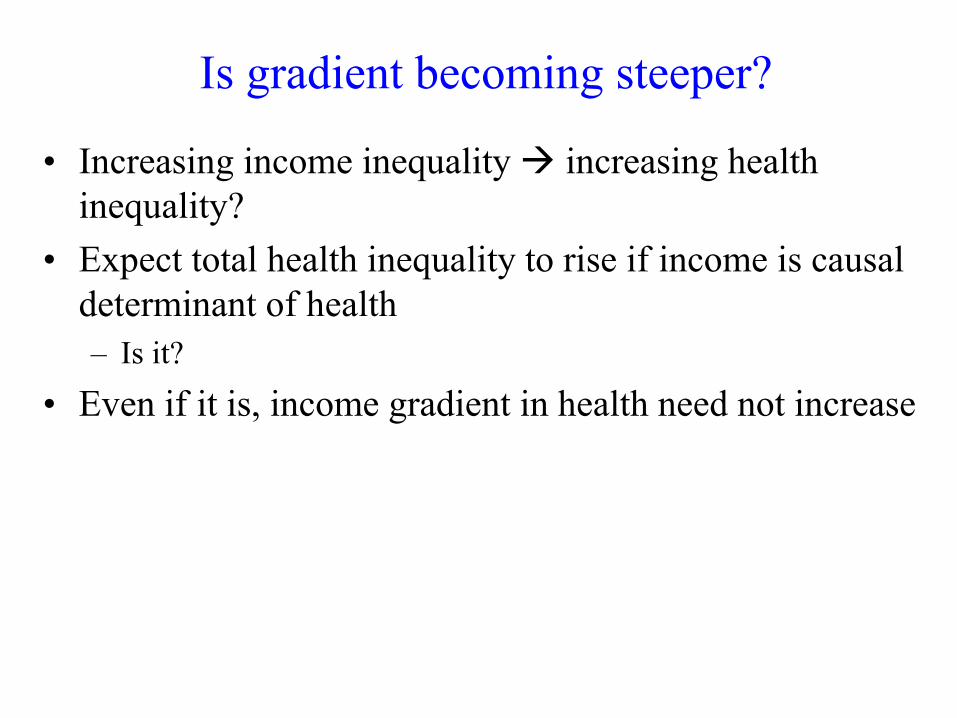
Is gradient becoming steeper?
• Increasing income inequality increasing health
inequality?
• Expect total health inequality to rise if income is causal
determinant of health
– Is it?
• Even if it is, income gradient in health need not increase
Is gradient becoming steeper in US?
• Yes according to:
– Case & Deaton (Brookings Papers 2017)
– Chetty et al. (JAMA 2016)
– Cutler et al. (Journal Health Economics 2011)
– National Academies of Sciences (2015)
– Olshansky et al. Health Affairs (2012)
Trend in education gradient in
life expectancy
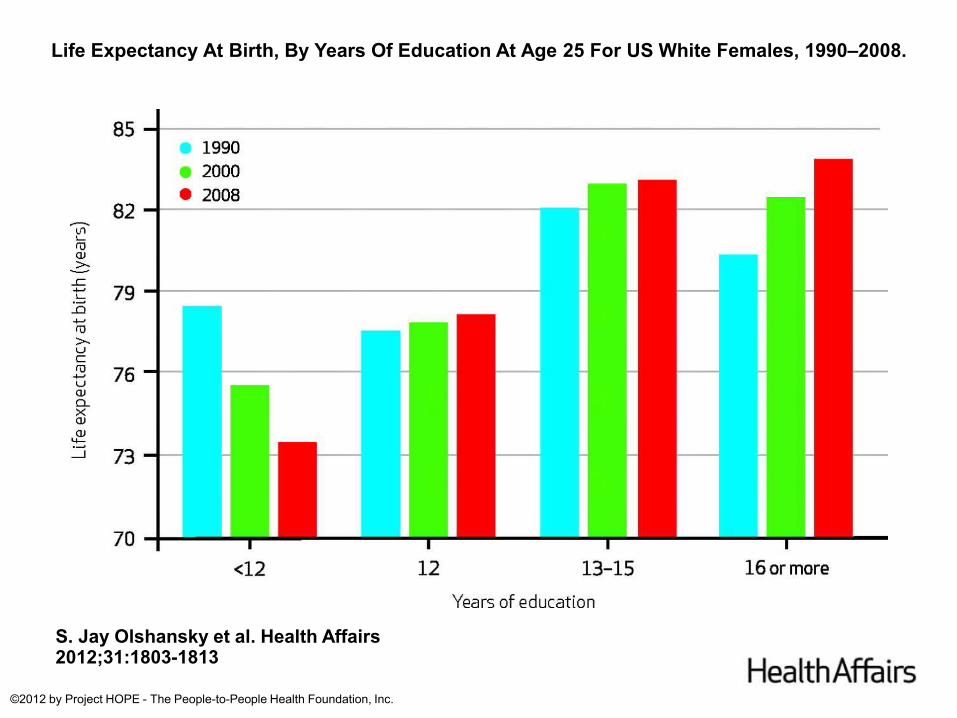
Life Expectancy At Birth, By Years Of Education At Age 25 For US White Females, 1990–2008.
S. Jay Olshansky et al. Health Affairs 2012;31:1803-1813
©2012 by Project HOPE - The People-to-People Health Foundation, Inc.
But low education group is
shrinking
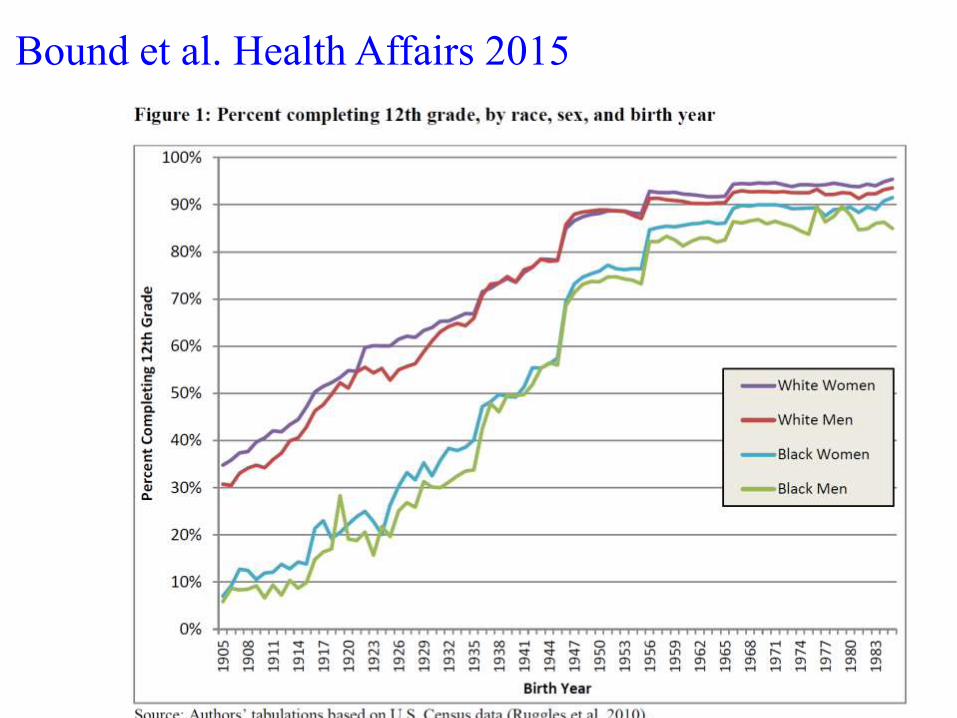
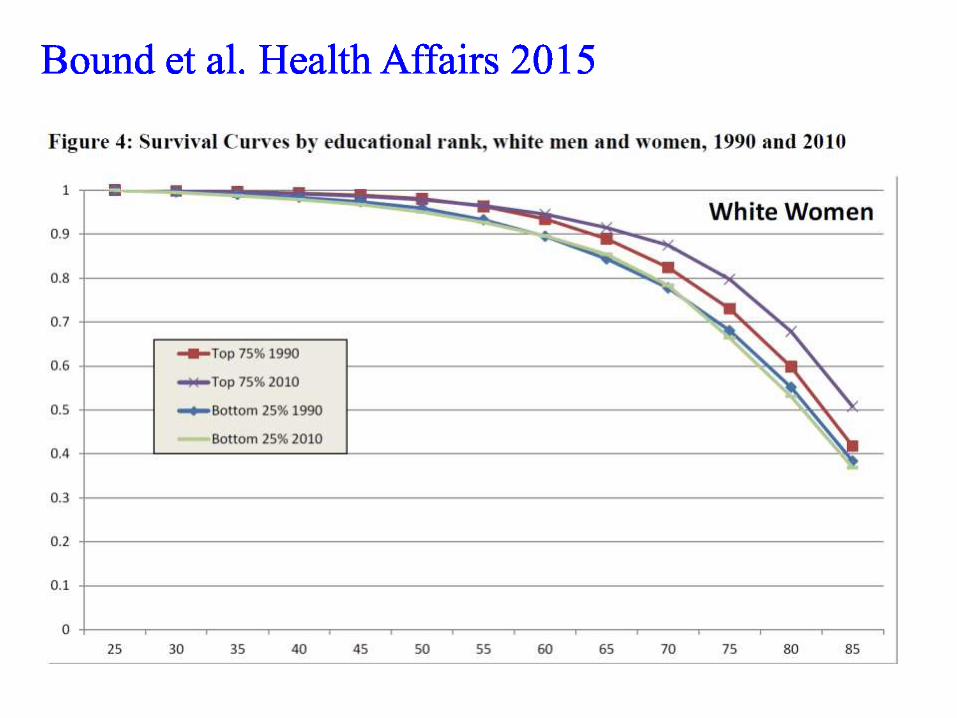
Bound et al. Health Affairs 2015
Not comparing like with like
• Smaller low education group likely to be
different in composition
• Least healthy left behind
• Bound et al. Health Affairs (2015) examine
trends in mortality rate in bottom quartile of
education distribution
• (see Goldring et al JHE (2016) for another
correction)
Trend in income gradient in life
expectancy
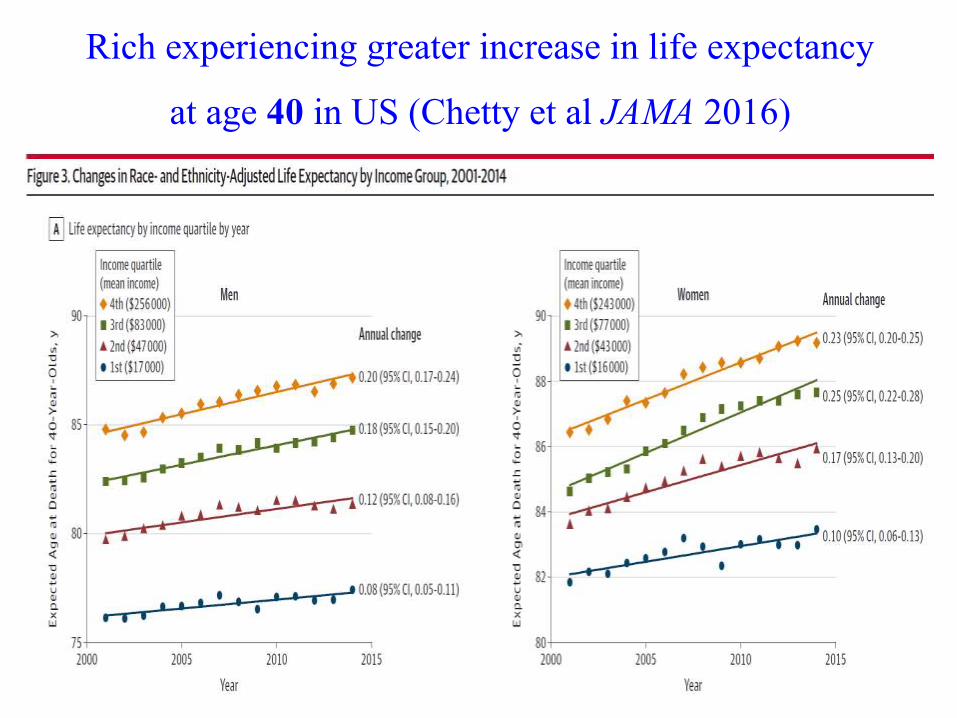
Rich experiencing greater increase in life expectancy
at age 40 in US (Chetty et al JAMA 2016)
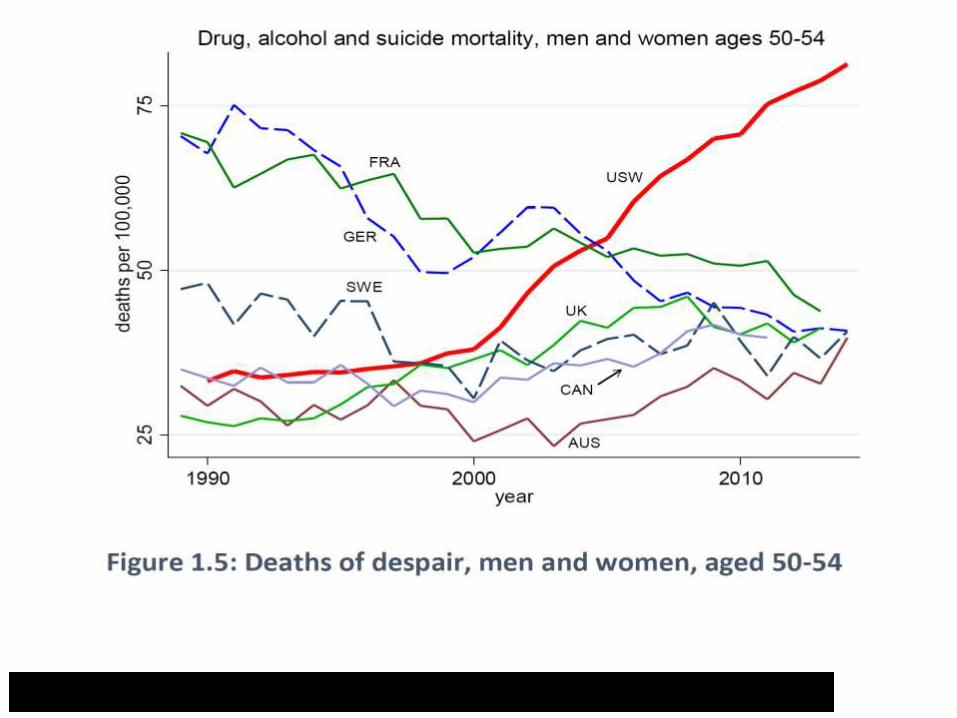
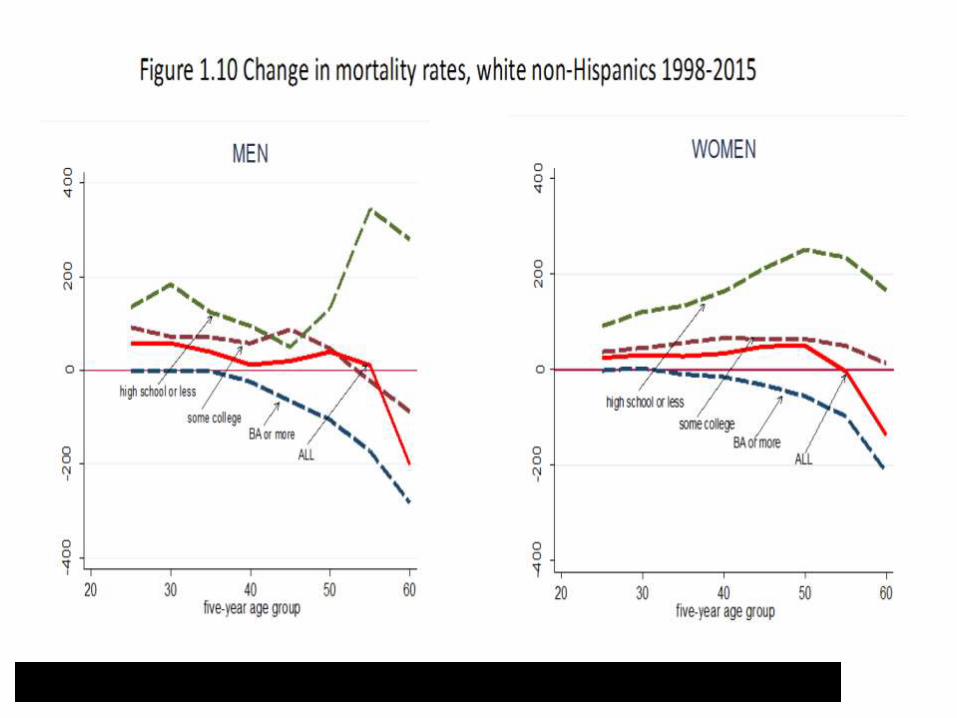
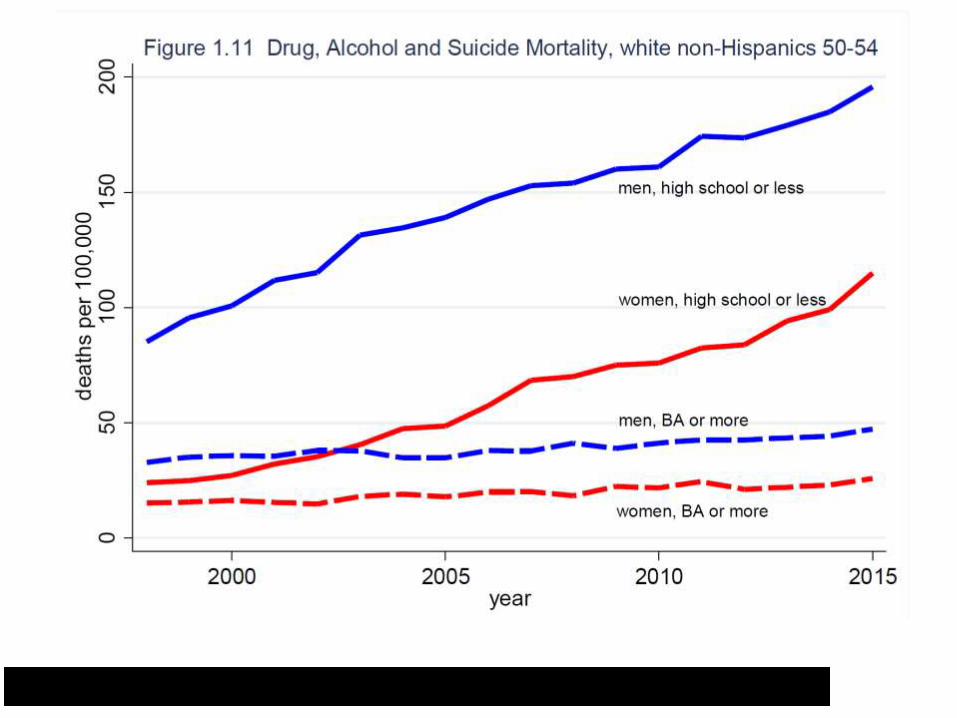
Rising mortality of middle-aged
whites in US…..
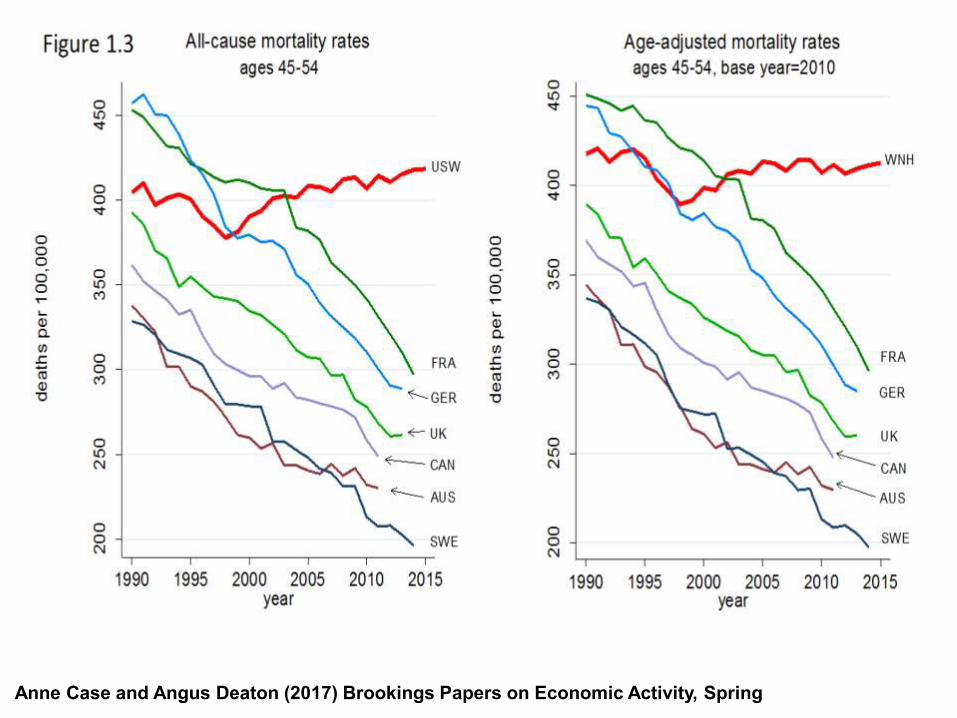
Anne Case and Angus Deaton (2017) Brookings Papers on Economic Activity, Spring
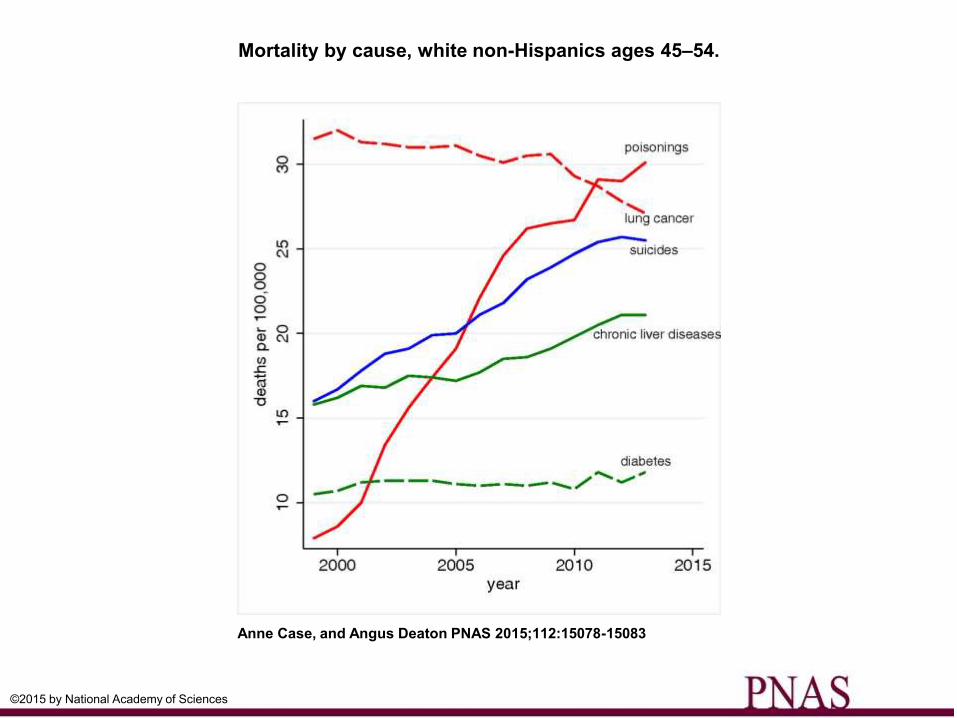
Mortality by cause, white non-Hispanics ages 45–54.
Anne Case, and Angus Deaton PNAS 2015;112:15078-15083
©2015 by National Academy of Sciences
But what is happening to SES
mortality gradient at younger ages?
Currie & Schwandt JEP &
Science 2016
• Compare life expectancy at birth across US
counties ranked by poverty rates
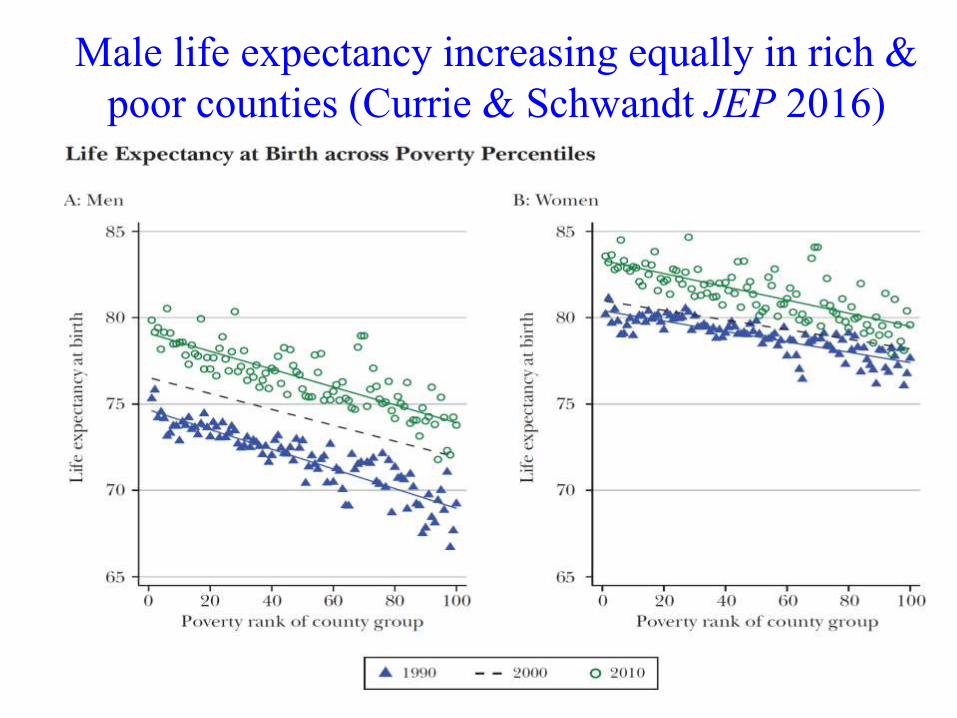
Male life expectancy increasing equally in rich &
poor counties (Currie & Schwandt JEP 2016)
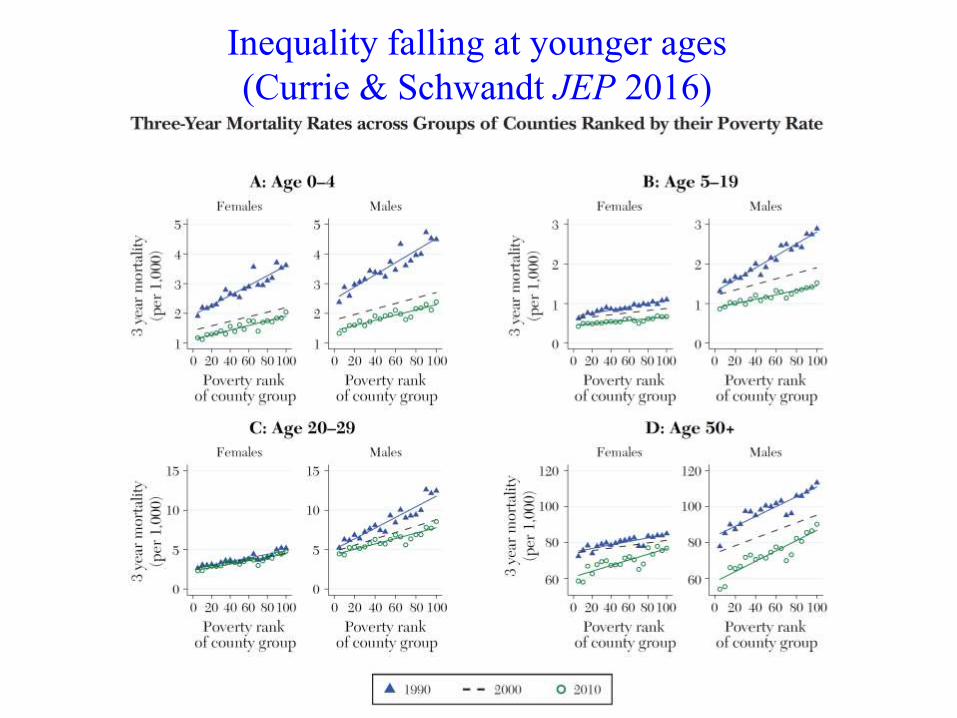
Inequality falling at younger ages
(Currie & Schwandt JEP 2016)
Is gradient becoming steeper in
Europe?
0
200
400
600
800
1000
1200
1400
1600
1800
Rate
diffe
ren
ce (
age
-ad
juste
d, 3
0-7
4 y
ea
rs)
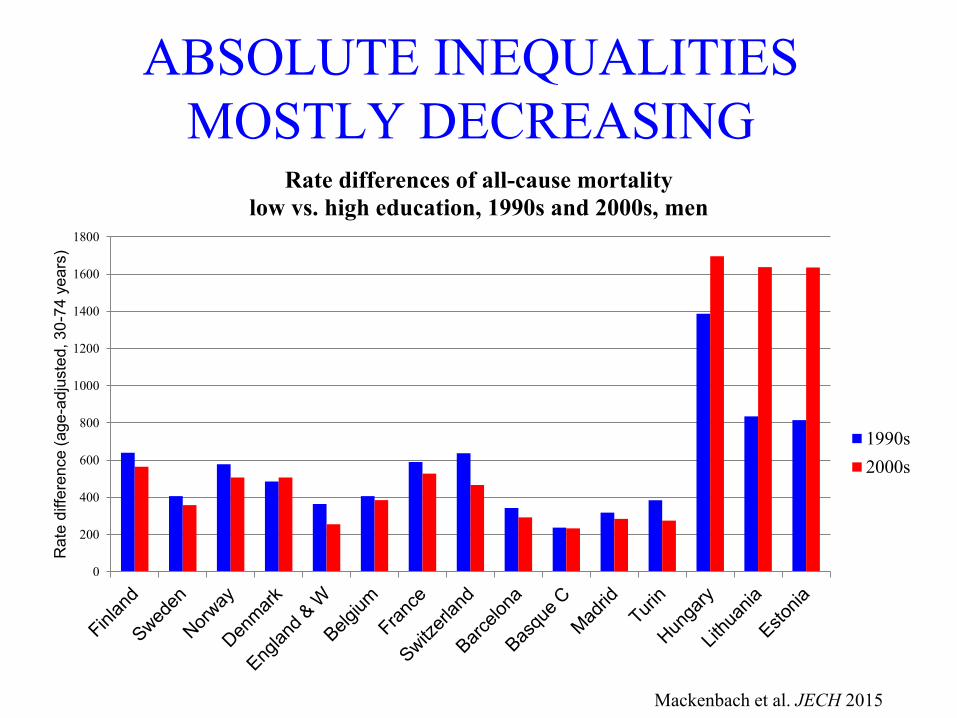
Rate differences of all-cause mortality
low vs. high education, 1990s and 2000s, men
1990s
2000s
ABSOLUTE INEQUALITIES
MOSTLY DECREASING
Mackenbach et al. JECH 2015
0
0,5
1
1,5
2
2,5
3
3,5
Ra
te R
atio
(age
-ad
juste
d, 3
0-7
4 y
ea
rs)
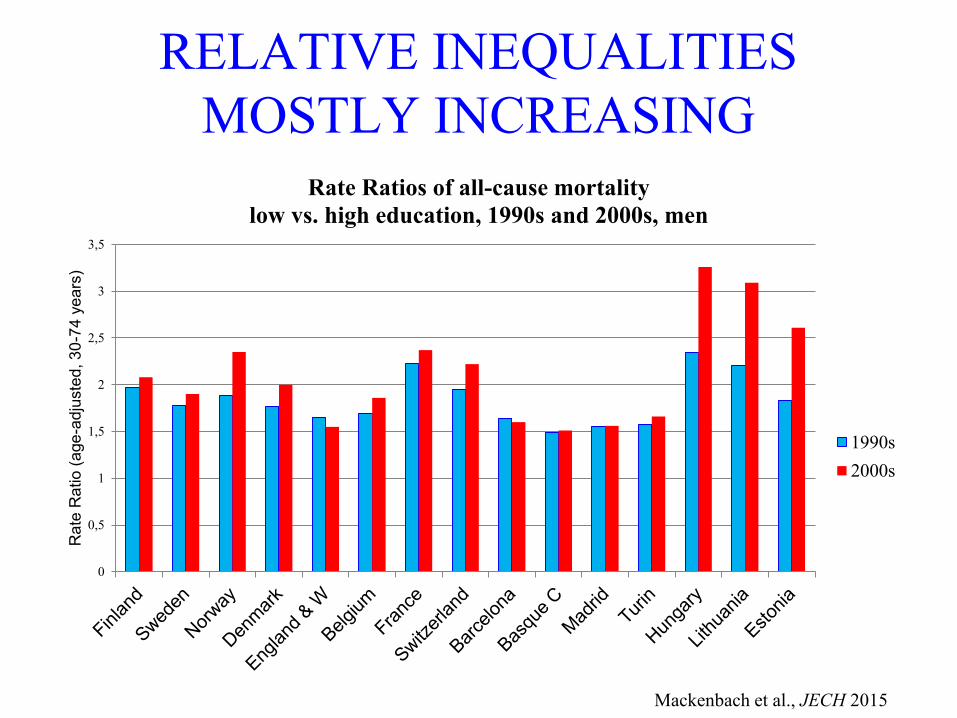
Rate Ratios of all-cause mortality
low vs. high education, 1990s and 2000s, men
1990s
2000s
RELATIVE INEQUALITIES
MOSTLY INCREASING
Mackenbach et al., JECH 2015
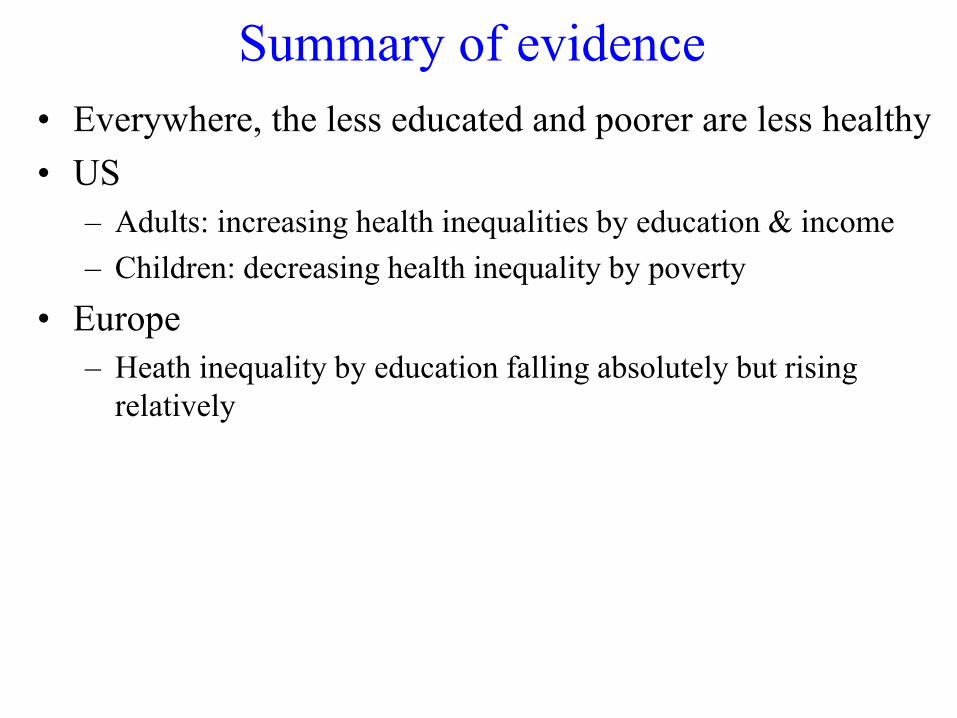
Summary of evidence
• Everywhere, the less educated and poorer are less healthy
• US
– Adults: increasing health inequalities by education & income
– Children: decreasing health inequality by poverty
• Europe
– Heath inequality by education falling absolutely but rising
relatively
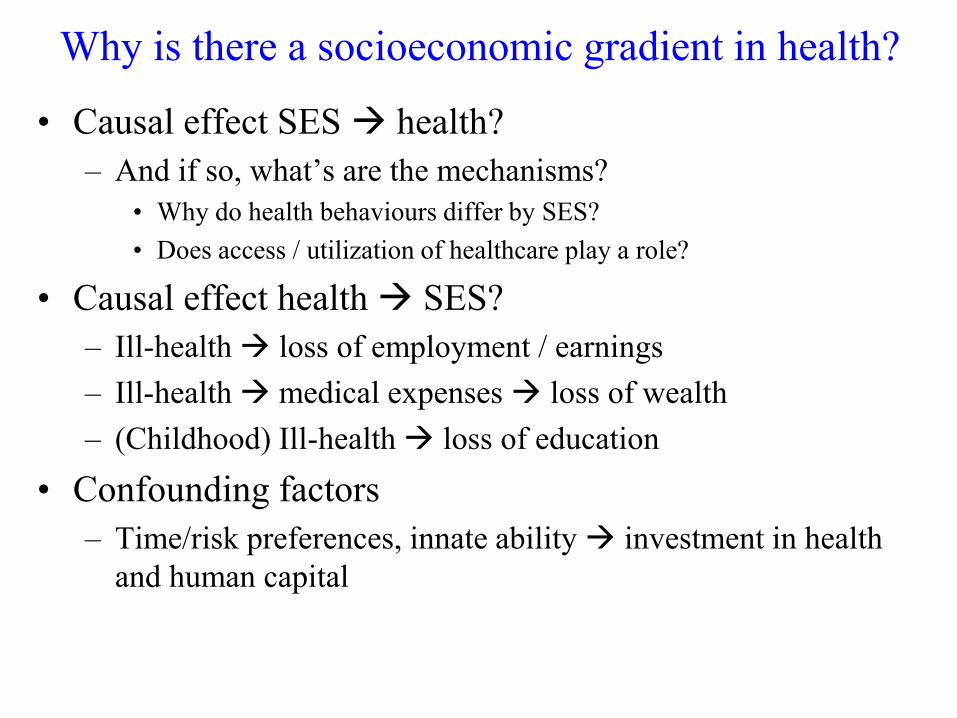
Why is there a socioeconomic gradient in health?
• Causal effect SES health?
– And if so, what’s are the mechanisms?
• Why do health behaviours differ by SES?
• Does access / utilization of healthcare play a role?
• Causal effect health SES?
– Ill-health loss of employment / earnings
– Ill-health medical expenses loss of wealth
– (Childhood) Ill-health loss of education
• Confounding factors
– Time/risk preferences, innate ability investment in health
and human capital
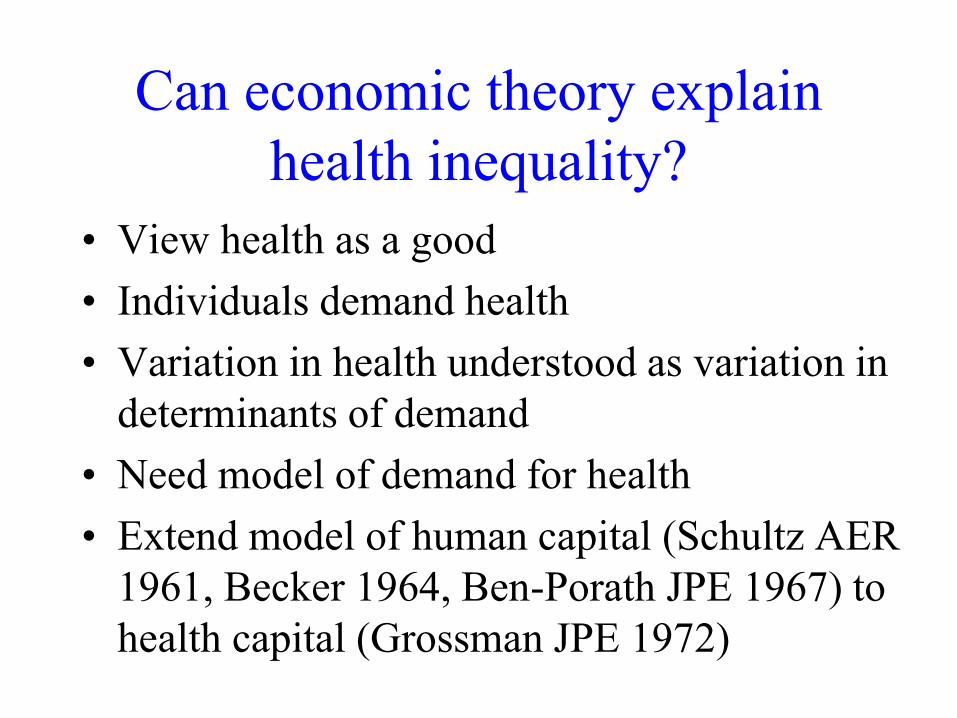
Can economic theory explain
health inequality?
• View health as a good
• Individuals demand health
• Variation in health understood as variation in
determinants of demand
• Need model of demand for health
• Extend model of human capital (Schultz AER
1961, Becker 1964, Ben-Porath JPE 1967) to
health capital (Grossman JPE 1972)
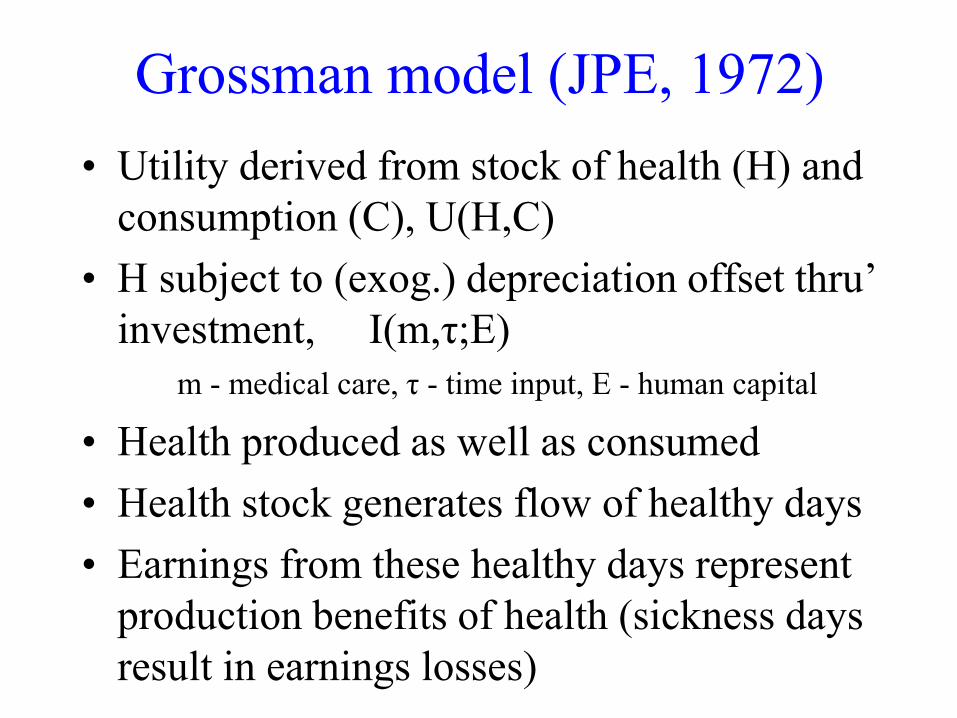
Grossman model (JPE, 1972)
• Utility derived from stock of health (H) and
consumption (C), U(H,C)
• H subject to (exog.) depreciation offset thru’
investment, I(m,τ;E)
m - medical care, τ - time input, E - human capital
• Health produced as well as consumed
• Health stock generates flow of healthy days
• Earnings from these healthy days represent
production benefits of health (sickness days
result in earnings losses)
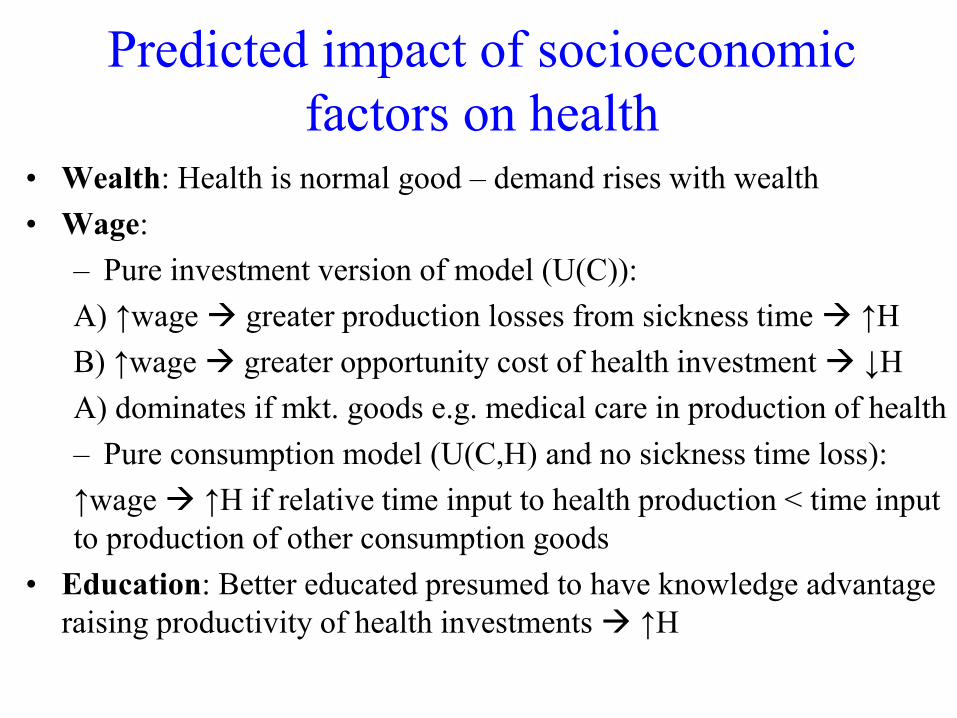
Predicted impact of socioeconomic
factors on health• Wealth: Health is normal good – demand rises with wealth
• Wage:
– Pure investment version of model (U(C)):
A) ↑wage greater production losses from sickness time ↑H
B) ↑wage greater opportunity cost of health investment ↓H
A) dominates if mkt. goods e.g. medical care in production of health
– Pure consumption model (U(C,H) and no sickness time loss):
↑wage ↑H if relative time input to health production < time input
to production of other consumption goods
• Education: Better educated presumed to have knowledge advantage
raising productivity of health investments ↑H
Galama & van Kippersluis
(EJ forthcoming)
• Extend Grossman with aim of developing a unified
theory capturing multiple mechanisms thru’ which
health and SES are related
• Particular emphasis on the lifecycle profile of the
SES-health gradient, i.e. widening until middle-age
and then narrowing in old age
G & vK extensions to Grossman1. Decreasing returns to scale (DRTS) in health production
function
2. Job-related health stress
- Increases health depreciation rate
- Poor substitute health capital for limited financial/human
capital
3. Healthy & unhealthy consumption
- Affect health depreciation
4. Returns to education thru’ wage rate
- In addition to potential impact on efficiency of health
production
5. Endogenous optimisation of length of life
Comparative dynamics of health wrt wealth
• Wealthy live longer
• Wealthy value health more
• Wealthier are healthier at all ages
• Health more sensitive to wealth when longevity
can be extended
– Health inequality greater in environments where
resources can be used to extend life
Conjectured wealth effects on health
behaviour
• Wealthy engage more in healthy consumption
– Direct wealth effect (+)
– Indirect health benefit effect (+)
• Wealthy likely to engage less in severely unhealthy
consumption
– Direct wealth effect (+)
– Indirect health cost effect (-)
• Wealthy engage less in job-related health stress
– Compensating wage valued less (-)
– Indirect health cost effect (-)
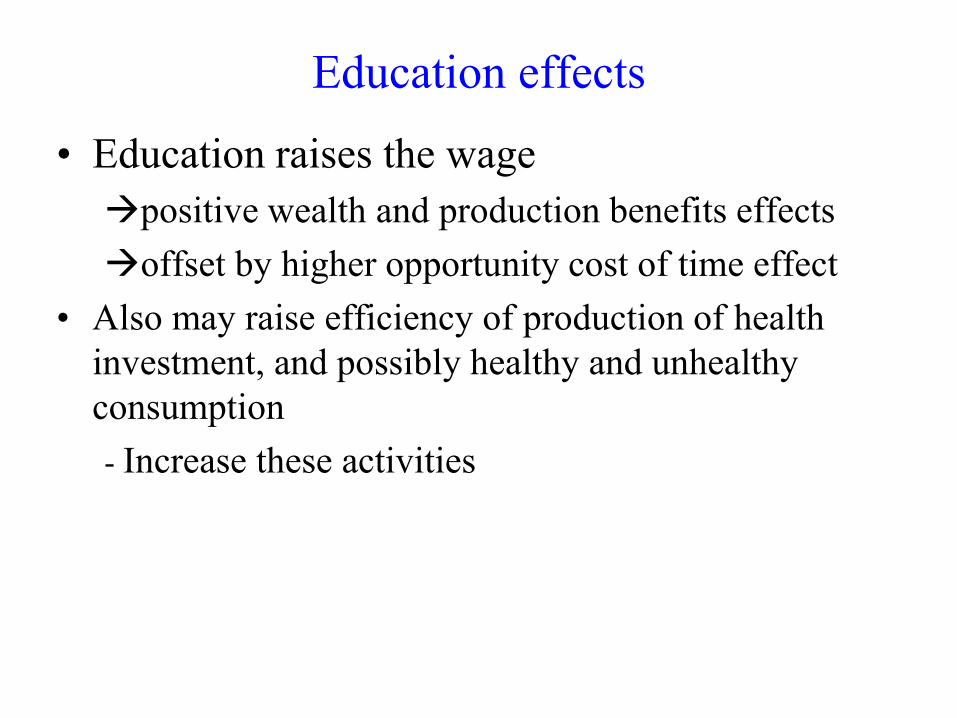
Education effects
• Education raises the wage
positive wealth and production benefits effects
offset by higher opportunity cost of time effect
• Also may raise efficiency of production of health
investment, and possibly healthy and unhealthy
consumption
- Increase these activities
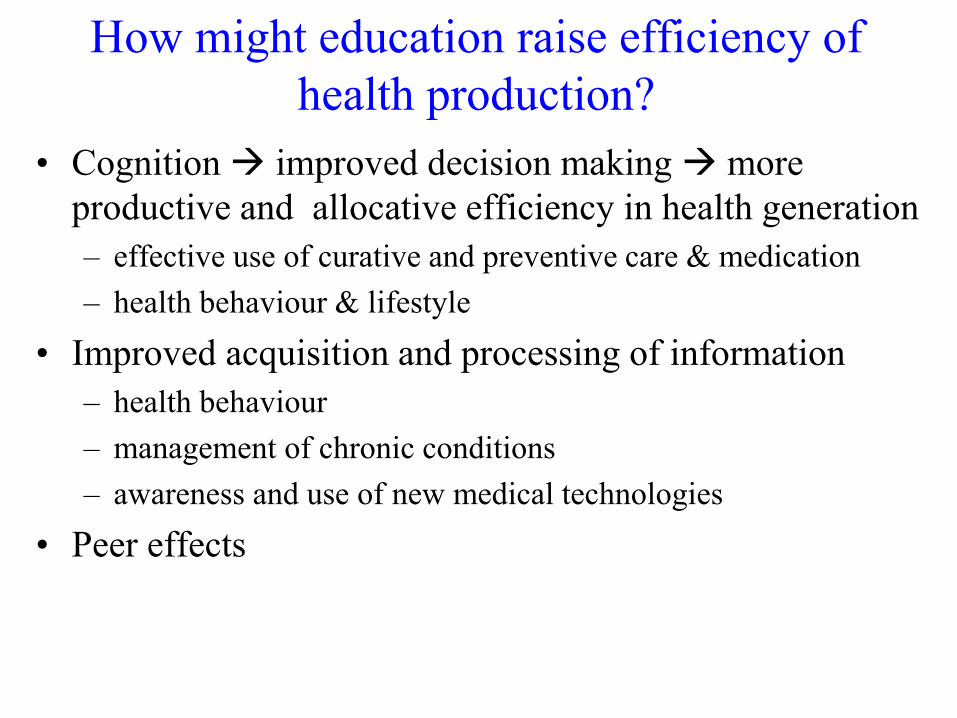
How might education raise efficiency of
health production?
• Cognition improved decision making more
productive and allocative efficiency in health generation
– effective use of curative and preventive care & medication
– health behaviour & lifestyle
• Improved acquisition and processing of information
– health behaviour
– management of chronic conditions
– awareness and use of new medical technologies
• Peer effects
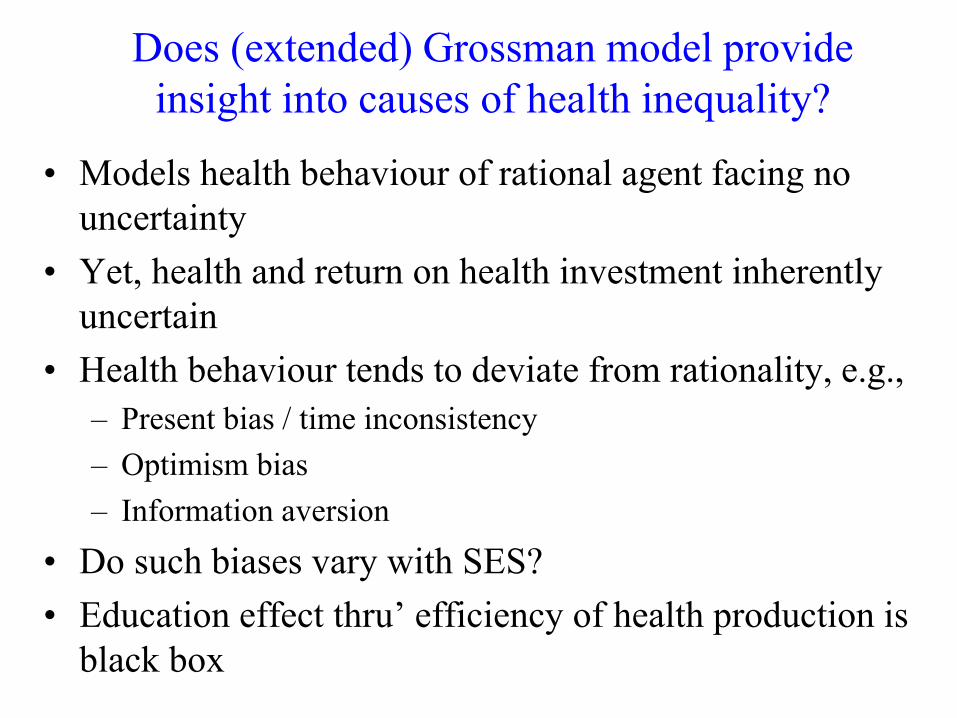
Does (extended) Grossman model provide
insight into causes of health inequality?
• Models health behaviour of rational agent facing no
uncertainty
• Yet, health and return on health investment inherently
uncertain
• Health behaviour tends to deviate from rationality, e.g.,
– Present bias / time inconsistency
– Optimism bias
– Information aversion
• Do such biases vary with SES?
• Education effect thru’ efficiency of health production is
black box
Evidence on causal effects
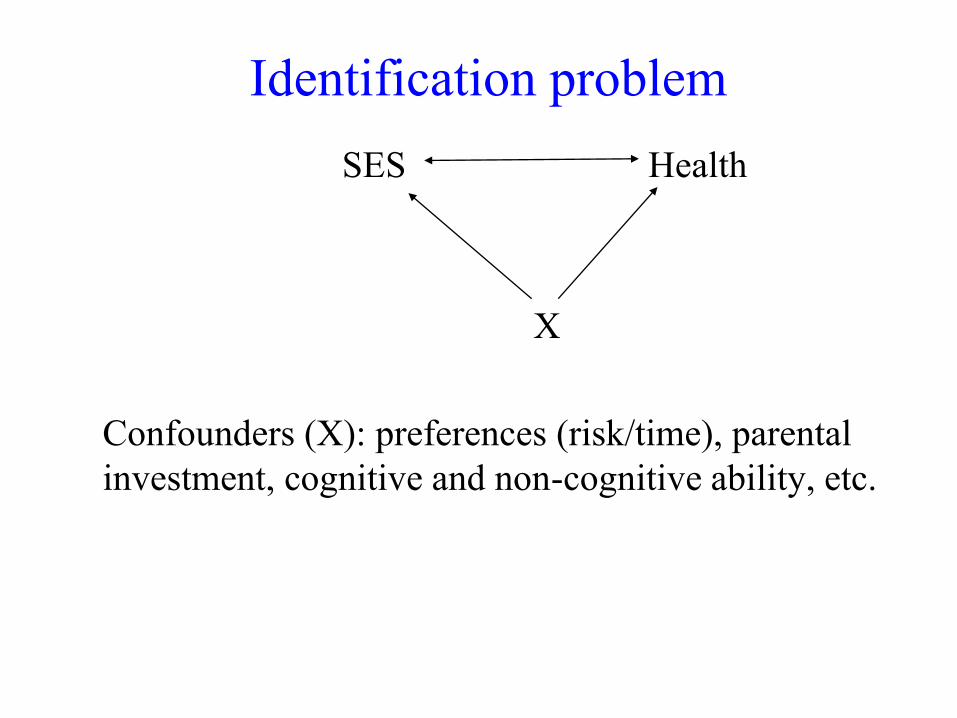
Identification problem
SES Health
X
Confounders (X): preferences (risk/time), parental
investment, cognitive and non-cognitive ability, etc.
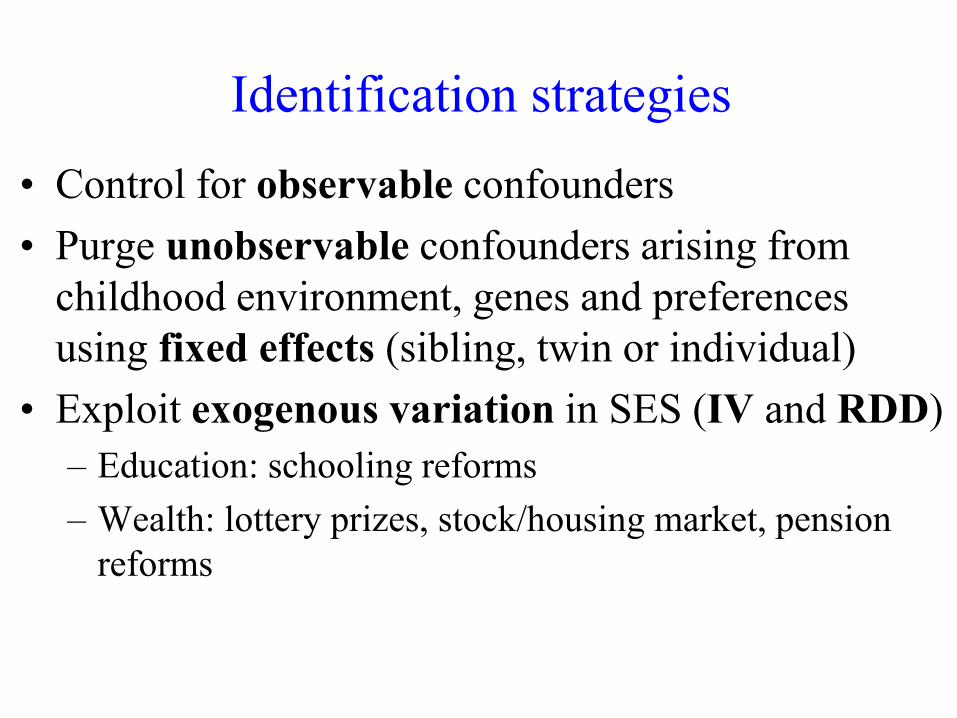
Identification strategies
• Control for observable confounders
• Purge unobservable confounders arising from
childhood environment, genes and preferences
using fixed effects (sibling, twin or individual)
• Exploit exogenous variation in SES (IV and RDD)
– Education: schooling reforms
– Wealth: lottery prizes, stock/housing market, pension
reforms
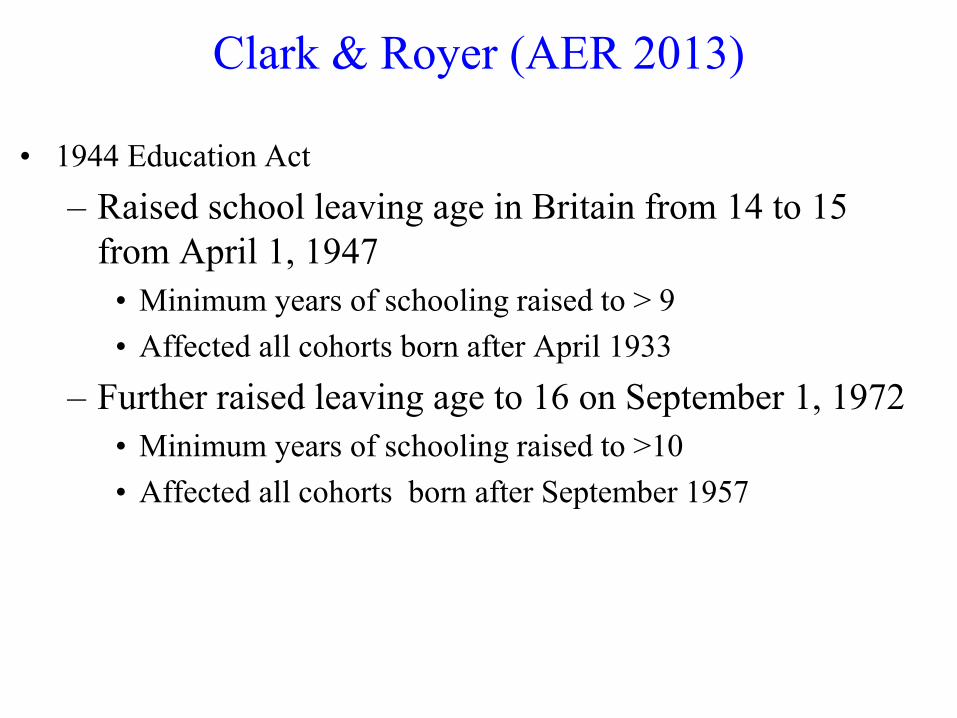
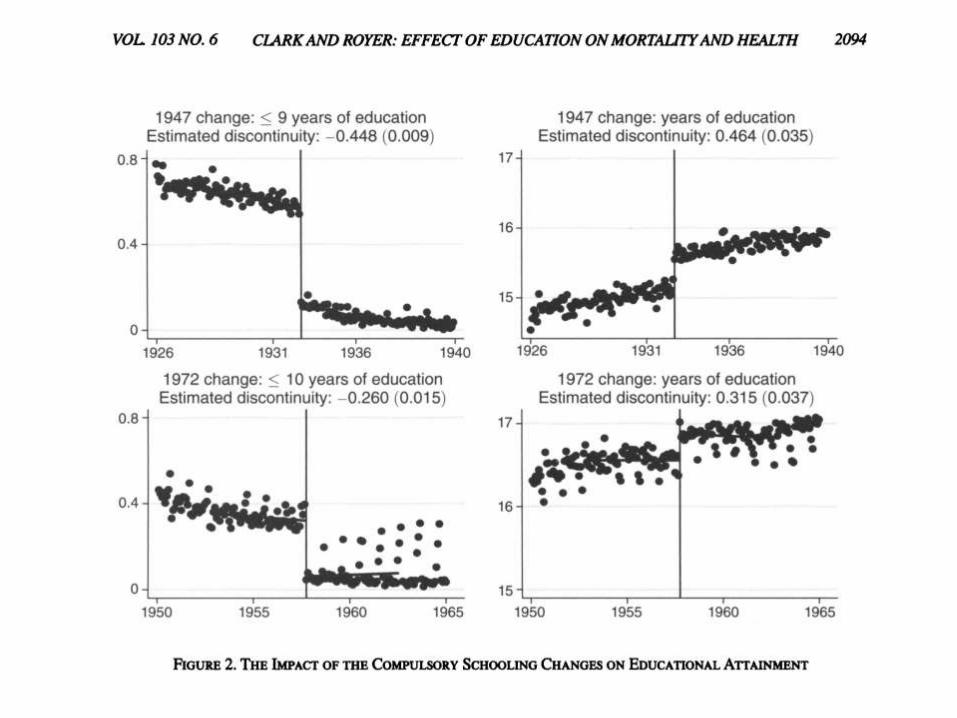
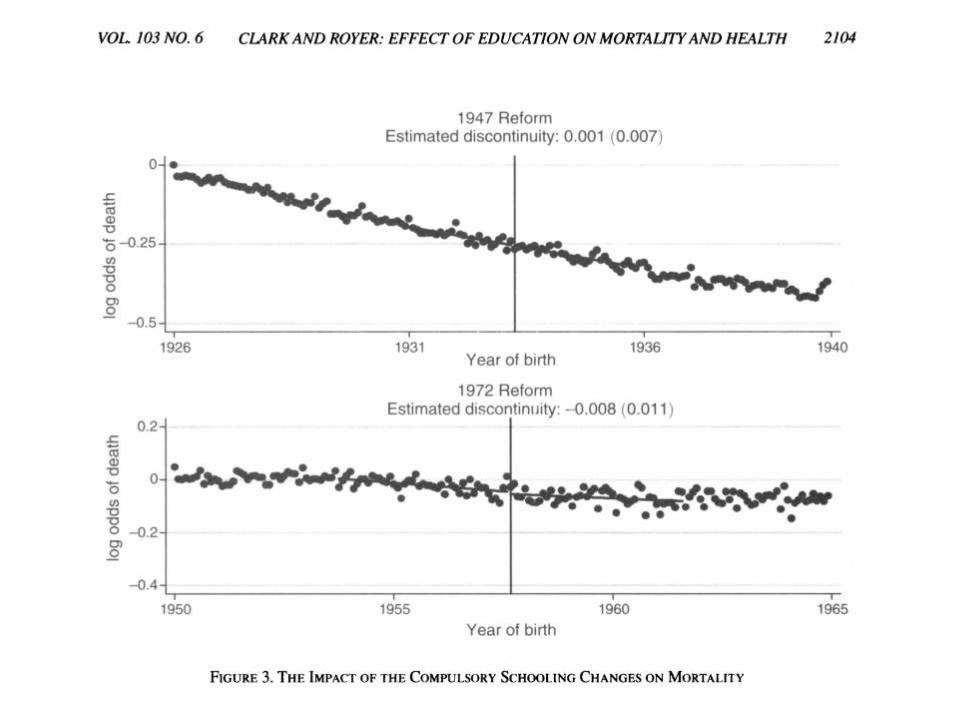
Clark & Royer (AER 2013)
• 1944 Education Act
– Raised school leaving age in Britain from 14 to 15
from April 1, 1947
• Minimum years of schooling raised to > 9
• Affected all cohorts born after April 1933
– Further raised leaving age to 16 on September 1, 1972
• Minimum years of schooling raised to >10
• Affected all cohorts born after September 1957
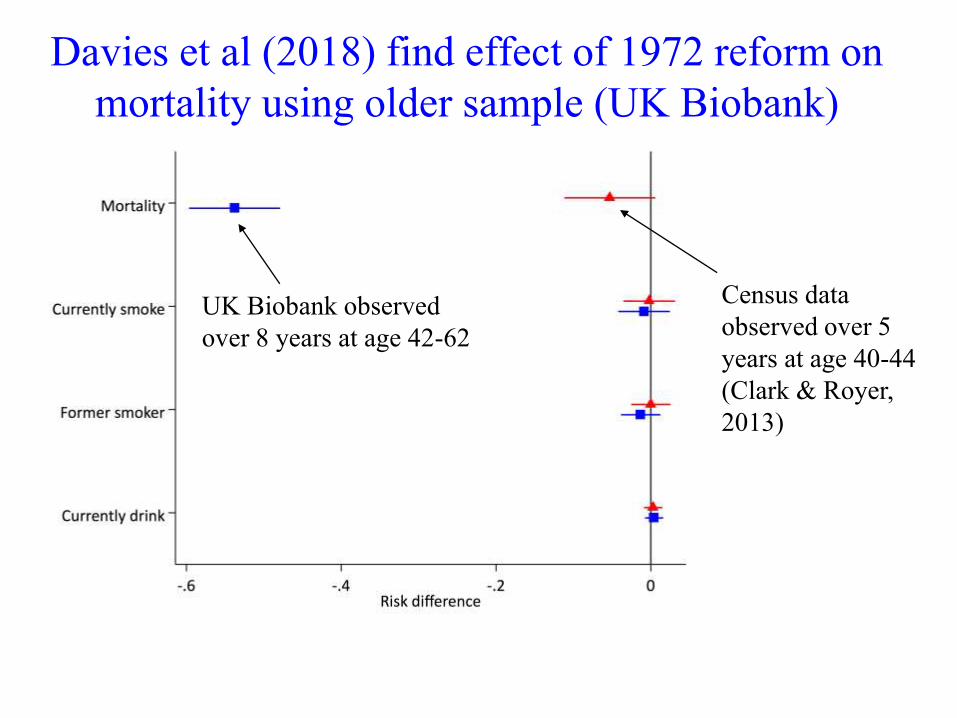
Davies et al (2018) find effect of 1972 reform on
mortality using older sample (UK Biobank)
UK Biobank observed
over 8 years at age 42-62
Census data
observed over 5
years at age 40-44
(Clark & Royer,
2013)
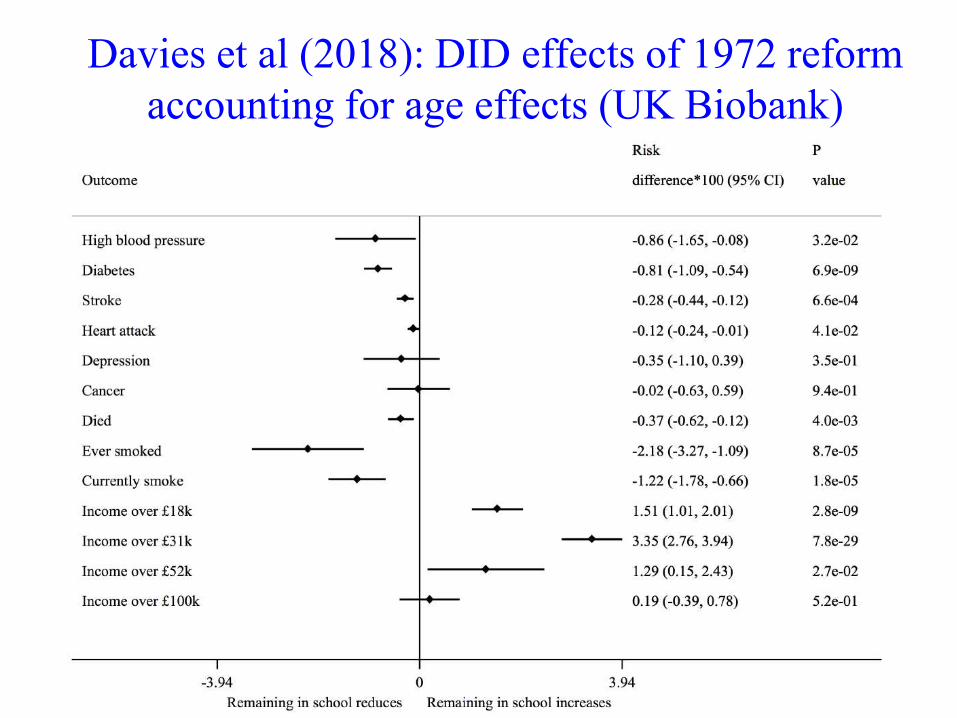
Davies et al (2018): DID effects of 1972 reform
accounting for age effects (UK Biobank)
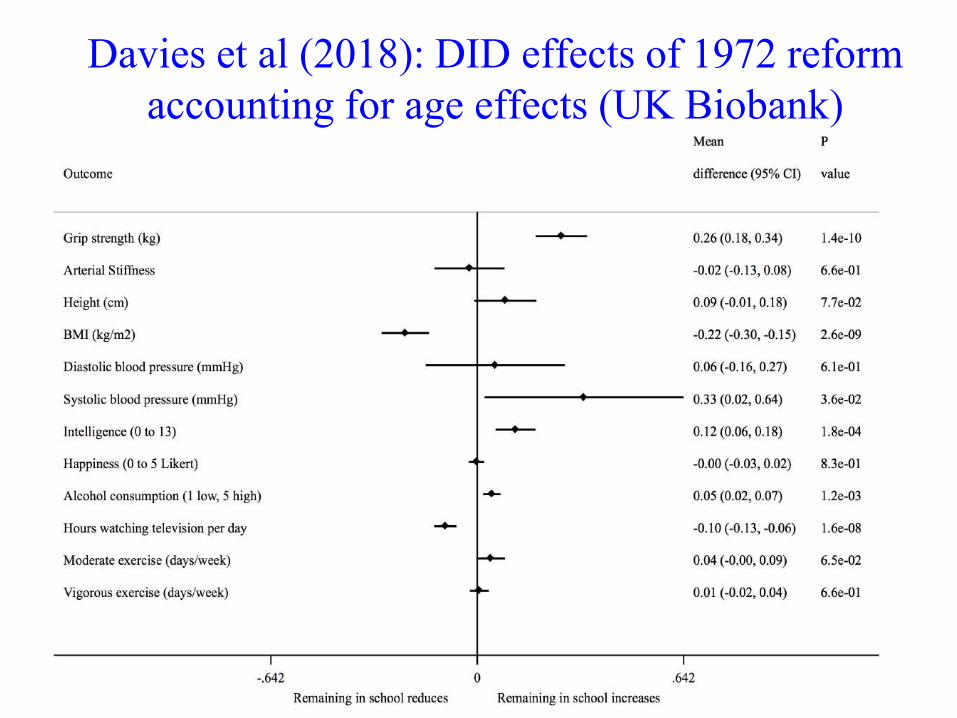
Davies et al (2018): DID effects of 1972 reform
accounting for age effects (UK Biobank)
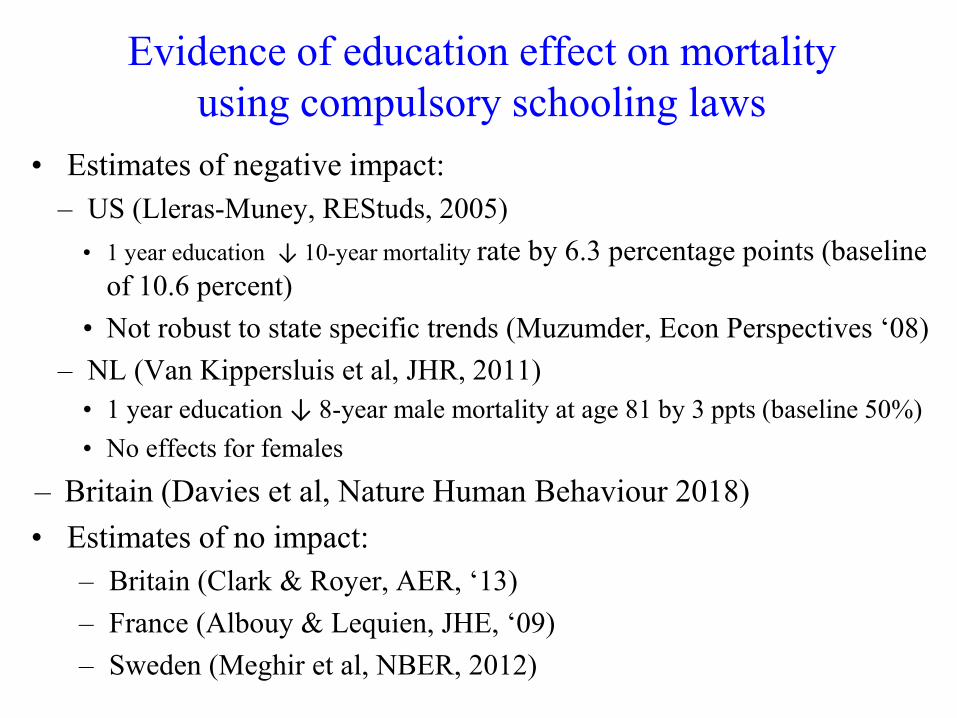
Evidence of education effect on mortality
using compulsory schooling laws
• Estimates of negative impact:
– US (Lleras-Muney, REStuds, 2005)
• 1 year education ↓ 10-year mortality rate by 6.3 percentage points (baseline
of 10.6 percent)
• Not robust to state specific trends (Muzumder, Econ Perspectives ‘08)
– NL (Van Kippersluis et al, JHR, 2011)
• 1 year education ↓ 8-year male mortality at age 81 by 3 ppts (baseline 50%)
• No effects for females
– Britain (Davies et al, Nature Human Behaviour 2018)
• Estimates of no impact:
– Britain (Clark & Royer, AER, ‘13)
– France (Albouy & Lequien, JHE, ‘09)
– Sweden (Meghir et al, NBER, 2012)
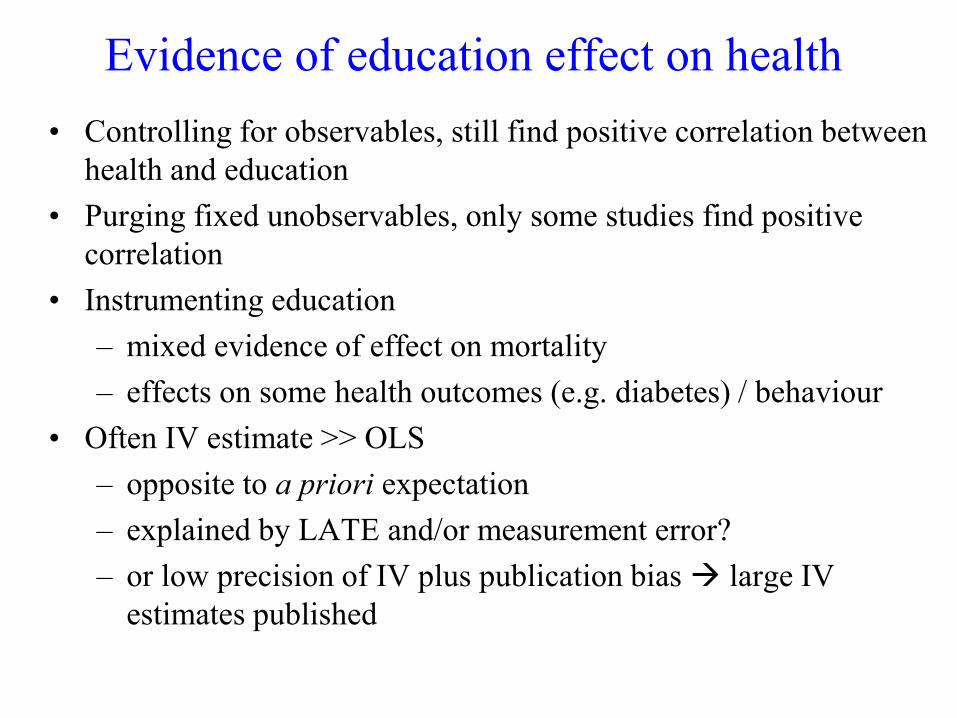
Evidence of education effect on health
• Controlling for observables, still find positive correlation between
health and education
• Purging fixed unobservables, only some studies find positive
correlation
• Instrumenting education
– mixed evidence of effect on mortality
– effects on some health outcomes (e.g. diabetes) / behaviour
• Often IV estimate >> OLS
– opposite to a priori expectation
– explained by LATE and/or measurement error?
– or low precision of IV plus publication bias large IV
estimates published
Wealth effect on health
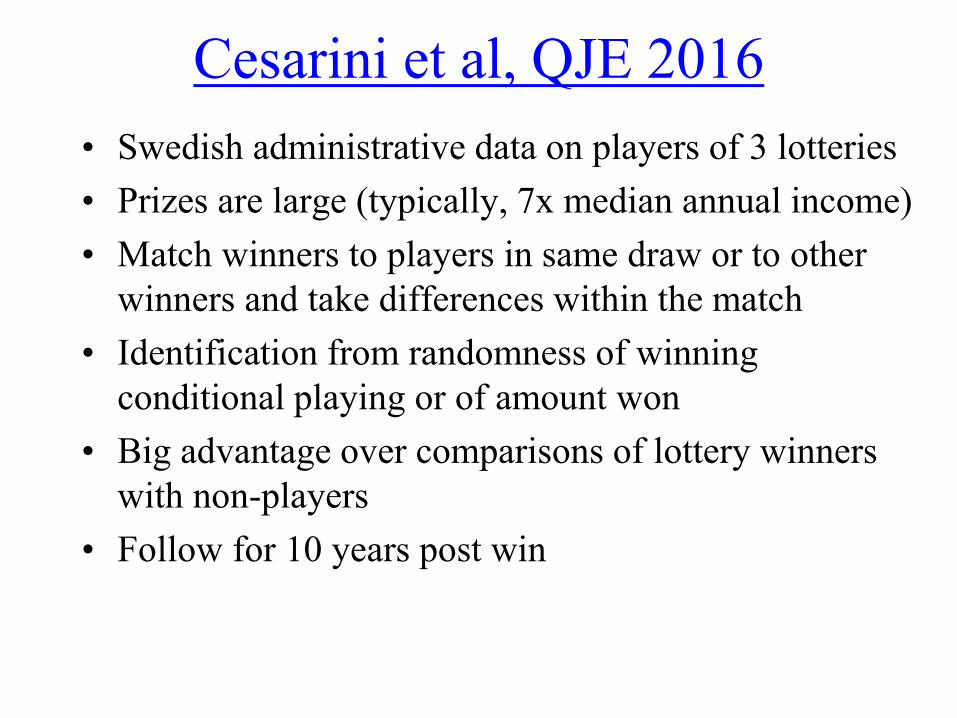
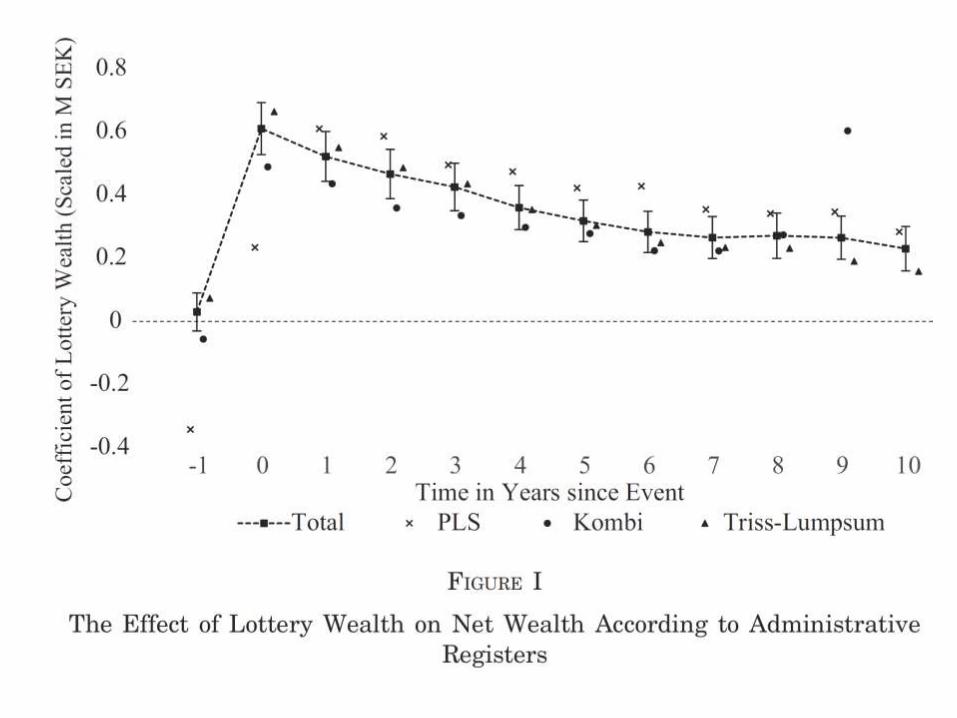
Cesarini et al, QJE 2016
• Swedish administrative data on players of 3 lotteries
• Prizes are large (typically, 7x median annual income)
• Match winners to players in same draw or to other
winners and take differences within the match
• Identification from randomness of winning
conditional playing or of amount won
• Big advantage over comparisons of lottery winners
with non-players
• Follow for 10 years post win
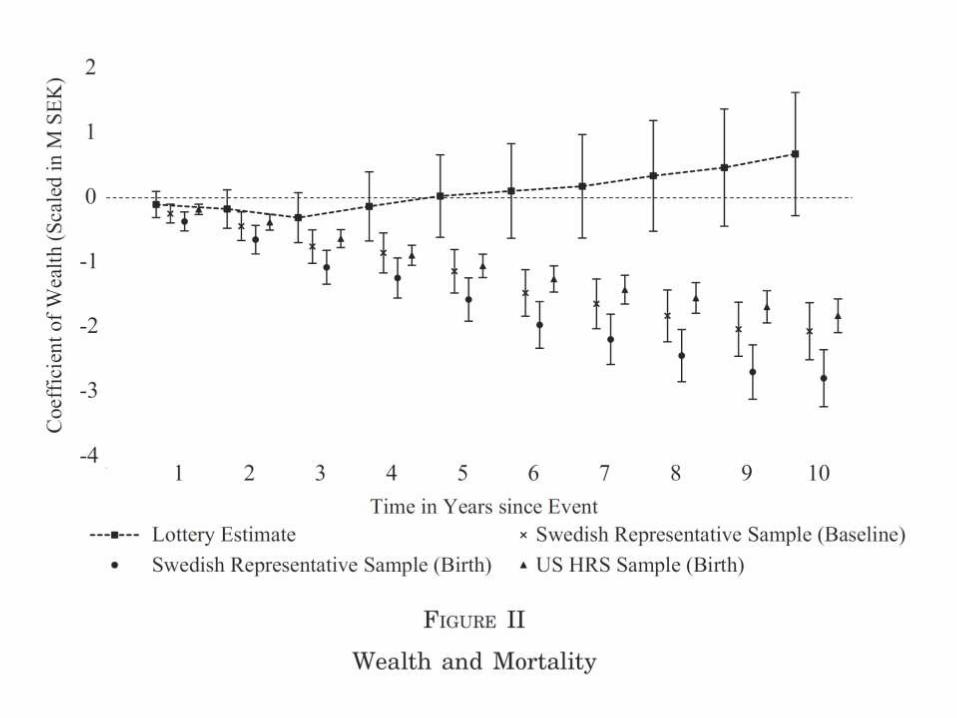
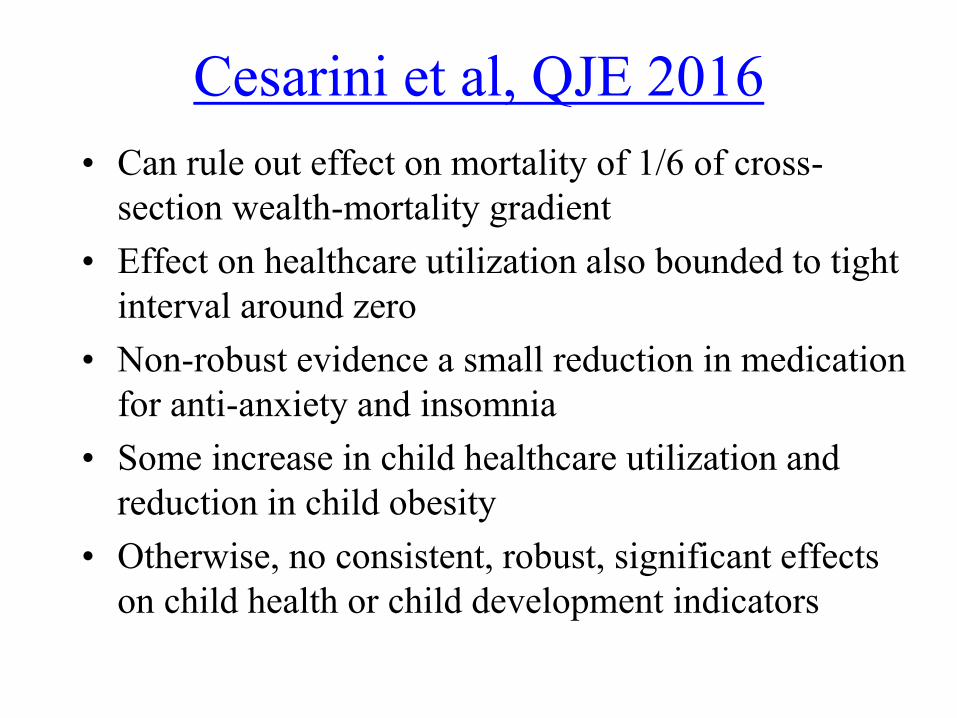
Cesarini et al, QJE 2016
• Can rule out effect on mortality of 1/6 of cross-
section wealth-mortality gradient
• Effect on healthcare utilization also bounded to tight
interval around zero
• Non-robust evidence a small reduction in medication
for anti-anxiety and insomnia
• Some increase in child healthcare utilization and
reduction in child obesity
• Otherwise, no consistent, robust, significant effects
on child health or child development indicators
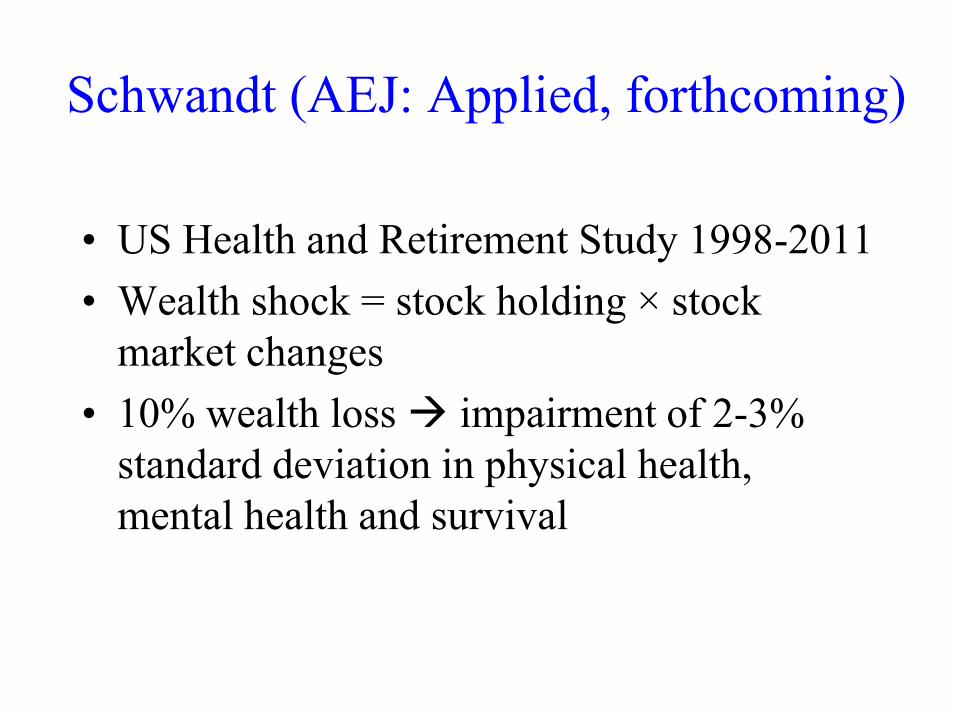
Schwandt (AEJ: Applied, forthcoming)
• US Health and Retirement Study 1998-2011
• Wealth shock = stock holding × stock
market changes
• 10% wealth loss impairment of 2-3%
standard deviation in physical health,
mental health and survival
Limitation of IV approach
• Immediate response to wealth shock does not
identify accumulated effect of lifetime wealth on
evolution of health.
• According to Grossman (1972), health is stock
that accumulates from past investment and
depreciates. Wealth effect, if any, likely to evolve
gradually, not occur suddenly.

Testing non-causality (Adams et al 2003)
• Test no causal effect of wealth on health (and vice versa)
• Aim to establish if correlation could arise from causal effect,
not to identify the causal effect
• Regress health on lagged health, lagged wealth and controls
• Use lags to avoid reverse causality
• First test for model invariance in order to establish if have
model capable of capturing causal effects
• If model is invariant and lagged wealth not significant, then
wealth does not Granger-cause health
• If lagged wealth is significant, cannot infer causality since
could be due to correlated unobservables
• So, approach is most useful when do not find Granger
causality
Results
• AHEAD panel of elderly (70+) Americans
• In addition to wealth, also use income and
education as measures of SES
• For mortality and acute, sudden-onset diseases,
hypothesis of no causal effect of SES is accepted
• For mental health problems (not universally
insured), non-causality is rejected
• For chronic conditions (not all universally
insured), evidence is mixed
• See Smith (JHR 2007) for similar conclusions
Stowasser et al (2012)
• Extend the analysis by using
– Larger sample
– Longer panel
– Younger cohorts (50+) with more variation in
health insurance cover
• Find that Granger causality from SES to
health cannot be rejected for a much larger
set of outcomes
• Cannot conclude there is causality, but less
grounds for concluding there is not
Income effect on health
• Evidence of income impacting negatively on health
– Health is counter cyclical (Ruhm, QJE ’00, JHE ’05)
– Health deteriorates with receipt of income in US (Dobkin &
Puller JPubE ’07, Evans & Moore JPubE ’11)
– Lower pensions as result of US Social Security Notch reduced
mortality (Snyder & Evans REStat ’06)
• Evidence of child health rising with parental income
(Case et al, AER, ’02; Currie & Stabile, AER, ’03)
SES health: evidence
• Mixed evidence of causal effect of wealth on health
• Evidence of negative effect of income on adult health (US)
• Evidence of positive effect of parental income on child health (US)
• Evidence of effect of education on health is mixed
• Given no consistently strong evidence of effect of SES on health,
why is there a strong SES gradient in health?
– Correlated unobservables
– Difficult to capture causal relationships that evolve slowly
– Reverse causality
Poor are less healthy
Less healthy are poor
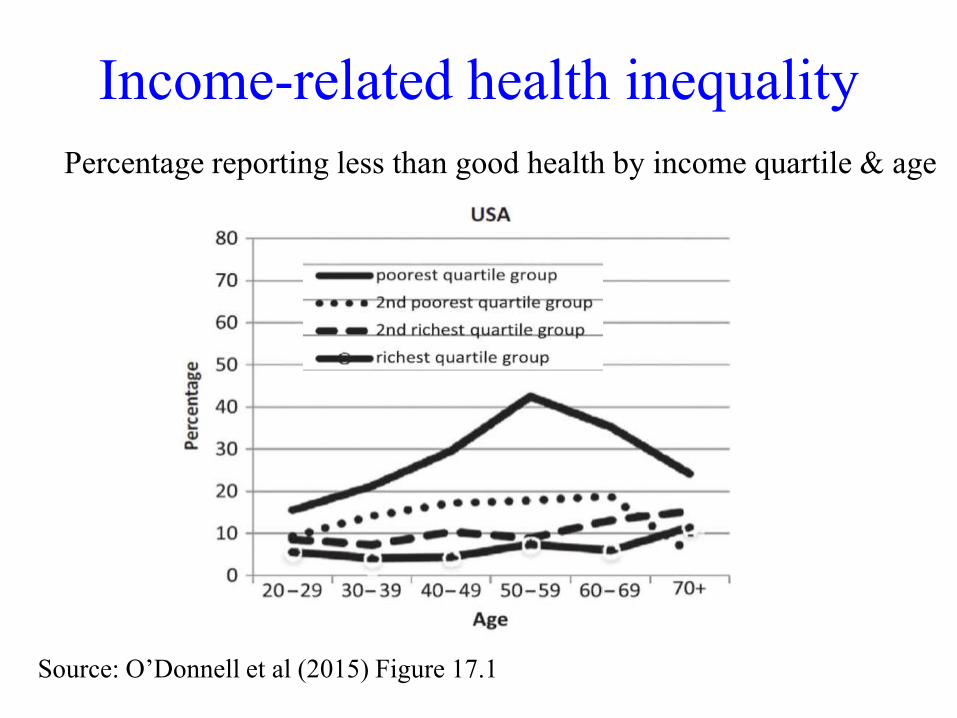
Income-related health inequality
Percentage reporting less than good health by income quartile & age
Source: O’Donnell et al (2015) Figure 17.1
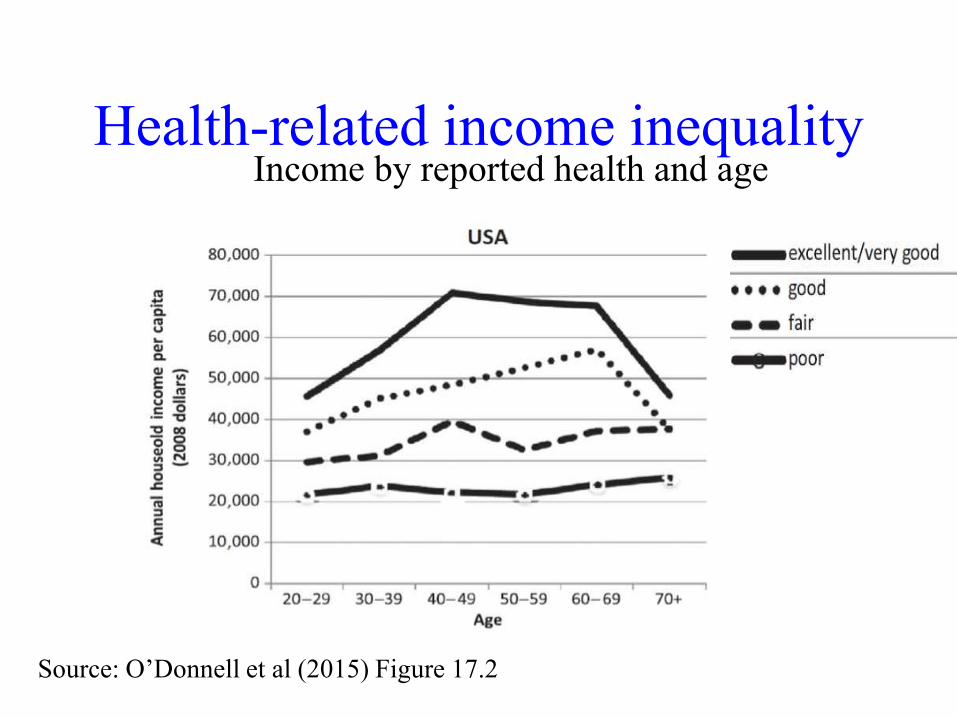
Health-related income inequalityIncome by reported health and age
Source: O’Donnell et al (2015) Figure 17.2
Income gradient in health or health
gradient in income?
SES causation vs health selection
Correlation between ill-health and
non-employment is very strong
• A very large proportion of those not working report
health problems
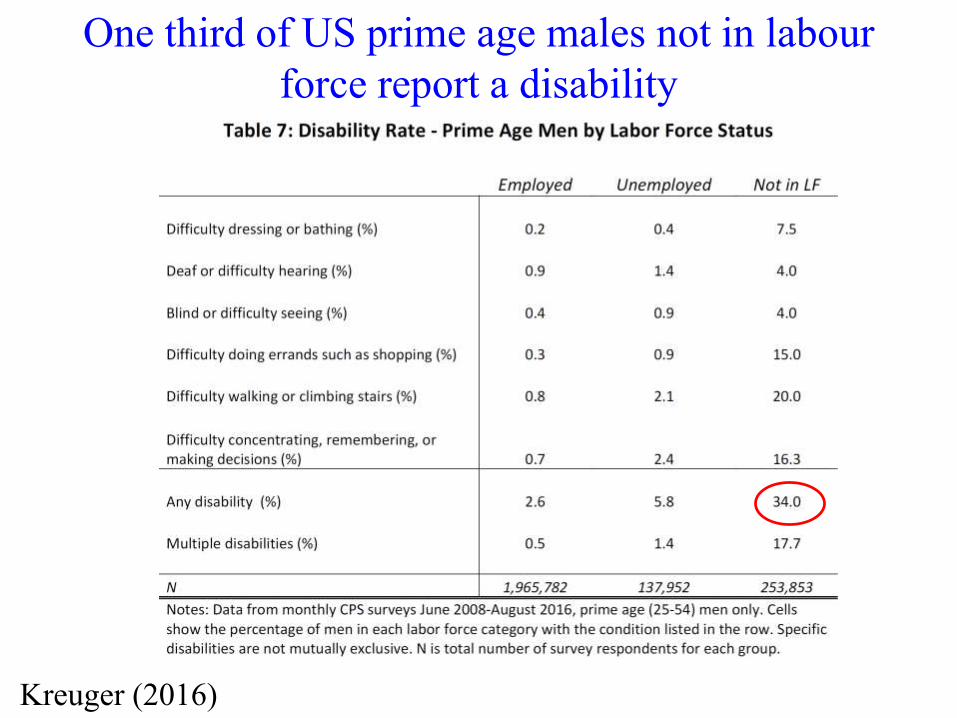
One third of US prime age males not in labour
force report a disability
Kreuger (2016)
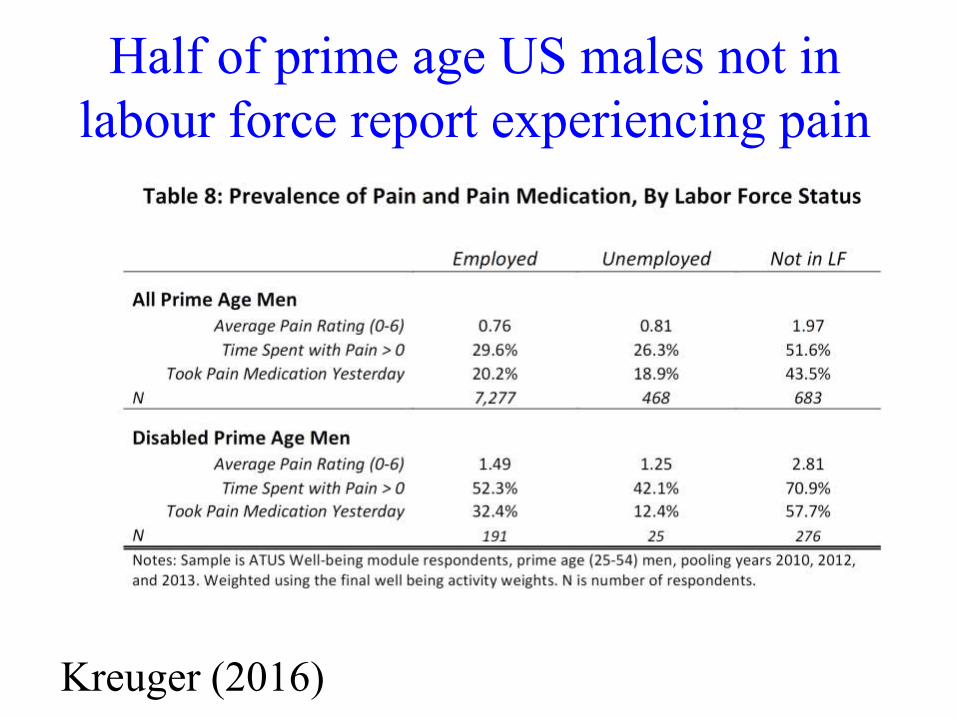
Half of prime age US males not in
labour force report experiencing pain
Kreuger (2016)
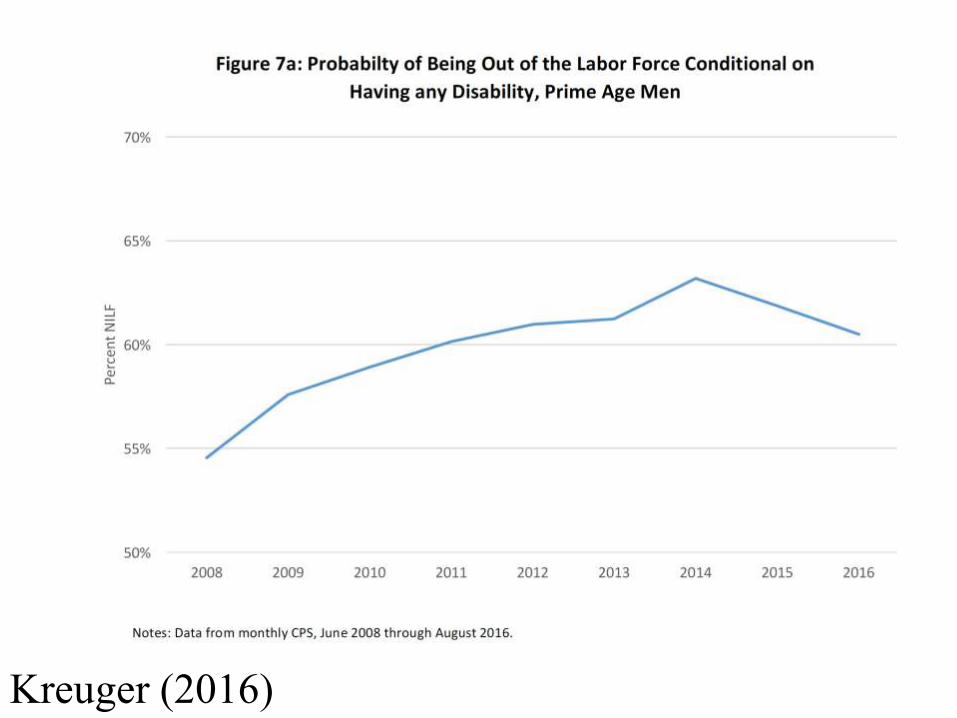
Correlation between ill-health and
non-employment is very strong
• A very large proportion of those not working report
health problems
• And rate non-employment is high and rising in US
among those reporting a health problem
Kreuger (2016)
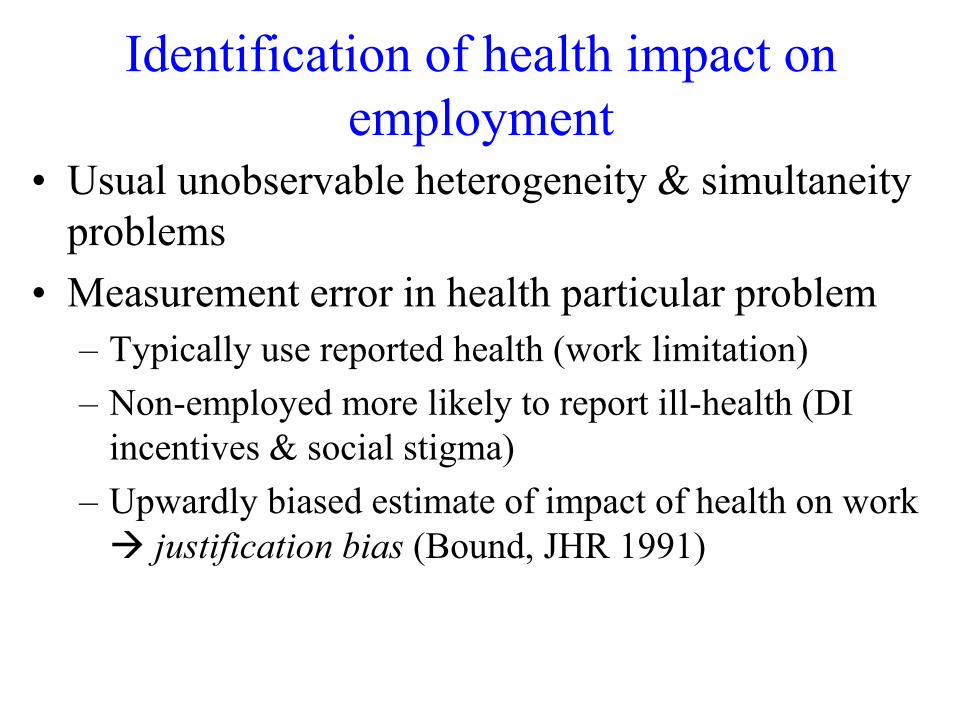
Identification of health impact on
employment• Usual unobservable heterogeneity & simultaneity
problems
• Measurement error in health particular problem
– Typically use reported health (work limitation)
– Non-employed more likely to report ill-health (DI
incentives & social stigma)
– Upwardly biased estimate of impact of health on work
justification bias (Bound, JHR 1991)
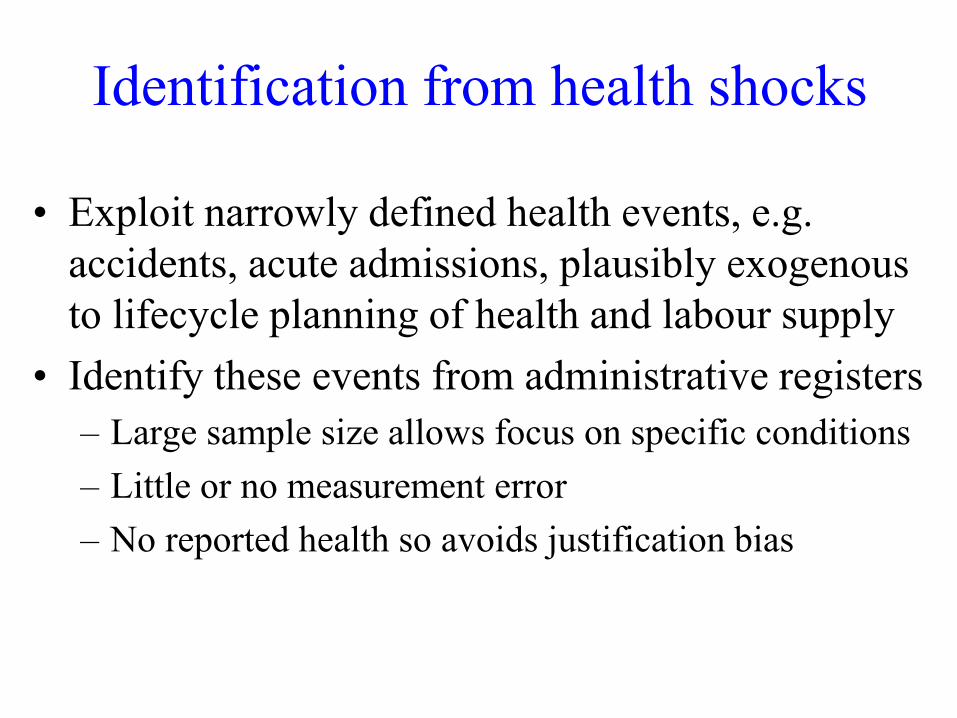
Identification from health shocks
• Exploit narrowly defined health events, e.g.
accidents, acute admissions, plausibly exogenous
to lifecycle planning of health and labour supply
• Identify these events from administrative registers
– Large sample size allows focus on specific conditions
– Little or no measurement error
– No reported health so avoids justification bias
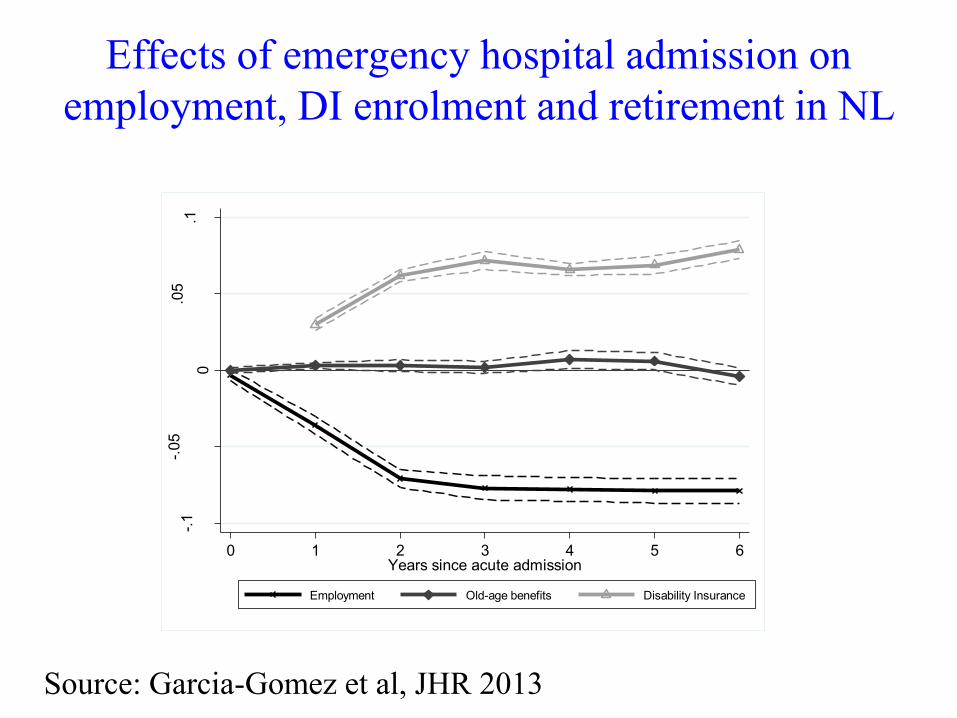
Effects of emergency hospital admission on
employment, DI enrolment and retirement in NL
-.1
-.05
0
.05
.1
Estim
ate
d e
ffect,
pro
babili
ty
0 1 2 3 4 5 6Years since acute admission
Employment Old-age benefits Disability Insurance
Source: Garcia-Gomez et al, JHR 2013
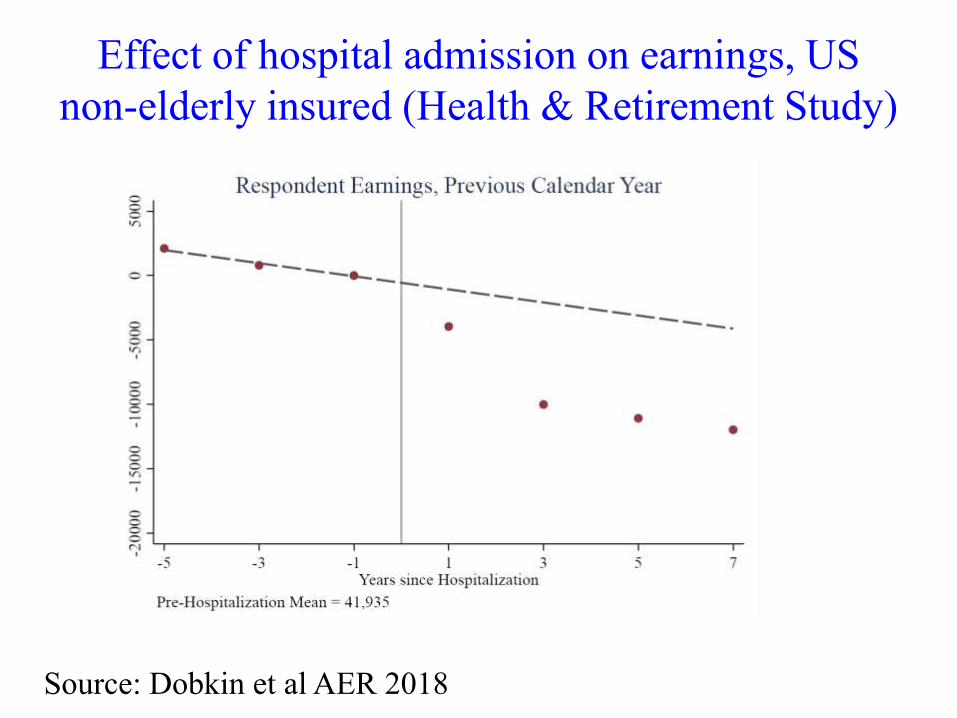
Effect of hospital admission on earnings, US
non-elderly insured (Health & Retirement Study)
Source: Dobkin et al AER 2018
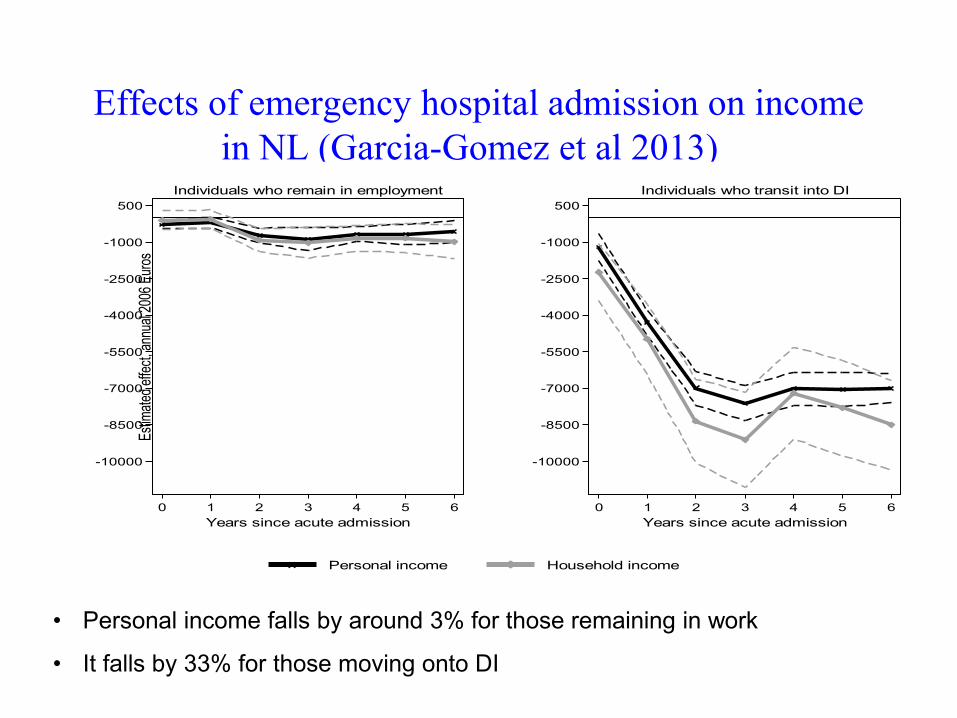
Effects of emergency hospital admission on income
in NL (Garcia-Gomez et al 2013)
• Personal income falls by around 3% for those remaining in work
• It falls by 33% for those moving onto DI
-10000
-8500
-7000
-5500
-4000
-2500
-1000
500
Est
imat
ed e
ffect
, ann
ual 2
006
Eur
os
0 1 2 3 4 5 6
Years since acute admission
Individuals who remain in employment
-10000
-8500
-7000
-5500
-4000
-2500
-1000
500
Est
imat
ed e
ffect
, ann
ual 2
006
Eur
os
0 1 2 3 4 5 6
Years since acute admission
Individuals who transit into DI
Personal income Household income
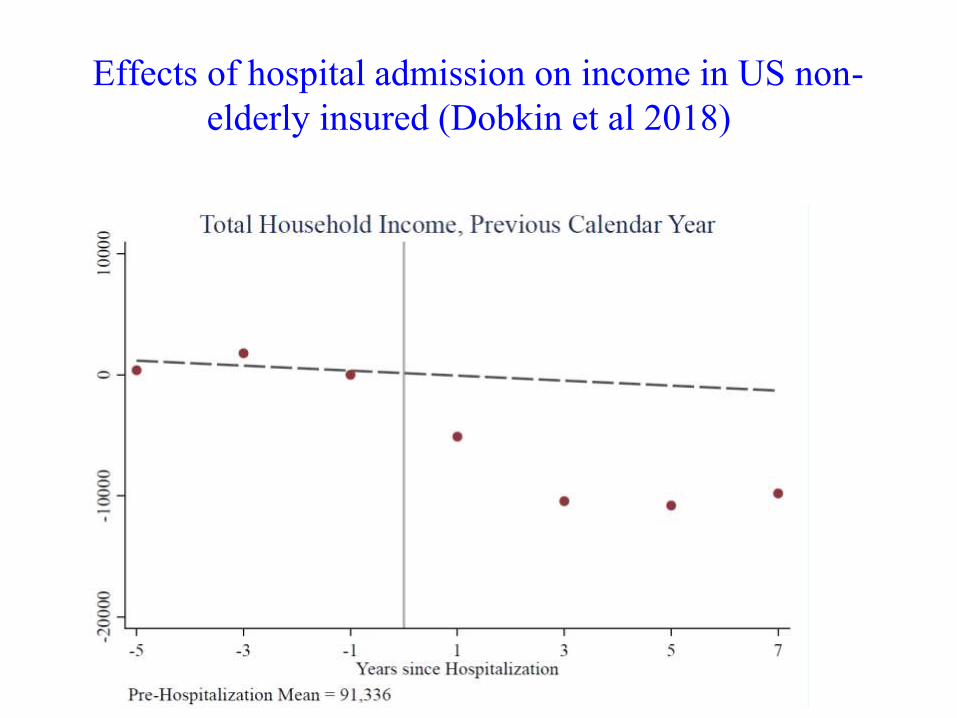
Effects of hospital admission on income in US non-
elderly insured (Dobkin et al 2018)
How important is health impact on
employment to understanding income
gradient in health?
• Life cycle evolution of the gradient suggests it
may be very important
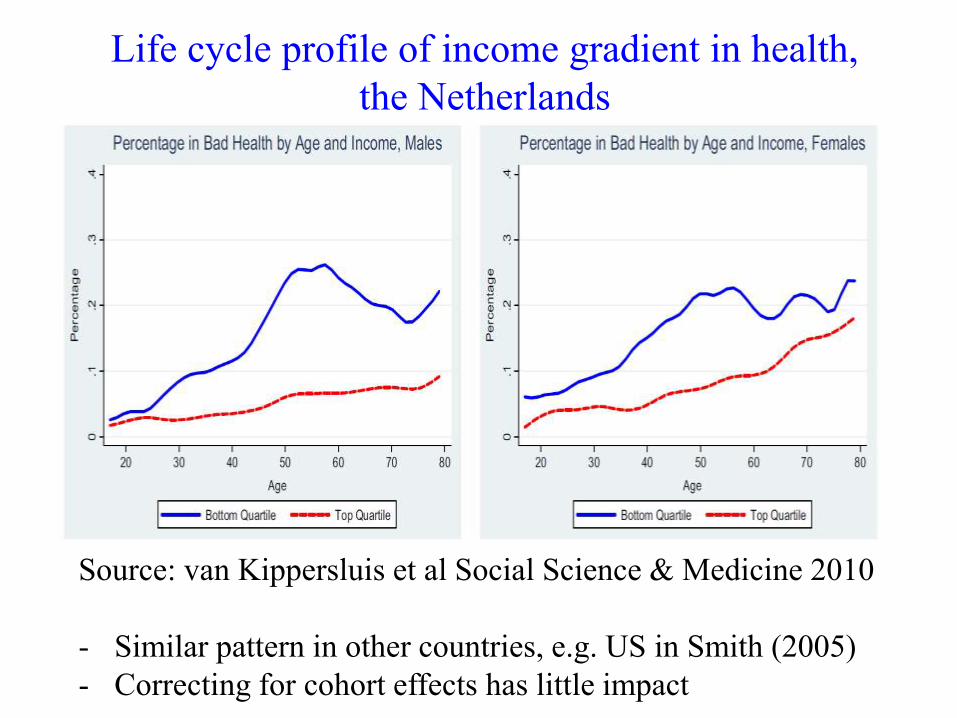
Life cycle profile of income gradient in health,
the Netherlands
Source: van Kippersluis et al Social Science & Medicine 2010
- Similar pattern in other countries, e.g. US in Smith (2005)
- Correcting for cohort effects has little impact
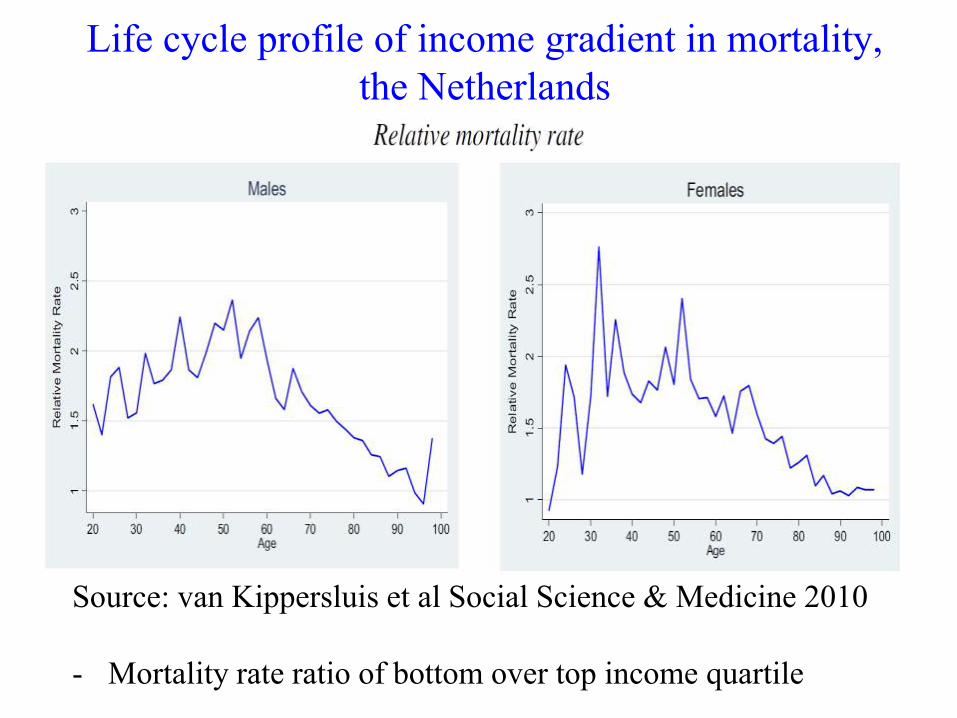
Life cycle profile of income gradient in mortality,
the Netherlands
Source: van Kippersluis et al Social Science & Medicine 2010
- Mortality rate ratio of bottom over top income quartile
What explains this life cycle profile
of the gradient?
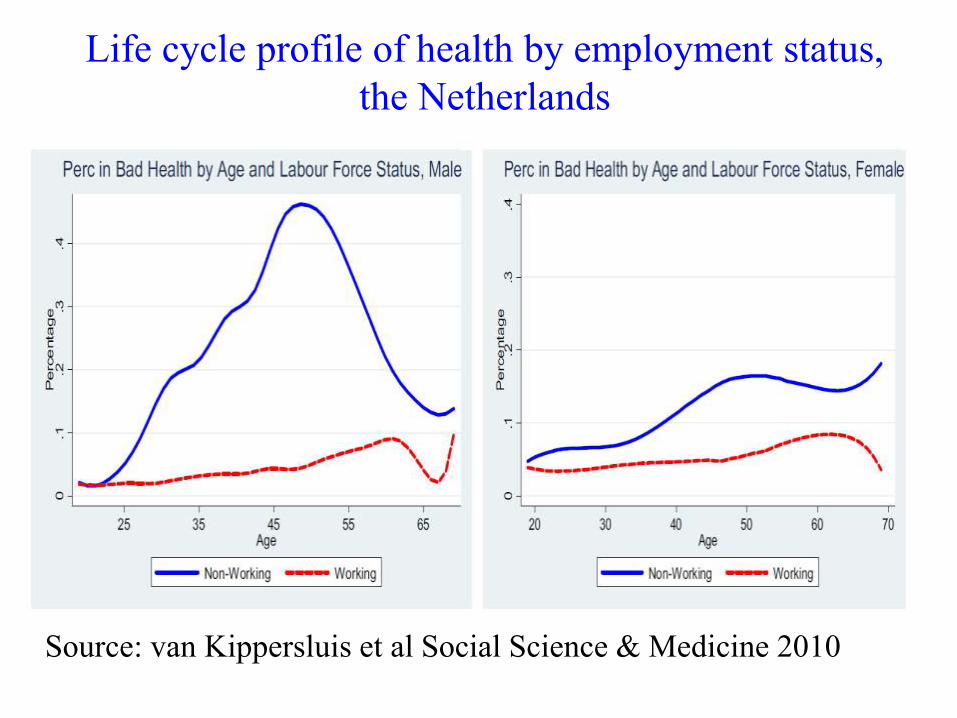
Life cycle profile of health by employment status,
the Netherlands
Source: van Kippersluis et al Social Science & Medicine 2010
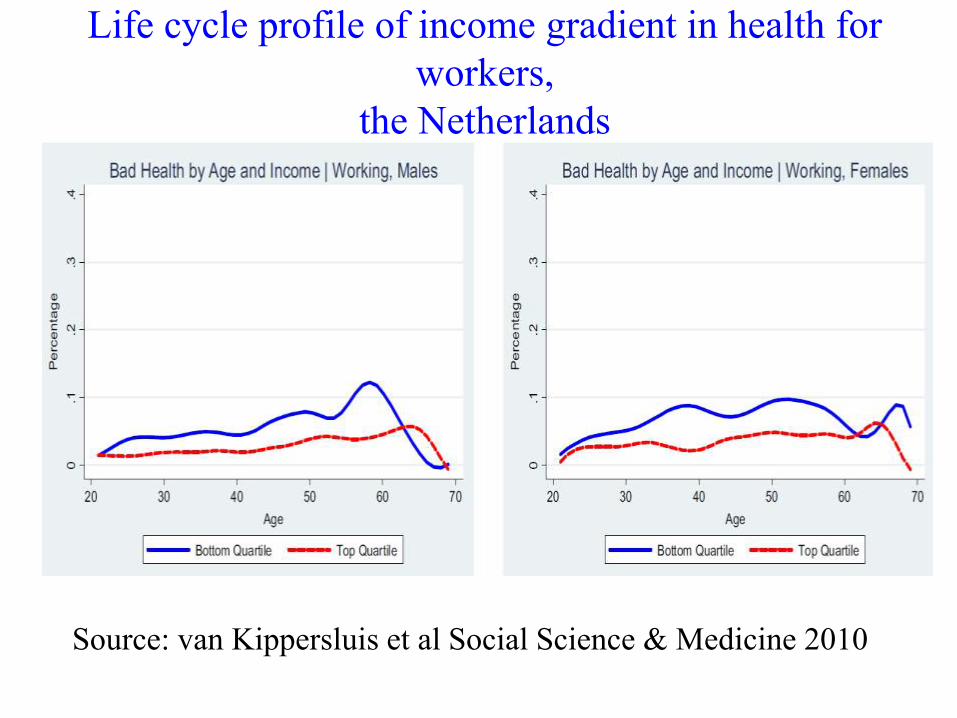
Life cycle profile of income gradient in health for
workers,
the Netherlands
Source: van Kippersluis et al Social Science & Medicine 2010
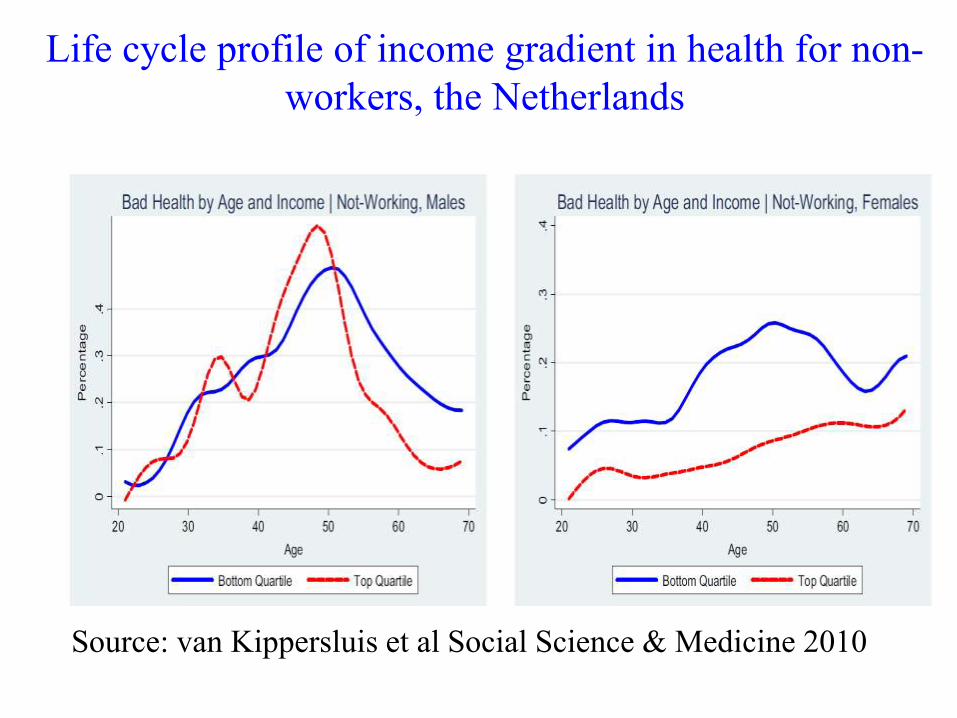
Life cycle profile of income gradient in health for non-
workers, the Netherlands
Source: van Kippersluis et al Social Science & Medicine 2010
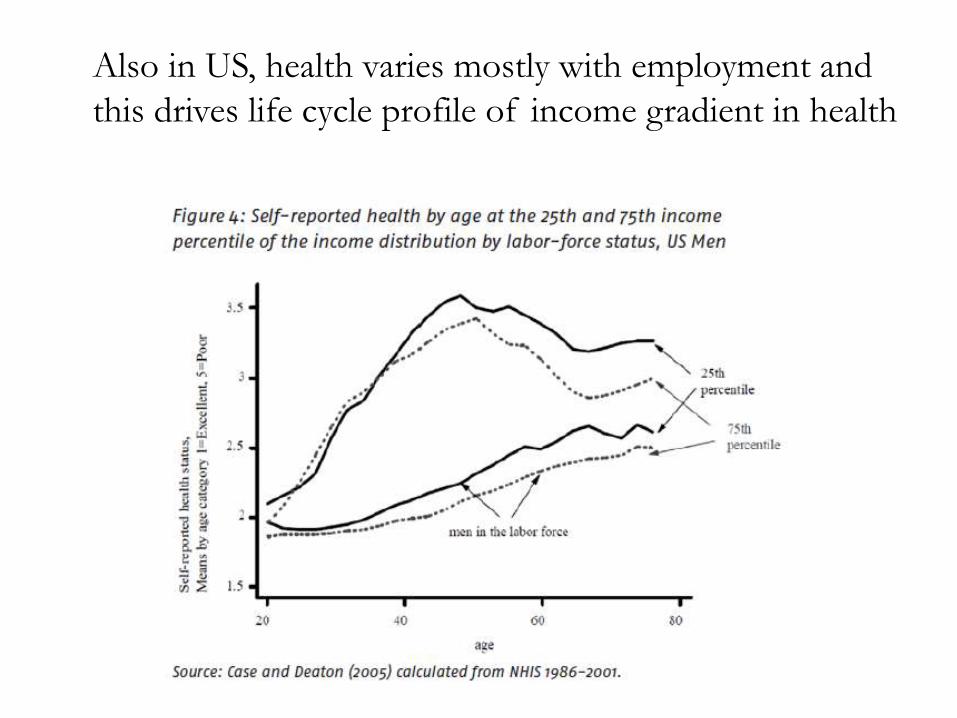
Also in US, health varies mostly with employment and
this drives life cycle profile of income gradient in health
Contribution of health employment to
income gradient in health
• As folks age, some suffer ill-health lose
employment lose income
• Given much of variation in health is in middle-age,
this probably makes sizeable contribution to income
gradient in health
• After middle-age, non-health reasons for labour force
withdrawal dominate gradient flattens
• Health selection needs to be taken very seriously
• But who experiences the loss of health?