Embed Size (px)
Citation preview
i
Project 2016/19:
Socio-economic developmental strategies as retail performance indicators: A balanced scorecard
approach
Project 2016/19:
Socio-economic developmental strategies
as retail performance indicators:
A balanced scorecard approach
April 2016
Prepared by:
Lead researcher: W J Sewell, D Litt et Phil
Research team: P Venter, CPUT
Roger B Mason, WRLC, CPUT
Wholesale and Retail Leadership Chair
Cape Peninsula University of Technology
Cape Town
“Collaboration opens the window to a world of opportunities“
Copyright, Cape Peninsula University of Technology. 2016.
Copyright for this report is held by Cape Peninsula University of Technology.
No part of this report may be published in part or in whole, reproduced, stored in a
retrieval system, or transmitted, in any form or by any means, unless permission has
been obtained from the Cape Peninsula University of Technology.
All reasonable care has been taken in collecting data and in the resultant
interpretation of this data. Cape Peninsula University of Technology, the Wholesale &
Retail Leadership Chair, and the author(s)/editor cannot accept any liability for any
direct or indirect loss that might result because of unintentional errors or omissions in
the data and interpretation thereof.
The opinions and conclusions in this report are those of the author/s and the
Wholesale & Retail Leadership Chair, and are not necessarily those of Cape
Peninsula University of Technology.
ISBN 978-0-9946954-1-3
This report is available online at: www.wrlc.org.za

i
CONTENTS Page
Executive Summary: v
Chapter 1
Introduction: Context, Objectives and Scope 1
1.1 RESEARCH CONTEXT 1
1.2 RESEARCH OBJECTIVES AND SCOPE 2
1.3 SOCIO-ECONOMIC SIGNIFICANCE OF THE RETAIL BUSINESS SECTOR
3
1.4 CONCLUSION: SYNERGISING RETAIL SCORECARDS, TOWARDS ‘OUR FUTURE: MAKE IT WORK’
6
Chapter 2
Methodology 7
2.1 RESEARCH TYPE 7
2.2 SAMPLING 8
2.3 DATA COLLECTION 8
2.4 DATA ANALYSIS 8
2.5 VALIDITY AND RELIABILITY 9
2.6 FOCUS GROUP CRITIQUE 9
2.7 CONCLUSION 9
Chapter 3
Literature Review 11
3.1 ‘BALANCED SCORECARD’ INTEGRATED STRATEGY MANAGEMENT: ORIGINS AND RETAIL BENCHMARKS
11
3.1.1 What is the relevant literature on the balanced scorecard as a management system for planning and monitoring a diverse range of organisational performance strategies?
11
3.1.1.1 The Balanced Scorecard: Translating Strategy into Action (Kaplan & Norton 1996)
11
3.1.1.2 Towards the Sustainable Corporation: Win-Win-Win for Sustainable Development (Elkington 1994)
12
3.1.1.3 Strategy and Society: The Link between Competitive Advantage and Corporate Social Responsibility (Porter and Kramer 2006)
13
ii
CONTENTS Page
3.2 INTERNATIONAL RETAILERS’ SCORECARD PRACTICES 14
3.2.1 United States of America: National Retail Federation 14
3.2.1.1 Wal-Mart 15
3.2.1.2 Target Stores 15
3.2.2 Australia 15
3.2.2.1 David Jones 16
3.2.2.2 Myer Holdings Limited 16
3.2.3 United Kingdom and Europe 16
3.2.3.1 Marks and Spencer Group 17
3.2.3.2 John Lewis Partnership 17
3.2.3.3 Tesco PLC 16
3.3 ANALYSIS OF INTERNATIONAL RETAIL SCORECARD PRACTICES
18
3.4 SCORECARD PRACTICES OF SOUTH AFRICAN RETAILERS 19
3.4.1 To what extent is a form of ‘balanced scorecard’ management system used by South African retail organisations in strategising, monitoring and evaluating their financial and socio economic developmental objectives?
21
3.4.1.1 Clicks Group Limited 21
3.4.1.2 Edcon Holdings Limited 22
3.4.1.3 JD Group 23
3.4.1.4 Lewis Group Limited 25
3.4.1.5 Mr Price Group Limited 26
3.4.1.6 Pick n Pay Stores Limited 28
3.4.1.7 Shoprite Holdings Limited 30
3.4.1.8 Spar Group Limited 31
3.4.1.9 The Foschini Group Limited 33
3.4.1.10 Truworths International Limited 34
3.4.1.11 Woolworths Holdings Limited 36
3.4.2 What are the key pressures and opportunities for retail businesses to
address socio-economic development strategies, as organisational performance indicators?
38
3.4.3. Is there evidence of added benefits in the collaborative use of scorecard perspectives, between retail businesses and state institutions, to promote socio-economic development?
39

iii
CONTENTS Page
3.4.4. Are there significant differences in performance scorecard perspectives, socio-economic developmental strategies and outcomes, between retail sub-sectors and company size?
39
3.5 LITERATURE REVIEW CONCLUSIONS 40
Chapter 4
EMPIRICAL DATA: DIALOGIC INTERVIEW INSIGHTS AND PERCEPTIONS 42
4.1 INTERVIEW RESPONSES TO THE RESEARCH QUESTIONS 42
4.1.1 What is the relevant literature on the ‘balanced scorecard’ as a management system for planning and monitoring a diverse range of organisational performance strategies?
42
4.1.2 To what extent is a form of ‘balanced scorecard’ management system used by South African retail organisations in strategising, synergising and evaluating their financial and socio-economic developmental practices?
42
4.1.3 What are the key pressures, opportunities or problems for retail businesses to address socio-economic developmental strategies, as organisational performance indicators?
43
4.1.4 Is there evidence of benefits in the collaborative use of balanced scorecard perspectives, between business and state institutions, to promote socio-economic development?
44
4.1.5 Are there significant differences in performance scorecard perspectives, socio-economic developmental strategies and outcomes, between retail company size and sub-sectors?
46
4.2 SUMMARY OF FINDINGS 47
Chapter 5
CONCLUSION 49
5.1 SUMMARY 49
5.2 RECOMMENDATIONS 50
5.2.1 Retail Stakeholder Forum 50
5.2.2 Reality Check: Scorecard substance or Wish list? 51
5.2.3 Retail Charter scorecard indicators for collaborative adoption 51
5.2.4 Recommendations for further research 51
iv
References 52
Appendices 57
List of Tables iv
List of Figures iv
List of Appendices iv
List of Tables
3.1 Six Capitals of Value Creation – Clicks Group 22
3.2 Six Capitals of Value Creation – Mr Price Group 26
3.3 Six Capitals of Value Creation – Pick n Pay Stores 28
3.4 Scorecard Framework – Spar Group 32
3.5 Six Capitals of Value Creation – The Foschini Group 33
3.6 Six Capitals of Value Creation – Truworths 35
3.7 Six Capitals of Value Creation – Woolworths Holdings 37
5.1 Overall Summary of Findings 49
List of Figures
1.1 National Development Plan Cycle of Development Scorecard 2
1.2 Employment by Enterprise Size in the Retail Trade 4
1.3 Gross Monthly Household Income 5
3.1 The Balanced Scorecard strategic framework 11
3.2 Triple Bottom Line: a business imperative 12
3.3 Tesco Steering Wheel 17
3.4 Six Capitals required to realise the JD Group strategic business goals 24
3.5 The Pick n Pay Steering Wheel 29
3.6 Ubuntu: Retail Brand Recognition for socio-economic scorecard contribution 38
List of Appendices
A Interview Guidelines 57
B Empirical Survey Matrix 58
C Letter of Information and Informed Consent 59
D CPUT Ethics Clearance Certificate 61
E
& F
Scorecard for Broad based Socio-Economic Empowerment Charter for the
South African Mining Industry (from Government Gazette 13 August 2004)
61
v
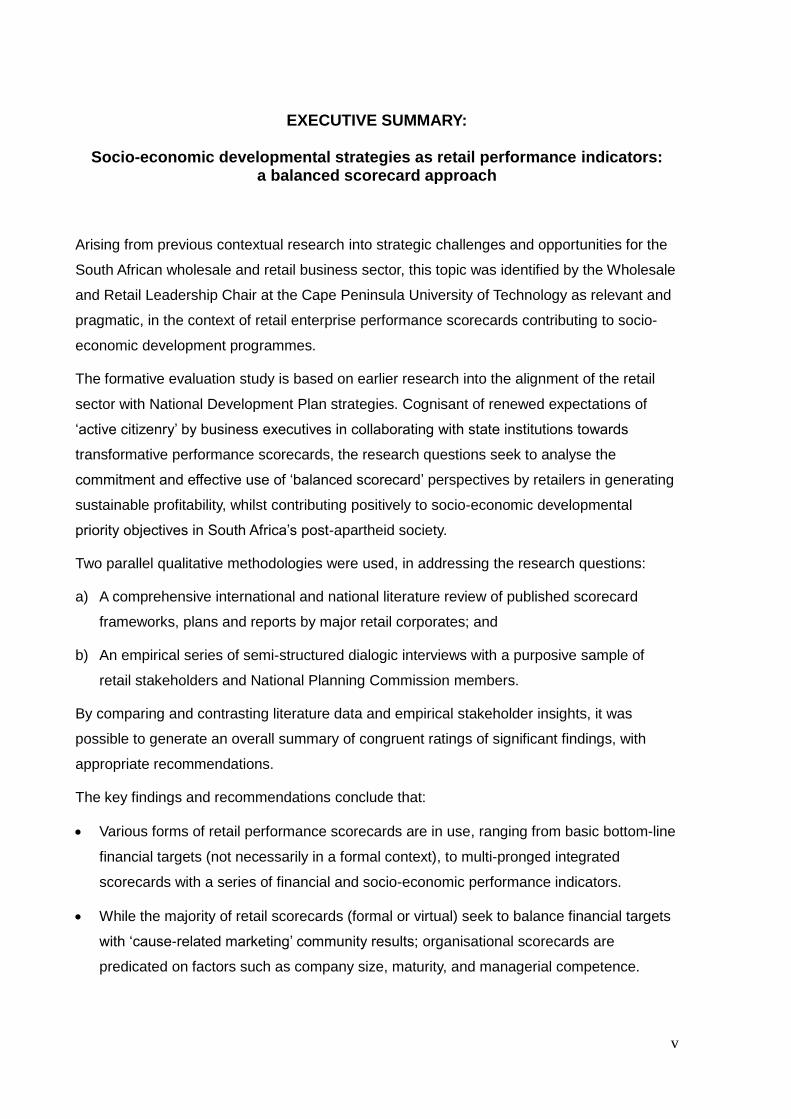
EXECUTIVE SUMMARY:
Socio-economic developmental strategies as retail performance indicators:
a balanced scorecard approach
Arising from previous contextual research into strategic challenges and opportunities for the
South African wholesale and retail business sector, this topic was identified by the Wholesale
and Retail Leadership Chair at the Cape Peninsula University of Technology as relevant and
pragmatic, in the context of retail enterprise performance scorecards contributing to socio-
economic development programmes.
The formative evaluation study is based on earlier research into the alignment of the retail
sector with National Development Plan strategies. Cognisant of renewed expectations of
‘active citizenry’ by business executives in collaborating with state institutions towards
transformative performance scorecards, the research questions seek to analyse the
commitment and effective use of ‘balanced scorecard’ perspectives by retailers in generating
sustainable profitability, whilst contributing positively to socio-economic developmental
priority objectives in South Africa’s post-apartheid society.
Two parallel qualitative methodologies were used, in addressing the research questions:
a) A comprehensive international and national literature review of published scorecard
frameworks, plans and reports by major retail corporates; and
b) An empirical series of semi-structured dialogic interviews with a purposive sample of
retail stakeholders and National Planning Commission members.
By comparing and contrasting literature data and empirical stakeholder insights, it was
possible to generate an overall summary of congruent ratings of significant findings, with
appropriate recommendations.
The key findings and recommendations conclude that:
Various forms of retail performance scorecards are in use, ranging from basic bottom-line
financial targets (not necessarily in a formal context), to multi-pronged integrated
scorecards with a series of financial and socio-economic performance indicators.
While the majority of retail scorecards (formal or virtual) seek to balance financial targets
with ‘cause-related marketing’ community results; organisational scorecards are
predicated on factors such as company size, maturity, and managerial competence.
vi
Collaboration between retailers and state institutions in scorecard development and
monitoring is not a reality, as has been achieved in some other industry sectors. It is
therefore recommended that steps be taken to convene a retail stakeholder forum, in
order to explore the merits of a collaborative Retail Charter scorecard framework, with
potential to promote public/private sector knowledge sharing and retail supply-chain
socio-economic developmental strategies.
1
CHAPTER 1
INTRODUCTION: CONTEXT, OBJECTIVES AND SCOPE
1.1 RESEARCH CONTEXT
A survey report entitled Priority Research Needs of the South African Wholesale and Retail
Sector (Steyn, Sewell and Venter 2013) marked the first step taken by the Wholesale and
Retail Leadership Chair (WRLC) towards the creation of a basis for contemporary research
in this dynamic business sector. The WRLC report provided an overview of significant
research and learning requirements within the wholesale and retail business sector,
prioritising strategic topics within the framework of the country’s National Skills Development
Strategy lll (RSA 2011b), National Development Plan: Vision 2030 (NDP) socio-economic
developmental strategies; and the W&R Sector Education and Training Authority mandate.
As one of the key retail research topics, a position paper (Sewell, Mason and Venter 2014)
defined the strategy alignments in retail business sector implementation of National
Development Plan socio-economic developmental themes. The NDP highlights (RSA 2012:
27) that “three core developmental priorities stand out, towards building an inclusive,
equitable South African society, namely:
Raising employment through faster economic growth;
Improving the quality of education, skills development and innovation; and
Building the capability of the state to play a developmental, transformative role”.
Towards achievement of these national transformative priorities, the functional links in the
retail supply chain can have significant socio-economic added value, with job creation and
cause-related marketing implications, within the diversity of South African society
(Varadarajan and Menon 1988; Porter 1996; National Business Initiative 2005; Gagnon 2005;
Porter and Kramer 2005; Corbishley and Mason 2011; Retail Indaba Report 2014; Bureau of
Market Research, UNISA 2015; Business Monitor International 2015).
Responding to the report findings and recommendations, National Planning Commissioner
Muller indicated that this had been a subject of strategic debate at the 2014 World Economic
Forum meeting, asking: “How do we organise supply chains and retail sector operations
more inclusively, to build a sustainable society (and business enterprises) in the long term,
rather than just to extract maximum profit in the short term?”
Since then, the appointment of new National Planning Commission leadership, coupled with
promulgation of the Medium-Term Strategic Framework 2014-2019 (RSA 2014) ‘ministerial
scorecard’ outcomes for addressing post-apartheid inequality, poverty and unemployment,
2
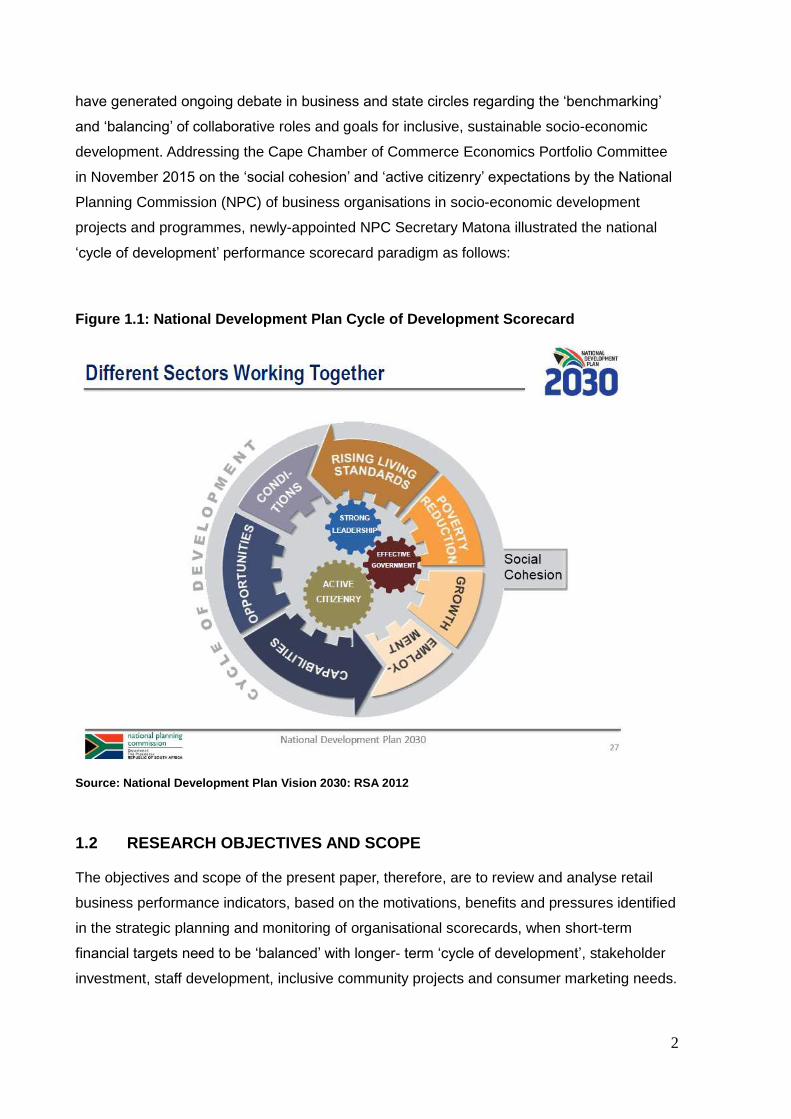
have generated ongoing debate in business and state circles regarding the ‘benchmarking’
and ‘balancing’ of collaborative roles and goals for inclusive, sustainable socio-economic
development. Addressing the Cape Chamber of Commerce Economics Portfolio Committee
in November 2015 on the ‘social cohesion’ and ‘active citizenry’ expectations by the National
Planning Commission (NPC) of business organisations in socio-economic development
projects and programmes, newly-appointed NPC Secretary Matona illustrated the national
‘cycle of development’ performance scorecard paradigm as follows:
Figure 1.1: National Development Plan Cycle of Development Scorecard
Source: National Development Plan Vision 2030: RSA 2012
1.2 RESEARCH OBJECTIVES AND SCOPE
The objectives and scope of the present paper, therefore, are to review and analyse retail
business performance indicators, based on the motivations, benefits and pressures identified
in the strategic planning and monitoring of organisational scorecards, when short-term
financial targets need to be ‘balanced’ with longer- term ‘cycle of development’, stakeholder
investment, staff development, inclusive community projects and consumer marketing needs.
3
In terms of the national development priorities highlighted above, this study seeks to address
the following questions through international literature review, complemented by empirical
interview insights and stakeholder perceptions for effective retail business scorecard design
and performance:
What is the relevant literature on the ‘balanced scorecard’ as a management system for
planning and monitoring a diverse range of organisational performance strategies?
To what extent is a form of ‘balanced scorecard’ management system used by South
African retail organisations in strategising, synergising and evaluating their financial and
socio-economic developmental indicators?
What are the key pressures and opportunities for retail businesses to address socio-
economic developmental strategies, as organisational performance indicators?
Is there evidence of benefits in the collaborative use of scorecard perspectives,
between retail businesses and state institutions, to promote socio- economic
development?
Are there significant differences in performance scorecard perspectives, socio-economic
developmental strategies, between retail company size and sub-sectors?
Within the retail sector supply chain, customer, staff and investor contexts, differentiated
retail business scorecard frameworks are applied to the socio-economic strategies of the
National Development Plan: Vision 2030 (RSA 2012), which was formulated after extensive
public consultation by the National Planning Commission diagnostic report (RSA 2011a).
The National Development Plan themes include few objectives relating directly to the retail
sector, although NDP Chapters 3 and 7 highlight strategic objectives and ‘Business Drivers of
Change’ (RSA 2012: 152), which require well-informed data and organisational scorecard
synergy by retail strategists and decision-makers.
It is therefore envisaged that this study will contribute to shared retail business scorecard
understanding, collaborative performance indicator design and focussed implementation of
inclusive developmental scorecard strategies.
1.3 SOCIO-ECONOMIC SIGNIFICANCE OF THE RETAIL BUSINESS SECTOR
The retail sector is a significant component of the South African economy and a major
employer. According to Statistics South Africa, retailing is the fourth largest contributor to
Gross Domestic Product; and the 30 000 tax-registered retail enterprises employ about 20%
of the economically active workforce of the country.
4
In the collaborative spirit of ‘Fashioning corporate social responsibility’ (Jones, Hillier and
Comfort 2012), ‘Retailing in post-apartheid South Africa: the strategic positioning of
Boardmans ‘ (De Bruyn and Freathy 2011) describes the social and economic transformation
that has occurred since the end of the former apartheid regime; and discusses the
implications of these changes for the retail sector. In particular, the emergence of a new
(increasingly black) middle class has motivated many retailers to reconfigure their business
scorecard strategies, community marketing and staff profiles.
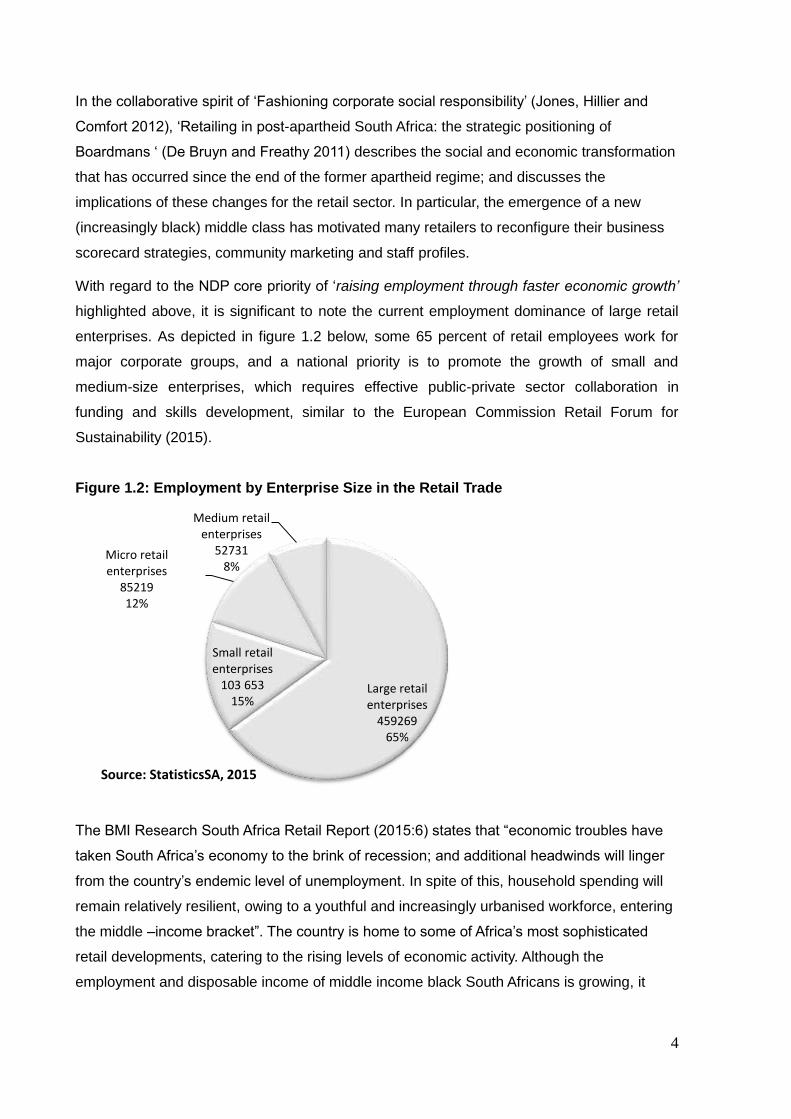
With regard to the NDP core priority of ‘raising employment through faster economic growth’
highlighted above, it is significant to note the current employment dominance of large retail
enterprises. As depicted in figure 1.2 below, some 65 percent of retail employees work for
major corporate groups, and a national priority is to promote the growth of small and
medium-size enterprises, which requires effective public-private sector collaboration in
funding and skills development, similar to the European Commission Retail Forum for
Sustainability (2015).
Figure 1.2: Employment by Enterprise Size in the Retail Trade
The BMI Research South Africa Retail Report (2015:6) states that “economic troubles have
taken South Africa’s economy to the brink of recession; and additional headwinds will linger
from the country’s endemic level of unemployment. In spite of this, household spending will
remain relatively resilient, owing to a youthful and increasingly urbanised workforce, entering
the middle –income bracket”. The country is home to some of Africa’s most sophisticated
retail developments, catering to the rising levels of economic activity. Although the
employment and disposable income of middle income black South Africans is growing, it
Large retail enterprises
459269 65%
Small retail enterprises
103 653 15%
Micro retail enterprises
85219 12%
Medium retail enterprises
52731 8%
Source: StatisticsSA, 2015
5
remains essential for retailers to promote ‘Brand SA’ local product sourcing, manufacturing
and agri-business development, towards maximising local supplier sustainability and
employment; thereby increasing the disposable income of potential retail customers.
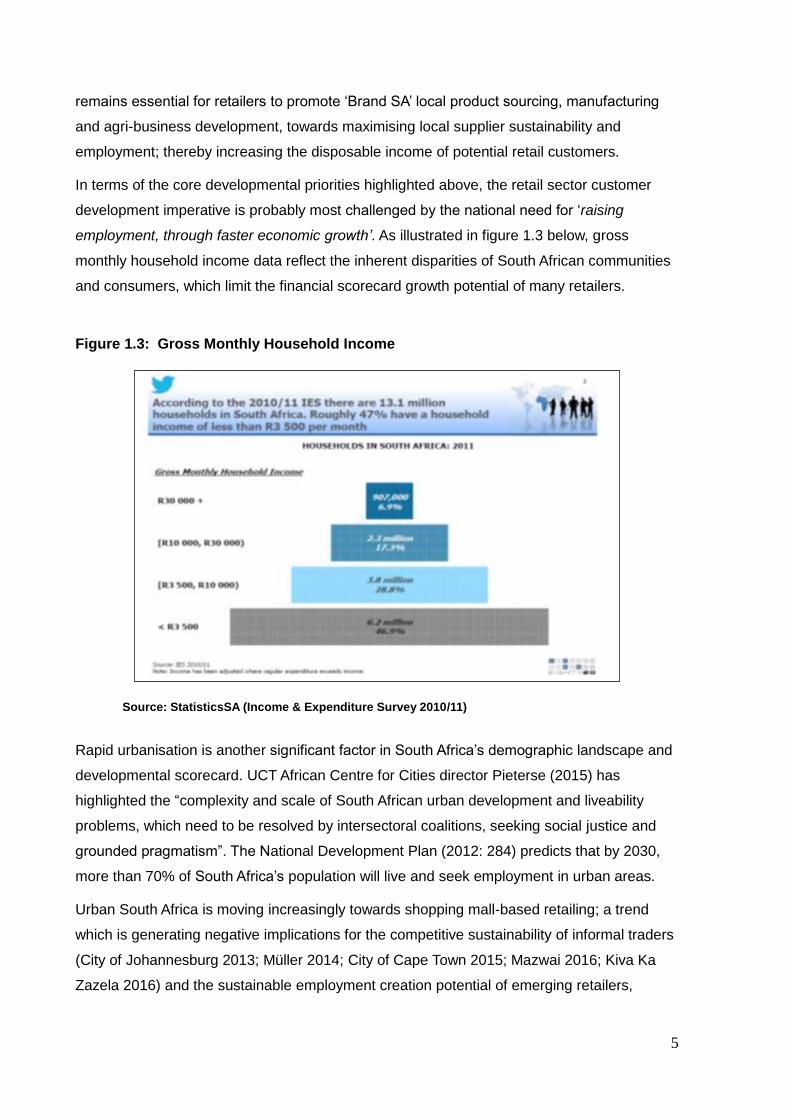
In terms of the core developmental priorities highlighted above, the retail sector customer
development imperative is probably most challenged by the national need for ‘raising
employment, through faster economic growth’. As illustrated in figure 1.3 below, gross
monthly household income data reflect the inherent disparities of South African communities
and consumers, which limit the financial scorecard growth potential of many retailers.
Figure 1.3: Gross Monthly Household Income
Source: StatisticsSA (Income & Expenditure Survey 2010/11)
Rapid urbanisation is another significant factor in South Africa’s demographic landscape and
developmental scorecard. UCT African Centre for Cities director Pieterse (2015) has
highlighted the “complexity and scale of South African urban development and liveability
problems, which need to be resolved by intersectoral coalitions, seeking social justice and
grounded pragmatism”. The National Development Plan (2012: 284) predicts that by 2030,
more than 70% of South Africa’s population will live and seek employment in urban areas.
Urban South Africa is moving increasingly towards shopping mall-based retailing; a trend
which is generating negative implications for the competitive sustainability of informal traders
(City of Johannesburg 2013; Müller 2014; City of Cape Town 2015; Mazwai 2016; Kiva Ka
Zazela 2016) and the sustainable employment creation potential of emerging retailers,
6
formerly disadvantaged by apartheid socio-economic policy constraints. These socio-
economic developmental indicators are relevant to the research questions of this retail
‘balanced scorecard’ study, and will be reviewed in subsequent chapters.
1.4 CONCLUSION: SYNERGISING RETAIL SCORECARDS, TOWARDS ‘OUR
FUTURE: MAKE IT WORK’
South Africans from all walks of life participated in the consultative processes which informed
the National Planning Commission’s Diagnostic Report (RSA 2011a), highlighting that “since
the dawn of inclusive democracy in 1994, much has been achieved, but still more work
needs to be done, to make South Africa truly belong to all who live in it”. (2011a:28).
Business managers are frequently faced with decisions of how to allocate and motivate
scarce resources, in an environment that is placing more and more pressures on them,
within the corporate social development -financial performance link (Wood 1991; Waddock
and Graves 1997). Literature reviewed and roleplayers interviewed, within the links in the
retail supply chain, identified a range of socio-economic development and sustainability
scorecard indicators which are being benchmarked towards ‘balancing’ immediate financial
objectives more positively with the vision of socio-economic developmental strategies.
Business collaboration with state strategies and governance policies is not a new
phenomenon, as has been evident in East Asian and European Union regional development
initiatives. Business Unity South Africa (BUSA Annual Review 2015), a federation including
the Retail Association and Retail Motor Industry Organisation, has been active in promoting
sector collaboration, corporate social investment (CSI) and industry transformation charters;
including the Manufacturing Circle (2015) and Mining Industry Growth, Development and
Employment Task Team (2015). No formal collaboration or transformation charter currently
exists in the Retail sector.
‘When is a balanced scorecard a balanced scorecard?’ ask Soderberg, Kalagnanam,
Shehan and Vaidyanathan (2011). Echoing that taxonomic conundrum, the present study
reflects the socio-economic demographics of South African retail enterprises, within the
realities of diverse communities, household expenditure, employment equity, staff
competence, procurement and supply chain options. Together, these realities define the
scorecard pressures, opportunities and benefits for retail strategists, when they consider the
synergies of ‘balancing’ their short-term financial objectives with the longer-term socio-
economic developmental priorities of the National Development Plan: Vision 2030.
7
CHAPTER 2
METHODOLOGY
2.1 RESEARCH TYPE
In framing the mixed methods, qualitative research methodology for this evaluation study,
research methodology in the business management context followed the pragmatic data
gathering and analytical approach of Bryman, Bell, Hirschsohn, Dos Santos, Du Toit and
Masenge (2015). The literature review and stakeholder dialogic interviews reflect the
diversity in effective usage of organisational performance scorecards in the retail sector; and
reinforce the National Planning Commission’s wide consultation in its diagnostic phase; as
well as the ongoing need for “catalysing development in Africa” (African Management
Initiative 2015) and “African voices in the development debate” (Africa Progress Panel 2015).
Following Patton’s (2002) utilisation-focused programme evaluation methodology, widely
used within the Department of Planning, Monitoring and Evaluation (DPME), opportunities
were identified for descriptive literature review of ‘balanced scorecard’, ‘triple bottom line’ and
similar multi-pronged performance frameworks, coupled with performance strategy indicators
in business and public governance seminars. Thereafter followed supplementary interviews
with retail sector management and stakeholders, National Planning Commission members
and officials accountable for socio-economic policy; and performance evaluation practitioners.
The exploratory and descriptive international literature review phase sought to strengthen
understanding of the international retail business contexts of the ‘Triple Bottom Line’
(Elkington 1994) and ‘Balanced Scorecard’ (Kaplan and Norton 1996) performance
management paradigms; and subsequent publication of the National Development Plan:
Vision 2030 (RSA 2012), which proposes priorities of South African socio-economic
development, for ‘active citizenry’ achievement. Thereafter, literature review and dialogic
interviews with retail stakeholders sought to gain insights into the evolving perceptions of the
country’s socio-economic diagnostics and inclusive development strategies. In the process, it
became evident that a qualitative focus on the retail customer profiles, supply chains,
employee engagement and community demographics would facilitate meaningful answers to
the research questions, within a relational social capital framework (Smith, De Beer and
Mason 2015) of stakeholder performance concepts and socio-economic complexity.
2.2 SAMPLING
Emmel’s (2013) grounded ‘realist approach’ to qualitative sampling and ‘dynamics of
knowledge production and utilisation’ (Bailey 2005) proved meaningful, in analysing and
8
interpreting the diversity of South African retail sector scorecard perceptions, policies and
priorities. A purposive sample of 60 sector roleplayers (from retail management, business
associations, government agencies and sector service providers) was interviewed (see
Appendix B), in order to gain their pragmatic insights into balanced scorecard motivation,
synergistic strategies and perceived benefits, pressures and problems for socio-economic
developmental initiatives.
2.3 DATA COLLECTION
The literature review and interview guide (Appendix A) were designed to identify relevance of
use by retail organisations of a ‘balanced scorecard’, ‘triple bottom line’ or similar integrated
performance strategy framework, aligned with national development priority themes; and to
analyse possible corporate / independent trader and retail sub- sector strategy variances; in
order to generate valid answers to the defined research questions.
Thereafter, literature review insights were supplemented through empirical dialogic interviews
with a purposive range of stakeholders and roleplayers in the retail sector; including several
retail-related trade associations, sub-sectors of retail activity and corporate image aspirations.
These empirical dialogic interviews reflect current retail business scorecard practices, within
the analysis of financial ‘bottom line’ focus, socio-economic developmental priorities and
corporate social investment (CSI) policies and strategies.
2.4 DATA ANALYSIS
Qualitative analysis, scorecard benchmarking and empirical interpretation of socio-economic
development strategies emerging from the literature review data were facilitated by semi-
structured dialogic interview insights of retailer ‘socio-economic development priorities’, and
by explanatory comments made by a purposive sample of retail business and regulatory
stakeholders in major urban regions. 60 interview insights were analysed, indicating the
significance of retail management use of a form of ‘balanced scorecard’ or similar
performance management tool, synergising short-term financial objectives with longer-term
community and/or socio-economic investment, in support of employment creation,
developmental inclusiveness, equity and sustainability strategies.
The literature review and empirical survey processes indicated that many retailers perceive
specific socio-economic developmental strategies and cause-related marketing as relevant to
their business growth, reputation and sustainability; albeit within a wide variety of motivations,
resources and scorecard indicators.
9
2.5 VALIDITY AND RELIABILITY
Face- and context-validity of responses by retail stakeholders and regulatory roleplayers
were optimised, within the variables of organisational and individual perceptions of scorecard
alignment with the ‘core developmental priorities’ seen as relevant to inclusive growth and
sustainability of the retail sector; and of the potential synergies for effective governance
collaboration and implementation of those financial and socio-economic developmental
objectives.
Reliability of data will largely be a function of the sampling distribution of the rating
frequencies; and of the intra-sectoral transferability of these rating values, among the
commercial diversity of retail respondents’ retail performance scorecards.
2.6 FOCUS GROUP CRITIQUE
Prior to finalisation of this report, representatives of several retail business enterprises and
associations provided constructive insights. Valuable critique of the draft report was provided
by a focus group of retail stakeholders. The researcher presented an overview of the study
objectives, methodology, key findings and recommendations to the stakeholders, who
provided frank feedback on aspects of the draft report which, in their view, required
enhanced clarity, verification, focus or formatting. Their candid scorecard comments and
well-informed interview recommendations were helpful in enhancing validity and utilisation-
focused pragmatic evaluation, for this qualitative study.
2.7 CONCLUSION
The knowledge production and utilisation methodology (Emmel 2013) of this literature review
and empirical study were purposively sampled, seeking to analyse the extent of strategic use
of ‘balanced‘, ‘integrated’ and/or ‘triple bottom line’ performance scorecard systems in a
range of retail organisations, in ‘active citizenry’ support of inclusive socio-economic
development, as specified in the research objectives.
The retail ‘thought leader’ exploratory phase, literature review and semi-structured dialogic
interviews with retail sector stakeholders, market research and National Planning
Commission roleplayers in major urban regions contributed positively to the validity and
reliability of the data. It is acknowledged, however, that the ‘utilisation focus’ of the scorecard
indicators and ‘return on organisational investment’ insights are dependent on the clarity of
business ‘active citizenry’ strategies, socio-economic developmental commitment; as well as
the relevance and rigour of scorecard management design, monitoring and evaluation.
10
CHAPTER 3
LITERATURE REVIEW
3.1 ‘BALANCED SCORECARD’ INTEGRATED STRATEGY MANAGEMENT:
ORIGINS AND RETAIL BENCHMARKS
In this chapter, literature sources are reviewed to identify the origins and purposes of
the ‘balanced scorecard‘ and similar multi-pronged strategic performance
management systems; to explore their adaptations and applications by international
and South African retail organisations; and to analyse relevant data and insights
which will contribute to answering the five research questions, below.
3.1.1 What is the relevant literature on the balanced scorecard as a
management system for planning and monitoring a diverse range of
organisational performance strategies?
Literature sources in which organisational scorecard approaches to a synergistic range of
financial, marketing, employee and socio-economic performance indicators originated are
reviewed in this chapter; illustrated by benchmark examples of implementation in
international retail enterprises, potentially relevant to the research questions.
3.1.1.1 The Balanced Scorecard: Translating Strategy into Action (Kaplan & Norton
1996)
The origins of this seminal book can be traced back to 1990, when the authors launched a
multi-company study entitled ‘Measuring Performance in the Organisation of the Future’.
Their study was motivated by the view that existing business performance measurements
were becoming obsolete; and that reliance on purely financial performance indicators was
hindering organisations’ potential to create future socio-economic value and reputation, in
their target communities.
Their initial study group findings were summarised in a Harvard Business Review article,
‘The Balanced Scorecard: Measures that Drive Performance’ (Kaplan and Norton 1992). At
that time, the authors were contracted by several senior corporates, to help them implement
the balanced scorecard concept in their business organisations. They found that most
organisations – even those implementing new performance management systems – were not
effectively aligning indicators, outcomes and stakeholder reports to strategic business
processes; namely those that must be performed exceptionally well for an organisation’s
strategies to succeed.
11
Further consulting work with a number of United States companies (including a major
clothing retailer, a retail bank, and a petroleum retailer) saw the ‘balanced scorecard’ evolve
into a ‘core strategic management system’, as was detailed in another Harvard Business
Review article (February 1996), titled ‘Using the Balanced Scorecard as a Strategic
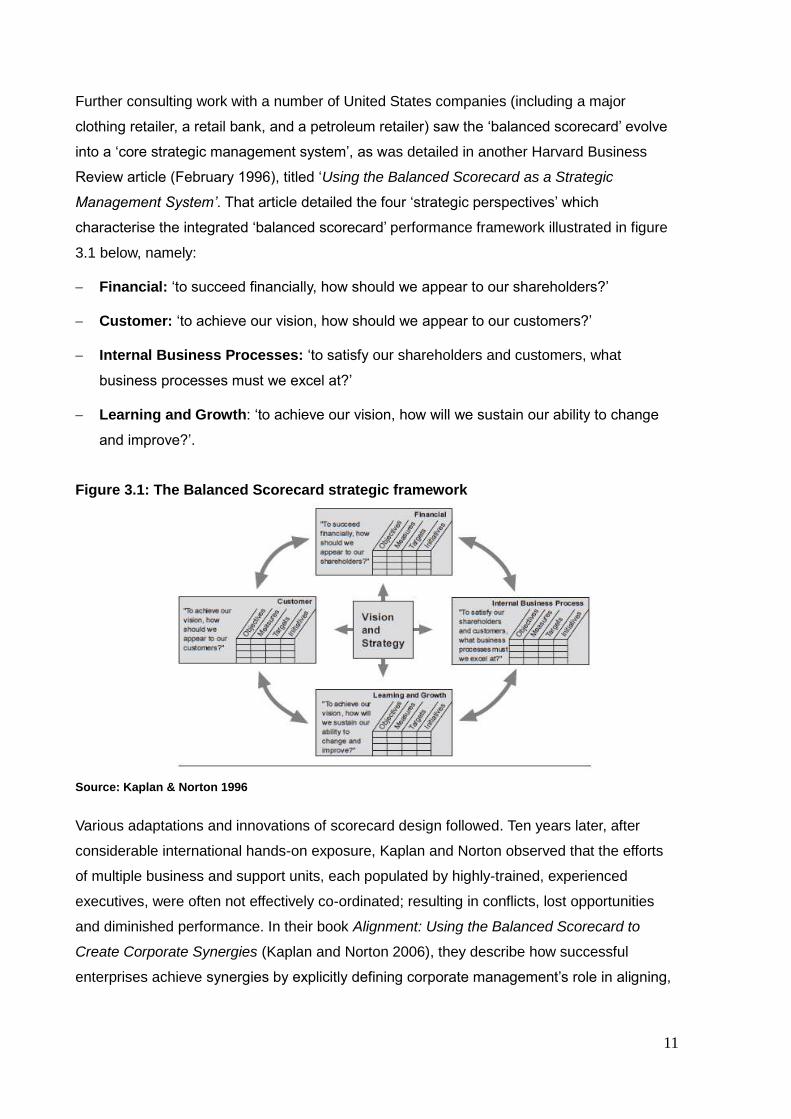
Management System’. That article detailed the four ‘strategic perspectives’ which
characterise the integrated ‘balanced scorecard’ performance framework illustrated in figure
3.1 below, namely:
Financial: ‘to succeed financially, how should we appear to our shareholders?’
Customer: ‘to achieve our vision, how should we appear to our customers?’
Internal Business Processes: ‘to satisfy our shareholders and customers, what
business processes must we excel at?’
Learning and Growth: ‘to achieve our vision, how will we sustain our ability to change
and improve?’.
Figure 3.1: The Balanced Scorecard strategic framework
Source: Kaplan & Norton 1996
Various adaptations and innovations of scorecard design followed. Ten years later, after
considerable international hands-on exposure, Kaplan and Norton observed that the efforts
of multiple business and support units, each populated by highly-trained, experienced
executives, were often not effectively co-ordinated; resulting in conflicts, lost opportunities
and diminished performance. In their book Alignment: Using the Balanced Scorecard to
Create Corporate Synergies (Kaplan and Norton 2006), they describe how successful
enterprises achieve synergies by explicitly defining corporate management’s role in aligning,
12
co-ordinating and overseeing organisational strategy. These sometimes contradictory
performance scorecard indicators and outcomes will be reviewed in the retail business
context, internationally and in South Africa.
3.1.1.2 Towards the Sustainable Corporation: Win-Win-Win for Sustainable
Development (Elkington 1994)
At about the time that Kaplan and Norton published their initial article, other innovative
scorecard concepts changed the way that businesses, non-profit organisations and
government agencies could define and measure performance and sustainability of their
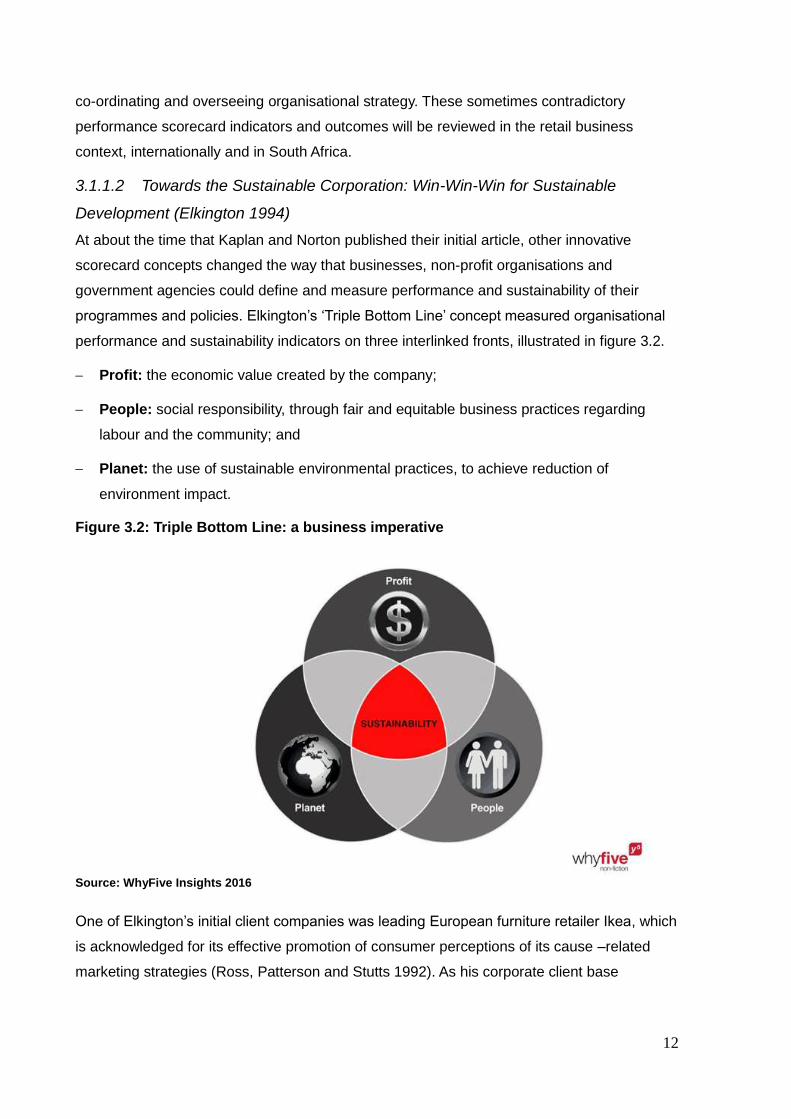
programmes and policies. Elkington’s ‘Triple Bottom Line’ concept measured organisational
performance and sustainability indicators on three interlinked fronts, illustrated in figure 3.2.
Profit: the economic value created by the company;
People: social responsibility, through fair and equitable business practices regarding
labour and the community; and
Planet: the use of sustainable environmental practices, to achieve reduction of
environment impact.
Figure 3.2: Triple Bottom Line: a business imperative
Source: WhyFive Insights 2016
One of Elkington’s initial client companies was leading European furniture retailer Ikea, which
is acknowledged for its effective promotion of consumer perceptions of its cause –related
marketing strategies (Ross, Patterson and Stutts 1992). As his corporate client base
13
expanded, his book ‘Cannibals with Forks- The Triple Bottom Line of 21st Century Business’
(Elkington 1997) highlighted the benefits of sustainable practices, in reducing environmental
impact. He also indicated the challenge of comparing the ‘people’ and ‘planet’ accounts in
financial terms; the way in which the ‘profit’ performance scorecard indicator is measured.
3.1.1.3 Strategy and Society: The Link between Competitive Advantage and
Corporate Social Responsibility (Porter and Kramer 2006)
In their 2006 article, Porter and Kramer proposed a fundamentally new way to look at the
scorecard relationship between business and society, which does not treat corporate
financial growth and social investment as a zero-sum game. They introduced a corporate
scorecard framework, to discover opportunities to benefit society and themselves, by
strengthening the competitive context in which they operate; and to determine which
corporate social responsibility (CSR) initiatives they should address, finding the most
effective ways of doing so.
Recent papers review the relevance of business scorecards which seek to balance, blend or
integrate CSR indicators with financial results. Queiroz (2016) makes a compelling business
case for including CSR in the corporate scorecard; and Browne, Nuttall and Stadlen (2016)
posit a ‘practical blueprint for reconciling companies and communities’. They argue that
companies should move beyond CSR to ‘engage radically with society’, towards a ‘new
frontier of competitive advantage, profitability and longevity’ in their scorecards.
In this context, Adams (2015) sets out the case for ‘integrated reporting’ and its potential to
change the thinking of business managers, leading to the further integration of sustainability
indicators, within strategic planning and tactical management. Her paper refers to the
increasing influence of the International Integrated Reporting Council (IIRC) which is a global
coalition of more than a thousand businesses, investors, government agencies and
regulators. The IIRC recommends that all ‘integrated scorecard reports' should include a
combination of quantitative and qualitative information, based on a ‘six capitals’ framework of
values that are transformed by the activities of an organisation; namely:
Financial
Manufactured
Intellectual
Human
Social and Relationship; and
Natural Capital.
An organisation’s IIRC business performance scorecard draws on these six capital inputs;
and shows how its strategic activities transform them into value-adding outputs.
14
3.2 INTERNATIONAL RETAILERS’ SCORECARD PRACTICES
Benchmark examples from several countries illustrate scorecard approaches typically
focussed on retail investors, target customers, staff or communities in which the company
seeks to promote its reputation – and so to enhance its indicators of ‘return on expectations’.
‘The relationship of customer satisfaction, customer loyalty and profitability: an empirical
study’ (Hallowell 1996) and ‘An application of the balanced scorecard in retailing’ (Thomas,
Gable and Dickinson 1999) both present findings of scorecard evaluation studies in the USA,
using multiple indicators of retail profitability, customer satisfaction and loyalty. Their findings
indicated that a form of ‘balanced scorecard’ offered a flexible management technique for
improving multi-branch retail performance.
Understanding management motivation and staff attitudes towards their organisation’s
scorecard system is an important contribution to the literature (Aguinis 2009). ‘Is a Balanced
Scorecard useful in a Competitive Retail Environment?’ (Biggart, Burney, Flanagan and
Harden 2010) is the question posed for a multi-store qualitative study of retail managers’
satisfaction with their company scorecard system. That study reflects how perceptions differ
across staff and management levels; and includes a comparison of how these perceptions
are related to the system’s scoring criteria and to company financial results.
3.2.1 United States of America: National Retail Federation
The collaborative scorecard agenda of the National Retail Federation is strategically ‘focused
on jobs, innovation and consumer value’. The NRF 2015 Annual Report highlights that
member companies and NRF policy committees ‘educate lawmakers’, participating in
legislature working groups which monitor employment law, health and employee benefits,
food and product safety, food supply chain, and postal services. Regular interaction and
advocacy with government legislatures and socio-economic agencies is promoted, using the
Retail Opportunity Index to ‘measure the support of policies that contribute to a healthy retail
sector and US economy’.
From the consumer perspective, two major US retail groups featured highly in ‘America’s 25
Most Inspiring Companies’ (2015) which reported on a national customer survey, based on a
‘validated scorecard of company inspiration drivers’, including
Ethics
Competitive prices; and
Staff engagement.
15
3.2.1.1 Wal-Mart was rated in second place, nationally, because the company ‘keeps its
promises and is authentic in terms of competitive pricing, commitment to give back to the
community’; and is a ‘welcome source of employment for senior citizens’.
The Wal-Mart Global Responsibility Report (2015) reflects the company’s adaptation of a
‘triple bottom line’ scorecard, with commitments to:
Community
Innovation
Sustainability
Opportunity
Probably a reflection of the ultimate importance of financial sustainability indicators, the Wall
Street Journal (15 January 2016) reported that Wal-Mart had announced its intention of
closing 269 stores globally (including 154 in the USA) in the coming year, in order to ‘focus
resources on e-commerce and other areas of more profitable operation’.
3.2.1.2 Target Stores (in third place, nationally) was recognised by respondents for its
excellent Corporate Social Responsibility record, using three scorecard indicators:
Creating positive guest experiences together
Making a great workplace, together
Supporting our communities, together.
3.2.2 Australia
The Retail Council in Australia is developmentally active on behalf of its member companies.
The Council engaged with government and other industry associations at the Australian
National Reform Summit in 2015, seeking common scorecards for economic and social
reform, including the Indigenous Australia Program, a national equity development campaign.
Reform Summit agenda items highlighted by the Retail Council underscored that:
“The nation’s economic and social cohesion is slipping;
Youth unemployment is unacceptably high; and
Growth, combined with societal equity, is the priority objective.”
In support of the third agenda item, the Retail Council’s ‘Women in Retail Business and
Leadership’ seminar series was launched.
In solidarity with those national socio-economic development themes, two major Australian
retail groups have added significant strategies to their scorecards, as described below:
16
3.2.2.1 David Jones’ Corporate Sustainability Report provides an overview of this major
Australian retail company’s performance in five key areas; including ‘Our people;
Commitment to organisational health and safety; Community; Supply chain; and
Environment’. Community scorecard indicators highlighted in the David Jones report are
A ‘diamond partner’ donor commitment to the National Breast Cancer Foundation (with a
widely-promoted ‘Shop Pink Donation Day’) and
Appointment of a ‘brand ambassador’ to promote the national Reconciliation Action Plan,
‘working to build strong community relationships and mutual respect between aboriginals
and non-indigenous Australians’.
3.2.2.2 Myer Holdings Limited. As one of Australia’s largest department store groups,
Myer has a footprint of over 70 stores nationally. The Myer Diversity Policy is ‘committed to a
fair and inclusive work environment, that embraces diversity and recognises its contribution
to Myer’s commercial success’; underpinned by key socio-economic indicators, including:
Mentoring competence development and offering work practices to meet the differing
needs of employees, in the context of business requirements;
Eliminating artificial barriers to career progression, by providing support;
Setting key performance indicators for senior executives, to measure the achievement of
diversity objectives.
3.2.3 United Kingdom and Europe
In the context of synergistic ‘balanced’, ‘triple bottom line’ and ‘six capitals’ strategies,
corporate social investment and cause-related marketing indicators are evident in British and
European retail performance management scorecards, exemplified below.
3.2.3.1 The Marks and Spencer Group, with over 800 stores in Britain and 400 in Europe
and abroad, details group financial and non-financial performance indicators in its 2015
Strategic Report. M&S Group non-financial socio-economic scorecard indicators include:
‘improved product sustainability’ and ‘reduced greenhouse gas emissions impact’, both of
which require effective product sourcing and supply chain management; and the M&S
Strategic Report highlights that ‘it is crucial that we listen to our customers and understand
their needs’; hence the development of a Customer Insight Unit (CIU), which analyses
responses from 60 000 customers a month, across the regional cultures of Britain, Europe
and Asia. CIU reports combine the periodic feedback with ongoing market research, to
monitor the various consumer climates and understand regional shopping behaviour.
17
3.2.3.2 The John Lewis Partnership included in its Annual Report 2015 a comprehensive
Sustainability Review, ‘reflecting the way we do business internationally’. The John Lewis
Partnership performance principles are defined as follows, each with a case study to
illustrate this major international retail group’s strategic scorecard:
Purpose: ‘Building a stronger, happier business’
Power: ‘Making better decisions, together’
Profit: ‘Using our profits to grow sustainably’
Members: ‘Leading with a more engaging approach’
Customers: ‘Generating loyalty through choices, value and service’
Business relationships: ‘A better way of doing business’
Community: ‘Creating value beyond the Partnership’.
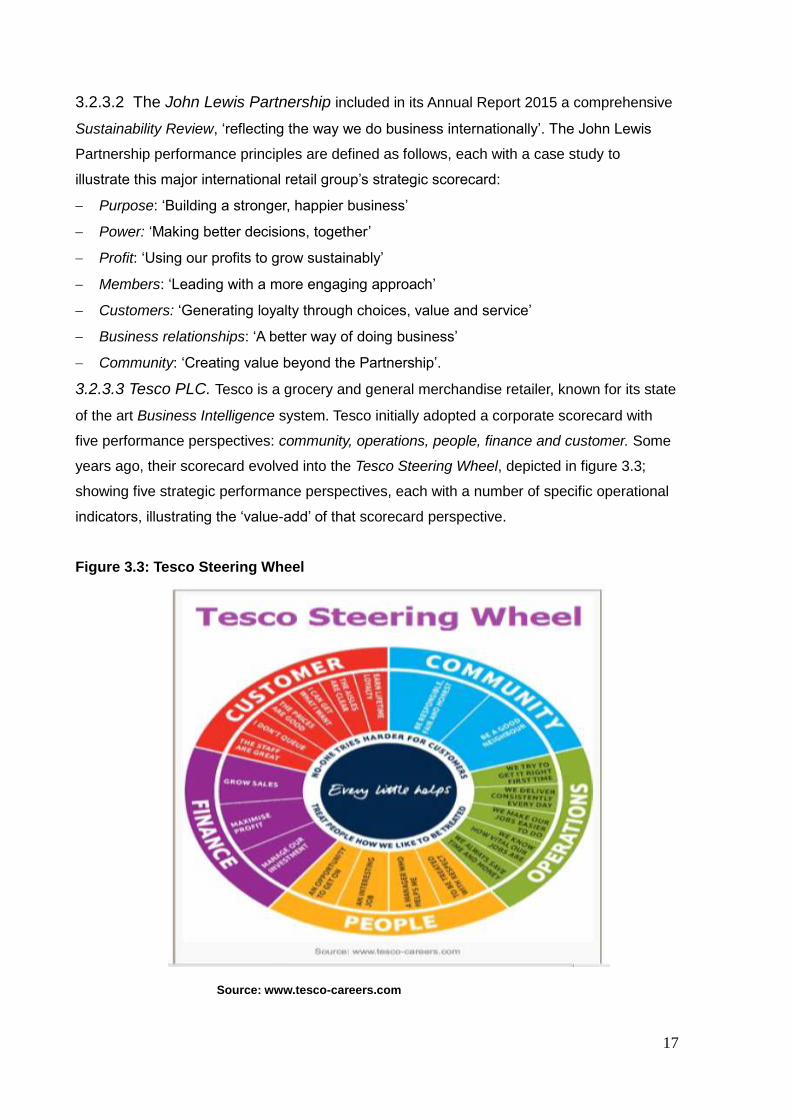
3.2.3.3 Tesco PLC. Tesco is a grocery and general merchandise retailer, known for its state
of the art Business Intelligence system. Tesco initially adopted a corporate scorecard with
five performance perspectives: community, operations, people, finance and customer. Some
years ago, their scorecard evolved into the Tesco Steering Wheel, depicted in figure 3.3;
showing five strategic performance perspectives, each with a number of specific operational
indicators, illustrating the ‘value-add’ of that scorecard perspective.
Figure 3.3: Tesco Steering Wheel
Source: www.tesco-careers.com
18
The complexity of this Steering Wheel scorecard framework, however, became confusing for
Tesco management, staff and customers. In the Tesco PLC Annual Report 2015, the
statement is made that ‘the Steering Wheel served us well for many years, but as time has
gone on, it became too complex, with over 40 different measures. We now have just six
simple key performance indicators. It’s all about alignment and focus: if we give our
colleagues more power to choose the right actions, we’ll do a better job for customers and
achieve greater success for our business’. The simplified Tesco Scorecard now has six
scorecard indicators:
Customers recommend us and come back, time and again.
Colleagues recommend us as a great place to work and shop.
We build trusted partnerships with suppliers.
Grow sales.
Deliver profit.
Improve operating cash flow.
These six Tesco strategic scorecard indicators are indeed ‘balanced’ – with three financial
and three stakeholder relations performance indicators. Moreover, the Tesco board has a
Corporate Responsibility Committee and works closely with an Expert Advisory Panel of four
independent advisors, who act as a critical voice to audit and evaluate the company’s socio-
economic strategies and performance scorecard.
3.3 ANALYSIS OF INTERNATIONAL RETAIL SCORECARD PRACTICES
These international benchmarks of retail business performance scorecards illustrate a range
of management practices, across national and corporate cultures, to ‘balancing’ the
traditional ‘bottom line’ financial success indicator with socio-economic developmental goals,
typically seeking to promote community awareness and consumer loyalty, towards business
sustainability and growth.
Few of the international contexts, except that of Australian promotion of indigenous peoples’
development, provide retail performance indicators that are relevant to the current South
African context; in which the National Development Plan objectives, together with
employment equity and preferential procurement legislation, seek transformative socio-
economic ‘active citizenry’ commitments from business enterprises.
In the next chapter, the extent of forms of ‘balanced scorecard’ strategies and tactics of
South African retail corporates will be reviewed and analysed, with regard to the key
pressures, opportunities and benefits of such scorecard strategies.
19
3.4 SCORECARD PRACTICES OF SOUTH AFRICAN RETAILERS
A pioneering reference to the retail entrepreneurial value of defining and delivering multi-
pronged financial and socio-economic scorecard indicators is reflected in The Four Legs of
the Table (Ackerman 2005), positing that retail performance needs to be based on effective
Administration, Merchandise, Promotions/ Social Responsibility and People management.
Besides consideration of the National Planning Commission Diagnostic Report (RSA 2011)
and National Development Plan: Vision 2030 (RSA 2012), the literature review undertaken
for this evaluation study encompassed relevant national socio-economic developmental
analyses, including topics relating to challenges facing socially responsible business
investment in South Africa (Herringer, Firer and Viviers 2009); State-Business Relations and
Economic Growth in sub-Saharan Africa (Te Velde with Leftwich 2010); Bureau for Economic
Research/ Ernst & Young retail survey (2015); Business Monitor International: South African
Retail (2015); and South African Reconciliation Barometer 2015 (Institute for Justice and
Reconciliation 2016),which provide diverse insights into socio-economic developmental
scorecard perceptions, pressures, problems, opportunities and benefits.
Few academic papers relating to the South African business sector ‘balanced scorecard’
governance, regulatory and marketing strategies were found. These included a qualitative
exploration of corporate social investment (CSI) attitudes by Human and Terblanche (2009);
a South African perspective on corporate governance and risk management (Young 2010);
and an in-depth study of marketing and consumer behaviour in the eThekweni metropolitan
municipality (Corbishley and Mason 2011). In reviewing the retail scorecard governance data,
with a view to socio-economic strategy analysis within the objectives of this study, note was
also taken of regulatory framework factors which may promote, impede or pressurise
sustainable business growth, socio-economic inclusivity and job creation, including:
Legislation impacting on local procurement, supply chain logistics and costs (Luke and
Heyns 2013; Republic of South Africa 2011a).
Economic Infrastructure development resources and skills requirements (De Bruin 2013)
Entrepreneurship, youth unemployment and job market entry (African Frontiers Forum
2013; Chatterji, Glaeser and Kerr 2013; SA Board for People Practices 2014)
Mechanisms for promoting ‘active citizenry’ in monitoring government socio-economic
services (RSA 2013)
Franchising models, business reputations and community trust (Falala 2013; Franchise
Association of South Africa 2015).
Changing the Colour of Capital: Essays in politics and economics (Turok, Ed 2015).
20
Sources of particular South African retail sector performance relevance, informing scorecard
insights, benefits and pressures for contributing to socio-economic development and
promoting sustainable retail business include inter alia:
National Labour and Economic Development Institute (NALEDI 2007)
Commissioned by the Department of Trade and Industry’s Economic Research and Policy
Co-ordination Unit, this insightful NALEDI (2007) report is entitled The Retail Sector: An
Analysis of its contribution to Economic Growth, Employment and Poverty Reduction.
NEDLAC Trade and Industry Chamber: National Retail Sector Strategy 2010
This strategic review of the retail sector was undertaken as a Fund for Research into
Industrial Development, Growth and Equity study, via the National Economic Development
and Labour Council (2010). Key outcomes of this benchmark study indicate that the primary
ways to stimulate W&R economic growth are through minimising the regulatory burden,
creating a more conducive public governance environment in which to do business.
The Retail Industry on the Rise in South Africa: Gauteng Provincial
Treasury 2012 This bulletin prepared by the Provincial Treasury of South Africa’s
economic hub, comments on the economic environment which allows consumers to spend
more, supported by an increase in both the supply of retail space and the number of
shopping centres in the country. At 26.5 percent, Gauteng province contributes the largest
share of gross value added by the retail industry, nationally. The bulletin also highlights an
average annual increase of 29 percent in online retail sales, which adds more employment
opportunities to the youth. Some of the strategic challenges experienced by retailers,
according to this Gauteng report, include operational costs and skills shortages.
Retail Association: Employment Conference 2014
According to the Retail Association 2014 Employment Conference report, ”Gearing up for
future growth, retailers need to take a strategic look at the sector’s employment market
requirements. Collaborative, pro-active strategies are vital to ensure that retail has the
human capital capacity to stimulate and sustain economic growth in the sector”.
Consumer Goods Council of South Africa: Annual Report 2015
The Consumer Goods Council, incorporating the South African Retail Council, brings
together a wide range of consumer product manufacturers, importers, wholesalers and
retailers. The CGCSA Annual Report (2015) reflects several aspects of collaborative sector
strategies, members’ achievements and pressures for enhancing inclusive socio-economic
development, which will be reviewed in this study.
21
Institute for Poverty, Land and Agrarian Studies and Southern Africa Food
Laboratory
Associated with the Universities of the Western Cape, Stellenbosch and Cape Town, these
two innovative organisations (PLAAS and SAFL 2015) collaborate in socio-economic
developmental projects, supporting smallholder growth towards commercial agriculture,
including sustainable supply chains for retail supermarket groups.
3.4.1 To what extent is a form of ‘balanced scorecard’ management system
used by South African retail organisations in strategising, monitoring and
evaluating their financial and socio-economic developmental objectives?
In the context of South Africa’s socio-economic growth and employment equity priorities and
of the international retailer scorecard indicators benchmarked above, a purposive sample of
Integrated Annual Reports of major South African retail groups was reviewed, in order to
analyse their scorecard strategies and ‘cause-related marketing’ approaches to synergising
organisational financial and socio-economic development indicators. As was highlighted
earlier, 65% of retail staff are employed by these major corporate groups, which are
members of the Johannesburg Securities Exchange (JSE), which sets standards for
members’ Socially Responsible Investment Index (Sonnenberg and Hamann 2006). Their
annual reports are therefore in the public domain and subject to JSE reporting requirements,
for ease of investor scorecard access and media comparative analysis.
A purposive framework was used in analysing these corporate retail business strategic
scorecards, which will be supplemented by semi-structured dialogic interviews with a
pragmatic range of retail sector stakeholders.
3.4.1.1 Clicks Group Limited
(a) Retail footprint and mission
Headquartered in Cape Town, the Clicks Group retail brands (Clicks, Musica, The Body Shop
franchise, GNC franchise and Claires franchise) have a combined footprint of 657 stores;
including 34 in neighbouring countries. The Clicks Group 2015 Integrated Annual Report
states that its mission is “to create sustainable long-term shareholder value through a retail-
led health, beauty and wellness offering”.
(b) Scorecard framework
The Report states that the International Integrated Reporting Council (IIRC) framework of six
Capitals of Value Creation, as described earlier in the international literature review, have
been adopted by the Board, in defining and reporting on the Group scorecard, as follows:
22
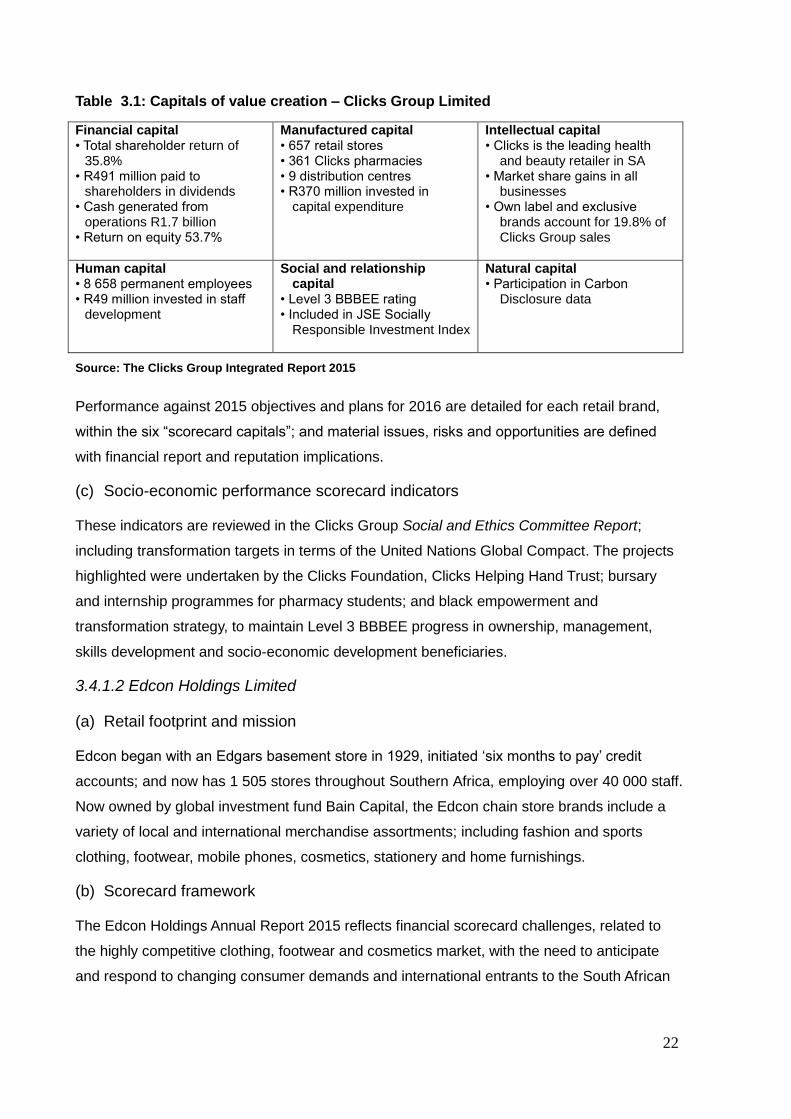
Table 3.1: Capitals of value creation – Clicks Group Limited
Financial capital • Total shareholder return of
35.8% • R491 million paid to
shareholders in dividends • Cash generated from
operations R1.7 billion • Return on equity 53.7%
Manufactured capital • 657 retail stores • 361 Clicks pharmacies • 9 distribution centres • R370 million invested in
capital expenditure
Intellectual capital • Clicks is the leading health
and beauty retailer in SA • Market share gains in all
businesses • Own label and exclusive
brands account for 19.8% of Clicks Group sales
Human capital • 8 658 permanent employees • R49 million invested in staff
development
Social and relationship capital
• Level 3 BBBEE rating • Included in JSE Socially
Responsible Investment Index
Natural capital • Participation in Carbon
Disclosure data
Source: The Clicks Group Integrated Report 2015
Performance against 2015 objectives and plans for 2016 are detailed for each retail brand,
within the six “scorecard capitals”; and material issues, risks and opportunities are defined
with financial report and reputation implications.
(c) Socio-economic performance scorecard indicators
These indicators are reviewed in the Clicks Group Social and Ethics Committee Report;
including transformation targets in terms of the United Nations Global Compact. The projects
highlighted were undertaken by the Clicks Foundation, Clicks Helping Hand Trust; bursary
and internship programmes for pharmacy students; and black empowerment and
transformation strategy, to maintain Level 3 BBBEE progress in ownership, management,
skills development and socio-economic development beneficiaries.
3.4.1.2 Edcon Holdings Limited
(a) Retail footprint and mission
Edcon began with an Edgars basement store in 1929, initiated ‘six months to pay’ credit
accounts; and now has 1 505 stores throughout Southern Africa, employing over 40 000 staff.
Now owned by global investment fund Bain Capital, the Edcon chain store brands include a
variety of local and international merchandise assortments; including fashion and sports
clothing, footwear, mobile phones, cosmetics, stationery and home furnishings.
(b) Scorecard framework
The Edcon Holdings Annual Report 2015 reflects financial scorecard challenges, related to
the highly competitive clothing, footwear and cosmetics market, with the need to anticipate
and respond to changing consumer demands and international entrants to the South African
23
market. Significantly, the board report highlights the risk that “We may not be able to obtain
the capital required to implement our business plan, which may force us to limit the scope of
our operations, and adversely impact our revenues”. This cautionary note follows
retrenchment of several thousand Edcon head office and branch staff, in recent years.
(c) Socio-economic performance scorecard indicators
In December, however, a special media release announced a strategic realignment plan,
‘designed to enhance financial performance by ensuring that customer needs are at the
centre of every strategic decision that is made’. The chief executive commented in the media
release that Edcon liquidity and balance sheet stabilisation now made it possible to ‘roll out
an operational improvement programme, with three key scorecard imperatives:
Customer-centric approach; Simplicity; and People empowerment’.
In summarising the Edcon scorecard performance indicators, the chief executive commented
that ‘lean retail, with reduced complexity is key; and an agile supply chain with quick
responses to stores, will be the drivers to ensure better productivity’. He added that the
Edgars chain will be focussing on ‘a more effective transformation programme’.
3.4.1.3 JD Group
(a) Retail footprint and mission
The JD Group (an abbreviation of Joshua Doore, its original furniture store brand), consists
of 1223 retail stores, 64 automotive dealerships and 34 car rental outlets; with a total of
24 302 employees. The JD Group Annual Report 2015 reflects that its retail branches are in
the following sub-sectors in Southern Africa: furniture; household appliances; consumer
electronic and technology goods; building materials and do-it-yourself (DIY) products.
(b) Scorecard framework
A balanced scorecard approach is evident in the JD Group Mission Statement, namely ‘to
lead in our chosen sectors by satisfying our customers’ needs and stakeholders’ expectations,
through the delivery of consistent, sustainable profit growth’, based on the foundational
values of: responsibility and accountability; urgency; performance-driven; and commitment to
customer service.
Drawing on the principles of integrated reporting, the JD Group business scorecard goals are
underpinned by the following six IIRC ‘capitals’.
24
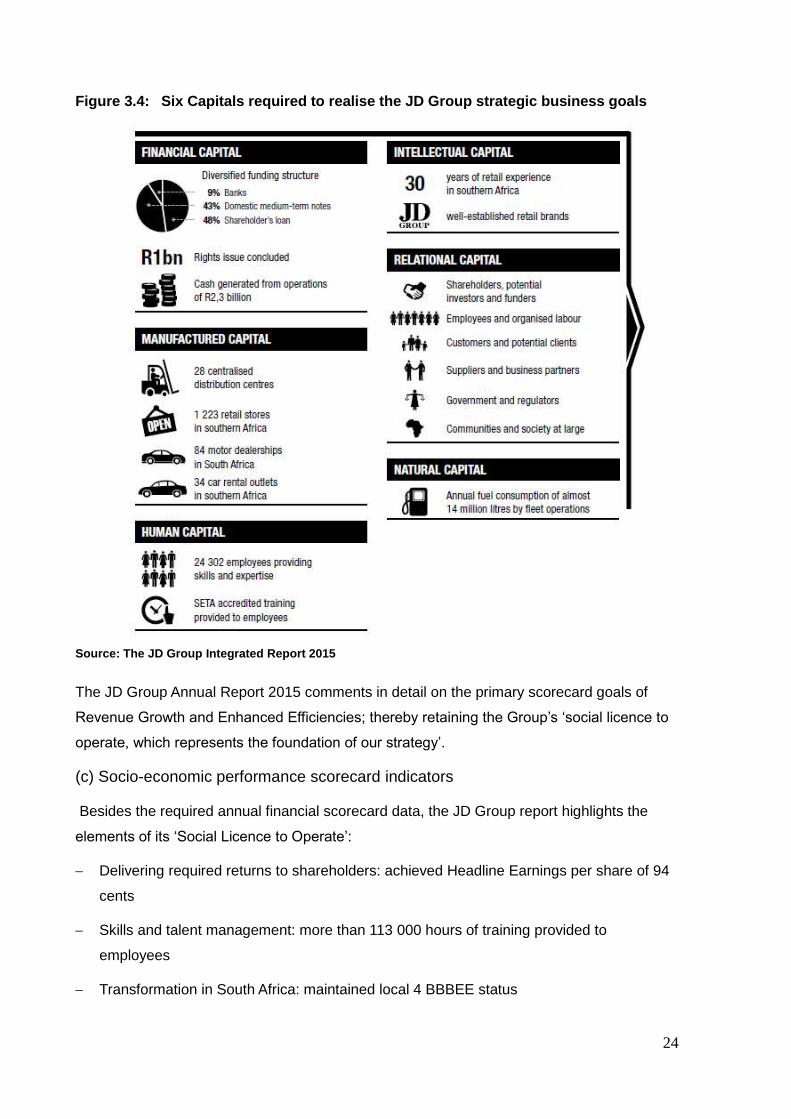
Figure 3.4: Six Capitals required to realise the JD Group strategic business goals
CAPITAL
Source: The JD Group Integrated Report 2015
The JD Group Annual Report 2015 comments in detail on the primary scorecard goals of
Revenue Growth and Enhanced Efficiencies; thereby retaining the Group’s ‘social licence to
operate, which represents the foundation of our strategy’.
(c) Socio-economic performance scorecard indicators
Besides the required annual financial scorecard data, the JD Group report highlights the
elements of its ‘Social Licence to Operate’:
Delivering required returns to shareholders: achieved Headline Earnings per share of 94
cents
Skills and talent management: more than 113 000 hours of training provided to
employees
Transformation in South Africa: maintained local 4 BBBEE status
25
Sustainability and being a responsible corporate citizen: first-time inclusion in the JSE
Socially Responsible Investment (SRI) index.
3.4.1.4 Lewis Group Limited
(a) Retail footprint and mission
The first Lewis furniture store opened in Cape Town in 1934. Listed on the Johannesburg
Securities Exchange (JSE) since 2004, the Lewis Group now has 716 furniture and
appliance stores across Southern Africa, targeting customers in the fast-growing lower-to-
middle income market. Brands now include: Lewis, Beares, Best Home & Electric, as well as
Monarch Insurance, which provides insurance cover to credit account customers.
(b) Scorecard framework
The Lewis Group Integrated Annual Report 2015 highlights company medium-term indicators
and targets, with key risks and action plans, under the corporate scorecard headings of:
Merchandising and Supply Chain
Credit Management
Execution of Business Model
Financial Capital Management
Human Capital Management
(c) Socio-economic performance scorecard indicators
Apart from the statutory financial data, these scorecard elements are highlighted in the Social,
Ethics and Transformation Committee report, which is a board committee operating in
compliance with the Companies’ Act. This committee report announces that the Lewis Group
qualified for inclusion in the JSE Socially Responsible Investment (SRI) Index for the fourth
successive year; and also evaluates the group’s transformation performance against the
Department of Trade and Industry BBBEE scorecard, in which it has achieved Level 4 status
for 5 successive years.
In the Lewis annual report, the indicator of ‘Engaging with Stakeholders‘ is emphasised as
‘central to the group’s sustainability … aimed at maintaining mutually beneficial relationships,
to create opportunities to enhance revenue and performance, and ultimately ensure longer-
term sustainability’.
In terms of corporate social investment, ‘Lewis seeks to be an integral part of the lives of
stakeholders, and recognised by the communities in which they operate as a dependable,
26
caring and ethical corporate citizen’. The majority of Lewis’ community support goes towards
education and nutrition, followed by health and the cause of children at risk in their society.
The ‘Nation Builder’ programme states in the Lewis Group report that it ‘is proud to be
associated, because the company’s deeper community purpose supercedes their profits’.
3.4.1.5 Mr Price Group Limited
(a) Retail footprint and mission
Based in KwaZulu-Natal province, Mr Price Group has 1 150 stores throughout Southern
Africa and online channels offering full product assortments, with a market capitalisation of
R64 billion. Group retail operations focus on fashion, sportswear and home textiles, and
include 15 franchised stores in neighbouring countries.
(b) Scorecard framework
The 2015 Annual Integrated Report of Mr Price Group exemplifies the principles of a
‘balanced scorecard/triple bottom line’ performance management system, using the
International Integrated Reporting Council framework.
Besides a comprehensive financial performance analysis, in compliance with King 111
governance requirements, the 2015 Annual Integrated Report includes an informative IIPC
‘Six Capitals Framework’ summary of resources and value creation indicators, as follows:
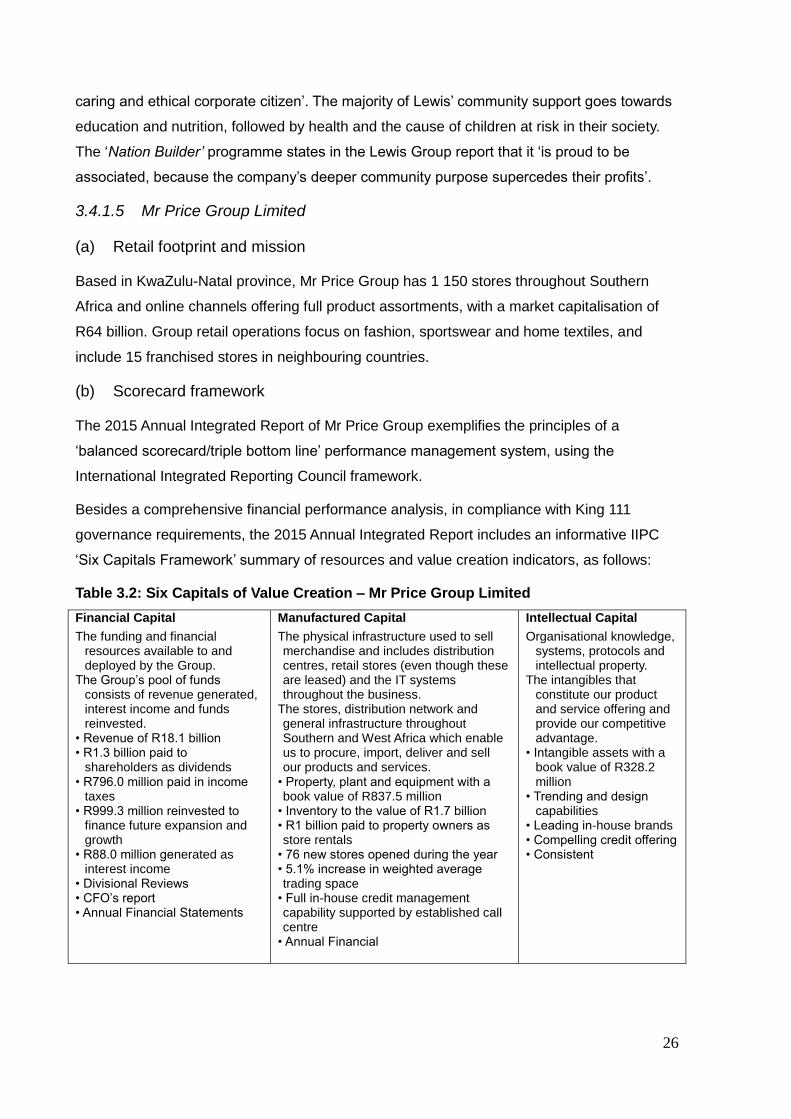
Table 3.2: Six Capitals of Value Creation – Mr Price Group Limited
Financial Capital
The funding and financial resources available to and deployed by the Group.
The Group’s pool of funds consists of revenue generated, interest income and funds reinvested.
• Revenue of R18.1 billion • R1.3 billion paid to
shareholders as dividends • R796.0 million paid in income
taxes • R999.3 million reinvested to
finance future expansion and growth
• R88.0 million generated as interest income
• Divisional Reviews • CFO’s report • Annual Financial Statements
Manufactured Capital
The physical infrastructure used to sell merchandise and includes distribution centres, retail stores (even though these are leased) and the IT systems throughout the business.
The stores, distribution network and general infrastructure throughout Southern and West Africa which enable us to procure, import, deliver and sell our products and services.
• Property, plant and equipment with a book value of R837.5 million
• Inventory to the value of R1.7 billion • R1 billion paid to property owners as store rentals
• 76 new stores opened during the year • 5.1% increase in weighted average trading space
• Full in-house credit management capability supported by established call centre
• Annual Financial
Intellectual Capital
Organisational knowledge, systems, protocols and intellectual property.
The intangibles that constitute our product and service offering and provide our competitive advantage.
• Intangible assets with a book value of R328.2 million
• Trending and design capabilities
• Leading in-house brands • Compelling credit offering • Consistent
27
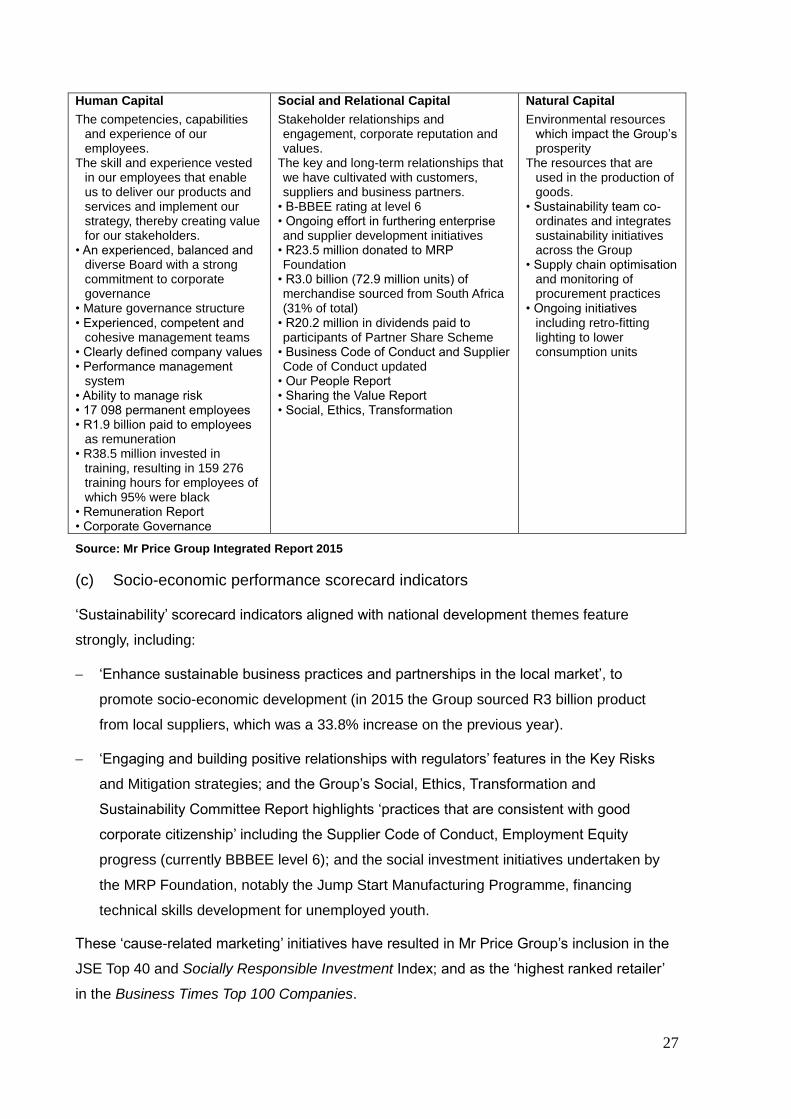
Human Capital
The competencies, capabilities and experience of our employees.
The skill and experience vested in our employees that enable us to deliver our products and services and implement our strategy, thereby creating value for our stakeholders.
• An experienced, balanced and diverse Board with a strong commitment to corporate governance
• Mature governance structure • Experienced, competent and
cohesive management teams • Clearly defined company values • Performance management
system • Ability to manage risk • 17 098 permanent employees • R1.9 billion paid to employees
as remuneration • R38.5 million invested in
training, resulting in 159 276 training hours for employees of which 95% were black
• Remuneration Report • Corporate Governance
Social and Relational Capital
Stakeholder relationships and engagement, corporate reputation and values.
The key and long-term relationships that we have cultivated with customers, suppliers and business partners.
• B-BBEE rating at level 6 • Ongoing effort in furthering enterprise and supplier development initiatives
• R23.5 million donated to MRP Foundation
• R3.0 billion (72.9 million units) of merchandise sourced from South Africa (31% of total)
• R20.2 million in dividends paid to participants of Partner Share Scheme
• Business Code of Conduct and Supplier Code of Conduct updated
• Our People Report • Sharing the Value Report • Social, Ethics, Transformation
Natural Capital
Environmental resources which impact the Group’s prosperity
The resources that are used in the production of goods.
• Sustainability team co-ordinates and integrates sustainability initiatives across the Group
• Supply chain optimisation and monitoring of procurement practices
• Ongoing initiatives including retro-fitting lighting to lower consumption units
Source: Mr Price Group Integrated Report 2015
(c) Socio-economic performance scorecard indicators
‘Sustainability’ scorecard indicators aligned with national development themes feature
strongly, including:
‘Enhance sustainable business practices and partnerships in the local market’, to
promote socio-economic development (in 2015 the Group sourced R3 billion product
from local suppliers, which was a 33.8% increase on the previous year).
‘Engaging and building positive relationships with regulators’ features in the Key Risks
and Mitigation strategies; and the Group’s Social, Ethics, Transformation and
Sustainability Committee Report highlights ‘practices that are consistent with good
corporate citizenship’ including the Supplier Code of Conduct, Employment Equity
progress (currently BBBEE level 6); and the social investment initiatives undertaken by
the MRP Foundation, notably the Jump Start Manufacturing Programme, financing
technical skills development for unemployed youth.
These ‘cause-related marketing’ initiatives have resulted in Mr Price Group’s inclusion in the
JSE Top 40 and Socially Responsible Investment Index; and as the ‘highest ranked retailer’
in the Business Times Top 100 Companies.
28
3.4.1.6 Pick n Pay Stores Limited
(a) Retail footprint and mission
With 699 owned stores (48 700 employees) and 490 franchised stores (2 200 employees)
across Southern Africa, the PnP and Boxer Group sources merchandise from over 5 000
trade suppliers, through its 10 distribution centres.
The Pick n Pay Stores Ltd Integrated Annual Report 2015 specifically highlights its balanced
scorecard mission, driven by ‘three enduring values of:
Customer sovereignty
Business efficiency, and
Doing good is good business’.
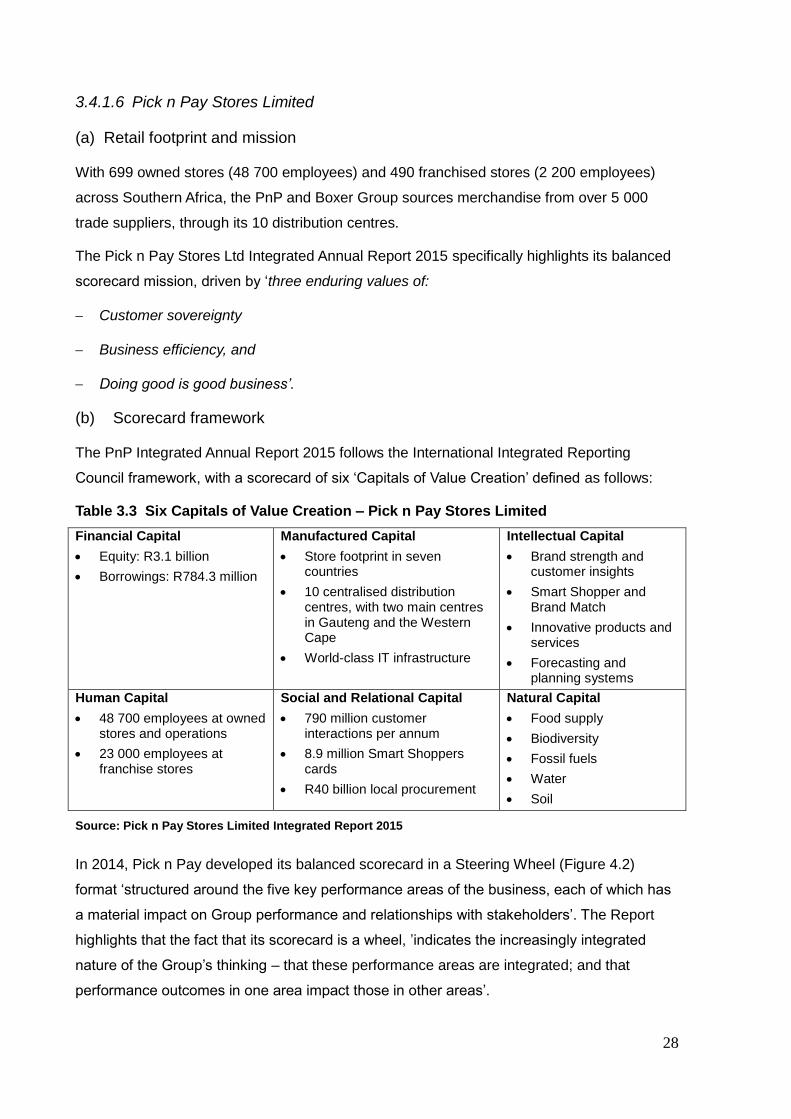
(b) Scorecard framework
The PnP Integrated Annual Report 2015 follows the International Integrated Reporting
Council framework, with a scorecard of six ‘Capitals of Value Creation’ defined as follows:
Table 3.3 Six Capitals of Value Creation – Pick n Pay Stores Limited
Financial Capital
Equity: R3.1 billion
Borrowings: R784.3 million
Manufactured Capital
Store footprint in seven countries
10 centralised distribution centres, with two main centres in Gauteng and the Western Cape
World-class IT infrastructure
Intellectual Capital
Brand strength and customer insights
Smart Shopper and Brand Match
Innovative products and services
Forecasting and planning systems
Human Capital
48 700 employees at owned stores and operations
23 000 employees at franchise stores
Social and Relational Capital
790 million customer interactions per annum
8.9 million Smart Shoppers cards
R40 billion local procurement
Natural Capital
Food supply
Biodiversity
Fossil fuels
Water
Soil
Source: Pick n Pay Stores Limited Integrated Report 2015
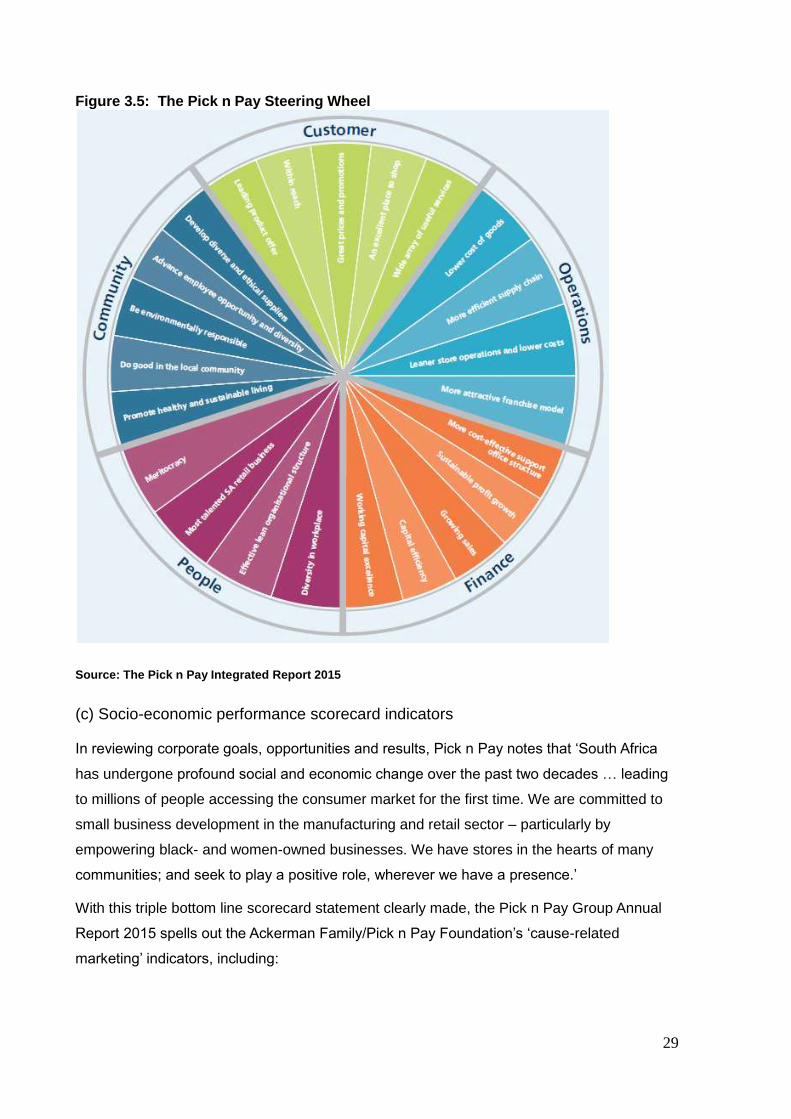
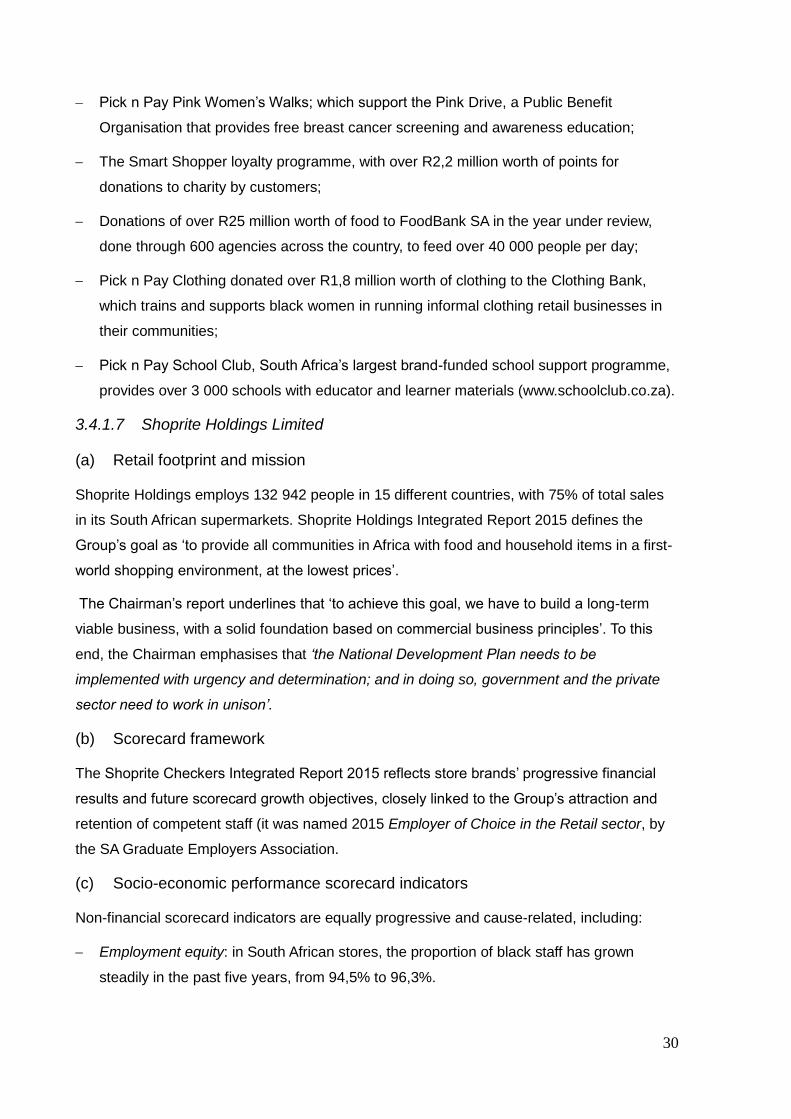
In 2014, Pick n Pay developed its balanced scorecard in a Steering Wheel (Figure 4.2)
format ‘structured around the five key performance areas of the business, each of which has
a material impact on Group performance and relationships with stakeholders’. The Report
highlights that the fact that its scorecard is a wheel, ’indicates the increasingly integrated
nature of the Group’s thinking – that these performance areas are integrated; and that
performance outcomes in one area impact those in other areas’.
29
Figure 3.5: The Pick n Pay Steering Wheel
Source: The Pick n Pay Integrated Report 2015
(c) Socio-economic performance scorecard indicators
In reviewing corporate goals, opportunities and results, Pick n Pay notes that ‘South Africa
has undergone profound social and economic change over the past two decades … leading
to millions of people accessing the consumer market for the first time. We are committed to
small business development in the manufacturing and retail sector – particularly by
empowering black- and women-owned businesses. We have stores in the hearts of many
communities; and seek to play a positive role, wherever we have a presence.’
With this triple bottom line scorecard statement clearly made, the Pick n Pay Group Annual
Report 2015 spells out the Ackerman Family/Pick n Pay Foundation’s ‘cause-related
marketing’ indicators, including:
30
Pick n Pay Pink Women’s Walks; which support the Pink Drive, a Public Benefit
Organisation that provides free breast cancer screening and awareness education;
The Smart Shopper loyalty programme, with over R2,2 million worth of points for
donations to charity by customers;
Donations of over R25 million worth of food to FoodBank SA in the year under review,
done through 600 agencies across the country, to feed over 40 000 people per day;
Pick n Pay Clothing donated over R1,8 million worth of clothing to the Clothing Bank,
which trains and supports black women in running informal clothing retail businesses in
their communities;
Pick n Pay School Club, South Africa’s largest brand-funded school support programme,
provides over 3 000 schools with educator and learner materials (www.schoolclub.co.za).
3.4.1.7 Shoprite Holdings Limited
(a) Retail footprint and mission
Shoprite Holdings employs 132 942 people in 15 different countries, with 75% of total sales
in its South African supermarkets. Shoprite Holdings Integrated Report 2015 defines the
Group’s goal as ‘to provide all communities in Africa with food and household items in a first-
world shopping environment, at the lowest prices’.
The Chairman’s report underlines that ‘to achieve this goal, we have to build a long-term
viable business, with a solid foundation based on commercial business principles’. To this
end, the Chairman emphasises that ‘the National Development Plan needs to be
implemented with urgency and determination; and in doing so, government and the private
sector need to work in unison’.
(b) Scorecard framework
The Shoprite Checkers Integrated Report 2015 reflects store brands’ progressive financial
results and future scorecard growth objectives, closely linked to the Group’s attraction and
retention of competent staff (it was named 2015 Employer of Choice in the Retail sector, by
the SA Graduate Employers Association.
(c) Socio-economic performance scorecard indicators
Non-financial scorecard indicators are equally progressive and cause-related, including:
Employment equity: in South African stores, the proportion of black staff has grown
steadily in the past five years, from 94,5% to 96,3%.
31
Skills Development and study bursaries: using e-learning and bursary facilities, group
supermarket staff training statistics indicate a 45% increase in training hours, over the
previous year.
Environmental impact of the value chain: the Shoprite Group Social and Ethics
Committee has initiated and monitored results relating to climate change, water usage,
food waste, packaging volumes, workplace health and safety. The Report states that the
R334 million fossil fuel savings have been identified in Group operations.
“Decade of the Deaf’ project: as part of the skills and access to employment drive,
Shoprite supports eDeaf, an NGO which empowers potential employees from the deaf
community. To date 40 deaf people have been trained and employed, through this project.
Food donations to hungry communities: Through projects with Foodbank South Africa
and Stop Hunger Now SA, food donations totalling R92,4 million value and over 23
million soup kitchen meals have been served by Shoprite ‘soup trucks’, since inception.
Disaster relief programmes: Over the past few decades Shoprite and Checkers stores
have supported many flood and fire disaster victims, through the company’s Disaster
Relief Response Programme, often in collaboration with the SA Red Cross Society.
3.4.1.8 Spar Group Limited
(a) Retail footprint and mission
The Spar Group in South Africa, based in KwaZulu-Natal, is a warehousing and distribution
business with 350 stores as independent voluntary traders who are franchised to use the
Spar supermarket, Tops liquor, and Build It building materials retail brands. The South African
holding company also owns 80% of the BWG Group, which owns the Spar brand in Ireland
and England, with 1 332 stores. Owing to the various store formats, geographic spread and
diverse independence of branch owners, Spar is unique in that it operates across the entire
Living Standards Measures (LSM) spectrum in South Africa.
The Spar Group’s mission (‘First choice brand in our communities’) and three core values
embody: Passion, Family values and Entrepreneurship.
b) Scorecard framework
The Spar Group Integrated Report 2015 states that its business scorecard and reporting
framework are based on the IIRC ‘six capitals’, as well as the statutory requirements of JSE
members and South African Companies Act. The Spar Integrated Annual Report scorecard
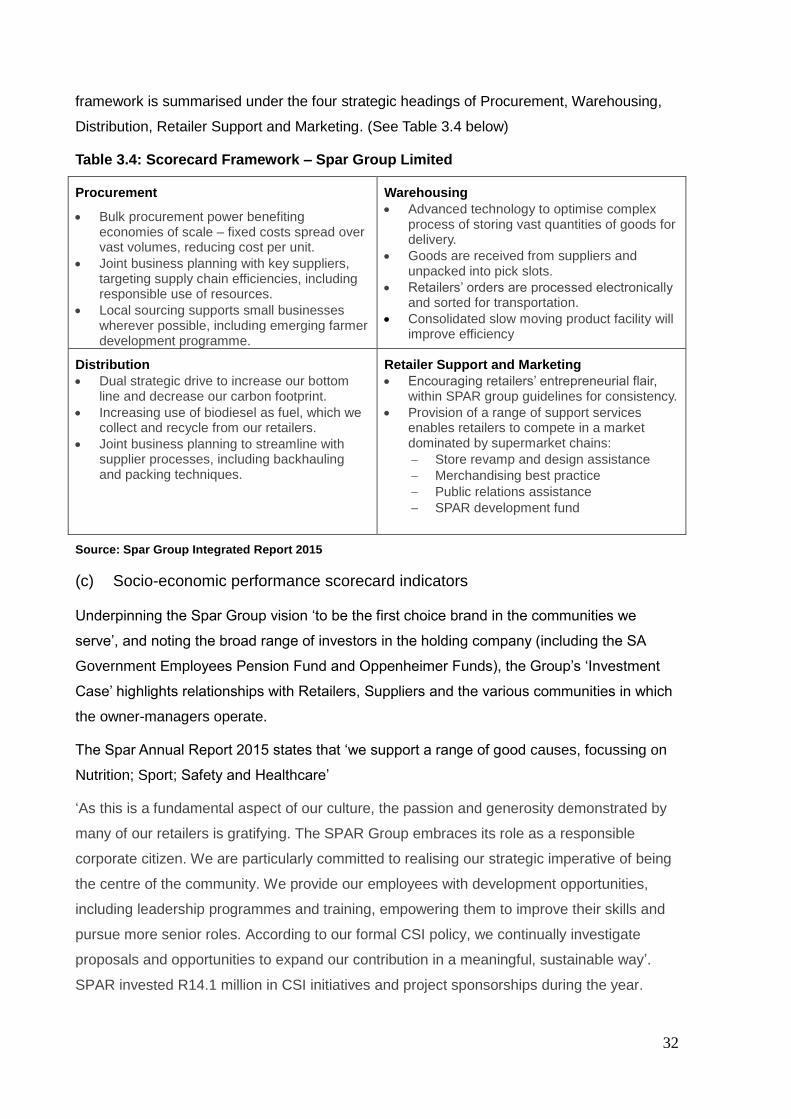
32
framework is summarised under the four strategic headings of Procurement, Warehousing,
Distribution, Retailer Support and Marketing. (See Table 3.4 below)
Table 3.4: Scorecard Framework – Spar Group Limited
Procurement
Bulk procurement power benefiting economies of scale – fixed costs spread over vast volumes, reducing cost per unit.
Joint business planning with key suppliers, targeting supply chain efficiencies, including responsible use of resources.
Local sourcing supports small businesses wherever possible, including emerging farmer development programme.
Warehousing
Advanced technology to optimise complex process of storing vast quantities of goods for delivery.
Goods are received from suppliers and unpacked into pick slots.
Retailers’ orders are processed electronically and sorted for transportation.
Consolidated slow moving product facility will improve efficiency
Distribution
Dual strategic drive to increase our bottom line and decrease our carbon footprint.
Increasing use of biodiesel as fuel, which we collect and recycle from our retailers.
Joint business planning to streamline with supplier processes, including backhauling and packing techniques.
Retailer Support and Marketing
Encouraging retailers’ entrepreneurial flair, within SPAR group guidelines for consistency.
Provision of a range of support services enables retailers to compete in a market dominated by supermarket chains:
Store revamp and design assistance
Merchandising best practice
Public relations assistance
SPAR development fund
Source: Spar Group Integrated Report 2015
(c) Socio-economic performance scorecard indicators
Underpinning the Spar Group vision ‘to be the first choice brand in the communities we
serve’, and noting the broad range of investors in the holding company (including the SA
Government Employees Pension Fund and Oppenheimer Funds), the Group’s ‘Investment
Case’ highlights relationships with Retailers, Suppliers and the various communities in which
the owner-managers operate.
The Spar Annual Report 2015 states that ‘we support a range of good causes, focussing on
Nutrition; Sport; Safety and Healthcare’
‘As this is a fundamental aspect of our culture, the passion and generosity demonstrated by
many of our retailers is gratifying. The SPAR Group embraces its role as a responsible
corporate citizen. We are particularly committed to realising our strategic imperative of being
the centre of the community. We provide our employees with development opportunities,
including leadership programmes and training, empowering them to improve their skills and
pursue more senior roles. According to our formal CSI policy, we continually investigate
proposals and opportunities to expand our contribution in a meaningful, sustainable way’.
SPAR invested R14.1 million in CSI initiatives and project sponsorships during the year.
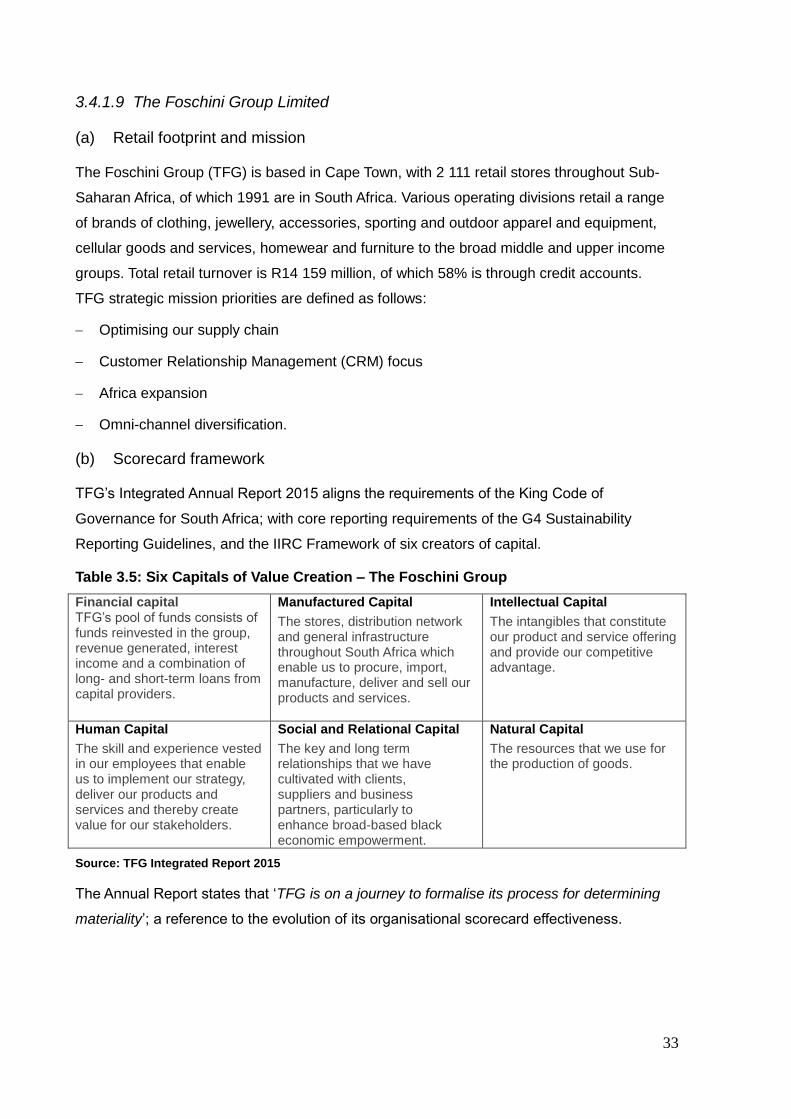
33
3.4.1.9 The Foschini Group Limited
(a) Retail footprint and mission
The Foschini Group (TFG) is based in Cape Town, with 2 111 retail stores throughout Sub-
Saharan Africa, of which 1991 are in South Africa. Various operating divisions retail a range
of brands of clothing, jewellery, accessories, sporting and outdoor apparel and equipment,
cellular goods and services, homewear and furniture to the broad middle and upper income
groups. Total retail turnover is R14 159 million, of which 58% is through credit accounts.
TFG strategic mission priorities are defined as follows:
Optimising our supply chain
Customer Relationship Management (CRM) focus
Africa expansion
Omni-channel diversification.
(b) Scorecard framework
TFG’s Integrated Annual Report 2015 aligns the requirements of the King Code of
Governance for South Africa; with core reporting requirements of the G4 Sustainability
Reporting Guidelines, and the IIRC Framework of six creators of capital.
Table 3.5: Six Capitals of Value Creation – The Foschini Group
Financial capital TFG’s pool of funds consists of funds reinvested in the group, revenue generated, interest income and a combination of long- and short-term loans from capital providers.
Manufactured Capital
The stores, distribution network and general infrastructure throughout South Africa which enable us to procure, import, manufacture, deliver and sell our products and services.
Intellectual Capital
The intangibles that constitute our product and service offering and provide our competitive advantage.
Human Capital
The skill and experience vested in our employees that enable us to implement our strategy, deliver our products and services and thereby create value for our stakeholders.
Social and Relational Capital
The key and long term relationships that we have cultivated with clients, suppliers and business partners, particularly to enhance broad-based black economic empowerment.
Natural Capital
The resources that we use for the production of goods.
Source: TFG Integrated Report 2015
The Annual Report states that ‘TFG is on a journey to formalise its process for determining
materiality’; a reference to the evolution of its organisational scorecard effectiveness.
34
(c) Socio-economic performance scorecard indicators
Within the consolidated review of the TFG’s financial, social, economic and environmental
performance, several Corporate Social Investment projects are highlighted, aligned with
target markets and national developmental priorities. The TFG slogan ‘Doing good never
goes out of fashion’ is strongly promoted.
NGO funding allocations to:
Buhle Farmer’s Academy which enables new and emerging farmers to establish
themselves in viable farming businesses;
Metro-Evangelical Services, which is a platform for job rehabilitation where individuals
are part of a skills development and job placement process; and;
Etafeni, which seeks to restore hope to HIV/AIDS infected women, by empowering them
with skills to earn an income and to make a difference in their communities.
The Feel Good Project; a flagship TFG project dedicated to developing opportunities for
employment and alleviating poverty. The Feel Good Project has two clothing stores (‘The
Feel Good Store’) in Khayelitsha and Claremont where individuals are trained for the
purpose of placement in TFG stores across South Africa.
Bursary Programme: TFG has partnered with Fedisa in a three-year bursary programme
named ‘Your Fashion Future’ which includes fully-paid tuition, accommodation, textbooks,
mentoring support and transport allowance.
3.4.1.10 Truworths International Limited
(a) Retail footprint and mission
The Truworths International retail group operates primarily in South Africa, with 747 stores
that generate 96% of revenue and profit and 2,7 million active credit accounts; as well as in
10 other African countries. The Truworths Integrated Report for the 2015 financial year
indicated that 44 new stores were opened, with 2 franchise stores in Angola; and an
additional 62 Naartjie and Earthchild stores were acquired.
Truworths group strategy is defined as ‘to offer fashion-conscious consumers an extensive
range of styles and innovative products across ladieswear, menswear and kidswear’; and to
‘expand the brand portfolio organically through range extension and acquisition of
established brands’.
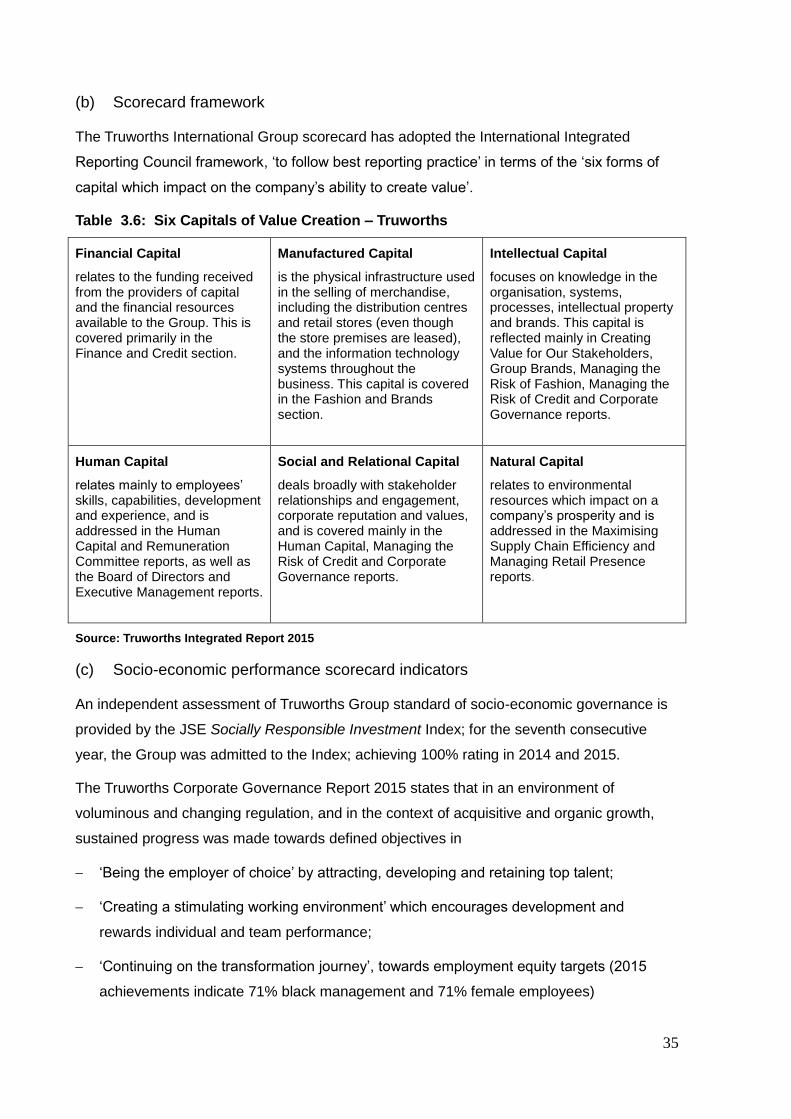
35
(b) Scorecard framework
The Truworths International Group scorecard has adopted the International Integrated
Reporting Council framework, ‘to follow best reporting practice’ in terms of the ‘six forms of
capital which impact on the company’s ability to create value’.
Table 3.6: Six Capitals of Value Creation – Truworths
Financial Capital
relates to the funding received from the providers of capital and the financial resources available to the Group. This is covered primarily in the Finance and Credit section.
Manufactured Capital
is the physical infrastructure used in the selling of merchandise, including the distribution centres and retail stores (even though the store premises are leased), and the information technology systems throughout the business. This capital is covered in the Fashion and Brands section.
Intellectual Capital
focuses on knowledge in the organisation, systems, processes, intellectual property and brands. This capital is reflected mainly in Creating Value for Our Stakeholders, Group Brands, Managing the Risk of Fashion, Managing the Risk of Credit and Corporate Governance reports.
Human Capital
relates mainly to employees’ skills, capabilities, development and experience, and is addressed in the Human Capital and Remuneration Committee reports, as well as the Board of Directors and Executive Management reports.
Social and Relational Capital
deals broadly with stakeholder relationships and engagement, corporate reputation and values, and is covered mainly in the Human Capital, Managing the Risk of Credit and Corporate Governance reports.
Natural Capital
relates to environmental resources which impact on a company’s prosperity and is addressed in the Maximising Supply Chain Efficiency and Managing Retail Presence reports.
Source: Truworths Integrated Report 2015
(c) Socio-economic performance scorecard indicators
An independent assessment of Truworths Group standard of socio-economic governance is
provided by the JSE Socially Responsible Investment Index; for the seventh consecutive
year, the Group was admitted to the Index; achieving 100% rating in 2014 and 2015.
The Truworths Corporate Governance Report 2015 states that in an environment of
voluminous and changing regulation, and in the context of acquisitive and organic growth,
sustained progress was made towards defined objectives in
‘Being the employer of choice’ by attracting, developing and retaining top talent;
‘Creating a stimulating working environment’ which encourages development and
rewards individual and team performance;
‘Continuing on the transformation journey’, towards employment equity targets (2015
achievements indicate 71% black management and 71% female employees)
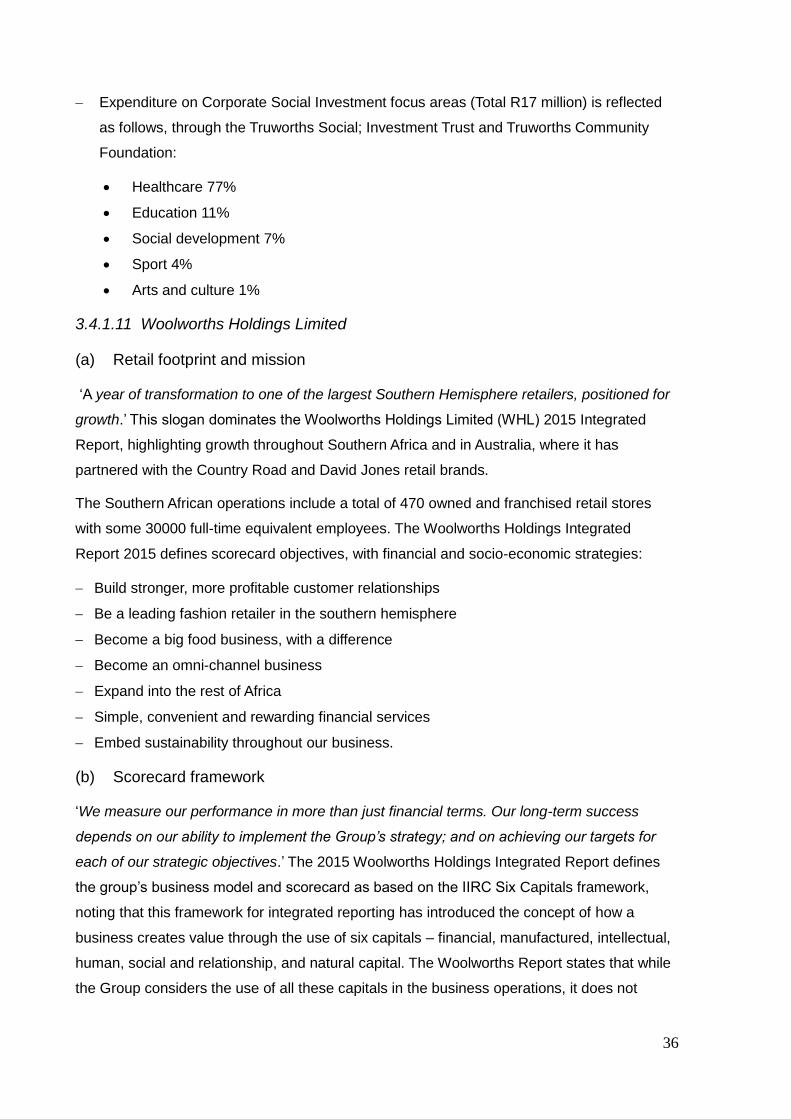
36
Expenditure on Corporate Social Investment focus areas (Total R17 million) is reflected
as follows, through the Truworths Social; Investment Trust and Truworths Community
Foundation:
Healthcare 77%
Education 11%
Social development 7%
Sport 4%
Arts and culture 1%
3.4.1.11 Woolworths Holdings Limited
(a) Retail footprint and mission
‘A year of transformation to one of the largest Southern Hemisphere retailers, positioned for
growth.’ This slogan dominates the Woolworths Holdings Limited (WHL) 2015 Integrated
Report, highlighting growth throughout Southern Africa and in Australia, where it has
partnered with the Country Road and David Jones retail brands.
The Southern African operations include a total of 470 owned and franchised retail stores
with some 30000 full-time equivalent employees. The Woolworths Holdings Integrated
Report 2015 defines scorecard objectives, with financial and socio-economic strategies:
Build stronger, more profitable customer relationships
Be a leading fashion retailer in the southern hemisphere
Become a big food business, with a difference
Become an omni-channel business
Expand into the rest of Africa
Simple, convenient and rewarding financial services
Embed sustainability throughout our business.
(b) Scorecard framework
‘We measure our performance in more than just financial terms. Our long-term success
depends on our ability to implement the Group’s strategy; and on achieving our targets for
each of our strategic objectives.’ The 2015 Woolworths Holdings Integrated Report defines
the group’s business model and scorecard as based on the IIRC Six Capitals framework,
noting that this framework for integrated reporting has introduced the concept of how a
business creates value through the use of six capitals – financial, manufactured, intellectual,
human, social and relationship, and natural capital. The Woolworths Report states that while
the Group considers the use of all these capitals in the business operations, it does not
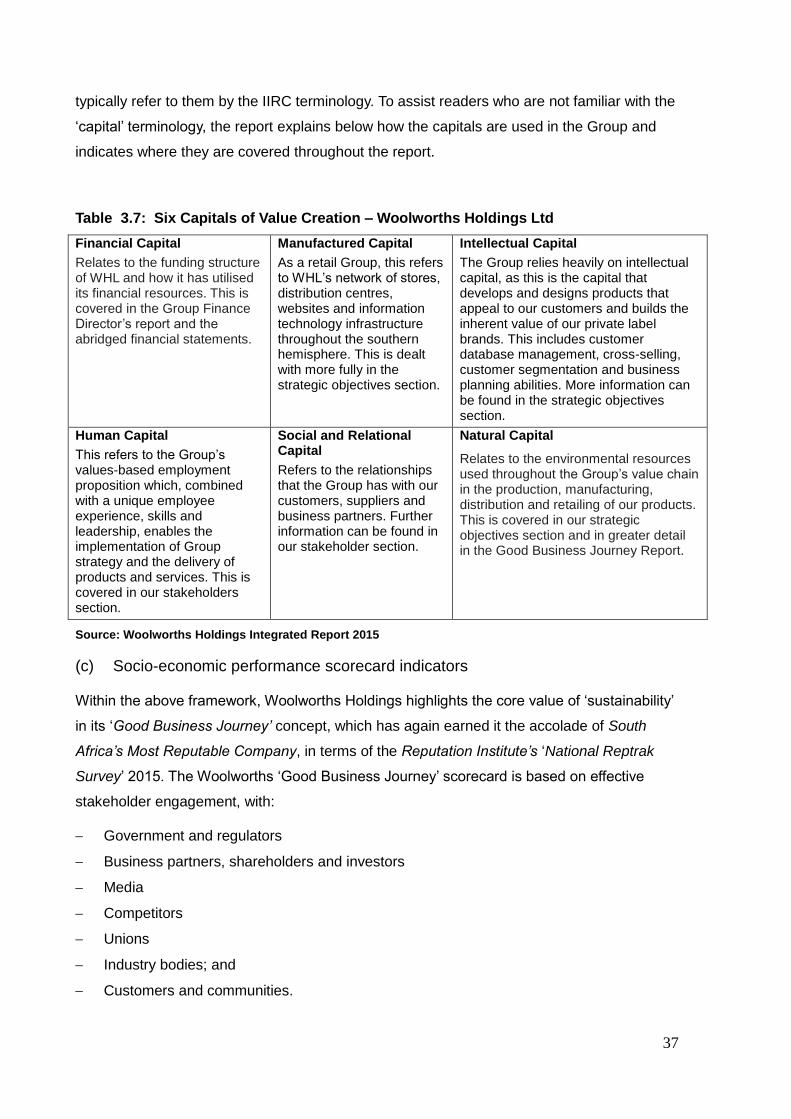
37
typically refer to them by the IIRC terminology. To assist readers who are not familiar with the
‘capital’ terminology, the report explains below how the capitals are used in the Group and
indicates where they are covered throughout the report.
Table 3.7: Six Capitals of Value Creation – Woolworths Holdings Ltd
Financial Capital
Relates to the funding structure of WHL and how it has utilised its financial resources. This is covered in the Group Finance Director’s report and the abridged financial statements.
Manufactured Capital
As a retail Group, this refers to WHL’s network of stores, distribution centres, websites and information technology infrastructure throughout the southern hemisphere. This is dealt with more fully in the strategic objectives section.
Intellectual Capital
The Group relies heavily on intellectual capital, as this is the capital that develops and designs products that appeal to our customers and builds the inherent value of our private label brands. This includes customer database management, cross-selling, customer segmentation and business planning abilities. More information can be found in the strategic objectives section.
Human Capital
This refers to the Group’s values-based employment proposition which, combined with a unique employee experience, skills and leadership, enables the implementation of Group strategy and the delivery of products and services. This is covered in our stakeholders section.
Social and Relational Capital
Refers to the relationships that the Group has with our customers, suppliers and business partners. Further information can be found in our stakeholder section.
Natural Capital
Relates to the environmental resources used throughout the Group’s value chain in the production, manufacturing, distribution and retailing of our products. This is covered in our strategic objectives section and in greater detail in the Good Business Journey Report.
Source: Woolworths Holdings Integrated Report 2015
(c) Socio-economic performance scorecard indicators
Within the above framework, Woolworths Holdings highlights the core value of ‘sustainability’
in its ‘Good Business Journey’ concept, which has again earned it the accolade of South
Africa’s Most Reputable Company, in terms of the Reputation Institute’s ‘National Reptrak
Survey’ 2015. The Woolworths ‘Good Business Journey’ scorecard is based on effective
stakeholder engagement, with:
Government and regulators
Business partners, shareholders and investors
Media
Competitors
Unions
Industry bodies; and
Customers and communities.
38
The 'Customers and Communities’ cause-related marketing is largely promoted through
three million ‘My Village’ and ‘My School’ cardholders, whereby a percentage of every
purchase is donated to a community programme or educational project of the customer’s
choice. The Woolworths 2015 Report indicates that the group aims to increase the number of
cardholders, especially amongst the younger, black LSM 8-10 market, so promoting the
consumer belief that raising money for education and training is ‘sustainably cool’.
3.4.2 What are the key pressures and opportunities for retail businesses to
address socio-economic development strategies, as organisational
performance indicators?
Taylor (2015) explores the organisational and individual complexities of performance
motivation. Apart from transformative regulations related to employment equity levels, skills
development levies and preferential state procurement policies, no South African literature
indicating explicit pressures or motivations was identified.
Opportunities for strengthening retail brand image and reputation or customer loyalty, based
on socio-economic development and cause-related marketing programmes, are reflected, in
an ‘Ubuntu’ (‘Community’) brand recognition research survey of South African consumers
(BrandMapp 2015); which posed the question: ‘What SA brand do you admire the most, for
giving back?’ Figure 3.5 below depicts the ‘reputation outcomes’ of retail and other sector
marketing strategies. Based on the wording size of the brands depicted in the figure,
Woolworths and Pick n Pay are the retail reputation leaders, followed by Shoprite and
Dischem.
Figure 3.6: Ubuntu: Brand Recognition for socio-economic scorecard contributions
Male
Total
Female
Total
16-24
25-34
35-49
50+
Total
Indian
Black
Coloured
White
<R20k
R20k-R50k
R50k-R100k
>R100k
Q13: what SA brand do you admire
the most for giving back?
Women and white
people are
particularly fond of
Woolworths.
Coloured people
and 50+ are the
biggest fans of
Pick and Pay
KFC wins with the
u24s
Source: WhyFive Insights – BrandMapp, 2015
39
3.4.3 Is there evidence of added benefits in the collaborative use of scorecard
perspectives, between retail businesses and state institutions, to promote
socio-economic development?
Few instances were noted in the literature of institutional collaboration in the development or
use of retail business performance scorecards, either between businesses or with state
institutions; other than the required submission of transformative data such as employment
equity and preferential procurement ratios. By contrast, the South African Mining Industry
sector has collaborated in drafting and defining a scorecard for the ‘Broad-based socio-
economic empowerment Charter for the SA Mining Industry’ (Government Gazette 26661,
2004). This sector collaborative scorecard (see Annexure C) was designed to facilitate the
application of the Mining and Minerals Industry Socio-economic Empowerment Charter; and
includes several performance indicators, ranging from Human Resource Development and
Employment Equity, to Beneficiation and Reporting.
Strategic plans and reports of certain business organisations indicate their commitment to
membership information sharing, around socio-economic transformation goals and
achievements, within the defined vision of the National Development Plan and related
legislation. Examples of organisations with retail business membership include:
- The SA Retail Council; whose stated objective is to ‘focus on two particular areas that
affect the retail industry: economic and legislative affairs; and labour relations’.
- The National Business Initiative; which states that its goal ‘in regard to the relationship
with its members and the rationale for membership is to maximise the positive
contribution of business in society by taking advantage of the NBI value proposition,
alongside government and other like-minded institutions, thereby demonstrating
responsible and active citizenry’.
- The Black Management Forum: which includes several individual and corporate retail
members. A recent BMF press release reflected its determination to ‘keep Corporate
South Africa in check’, with the main purpose of influencing socio-economic
transformation in our country, in pursuit of justice, fairness and equity.
3.4.4 Are there significant differences in performance scorecard perspectives,
socio-economic developmental strategies and outcomes, between retail sub-
sectors and company size?
No comparative literature was noted on this question, apart from the inherent differences in
target communities and cause –related marketing objectives, reflected in the corporate
40
annual reports summarised above. Typically, for instance, strategic scorecards of clothing
retailers seek to promote skills development and community reputations in terms of clothing
manufacture, fashionability or quality; and supermarket scorecards highlight agri-business
sustainability and food provision for disadvantaged communities.
Research papers relating to SME retailers, such as the Soweto study of management and
entrepreneurial practices in small businesses (Bureau of Market Research, Unisa 2013),
underscore the survivalist nature of emerging enterprises, whose implicit scorecards seek to
identify with local community needs and aspirations in a similar trajectory; but within limited
resources and scorecard managerial experience.
3.5 LITERATURE REVIEW CONCLUSIONS
Analysis of the international and South African literature review reflects a multi-functional
approach to organisational performance scorecard design, building on the initial integrated
reporting concepts of ‘balanced scorecard’ and ‘triple bottom line’ performance indicators.
While the breadth and depth of scorecard reports vary considerably, all the major retail group
literature that was reviewed reflects their typical scorecards’ need to be recognised by
Investors; for sound financial performance
Communities and regulatory agencies; for social investment and community
development contributions; and
Target customers; for product quality, high value, service standards, cause-related
marketing and community involvement.
The majority of the South African retail corporate reports reviewed indicate their adoption of
the International Integrated Reporting Council (IIRC) ‘Six Capitals’ integrated scorecard
format, namely:
Financial Capital
Manufactured Capital
Intellectual Capital
Human Capital
Social and Relationship Capital; and
Natural Capital.
Several refer to JSE membership accolades and other public image indices, based on their
cause-related marketing programmes.
41
Findings of the Quality of Life Survey: City Benchmarking Report (Gauteng City-Region
Observatory 2013), Position Paper on Employment Equity (SA Board for People Practices
2015) and SA Reconciliation Barometer 2015 (Institute for Justice and Reconciliation 2016)
underscore the need for retailers to:
Address the differing expectations of ethnic and generation groups, across the
country’s socio-economic inequality levels; and to
Demonstrate their commitment to promoting progress towards a more equitable
society.
In the next chapter, empirical findings from semi-structured dialogic interviews with a
purposive sample of retail business sector stakeholders will be summarised, supplementing
the literature review which informs the research questions defined above. Together with the
literature review, the empirical interview insights will facilitate qualitative analysis of the extent
of retail scorecard policies, practices and perceptions relevant to the research questions.
These research questions will also be included in the empirical study which follows, based on
semi-structured dialogic interviews with a purposive range of roleplayers in various retail sub-
sectors and phases of business growth and performance scorecard maturity.
42
CHAPTER 4
FINDINGS:
DIALOGIC INTERVIEW INSIGHTS AND PERCEPTIONS
In order to supplement the retail organisational scorecard data summarised in the literature
review; and to complement the research question findings with qualitative empirical insights,
a purposive sample of retail roleplayers and organisational stakeholders was interviewed,
using the interview guide (Appendix A) as a semi-structured dialogic framework.
4.1 INTERVIEW RESPONSES TO THE RESEARCH QUESTIONS
60 retail business sector stakeholders and roleplayers were interviewed, individually or in
small groups. Appendix B shows the range of people interviewed, categorised by their retail
stakeholder roles and major urban regions.
Key insights, perceptions and data relevant to the research questions are summarised below,
for inclusion in the subsequent analysis and findings.
4.1.1 What is the awareness of literature on the ‘balanced scorecard’ as a
management system for planning and monitoring organisational
performance strategies?
The dialogic interviews indicated that knowledge of relevant literature regarding
organisational performance scorecards varied, according to the management education role,
organisational size and performance measurement culture.
High ‘balanced scorecard’ and ‘triple bottom line scorecard’ awareness and usage was
most evident (70%) amongst retail corporate and franchise owner / management; as well
as most sector consultants, with relevant business management education.
Low ‘balanced scorecard’ awareness was evident amongst most SME owner/managers
(10%); although several recognised the operational value of defining their financial and
community reputation goals, to motivate staff and measure success.
4.1.2 To what extent is a form of ‘balanced scorecard’ management system
used by South African retail organisations in strategising, synergising
and evaluating their financial and socio-economic developmental
practices?
The extent of ‘balanced scorecard’ performance management use by South African retail
organisations varies considerably, as reflected by stakeholder interview responses.
43
Overall, 90% of respondents were aware of ‘performance scorecard targets’ in their
organisations, although dialogic interview elucidation indicated that these were usually
financial ‘bottom line’ targets for the branch, department or the individual manager.
After clarification of the concept of a ‘balanced’ or ‘multi-pronged’ framework of integrated
business scorecard targets, including non-financial community development objectives, the
extent of such scorecard usage was evident as follows; illustrated by typical commentary:
Always: 40% “It is part of our business planning, but top management
does not keep us informed of progress or challenges.”
Sometimes: 50% “Yes, we have financial targets and we must report
empowerment and community projects to boost our
company image.”
Never: 10% “In a small retail business like ours, sales and profit
targets and results are discussed every day.”
4.1.3 What are the key pressures, opportunities or problems for retail
businesses to address socio-economic developmental strategies, as
organisational performance indicators?
In the empirical dialogic interview context, this research question elicited a diverse range of
stakeholder responses and motivations, based largely on their business size, organisational
maturity, product sub-sector and personal perception of the private sector’s role in South
Africa’s socio-economic transformation.
Perceptions of organisational key performance areas for socio-economic development were
typically based on the following criteria:
(a) Pressures
BBBEE
The most frequently mentioned ‘pressure’ was that of Broad-Based Black Employment Equity
(BBBEE) levels, often perceived to be a mandatory requirement for business licensing and
further growth opportunity, subject to Department of Labour assessments and reports.
Regulatory Bureaucracy
Concerns were also expressed about other potential state bureaucracy or further regulatory
requirements, which would restrict business entrepreneurship and autonomy.
44
Staff Transformation
Less formally, but no less perceived as reality, was the requirement to be seen as
transforming staff complements; especially in communities where the emerging black middle
class represents a significant consumer ‘pressure group’.
(b) Opportunities
Marketing strategies
Across the spectrum of retail enterprise size and maturity, most respondents indicated an
ongoing alertness to (and pro-active search for) cost-effective opportunities to align their
product mix, sales and CSI activities with community profiles and developmental projects.
For example, programmes to promote healthy eating (by supermarkets) and moderate
drinking (by liquor retailers) were cited; as were cause-related marketing programmes by
schoolwear and stationery suppliers, and by an optician / eyewear retailer to the ‘OneSight’
eye testing support programme.
(c) Pressures and Problems
Most frequently cited pressures and problems relating to developing and implementing
meaningful socio-economic development strategies in retail business scorecards, were:
time needed to research the national and/or local community needs and resources;
‘copy cat’ competition when less innovative retailers in the same sub-sector ‘steal’
promotional ideas, diffuse the project identity and reduce the community impact of the
initiative (as was mentioned by a disillusioned respondent);
additional costs of promoting such community developmental strategies, especially when
the inputs (such as education or healthcare promotion) are seen to be the accountability
of a ‘capable state’ and not a role for the business sector to undertake.
4.1.4 Is there evidence of benefits in the collaborative use of balanced
scorecard perspectives, between business and state institutions, to
promote socio-economic development?
Empirical analysis of dialogic interview comments regarding the ranking of NDP ‘core
priorities of socio-economic development’; and of answers to the question relating to benefits
which have motivated use of a ‘multi-pronged scorecard’, indicates that:
(a) Inter-departmental and/or inter-branch communication and collaboration is often
enhanced by the shared use of an organisational scorecard. 90% of corporate retail business
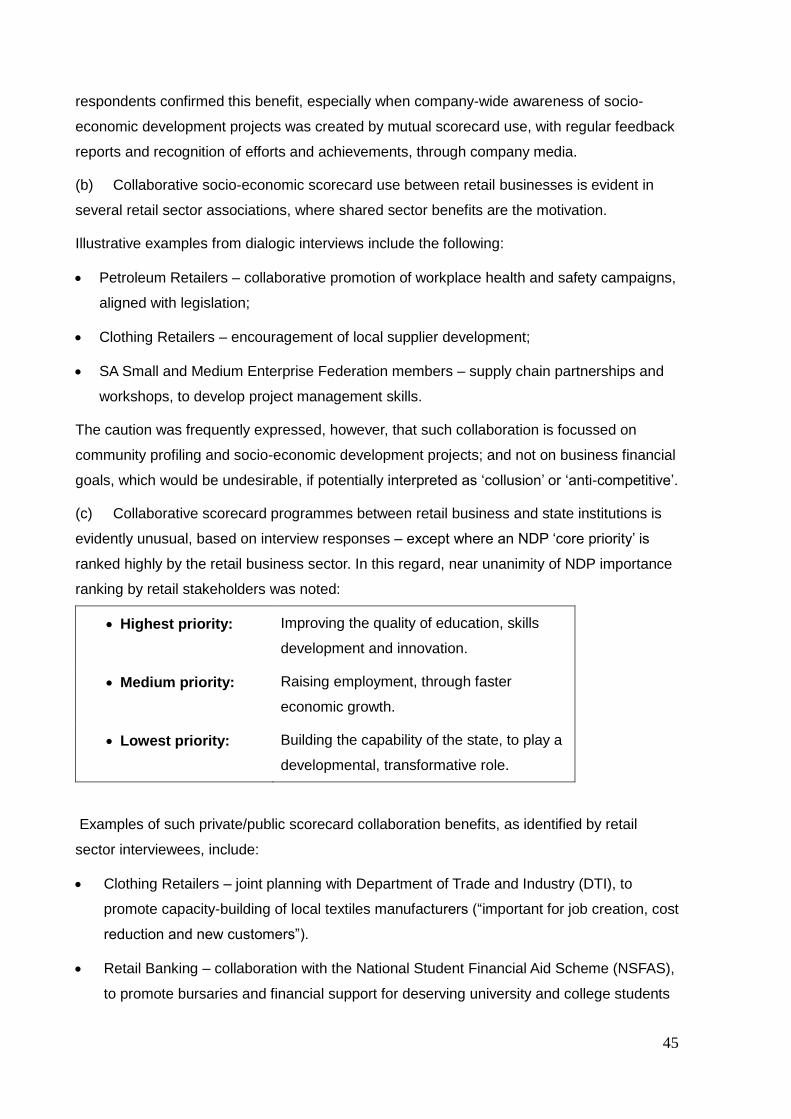
45
respondents confirmed this benefit, especially when company-wide awareness of socio-
economic development projects was created by mutual scorecard use, with regular feedback
reports and recognition of efforts and achievements, through company media.
(b) Collaborative socio-economic scorecard use between retail businesses is evident in
several retail sector associations, where shared sector benefits are the motivation.
Illustrative examples from dialogic interviews include the following:
Petroleum Retailers – collaborative promotion of workplace health and safety campaigns,
aligned with legislation;
Clothing Retailers – encouragement of local supplier development;
SA Small and Medium Enterprise Federation members – supply chain partnerships and
workshops, to develop project management skills.
The caution was frequently expressed, however, that such collaboration is focussed on
community profiling and socio-economic development projects; and not on business financial
goals, which would be undesirable, if potentially interpreted as ‘collusion’ or ‘anti-competitive’.
(c) Collaborative scorecard programmes between retail business and state institutions is
evidently unusual, based on interview responses – except where an NDP ‘core priority’ is
ranked highly by the retail business sector. In this regard, near unanimity of NDP importance
ranking by retail stakeholders was noted:
Highest priority: Improving the quality of education, skills
development and innovation.
Medium priority: Raising employment, through faster
economic growth.
Lowest priority: Building the capability of the state, to play a
developmental, transformative role.
Examples of such private/public scorecard collaboration benefits, as identified by retail
sector interviewees, include:
Clothing Retailers – joint planning with Department of Trade and Industry (DTI), to
promote capacity-building of local textiles manufacturers (“important for job creation, cost
reduction and new customers”).
Retail Banking – collaboration with the National Student Financial Aid Scheme (NSFAS),
to promote bursaries and financial support for deserving university and college students
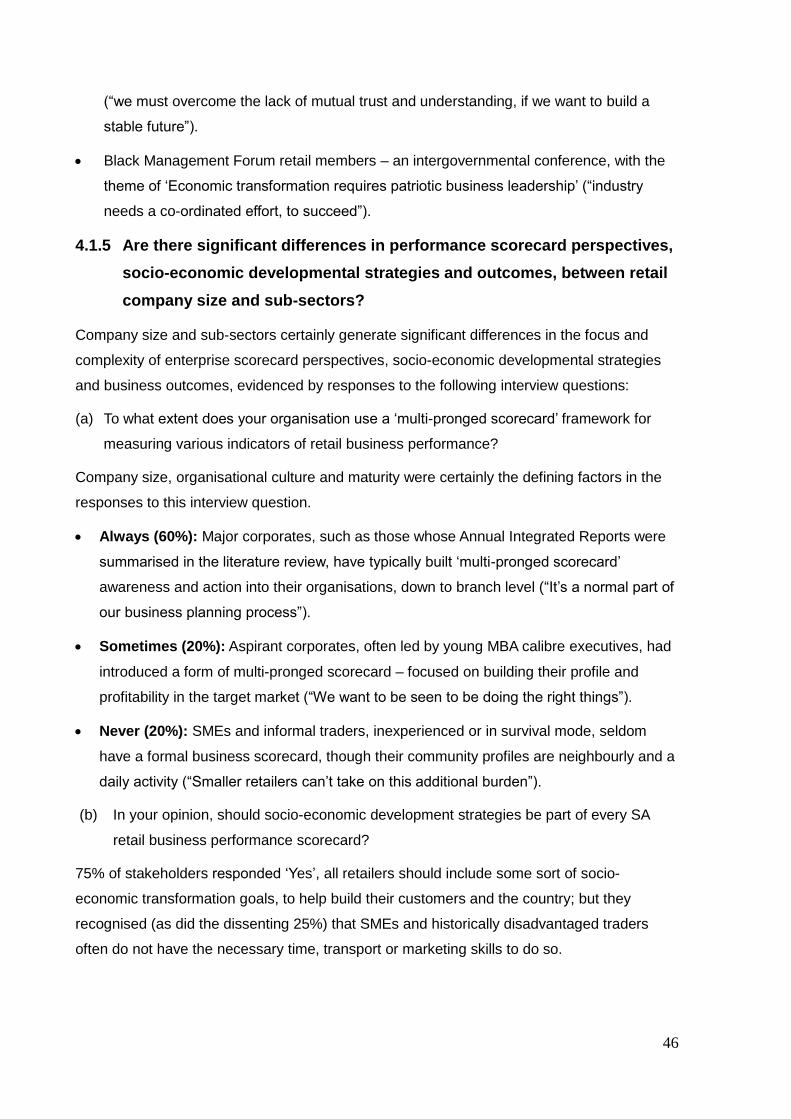
46
(“we must overcome the lack of mutual trust and understanding, if we want to build a
stable future”).
Black Management Forum retail members – an intergovernmental conference, with the
theme of ‘Economic transformation requires patriotic business leadership’ (“industry
needs a co-ordinated effort, to succeed”).
4.1.5 Are there significant differences in performance scorecard perspectives,
socio-economic developmental strategies and outcomes, between retail
company size and sub-sectors?
Company size and sub-sectors certainly generate significant differences in the focus and
complexity of enterprise scorecard perspectives, socio-economic developmental strategies
and business outcomes, evidenced by responses to the following interview questions:
(a) To what extent does your organisation use a ‘multi-pronged scorecard’ framework for
measuring various indicators of retail business performance?
Company size, organisational culture and maturity were certainly the defining factors in the
responses to this interview question.
Always (60%): Major corporates, such as those whose Annual Integrated Reports were
summarised in the literature review, have typically built ‘multi-pronged scorecard’
awareness and action into their organisations, down to branch level (“It’s a normal part of
our business planning process”).
Sometimes (20%): Aspirant corporates, often led by young MBA calibre executives, had
introduced a form of multi-pronged scorecard – focused on building their profile and
profitability in the target market (“We want to be seen to be doing the right things”).
Never (20%): SMEs and informal traders, inexperienced or in survival mode, seldom
have a formal business scorecard, though their community profiles are neighbourly and a
daily activity (“Smaller retailers can’t take on this additional burden”).
(b) In your opinion, should socio-economic development strategies be part of every SA
retail business performance scorecard?
75% of stakeholders responded ‘Yes’, all retailers should include some sort of socio-
economic transformation goals, to help build their customers and the country; but they
recognised (as did the dissenting 25%) that SMEs and historically disadvantaged traders
often do not have the necessary time, transport or marketing skills to do so.
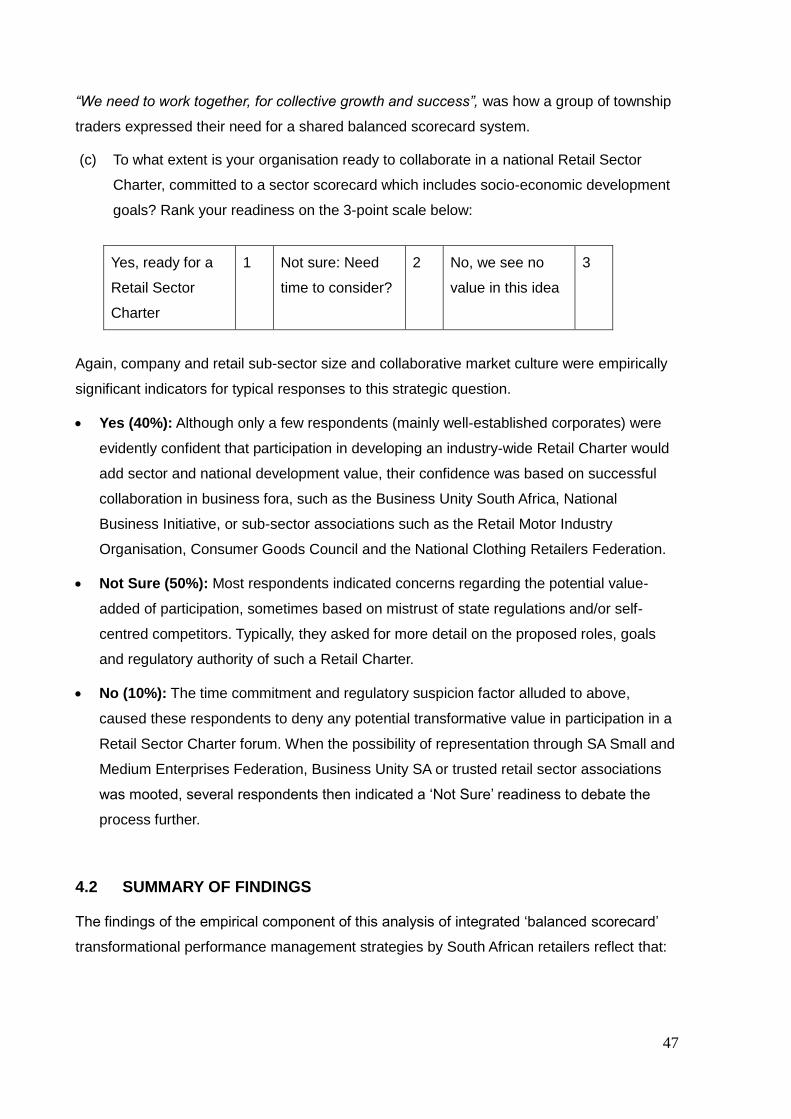
47
“We need to work together, for collective growth and success”, was how a group of township
traders expressed their need for a shared balanced scorecard system.
(c) To what extent is your organisation ready to collaborate in a national Retail Sector
Charter, committed to a sector scorecard which includes socio-economic development
goals? Rank your readiness on the 3-point scale below:
Yes, ready for a
Retail Sector
Charter
1 Not sure: Need
time to consider?
2 No, we see no
value in this idea
3
Again, company and retail sub-sector size and collaborative market culture were empirically
significant indicators for typical responses to this strategic question.
Yes (40%): Although only a few respondents (mainly well-established corporates) were
evidently confident that participation in developing an industry-wide Retail Charter would
add sector and national development value, their confidence was based on successful
collaboration in business fora, such as the Business Unity South Africa, National
Business Initiative, or sub-sector associations such as the Retail Motor Industry
Organisation, Consumer Goods Council and the National Clothing Retailers Federation.
Not Sure (50%): Most respondents indicated concerns regarding the potential value-
added of participation, sometimes based on mistrust of state regulations and/or self-
centred competitors. Typically, they asked for more detail on the proposed roles, goals
and regulatory authority of such a Retail Charter.
No (10%): The time commitment and regulatory suspicion factor alluded to above,
caused these respondents to deny any potential transformative value in participation in a
Retail Sector Charter forum. When the possibility of representation through SA Small and
Medium Enterprises Federation, Business Unity SA or trusted retail sector associations
was mooted, several respondents then indicated a ‘Not Sure’ readiness to debate the
process further.
4.2 SUMMARY OF FINDINGS
The findings of the empirical component of this analysis of integrated ‘balanced scorecard’
transformational performance management strategies by South African retailers reflect that:
48
Most of the larger retail corporates are aware of a balanced scorecard approach as a
performance indicator to measure business success while smaller retail businesses
formally focus on financial performance but did recognise, however, the operational
value of goals to improve reputation in the community.
Financial targets are the dominant indicator and where there are other indicators such
as transformation and community projects, managers don’t always communicate that to
their staff. It is rather done to boost the external image of the business.
The inclusion of other performance indicators is mainly driven by BBBEE and related
transformation pressures.
Most retailers approach community engagement through the alignment of their
marketing strategies with community socio-developmental projects.
The main problem which retailers experience in broadening their scorecard from purely
financial indicators is the time needed for it, the additional cost, as well as the risk of
competitors copying their strategies.
Most collaboration between businesses on social issues is on a sector/industry level;
and business leaders prefer to do it through sector associations, to prevent being
accused of collusion.
There is little evidence of collaboration or knowledge-sharing between businesses and
governmental institutions on socio-economic issues.
In summary, retail businesses are pragmatically aware of the need to be seen to be
contributing to local socio-economic development projects, but with significant variances in
scorecard design, effective implementation and sector collaboration.
In the final chapter, joint conclusions from the literature review and empirical study will be
summarised, within the framework of the five research questions.
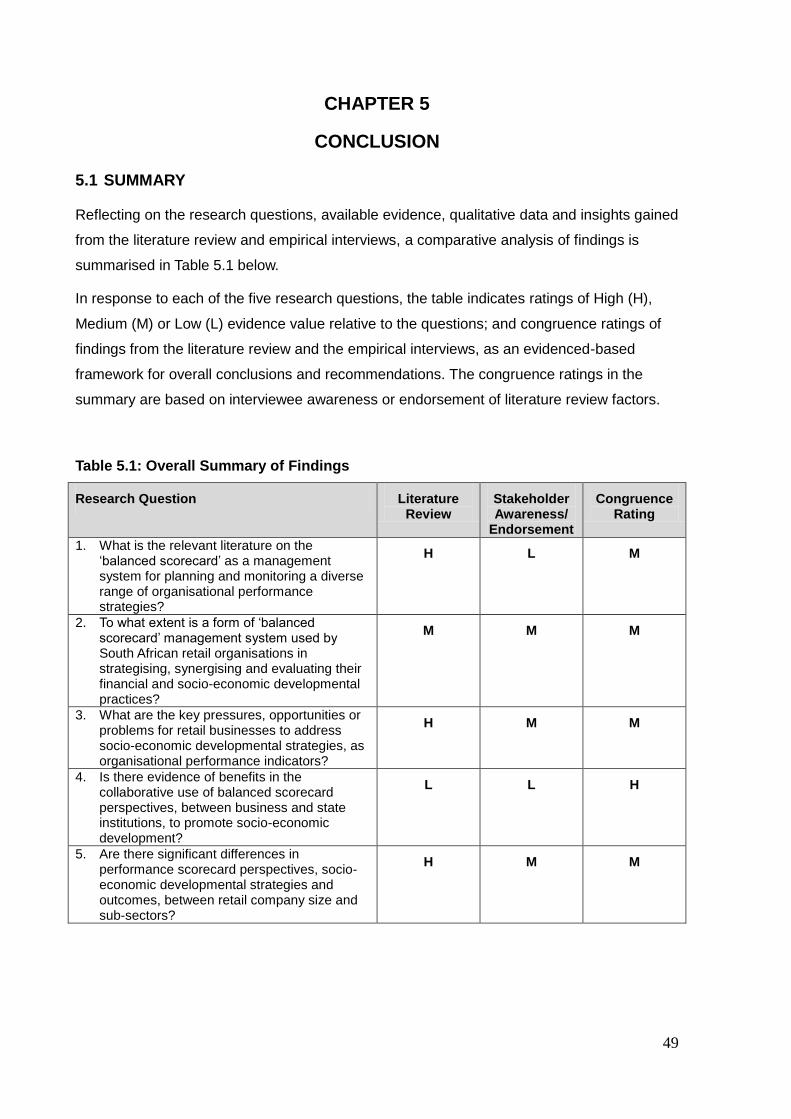
49
CHAPTER 5
CONCLUSION
5.1 SUMMARY
Reflecting on the research questions, available evidence, qualitative data and insights gained
from the literature review and empirical interviews, a comparative analysis of findings is
summarised in Table 5.1 below.
In response to each of the five research questions, the table indicates ratings of High (H),
Medium (M) or Low (L) evidence value relative to the questions; and congruence ratings of
findings from the literature review and the empirical interviews, as an evidenced-based
framework for overall conclusions and recommendations. The congruence ratings in the
summary are based on interviewee awareness or endorsement of literature review factors.
Table 5.1: Overall Summary of Findings
Research Question Literature Review
Stakeholder Awareness/
Endorsement
Congruence Rating
1. What is the relevant literature on the ‘balanced scorecard’ as a management system for planning and monitoring a diverse range of organisational performance strategies?
H L M
2. To what extent is a form of ‘balanced scorecard’ management system used by South African retail organisations in strategising, synergising and evaluating their financial and socio-economic developmental practices?
M M M
3. What are the key pressures, opportunities or problems for retail businesses to address socio-economic developmental strategies, as organisational performance indicators?
H M M
4. Is there evidence of benefits in the collaborative use of balanced scorecard perspectives, between business and state institutions, to promote socio-economic development?
L L H
5. Are there significant differences in performance scorecard perspectives, socio-economic developmental strategies and outcomes, between retail company size and sub-sectors?
H M M
50
Based on the above ratings of congruence between literature review and empirical
stakeholder interview findings with regard to the research questions, it is concluded that:
Relevant literature on the origins and retail applications of ‘balanced scorecard’ and
related performance management systems is widely accessible, internationally and in the
South African retail context.
Forms of ‘balanced scorecard’ management systems are publicly used by retail
corporates, with a clear cause-related marketing approach in integrated annual reports.
Many smaller enterprises, too, use formal or informal scorecards to focus and motivate
staff in planning and monitoring financial targets and community image-building projects.
Significant pressures and opportunities for socio-economic development scorecard
initiatives are typically based on the competitive nature of retailing; when reputations,
community image and customer loyalty are energised by the visibility and frequency of
socio-economic development projects or programmes.
Little evidence is currently available for meaningful benefits of collaborative use of
balanced scorecards, especially in private/public partnerships. Retailers who have
benefitted from collaboration within retail groups or trade associations, seem more open
to exploring business/state ‘active citizenry’ information-sharing and collaboration.
Retail company culture, maturity and management’s motivations (enterprise development
or personal values) are often the basis of performance scorecard perspectives, strategies
and outcomes. Corporate size and maturity typically reflect management competence
and competitive confidence; while SMEs are frequently in ‘start up’ or ‘survival’ mode,
therefore primarily focussed on financial results and sustainability.
5.2 RECOMMENDATIONS
5.2.1 Retail Stakeholder Forum
Given the broad stakeholder recognition of (a) the pragmatic value of a business
performance scorecard, even when informally conceptualised; (b) the wide variances in
conceptualisation and implementation of ‘balanced’ or ‘integrated’ scorecards with socio-
economic developmental indicators; and (c) consequent reservations about readiness to
collaborate in a Retail Sector Charter, it is recommended that a retail stakeholder forum of
organisational representatives should be convened, to consider the potential value of a
‘national retail sector developmental scorecard’, as a framework for further collaborative
developmental research, nationally and regionally.
51
5.2.2 Reality Check: Scorecard substance or Performance Wishlist?
In the processes of empirical dialogic interviews and Focus Group validation of findings,
some stakeholders expressed reservations about the substantive significance of enterprise
scorecard design, use and performance management value in some retail organisations.
They therefore suggested that further pragmatic research and ‘reality checks’ with regard to
actual business value, meaningful performance commitment and sustainability of retail sector
balanced scorecard socio-economic development and resource management, should be
commissioned, nationally and regionally. This could be done through the National Business
Initiative (NBI 2016), which has launched a series of round table scenario discussions with
economists, government officials and political analysts on South Africa’s socio-economic
future.
5.2.3 Retail Charter scorecard indicators for collaborative adoption
It is further recommended that the Wholesale & Retail Leadership Chair provides an
informative input to such a stakeholder forum. Two examples of scorecard indicators for
collaborative adoption could be the Broad-based Socio-Economic Charter for the Mining
Industry (see Appendix E) and the International Integrated Reporting Council ‘six capitals of
value creation’ framework, as already in use by several major South African retailers. As was
described earlier, the IIRC six factor performance scorecard framework consists of:
Financial Capital
Manufactured Capital
Intellectual Capital
Human Capital
Social and Relationship Capital; and
Natural Capital.
5.2.4 Recommendations for further research
In addition to the advocacy actions recommended above, it is also suggested that further
research into the topic area is needed to increase knowledge and understanding of retail’s
role in socio-economic development. The following are suggested:
The importance of including non-financial indicators in retailers’ scorecards.
Socio-economic developmental needs that could be addressed by retailers.
What are retailers doing at the regional and local levels to address the socio-
economic needs of their communities?
52
REFERENCES
Accenture. 2014. The Secret of Seamless Retailing Success.
www.accenture.com/Microsites/retail-research/Pages/consumer-research-
results; accessed 24 April 2014.
Ackerman, R. 2005. The Four Legs of the Table. Cape Town: David Philip.
African Frontiers Forum. 2013. Africa’s Youth and the Unemployment Challenge – The
Impact on Africa’s Economic Outlook. Paper delivered at the African Frontiers
Forum Conference, 15 May 2013, Johannesburg. www.frontieradvisory.com:
accessed 8 January 2014.
Aguinis, H. 2009 Performance Management. Upper Saddle River NJ: Pearson Education.
Aguinis, H and Glavas, A. 2012. What We Know And Don’t Know About Corporate Social
Responsibility: A Review and Research Agenda. Journal of Management, Vol 38,
No 4.
Alhaddi, H. 2015. Triple Bottom Line and Sustainability: A Literature Review. Business and
Management Studies, Vol.1, No.2.
Altman, Miriam. 2015. National Planning Commissioner and Director of the Centre for
Poverty, Employment and Growth at the Human Sciences Research Council. Semi-
structured dialogic interview, telephonic: 9 November 2015.
Battersby, Jane and Peyton, Stephen. 2014. The Geography of Supermarkets in Cape
Town: Supermarket Expansion and Food Access. Urban Forum online: accessed 16
January 2014.
Berman, B. R. and Evans, J. R. 2013. Retail Management: A Strategic Approach, 12th
edition. London: Pearson.
Biggart, B., Burney, L., Flanagan, R. and Harden, J, 2010. Is a Balanced Scorecard Useful
in a Competitive Retail Environment? Management Accounting Quarterly, Vol 12,
No 1.
Bloemer, J., and De Ruyter, K. 1998. On the relationship between store image, store
satisfaction and store loyalty. European Journal of Marketing, Vol 32, Issue 5/6.
Bureau for Economic Research / Ernst & Young 2013. Retail Survey. Johannesburg: Ernst
& Young.
Bureau of Market Research. 2014. Retail Trade Sales Forecast for South Africa, 2014.
Research Report Number 443. Pretoria: BMR, University of South Africa.
Business Monitor International. 2015. South Africa Retail Report 2015.
53
www.bmiresearch.com: accessed 30 December 2015.
Business Unity South Africa. 2014. Annual Review: One Voice of Business. Sandton:
BUSA.
Cape Peninsula University of Technology. 2013. Priority Research Needs of the South
African Wholesale and Retail Sector. Cape Town: CPUT Wholesale and Retail
Leadership Chair.
City of Cape Town. 2015. Economic Development Strategy.www.capetown.gov.za:
accessed 27 November 2015.
Coleman, Neil. 2013. COSATU Presentation on aspects of the National Development Plan
to Food and Allied Workers Union National Executive Committee. 16 May 2013.
www.cosatu.org.za; accessed on 8 December 2015.
Consumer Goods Council of South Africa. 2015. Annual Report. Johannesburg: CGCSA.
Corbishley, K. and Mason, R. 2011. Cause-related marketing and consumer behaviour in
the greater eThekweni area. African Journal of Business Management, Vol 5,
No 17.
Corporate Social Investments Review, Initiatives and Practices. October 2013. Cape
Town: Picasso Headline (Pty) Ltd,.
De Beer, Joe. 2016. Deputy Director-General: Economic Statistics, Statistics South Africa.
Dialogic interview per telephone: 4 February 2016.
De Bruyn, P., and Freathly, P. 2011. Retailing in post-apartheid South Africa: the strategic
positioning of Boardmans. International Journal of Retail and Distribution
Management, Vol 39, Issue 7.
Elkington, J. 1997 Cannibals with Forks: The Triple Bottom Line of 21st Century Business.
Oxford: Capstone Publishing.
Emmel, Nick. 2013. Sampling and Choosing Cases in Qualitative Research – A Realist
Approach. London: SAGE Publications
European Retail Round Table. 2013. Press release, 17 October 2013: European retailers
lead the way towards a sustainable future in a resource-constrained world.
www.eurocommerce.be/media; accessed 8 March 2014.
European Union Retail Forum for Sustainability. 2013. Announcement – 15th Meeting of
the Retail Forum for Sustainability.
www.ec.europa.eu/environment/industry/retail, accessed 14 April 2014.
Falala, Sifiso. 2013. Top Companies Reputation Index: Always there for you: This retail
chain exemplifies how reputations are built, in the corporate world. Article in Mail &
Guardian: 22-27 March 2013: p 36.
Gauteng City-Region Observatory (GCRO). 2012. Quality of Life Survey 2013: City

54
Benchmarking Report. Johannesburg: CCRO.
Gauteng Provincial Treasury. 2012. The Retail Industry on the Rise in South Africa.
Quarterly Bulletin, June 2012. Johannesburg: Provincial Treasury Economic
Analysis Unit.
Graham, S. 2011. Government and business need to work together to create jobs. Wits
Business School Journal, Issue 26, 36-37.
Gumede. W. 2014. ‘Any job might be better than having no employment at all’. Business
Times, 19 January 2014, pg 21.
Hallowell, R. 1996. The relationships of customer satisfaction, customer loyalty and
profitability: an empirical study. International Journal of Service Industry
Management, Vol 7, Issue 4.
Hamann, R and Acutt, N. 2003. How should civil society (and the government) respond to
‘corporate social responsibility’? A critique of business motivations and the potential
for partnerships. Development Southern Africa, Vol 20, Issue 2.
Human Sciences Research Council.2014. City of Johannesburg Economic Overview.
Pretoria: HSRC Economic Performance and Development Research Unit.
Kalpan, R. and Norton, D. 1996. The Balanced Scorecard: Translating Strategy into
Action. Boston: Harvard Business School Press.
Kariem, Ashraf. 2016 Secretariat, National Planning Commission. Semi-structured dialogic
interview, Union Buildings, Pretoria: 4 February 2016.
Kiva Ka Zazela, Dan. 2016. Executive member, South African Informal Traders Alliance.
Semi- structured dialogic interview, Cape Town: 17 January 2016.
KPMG. 2012. A business response to the National Development Plan. Discussion
document for a business stakeholder seminar. Johannesburg: KPMG.
www.kpmg.com/ZA/en/Issues and Insights, accessed 7 February 2016.
Matola, Miller. 2014. Chief Executive: Brand South Africa. NDP is a blueprint for citizens to
rally round proactively. Business Report. 11 July 2014. page 16
Mazwai, Thamsanqa. 2016. Member, National Planning Commission and former chairman
of Wholesale & Retail SETA Board. Semi-structured dialogic interview, per
telephone; 4 February 2016.
Müller, Rasheda. 2016. Executive member of South African Informal Traders Alliance.
Semi-structured dialogic interview in Cape Town: 16 February 2016.
National Business Initiative. 2015. Integrated Annual Report 2014/15. Johannesburg: NBI.
National Business Initiative. 2016. Quick Brief: South Africa’s Socio-Economic Future.
55
Johannesburg: NBI
National Economic Development and Labour Council. 2010. National Retail Sector
Strategy. Prepared for the NEDLAC Trade and Industry Chamber, on behalf of the
Fund for Research into Industrial Development, Growth and Equity. Cape Town:
Silimela Development Services.
National Labour & Economic Development Institute. 2007. The Retail Sector: An Analysis
of its Contribution to Economic Growth, Employment and Poverty Reduction in
South Africa. Commissioned by the Department of Trade and Industry, Economic
Research and Policy Co-ordination Unit. Johannesburg: NALEDI.
National Retail Federation. 2014. The Economic Impact of the U.S. Retail Industry.
Washington, DC: www.retailmeansjobs.com, accessed 16 December 2015.
Patton, Michael Quinn. 2002. Qualitative Research & Evaluation Methods. Thousand
Oaks, CA: Sage Publications.
Pick n Pay Stores Limited and Pick n Pay Holdings Limited. 2015. Integrated Annual
Report.
Pillay, Patricia. 2016. Head: South African Retail Council and Consumer Goods Industry
Affairs divisions of the Consumer Goods Council of South Africa. Semi-structured
dialogic interview, Johannesburg. 4 February 2016.
Porter, M and Kramer, M. 2006. Strategy and Society: The Link between Competitive
Advantage and Corporate Social Responsibility. Harvard Business Review. Dec
2006.
PriceWaterhouseCoopers. 2012. South African Retail and Consumer Products Outlook
2012-2016. Cape Town: PriceWaterhouseCoopers.
Queiroz, A. 2016. Corporate social responsibility: a business case approach. International
Journal of Engineering and Industrial Management, Vol 6.
Republic of South Africa. 2004. Scorecard for the Broad Based Socio-Economic
Empowerment Charter for the South African Mining Industry. Government Gazette
Notice 1639.
Republic of South Africa. 2011a. Diagnostic Report. Pretoria: National Planning
Commission, The Presidency.
Republic of South Africa. 2011b. National Skills Development Strategy lll, 2011/12-
2015/16. Pretoria: Department of Higher Education and Training.
Republic of South Africa. 2012. National Development Plan; Vision 2030. Pretoria:
National Planning Commission, The Presidency.
Republic of South Africa. 2014. Medium-Term Strategic Framework 2014-2019. Pretoria:
Department of Planning, Monitoring and Evaluation, The Presidency.
56
Republic of South Africa. 2015. Handover Report. Pretoria: National Planning
Commission, The Presidency.
Sewell, W., Mason, R. and Venter, P. 2014. Strategic Alignment of the South African Retail
Sector with the National Development Plan. Journal of Governance and Regulation,
Vol 3, Issue 2.
Soderberg, M., Kalagnanam, S., Sheehan, N. and Vaidyanathan, G. 2011. When is a
balanced scorecard a balanced scorecard? International Journal of Productivity and
Performance Management, Vol 60, Issue 67.
Sonnenberg, D. and Hamann, R. 2006. Implications of the JSE Socially Responsible
Index for corporate responsibility in South Africa. Development Southern Africa,
Vol 23, Issue 2.
South African Board for People Practices. 2015. Updated Position Paper on Employment
Equity and Transformation. Johannesburg: SABPP.
Taylor, B. M. 2015. The Hierarchical Model of Motivation: A Lens for viewing the
complexities of motivation. Performance Improvement, Vol 54, No 4.
Thomas, R., Gable, M. and Dickinson, R. 1999. An application of the balanced scorecard
in retailing. The International Review of Retail, Distribution and Consumer
Research, Vol 9, Issue 1.
Trade and Investment KwaZulu-Natal. 2013. Doing Business in KwaZulu-Natal.
Pietermaritzburg: TIKZN.
Turok, B. Ed. 2015. Changing the Colour of Capital: Essays in politics and economics.
Cape Town: David Philip Publishers.
Varadarajan, P. and Menon, A. 1988. Cause-Related Marketing: A Coalignment of
Marketing Strategy and Corporate Philanthropy. Journal of Marketing, Vol 52,
July 1988.
Waddock, S. and Graves, S. 1997. The Corporate Social Performance – Financial
Performance Link. Strategic Management Journal, Vol 18, Issue 4.
Wholesale & Retail Sector Education and Training Authority. 2015. Annual Report
2014/15. Centurion: W&R SETA.
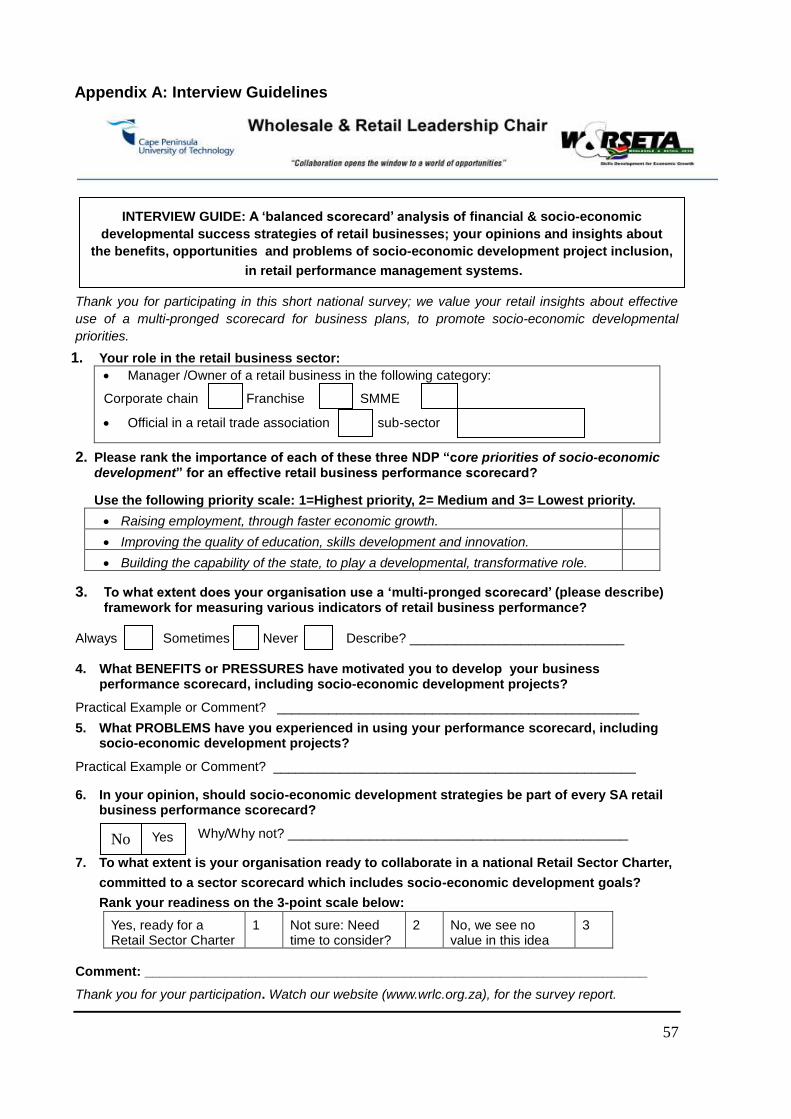
57
Yes No
Appendix A: Interview Guidelines
Thank you for participating in this short national survey; we value your retail insights about effective
use of a multi-pronged scorecard for business plans, to promote socio-economic developmental
priorities.
1. Your role in the retail business sector:
Manager /Owner of a retail business in the following category:
Corporate chain Franchise SMME
Official in a retail trade association sub-sector
2. Please rank the importance of each of these three NDP “core priorities of socio-economic development” for an effective retail business performance scorecard?
Use the following priority scale: 1=Highest priority, 2= Medium and 3= Lowest priority.
Raising employment, through faster economic growth.
Improving the quality of education, skills development and innovation.
Building the capability of the state, to play a developmental, transformative role.
3. To what extent does your organisation use a ‘multi-pronged scorecard’ (please describe) framework for measuring various indicators of retail business performance?
Always Sometimes Never Describe? _____________________________ 4. What BENEFITS or PRESSURES have motivated you to develop your business
performance scorecard, including socio-economic development projects?
Practical Example or Comment? _________________________________________________
5. What PROBLEMS have you experienced in using your performance scorecard, including socio-economic development projects?
Practical Example or Comment? _________________________________________________
6. In your opinion, should socio-economic development strategies be part of every SA retail business performance scorecard?
Why/Why not? ______________________________________________
7. To what extent is your organisation ready to collaborate in a national Retail Sector Charter,
committed to a sector scorecard which includes socio-economic development goals?
Rank your readiness on the 3-point scale below:
Yes, ready for a Retail Sector Charter
1 Not sure: Need time to consider?
2 No, we see no value in this idea
3
Comment: ____________________________________________________________________
Thank you for your participation. Watch our website (www.wrlc.org.za), for the survey report.
INTERVIEW GUIDE: A ‘balanced scorecard’ analysis of financial & socio-economic
developmental success strategies of retail businesses; your opinions and insights about
the benefits, opportunities and problems of socio-economic development project inclusion,
in retail performance management systems.
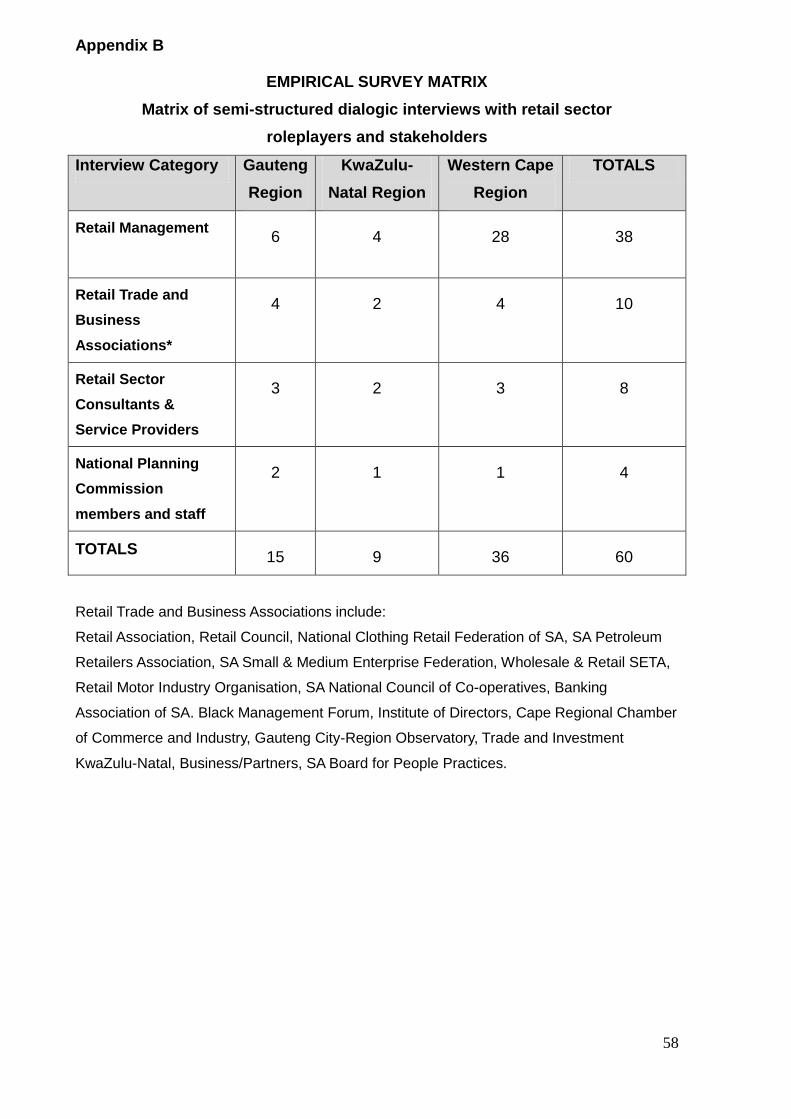
58
Appendix B
EMPIRICAL SURVEY MATRIX
Matrix of semi-structured dialogic interviews with retail sector
roleplayers and stakeholders
Interview Category Gauteng
Region
KwaZulu-
Natal Region
Western Cape
Region
TOTALS
Retail Management
6 4 28 38
Retail Trade and
Business
Associations*
4 2 4 10
Retail Sector
Consultants &
Service Providers
3 2 3 8
National Planning
Commission
members and staff
2 1 1 4
TOTALS 15 9 36 60
Retail Trade and Business Associations include:
Retail Association, Retail Council, National Clothing Retail Federation of SA, SA Petroleum
Retailers Association, SA Small & Medium Enterprise Federation, Wholesale & Retail SETA,
Retail Motor Industry Organisation, SA National Council of Co-operatives, Banking
Association of SA. Black Management Forum, Institute of Directors, Cape Regional Chamber
of Commerce and Industry, Gauteng City-Region Observatory, Trade and Investment
KwaZulu-Natal, Business/Partners, SA Board for People Practices.
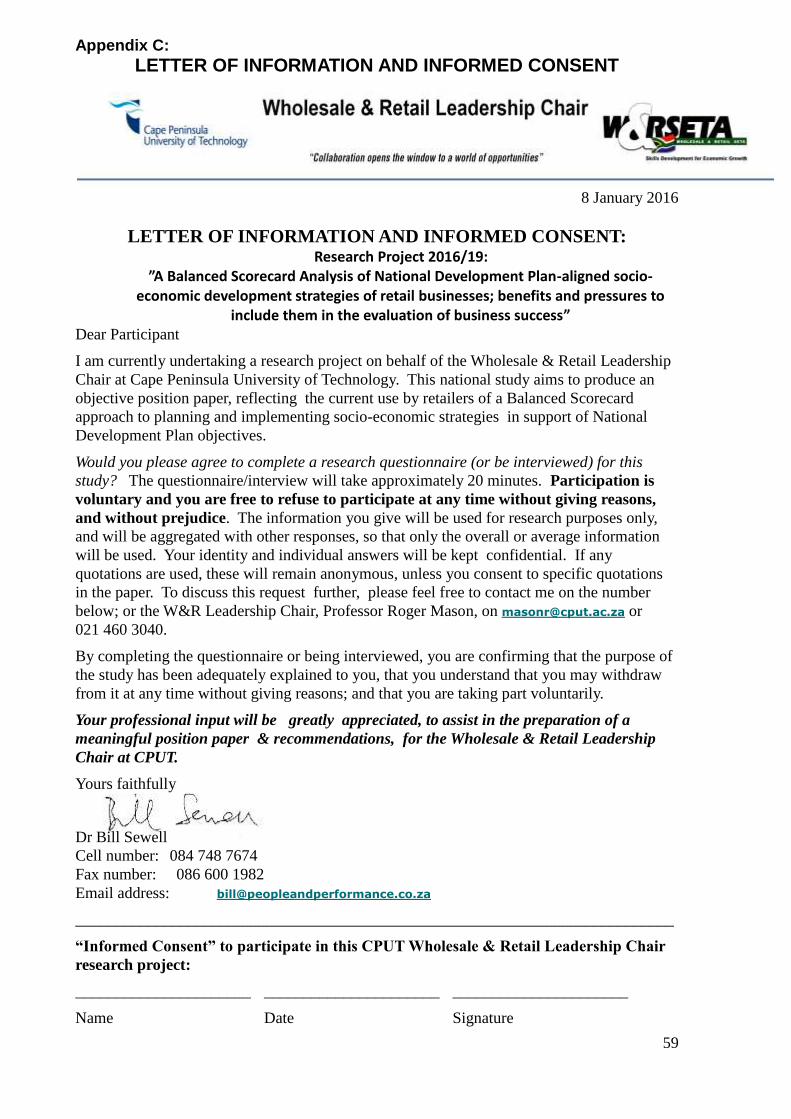
59
Appendix C:
LETTER OF INFORMATION AND INFORMED CONSENT
8 January 2016
LETTER OF INFORMATION AND INFORMED CONSENT: Research Project 2016/19:
”A Balanced Scorecard Analysis of National Development Plan-aligned socio-economic development strategies of retail businesses; benefits and pressures to
include them in the evaluation of business success” Dear Participant
I am currently undertaking a research project on behalf of the Wholesale & Retail Leadership
Chair at Cape Peninsula University of Technology. This national study aims to produce an
objective position paper, reflecting the current use by retailers of a Balanced Scorecard
approach to planning and implementing socio-economic strategies in support of National
Development Plan objectives.
Would you please agree to complete a research questionnaire (or be interviewed) for this
study? The questionnaire/interview will take approximately 20 minutes. Participation is
voluntary and you are free to refuse to participate at any time without giving reasons,
and without prejudice. The information you give will be used for research purposes only,
and will be aggregated with other responses, so that only the overall or average information
will be used. Your identity and individual answers will be kept confidential. If any
quotations are used, these will remain anonymous, unless you consent to specific quotations
in the paper. To discuss this request further, please feel free to contact me on the number
below; or the W&R Leadership Chair, Professor Roger Mason, on [email protected] or
021 460 3040.
By completing the questionnaire or being interviewed, you are confirming that the purpose of
the study has been adequately explained to you, that you understand that you may withdraw
from it at any time without giving reasons; and that you are taking part voluntarily.
Your professional input will be greatly appreciated, to assist in the preparation of a
meaningful position paper & recommendations, for the Wholesale & Retail Leadership
Chair at CPUT.
Yours faithfully
Dr Bill Sewell
Cell number: 084 748 7674
Fax number: 086 600 1982
Email address: [email protected]
___________________________________________________________________________
“Informed Consent” to participate in this CPUT Wholesale & Retail Leadership Chair
research project:
______________________ ______________________ ______________________
Name Date Signature
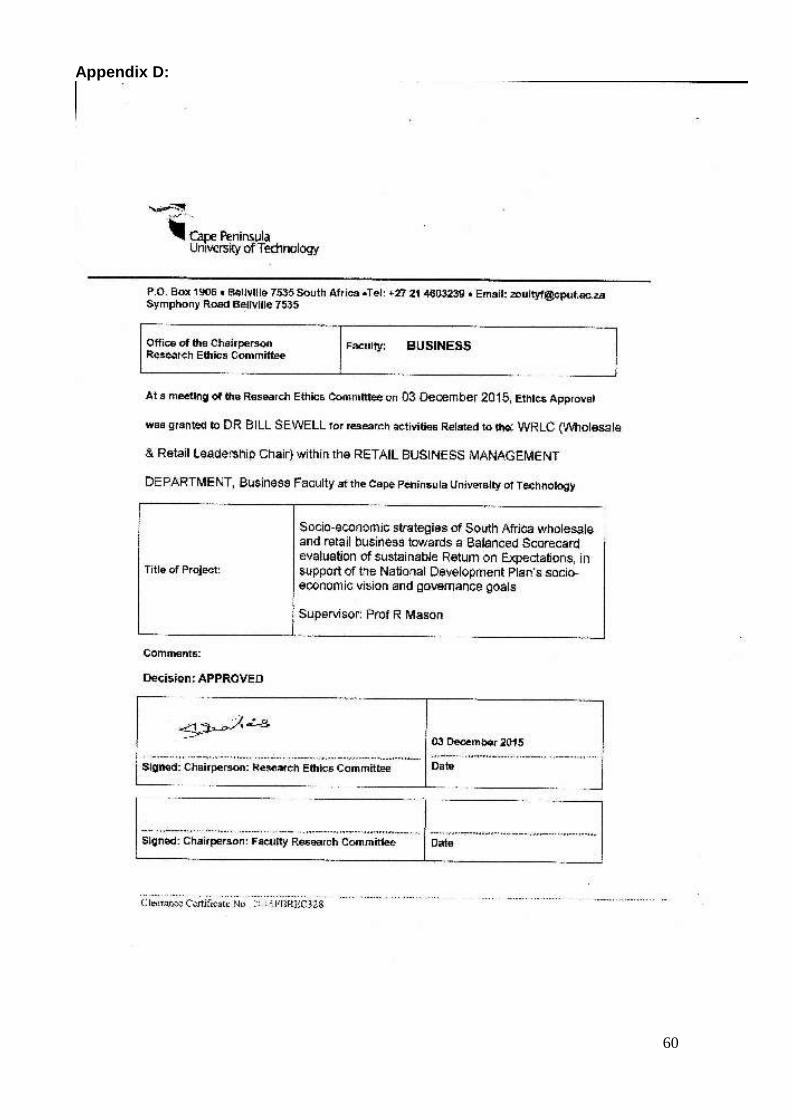
60
Appendix D:
61
Appendix E:
Staatskoerant, 13 Augustus 2004 No. 26661
GENERAL NOTICE
.
Notice 1639 of 2004
SCORECARD FOR THE BROAD BASED SOCIO-ECONOMIC
EMPOWERMENT CHARTER FOR THE SOUTH AFRICAN
MINING INDUSTRY
Introduction
The proposed scorecard gives effect to the provisions contained in the Broad Based
Socio-Economic Empowerment Charter for the Mining and Minerals Industry.
The Scorecard is designed to facilitate the application of the Charter in terms of the
Mineral and Petroleum Resources Development Act requirements for the conversion
of all the “old order rights” into new rights within a five-year conversion window
period, but recognising the full 10-year period.
In adjudicating the scorecard the Minister of Minerals and Energy will need to take
into account the entire scorecard in decision making.
The scorecard is intended to reflect the “spirit” of the Broad-based Socio-Economic
Empowerment Charter for the Mining Industry
Progress by stakeholders in achieving the aims of the Charter as enunciated in the
Scorecard can be measured in two ways:
The specific targets set in the Charter
The targets set by companies
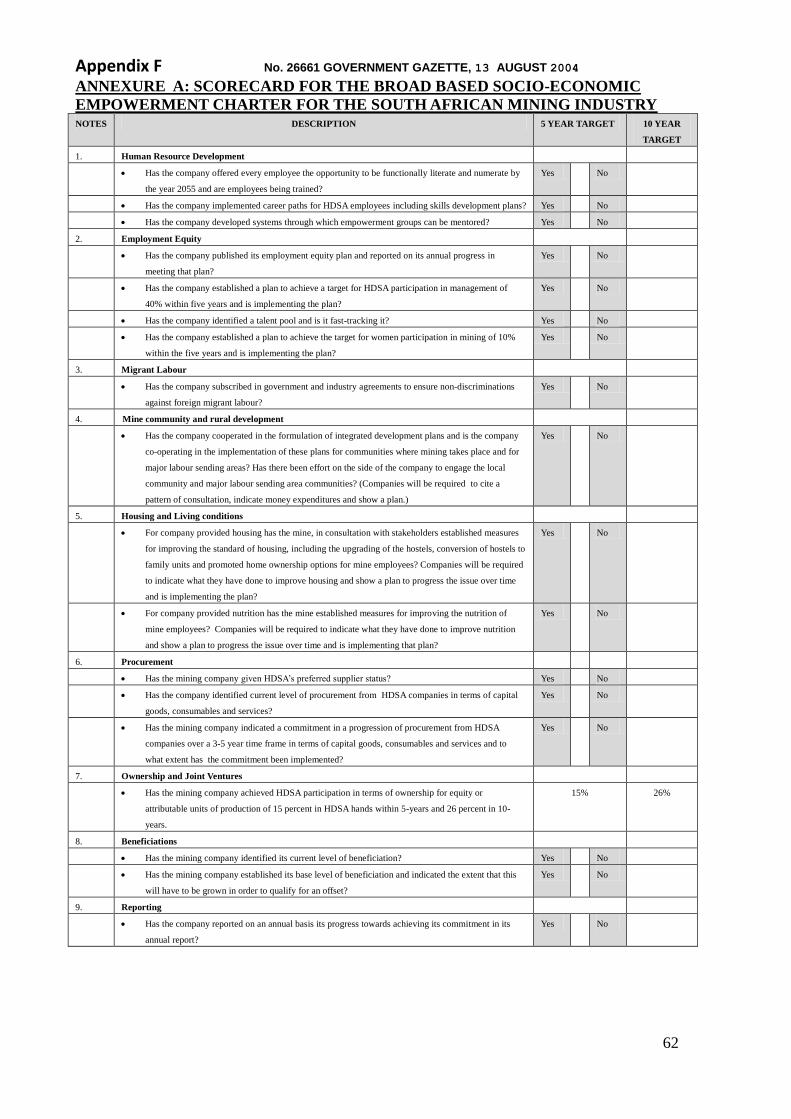
62
Appendix F No. 26661 GOVERNMENT GAZETTE, 13 AUGUST 2004 ANNEXURE A: SCORECARD FOR THE BROAD BASED SOCIO-ECONOMIC
EMPOWERMENT CHARTER FOR THE SOUTH AFRICAN MINING INDUSTRY NOTES DESCRIPTION 5 YEAR TARGET 10 YEAR
TARGET
1. Human Resource Development
Has the company offered every employee the opportunity to be functionally literate and numerate by
the year 2055 and are employees being trained?
Yes No
Has the company implemented career paths for HDSA employees including skills development plans? Yes No
Has the company developed systems through which empowerment groups can be mentored? Yes No
2. Employment Equity
Has the company published its employment equity plan and reported on its annual progress in
meeting that plan?
Yes No
Has the company established a plan to achieve a target for HDSA participation in management of
40% within five years and is implementing the plan?
Yes No
Has the company identified a talent pool and is it fast-tracking it? Yes No
Has the company established a plan to achieve the target for women participation in mining of 10%
within the five years and is implementing the plan?
Yes No
3. Migrant Labour
Has the company subscribed in government and industry agreements to ensure non-discriminations
against foreign migrant labour?
Yes No
4. Mine community and rural development
Has the company cooperated in the formulation of integrated development plans and is the company
co-operating in the implementation of these plans for communities where mining takes place and for
major labour sending areas? Has there been effort on the side of the company to engage the local
community and major labour sending area communities? (Companies will be required to cite a
pattern of consultation, indicate money expenditures and show a plan.)
Yes No
5. Housing and Living conditions
For company provided housing has the mine, in consultation with stakeholders established measures
for improving the standard of housing, including the upgrading of the hostels, conversion of hostels to
family units and promoted home ownership options for mine employees? Companies will be required
to indicate what they have done to improve housing and show a plan to progress the issue over time
and is implementing the plan?
Yes No
For company provided nutrition has the mine established measures for improving the nutrition of
mine employees? Companies will be required to indicate what they have done to improve nutrition
and show a plan to progress the issue over time and is implementing that plan?
Yes No
6. Procurement
Has the mining company given HDSA’s preferred supplier status? Yes No
Has the company identified current level of procurement from HDSA companies in terms of capital
goods, consumables and services?
Yes No
Has the mining company indicated a commitment in a progression of procurement from HDSA
companies over a 3-5 year time frame in terms of capital goods, consumables and services and to
what extent has the commitment been implemented?
Yes No
7. Ownership and Joint Ventures
Has the mining company achieved HDSA participation in terms of ownership for equity or
attributable units of production of 15 percent in HDSA hands within 5-years and 26 percent in 10-
years.
15% 26%
8. Beneficiations
Has the mining company identified its current level of beneficiation? Yes No
Has the mining company established its base level of beneficiation and indicated the extent that this
will have to be grown in order to qualify for an offset?
Yes No
9. Reporting
Has the company reported on an annual basis its progress towards achieving its commitment in its
annual report?
Yes No

63