Embed Size (px)
Citation preview
SUICIDE AND SOCIO-ECONOMIC INDICATORS: WHAT ARE THE MISSING LINKS?
Sandra Tan Chia Chia
Bachelor of Economics with Honours (Industrial Economics)
2012

Pusat Khidmat MakJumat Akademik UNlVERSm MALAYSIA SARAWAK
P,KHIDMAT MAKLUMAT AKADEMIK
11111 1II IIliJm 111111111 1000245044
SUICIDE AND SOCIO-ECONOMIC INDICATORS: WHAT ARE THE
MISSING LINKS?
SANDRA TAN CHIA CHIA
This project is submitted in partial fu.lfillment of the requirements for the degree of Bachelor of Economics with Honours
(Industrial Economics)
,
.' Faculty of Economics and Business UNIVERSITI MALAYSIA SARAW AK
2012
11
Statement of Originality
The work described in this Final Year Project, entitled "SUICIDE AND SOCIO-ECONOMIC INDICATORS: WHAT ARE THE
MISSING LINKS?" is to the best of the author's knowledge that of the author except
where due reference is made.
11J 'J l-\Y\Q, 1011, (Date submitted) s~an Chi. Chi.
24955
-
III
I
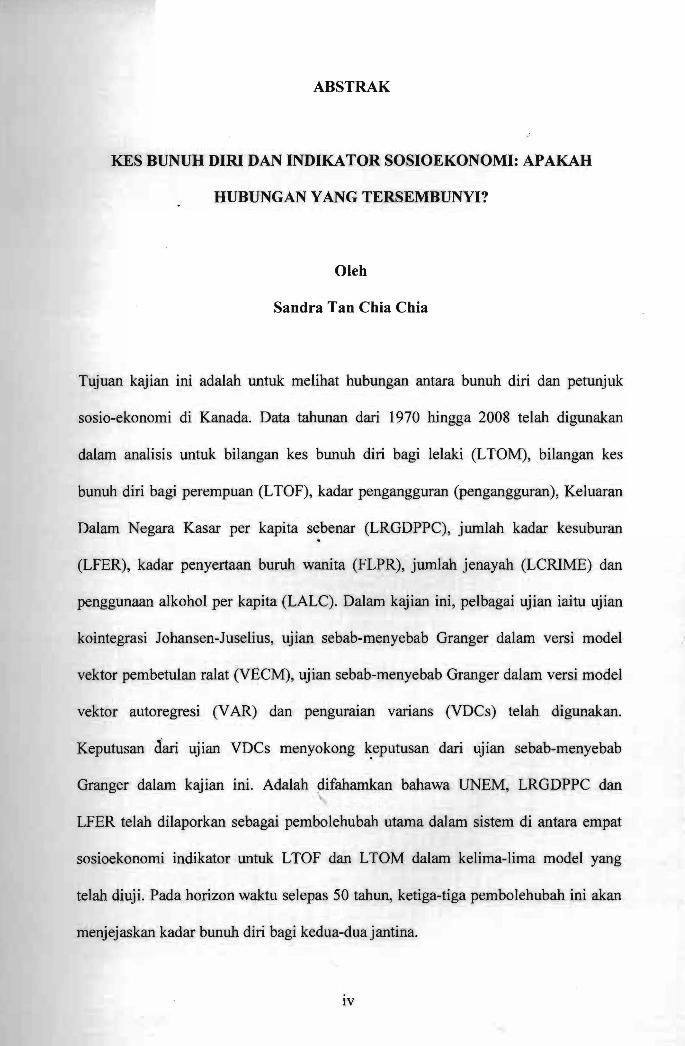
ABSTRAK
KES BUNUH DIRI DAN INDlKA TOR SOSIOEKONOMI: APAKAH
HUBUNGAN YANG TERSEMBUNYI?
Oleh
Sandra Tan Chia Chia
Tujuan kajian ini adalah untuk melihat hubungan antara bunuh diri dan petunjuk
sosio-ekonomi di Kanada. Data tahunan dari 1970 hingga 2008 telah digunakan
dalam analisis untuk bilangan kes bunuh diri bagi lelaki (L TOM), bilangan kes
bunuh diri bagi perempuan (LTOF), kadar pengangguran (pengangguran), Keluaran
Dalam Negara Kasar per kapita sebenar (LRGDPPC), jumlah kadar kesuburan
(LFER), kadar penyertaan buruh wanita (FLPR), jumlah jenayah (LCRlME) dan
penggunaan alkohol per kapita (LALC). Dalam kajian ini, pelbagai ujian iaitu ujian
kointegrasi lohansen-luselius, ujian sebab-menyebab Granger dalam versi model
vektor pembetulan ralat (VECM), ujian sebab-menyebab Granger dalam versi model
vektor autoregresi (V AR) dan penguraian varians (VDCs) telah digunakan.
Keputusan dari ujian VDCs menyokong ~eputusan dari ujian sebab-menyebab
Granger dalam kajian ini. Adalah ~ifahamkan bahawa UNEM, LRGDPPC dan
LFER telah dilaporkan sebagai pembolehubah utama dalam sistem di antara empat
sosioekonomi indikator untuk L TOF dan L TOM dalam kelima-lima model yang
telah diuji. Pada horizon waktu selepas 50 tahun, ketiga-tiga pembolehubah ini akan
menjejaskan kadar bunuh diri bagi kedua-dua jantina.
IV
: ...

ABSTRACT
SUICIDE AND SOCIO-ECONOMIC INDICA TORS: WHAT ARE THE
MISSING LINKS?
By
Sandra Tan Chia Chia
The purpose of this study is to examine the relationship between suicide and socio
economic indicators in Canada. Annual data from 1970 to 2008 was utilized in the
analysis for number of suicides for male (LTOM), number of suicides for female
(LTOF), unemployment rate (UNEM), real gross domestic product per capita
(LRGDPPC), total fertility rate (LFER), female labour participation rate (FLPR),
total numbers of crime (LCRIME) and alcohol consumption per capita (LALC). In
this study, various tests namely lohansen-luselius cointegration test, vector error
correction model (VECM) Ganger causality test, vector autoregressive model (VAR)
Granger causality test and variance decomposition (VDCs) were used. VDCs are
employed after the causality tests in VECM and V AR framework. The results from
VDCs support the causality results in this study. It is noted that UNEM, LRGDPPC
and LFER are found as leading variables in the system among four socio-economic
indicators for L TOF and L TOM in the five models. In 50-year horizon, these three
variables will affect the suicide rates for both genders.
v

ACKNOWLEDGEMENTS
I wish to express my most SIncere gratitude and appreciation to my
supervisor, Dr. Evan Lau Poh Hock for his guidance, patience and encouragement
throughout the development of my Final Year Project. I am grateful to have a
dedicated supervisor, who is generous with his time and knowledge.
I would like to give special thanks to my late father, Tan Chiang Min, who
encouraged me to pursue my studies. I only wish that he had lived to see it comes to
fruition. Apart from that, I would like to extend my gratitude to my family,
especially my beloved mother and grandparents for their continuous support and
encouragement the whole time especially when I confronted hardest time in my life.
I would like to thank my sister, lena Tan ring Ting for giving me ideas for
my project although we are from different faculties. I am also thankful for the
support and help from my uncle, Guy Hee and my aunt, Tan Gek Min.
Lastly, I would like to thank my friends, especially Liew Ann Kee and Chew
.' Lee Ping for their feedback and suggestions without any selfishness on my project. I
truly appreciate support and encouragement from my friends throughout this project.
VI

Pusat Khidmat Maklumat Akademik UNIVERSm MALAYSIA SARAWAK
TABLE OF CONTENTS
Abstract .................. ....................................................................... ii .. Acknowledgement...... ...................................................................... iv
Lists of figures ................................................................................. .ix
Lists of tables ............................................................................ .......x
Chapter 1: Introduction
1.1 Introduction ......................................................... . ....................... 1
1.2 Background of the study. . . . . . . . . . . . . . . . . . . . . . . . . . . . . . . . . . . . . . . . . . . . . . . . . . . . . . . . . . . . . . . . .. 3
1.3 Problem statement of the study ...................... ~ ....................................... 13
1.4 Objective of the study
1.4.1 General objective .................................................................. 16
1.4.2 Specific objectives ............................................................... 16
1.5 Significance of the study ................................................................ 17
1.6 Scope of the study ........................................................................ .18
Chapter 2: Literature Review
2.1 Introduction ............................................................................... 19
2.2 Time-series analysis ......................................................................20
2.3 Cross-section analysis ....................................................................31
2.4 Panel data analysis .......................................................................32
2.5 Time-series and cross-section analysis ................................................ .43
2.6 Cross-section and panel data analysis ................................................ .45
2.7 Concluding remarks ................................. . ....................................46
Chapter 3: Data and Methodology
3.1 Introduction ............................ ..................................................47
Vll

3.2 Model of study ............................................ .. ....... . ................ . .... 48
3.3 Research design
3.3.1 Data description .................................... ... ............................ 52
3.3.2 Data analysis
3.3.2.1 Unit root tests .................... .... ................................ ... .55
3.3.2.2 Johansen and Juselius co integration test .............................57
3.3.2.3 Granger-causality test ....................... ...... ......................59
3.3.2.4 Dynamic analysis ........................................................66
Chapter 4: Empirical Results and Discussion
4.1 Introduction ................................................................................68
4.2 Unit root tests results ..................................................................... 69
4.3 Johansen multivariate test results ................... . ........... ...... ................. 71
4.4 VECM Granger causality test results ..................................................75
4.5 VAR Granger causality test results ....................................................83
4.6 Variance decomposition results ..................................... .. .................85
Chapter 5: Conclusions and Recommendations
5.1 Introduction .............................................................................. 95
5.2 Summary ..................................................................................96
5.3 Policy implications .......................................................................98
5.4 Limitations and recommendations ..... .... .. .. ... .................................... 103
References .................... . ............................................................... 1 04
Vlll

I LIST OF FIGURES
Figure 1.1: Number of suicides by age group for male in Canada, 1970-2008 ........5
Figure 1.2: Number of suicides by age group for female in Canada, 1970-2008 ......6
Figure 1.3: Total number of suicides by sex in Canada, 1970-2008 .....................7
Figure 1.4: Unemployment rate in Canada, 1970-2008 ...................................8
Figure 1.5: Real gross domestic product per capita in Canada, 1970-2008 ............9
Figure 1.6: Total fertility rate in Canada, 1970-2008 .................................... 10
Figure 1.7: Female labour participation rate in Canada, 1970-2008 ................... 10
Figure 1.8: Alcohol consumption litres per capita (15+) in Canada, 1970-2008 ..... 11
Figure 1.9: Number of crimes in Canada, 1970-2008 .................................... 12
Figure 4.1: Short run and long run causality direction for Modell .....................79
Figure 4.2: Short run and long run causality direction for Model 2 ....................82
Figure 4.3: Short run causality direction for Model 3 .....................................84
IX
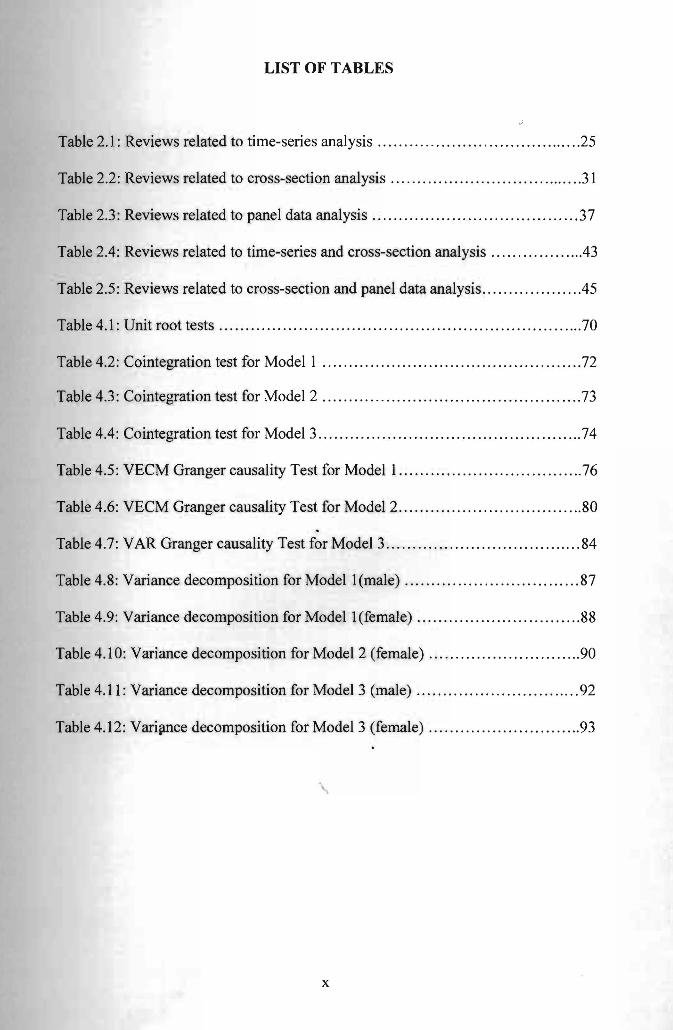
LIST OF TABLES
,j
Table 2.1: Reviews related to time-series analysis ...................................... .25
Table 2.2: Reviews related to cross-section analysis .....................................31
Table 2.3: Reviews related to panel data analysis ......... .. ............................ 37
Table 2.4: Reviews related to time-series and cross-section anaiysis .............. ... .43
Table 2.5: Reviews related to cross-section and panel data analysis .................. .45
Table 4.1: Unit root tests .....................................................................70
Table 4.2: Cointegration test for Modell .................................................72
Table 4.3: Co integration test for Model 2 ........................................ . ........73
Table 4.4: Cointegration test for Model 3 .......... ........................................74
Table 4.5: VECM Granger causality Test for Modell ...................................76
Table 4.6: VECM Granger causality Test for Model 2 ...................................80
Table 4.7: VAR Granger causality Test for Model 3 . ................................... .84
Table 4.8: Variance decomposition for Model l(male) ......... . ....................... 87
Table 4.9: Variance decomposition for Model l(female) ....................... . .......88
Table 4.10: Variance decomposition for Model 2 (female) .............................90
Table 4.11: Variance decomposition for Model 3 (male) ............................... 92
Table 4.12: Vari~ce decomposition for Model 3 (female) .............................93
x

CHAPTERl
INTRODUCTION
1.1 Introduction
Since the views from the Father of Sociology, Durkheim (1897) on the
determinants of suicide by focusing on the problem specifically in social structure in
his seminar work namely Le suicide, most of the sociologists have been inspired to
do research on suicidal issues. The nexus between suicide and unemployment has
been prehistoric issues in social science literature. Most of the earlier studies on,
which are on suicide, have been conducted from sociological and psychological
perspectives, but it is still scarce from economic perspectives (Althinanahtar and
Halicioglu, 2009). In sociological perceptive, specifically in one of the studies done
by Durkheim (1897), suggested that ~n individual has higher self-determination
when income level is higher and eventually could lead to a higher suicide rate. He
pointed out that level of income is less significant as a determinant for suicide
compared to changes in income level.
On the other hand, Hamermesh and Soss (1974), the founder of the economic
model of suicid"e pointed out that an individual ~ith higher future expected income
has higher expectation towards his or . her expected utility. It is relatively more
desirable for an individual to continue living than to commit suicide when he or she
has higher future expected income. According to the permanent income hypothesis
by Hamermesh and Soss (1974), when an individual discounted expected lifetime
utility falls below a certain threshold, he or she will decide to commit suicide.
1
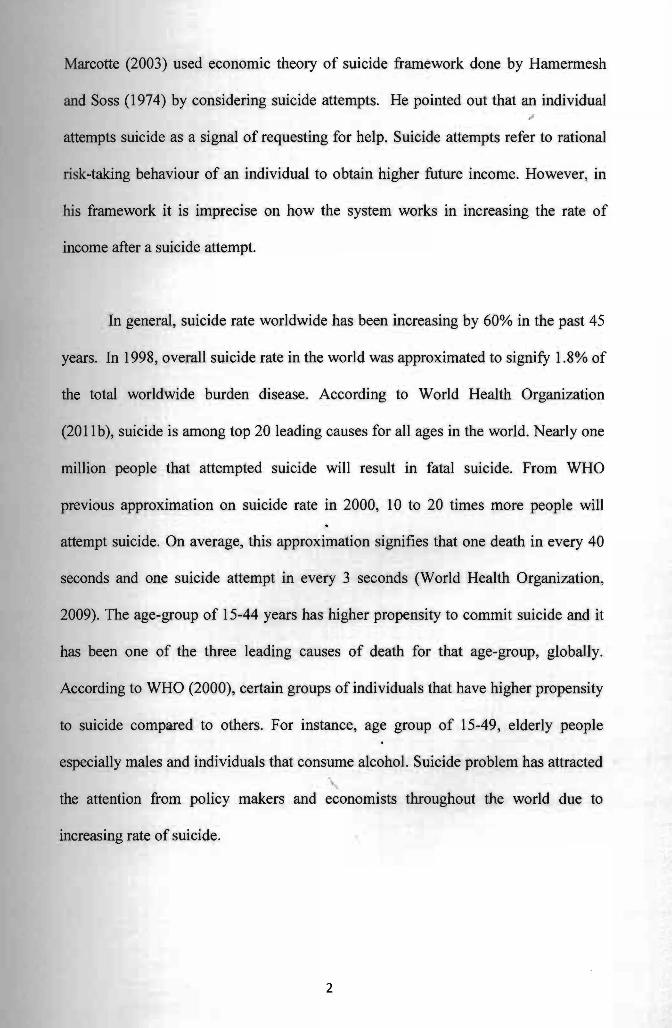
Marcotte (2003) used economic theory of suicide framework done by Hamermesh
and Soss (1974) by considering suicide attempts. He pointed out that an individual
attempts suicide as a signal of requesting for help. Suicide attempts refer to rational
risk-taking behaviour of an individual to obtain higher future income. However, in
his framework it is imprecise on how the system works in increasing the rate of
income after a suicide attempt.
In general, suicide rate worldwide has been increasing by 60% in the past 45
years. In 1998, overall suicide rate in the world was approximated to signifY 1.8% of
the total worldwide burden disease. According to World Health Organization
(2011b), suicide is among top 20 leading causes for all ages in the world. Nearly one
million people that attempted suicide will result in fatal suicide. From WHO
previous approximation on suicide rate in 2000, 10 to 20 times more people will
attempt suicide. On average, this approximation signifies that one death in every 40
seconds and one suicide attempt in every 3 seconds (World Health Organization,
2009). The age-group of 15-44 years has higher propensity to commit suicide and it
has been one of the three leading causes of death for that age-group, globally.
According to WHO (2000), certain groups of individuals that have higher propensity
to suicide compared to others. For instance, age group of 15-49, elderly people
especially males and individuals that consume alcohol. Suicide problem has attracted
the attention from policy makers and economists throughout the world due to
increasing rate of suicide.
2

1.2 Background of the Study
Based on the information provided by WHO, Canada's suicide rate for the
entire population was ranked in the middle of 22 industrialized industries. Suicide is
among the major problem in health status among the Canadians in all ages especially
adolescent to middle age population. It has been one of the major leading causes of
deaths after motorcycle accidents among the young population. In general, the total
number of suicides for both males and females has been increasing over the study
period, which is from 1970 to 2008.
The Health and Welfare Canada has appointed a National Task on Suicide in
1979 to investigate the problem of suicide among Canadian and first report was
published in 1987. Regarding that issue, Health Canada (2002) pointed out that the
existing data did not show the overall profile on suicidal behaviour among the
Canadians. They proposed that an additional data is required to complement the
available hospitalization and mortality data as to fully observe the suicidal
behaviour. Further study on relationship between suicidal behaviour and key
variables like socio-economic factors is proposed by Health Canada (2002) in order
to have an ove~iew of suicide profile among the Canadian. For instance, the
surveillance on contributing factors like socio-economic is essential for government
of Canada to identify which factors contribute more to suicidal behaviour among the
Canadians.
3
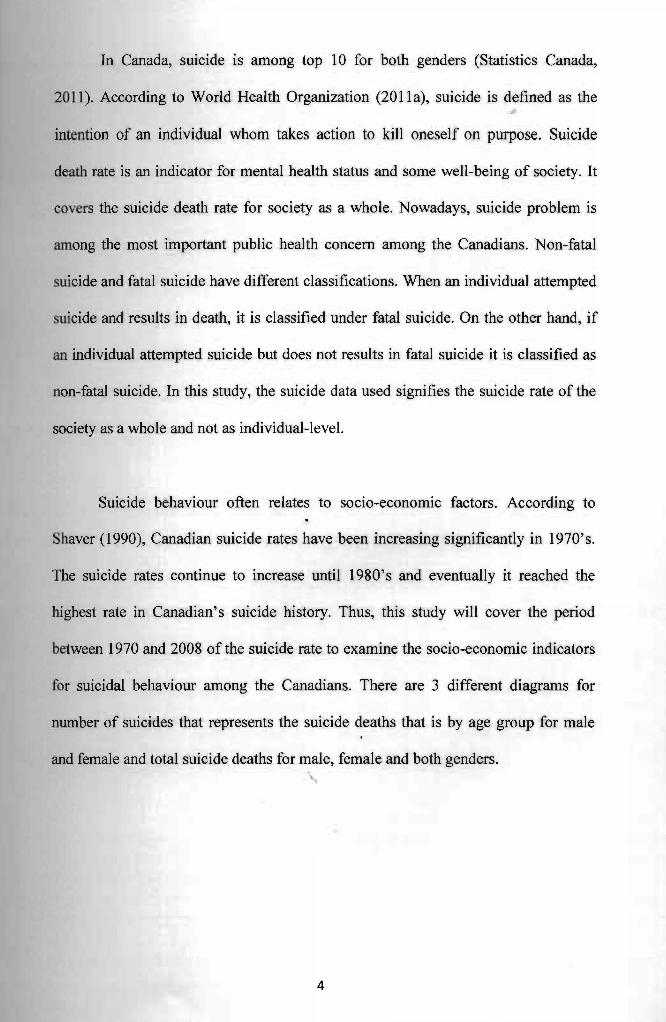
In Canada, suicide is among top 10 for both genders (Statistics Canada,
2011). According to World Health Organization (201 I a), suicide is defined as the
intention of an individual whom takes action to kill oneself on purpose. Suicide
death rate is an indicator for mental health status and some well-being of society. It
covers the suicide death rate for society as a whole. Nowadays, suicide problem is
among the most important public health concern among the Canadians. Non-fatal
suicide and fatal suicide have different classifications. When an individual attempted
suicide and results in death, it is classified under fatal suicide. On the other hand, if
an individual attempted suicide but does not results in fatal suicide it is classified as
non-fatal suicide. In this study, the suicide data used signifies the suicide rate of the
society as a whole and not as individual-level.
Suicide behaviour often relates to socio-economic factors. According to
Shaver (1990), Canadian suicide rates have been increasing significantly in 1970's.
The suicide rates continue to increase until 1980's and eventually it reached the
highest rate in Canadian's suicide history. Thus, this study will cover the period
between 1970 and 2008 of the suicide rate to examine the socio-economic indicators
for suicidal behaviour among the Canadians. There are 3 different diagrams for
number of suicides that represents the suicide deaths that is by age group for male
and female and total suicide deaths for male, female and both genders.
4

Pusat Kbidmat MakJumat Akademik UNlVERSm MALAYSIA SARAWAK
Figure 1.1: Number of suicides by age group for male in Canada, 1970-2008
1600
.!! III 1400 E .e Co
1200 :::l e C) 1000 Q) C) -15-24III
--....-·25-44~ 800 II) - ....-·45-64Q)
"0·13 600 -+- 65 and above ·s rJ)
'0 400 ~ .......JI.~......~~ ....~,.....D E .......~~,~-..(':::l 200 Z
o+,-.,........,.,..-r--rT"TTT"""I""'r-TO-r-r......-r"....,,.....,............-......-r..,..,,.....,...........,....-r-l Year 70 75 80 85 90 95 00 05
Source: Statistics Canada, Causes of Deaths [E950-E959].
Figure 1.1 illustrates the number of suicides by age group for male during the
study period. From Figure 1, it illustrates that age group of 25-44 has the highest
number of suicides followed by age gro!1P of 45-64, 15-24 and 65 and above in
Canada during the study period. In 1995, age group of 25-44 has the highest number
of suicides which is 1,486 people while the second highest number of suicide is
1,445 people which is also among age group of 25-44. However, after 1996, the
number of suicide for that age group is decreasing until the year 2008 .
•. On average, the trend illustrates that the nlUllber of suicides for age group of
45-64 have been increasing over the study.period. In 1990, the number of suicides is
for group aged 45-64 has increased rapidly increasing until 2008. As for age group
of 15-24, the total numbers of suicides have been rising from 1970 to 1979 and
started to decrease from 1983 to the recent year which is 2008. For elderly group,
which is age group of 65 and above has the lowest number of suicides compared to
5
I other age groups. However, it had increased over the study period, on average.
Overall, the number of suicides for male has been increasing for group aged 25-44,
45-64 and 65 and above.
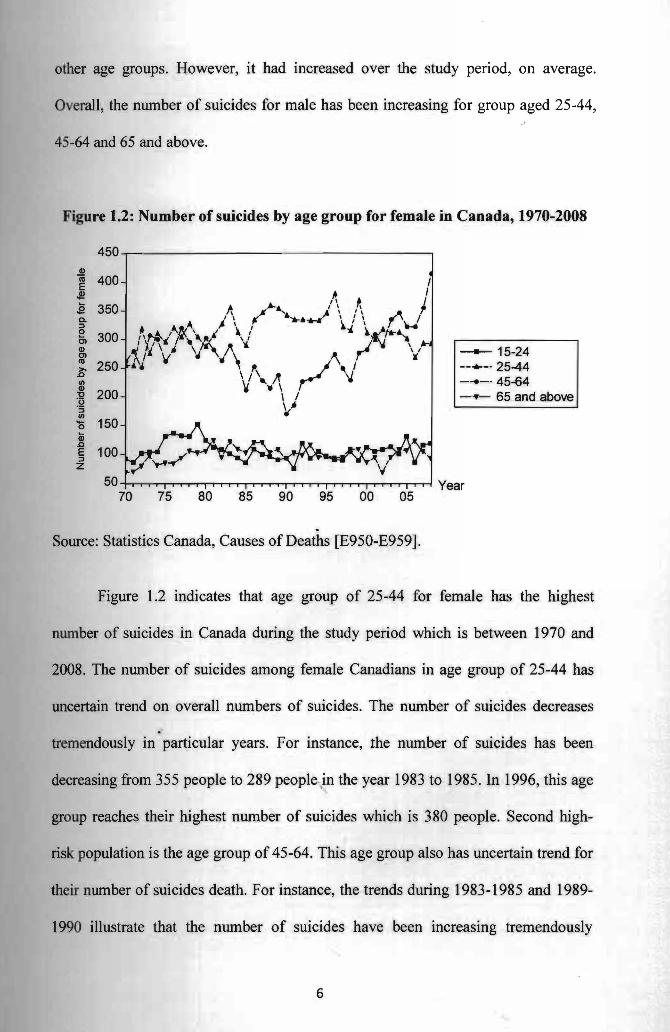
Figure 1.2: Number of suicides by age group for female in Canada, 1970-2008
450~~==~------------------------~
G)
Ii 400E J1 S 350 Q.
~ 300 G) -15-24Cl C1I 250 --....- · 25-44 ~ III --e-·45-64 ~ 200 - ....- 65 and above o 'S III
'0 150 ~ 5 100 z
50 +-r'T"'T""r-r"1r-rT-rr-r-r-..........r"T"'T..,...,........T"T""r-r"1~-rr'T"'T"..-nrro-l Year 70 75 80 85 90 95 00 05
Source: Statistics Canada, Causes of Deaths [E950-E959].
Figure 1.2 indicates that age group of 25-44 for female has the highest
number of suicides in Canada during the study period which is between 1970 and
2008. The number of suicides among female Canadians in age group of 25-44 has
uncertain trend on overall numbers of suicides. The number of suicides decreases ..
tremendously in particular years. For instance, the number of suicides has been
decreasing from 355 people to 289 people in the year 1983 to 1985. In 1996, this age
group reaches their highest number of suicides which is 380 people. Second high-
risk population is the age group of 45-64. This age group also has uncertain trend for
their number of suicides death. For instance, the trends during 1983-1985 and 1989
1990 illustrate that the number of suicides have been increasing tremendously
6
I between that periods. The age group of 15-24 and 65 and above has lower number of
suicides.
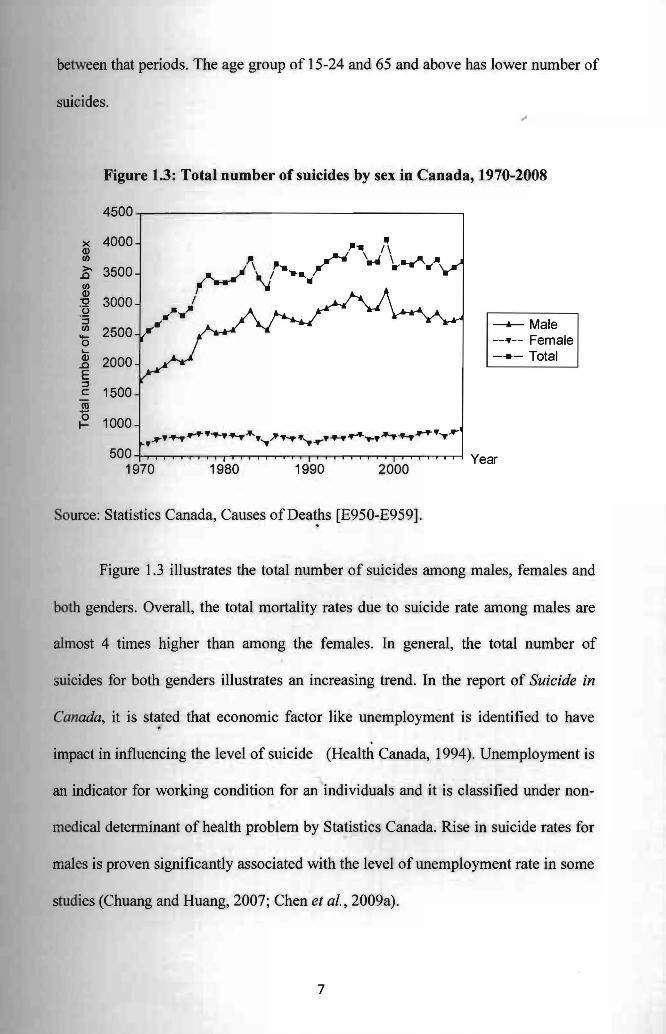
Figure 1.3: Total number of suicides by sex in Canada, 1970-2008
4500
x 4000 .. /\" Q) en ~ .-'.4 \ ....-' ....~"
~
.n >. 3500
/
,--" ,,'...en Q) "0 3000'u .....~ ':3 ..en 2500 0 -Q) .n '-
2000 E :::J c 1500 -co 0 ~ 1000
"~"+T""'''''''''+TJf...'f~/"~.",,,,,''''''''''''''''''f~+T''''''''''TJr 500
---*- Male --'1'-- Female - ..- Total
Year1970 1980 1990 2000
Source: Statistics Canada, Causes of Deat.hs [E950-E959].
Figure 1.3 illustrates the total number of suicides among males, females and
both genders. Overall, the total mortality rates due to suicide rate among males are
almost 4 times higher than among the females. In general, the total number of
suicides for both genders illustrates an increasing trend. In the report of Suicide in
Canada, it is st~ted that economic factor like unemployment is identified to have
impact in influencing the level of suicide (Health Canada, 1994). Unemployment is
an indicator for working condition for an individuals and it is classified under non
medical determinant of health problem by Statistics Canada. Rise in suicide rates for
males is proven significantly associated with the level of unemployment rate in some
studies (Chuang and Huang, 2007; Chen et ai., 2009a).
7
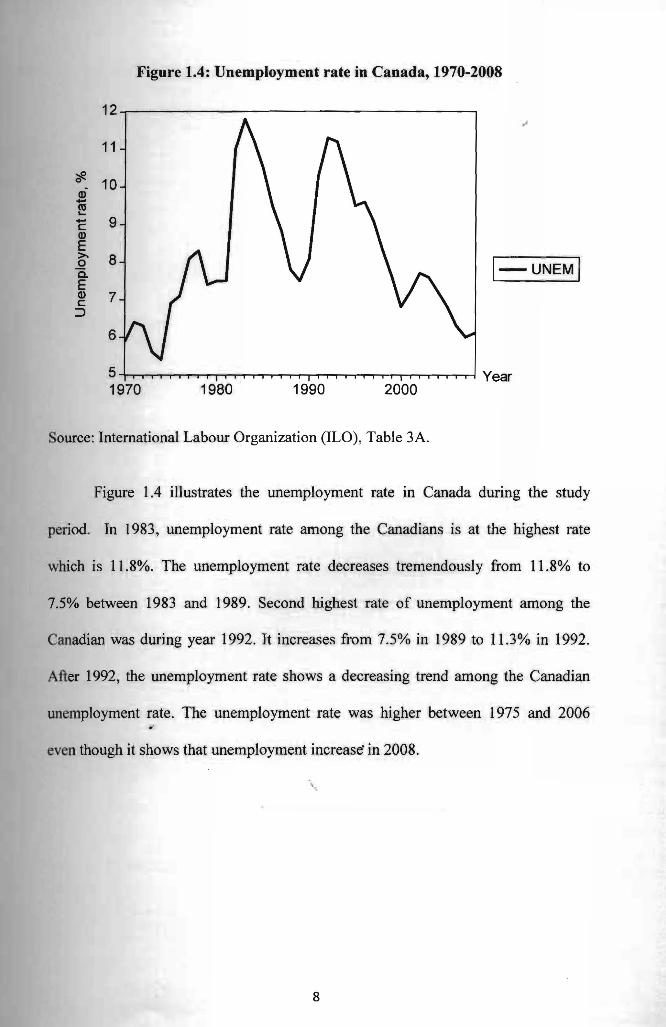
Figure 1.4: Unemployment rate in Canada, 1970-2008
12
11
-;:e0 10ai.... e! .... 9c CD E > 80 0.. E
l-UNEMI CD 7c
::>
6
5 1970 1980 1990 2000
ource: International Labour Organization (ILO), Table 3A.
Figure 1.4 illustrates the unemployment rate in Canada during the study
period. In 1983, unemployment rate among the Canadians is at the highest rate
which is 11.8%. The unemployment rate decreases tremendously from 11.8% to
7.5% between 1983 and 1989. Second highest rate of unemployment among the
Canadian was during year 1992. It increases from 7.5% in 1989 to 11.3% in 1992.
After 1992, the unemployment rate shows a decreasing trend among the Canadian
unemployment rate. The unemployment rate was higher between 1975 and 2006 .'
even though it shows that unemployment increase" in 2008.
8

Figure 1.5: Real gross domestic product per capita in Canada, 1970-2008
44000
40000 0 « u 36000 aj == Q. 32000 ~ ... Q) Q. 28000
Q. I-RGDPPCI
0 C> 24000iii Q) 0::
20000
16000 70 75 80 85 90 95 00 05
Source: DECD and IMF database.
Real gross domestic product per capita (RGDPPC) is an indicator for income
level. In this study, the RGDPPC is in national currency which is Canadian dollar.
Figure 1.5 illustrates that the RGDPPC is rising between 1970 and 2008. Since 1965,
Canada has implemented minimum wage. The minimum wage implemented in
Canada has been rising over the period but in different amount depending on the
provinces and territories. It could be the possible explanation that RGDPPC is in
increasing trend over the period.
9

Figure 1.6: Total fertility rate in Canada, 1970-2008
2.4 c:
'"E 0 ~ ... Q) 2.20. c: ! :2 1: 0 .... 0 2.0 G:;
.Q
E :l c: I-FERI C)
e Q)
1.8
'" ~
~ e ~ 1.6 :e .e S 0 I- 1.4 Year
1970 1980 1990 2000
Source: DECO database.
Figure 1.7: Female labour participation rate in Canada, 1970-2008
65
~ 0
-Q) 60 tV.... c: 0
:.;:; 55 tV a. '0 1:: tV 50 I-FLPRIa. .... ::J 0 ..c 45 J!! Q)
<U 40E Q)
lJ..
35 Year 1970 1980 1990 2000
ource: U.S. Bureau of Labor Statistics.
10

Total fertility rate is also one of the social factors that have significant impact
on suicidal behaviour. Figure 1.6 illustrates a decreasing trend for total fertility rate
among the female Canadians during the study period. In 1970, the total fertility rate
is the highest rate and it decreases over the study period. Total fertility rate is likely
to decrease can be explained by increasing number of women participate in the
labour force. In addition, Figure 1.7 illustrates that the female labour participation
rate (FLPR) has been rising over the period between 1970 and 2008. According to
Economic Department of OECD (2006), financial incentives and work practices
could be the possible reason of rising participation of women in the labour force.
These government policies may have influenced the decision of women and
encouraged them to join the labour force. Thus, more women participate in the
labour force.
Figure 1.8: Alcohol consumption litres per capita (15+) in Canada, 1970-2008
11~~~~--------------------1 cu '-0.. rJ
g 9 a II-ALel E ::J o c 8 8 (5 ~ o o c:(
7 -+-r~""T"'T""T"'T.......-.-r-r-r-r--'-'....,........,....r-r-r-r-r-r-T""'T'"T""'T'"T""'T'"T""'T'".....,.........,..-r-l Year 1970 1980 1990 2000
Source: OECD database.
11

Figure 1.8 illustrates that in 1970s to 1980s, Canadians consume more
alcohol. However, the consumption of alcoh01 started to decrease during 1980s, but .. it started to increase in between 1994 and 2008. Heavy consumption of alcohol
exists among Canadian in 1970s to 1980s and it might be correlated with number of
suicides among male and female during that period.
Figure 1.9: Number of crimes in Canada, 1970-2008
3000000 -r------ -------,- ----
2500000 Q) '" E ·c (J .... 0 2000000 .... l-cRIMEIQ)
.Q
E :J z
1500000
1000000 -h-"'T""T",..,....~r-T""1"""T""T""T""'I"....,..,....,....,_r-T""'1"""T""T,...,..-r-r-T""T""T'""T""",..,.-,...,--j Year 1970 1980 1990 2000
Source: Statistics Canada.
Crime rates may consider as one of the reasonable proxy for disintegration in
society. Crime rates data is obtained from Statistics Canada which it includes all .. types of crimes happened in Canada. As shown above, Figure 1.9 illustrates the
nwnber of crimes in Canada during the study period. Number of crimes has been
increasing between 1970 and 1991 where it reached highest peak in year 1991 which
is 2,898,989 numbers of crimes. In early 1970's, the number of crimes is the lowest
which is 1,110,066 cases. After 1991, number of crimes in Canada started to
decrease until 2008.
12
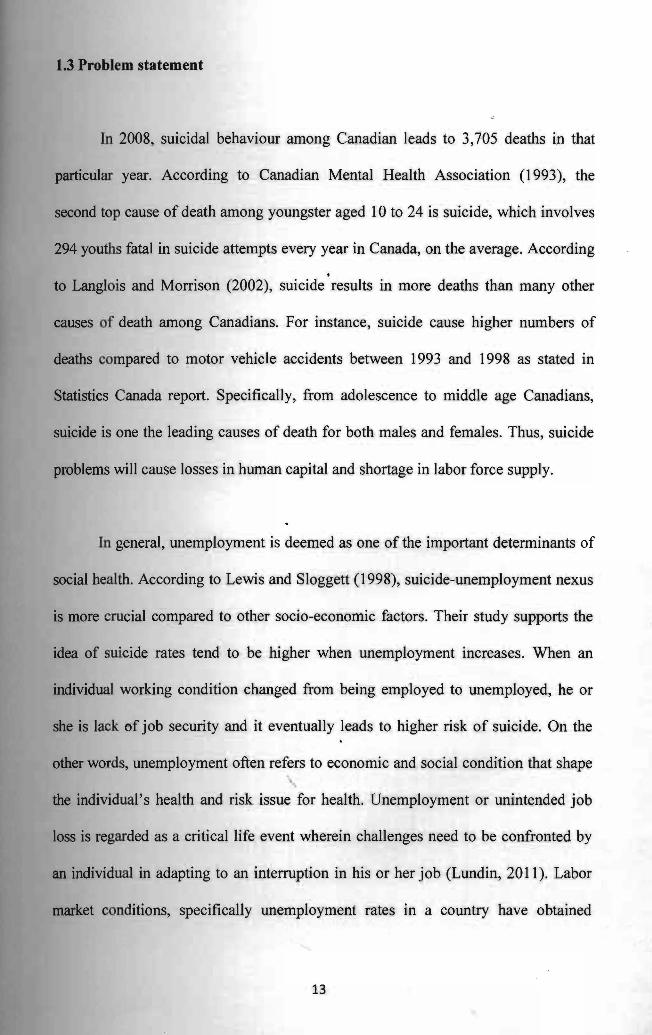
1.3 Problem statement
In 2008, suicidal behaviour among Canadian leads to 3,705 deaths in that
particular year. According to Canadian Mental Health Association (1993), the
second top cause of death among youngster aged 10 to 24 is suicide, which involves
294 youths fatal in suicide attempts every year in Canada, on the average. According
. to Langlois and Morrison (2002), suicide results in more deaths than many other
causes of death among Canadians. For instance, suicide cause higher numbers of
deaths compared to motor vehicle accidents between 1993 and 1998 as stated in
Statistics Canada report. Specifically, from adolescence to middle age Canadians,
suicide is one the leading causes of death for both males and females. Thus, suicide
problems will cause losses in human capital and shortage in labor force supply.
In general, unempioyment is deemed as one of the important determinants of
social health. According to Lewis and Sloggett (1998), suicide-unemployment nexus
is more crucial compared to other socio-economic factors. Their study supports the
idea of suicide rates tend to be higher when unemployment increases. When an
individual working condition changed from being employed to unemployed, he or
she is lack of job security and it eventually leads to higher risk of suicide. On the
other words, unemployment often refers to economic and social condition that shape
the individual's health and risk issue for health. Unemployment or unintended job
loss is regarded as a critical life event wherein challenges need to be confronted by
an individual in adapting to an interruption in his or her job (Lundin, 2011). Labor
market conditions, specifically unemployment rates in a country have obtained
13
substantial awareness from economists, exemplifying that high unemployment rates
are correlated to number of suicides.
Income level is also one of the important socio-economic factors that
contribute to suicide rate. Higher income is related with higher standard of living of
an individual and greater pleasure with life. From theoretical view, higher income
should associated with higher utility and subsequently will lowering the tendency of
committing suicide (Hamermesh and Soss, 1974). Therefore, the association between
income and suicide will be examined in this study because socio-economic factors
like income level is one of the important factors in suicide problems especially in
developed country like Canada.
Apart from that, fertility rate may reduce the risk of committing suicide,
particularly among females. Higher fertility rate may promote social or domestic
integration and thus, lowering the rate of suicide (Neumayer, 2003; Rodriquez, 2005;
Koo and Cox, 2008). However, higher fertility rate also refer to higher childcare
costs which eventually may bring too much of economic burden in term of financial.
Thus, it may lead to higher propensity of committing suicide among the females.
When higher numbers of women participate in the labour force, it might
either increase or decrease suicide rates depend on the genders. According to Koo
and Cox (2008), high FLPR could be associated with higher suicide rates among
male. The main explanation could be that the role as a breadwinner in the family. On
the other hand, they also pointed out that the relationship between FLPR and suicide
14