Embed Size (px)
Citation preview
Social perceptions of single-use plastic
consumption of the Balinese population
Javier López-Murcia Martín
Bachelor’s thesis in Natural Resources
Degree Programme in Sustainable Coastal Management
Raseborg 2015
BACHELOR’S THESIS
Author: Javier López-Murcia Martín
Degree Programme: Sustainable Coastal Management
Specilization: Natural Resources
Supervisor: Anna Granberg
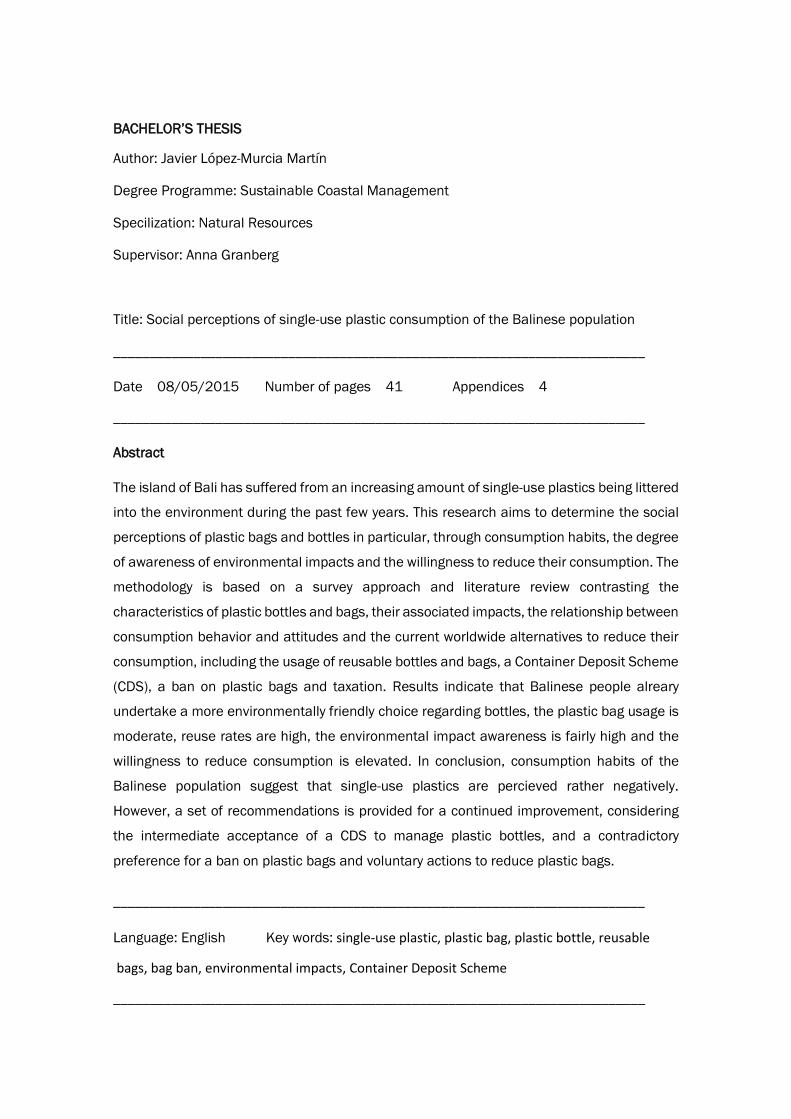
Title: Social perceptions of single-use plastic consumption of the Balinese population
_________________________________________________________________________
Date 08/05/2015 Number of pages 41 Appendices 4
_________________________________________________________________________
Abstract
The island of Bali has suffered from an increasing amount of single-use plastics being littered
into the environment during the past few years. This research aims to determine the social
perceptions of plastic bags and bottles in particular, through consumption habits, the degree
of awareness of environmental impacts and the willingness to reduce their consumption. The
methodology is based on a survey approach and literature review contrasting the
characteristics of plastic bottles and bags, their associated impacts, the relationship between
consumption behavior and attitudes and the current worldwide alternatives to reduce their
consumption, including the usage of reusable bottles and bags, a Container Deposit Scheme
(CDS), a ban on plastic bags and taxation. Results indicate that Balinese people alreary
undertake a more environmentally friendly choice regarding bottles, the plastic bag usage is
moderate, reuse rates are high, the environmental impact awareness is fairly high and the
willingness to reduce consumption is elevated. In conclusion, consumption habits of the
Balinese population suggest that single-use plastics are percieved rather negatively.
However, a set of recommendations is provided for a continued improvement, considering
the intermediate acceptance of a CDS to manage plastic bottles, and a contradictory
preference for a ban on plastic bags and voluntary actions to reduce plastic bags.
_________________________________________________________________________
Language: English Key words: single-use plastic, plastic bag, plastic bottle, reusable
bags, bag ban, environmental impacts, Container Deposit Scheme
_________________________________________________________________________

Acknowledgements
I would like to thank Anna Granberg for her valuable input in the writing process and,
especially for her infinite patience. I would also like to show my gratitude to Tanya
Donskih, who supported me at all stages of this thesis work and never complained when
I was unbearable, and to Timm Phillips at Project Clean Uluwatu for always giving me
the most useful tips. Finally, I want to give a huge thanks to Tino Maharde, who helped
me with the translation of the questionnaire into Indonesian, a crucial part of my thesis.

List of abbreviations
ACC American Chemistry Council
BCGP Bali Clean and Green Program
BGTO Bali Government Tourism Office
BPA Bisphenol A
CDS Container Deposit Scheme
DoE Department of Environment
EA Environment Agency
EC European Commission
EU European Union
GBG Global Business Guide
GHG Greenhouse Gases
HDPE High-Density Polyethylene
MoE Ministry of Environment
NOAA National Oceanic and Atmospheric Administration
LCA Lifecycle Assessment
LDPE Low-Density Polyethylene
LLPE Linear Low-Density Polyethylene
PITA Plastic Industry Trade Association
UK United Kingdom
US United States
WRAP Waste and Resources Action Program
Table of contents
1. Introduction ................................................................................................................... 1
1.1 Aims ......................................................................................................................... 3
1.2 Research question .................................................................................................... 4
1.2.1 Main question .................................................................................................... 4
1.2.2 Sub-question ...................................................................................................... 4
2. Theoretical Framework.................................................................................................. 5
2.1 Single-use plastics .................................................................................................... 5
2.1.1 Plastic bags ........................................................................................................ 5
2.1.2 Plastic bottles .................................................................................................... 9
2.2 Environmental impacts of single-use plastics ........................................................ 10
2.2.1 Ocean pollution ............................................................................................... 10
2.2.2 River pollution ................................................................................................ 11
2.3 Consumption behavior and attitude ....................................................................... 12
2.4 Strategies and alternatives to reduce single-use plastic bottles ............................. 13
2.4.1 Reusable bottles .............................................................................................. 13
2.4.2 Container Deposit Scheme .............................................................................. 13
2.5 Strategies and alternatives to reduce single-use plastic bags ................................. 14
2.5.1 Reusable bags .................................................................................................. 15
2.5.2 Ban on plastic bags.......................................................................................... 15
2.5.3 Taxation or fees ............................................................................................... 16
3. Materials and Methods ................................................................................................ 16
3.1 Questionnaire structure .......................................................................................... 17
3.2 Location ................................................................................................................. 18
4. Results ......................................................................................................................... 19
4.1 Background information ........................................................................................ 19
4.2 Consumption behavior ........................................................................................... 20
4.3 Environmental impacts awareness ......................................................................... 24
4.4 Willingness to reduce consumption ....................................................................... 27
5. Discussion .................................................................................................................... 30
6. Conclusions ................................................................................................................. 34
List of References ........................................................................................................ 37
Appendices
Appendix I ............................................................................................................ I
Appendix II .......................................................................................................... II
Appendix III ........................................................................................................ III
Appendix IV......................................................................................................... V
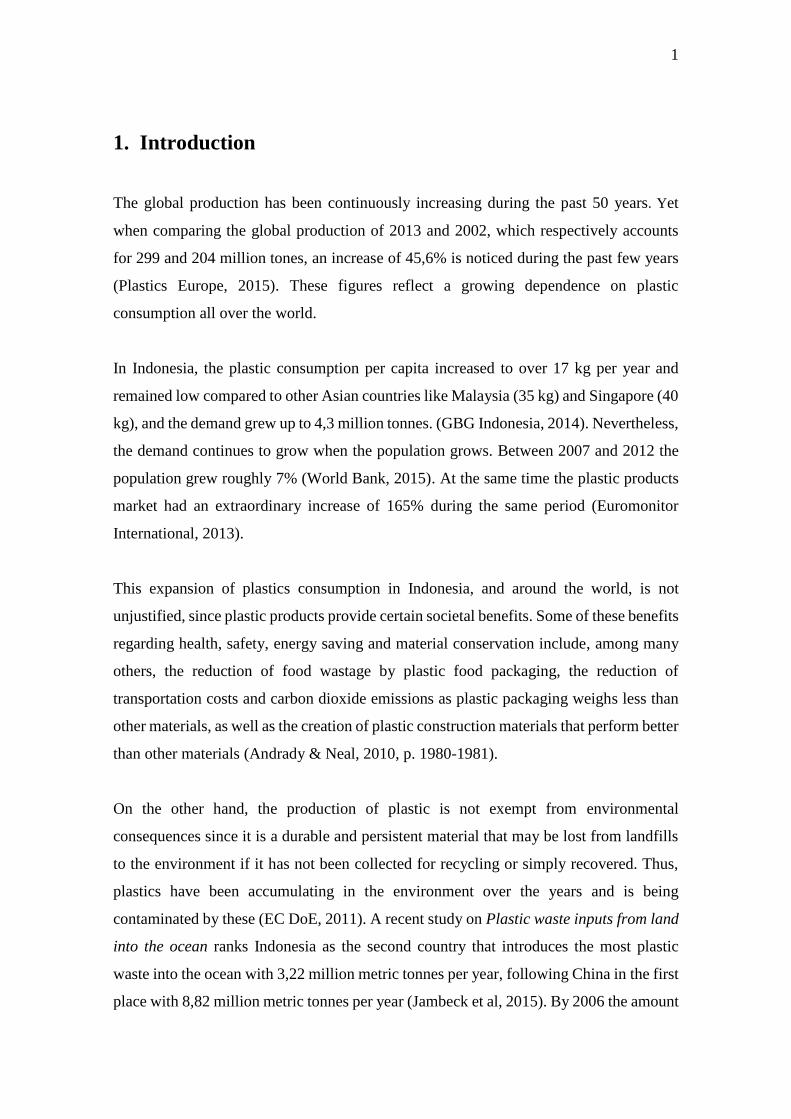
1
1. Introduction
The global production has been continuously increasing during the past 50 years. Yet
when comparing the global production of 2013 and 2002, which respectively accounts
for 299 and 204 million tones, an increase of 45,6% is noticed during the past few years
(Plastics Europe, 2015). These figures reflect a growing dependence on plastic
consumption all over the world.
In Indonesia, the plastic consumption per capita increased to over 17 kg per year and
remained low compared to other Asian countries like Malaysia (35 kg) and Singapore (40
kg), and the demand grew up to 4,3 million tonnes. (GBG Indonesia, 2014). Nevertheless,
the demand continues to grow when the population grows. Between 2007 and 2012 the
population grew roughly 7% (World Bank, 2015). At the same time the plastic products
market had an extraordinary increase of 165% during the same period (Euromonitor
International, 2013).
This expansion of plastics consumption in Indonesia, and around the world, is not
unjustified, since plastic products provide certain societal benefits. Some of these benefits
regarding health, safety, energy saving and material conservation include, among many
others, the reduction of food wastage by plastic food packaging, the reduction of
transportation costs and carbon dioxide emissions as plastic packaging weighs less than
other materials, as well as the creation of plastic construction materials that perform better
than other materials (Andrady & Neal, 2010, p. 1980-1981).
On the other hand, the production of plastic is not exempt from environmental
consequences since it is a durable and persistent material that may be lost from landfills
to the environment if it has not been collected for recycling or simply recovered. Thus,
plastics have been accumulating in the environment over the years and is being
contaminated by these (EC DoE, 2011). A recent study on Plastic waste inputs from land
into the ocean ranks Indonesia as the second country that introduces the most plastic
waste into the ocean with 3,22 million metric tonnes per year, following China in the first
place with 8,82 million metric tonnes per year (Jambeck et al, 2015). By 2006 the amount
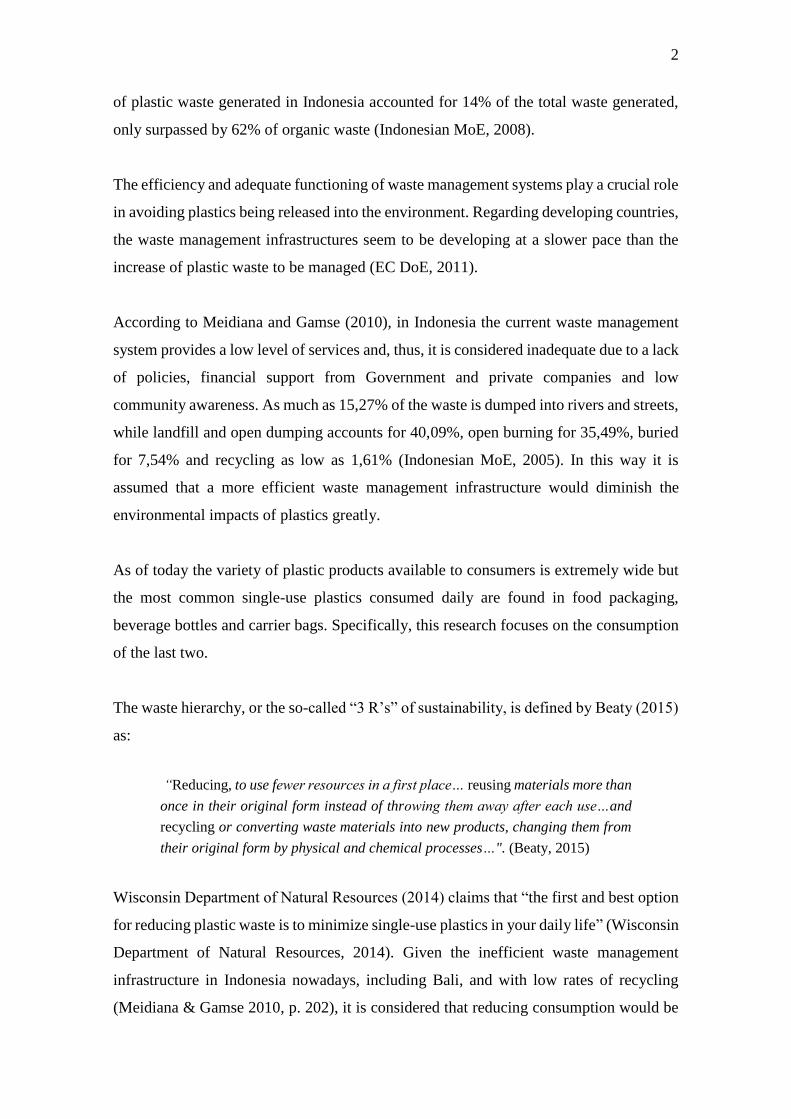
2
of plastic waste generated in Indonesia accounted for 14% of the total waste generated,
only surpassed by 62% of organic waste (Indonesian MoE, 2008).
The efficiency and adequate functioning of waste management systems play a crucial role
in avoiding plastics being released into the environment. Regarding developing countries,
the waste management infrastructures seem to be developing at a slower pace than the
increase of plastic waste to be managed (EC DoE, 2011).
According to Meidiana and Gamse (2010), in Indonesia the current waste management
system provides a low level of services and, thus, it is considered inadequate due to a lack
of policies, financial support from Government and private companies and low
community awareness. As much as 15,27% of the waste is dumped into rivers and streets,
while landfill and open dumping accounts for 40,09%, open burning for 35,49%, buried
for 7,54% and recycling as low as 1,61% (Indonesian MoE, 2005). In this way it is
assumed that a more efficient waste management infrastructure would diminish the
environmental impacts of plastics greatly.
As of today the variety of plastic products available to consumers is extremely wide but
the most common single-use plastics consumed daily are found in food packaging,
beverage bottles and carrier bags. Specifically, this research focuses on the consumption
of the last two.
The waste hierarchy, or the so-called “3 R’s” of sustainability, is defined by Beaty (2015)
as:
“Reducing, to use fewer resources in a first place… reusing materials more than
once in their original form instead of throwing them away after each use…and
recycling or converting waste materials into new products, changing them from
their original form by physical and chemical processes…". (Beaty, 2015)
Wisconsin Department of Natural Resources (2014) claims that “the first and best option
for reducing plastic waste is to minimize single-use plastics in your daily life” (Wisconsin
Department of Natural Resources, 2014). Given the inefficient waste management
infrastructure in Indonesia nowadays, including Bali, and with low rates of recycling
(Meidiana & Gamse 2010, p. 202), it is considered that reducing consumption would be
3
the best choice within the actual context rather than recycling. By reusing one would also
be reducing the amount of single-use plastics consumed since it stops the potential
consumer from buying more plastic bags and bottles while using instead, reusable bottles
and bags.
Consuming less plastic bags and bottles is a relatively easy task for people to help the
environment. However, initiating this behavioral change for a whole society is not an easy
one. Becker et al (2014) argue that individual intentions are less powerful than habits and
that institutional regulation, incentives and supports have the ability to encourage such
behavior change by altering the value and intention of the behavior. Bans or taxation on
plastic bags, incentives to use reusable bags or a returnable bottles system are among
these regulations and incentives.
In Bali, banana leaves used to be the most common material for packaging food while
nowadays these have been replaced by plastic bags. The issue appears when the habit of
littering banana leaves, which would organically decompose in a few months, remains
but it is replaced by plastic bags that will rest in the environment practically unaltered
during years. (Thiermann, 2013)
Thus, as a starting point for this research, and independently of littering habits, it is
considered that the reduction in use of plastic bags and bottles is the best option for
avoiding potential environmental impacts. As Ecomaine (2014) states, “the best plastic
bag is the one you don’t use” (Ecomaine, 2014). However, is the Balinese population
willing to engage in such alteration of consumption habits in order to reduce these
environmental impacts?
1.1 Aims
Where littering single-use plastics is the ultimate cause of contamination, this study
focuses on one step behind in the process: the consumption. More specifically, the aim of
the research is to provide information regarding the actual Balinese population’s attitudes
towards the consumption of single-use plastic bottles and bags and their awareness of
environmental impacts caused by these.

4
Based on the results, and in case the local population shows interest in reducing their
single-use plastic consumption, some feasible recommendations will be given to help
with the task. This research may be used by Government authorities, non-profit
organizations, private bodies or individuals in order to develop adequate strategies and
take actions according to actual attitudes.
1.2 Research question
1.2.1 Main question
What is the Balinese social perception towards the consumption of single-use plastic bags
and bottles?
1.2.2 Sub-questions
1. Is the Balinese population aware of the environmental impacts of single-use
plastics?
2. Is the Balinese population willing to reduce the consumption of single-use
plastics?
2. Theoretical Framework
The literature reviewed in this report encompasses the main characteristics of single use
plastic bags and bottles, materials in which they are manufactured, lifecycle assessment
of plastics and other alternative materials among others. It also covers the environmental
impacts, the relationship between behaviors and attitudes regarding plastics and a set of
existing strategies or alternatives to reduce the use of both plastic bottles and bags being
used in other parts of the world.
5
2.1 Single-use plastics
Three of the most common single-use products that we use on a daily basis are: plastic
bags, plastic bottles and plastic food packaging. For the sake of reducing the scope of the
research, the focus is set on plastic bags and bottles.
2.1.1 Plastic Bags
Before plastic bags were created the most common way of carrying groceries home was
with paper bags. In 1965, a Swedish company called Celloplast designed what would be
the first “T-shirt plastic bags”, which would slowly replace the habit of using paper bags
(Petru, 2014). The terms single use or disposable carrier bags are defined by Zero Waste
Scotland (2014) as “all carrier bags that are supplied with the intention that they are to be
used once, to carry goods away from the point of sale” (Barnes, 2014, p. 4).
The high presence of plastic bags in our society does not come unjustified. The
convenience that they provide on a daily basis have converted them into a valuable
product. These are characterized to be functional, strong, cheap to manufacture,
lightweight and hygienic as they are disposable. (Australian DoE, 2008)
The main raw materials used for the production of plastic are crude oil and natural gas
(ACC, 2015). For plastic bags, these are processed so that they form repeating units of
ethylene which can eventually form polyethylene. In this process, where ethylene
molecules are polymerized, long chains of carbon are created and each carbon atom bonds
to two hydrogen atoms. Then these polymers are heated to form a plastic resin which is
blown through tubes. This last step creates the pocket of the bag, which is followed by
cooling, stretching and cutting of it into individual bags (ICF International, 2010).
The most common polyethylene types that plastic bags are made of: high-density
polyethylene (HDPE), low-density polyethylene (LDPE), or linear low-density
polyethylene (LLDPE). Usually, grocery bags are made of HDPE and thicker ones often
provided in mall centers are made of LLDPE, and garment bags are made of LDPE.
(Lajeunesse, 2004, p. 51)
6
Despite plastic bags being designed to be used only once, these can and often are reused
in a number of ways. To serve as example, in a study carried out by the UK’s WRAP
(2005) several different reuses that consumers give to plastic bags are described, such as
bin liners, for pets excrements, garden refuse, reuse for supermarket or other shopping, to
store things at home, for packed lunches, to carry other things at home, and to keep bottles
and cans in for recycling among others. In such study the most common use among the
respondents was as a bin liner in kitchen (53%) (WRAP, 2005).
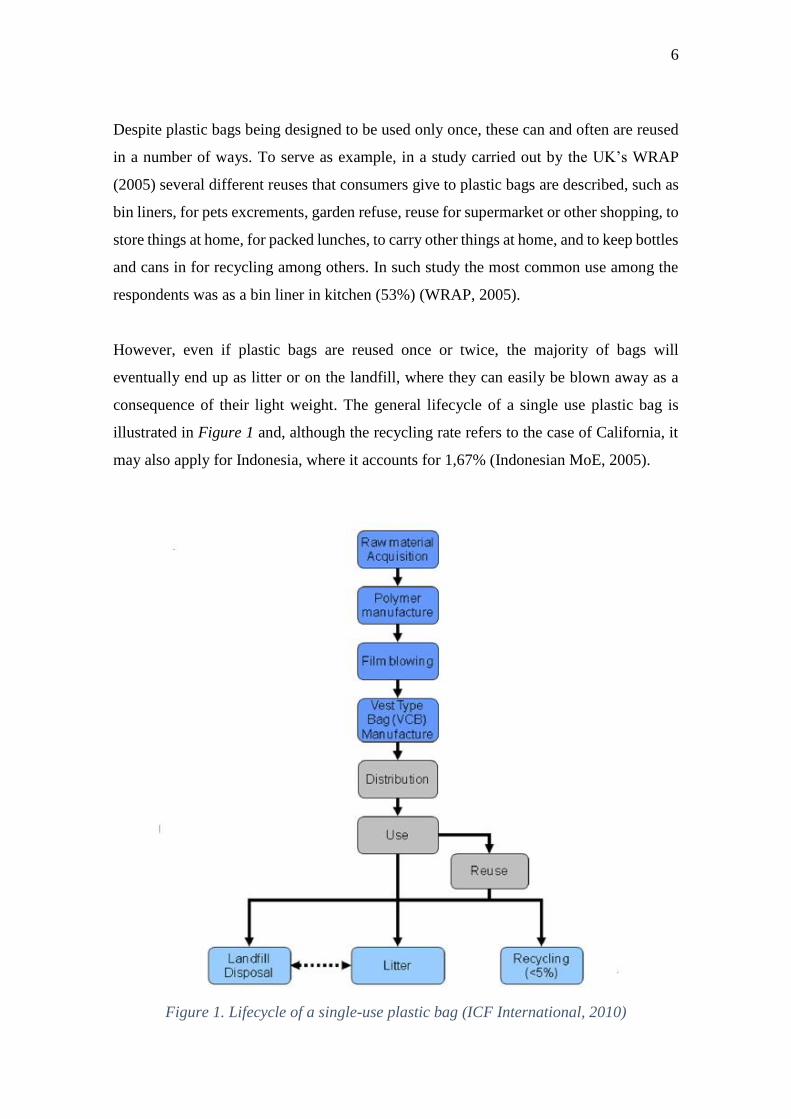
However, even if plastic bags are reused once or twice, the majority of bags will
eventually end up as litter or on the landfill, where they can easily be blown away as a
consequence of their light weight. The general lifecycle of a single use plastic bag is
illustrated in Figure 1 and, although the recycling rate refers to the case of California, it
may also apply for Indonesia, where it accounts for 1,67% (Indonesian MoE, 2005).
Figure 1. Lifecycle of a single-use plastic bag (ICF International, 2010)
7
Recycling of plastics bags is being carried out in many countries at a higher or lesser
level. Tolinski (2012) argues that,
“a lack of comprehensive recycling (close to what we have now) puts pressure on
the plastics industry to develop alternatives, or possibly will lead to more extreme
regulations limiting plastics use, such as the shopping bag bans now being
enacted”. Tolinski (2012, p.56)
Given the fact that there are thousands of different varieties of plastics, it is a more
complex process to recycle these than other materials like paper, glass or aluminum.
Besides, for the plastics to be recycled these have to be collected, sorted by type (every
type of plastic is assigned a code), cleaned, processed and delivered to a manufacturer
that will convert it into another product (Eureka Recycling, 2009, p. 1).
Other alternative materials are being used for the manufacturing of single-use bags. Paper
bags have been used for years and according to Florida’s Department of Environmental
Protection (2013) these have a higher recycling rate although it takes almost twice the
same energy to recycle one pound of paper than a pound of plastic and four times more
energy to produce one paper bag compared to a plastic one. In addition, although paper
comes from a renewable source, high pressures would be put into forests if all plastic bags
were substituted by paper ones. Fuel used for transportation is seven times higher when
carrying the same amount of paper bags than plastic ones, and the amount of fresh water
used for paper bags is much higher as well (ICF International, 2010; ACC, 2015).
Recently, biodegradable bags are also being produced as an alternative to traditional
plastic bags. These are designed to naturally degrade by activity of microorganisms like
fungi, algae and bacteria and made from synthetic or biologically produced polyesters
like sugarcane, corn or potatoes (ICF International, 2010). More specifically, there are
three types of categories under the term “biodegradable” regarding plastics: startch-
polyester, polylactic acid (PLA) and polyethylene with additives that accelerate the
degradation (see Table 1).
8
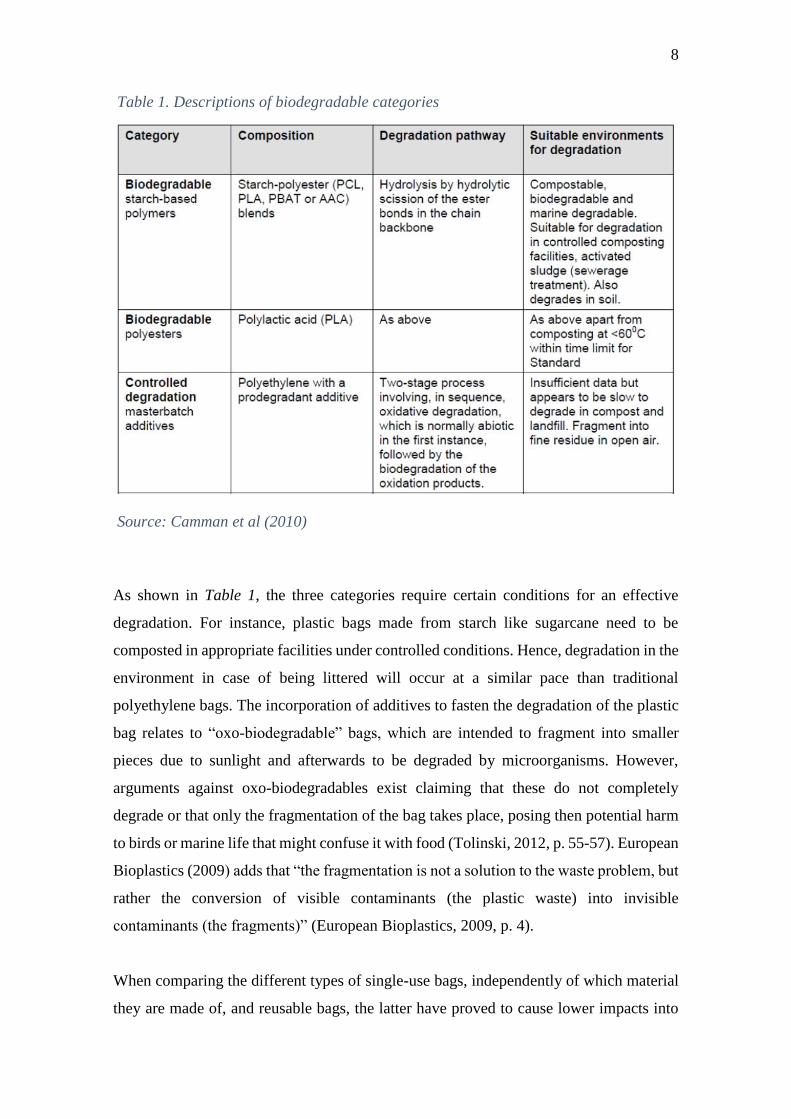
Table 1. Descriptions of biodegradable categories
Source: Camman et al (2010)
As shown in Table 1, the three categories require certain conditions for an effective
degradation. For instance, plastic bags made from starch like sugarcane need to be
composted in appropriate facilities under controlled conditions. Hence, degradation in the
environment in case of being littered will occur at a similar pace than traditional
polyethylene bags. The incorporation of additives to fasten the degradation of the plastic
bag relates to “oxo-biodegradable” bags, which are intended to fragment into smaller
pieces due to sunlight and afterwards to be degraded by microorganisms. However,
arguments against oxo-biodegradables exist claiming that these do not completely
degrade or that only the fragmentation of the bag takes place, posing then potential harm
to birds or marine life that might confuse it with food (Tolinski, 2012, p. 55-57). European
Bioplastics (2009) adds that “the fragmentation is not a solution to the waste problem, but
rather the conversion of visible contaminants (the plastic waste) into invisible
contaminants (the fragments)” (European Bioplastics, 2009, p. 4).
When comparing the different types of single-use bags, independently of which material
they are made of, and reusable bags, the latter have proved to cause lower impacts into

9
the environment in case of actually being used several times (ICF International, 2010, p.
2). However, this alternative will be discussed in a separate chapter of this report.
2.1.2 Plastic Bottles
Plastic bottles were first commercially available in 1947. Nevertheless, likewise plastic
bags, they did not start to be widely used until 1960s, when high-density polyethylene
was created. Ever since, its consumption was on the rise due to its lightweight
characteristics and the low production cost. (Nimbus Project, 2013)
In an article by Jensen and Danubrata (2014), Janice Wung mentions that "the bottled
water market in Indonesia has seen increasing competition due to exploding bottled water
consumption" (Jensen & Danubrata, 2014). In addition, "the almost non-existent anti-
bottled water campaign in this part of the world compared to the U.S. and Europe,
together with the economic growth, has presented Indonesia as a lucrative market to
global bottled water companies" (Jensen & Danubrata, 2014).
Usually beverage plastic bottles are made primarily of either high-density polyethylene
(HDPE) or Polyethylene Terephthalate (PET). In 1988, the Society of the Plastics
Industry (SPI) introduced a universal system to facilitate the identification of the resin
type of which different bottles were made. With this system, separation of plastics for the
recycling process becomes more efficient (PITA, w.y.). The PET’s are represented by
code #1 (see Appendix I), they are clear, strong, and has good gas and moisture barrier
properties and are commonly used in soft drinks, water bottles or juices among others.
Regarding HDPE bottles, these are represented by code #2, they are more stiff than PET’s
and are used in water bottles and juices as well but also in milk bottles. Recycling of
plastics assigned with codes from #3 to #7 are most likely not recyclable by the majority
of recycling programs, while PET and HDPE (codes #1 and #2) are highly recycled
(Eureka Recycling, 2009).
On the other hand, the downside of recycling is that when a bottle is recycled this does
not become another bottle again, as every time that plastic is reheated it loses quality and
other products, such as toys, are produced from it. In this way, recycling can only occur
10
a finite number of times before the plastic ends up incinerated or in the landfill. (Eureka
Recycling, 2009)
2.2 Environmental impacts of single-use plastics
As of today, many studies have already proven detrimental effects of plastics into the
environment as well as into human health. Regarding the latter, the more concerning
components of plastics that can harm our health are the following additives: Bisphenol A
(BPA), Phthalates and Brominated Flame Retardants (EC DoE, 2011).
Only BPA is found in plastic bottles, while the other two additives are found in other
plastic products like PVC pipes, raincoats, televisions and more, which are out of the
focus for this research. Thus, the purpose of BPA is to make the hard and clear plastic
found in plastic bottles and other products. Nevertheless, the health risks associated to
BPA are that it functions as endocrine disruptors and particularly affects more to early
developing stages of humans, especially for chronic diseases like diabetes and obesity
(EC DoE, 2011).
In regards with the negative environmental effects, it is believed that all plastic that has
been at some point spread into the environment still remains in it. Not necessarily in its
product form but more likely fragmented into smaller pieces due to UV light and physical
abrasion (Barnes et al, 2009, p. 1993). Due to the resilience of plastics, ecosystems in
environments like oceans and rivers can be harmed and, with aims to gain understanding
about the issue, multiple studies have been carried out in efforts to assess such impacts.
2.2.1 Ocean pollution
Conforming to the study presented by Jamberick et al (2015), the annual amount of plastic
introduced into the ocean from land sources ranges between 1,1 and 8,8 million metric
tonnes per year for the top 20 countries, that mismanaged 83% of total waste. The most
influencing factors are population size as well as proportion of mismanaged waste. As

11
already stated before in this report, Indonesia ranks second in this list (see Appendix II)
with 3,22 million metric tonnes.
Increasing amounts of plastic are found on the ocean surface, deep ocean, ocean bed,
coastlines, and sediments. However, they have also been found in wildlife that confused
small pieces of plastic with food as well as entanglements that could lead to injury or
death of marine flora and fauna. The sources of this contaminants come from both littering
at sea and from land sources such as plastic blown away from landfills, sewage effluents,
transportation accidents as well as littering on the street. (Barnes et al, 2009, p. 1985-
1989)
The famous “Great Garbage Patch” is the name given to large concentration of marine
debris in the North Pacific, even though there are four more gyres around the world. Many
believe that this gyres contain large pieces of floating garbage, while the reality is that the
majority of this garbage corresponds to micro-plastics that cannot be easily seen by the
naked eye (US NOAA, w.y.). There is, however, at least four more gyres around the world
of similar magnitude.
2.2.2 River pollution
Streams and rivers serve as an entry point of all kind of waste, including single-use
plastics, into the oceans. This is due to direct littering into them or through storms that
carry plastics into the drains. In this sense, depending on the size of the river and the
strength of its currents, a larger or smaller amount of plastic will be introduced into the
ocean or will remain in riverbanks. (Barnes et al, 2009, p. 1992)
In an article by the newspaper The Bali Times (2013) the Indonesian Ministry of
Environmental affirmed that 52 rivers are currently polluted and, “based on the 2012
monitoring results, only 0.49 percent of rivers being monitored meet the water quality
standard, while 75.25 percent seriously polluted, 22.52 moderately polluted and 1.73
percent slightly polluted” (The Bali Times, 2013).
12
2.3 Consumption behavior and attitude
Both developed and developing countries can be considered to be dominated by a
“throwaway society” were the norm is to produce short-lived products in order to keep
producing more. Natural resources are relentlessly exploited in order to satisfy the
society’s demand for use-and-toss products, where reusing and recycling practices remain
in the background. (Upstream, w.y.)
If having in mind that the whole society is compounded of individuals, then each
individual action affects the whole and vice versa. Despite attitude being a major factor
influencing behavior, Arbuthnott (2008, p. 152) argues that behavior is also influenced
by others such as contextual support, social norms, action difficulty, and habitual
behavior.
Independently of which factors might affect consumption behaviors, there are studies
defending the idea that occasionally there exists a gap between attitude and behavior, i.e.
these two aspects might not always go in line. For instance, d’Astous and Legendre (2009)
claim that there is a “significant difference between what consumers say about the
importance of consumption-related ethical issues and their actual behavior” (d’Astous
and Legendre, 2009, p. 255). Moreover, as Arbuthnott (2008) states, “the more personal
and specific our intentions are, the more likely they are to influence our behavior. For
instance, we are more likely to act consistently with attitudes about our own needs than
attitudes about the needs of others or the generic environment” (Arbuthnott, 2008, p. 154).
Therefore, consumption decisions regarding single-use plastics should be determined by
environmental consciousness or, on the contrary, such behavior might not be altered at
all despite showing an attitude towards changing it. In other words, the consumer might
show intentions of using less single-use plastic bags or bottles, but if s(he) is not
concerned enough about the environmental consequences of these s(he) will probably not
act accordingly. This would create the so-called gap between attitude and behavior.
13
2.4 Strategies and alternatives to reduce single-use plastic bottles
Although there are more strategies in order to reduce plastic bottles consumption, the
usage of reusable bottles and the implementation of a Container Deposit Scheme (CDS)
are the only two strategies considered.
2.4.1 Reusable bottles
Reusing plastic bottles that are meant to be used once may increase the chances of BPA
leaching and, therefore, the health risks associated with it (Ellsbury, 2012). Due to this,
in order to reduce the consumption of single-use plastic bottles in a safe manner reusable
bottles appear to be a suitable solution. Ellsbury (2012) lists a series of benefits of
reusable bottles over traditional single-use bottles, where: these reduce the amount of
fossil fuels used and toxins released into the air, they are durable and stylish, healthier as
these are BPA-free, possible to refill in most public facilities and lastly, more cost-
efficient as tap water can cost 500 times less than bottled water.
Regarding the last of the benefits mentioned before, it is important to notice that in
Indonesia is not safe to drink from tap water and it is common to consume mineral water
from 19 liters gallon containers. Still, habitants that cannot afford to buy mineral water
rely on boiling tap water to survive. (Union Panels, 2014)
Reusable bottles are commercially available in different materials: plastic, stainless steel,
aluminum and glass. Each one has advantages and disadvantages over the others (Because
Water, 2014) but, independently of which material these are made of, all of them
contribute to reduce single-use plastic.
2.4.2 Container Deposit Scheme
Clean up Australia (w.y.) defines a Container Deposit Scheme (CDS) as “the collection
of drink containers and receiving a cash refund for each container returned. Depending

14
on the deposit system, containers can be returned to the manufacturers via the retailer, to
designated collection depots, reverse vending machines or recovered as part of existing
waste or recycling collection system”. (Clean up Australia, w.y.)
Among the benefits of this system there is the reduction of waste spreading into the
environment, the job creation, and the increase in recycling rates, with all the advantages
that it involves on its own (Clean up Australia, w.y.). New Zeland’s Zero Waste Plan
(2002, p. 4) adds that a CDS also reduces the use of natural resources to produce more
bottles and cans, provides a monetary incentive to return them as well as an infrastructure
for collection-recycling. In the case of Indonesia, the bottle collection market is
dominated by an informal sector of scavengers, truck helpers, intermediates, distributors
and more (Chaerul et al, 2006).
Hopewell et al (2009, p. 2119) believe that unless the bottle consumers are greatly
committed to recycle their bottles or a returnable deposit scheme that offers an economic
incentive is present, the collection rates tend to be very low. Therefore, they imply that a
returnable deposit scheme would increase collection rates.
Currently, many countries have implemented laws regarding container deposit schemes.
Just to name a few: some states of US, Canada, Australia, South Korea, Israel, Belgium,
Estonia, Denmark, Sweden and Finland (Bottle Bill, w.y.). Considering only the return
rate of plastic bottles, some countries have proven being very successful and effective.
Then, countries like Estonia, Denmark and Finland reach around 96%, 93% and 89%,
respectively. On the contrary, the efficiency of this system can differ greatly from country
to country, as it is the case of Sweden with only 40% of plastic bottles are returned despite
showing high return rates in aluminum with 91% (Weisfeld, 2012).
2.5 Strategies and alternatives to reduce single-use plastic bags
In order to reduce the usage of single-use plastic bags the consumption of reusable bags,
a ban and taxation are the three strategies reviewed.

15
2.5.1 Reusable bags
The terms reusable bags, often called “bags for life”, comprises bags made of any material
that are meant to be used from several to hundreds of times. Usually these are
commercially produced in materials like cloth, woven, jute, canvas, hemp, synthetics,
thicker plastics, etc. (UK EA, 2006). When comparing with single-use plastic bags, these
require more energy and resources per bag but if used several times, as intended, the
environmental footprint becomes lower and lower after each use (ICF International,
2010).
Dilli (2007) compares, in a LCA, the environmental footprints of single-use HDPE,
single-use LDPE, paper, degradable, cloth and non-woven reusable plastic bags and
concludes that reusable ones have the lowest environmental impacts in terms of water
usage, GHG, energy and resources usage, and litter.
In its study over consumer attitudes towards single-use and reusable bags, WRAP (2015)
claims that “over a quarter of respondents considered budget bags for life [non-woven
plastic bags] to be a normal shopping bag [single-use plastic bag]” (WRAP, 2015) and
that “half of the respondents claimed that they did not re-use bags for life has time they
went food shopping…” (WRAP, 2015), i.e. they forgot to bring them.
2.5.2 Ban on plastic bags
A plastic bag ban in considered as the prohibition from retailers to sale single-use plastic
bags in a given territory. Several countries around the world have successfully
implemented bans and many others are on their way. For instance, Philippines
implemented in 2011 a “Total Plastic Bag Ban”, which entails a strict system where
retailers can only offer paper bags or biodegradable bags and those who disobey the law
are punished through fines, revocation of business license or even prison (Hogaza, 2014).
In China, a ban was imposed in 2008 which has resulted in a decrease of 60% for local
supermarkets against 80% for foreign- owned ones. Still, it is reported that at least 80%
of supermarkets in rural areas did not stop providing with free single-use plastic bags due
to more difficult control. (Block, 2013)
16
In a study undertaken by Piazza Research (2012) made in Canberra, Australia, attitudes
of the habitants concerning a plastic bag ban implemented in 2011 were evaluated. The
results showed that 84% of the shoppers brought their own reusable bag “always” or
“most of the times”, while only 3% never did bring them. Besides, in favor to the success
of the ban, 84% admitted that as a consequence of such ban they now bring reusable bags
when shopping. Also, 56% affirmed that they were already using reusable bags before
the ban came into force. When respondents were asked whether they support the ban or
not, 58% did, 33% did not, and 9% was not sure (Piazza Research, 2012). This study
reflects, as in any other part of the world, the difficulty of reaching consensus regarding
bans and the controversy of the matter.
2.5.3 Taxation or fees
Introducing taxes to plastic bag consumption is different than charging a fee. The first
will usually consist in an imposition of taxes at a retailer level, which will eventually be
paid indirectly by the consumers. The second consists of a fee that is charged directly to
the consumer at the counter. In any case, Poortinga et al (2012) suggest that voluntary
actions are half as effective as fees in order to reduce single-use plastic bag consumption
and that, in England, 54% of the population is in favor for a plastic bag charge.
3. Materials and methods
In order to reflect the most accurately possible the social perceptions of the Balinese
population regarding single-use plastic consumption, a questionnaire (see Appendices III
and IV) in Indonesian was selected as the most suitable method. This method is
appropriate for collecting data with large number of respondents in many locations, when
the information required from the respondents is fairly brief and uncontroversial, the
research requires standardized data, the respondents are able to understand the questions
once considered factors like age and language, and the social climate is open enough to
receive honest answers (Denscombe, 2010, p. 156).
17
The characteristics of this research required a method that allows the collection of
quantitative data at the same time that provides opportunity to gather some qualitative
data. Thus, the questionnaire consisted of close-ended questions with some of them
containing an “other” or similar option to serve as open-ended questions. The first type
provide standardized, pre-coded answers and data accuracy and the second allows for
more scope for respondents to give answers that reflect better their real opinion
(Denscombe, 2010, p. 165-166). The questions consisted of dichotomous, multiple choice
and Likert scale ones, where considered suitable.
The software Microsoft Word 2013 was used for the creation of the questionnaire and
Microsoft Excel 2013 for the tabulation of data and creation of graphs was considered
appropriate.
3.1 Questionnaire structure
The questionnaire consisted of 17 questions divided into four parts, which measured:
Part I. Background information (questions 1-3)
Part II. Consumption behavior (questions 4,5,7,9 and 10)
Part III. Environmental impacts awareness (questions 13-15)
Part IV. Willingness to reduce consumption (questions 6, 8, 11, 12, 16 and 17)
Some questions focused specifically in plastic bags, while other in plastic bottles.
However, there was a series of questions that contemplated both products in a single
question, since it concerned the two single-use plastics.
Before handing the final questionnaire among potential respondents, 15 questionnaires
were handed to a test group which, after having filled them up, provided valuable
feedback. Corrections were made regarding the overall length of the questionnaire and
several questions less relevant to the research were excluded while others were
reformulated. The 15 responses gathered from the test group were not included in the total
for the final questionnaire.
18
Instructions at the beginning of the questionnaire were facilitated, which included a short
description of the purpose of it and a confidentiality statement. The language used in the
survey was easy to understand and questions were formulated as short as possible to avoid
loss of interest from the respondents. Indonesian was chosen as the most suitable
language.
3.2. Location
The questionnaire took place in three different supermarkets around Bali: Carrefour,
Hypermart and Hardy’s. The first two are located in Kuta area, while the last one is in
Nusa Dua. The reasons for choosing these three supermarkets are due to the fact that these
are among the largest commercial centers or supermarkets in Bali, with high affluence of
customers. This fact probably contributed to obtain higher responses rates, even though
it would have been equally valid to obtain responses from any person who consumed
plastic bottles or bags, independently that they were present where the actual consumption
of these occurs.
As a subjective observation, it was noticed that, although in general in Carrefour the
number of customers was higher than in the other two establishments, there was a more
“rushy” atmosphere and less responses were gathered there. On the contrary, at the
entrance of Hypermart and Hardy’s there were benches and less customers around so
people seemed more keen to participate in a more relaxed atmosphere. Two other large
supermarkets, whose names have been preferred to be omitted in this report, were targeted
for questionnaire sampling. Nevertheless, permission to distribute the surveys among
their customers was denied by the management of the respective establishments.
The questionnaire was handed personally during 7 days on the afternoons, when more
affluence of customers was found. The nature of this research implied an ample target
group, which essentially includes any Balinese that consumes plastic bottles or bags.
Thus, efforts were made to distribute the questionnaire among persons of all ages and
gender, aiming to gather the greatest variety of responses possible.

19
4. Results
4.1 Background information
Figure 2. Gender of respondents Figure 3. Age of respondents
In total, 102 responses were obtained from the questionnaire distribution process. Among
all the respondents 55% were male and 45% female (Figure 2). Efforts were made to
hand out the questionnaires equitably within the potential respondents in order to gain
representativeness from both genders and all age groups. Figure 3 illustrates that the
highest number of responses were from people under 25 years old (37%). Respondents
between 25 and 35 years old correspond to the 31% of the samples, followed by 21%
between 36 and 45 years old and then, 8% between 46 and 55 years old. The last group
represents the respondents over 55 years old, with only 3% of the total.
Figure 4. Educational level of respondents
55%
45%
1. What is your gender?
Male
Female
37%
31% 21%
8%
3%
2. What is your age?
< 2525-3536-4546-55> 55
4%5%
44%
45%
1%
1%
3. What is your educational level?
Elementary school
Junior high school
Senior high school
University
Other
No response

20
As Figure 4 shows, almost half of the respondents (45%) had attended to University and
44% of the respondents had attended to Senior high school. Regarding the rest of them,
5% attended to Junior high school, 4% to Elementary school, 1% to other type of
education (no specification given) and 1% did not respond.
4.2 Consumption behavior
Figure 5. Beverage packaging size preferences
Question 4 was asked in order to explore Balinese’s preferences regarding the bottle size
of the drinks when buying drinks “for home”. It is emphasized the fact of buying for home
since it is assumed that, in general, beverage consumers that buy to drink “on the way”
probably prefer a smaller bottle for mainly two reasons: a) they usually do not want to
carry a larger, heavier bottle if they plan to drink it at the moment; and b) they most likely
do not want to consume large amounts of a drink which is intended to be consumed in
several servings.
This being clarified, 58% of the respondents preferred to buy a bigger bottle against 37%
that would rather buy smaller ones instead. Only 1% did not know and 2% was indifferent.
The rate of no responses stayed low at 2% (Figure 5).
37%
58%
1%
2%
2%
4. When buying drinks for home, do you prefer to buy a bigger bottle or smaller ones?
Smaller bottles
Bigger bottle
I do not know
I do not care
No response
21
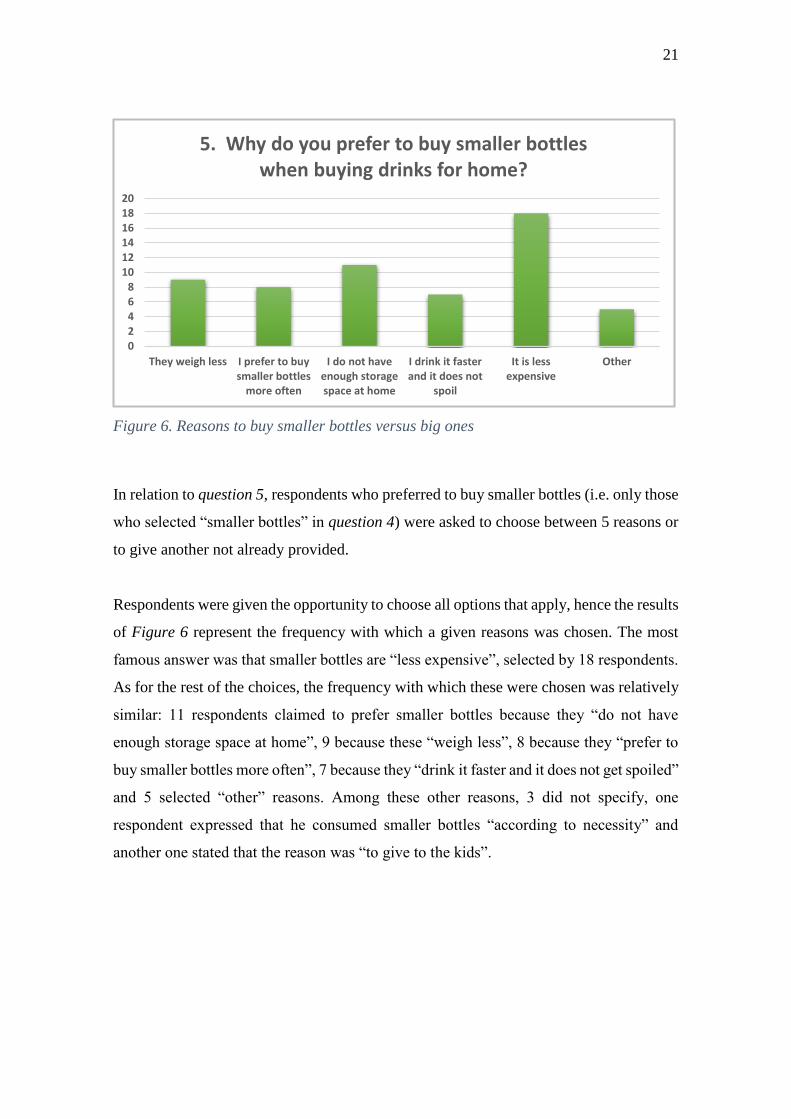
Figure 6. Reasons to buy smaller bottles versus big ones
In relation to question 5, respondents who preferred to buy smaller bottles (i.e. only those
who selected “smaller bottles” in question 4) were asked to choose between 5 reasons or
to give another not already provided.
Respondents were given the opportunity to choose all options that apply, hence the results
of Figure 6 represent the frequency with which a given reasons was chosen. The most
famous answer was that smaller bottles are “less expensive”, selected by 18 respondents.
As for the rest of the choices, the frequency with which these were chosen was relatively
similar: 11 respondents claimed to prefer smaller bottles because they “do not have
enough storage space at home”, 9 because these “weigh less”, 8 because they “prefer to
buy smaller bottles more often”, 7 because they “drink it faster and it does not get spoiled”
and 5 selected “other” reasons. Among these other reasons, 3 did not specify, one
respondent expressed that he consumed smaller bottles “according to necessity” and
another one stated that the reason was “to give to the kids”.
02468
101214161820
They weigh less I prefer to buysmaller bottles
more often
I do not haveenough storagespace at home
I drink it fasterand it does not
spoil
It is lessexpensive
Other
5. Why do you prefer to buy smaller bottles when buying drinks for home?

22
Figure 7. Bottle material preference.
The purpose of question 7 question was to gain further knowledge regarding preferences
of the Balinese population towards plastic bottles, where respondents were given to
choose between different materials for beverage packaging: plastic, glass, can
(aluminum) or cardboard.
Of all the respondents, 45% preferred plastic bottles over other materials, followed by
32% which chose glass bottles instead. Cardboard bricks accounted for the 13% of the
responses, cans for the 4% and 6% did not respond to the question (Figure 7).
Figure 8. Number of plastic bags consumed per week
With aims to understand plastic bags consumption behaviors of the Balinese population,
question 9 was included in the questionnaire. The number of plastic bags used by the each
individual is a major factor in determining the behavior towards single-use plastic
consumption.
32%
45%
4%13%
6%
7. If the same drink is offered in different packages, I would buy the one in:
Glass bottles
Plastic bottle
Can
Cardboard brick
No response
2%28%
32%
9%18%
11%
9. How many plastic bags do you use per week?
None< 55 to 10> 10I do not know

23
In Figure 8 the responses are divided into 5 different groups in addition to the “no
response” one. Only 2% of the respondents claimed that they used “none” plastic bags.
At the same time, at least 28% uses less than 5 bags per week but the greater part of the
responses corresponds to consumers of between 5 and 10 plastic bags per week (32%). In
regards with those participants that consume more than 10 bags per week, 9 of them (9%)
selected this option. A fairly large part of the respondents (18%) did not know how many
bags the used and 11% did not respond at all.
Figure 9. Plastic bag usage
Almost half of the respondents (49%) claimed to reuse all of the plastic bags after they
have used them for carrying their shopping home (Figure 9), which is the main purpose
of single-use plastic bags. Moreover, 17% of the respondents confirmed that they “reuse
some and throw some away”, without delving into the quantity of bags that are reused
and discarded respectively. Only 11% throw all of them away, i.e. they did not reuse the
bags under any circumstances.
The option “I sell them” was included in the final questionnaire after receiving feedback
from the test group, where 2 out of 15 respondents assured that they occasionally sell the
plastic bags to “neighbors or whoever might need them”. The fact that more than a single
respondent answered that they sell the bags was considered a justifying factor to create a
new category on its own, instead of considering them as “other” answers. However, only
1% of the respondents in the final questionnaire affirmed that they sell the bags (Figure
9), making it a fairly uncommon practice.
11%
17%
49%
1%2%20%
10. What do you do with the plastic bags once you have used them for carrying your shopping home?
I throw them away
I reuse some and throwsome awayI reuse all of them
I sell them
Other
No response

24
Among other practices carried out by the respondents, one of them assured that he/she
“use[s] them to make crafts”, and another one did not give an explanation but also selected
“other” between the options. This two respondents accounted for 2% of the sample. The
no-response rate reaches the 20% (Figure 9).
4.3 Environmental impacts awareness
Figure 10. Environmental impacts awareness
The purpose of question 13 was to verify whether respondents believe that single-use
plastic can have negative environmental impacts and, if affirmative, to identify which
ones they believe to be harmful. The respondents, apart from the options “no” and “I do
not know”, they were given the chance to choose between three other options that already
included three interrelated, yet independent, environments susceptible to plastic pollution
(forests, rivers and oceans). Furthermore, a last option called “Yes. Other” was included
to reflect the respondent’s acknowledgment of the possibility for plastics to harm the
Environment, but also to give opportunity to express his/her opinion on other impacts not
considered.
The numbers on the left side of Figure 10 represent the frequency that a given answer is
chosen and the most frequented answer was that rivers are contaminated, which was
selected 45 times. In second place, ocean pollution was chosen as one of the negative
0
10
20
30
40
50
No I do not know Yes. Rivers arepolluted
Yes. Oceans arepolluted
Yes. Forests arepolluted
Yes. Other
13. Do you think that single-use plastics (bottles and bags) can harm the Environment?
25
impacts, with 42 responses. Moreover, at least 28 respondents believe that forests are
polluted by single-use plastics. Among other impacts (21) not pre-defined within the
options at least 8 respondents believed that “the land is contaminated”, another one agreed
that pollution occurs but claimed that “it cannot be analyzed” and the rest also agreed on
it but did not explain further. On the other hand, 9 respondents believed that single-use
plastics are not harmful to the Environment while one did not know.
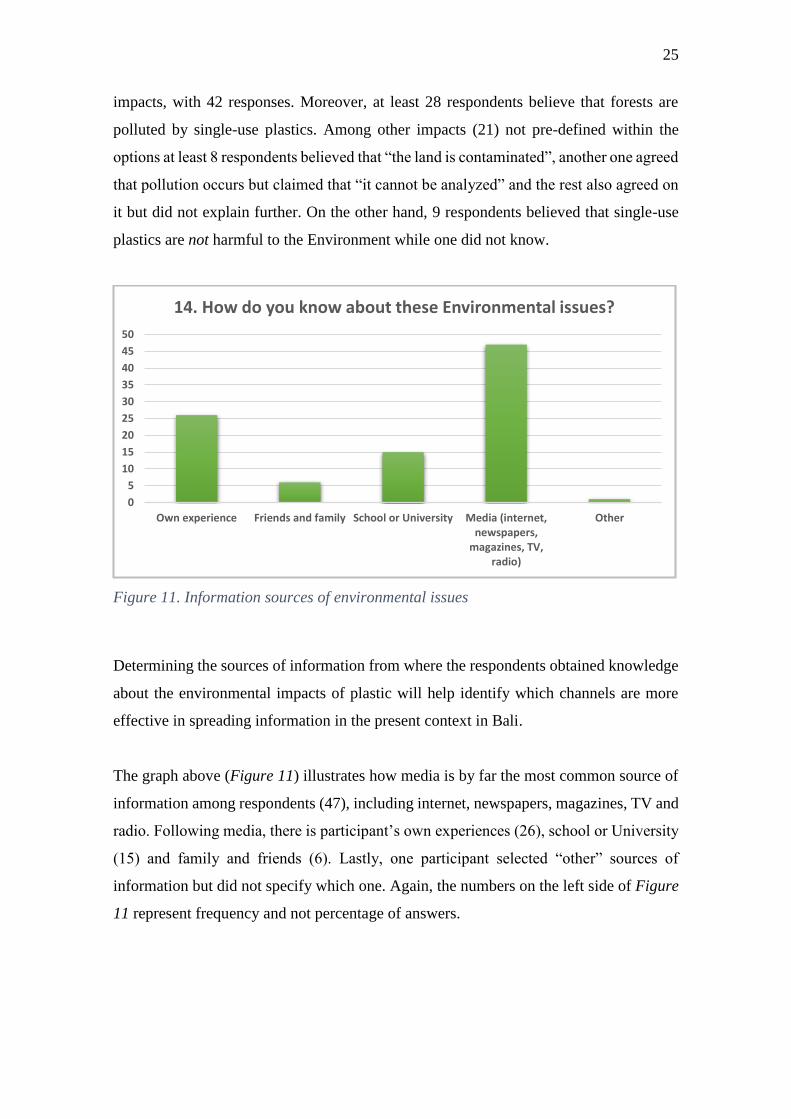
Figure 11. Information sources of environmental issues
Determining the sources of information from where the respondents obtained knowledge
about the environmental impacts of plastic will help identify which channels are more
effective in spreading information in the present context in Bali.
The graph above (Figure 11) illustrates how media is by far the most common source of
information among respondents (47), including internet, newspapers, magazines, TV and
radio. Following media, there is participant’s own experiences (26), school or University
(15) and family and friends (6). Lastly, one participant selected “other” sources of
information but did not specify which one. Again, the numbers on the left side of Figure
11 represent frequency and not percentage of answers.
0
5
10
15
20
25
30
35
40
45
50
Own experience Friends and family School or University Media (internet,newspapers,
magazines, TV,radio)
Other
14. How do you know about these Environmental issues?
26
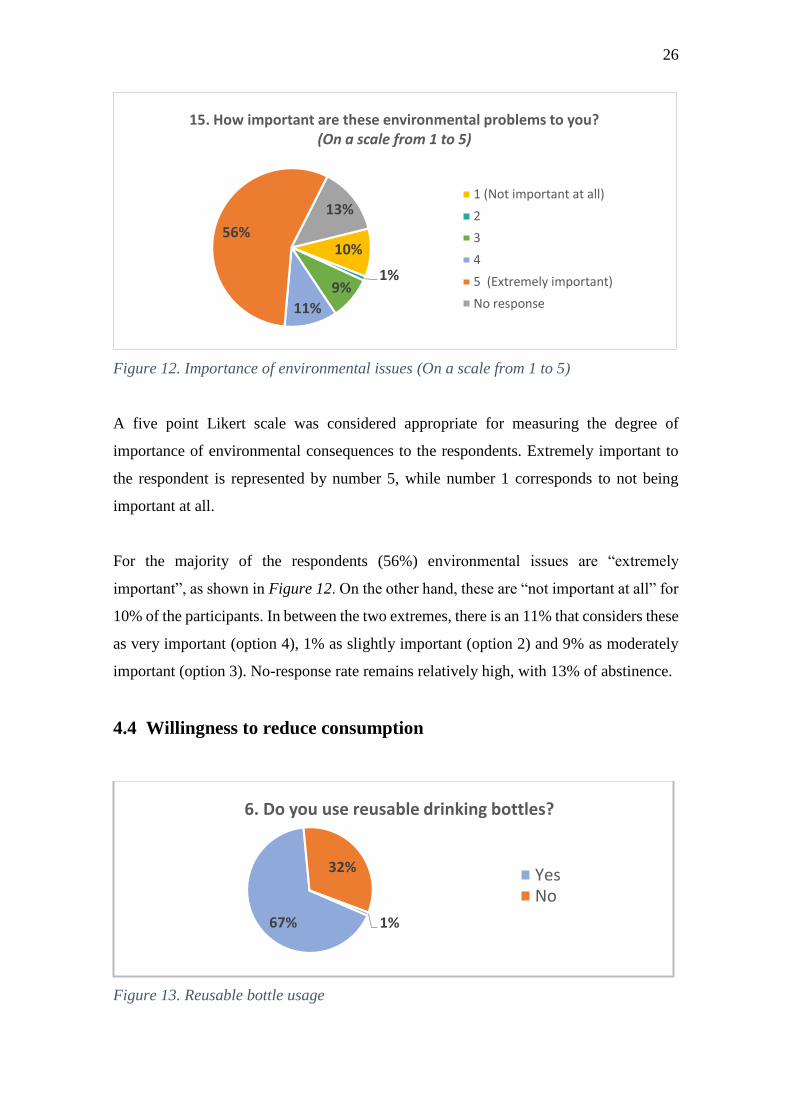
Figure 12. Importance of environmental issues (On a scale from 1 to 5)
A five point Likert scale was considered appropriate for measuring the degree of
importance of environmental consequences to the respondents. Extremely important to
the respondent is represented by number 5, while number 1 corresponds to not being
important at all.
For the majority of the respondents (56%) environmental issues are “extremely
important”, as shown in Figure 12. On the other hand, these are “not important at all” for
10% of the participants. In between the two extremes, there is an 11% that considers these
as very important (option 4), 1% as slightly important (option 2) and 9% as moderately
important (option 3). No-response rate remains relatively high, with 13% of abstinence.
4.4 Willingness to reduce consumption
Figure 13. Reusable bottle usage
10%
1%9%
11%
56%
13%
15. How important are these environmental problems to you?(On a scale from 1 to 5)
1 (Not important at all)
2
3
4
5 (Extremely important)
No response
67%
32%
1%
6. Do you use reusable drinking bottles?
YesNo

27
Approximately two thirds of the respondents assured that they use reusable drinking
bottles (67%), while 32% denied making use of them. Only 1% of the participants did not
respond to this question (Figure 13).
Figure 14. Returnable bottle system acceptance
Identifying willingness of Balinese to return the plastic bottles to a store or supermarket
in exchange of some of the money they paid for these will help determine whether it
would be feasible or not to introduce a returnable bottle system with container deposits
in the island.
Results in Figure 14 illustrate how 42% of the respondents would be willing to return
their bottles to the supermarket if they received “some of the money” back. Furthermore,
16% would “maybe” accept to return these, 8% would do depending on the amount of
money received back and 1% did not give an explanation to “depends on (specify)”. On
the contrary, 30% of the participants would not return the bottles to the supermarket.
42%
30% 16%
8%
1%
3%
8. Would you take back your empty bottle to the supermarket if these returned you some of the money that you paid for it?
Yes
No
Maybe
Depends on the amount ofmoney I would get backDepends on (specify)
No response
28
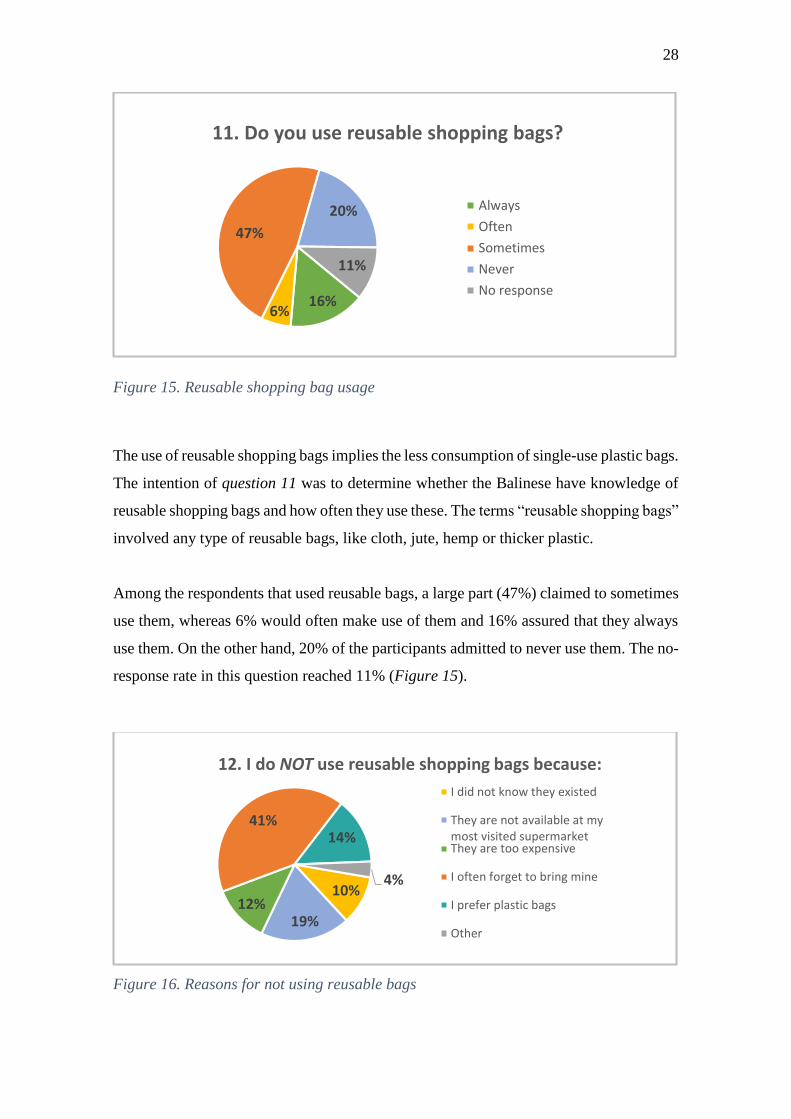
Figure 15. Reusable shopping bag usage
The use of reusable shopping bags implies the less consumption of single-use plastic bags.
The intention of question 11 was to determine whether the Balinese have knowledge of
reusable shopping bags and how often they use these. The terms “reusable shopping bags”
involved any type of reusable bags, like cloth, jute, hemp or thicker plastic.
Among the respondents that used reusable bags, a large part (47%) claimed to sometimes
use them, whereas 6% would often make use of them and 16% assured that they always
use them. On the other hand, 20% of the participants admitted to never use them. The no-
response rate in this question reached 11% (Figure 15).
Figure 16. Reasons for not using reusable bags
16%6%
47%
20%
11%
11. Do you use reusable shopping bags?
Always
Often
Sometimes
Never
No response
10%
19%12%
41%14%
4%
12. I do NOT use reusable shopping bags because:
I did not know they existed
They are not available at mymost visited supermarketThey are too expensive
I often forget to bring mine
I prefer plastic bags
Other

29
Understanding the reasons for not utilizing reusable bags is of significant importance to
this research, since encouraging the further use of them by Balinese is one of the key
recommendations to reduce plastic bags consumption.
In Figure 16 it is shown the reasons for not using reusable bags and the most common is
that respondent’s often forget to bring their own to the store (28%). Followed by this,
15% of them stated that reusable bags are not available at their most visited supermarket,
9% prefer to use plastic bags, 8% responded that these are too expensive and 7% is
unaware of the existence of these type of bags.
On open answer was provided with the option “other” but no responses were obtained in
this category. Regarding the rate of no responses, this question obtained the highest rate
within the questionnaire (33%).
Figure 17. Willingness to reduce single-use plastic consumption
When respondents were directly asked if they are willing to reduce the amount of plastics
that they consume 73% agreed to do so for both bags and bottles (Figure 17). Roughly
8% would like to reduce only their plastic bags consumption and 1% only plastic bottles.
On the contrary, 2% of the participants would not like to reduce it and another 2% do not
believe it is feasible. No response rate obtained is 14%.
73%
2%2%
1%
8%14%
16. Would you like to reduce your consumption of plastic bottles and bags?
Yes, of both of them
No
I do not think it is possible
Only plastic bottles
Only plastic bags
No response
30
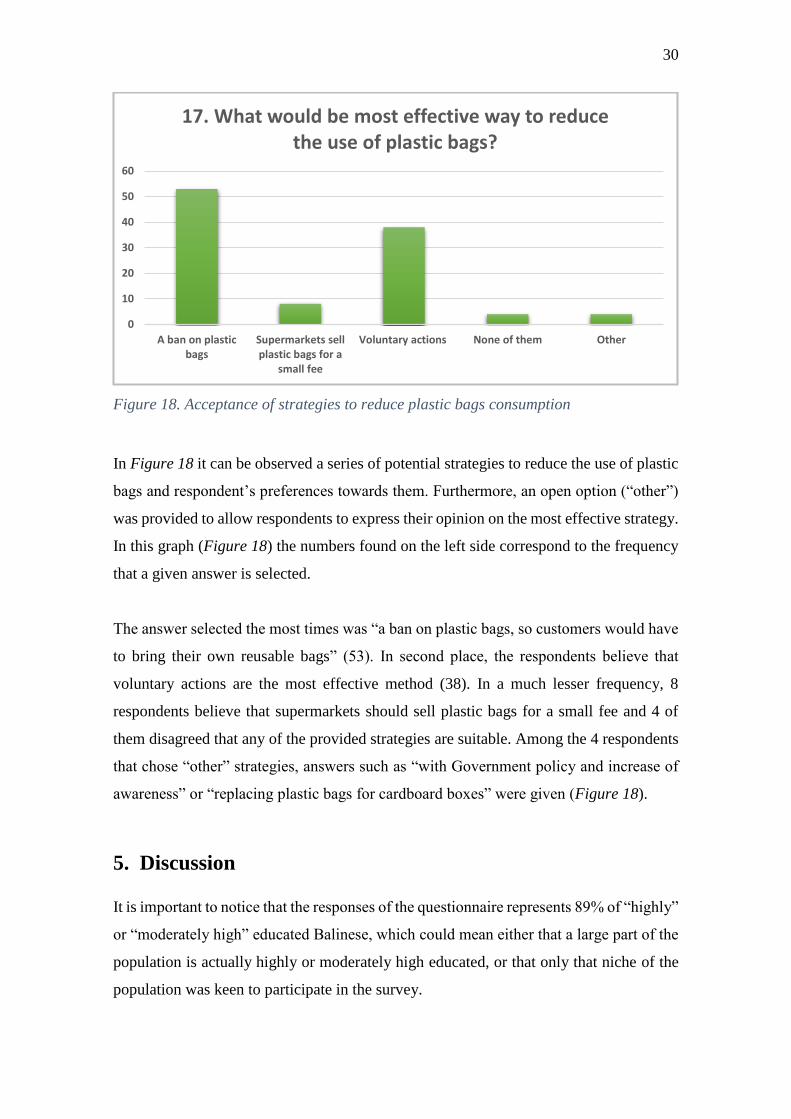
Figure 18. Acceptance of strategies to reduce plastic bags consumption
In Figure 18 it can be observed a series of potential strategies to reduce the use of plastic
bags and respondent’s preferences towards them. Furthermore, an open option (“other”)
was provided to allow respondents to express their opinion on the most effective strategy.
In this graph (Figure 18) the numbers found on the left side correspond to the frequency
that a given answer is selected.
The answer selected the most times was “a ban on plastic bags, so customers would have
to bring their own reusable bags” (53). In second place, the respondents believe that
voluntary actions are the most effective method (38). In a much lesser frequency, 8
respondents believe that supermarkets should sell plastic bags for a small fee and 4 of
them disagreed that any of the provided strategies are suitable. Among the 4 respondents
that chose “other” strategies, answers such as “with Government policy and increase of
awareness” or “replacing plastic bags for cardboard boxes” were given (Figure 18).
5. Discussion
It is important to notice that the responses of the questionnaire represents 89% of “highly”
or “moderately high” educated Balinese, which could mean either that a large part of the
population is actually highly or moderately high educated, or that only that niche of the
population was keen to participate in the survey.
0
10
20
30
40
50
60
A ban on plasticbags
Supermarkets sellplastic bags for a
small fee
Voluntary actions None of them Other
17. What would be most effective way to reduce the use of plastic bags?
31
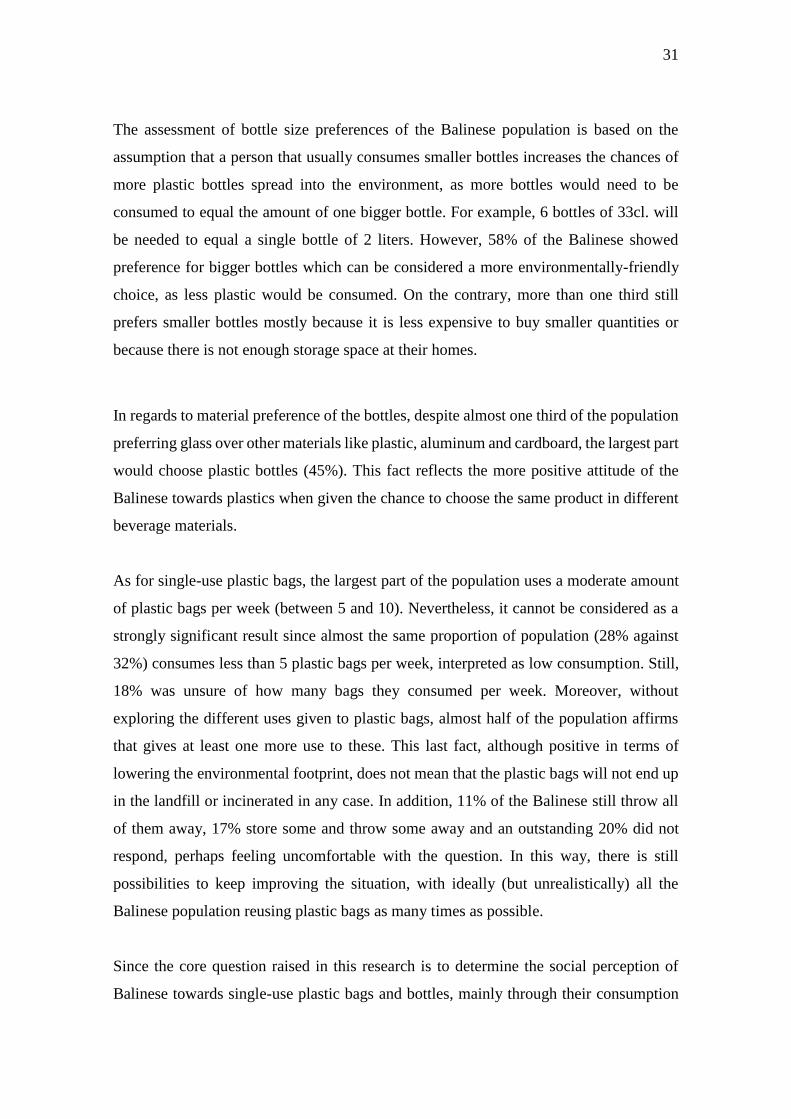
The assessment of bottle size preferences of the Balinese population is based on the
assumption that a person that usually consumes smaller bottles increases the chances of
more plastic bottles spread into the environment, as more bottles would need to be
consumed to equal the amount of one bigger bottle. For example, 6 bottles of 33cl. will
be needed to equal a single bottle of 2 liters. However, 58% of the Balinese showed
preference for bigger bottles which can be considered a more environmentally-friendly
choice, as less plastic would be consumed. On the contrary, more than one third still
prefers smaller bottles mostly because it is less expensive to buy smaller quantities or
because there is not enough storage space at their homes.
In regards to material preference of the bottles, despite almost one third of the population
preferring glass over other materials like plastic, aluminum and cardboard, the largest part
would choose plastic bottles (45%). This fact reflects the more positive attitude of the
Balinese towards plastics when given the chance to choose the same product in different
beverage materials.
As for single-use plastic bags, the largest part of the population uses a moderate amount
of plastic bags per week (between 5 and 10). Nevertheless, it cannot be considered as a
strongly significant result since almost the same proportion of population (28% against
32%) consumes less than 5 plastic bags per week, interpreted as low consumption. Still,
18% was unsure of how many bags they consumed per week. Moreover, without
exploring the different uses given to plastic bags, almost half of the population affirms
that gives at least one more use to these. This last fact, although positive in terms of
lowering the environmental footprint, does not mean that the plastic bags will not end up
in the landfill or incinerated in any case. In addition, 11% of the Balinese still throw all
of them away, 17% store some and throw some away and an outstanding 20% did not
respond, perhaps feeling uncomfortable with the question. In this way, there is still
possibilities to keep improving the situation, with ideally (but unrealistically) all the
Balinese population reusing plastic bags as many times as possible.
Since the core question raised in this research is to determine the social perception of
Balinese towards single-use plastic bags and bottles, mainly through their consumption
32
habits, the researcher can conclude that Balinese seem to have a more negative perception
of single-use plastics rather than positive. For example, they prefer to consume bigger
bottles, their plastic bag usage is low-moderate in general and roughly half the population
reuses them at least once. At this point, it is still unclear whether environmental concerns
are the motivating factor for this general negative perception but the fact that
environmental issues are “extremely important” for the majority (56%) of the population
suggests that this is the case. On the other hand, there is still a relatively fair proportion
of the population whose habits are more directed towards a positive perception regarding
plastics. Therefore, it can only be concluded with certainty that consumption habits can
still be changed for that part of the population in order to keep improving the situation.
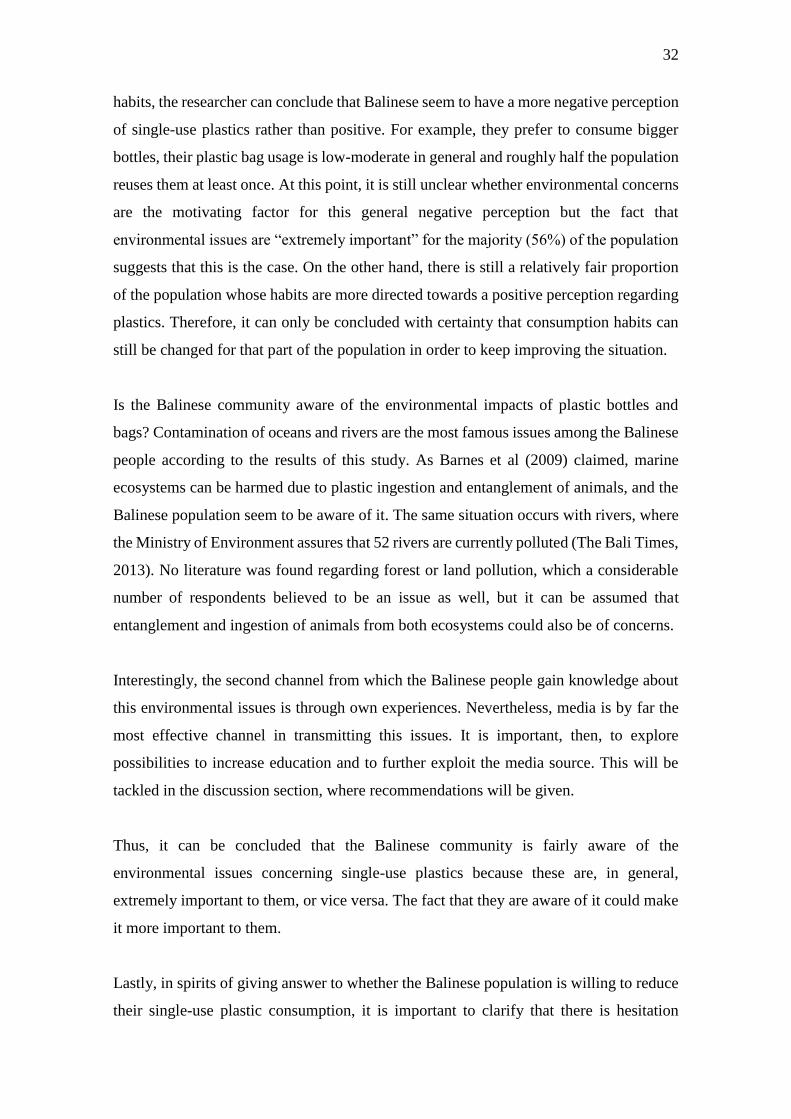
Is the Balinese community aware of the environmental impacts of plastic bottles and
bags? Contamination of oceans and rivers are the most famous issues among the Balinese
people according to the results of this study. As Barnes et al (2009) claimed, marine
ecosystems can be harmed due to plastic ingestion and entanglement of animals, and the
Balinese population seem to be aware of it. The same situation occurs with rivers, where
the Ministry of Environment assures that 52 rivers are currently polluted (The Bali Times,
2013). No literature was found regarding forest or land pollution, which a considerable
number of respondents believed to be an issue as well, but it can be assumed that
entanglement and ingestion of animals from both ecosystems could also be of concerns.
Interestingly, the second channel from which the Balinese people gain knowledge about
this environmental issues is through own experiences. Nevertheless, media is by far the
most effective channel in transmitting this issues. It is important, then, to explore
possibilities to increase education and to further exploit the media source. This will be
tackled in the discussion section, where recommendations will be given.
Thus, it can be concluded that the Balinese community is fairly aware of the
environmental issues concerning single-use plastics because these are, in general,
extremely important to them, or vice versa. The fact that they are aware of it could make
it more important to them.
Lastly, in spirits of giving answer to whether the Balinese population is willing to reduce
their single-use plastic consumption, it is important to clarify that there is hesitation
33
regarding the validity of question 6 (“Do you use reusable drinking bottles?”). The
reasons to suggest this is because the Indonesian version of the survey translates the terms
as “bottles that can be reused” instead of “reusable bottles”. This might not seem an
important difference but it could be if it is taken into account that “reusable bottles” was
intended to be understood as bottles than can be reused many times and not single-use
bottles that are used more than once, which is not recommended due to higher risks of
BPA leaching (Ellsbury, 2012). Therefore, it is not clear which of the two options
respondents understood and, in this way, there is a possibility of misinterpreting results
since an unexpected 67% of the population claimed to use reusable drinking bottles.
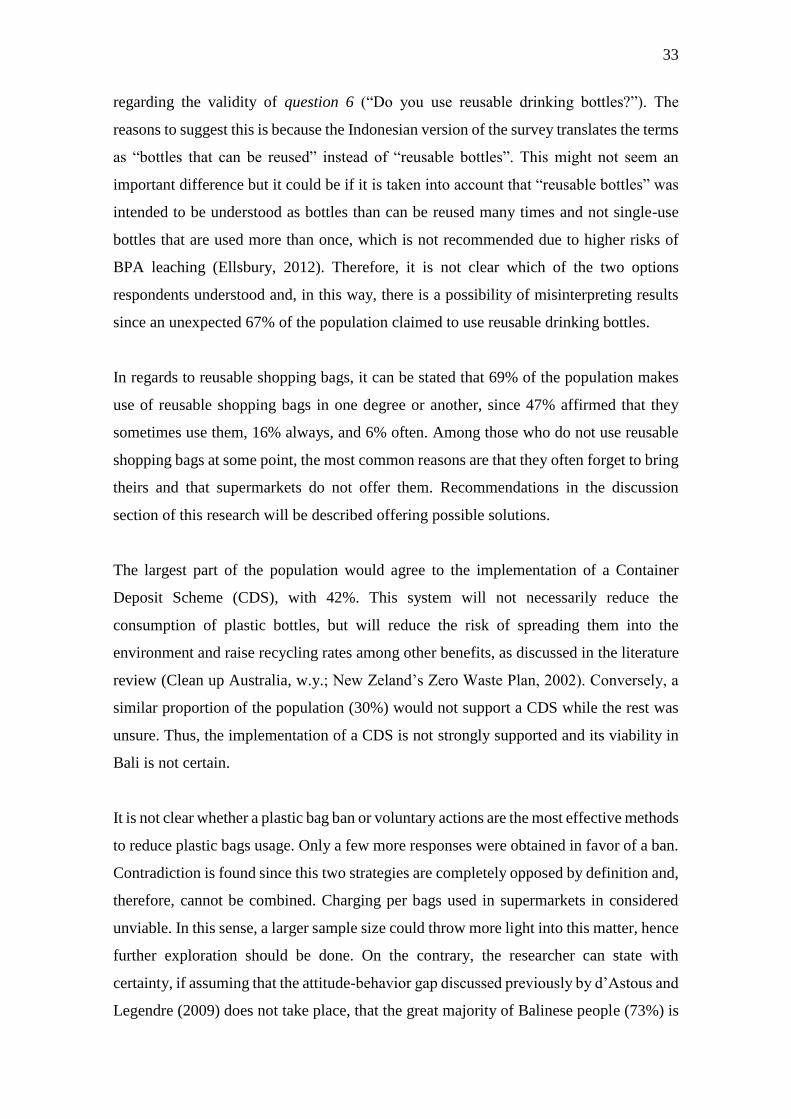
In regards to reusable shopping bags, it can be stated that 69% of the population makes
use of reusable shopping bags in one degree or another, since 47% affirmed that they
sometimes use them, 16% always, and 6% often. Among those who do not use reusable
shopping bags at some point, the most common reasons are that they often forget to bring
theirs and that supermarkets do not offer them. Recommendations in the discussion
section of this research will be described offering possible solutions.
The largest part of the population would agree to the implementation of a Container
Deposit Scheme (CDS), with 42%. This system will not necessarily reduce the
consumption of plastic bottles, but will reduce the risk of spreading them into the
environment and raise recycling rates among other benefits, as discussed in the literature
review (Clean up Australia, w.y.; New Zeland’s Zero Waste Plan, 2002). Conversely, a
similar proportion of the population (30%) would not support a CDS while the rest was
unsure. Thus, the implementation of a CDS is not strongly supported and its viability in
Bali is not certain.
It is not clear whether a plastic bag ban or voluntary actions are the most effective methods
to reduce plastic bags usage. Only a few more responses were obtained in favor of a ban.
Contradiction is found since this two strategies are completely opposed by definition and,
therefore, cannot be combined. Charging per bags used in supermarkets in considered
unviable. In this sense, a larger sample size could throw more light into this matter, hence
further exploration should be done. On the contrary, the researcher can state with
certainty, if assuming that the attitude-behavior gap discussed previously by d’Astous and
Legendre (2009) does not take place, that the great majority of Balinese people (73%) is
34
willing to reduce their consumption of both plastic bottles and bags.
In general, all the results gathered in this study are limited to the relatively short number
of samples (102 responses) considering that these intend to represent the views of the
whole local population in Bali. In this sense, financial and time resources to utilize a
questionnaire that would access to a much larger group are two constraints for this study
that should be taken into account for further research in the future.
6. Conclusions
Bali is experiencing an uncontrolled booming in tourism during the past few years, going
from 1.968.892 tourists in 2008 to 3.766.638 in 2014 (BGTO, 2015). This fact is creating
enormous pressures in the island related to space planning, water resources, energy
resources and increasing pollution. While it is probable that the neighbor island of Java,
the most populated in Indonesia with 58% of the country’s total population 237,424,363
inhabitants (World Population Review, 2014), contribute to the debris arriving to the
Balinese coastline, it is undeniable that internal pressures coming from the local
population also occur as a result of their own development and habits.
The more contaminated and overdeveloped the island is, the less income the local
economy would receive due to less tourist visiting it. Hence, the Government, noticing
such counterproductive development decided to launch the “Bali Clean and Green
Program” in 2010. According to the BCGP (2011) the program aims to make “with all
components of the Balinese people… a clean, healthy, comfortable, sustainable and
beautiful for present and future generations towards the achievement of Bali, an
advanced, secure, peaceful and prosperous” (BCGP, 2011). And to fulfill its goal it thrives
to increase awareness in conservation areas, to carry out a sustainable development and
to maintain a clean and healthy environment (BCGP, 2011).
In line with the goals set by the BCGP, this research ultimately aspires to serve as a source
of information for any interested party, by presenting the actual challenges that the island
is facing in regards to single-use plastics, habits around them and proposing suggestions
for achieving a cleaner Bali.
35
Firstly, more initiatives boosting the use of reusable bags would be highly recommended.
The recycling rates in Indonesia in general are low and, although there are organizations
and private companies developing a recycling infrastructure, this is still hugely
underdeveloped. For this reason, the researcher believes that a focus in reducing and
reusing rather than recycling would be more effective in the short-term given the actual
context. Already some organizations and companies are taking actions towards this. For
instance, Greeneration Indonesia has developed a reusable bag that can be easily folded
and carried, which decreases the chances of forgetting the bag at home (baGOES, 2015).
Moreover, efforts should be made in regards to availability of reusable bags at
supermarkets and stores. Economic incentives could be granted to those supermarkets
that sells reusable bags.
Secondly, the fact that the Balinese people is aware of the environmental problems
through own experience could imply that they are affected directly or that it is something
they often witness. Media sources like internet, television, newspapers and radio should
be used more wisely and provide enough attention to raising awareness. This is, mass
education to drive the local community towards more sustainable practices. In the same
way, environmental education at schools should pay a more important role than it
nowadays does.
The Green School in Bali is a successful example of environmental education from early
stages of human development. Recently, a group of students from that school engaged in
an initiative to implement a plastic bag ban which so far has managed to make Governor
Bapak Made Mangku Pastika “to sign a Memorandum Of Understanding to take measures
that will see the use of plastic bags minimized on Bali by January 1, 2016” (Green School,
2014). However, the results of the present research indicate that, although the Balinese
agree that a plastic bag ban is the most effective strategy to follow, voluntary actions were
considered to be almost equally effective. Then, local consensus needs to be reached with
high community participation in order to develop further one of the strategies.
Lastly, the implementation of a Container Deposit Scheme should still be researched more
thoroughly despite the results obtained in this paper being somewhat favorable. The
division of opinions did not allow to strongly conclude that the Balinese community
36
would agree on a CDS. However, increasing knowledge among the population about the
benefits of this system and other types of incentives, like discounts in the total purchase,
could imply higher acceptance. A CDS could provide a formal bottle recycling
infrastructure that would substitute the current informal sector (Chaerul et al, 2006).
All in all, these recommendations previously mentioned would contribute to steer the
Balinese sociality towards more sustainable practices with aims to preserve their
environment and own health in line with the island’s economic interests.

37
List of References
American Chemistry Council (ACC) (2015). Lifecycle of a Plastic Product.[Online]
http://plastics.americanchemistry.com/Life-Cycle#production [Retrieved: 10 April 2014]
Andrady A. L. & Neal M. A. (2009). Applications and societal benefits of plastics.
Philosophical Transactions of the Royal Society B 364: 1977–1984.
Arbuthnott K. D. (2008). Education for sustainable development beyond attitude change.
IJSHE 10(2): 152-162
Australian Department of the Environment (DoE) (2008). Plastic Bags. [Online]
http://www.environment.gov.au/node/21324 [Retrieved: 5 April 2015]
baGOES (2015) [Online] http://bagoes.co.id/about-us/ [Retrieved: 25 April 2015]
Bali Clean and Green Program (BCGP) (2011) Bali Clean and Green Provence Program.
[Online] http://balicleanandgreen.blogspot.fi/2011/05/bali-clean-and-green-province-
program.html [Retrieved: 19 April 2015]
Bali Government Tourism Office (2015) The Number of Foreign Tourists Arrival to Bali
By Month 2008-2014. [Online] http://www.disparda.baliprov.go.id/en/Statistics2
[Retrieved: 20 April 2015]
Barnes, D. (2014). The single use carrier bag charge (Scotland) Regulations 2014 for
Scottish Zero Waste Plan.
Barnes, D., Galgani, F., Thompson, R. C. & Barlaz, M. (2009). Accumulation and
fragmentation of plastic debris in global environments. Philosophical Transactions of the
Royal Society B 364: 1985–1998.
Beaty, C. (2015). An Introduction to the Three R’s of Sustainability. Meryland Wildlife
Habitat Council. [Online] http://www.wildlifehc.org/an-introduction-to-the-three-rs-of-
sustainability/ [Retrieved: 27 February 2015]
Because Water (2014) Plastic, Stainless Steel, Aluminum or Glass Water Bottle? [Online]
http://becausewater.org/glass-water-bottle/glass-vs-plastic/ [Retrieved: 20 March 2015]
Becker, C. M., Ayscue, E., Brockett, S. J., Scarola, G., Kelley, T. (2014). Initiating
Sustainable Behavior: Feel Good for Doing Good. Electronic Green Journal, 1(37)
Block, B. (2013) China Reports 66-Percent Drop in Plastic Bag Use. WorldWatch
Institute. [Online] http://www.worldwatch.org/node/6167 [Retrieved: 15 April 2015]
38
Bottle Bill Resource Guide (w.y.) [Online] http://www.bottlebill.org/legislation/world/
[Retrieved: 2 April 2015]
Camann, A; Dragsbaek, K; Krol, S; &Sandgren, J. (2010). Properties, Recycling &
Alternatives to PE Bags. Worcester Polytechnic Institute. [Online]
https://www.wpi.edu/Pubs/E-project/Available/E-project-030510-
145034/unrestricted/Properties,_Recycling_and_Alternatives_to_PE_Bags.pdf
[Retrieved: 7 April 2015]
Chaerul, M., Tanaka, M. & Shekdar, A. V. (2006) Municipal solid waste management in
Indonesia: status and the strategic actions. Journal of the Faculty of Environmental
Science and Technology, Okayama University. Vo1.l2, No,I: 41·49
Clean Up Australia (w.y.). Container Deposit Scheme in a snapshot. [Online]
http://www.cleanup.org.au/au/Whatelsewesupport/container-desposit-snapshot.html
[Retrieved: 20 March 2015]
d’Astous, A., & Legendre, A. (2009). Understanding consumers’ ethical justifications: A
scale for appraising consumers’ reasons for not behaving ethically. Journal of Business
Ethics, 87(2): 255-268.
Denscombe, M. (2010) Good Research Guide: For small-scale social research projects.
4th edition. Berkshire: McGraw-Hill Education
Department of Environmental Protection (2013). Plastic Bags vs. Paper Bags: pros and
cons. Florida, US.
Dilli, R. (2007). Comparison of existing life cycle analysis of shopping bag alternatives.
Sustainability Victoria
Ecomaine (2014). New Poll Finds Consumer Confusion About Plastics Recycling.
[Online] http://www.ecomaine.org/tag/plastic-bags/. [Retrieved: 11 March 2015]
Ellsbury, H. (2012). Think reusable bottles, forget plastic bottled water. [Online]
https://www.banthebottle.net/articles/think-reusable-bottles-forget-plastic-bottled-water/
[Retrieved: 15 March 2015]
Eureka Recycling (2009). Recycling Plastic: Complications & Limitations. [Online]
http://www.eurekarecycling.org/imageupload/file/Recycling_Plastic_Complications201
0.pdf [Retrieved on 16 March 2015]
Euromonitor International (2013). Plastic Products in Indonesia: ISIC 252. [Online]
http://www.euromonitor.com/plastic-products-in-indonesia-isic-252/report [Retrieved: 4
April 2015]
European Bioplastics (2009). “Oxo-biodegradable” Plastics. Position Paper.

39
European Comission Department of Environment (EC DoE) (2011). Plastic Waste:
Ecological and Human Health Impacts.
Global Business Guide Indonesia (2014). Plastic Packaging Opportunities in Indonesia.
[Online]http://www.gbgindonesia.com/en/manufacturing/article/2014/plastic_packaging
_opportunities_in_indonesia.php [Retrieved: 2 April 2015]
Green School (2014) The Governor of Bali Signs MoU with BBPB Team. [Online]
http://greenschool.org/bamboo-news/new/dec-2014/Main-Article#.VUuCWJPmbC4
[Retrieved: 26 April 2015]
Hogaza, M. R. A. (2014). More cities comply with total plastic bag ban. Manila Bulletin.
[Online] http://www.mb.com.ph/more-cities-comply-with-total-plastic-bag-ban/
[Retrieved: 15 April]
Hopewell, J., Dvorak, R. & Kosior, E. (2009) Plastic recycling: challenges and
opportunities. Philosophical Transactions of the Royal Society B 364: 2115–2126.
ICF International (2010). Master Environmental Assessment on Single-Use and Reusable
Bags.
Indonesian Ministry of Environment (MoE) (2005). Indonesia Country Fact Sheet.
Indonesian Ministry of Environment (MoE) (2008). Indonesian Domestic Solid Waste
Statistics Year 2008.
Jambeck, J.R., Geyer, R., Wilcox, C., Siegler, T. R., Perryman, M., Andrady, A.,
Narayan, R., Lavender Law, K. (2015). Plastic waste inputs from land into the ocean
Science 347: 768-771.
Jensen, F. & Danubrata, E. (2014). Indonesia water firm Danone AQUA aims to double
production capacity. Reuters. [Online]
http://www.reuters.com/article/2014/05/07/indonesia-danone-
idUSL3N0NS1FK20140507 [Retrieved: 10 April 2015]
Lajeunesse, S. (2004). Plastic Bags. What's That Stuff?. Vol 82(38): 51
Meidiana, C. & Gamse, T. (2010). Development of Waste Management Practices in
Indonesia. European Journal of Scientific Research ISSN 1450-216X Vol.40 No.2: 199-
210.
New Zeland Zero Waste Plan (2002). Extended Producer Responsibility: Container
Deposit Legislation Report.
Nimbus Project (2013). History of Water Bottles. [Online]
http://www.thenimbusproject.com/?p=1661 [Retrieved: 4 April 2015]

40
Petru, A. (2014). A brief History of The Plastic Bag. Triplepundit. [Online]
http://www.triplepundit.com/2014/11/brief-history-plastic-bag/ [Retrieved: 20 March
2015]
Piazza Research (2012). Consumer Attitudes to the ACT Plastic Bag Ban - Survey 2012
Plastic Industry Trade Association (w.y.). SPI Resin Identification Code - Guide to
Correct Use. [Online]
http://www.plasticsindustry.org/AboutPlastics/content.cfm?ItemNumber=823
[Retrieved: 4 April 2015]
Plastics Europe (2015). Plastics – the Facts 2014/2015: An analysis of European plastics
production, demand and waste data.
Poortinga, W., Whitmarsh, L. & Suffolk, C. (2012). The Introduction of a Single-Use
Carrier Bag Charge in Wales: Attitude Change and Behavioural Spillover Effects. WSA
Working Paper Series ISSN 2050-8522
The Bali Times (2013). Indonesia to Restore Polluted Rivers. [Online]
http://www.thebalitimes.com/2013/04/23/indonesia-to-restore-polluted-rivers/
[Retrieved: 2 April 2015]
Thiermann, K. (2013). Bali: Paradise Lost? The Huffington Post. [Online]
http://www.huffingtonpost.com/kyle-thiermann/bali-paradise-lost_b_4109637.html
[Retrieved: 10 March 2015]
Tolinski, M. (2012). Plastics and sustainability: Towards a Peaceful Coexistence
between Bio-based and Fossil Fuel-based Plastics. New Yersey: Scrivener
Union Panels (2014). AQUA mineral water – a necessity for Indonesia. [Online]
http://www.unionpanels.com/blogs/aqua-mineral-water-%E2%80%93-necessity-
indonesia-0 [Retrieved: 15 March 2015]
United Kingdom Environmental Agency (2006). Life cycle assessment of supermarket
carrier bags: a review of the bags available in 2006
United States NOAA (w.y.). What is the Great Pacific Garbage Patch? [Online]
http://oceanservice.noaa.gov/facts/garbagepatch.html. [Retrieved: 12 April 2015]
Upstream (w.y.). Our Throw-Away Society. [Online]
http://upstreampolicy.org/issues/our-throw-away-society/. [Retrieved: 4 April 2015]
Waste and Resources Action Program (2005). Carrier Bag Usage And Attitudes.
Waste and Resources Action Program (2015). Carrier Bag Usage And Attitudes:
Consumer Research in England
41
Weisfeld, S. (2012). Container Deposit Legislation in Ireland: A proposed deposit and
refund scheme. VOICE Ireland
Wisconsin Department of Natural Resources (2014). Reducing, reusing and recycling
plastic bags and wrap. [Online] http://dnr.wi.gov/topic/recycling/bags.html [Retrieved:
27 February 2015]
World Bank (2015) Statistics on Indonesia. [Online]
http://databank.worldbank.org/data/views/reports/tableview.aspx [Retrieved: 4 April
2015]
World Population Review (2014). Indonesian population review. [Online]
http://worldpopulationreview.com/countries/indonesia-population/ [Retrieved: 20 April
2015]
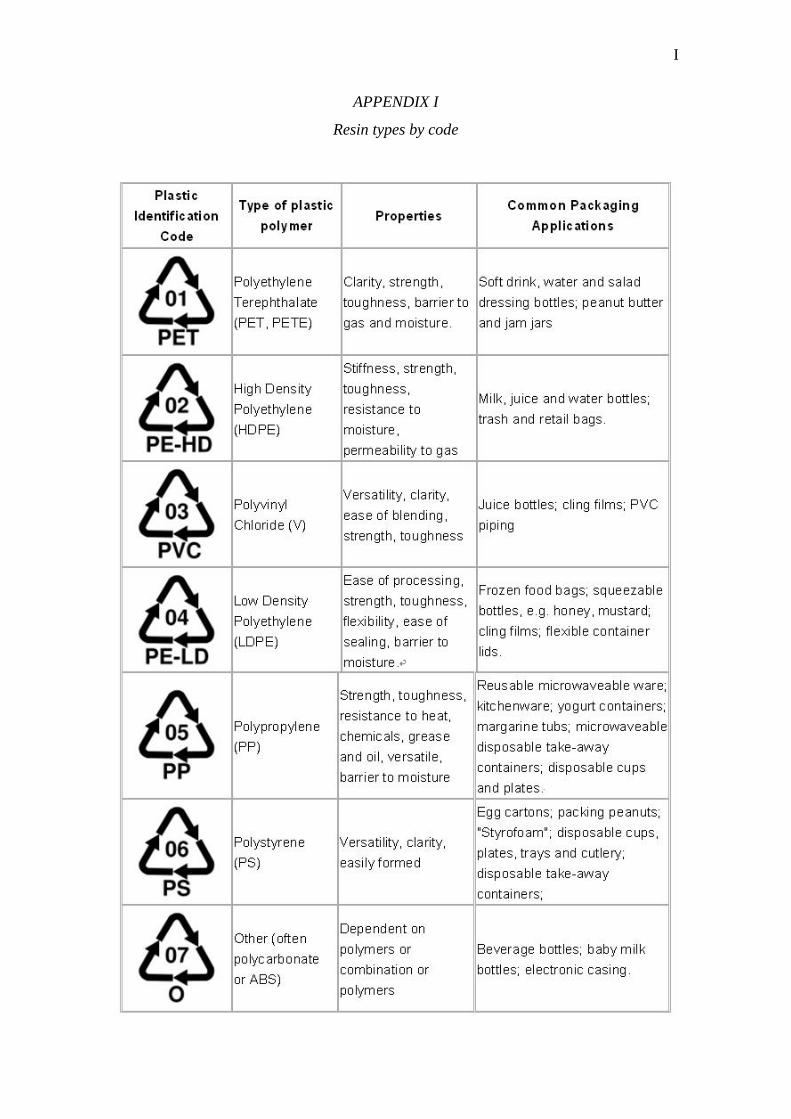
I
APPENDIX I
Resin types by code
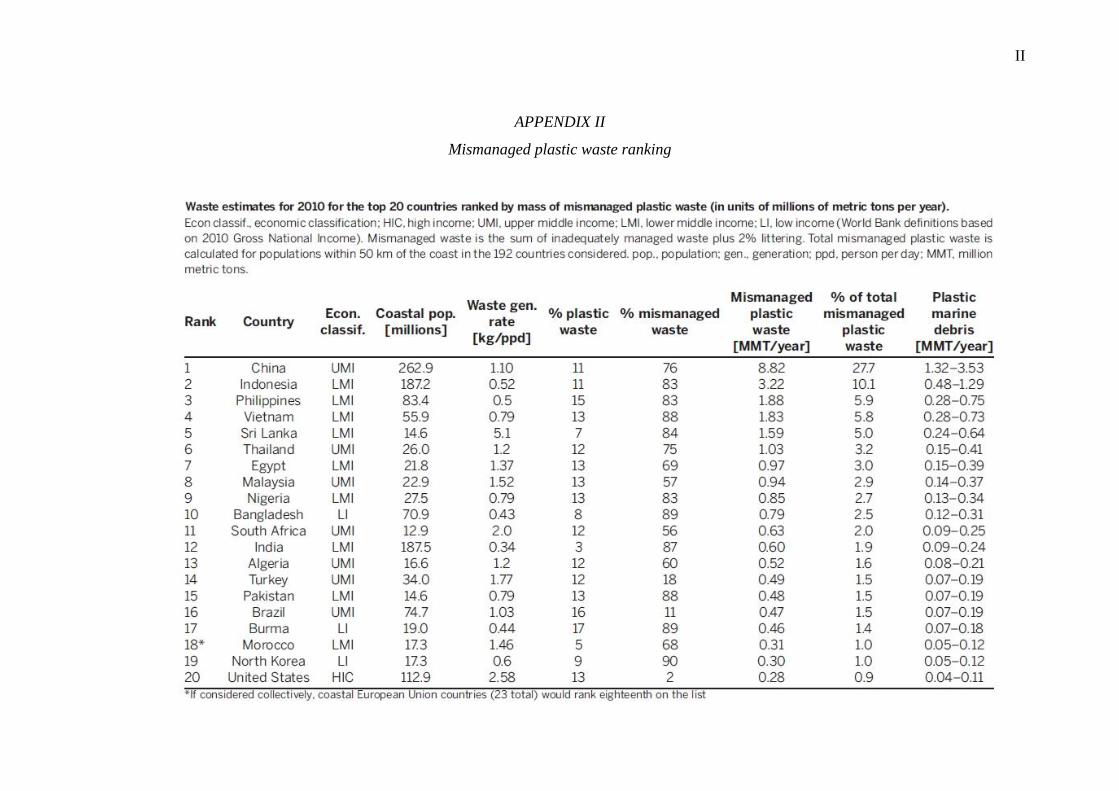
II
APPENDIX II
Mismanaged plastic waste ranking
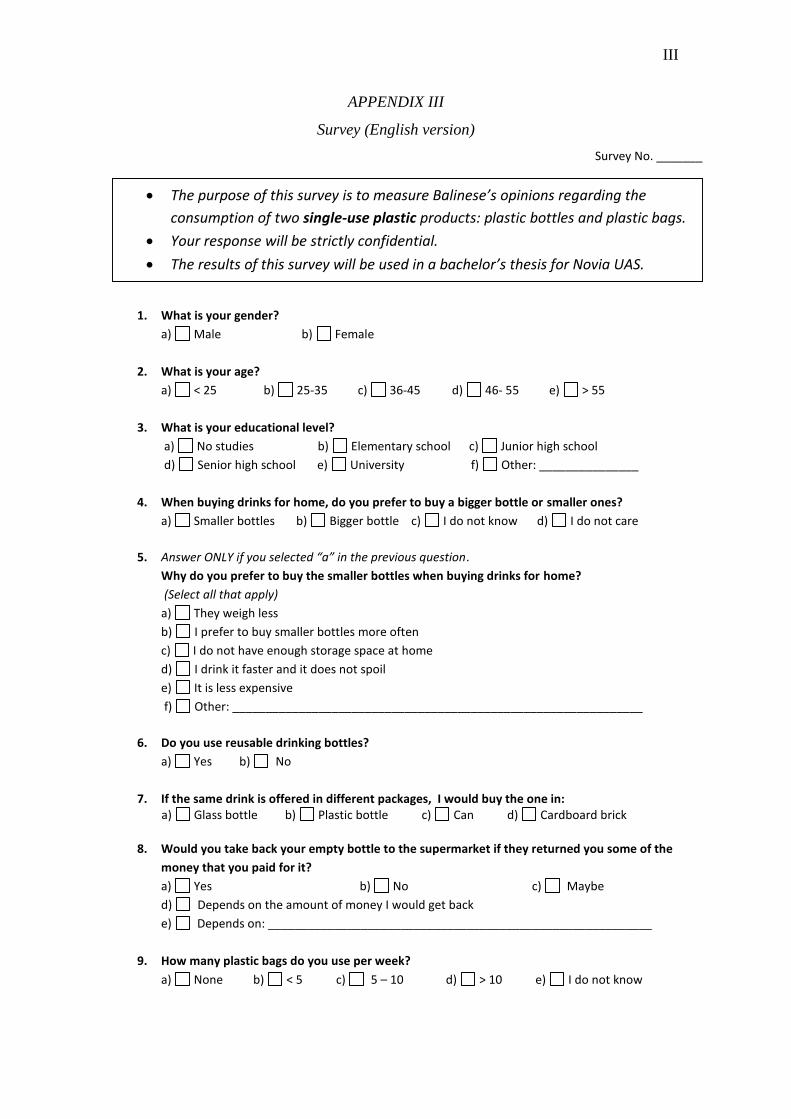
III
APPENDIX III
Survey (English version)
Survey No. _______
1. What is your gender?
a) Male b) Female
2. What is your age?
a) < 25 b) 25-35 c) 36-45 d) 46- 55 e) > 55
3. What is your educational level?
a) No studies b) Elementary school c) Junior high school
d) Senior high school e) University f) Other: _______________
4. When buying drinks for home, do you prefer to buy a bigger bottle or smaller ones?
a) Smaller bottles b) Bigger bottle c) I do not know d) I do not care
5. Answer ONLY if you selected “a” in the previous question.
Why do you prefer to buy the smaller bottles when buying drinks for home?
(Select all that apply)
a) They weigh less
b) I prefer to buy smaller bottles more often
c) I do not have enough storage space at home
d) I drink it faster and it does not spoil
e) It is less expensive
f) Other: ______________________________________________________________
6. Do you use reusable drinking bottles?
a) Yes b) No
7. If the same drink is offered in different packages, I would buy the one in: a) Glass bottle b) Plastic bottle c) Can d) Cardboard brick
8. Would you take back your empty bottle to the supermarket if they returned you some of the
money that you paid for it?
a) Yes b) No c) Maybe
d) Depends on the amount of money I would get back
e) Depends on: __________________________________________________________
9. How many plastic bags do you use per week?
a) None b) < 5 c) 5 – 10 d) > 10 e) I do not know
The purpose of this survey is to measure Balinese’s opinions regarding the
consumption of two single-use plastic products: plastic bottles and plastic bags.
Your response will be strictly confidential.
The results of this survey will be used in a bachelor’s thesis for Novia UAS.
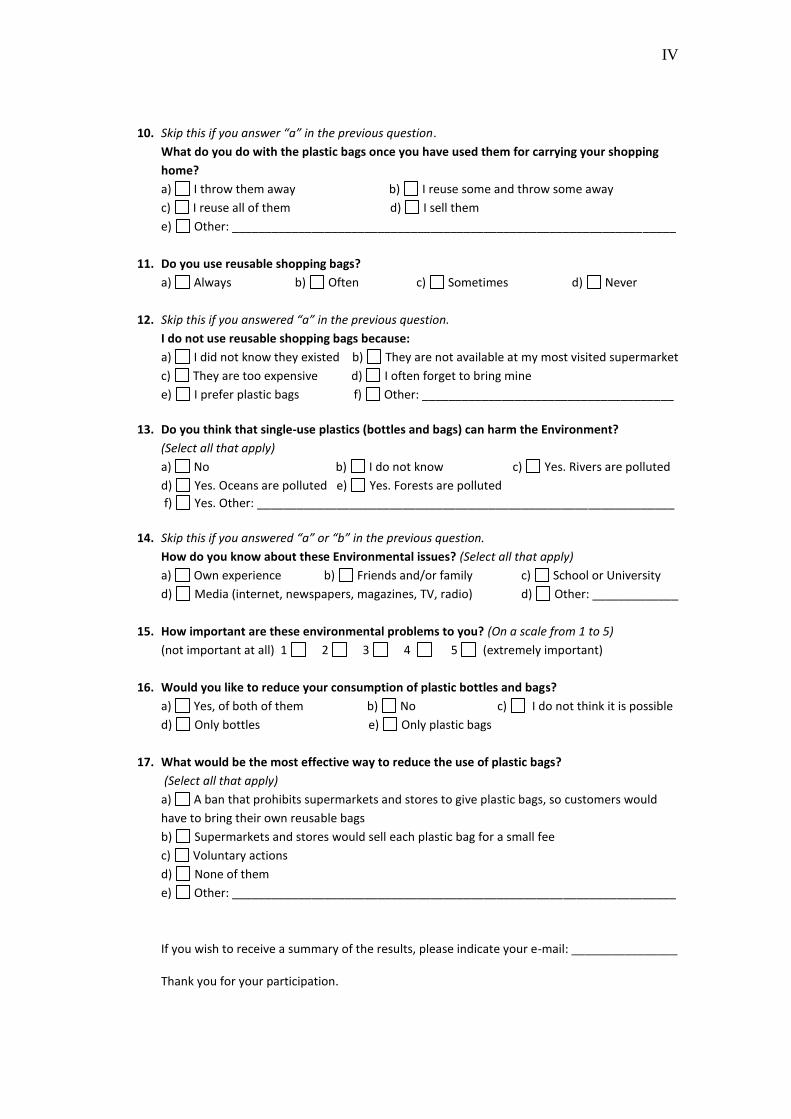
IV
10. Skip this if you answer “a” in the previous question.
What do you do with the plastic bags once you have used them for carrying your shopping
home?
a) I throw them away b) I reuse some and throw some away
c) I reuse all of them d) I sell them
e) Other: ___________________________________________________________________
11. Do you use reusable shopping bags?
a) Always b) Often c) Sometimes d) Never
12. Skip this if you answered “a” in the previous question.
I do not use reusable shopping bags because:
a) I did not know they existed b) They are not available at my most visited supermarket
c) They are too expensive d) I often forget to bring mine
e) I prefer plastic bags f) Other: ______________________________________
13. Do you think that single-use plastics (bottles and bags) can harm the Environment?
(Select all that apply)
a) No b) I do not know c) Yes. Rivers are polluted
d) Yes. Oceans are polluted e) Yes. Forests are polluted
f) Yes. Other: _______________________________________________________________
14. Skip this if you answered “a” or “b” in the previous question.
How do you know about these Environmental issues? (Select all that apply)
a) Own experience b) Friends and/or family c) School or University
d) Media (internet, newspapers, magazines, TV, radio) d) Other: _____________
15. How important are these environmental problems to you? (On a scale from 1 to 5)
(not important at all) 1 2 3 4 5 (extremely important)
16. Would you like to reduce your consumption of plastic bottles and bags?
a) Yes, of both of them b) No c) I do not think it is possible
d) Only bottles e) Only plastic bags
17. What would be the most effective way to reduce the use of plastic bags?
(Select all that apply)
a) A ban that prohibits supermarkets and stores to give plastic bags, so customers would
have to bring their own reusable bags
b) Supermarkets and stores would sell each plastic bag for a small fee
c) Voluntary actions
d) None of them
e) Other: ___________________________________________________________________
If you wish to receive a summary of the results, please indicate your e-mail: ________________ Thank you for your participation.

V
APPENDIX IV
Survey (Indonesian version)
Survei no. ______
1. Apa jenis kelamin Anda? a) Laki-laki b) Perempuan 2. Berapa usia Anda? a) < 25 b) 25-35 c) 36-45 d) 46- 55 e) > 55 3. Apa tingkat pendidikan Anda? a) Tidak pernah sekolah b) Sekolah dasar c) Sekolah Menengah Pertama d) Sekolah Menengah Atas e) Universitas f) Lainnya: ________________ 4. Ketika anda membeli minuman untuk dirumah, apakah Anda lebih memilih untuk membeli botol yang lebih besar atau botol yang lebih kecil? a) Botol kecil b) Botol yang lebih besar c) Tidak tahu d) Tidak peduli 5. Jika Anda memilih opsi “a" pada pertanyaan sebelumnya. Mengapa Anda lebih memilih untuk membeli botol kecil untuk minuman di rumah? (Pilih beberapa opsi berikut dibawah) a) Mereka beratnya kurang b) Saya lebih memilih untuk membeli botol kecil lebih sering c) Saya tidak memiliki ruang penyimpanan yang cukup di rumah d) Saya minum lebih cepat dan minuman tidak merusak e) Hal ini lebih murah f) Lain-lain: ______________________________________________________________________ 6. Apakah anda menggunakan botol minuman yang dapat digunakan kembali? a) Ya b) Tidak 7. Jika minuman yang sama ditawarkan dalam paket yang berbeda, saya akan membeli: a) Botol kaca b) Botol plastik c) Kaleng d) Lertas kartun 8. Apakah Anda mengambil kembali botol kosong yang anda gunakan di supermarket jika mereka mengembalikan beberapa uang anda dengan menukarkan botol yang anda gunakan sebelumnya? a) Ya b) Tidak c) Mungkin d) Tergantung pada jumlah uang yang saya akan dapatkan kembali e) Tergantung: ______________________________________________ 9. Berapa banyak kantong plastik yang Anda gunakan dalam waktu seminggu? a) Tidak ada b) < 5 c) 5-10 d) > 10 e) Tidak tahu
Tujuan dari survei ini adalah untuk mengukur besarnya opini Masyarakat Bali mengenai
konsumsi produk plastik yang sekali pakai seperti: botol plastik dan kantong plastik.
Tanggapan Anda akan dirahasiakan.
Hasil survei ini akan digunakan dalam tesis untuk Novia UAS.
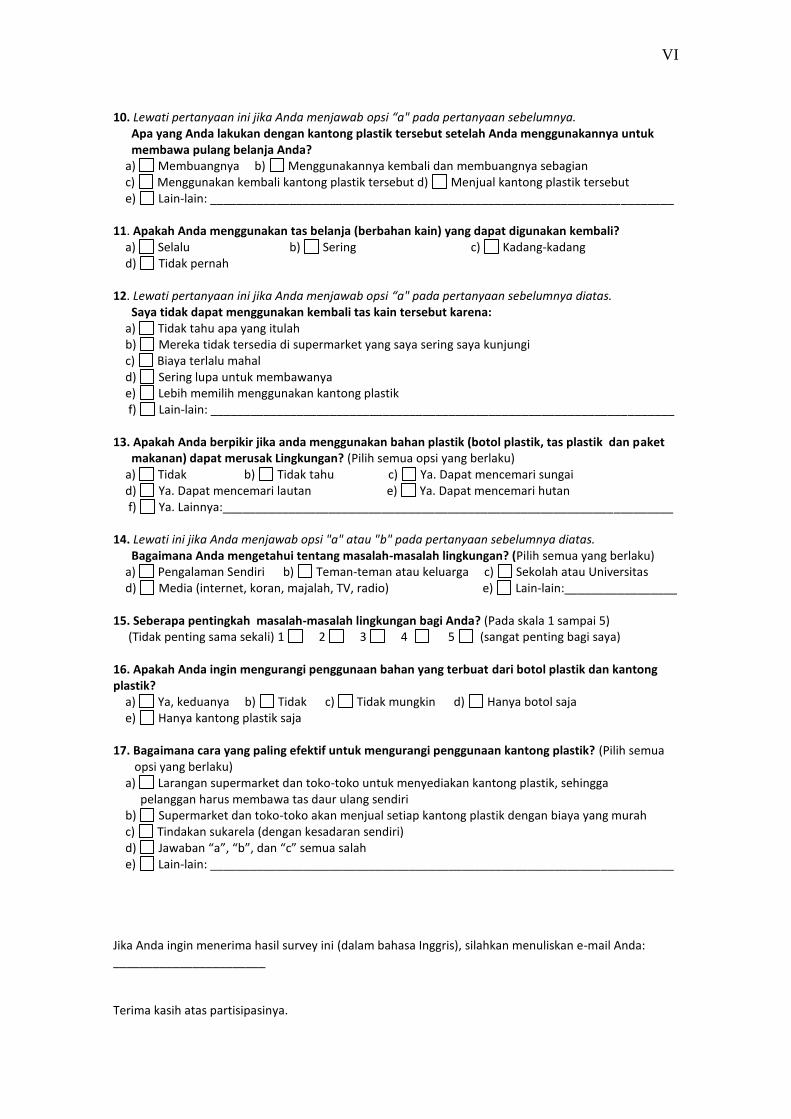
VI
10. Lewati pertanyaan ini jika Anda menjawab opsi “a" pada pertanyaan sebelumnya. Apa yang Anda lakukan dengan kantong plastik tersebut setelah Anda menggunakannya untuk membawa pulang belanja Anda? a) Membuangnya b) Menggunakannya kembali dan membuangnya sebagian c) Menggunakan kembali kantong plastik tersebut d) Menjual kantong plastik tersebut e) Lain-lain: ______________________________________________________________________ 11. Apakah Anda menggunakan tas belanja (berbahan kain) yang dapat digunakan kembali? a) Selalu b) Sering c) Kadang-kadang d) Tidak pernah 12. Lewati pertanyaan ini jika Anda menjawab opsi “a" pada pertanyaan sebelumnya diatas. Saya tidak dapat menggunakan kembali tas kain tersebut karena: a) Tidak tahu apa yang itulah b) Mereka tidak tersedia di supermarket yang saya sering saya kunjungi c) Biaya terlalu mahal d) Sering lupa untuk membawanya e) Lebih memilih menggunakan kantong plastik f) Lain-lain: ______________________________________________________________________ 13. Apakah Anda berpikir jika anda menggunakan bahan plastik (botol plastik, tas plastik dan paket makanan) dapat merusak Lingkungan? (Pilih semua opsi yang berlaku) a) Tidak b) Tidak tahu c) Ya. Dapat mencemari sungai d) Ya. Dapat mencemari lautan e) Ya. Dapat mencemari hutan f) Ya. Lainnya:____________________________________________________________________ 14. Lewati ini jika Anda menjawab opsi "a" atau "b" pada pertanyaan sebelumnya diatas. Bagaimana Anda mengetahui tentang masalah-masalah lingkungan? (Pilih semua yang berlaku) a) Pengalaman Sendiri b) Teman-teman atau keluarga c) Sekolah atau Universitas d) Media (internet, koran, majalah, TV, radio) e) Lain-lain:_________________ 15. Seberapa pentingkah masalah-masalah lingkungan bagi Anda? (Pada skala 1 sampai 5) (Tidak penting sama sekali) 1 2 3 4 5 (sangat penting bagi saya) 16. Apakah Anda ingin mengurangi penggunaan bahan yang terbuat dari botol plastik dan kantong plastik? a) Ya, keduanya b) Tidak c) Tidak mungkin d) Hanya botol saja e) Hanya kantong plastik saja 17. Bagaimana cara yang paling efektif untuk mengurangi penggunaan kantong plastik? (Pilih semua opsi yang berlaku) a) Larangan supermarket dan toko-toko untuk menyediakan kantong plastik, sehingga pelanggan harus membawa tas daur ulang sendiri b) Supermarket dan toko-toko akan menjual setiap kantong plastik dengan biaya yang murah c) Tindakan sukarela (dengan kesadaran sendiri) d) Jawaban “a”, “b”, dan “c” semua salah e) Lain-lain: ______________________________________________________________________ Jika Anda ingin menerima hasil survey ini (dalam bahasa Inggris), silahkan menuliskan e-mail Anda: _______________________ Terima kasih atas partisipasinya.