Embed Size (px)
Citation preview
Perceptions of Plastic Surgeons, Orthodontists and Laypersons to Altered Facial Balance
by
Sean Marcy
A thesis submitted in conformity with the requirements for the Degree of Master of Science Graduate Department of Dentistry
University of Toronto
© Copyright by Sean Marcy 2010
ii
Perceptions of Plastic Surgeons, Orthodontists and Laypersons to Altered Facial Balance
Sean Marcy
Master of Science
Graduate Department of Dentistry University of Toronto
2010
Abstract Objective: To quantify the acceptability of facial asymmetry to plastic surgeons,
orthodontists and the lay population.
Methods: Facial images were animated with one of six asymmetries: jaw and
nasal deviation, interocular distance, ocular height, angulation, and shape.
Evaluators were asked to judge the faces based on their visual acceptability.
Results: There were no differences between the groups except for in the
evaluation of ocular shape. Mandibular deviation of 4mm, and nasal deviation of
3mm was judged as unacceptable. 9% rounder and 18% flatter eyes were
considered unacceptable. Hypertelorism and inferior ocular dystopia was
unacceptable after a change of 2mm. Hypotelorism and superior vertical dystopia
was unacceptable after a change of 2.5mm. Ocular angulations of 5.5 degrees
superiorly and 3.5 degrees inferiorly were unacceptable.
Conclusions: Plastic surgeons, orthodontists, and lay people find specific facial
asymmetries to be unacceptable at similar levels of deviation.
iii
Acknowledgements I would like to express my deepest gratitude to the following people for their encouragement and support during the implementation and completion of this investigation:
Dr. Christopher Forrest, Sick Kids Hospital, Toronto, Ontario; thank you for introducing me to the world of craniofacial orthodontics and the wonderful people involved with the Craniofacial team. Your commitment to improving the lives of those with facial anomalies has been an inspiration and source of motivation for me throughout this project. I would like to thank you for your encouragement, support, and guidance over the past three years. Dr. Bryan Tompson, University of Toronto, Faculty of Dentistry, Department of Graduate Orthodontics; thank you for all your support and guidance throughout my orthodontic education and this research project and for your patience and confidence in me – I really appreciated it. Dr. John Semple, Women’s College Hospital, Toronto, Ontario; thank you for very rationale advice and for your encouragement and support during the preparation of my thesis. Ms. April Clausen, SickKids Hospital, Toronto, Ontario; thank you for all your technical support throughout the various stages of this project. You really came through for me when I needed your help – thanks. Ms. Andrea Cormier, University of Toronto, Faculty of Dentistry, Department of Media Services; thank you for generously taking time away from your busy schedule to teach me your animation skills throughout this investigation – I could not have completed this project without your help. Mr. Derek Stephens, Biostatistician/Manager, BDA, SickKids Hospital, Toronto, Ontario; thank you for all of your statistical support and guidance during the preparation of my thesis project. Mr. James Fiege, Christine Nicolau, Bruno Rakiewicz, Jeff Comber and Rita Bauer, University of Toronto, Faculty of Dentistry, Department of Media Services; thank you for taking the time to lend me your media expertise throughout this investigation.
iv
Table of Contents
Abstract..…………………………………………………..………………….…………..…..
Acknowledgements.………………………………………………………………………..
List of Tables…………………………….…………..………………………………………..
List of Figures…………………………….…………..………………………………………..
List of Appendices……………………….…………..………………………………………..
1 Introduction and Statement of the Problem……………………………… 2 Background and Review of the Literature……………………………….
2.1 Normal Facial Asymmetry 2.2 Objective Quantification of Facial Asymmetry and Balance 2.3 Subjective Assessment of Facial Asymmetry and Balance
3 Objectives ……………...……………………….…………………………..… 4 Hypotheses….………………………………………………………………… 5 Methods…………………………………….…………………………………… 6 Results……………………………………………………………………………
7 Discussion……………………………………………….….………………… 8 Conclusion…………………………….………………………………………… 9 References………………………………………………………………………
ii
iii
v
vi
vii
1
3
21
22
23
29
42
47
48

v
List of Tables
Table 1: Overall thresholds of unacceptable asymmetry.……………………..
Table 2: Segregated thresholds of unacceptable asymmetry…….…………..
39
39
13
14
14
15
17
18
19
20
20
20
21
21
22
22
23
23
24
24
25
25
25
29
33
34
51
52
vi
List of Figures
Figure 1: Mandibular asymmetry measured relative to facial midline…………
Figure 2: Eye fissure inclination measured relative to facial midline………….
Figure 3: Ocular shape measurements………………………………………….
Figure 4: Telorism measured relative to facial midline………………………….
Figure 5: Nasal asymmetry measured relative to facial midline…….…………
Figure 6: Vertical ocular dystopia measured relative to facial midline…………
Figure 7: Vertical face proportions…………………………………….…………
Figure 8: Mandibular asymmetry results……………………………….…………
Figure 9: Nasal asymmetry results…………………………………………………
Figure 10: Hypertelorism results…………………………………………………….
Figure 11: Hypotelorism results………………………………………………….
Figure 12: Superior ocular angulation results…………………………………..
Figure 13: Inferior ocular angulation results ……………………………………
Figure 14: Superior ocular dystopia results…………………………………….
Figure 15: Inferior ocular dystopia results………………………………………
Figure 16: Round ocular shape results………………………………………….
Figure 17: Flat ocular shape results.…………………………………………….
Figure 18: Gender demographics of judges…………………………………….
Figure 20: Ethnic demographics of judges.……………………………………..
Figure 21: Age/Experience demographics of judges.………………………….
Figure 22: Vision demographics of judges.……………………………………..
12
13
13
14
14
14
16
29
30
31
32
33
34
35
36
37
38
40
40
41
41

vii
List of Appendices
Appendix I: Anthropometric Terminology…………………………….…………...
51
13
14
14
15
17
18
19
20
20
20
21
21
22
22
23
23
24
24
25
25
25
29
33
34
51
52
1
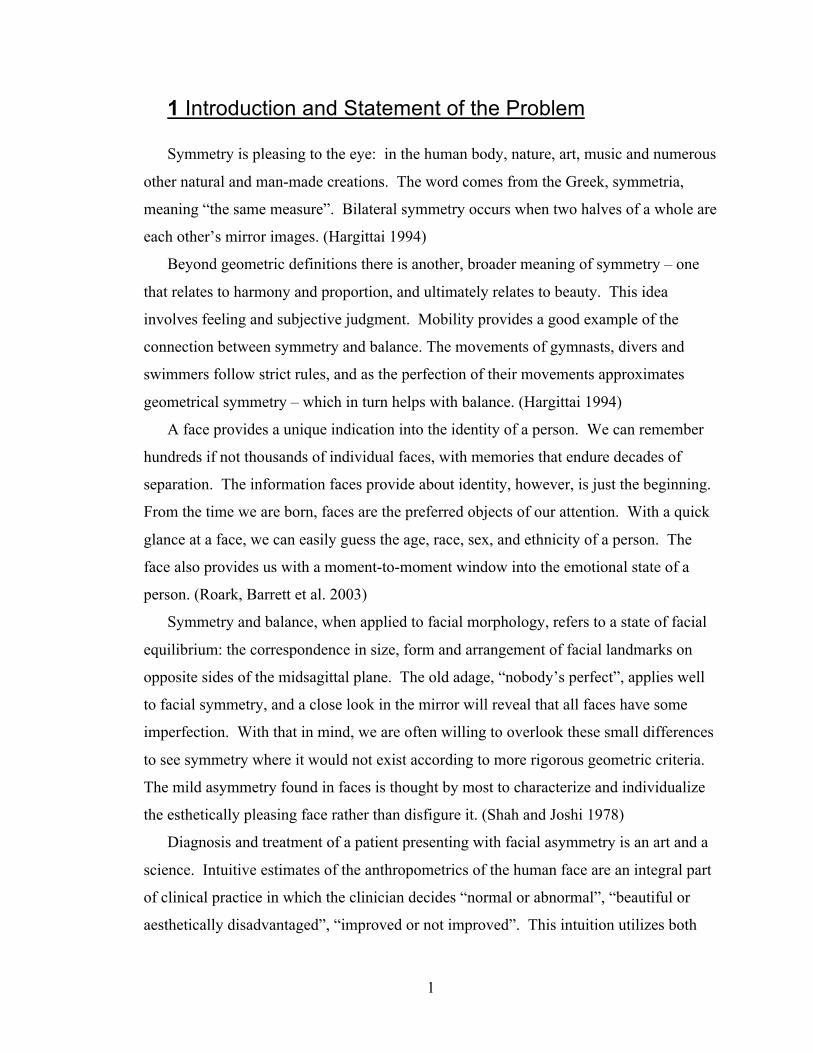
1 Introduction and Statement of the Problem
Symmetry is pleasing to the eye: in the human body, nature, art, music and numerous
other natural and man-made creations. The word comes from the Greek, symmetria,
meaning “the same measure”. Bilateral symmetry occurs when two halves of a whole are
each other’s mirror images. (Hargittai 1994)
Beyond geometric definitions there is another, broader meaning of symmetry – one
that relates to harmony and proportion, and ultimately relates to beauty. This idea
involves feeling and subjective judgment. Mobility provides a good example of the
connection between symmetry and balance. The movements of gymnasts, divers and
swimmers follow strict rules, and as the perfection of their movements approximates
geometrical symmetry – which in turn helps with balance. (Hargittai 1994)
A face provides a unique indication into the identity of a person. We can remember
hundreds if not thousands of individual faces, with memories that endure decades of
separation. The information faces provide about identity, however, is just the beginning.
From the time we are born, faces are the preferred objects of our attention. With a quick
glance at a face, we can easily guess the age, race, sex, and ethnicity of a person. The
face also provides us with a moment-to-moment window into the emotional state of a
person. (Roark, Barrett et al. 2003)
Symmetry and balance, when applied to facial morphology, refers to a state of facial
equilibrium: the correspondence in size, form and arrangement of facial landmarks on
opposite sides of the midsagittal plane. The old adage, “nobody’s perfect”, applies well
to facial symmetry, and a close look in the mirror will reveal that all faces have some
imperfection. With that in mind, we are often willing to overlook these small differences
to see symmetry where it would not exist according to more rigorous geometric criteria.
The mild asymmetry found in faces is thought by most to characterize and individualize
the esthetically pleasing face rather than disfigure it. (Shah and Joshi 1978)
Diagnosis and treatment of a patient presenting with facial asymmetry is an art and a
science. Intuitive estimates of the anthropometrics of the human face are an integral part
of clinical practice in which the clinician decides “normal or abnormal”, “beautiful or
aesthetically disadvantaged”, “improved or not improved”. This intuition utilizes both
2
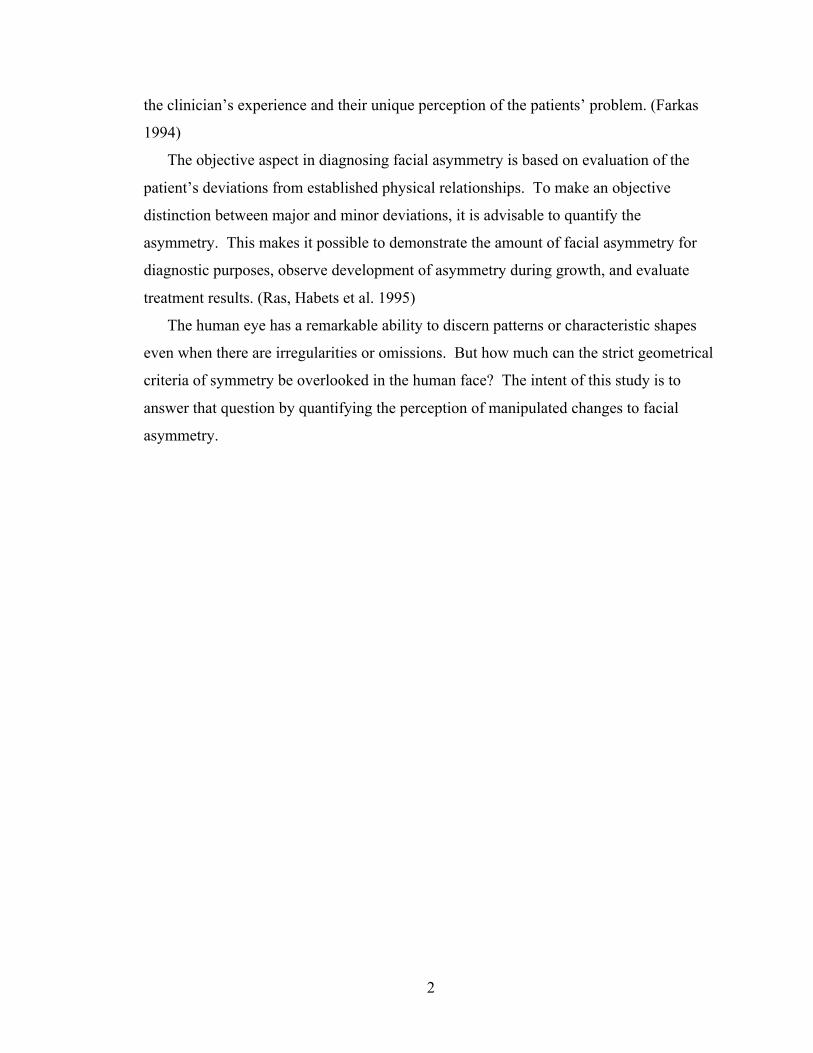
the clinician’s experience and their unique perception of the patients’ problem. (Farkas
1994)
The objective aspect in diagnosing facial asymmetry is based on evaluation of the
patient’s deviations from established physical relationships. To make an objective
distinction between major and minor deviations, it is advisable to quantify the
asymmetry. This makes it possible to demonstrate the amount of facial asymmetry for
diagnostic purposes, observe development of asymmetry during growth, and evaluate
treatment results. (Ras, Habets et al. 1995)
The human eye has a remarkable ability to discern patterns or characteristic shapes
even when there are irregularities or omissions. But how much can the strict geometrical
criteria of symmetry be overlooked in the human face? The intent of this study is to
answer that question by quantifying the perception of manipulated changes to facial
asymmetry.
3
2 Background & Review of the Literature
2.1 “Normal” Facial Asymmetry
The earliest quantification of cranial asymmetry is attributed to Woo (1931), who
carried out measurements on 800 male skulls from the Egyptian dynasties. He found that
the bones of the cranium exhibited an asymmetry, with the right side being larger than the
left. The facial complex also exhibited asymmetry with the left zygoma and maxilla
being larger than the right.
Lu (1965) was first to radiographically quantify facial asymmetry by analyzing 24
posteroanterior cephalograms of boys’ aged 4-6. His method produced an average total
percentage of asymmetry sum of squares value for each radiograph. He concluded that
some asymmetry was present in all faces, the average being 2%, and upon visual
examination only those with radiographic asymmetry greater than 3% were clinically
discernible.
Vig and Hewitt (1975) investigated skeletal asymmetry in 63 randomly selected
children aged 9-18 with no discernable clinical asymmetry. Using a radiographic method
of triangulation, each side of the face was divided into several triangles representing
component areas of the face. The surface areas of these triangles were compared with the
equivalents on the contralateral side. They found that the cranial base and maxillary
regions exhibited an overall asymmetry with the larger side being the left, and that the
mandibular and dentoalveolar regions exhibited a greater degree of asymmetry than the
midface.
Using the same method, Shah and Joshi (1978) examined 43 subjects aged 18-25. In
contrast they found that the total facial structures were larger on the right side, and the
lateral maxillary region exhibited a greater degree of asymmetry than other components
of the face. They speculated that one of the possible etiological factors for the production
of asymmetries might be the unilateral chewing pattern of the subject.
Burke (1971) was the first to use stereophotogrammetry to evaluate soft tissue facial
asymmetry. A form of indirect anthropometry, he introduced a novel method to reduce
the expense of equipment available at the time. Evaluating 48 individuals aged 8-20;
linear measurements were compared between the eyes, nose and mouth. Although the
4
overall mean differences between left and right were all <1mm, when individual records
were examined he found quite a marked bilateral difference.
Collecting data between 1973 and 1989, the most extensive examination of facial
morphology and asymmetry was completed by Farkas (1994). He employed and
developed the techniques of direct anthropometry to obtain surface measurements in
2326 healthy Caucasian North American, 235 Chinese, and 132 African American
subjects over a wide age range. For each subject he collected measurements of the head,
face, orbits, nose, lips, mouth and ears.
Paired measurements were regarded as asymmetrical if the findings obtained from
both sides differed by one or more millimeters or degrees. Maximum normal asymmetry
was defined as the mean bilateral difference plus two standard deviations (mean + 2 SD).
Asymmetry was considered supernormal (abnormal) if the difference between the paired
measurements was larger than the maximum normal difference of the norms, at the same
age, sex, and ethnic origin of the patient.
Farkas’ values of maximum normal asymmetry (MNA) relating specifically to the
asymmetries evaluated in the current research are discussed in the following section. A
complete discussion of proper clinical craniofacial asymmetry assessment is presented
later.
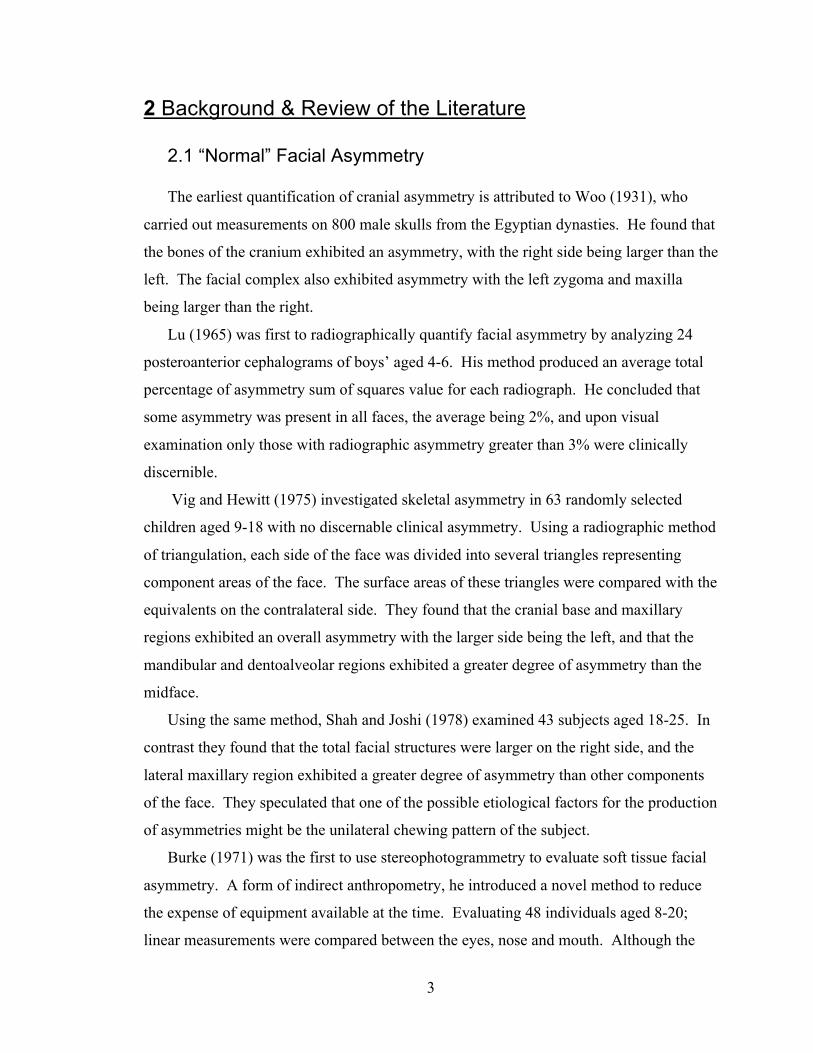
a. Mandibular asymmetry: Maximum normal asymmetry (MNA) of mandibular
depth measured from tragion (t) to gnathion (gn) was 5.1-5.8 mm. Therefore
MNA from gnathion to the midsagittal plane was 2.7 mm.
Figure 1 – In the present study mandibular asymmetry was measured from gnathion
(gn) to facial midline.
5
Computed tomography in subjects with no visual asymmetry were found to have an
average skeletal discrepancy of 2 mm measured from gnathion to midsagittal axis, a
value corresponding well to Farkas’ soft tissue measurements. (Katsumata, Fujishita et al.
2005)
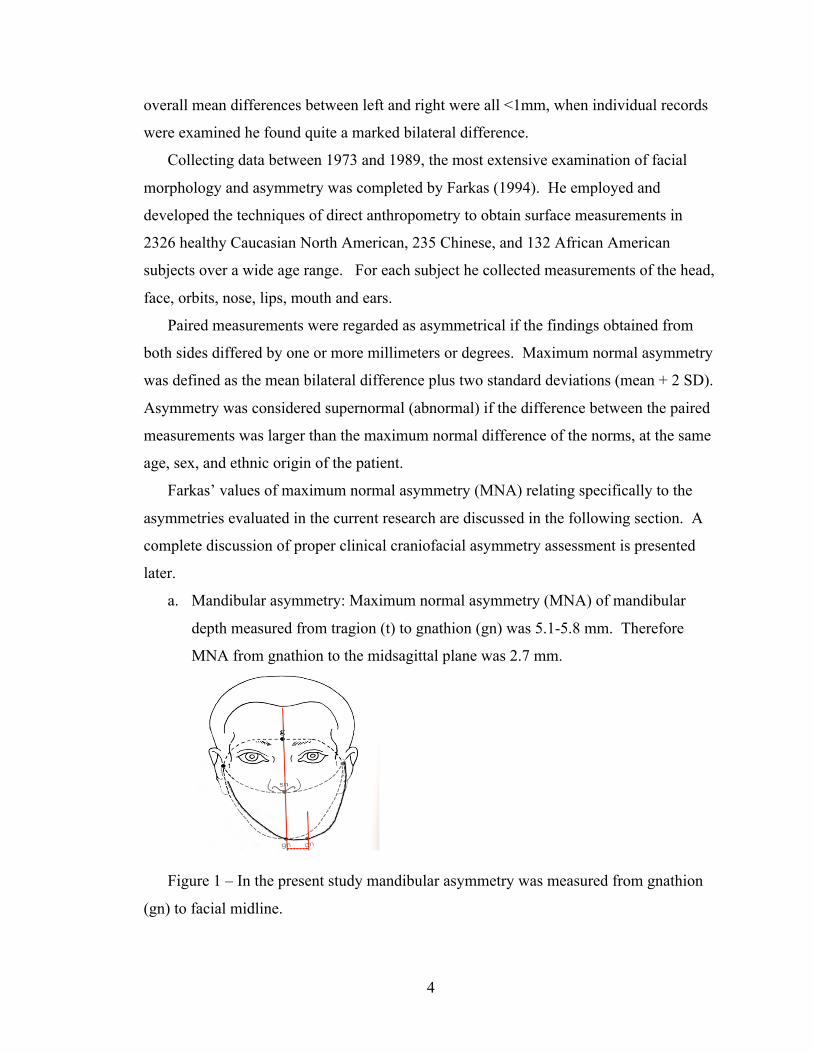
b. Eye fissure inclination: Approximately 2% of the population sample had an
asymmetry with a MNA of approximately 1.5 degrees.
Figure 2 - In the present study eye fissure inclination was measured as the line
connecting endocanthion (en) and exocanthion (ex) points relative to horizontal
(perpendicular to midsagittal axis).
c. Ocular Shape: The frequency of eye fissure height and length asymmetries was
below 2% in both sexes, with the MNA of paired measurements in the range of
0.3-1.4 mm.
Figure 3 – In the present study ocular shape was measured vertically from palpebrale
superius (ps) to palpebrale inferius (pi); and horizontally from endocanthion (en) to
exocanthion (ex).
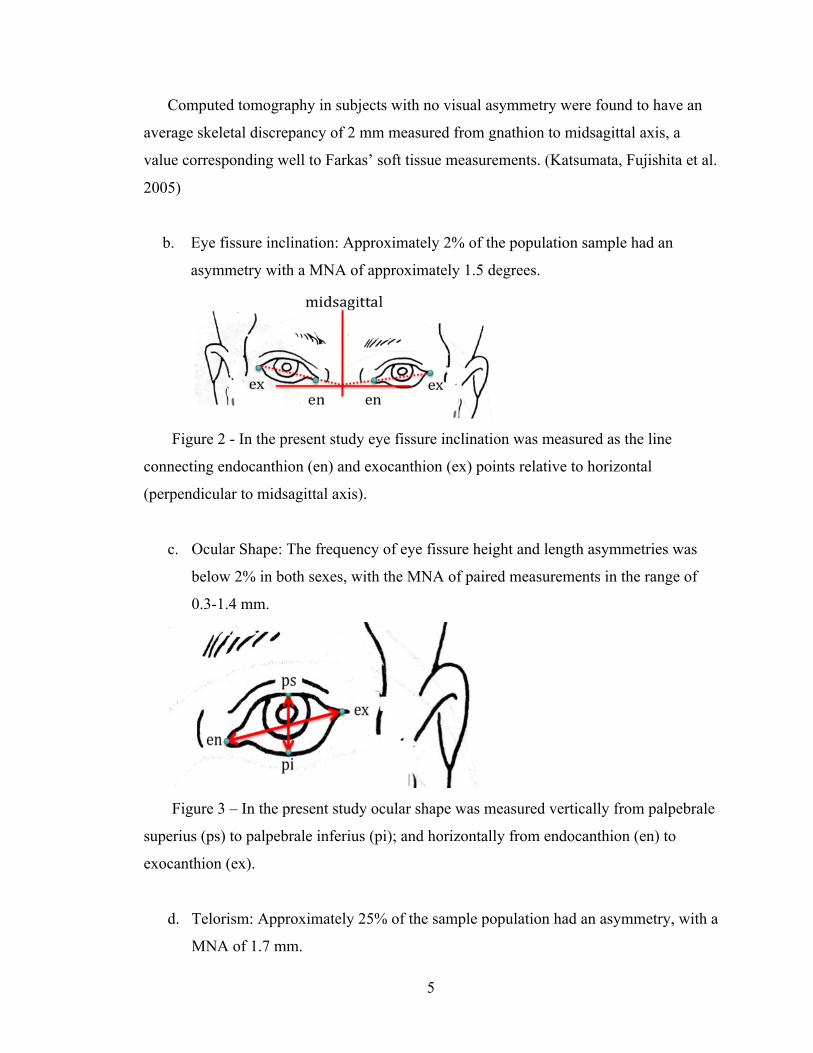
d. Telorism: Approximately 25% of the sample population had an asymmetry, with a
MNA of 1.7 mm.
6
Figure 4 - In the present study telorism was measured from endocanthion (en) to
sellion (se).
e. Asymmetry of the nasal bridge – approximately 25% incidence of asymmetry
within the sample population, but no MNA value was calculated by Farkas.
Figure 5 – In the present study nasal asymmetry was measured as a line from sellion
(se) – pronasale (prn) relative to the facial midline.
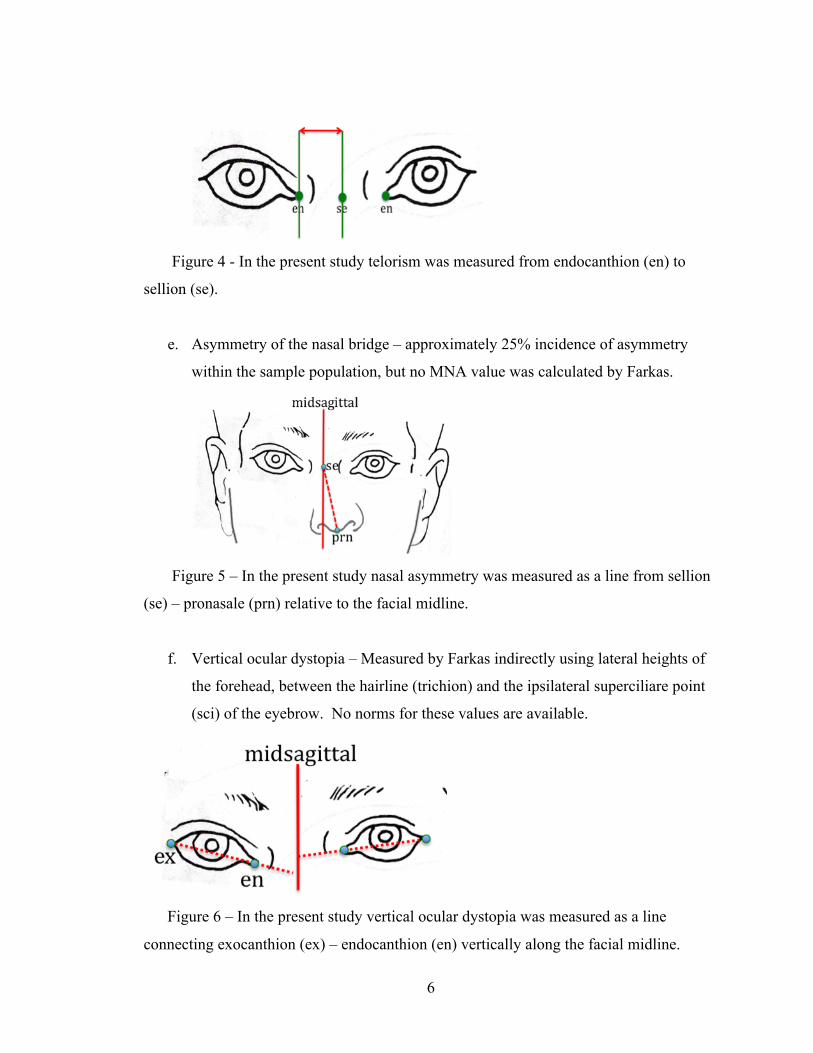
f. Vertical ocular dystopia – Measured by Farkas indirectly using lateral heights of
the forehead, between the hairline (trichion) and the ipsilateral superciliare point
(sci) of the eyebrow. No norms for these values are available.
Figure 6 – In the present study vertical ocular dystopia was measured as a line
connecting exocanthion (ex) – endocanthion (en) vertically along the facial midline.
7
Farkas (1994) also examined 60 healthy young adult Chinese Singaporeans aged 18-
19, and a group of 50 male and 50 female African Americans aged 18-25 to measure
facial asymmetry. Similar to the Caucasian population, the mean extent of asymmetries
was smaller in the “sensitive” areas of the face (orbits, nose, upper lip) and more
pronounced in the paired measurements locating the orbits and mouth within the facial
framework (depth measurements of the face).
Farkas’ research concluded that neither the mild asymmetries of the central facial
zone nor the greater asymmetries found more frequently outside the “sensitive” zone
cause any visible change in healthy facial harmony.
The higher frequency of asymmetry found outside the central zone must be
interpreted with caution as the linear measurements were a greater relative distance as
measured from the lateral to central portions of the face, and thus would be inherently
more prone to differences of > 1mm (defined by Farkas as asymmetry).
Peck (1991) and Ferrario (1994) have measured asymmetry both radiographically and
anthropometrically in esthetically pleasing faces. Both found less asymmetry as the
cranium is approached. It is postulated that the dentoalveolar region and lower parts of
the face show a greater response to functional adaptation and continue growing longer
than the cranial region. Thus they have a greater potential to exhibit asymmetry.
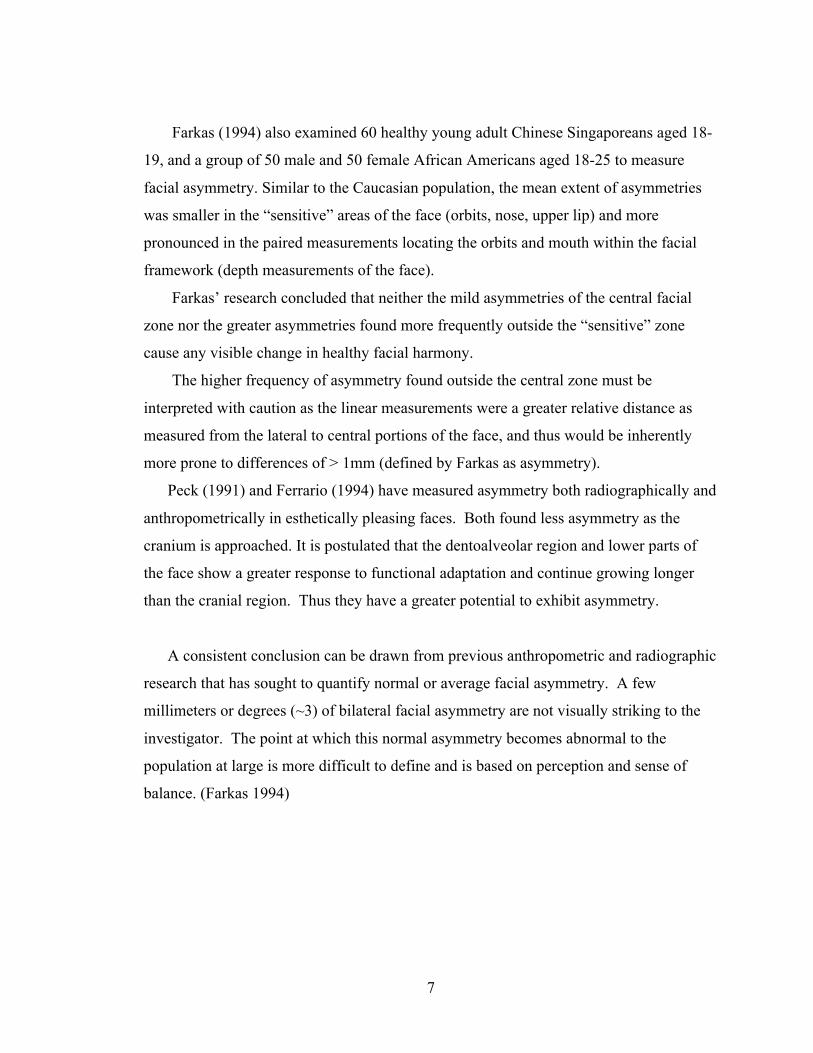
A consistent conclusion can be drawn from previous anthropometric and radiographic
research that has sought to quantify normal or average facial asymmetry. A few
millimeters or degrees (~3) of bilateral facial asymmetry are not visually striking to the
investigator. The point at which this normal asymmetry becomes abnormal to the
population at large is more difficult to define and is based on perception and sense of
balance. (Farkas 1994)
8
tr
n
sn
me
15
15
16
2.2 Objective Quantification of Facial Asymmetry and Balance
Objective measurement of facial asymmetry is important for diagnostic purposes, in
the assessment of developing asymmetry during growth, and evaluation of treatment
results.
Direct Anthropometry - The most important diagnostic tool for quantifying facial
asymmetry and balance is direct anthropometric measurements taken during the clinical
examination. Observation of the patients’ body posture, mannerisms, and hairstyle are
important as they may mask the problem and mislead the treatment. (Booth c2007)
Holistic Facial Balance – According to Tessier, “harmony or disharmony does not lie
within angles, distances, lines, surfaces, or volumes. They arise from proportion”. (Farkas
and Munro 1987) Vertical, transverse, and anteroposterior proportions of the face should
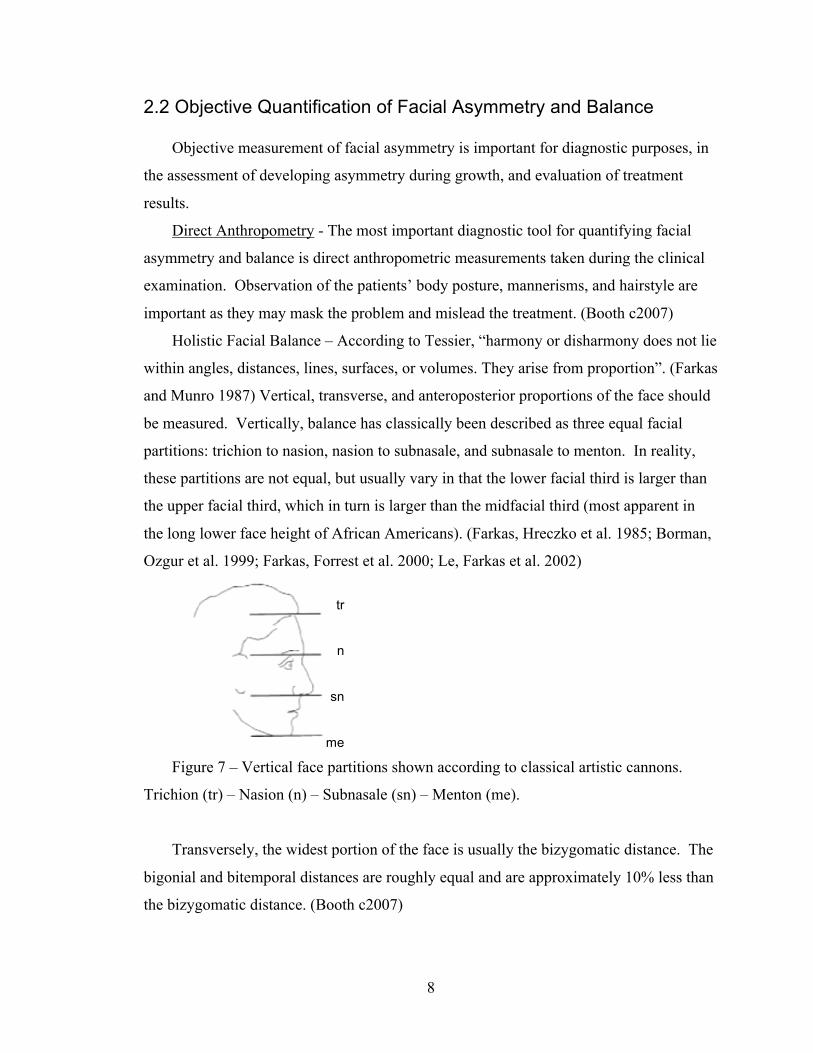
be measured. Vertically, balance has classically been described as three equal facial
partitions: trichion to nasion, nasion to subnasale, and subnasale to menton. In reality,
these partitions are not equal, but usually vary in that the lower facial third is larger than
the upper facial third, which in turn is larger than the midfacial third (most apparent in
the long lower face height of African Americans). (Farkas, Hreczko et al. 1985; Borman,
Ozgur et al. 1999; Farkas, Forrest et al. 2000; Le, Farkas et al. 2002)
Figure 7 – Vertical face partitions shown according to classical artistic cannons.
Trichion (tr) – Nasion (n) – Subnasale (sn) – Menton (me).
Transversely, the widest portion of the face is usually the bizygomatic distance. The
bigonial and bitemporal distances are roughly equal and are approximately 10% less than
the bizygomatic distance. (Booth c2007)
9
Relating nasal base width to intercanthal and eye fissure width is another clinical
comparison often employed. In African American and Asian populations the nasal base
is often wider than the intercanthal distance, which in turn is slightly greater than eye
fissure width. In Caucasians the nasal base is more similar in width to the intercanthal
distance than in other populations. Generally, Asian populations also exhibit smaller
mouth and palpebrale fissure widths than Caucasians. (Farkas, Forrest et al. 2000; Le,
Farkas et al. 2002)
Overall, the neoclassical facial proportion canons often used in clinical practice
were found valid in a markedly smaller percentage of Asian and African American
subjects than in North American Caucasians (in which they still applied to less than one-
third of the population). With their shortcomings apparent they should be used with
caution when diagnosing the harmony of facial proportions.
Specific Facial Measurements –
Diagnosis of craniofacial asymmetry should be objectively based on quantitative
measurements – comparison of data obtained from paired measurements to established
averages if they are available. Anthropometry provides the means to establish which
specific factors contribute to the formation of asymmetries in the face.
Clinical examination of craniofacial asymmetry should follow a logical sequence and
are presented by region in the following section. Farkas’ maximum normal asymmetry
(MNA) values are a useful tool, and are included where applicable. (Farkas 1994)
Head:
a. Auricular height – measured from vertex (v) to porion (po), this value is important
if cephalometric radiographs are used to diagnose asymmetry (discussed in more
detail in radiology section). MNA was approximately 6.5-7 mm.
b. Lateral heights of the forehead (tragus-ipsilateral superciliare) – suggested by
Farkas as an indirect measurement of vertical ocular dystopia.
c. Protrusion/Flatness of forehead/brow: measured from the point of greatest brow
protrusion (glabella) to the most posterior point of the occiput on the contralateral
side of the head (opisthocranium).
10
Face:
Tangential maxillary and mandibular half-arcs – the distance from tragus to the
midsagittal landmarks: glabella (g), nasion (n), subnasale (sn) and gnathion (gn). The
MNA ranged from 4.1-5.8 mm, increasing caudally.
Orbits:
a. Linear ocular measurements – MNA between paired measurements of ocular
height and width was in the range of 0.3-1.4 mm.
b. Ocular inclination – MNA of 1.5 degrees. The eye normally inclines upward from
a medial to lateral direction, to a greater degree in females. (Farkas 1994)
c. Interocular Spacing - telorism must be distinguished from telecanthus. Ocular
hypertelorism can be simulated by epicanthic folds, exotropia, low nasal bridge,
small globes with narrow palpebral fissures, and widely spaced eyebrows.
d. Projective measurement locating the orbits – MNA in orbitogonial distance of 5.4
mm, orbitotragal distance of 4 mm, and orbitosellion distance of 1.7 mm.
Nose:
Measurements of the nose width (alare-alare); width between the facial insertions of
the alar bases (alar crest-alar crest); width between the labial insertion of the alar bases
(subalare-subalare); and width of the columella (subnasale’-subnasale’). MNA from 0.7-
1.9 mm. The largest amount of asymmetry found in columella length. (Farkas 1994)
Mandible and mouth:
a. Labio-oral distances – The lateral height of the upper lip is determined by the
projective distances between the labial insertions of the ala (subalare right, left)
and the points on the vermillion line (labiale superius’ right, left). MNA in the
lateral height of upper lip was 1.5 mm, and labial fissure inclination of 2.1 degrees
(higher in males). (Farkas 1994)
b. Mouth location by measurement – measured from chelion-tragus, MNA is 5–6
mm.
11
c. Labio-Ocular distances - mandibular asymmetry can also be quantified by relating
the bilateral oral commissures to the interpupillary plane. A tongue blade is
helpful to determine whether an occusal cant is present.
Ears –
a. Measurements of the ears - Perpendicular measurements of the auricle: length of
the ear (superaurale-subaurale); width of the ear insertion to the head (otobasion
superius-otobasion inferius). MNA for linear measurements was 3 mm and
angular measurements was 6.5 degrees. (Farkas 1994)
b. Position of the ears – Major measurements locating the ear in relation to the
facial midline. (1) The upper insertion of the ear is measured from gnathion. (2)
The position of the lower insertion of the ear is determined projectively from the
gnathion and (3) from the subnasale and (4) tangentially from the gnathion. MNA
of approximately 5-6 mm. (Farkas 1994)
When facial asymmetry is noted, at a minimum, the clinical evaluation should also
include: (Miloro, Ghali et al. 2004)
- Palpation of the face to differentiate between soft and hard tissue defect
- Comparison of dental and facial midlines
- Inspection of gonial angle symmetry and differences in antegonial notching
- Mandibular deviation on opening
- TMJ function
Indirect Anthropometry – Measurements made from standardized photographs can
serve to supplement the clinical exam and provide a record of pretreatment conditions.
Views include frontal at rest and smiling, maximum opening and a three quarter view. A
submental and bird’s eye view may also be beneficial in asymmetric patients.
As noted, the gold standard of soft tissue asymmetry analysis occurs during the
clinical exam using direct anthropometry. Recent stereophotogrammetric advances have
sought to provide the application of comparable accuracy using an indirect
anthropometric technique. The technology is based on converging photographic images
12
to build up a three-dimensional model that can be viewed from any perspective and
measured from any direction. The major advantage is less patient cooperation, which is
especially helpful for very young patients.
Stereophotogrammetry, was originally adapted by Burke (1971), and later by Ras
(1995) to quantify facial morphology in three dimensions. One of the latest technologies,
3dMDcranial System (Atlanta, GA) utilizes a five-camera configuration to image a full
360-degrees of the head in approximately 1.5 milliseconds. (Lane and Harrell 2008)
The most recent software is capable of fusing a soft tissue image with the patients
computed tomography image (and/or digitized dental model) to assess, plan, monitor,
evaluate and simulate patient treatments.
Indirect anthropometric systems have been tested for accuracy and reproducibility
comparing them to the gold standard of direct anthropometry. Wong tested the
correlation between direct anthropometry and 3dMD and found less than 1 mm difference
between 17 of 18 measurements (mean r=0.88) (Wong, Oh et al. 2008). Weinberg (2006)
tested two indirect systems (3dMD and Genex) evaluating 12 linear measurements.
Although statistically significant differences were found between the methods for 9 of the
12 variables, the magnitude was consistently at the sub millimeter level. Most recently,
Heike et al. (2009) tested the reliability of the 3dMD system that addressed some
limitations in previous research. They incorporated cranial vault measurements and
additional facial landmarks, evaluated both children and adults, and compared reliability
among participants both with and without a craniofacial condition. Intrarater and
interrater reliability for most interlandmark distances had intraclass correlation
coefficients greater than 95%, mean absolute differences of less than 1 mm, relative error
measurement less than 5, and technical error of measurement less than 1 mm.
Overall, these results suggest high inter-method reliability between direct and
indirect anthropometric techniques. With the validation of stereophotogrammetry, three-
dimensional soft tissue data in the form of average facial values and post surgical results
is beginning, and will continue to emerge. (Oh, Wong et al. 2008)
13
Radiography and other imaging techniques –
Submental-vertical view – useful for the assessment of asymmetry in the horizontal
plane. Uses landmarks within the cranial base, maxilla, and mandible to construct
reference lines with which to assess asymmetry. These references allow assessment
within each component part of the craniofacial complex as well as the relative
relationship of these parts to one another. Forsberg found the mean tracing and
measurement error to be less than 1 mm for all landmarks. (Forsberg, Burstone et al.
1984)
Panoramic view – can provide only relative information regarding the height of the
mandibular condyle and ramus. Because length and angles cannot be measured
accurately, degenerative changes or asymmetric morphology can be identified with a
comparative vertical measurement of the condylar head apex to the sigmoid notch base,
and the sigmoid notch base to the mandibular angle. The shape of the inferior mandibular
border should also be traced in the region of the sigmoid notch. Due to the degree of
distortion inherent in this view, suspicious findings should be investigated with other
imaging modalities. (Peterson 1992)
Posteroanterior (PA) cephalometric view – Tracing soft and hard tissue features and
then placing a true vertical and horizontal midline axis, it is possible to visualize
deviations of the dental and skeletal midline, occlusal cants, discrepancies in orbital
symmetry, and vertical asymmetries. It is a valuable tool in the study of the right and
left facial structures since they are located at relatively equal distances from the film and
x-ray source. (Peterson 1992)
Harvold advocated the construction of a horizontal reference plane at the level of the
zygomatico-frontal sutures, and a vertical reference plane perpendicular to the horizontal
line through the crista galli. Horizontal reference lines connect the right and left ear
canals, mastoid process, maxillary molars, and gonial angles. Observing the orientation
of these lines almost always is preferable to actual measurements on the radiograph.
Other options for analysis of the posteroanterior image include the bisection and
triagulation approach outlined by Bishara. (Bishara, Burkey et al. 1994; Proffit 2003)
14
A major limitation of the technique is the location of landmarks. It is thought to be
unreliable enough that when measurements are used, small deviations may be concealed
by tracing error or may appear to exist when in fact they do not.
It is noteworthy that all cephalometric radiography is based on the position of the
external auditory meatus, and that asymmetry of these structures themselves will modify
the symmetry factor of all other structures. If they are located at significantly different
vertical levels, the film should be taken without the use of ear rods.
Lateral cephalometric view – can provide clues of vertical differences by the lack of
superimposition of the inferior border of the mandible. As it is difficult to make a
distinction between right and left side anatomical landmarks, lateral cephalograms are
generally regarded as inaccurate for diagnosis of facial asymmetry. (Peterson 1992)
Computed Tomography (CT) – can be used as two-dimensional and three-
dimensional grayscale and colour information to very accurately identify the anatomic
architecture causing craniofacial asymmetry.
Images can be rotated and viewed from any aspect to reveal details of the anatomy in
patients with severe asymmetry. The same information can be used to make a
stereolithographic model, which can be very helpful in planning surgery. (Proffit 2003)
The benefits with this technique are the elimination of structure superimposition,
absolute positioning of anatomical landmarks, and elimination of
magnification.(Katsumata, Fujishita et al. 2005) The introduction of spiral and cone-
beam CT scanners has improved accuracy, while their faster scanning speeds reduce
motion artifacts and patient exposure. (Kwon, Park et al. 2006)
As with plain film radiography, an appropriate midsagittal reference plane using
landmarks not affected by deformity is needed to evaluate absolute facial asymmetry.
When evaluating asymmetry using a CT modality, some authors have applied a
midsagittal reference plane consisting of sella, nasion, and basion, while others use
Frankfurt horizontal plane. (Maeda, Katsumata et al. 2006)
15
Technetium-99m (99mTc) – When a progressive mandibular asymmetry develops due
to excessive growth, bone scans can be used to determine whether aberrant activity has
ceased. The radioactive isotope localizes in areas of greatest bone turnover, and after
intravenous injection a gamma counter is used to map the pattern of radioactive emission.
(Peterson 1992)
2.3 Subjective Assessment of Facial Asymmetry and Balance
Neurologic Basis of Face Perception and its Clinical Relevance
Whole-brain, event-related functional magnetic resonance imaging (fMRI) detects
real-time changes in neural activity associated with a subject viewing facial photographs
relative to non-facial objects. Using this technique, researchers have shown the existence
of specialized neuronal clusters for facial perception in defined brain regions. It is
suggested that while discrete regions in the fusiform gyrus encode the identity of a
perceived face, the superior temporal sulcus codes for changeable aspects of faces such as
facial expression, along with the amygdala, and the fusiform cortex (Masella and Meister
2007). Dolan (2002) noted that the amygdala is an important mixing site of emotion and
perception, helping humans make “perceptual value judgments” about facial appearance.
The variability of the amygdala may function individualize the process of facial
discrimination.
Chen et al. (2007) manipulated facial symmetry while recording brain activity to
study its role in face processing. Contrasting faces and their image-symmetric versions,
showed a similar activation pattern except for additional activity in the occiptal face area,
suggesting its involvement in facial symmetry processing.
Why this neuroimaging information becomes important in the present research is
the significant inter-patient differences found in these brain face-processing neurons and
centers. The words of Arthur Toga, director of the UCLA Laboratory of Neuro Imaging,
reflect current knowledge as to the neural processing of facial perception: “Every
person’s brain is as unique as their face.” Such variable individualized neural hard wiring
can give humans inherent advantages or limitations in facial assessment ability, with the
result that laypeople might see a slightly different face from the one the healthcare
16
professional sees, and vice-versa.(Masella and Meister 2007)
How do we look at a face?
The ability to distinguish people from their faces is vital socially and
professionally.(Gorno-Tempini, Price et al. 1998) Face recognition is an important
inherited ability; neonatal studies note that “at just 30 minutes of age, infants will track a
moving face farther than other moving patterns of comparable contrast and
complexity.”(Farah, Wilson et al. 1998) Current research favors the concept of “holistic,”
or global, face recognition, in which the overall facial structure is most important, and the
explicit recognition of eyes, nose, and mouth is less critical. Facial parts are “not only
perceived together but influence one another so that, in effect, the ‘whole is more than the
sum of its parts.’”(Farah, Wilson et al. 1998)
Eye tracking is a non-invasive technique that allows the measurement of gaze
patterns in nearly real-time. It provides a method for understanding how perceivers
process visual stimuli such as human faces. Originally introduced as the Dodge corneal
reflection method of eye movement recording in 1907, the technique was modified and
further developed by Mackworth and Thomas in the early 1960’s. (Mackworth and
Mackworth 1958; Mackworth and Thomas 1962)
Pictures are uploaded to an eye-tracking system, so they can be presented to
participants on a computer monitor, as their eyes are tracked. Subunit regions of interest
within the face (Look Zones) can be defined by the investigator, which permits the
examination of gaze within a pre-specified stimulus region. The eye-tracking system can
capture and statistically calculate the eye gazes and fixation time within each of the
predefined regions. Most current software calculates gaze on the basis of analysis of the
infrared reflection from the pupil and cornea.(Nguyen, Isaacowitz et al. 2009)
Using the eye-tracking technique, many authors have separated the face being
viewed into an internal and external region. Studies have consistently shown that the
internal region is more important when processing faces compared with the external
region (80-97% of fixations). Within the internal region, a person usually fixates first on
the eyes, nose, and mouth, then other landmarks but returns again and again to the eyes,
17
nose, and mouth. Specifically, the observer fixates the most attention on the iris.
(Walker-Smith, Gale et al. 1977; Janik, Wellens et al. 1978; Bruce and Young 1986;
Althoff and Cohen 1999)
Yarbus (1961) demonstrated that eye movements are not just triggered in a reflex
way by the objects in a scene, but are subject to control by instructions related to the
demands of a particular task. For example, when asked to evaluate the emotional
expression of faces, perceivers looked most at the eyebrows, followed by the mouth and
the eyes (Isaacowitz, Wadlinger et al. 2006). When asked to judge age and fatigue of the
human face, participants spent the most time looking at the eye region (~30%), then the
forehead and nose regions (~15%).(Nguyen, Isaacowitz et al. 2009)
With the internal region of the face considered the most important when viewing
faces, our study choose to simulate asymmetries in the eyes, nose and mouth.
Perceiving Facial Imbalance -
Perception is defined as the process by which patterns of environmental stimuli are
organized and interpreted. It is a complex experience that can be influenced by: physical
(colour, texture, shape), physiological (nervous system pathways), psychological (mental
state) and social factors. (Giddon 1995)
Perception of facial attractiveness - The importance of symmetry in rating facial
attractiveness has been studied using computer constructed left-left /right-right symmetric
faces (chimeric faces). Conclusions were that symmetry was either not relevant to
attractiveness (Langlois and Roggman 1990; Chen, German et al. 1997) or that the
perfectly symmetric composite photographs decreased attractiveness scores (Langlois,
Roggman et al. 1994; Zaidel and Deblieck 2007). Faces that are either “too symmetric”
or “too asymmetric” seem to be perceived as unattractive. The acceptable range for how
attractiveness is judged in faces must lie somewhere within the continuum but the borders
of the range are as yet unknown. (Zaidel and Deblieck 2007)
Perception of craniofacial deformity -
Haxton and Giddon (1984) were the first to quantify tolerance for craniofacial
deviation by determining the percent of acceptable and/or unacceptable responses to
18
systematic variations in interocular distance and angulation of the mouth (selected to
simulate various degrees of hypertelorism and/or hypotelorism and mandibular
asymmetry). Five groups of 20 people, varying in familiarity and experience with
craniofacial deviations (CFD), participated: parents and children with CFD, unaffected
children undergoing ordinary dental treatment and their parents, and dental health
professionals. They were asked to rate 10 randomly presented, systemicatically changed
stimulus photographs as either "acceptable" or "unacceptable". For each physical
variation, the logit of the acceptable percentage and line of best fit were used to indicate
acuteness of judgment and 50% thresholds; i.e., the point in physical units above which
50% of the respondents classified the objective stimulus as acceptable and below which
50% considered it unacceptable. In response to changes in interocular distance, the CFD
group was the more acute in its judgments. Overall, the discrimination of variations in the
mouth and chin was less acute than for the eyes, with little difference in judgment among
the respondent groups. No specific threshold values were reported in the available
literature for this study.
Padwa et al. (1997) compared the subjective evaluation of occlusal canting in frontal
photographs with objective radiographic measurements (occlusal plane to true horizontal)
to determine the radiographic threshold at which a labial cant is recognized as abnormal.
Frontal photographs (at rest and smiling) of two groups of orthognathic surgery patients
were evaluated. Group 1 consisted of patients with a documented occlusal cant (n = 21),
and group 2 consisted of patients with no cant (n = 22). Four untrained and five trained
observers, independently, and blind to the diagnoses, assessed patient photographs to
judge the presence or absence of canting. Radiographic cants greater than 4 degrees were
detected clinically with greater than 90% frequency by all observers. Two degrees of
canting was recognized by approximately 50% of subject in both groups.
Most recently, Evans et al. (2005) estimated a range of acceptable appearances for an
increase in interocular distance and canting of the mouth (similar to Haxton, 1984). The
evaluation stimulus was full frontal black and white photos of an 8 yr old boy and 11 yr
old girl. The eyes and mouth were cut out, modified, taped in place, and subsequently
used to create Kodachrome slides. The ratio of eye deviation was determined by dividing
19
the distance between the eyes by the average eye fissure width distance. Mandibular
asymmetry was presented as a change in mouth angulation and chin position.
There were four groups of judges: dental professionals, orthodontic patients and their
parents, craniofacial patients and their parents, “normal” patients and their parents.
Judges were instructed to focus only on the mouth and eyes, and to ignore other facial
features. They were told that there were no right or wrong answers, only to indicate
whether the photo was acceptable or not unacceptable.
While the four groups of judges equally discriminated the distance between the eyes,
dental professionals had the narrowest range of acceptability compared to the other
groups.
When the angulation of the mouth was judged, the craniofacial group demonstrated
greater sensitivity than the other three groups. While the CF group had a 50%
acceptability rate at 85 degrees, all three other groups were at 50% acceptance between
86-87 degrees. Despite this, their acceptability fell to 0% at 80 degrees while the other
groups didn’t reach 0% acceptability until mouth angulation reached 75-79 degrees.
It was noted in the discussion of this study that the female facial image used for
evaluation of mouth angulation had a facial expression of emotion, which may have
influenced results (a smurk).
In the only study to evaluate the perception of nasal asymmetry, Nouraei et al. (2009)
have recently demonstrated that objective changes in nasal symmetry are significantly
associated with changes in the perception of the face as symmetrical or asymmetrical.
They correlated pre- and 6 month post-rhinoplasty subjective evaluation of facial
symmetry with objective measures of nasal symmetry. Most patients who experienced a
positive perceptual shift had improvements in the degree of nasal symmetry that
exceeded 2%. Conversely, 87.5% of patients who experienced a negative perceptual shift
had improvements in nasal symmetry that were less than 2%; indeed, the majority of
them, in fact, experienced loss of nasal symmetry. Therefore, they concluded that a loss
of nasal symmetry has a greater influence in causing a negative perceptual shift than
attainment of facial symmetry has in causing a positive shift in perception.
Within the few investigations studying perception of facial deviation, there were
some limitations. The use of black and white photos and stimulus faces that were

20
presented at approximately two thirds of the actual head size could potentially affect
perceptual judgments. It is intuitive that the more realistic the presentation of a face to an
evaluator, the more realistic the response.
In conclusion, research has shown a range of abilities exists in the capacity to discern
and make meaningful judgments about facial appearance. Variability in facial
discrimination ability arises from 2 major sources: individual organic or hard-wiring
capability, and qualitative and quantitative visual perceptual experience. (Masella 2007)
21
3 Objectives of the Study
Improvements in Plastic and Reconstructive surgery over the past 20 years have
made it possible to bring previously untreatable facial deformities and anomalies closer to
socially acceptable standards of appearance (Evans, Viana et al. 2005). The practical
clinical question is how close to an idealized appearance do health care providers actually
have to come to maximize treatment outcome, including patient satisfaction, psychosocial
well-being, and quality of life (Wilkins, Lowery et al. 1996).
Little information exists on the anthropometric measures that distinguish the
perception of acceptable from unacceptable facial appearance among health care
professionals and laypeople.
Therefore, the objective of this study is to determine how much asymmetric change
there must be in a particular facial feature before it is perceived as unacceptable to plastic
surgeons, orthodontists and the lay population.
Specific questions to be answered:
(1) Are there specific thresholds at which facial imbalance is deemed unacceptable?
(2) Is the professional eye more critical of facial asymmetry than the lay population?

22
4 Hypotheses
1) There are specific thresholds beyond which regional facial asymmetry is
considered unacceptable.
2) Interdisciplinary variation exists with respect to the detection of facial asymmetry.
23
5 Materials and Methods
This study obtained approval from the Research Ethics Board at the Hospital for Sick
Children in Toronto, Ontario. Before the study was undertaken, a power analysis was
carried out with the assistance of Derek Stephens in the Biostatistics Methodology Unit at
The Hospital for Sick Children Research Institute. It was calculated that approximately
20 subjects were needed in each group to have a high (0.9) probability of detecting a
clinically significant difference (assumed to be 1mm), if one existed. This number is
consistent with sample sizes of similar studies. (McKoy-White, Evans et al. 2006; Miner,
Anderson et al. 2007)
Initial images were taken at Sick Kids hospital using 3dMD (version 6.6)
stereophotogrammetry. All photographs were taken by a single technician specializing in
craniofacial photography. Informed consent was obtained from all subjects imaged. It
was clearly stated that a movie of their manipulated face would be shown to other
healthcare professionals and laypersons involved in the study, and that although no
personal identification would be used, the identifiability of their picture to persons
involved in the study was unavoidable.
A four-pod stereo configuration using 25 mm lens, at a predetermined setup (height,
distance) was used to image subjects. Calibration of the camera was undertaken prior to
imaging every participant. Incandescent overhead lighting and an internal flash unit were
employed for lighting.
The participant being imaged knelt in the centre of the setup facing a single
predetermined camera. Four images per subject were captured in natural head position.
From these, the best image was selected based on overall quality and ideal geometric
representation of facial features.
During rendering, fixed patch dimension was set at ‘30’, which represents the
minimal size for which a polygon will be generated within the image. The number of
approximations per polygon (Mdiv) was set at ‘0’. This was accomplished within the
Mstereo.ini file. All images were processed in batch to produce their corresponding
object (.obj) files.
24
Six subjects’ photographs were selected, chosen to represent average looking young
adult faces, aged 16-30. They included a male and female Caucasian, Chinese, and
African American. The faces were then compared to average anthropometric facial
proportions described by Farkas9 to ensure a true representation of an average sized face.
This was done within the 3dMD software where it is possible to take indirect facial
measurements and contrast them to normal racial and age values.
3dMD images were converted from their proprietary .TSB format and exported as
universal readable object (.obj) and bitmap (.bmp) files to Maya Unlimited v9.0. Image
evaluation at different processing levels (FPD, mdiv) of 3dMD was done to confirm ideal
smoothness of wireframe and minimize any missing facial data. The total polygon faces
were limited (<200,000) to ensure efficiency of manipulation within Maya.
The bitmap files were imported into Photoshop Elements version 6 and modified in
the frontal and lateral views to remove any distracting image irregularities. The clone
stamp tools removed excess glare from forehead and cheeks and optimized color values
within the ocular and alar region. In profile views the eyelashes were removed to limit
shadows that projected onto the nose on a frontal view. Any moles or blemishes were
removed. These modified files were then imported back into Maya software.
The remaining image manipulation was completed within Maya. All work using
Maya and Adobe After Effects was completed under the supervision of Andrea Cormier
working in the Media Services Department, Faculty of Dentistry, at the University of
Toronto.
Initially, object (.obj) wireframe models were smoothed in the area of the canthus,
columella and ala for a more natural appearance. This was done using the sculpt
geometry tool.
Touched up bitmaps (.bmp), generated from the 3DMD software, were applied to the
wireframe models as file textures. The models were oriented in both the frontal and
lateral views. Natural head position was reproduced based on initial image capture and
parallelism between of the intercanthal plane to the x-axis. For any minor bilataral ocular
differences that existed (less than 1 mm), minor adjustment of one eye (including brow
and surrounding soft tissue) vertically and horizontally to idealize position was done
25
using the cluster function. The facial midline was defined as a sagittal line that started in
the hairline (trichion), then crossed the central point above the bridge of the nose
(nasion), the central portion of Cupid’s bow (labrale superius), and the chin (menton).
Because inherent facial asymmetries exist in every face, these points were not always in a
perfectly straight line, in which case the midline was drawn as the line of best fit. This
facial midline was aligned to the y-axis. Natural head position was verified in lateral
view.
Models were scaled to ensure proper facial size based on original measurements
within 3dMD software. Preferences in the software were set to millimeter and degree
measurements. When needed, models were modified to fit the average anthropometric
facial proportions of Farkas (1994) according to age and race.
Models were cleaned to remove any extra polygons that were generated during image
capture and not within the framework of the head. If minor gaps existed in the model they
were filled using the Append to Polygon tool or the Merge tool.
Following image idealization and orientation, one model file per subject was saved as
a reference Maya file for future animation.
Based on anthropometric landmarks used by (Farkas 1994), discrete distortions of
three facial features – the eyes, nose, and mouth – were created. A total of six
manipulations per model were animated. These included asymmetric changes in
interocular distance, ocular angulation, ocular height, ocular shape, nasal angulation and
mandibular asymmetry.
For each animation the process was as follows. A new scene was opened within
Maya and the saved reference file was referenced into the scene file. Clusters were
created to select facial features of interest. The ocular cluster for angulation and height
extended from superciliare (sci) to orbitale (or) vertically and endocanthion (en) to
exocanthion (ex) horizontally. The ocular cluster for shape extended from palpebrale
superius (ps) to palpebrale inferius (pi) inferiorly and endocanthion (en) to exocanthion
(ex) horizontally. Nasal cluster extended from sellion (se) to subnasale (sn) vertically
and bilaterally to alar crest (ac). Mandibular cluster extended from tragion (right) to
subnasale to tragion (left) superiorly and gonion (right) to menton to gonion (left)
inferiorly.
26
After clusters were created, the transform and rotate functions increased facial
asymmetry to a point when the feature appeared maximally unacceptable. These extreme
distortions were determined by the boundaries that existed within the smoothing function
of the software to have surrounding soft tissue appear normal (i.e. all movements were
made with an attempt to keep the remaining facial features looking natural). The borders
of animated features were blended using the paint cluster weight tool to make
asymmetries realistic without changing the dimensions of the intentionally animated
features.
The outer limits of feature movement were confirmed in the frontal view with a
calibrated distance tool within the software. Animation keys were subsequently set to
reflect appropriate frame numbers. All linear movements occurred at a rate of 0.1
millimeter per frame and all angular measurements at a rate of 0.1 degree per frame. For
the animation of ocular shape the movement occurred at a rate of 0.5 percent per frame.
Asymmetric features were created to reflect the following movements:
a. Interocular Distance: +/- 15 millimeters
b. Palpebral fissure angulation: +/- 15 degrees from x-axis
c. Vertical orbital position: +/- 10 millimeters along y-axis
d. Orbital Shape - height:width ratio increased and decreased by 50%
e. Nasal angulation: +/- 10 degrees from y-axis
f. Mandibular symmetry: +/- 10 millimeters from menton to y-axis
Animations were created to depict the face changing slowly from symmetry towards
extremes of asymmetry. For example: symmetric to positive asymmetry, Positive
asymmetry to symmetric, symmetric to negative asymmetry, negative asymmetry to
symmetric, symmetric to positive asymmetry, positive asymmetry to symmetric,
symmetric to negative asymmetry, negative asymmetry to symmetric. The rate of
movement was confirmed within the graph editor function.
An internal software camera was set up in each reference file to ensure natural head
position was maintained (parallel to z-axis of the rendering camera). Each animation was
rendered from Maya as individual frames to a sequence of targa (.tga) files in a specified
folder. Production quality setting was used during rendering.
27
Targa (.tga) files were then imported and saved in Adobe After Effects for sequencing
and export as both QuickTime (.mov) and Audio Video Interleave (AVI) file formats.
At this stage there were 36 animations. For each of the six subjects imaged, there
were 6 animations to represent each of the 6 asymmetries. To limit the length of
evaluation by judges in the following steps, 12 animations that equally represented each
gender and racial group were selected.
While animations were being created, an interactive flash application was developed
in Adobe Creative Suite 3. This was done with the assistance of Neil Darbyshire who
works in the Computer Services Department, Faculty of Dentistry, at the University of
Toronto. The purpose of the program was twofold. First, it provided a template to
present the animations to judges, including an initial introduction to the study and
instructions on completing the evaluation. Secondly, the application functioned to record
a time-code when the evaluator pressed and released the computer mouse button. It
stored the time-codes for each evaluator and these times were subsequently imported into
Microsoft excel for calculation of unacceptable asymmetry values based on the frames
per second of presentation (15 frames/second) and total frames (540-1200).
The program was presented to judges on a 24-inch LCD high definition monitor that
allowed depiction of the faces at actual head size. Facial measurements were confirmed
based on facial height and depth lengths.
Judges consisted of 20 plastic surgeons, 20 orthodontists, and 20 laypersons. They
were recruited from the University of Toronto, Hospital for Sick Kids in Toronto,
London Health Sciences Centre and Women’s College Hospital in Toronto. At the start
of the experiment, participants were asked to report demographic information, including
age, gender, ethnicity, vision problems, and number of years in practice (orthodontists
and plastic surgeons only).
After a visual demonstration of the study and brief tutorial from the principal
investigator, each judge completed one task. The judge was instructed to respond to the
animated feature by pressing the mouse button when the face looked unacceptable, and
hold it down as long as the image remained unacceptable, only to release it when the
image became acceptable again. For the three respondent groups the results for each
asymmetric feature were based on the mean of the two completed trials.
28
Following the methods of (Giddon 1995), to avoid semantic confusion in our own
research, the term "acceptable" was selected as the generic description encompassing all
the other superlatives; i.e., all beautiful or pleasant faces would be considered acceptable;
and all unpleasant, ugly, or unattractive faces would be considered unacceptable. To
minimize fatigue, habituation, and order effects, feature order was randomized across
judges.
All equipment involved in the study was hand sterilized between participants as the
majority of evaluations were undertaken in a health care setting.
Statistical Analysis - The aggregated results of all evaluators was used to calculate
the overall unacceptable asymmetry thresholds. (hypothesis 1)
An analysis of variance was performed to test the hypothesis that there was a
difference between the mean thresholds of each group, for each asymmetric feature.
(hypothesis 2)
All demographic information collected from judges was bivariable, therefore
Student’s t-tests were conducted to determine the association between the sex, ethnicity,
age/experience, and vision of the judges and their perception of asymmetry.
29
6 Results
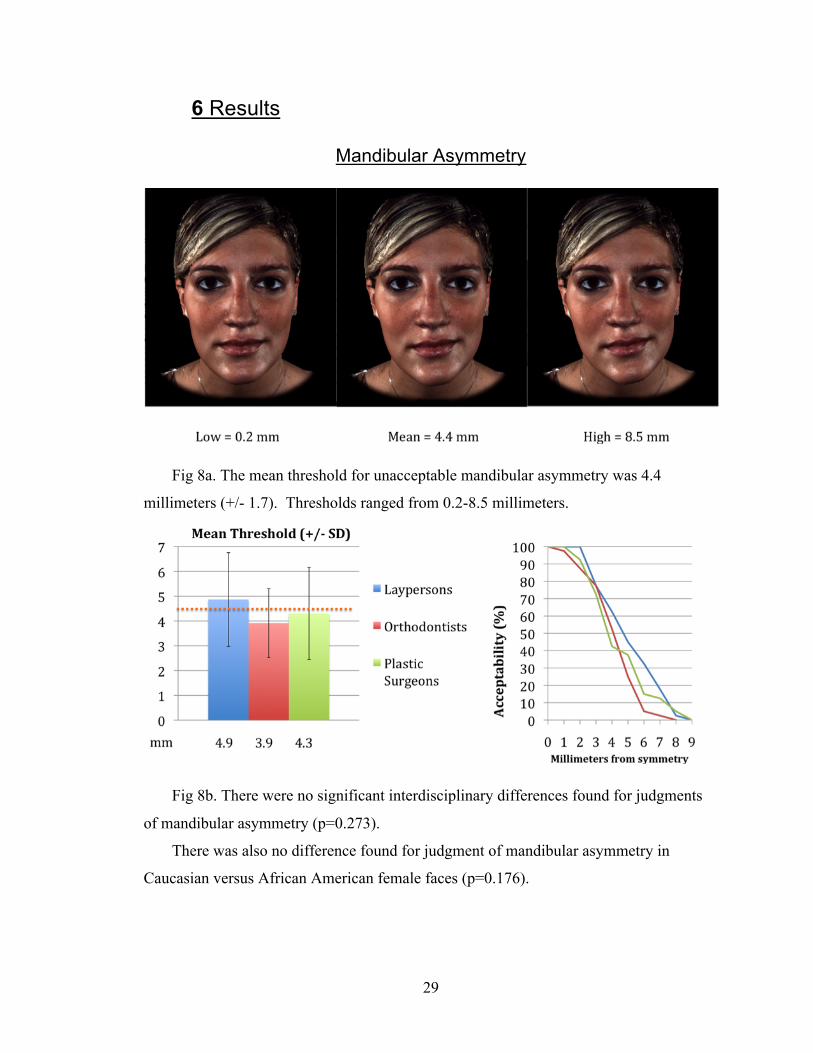
Mandibular Asymmetry
Fig 8a. The mean threshold for unacceptable mandibular asymmetry was 4.4
millimeters (+/- 1.7). Thresholds ranged from 0.2-8.5 millimeters.
Fig 8b. There were no significant interdisciplinary differences found for judgments
of mandibular asymmetry (p=0.273).
There was also no difference found for judgment of mandibular asymmetry in
Caucasian versus African American female faces (p=0.176).

30
Nasal Asymmetry
Fig 9a. The mean threshold for unacceptable nasal asymmetry was 2.8 degrees (+/-
1.0). Thresholds ranged from 0.9-6.6 degrees.
Fig 9b. There were no significant interdisciplinary differences found for judgments
of nasal asymmetry (p=0.546).
Judges were slightly (0.35mm) more critical of nasal asymmetry in Caucasian female
than African American male faces (p=0.0013). The biggest difference existed within the
plastic surgery group (0.5 mm).
31
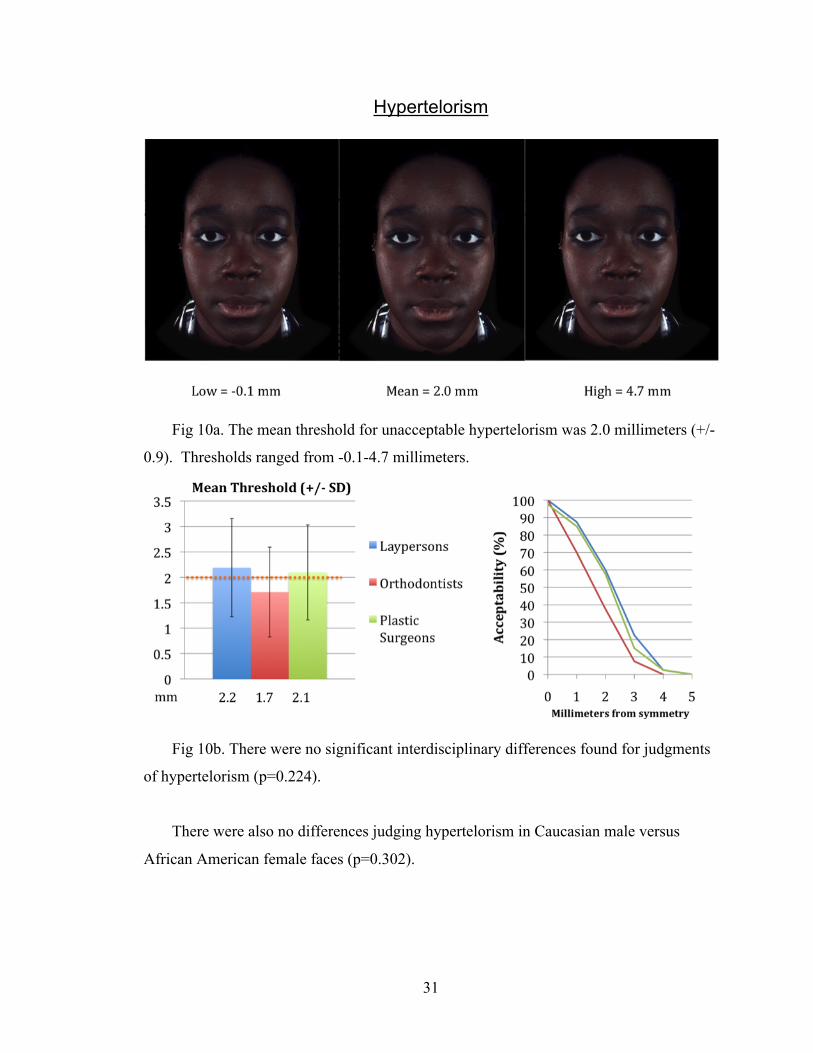
Hypertelorism
Fig 10a. The mean threshold for unacceptable hypertelorism was 2.0 millimeters (+/-
0.9). Thresholds ranged from -0.1-4.7 millimeters.
Fig 10b. There were no significant interdisciplinary differences found for judgments
of hypertelorism (p=0.224).
There were also no differences judging hypertelorism in Caucasian male versus
African American female faces (p=0.302).
32
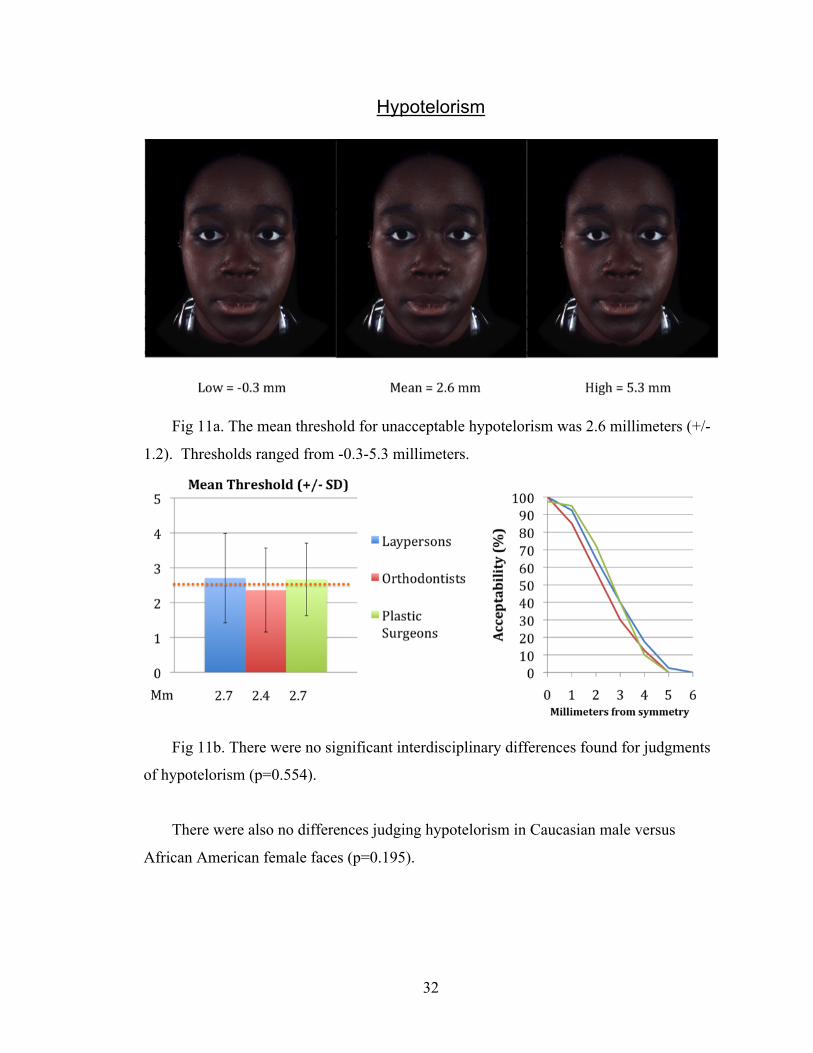
Hypotelorism
Fig 11a. The mean threshold for unacceptable hypotelorism was 2.6 millimeters (+/-
1.2). Thresholds ranged from -0.3-5.3 millimeters.
Fig 11b. There were no significant interdisciplinary differences found for judgments
of hypotelorism (p=0.554).
There were also no differences judging hypotelorism in Caucasian male versus
African American female faces (p=0.195).
33
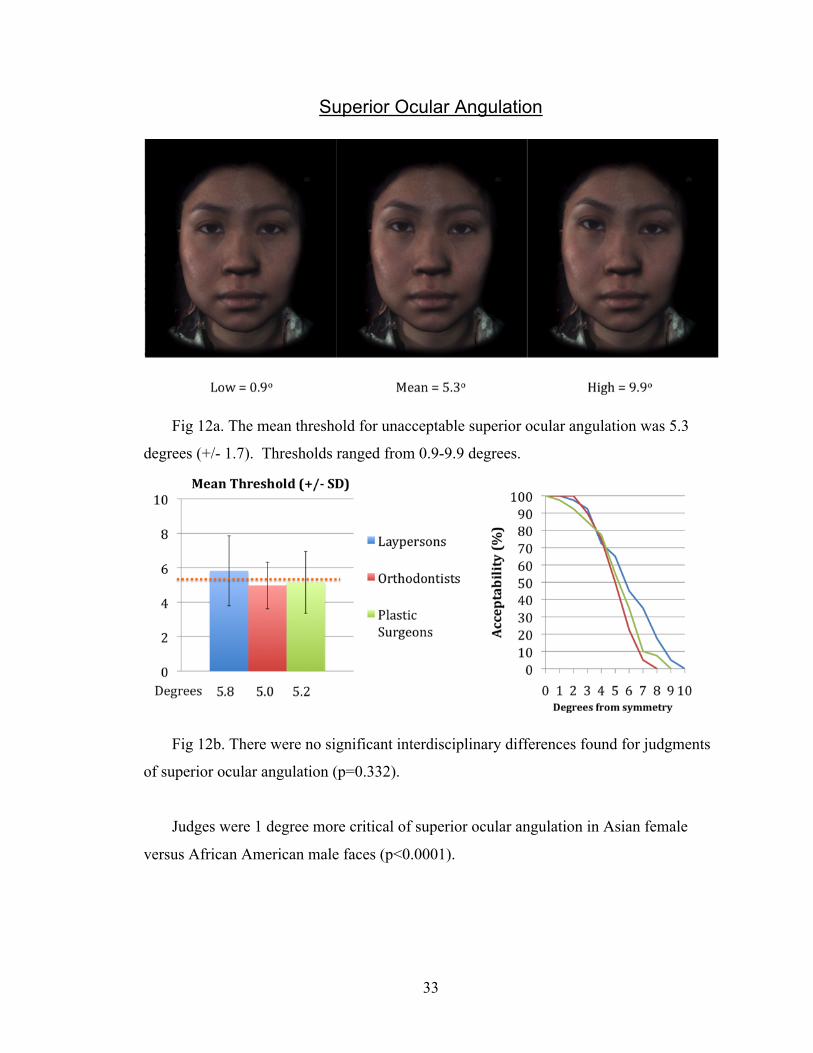
Superior Ocular Angulation
Fig 12a. The mean threshold for unacceptable superior ocular angulation was 5.3
degrees (+/- 1.7). Thresholds ranged from 0.9-9.9 degrees.
Fig 12b. There were no significant interdisciplinary differences found for judgments
of superior ocular angulation (p=0.332).
Judges were 1 degree more critical of superior ocular angulation in Asian female
versus African American male faces (p<0.0001).
34
Inferior Ocular Angulation
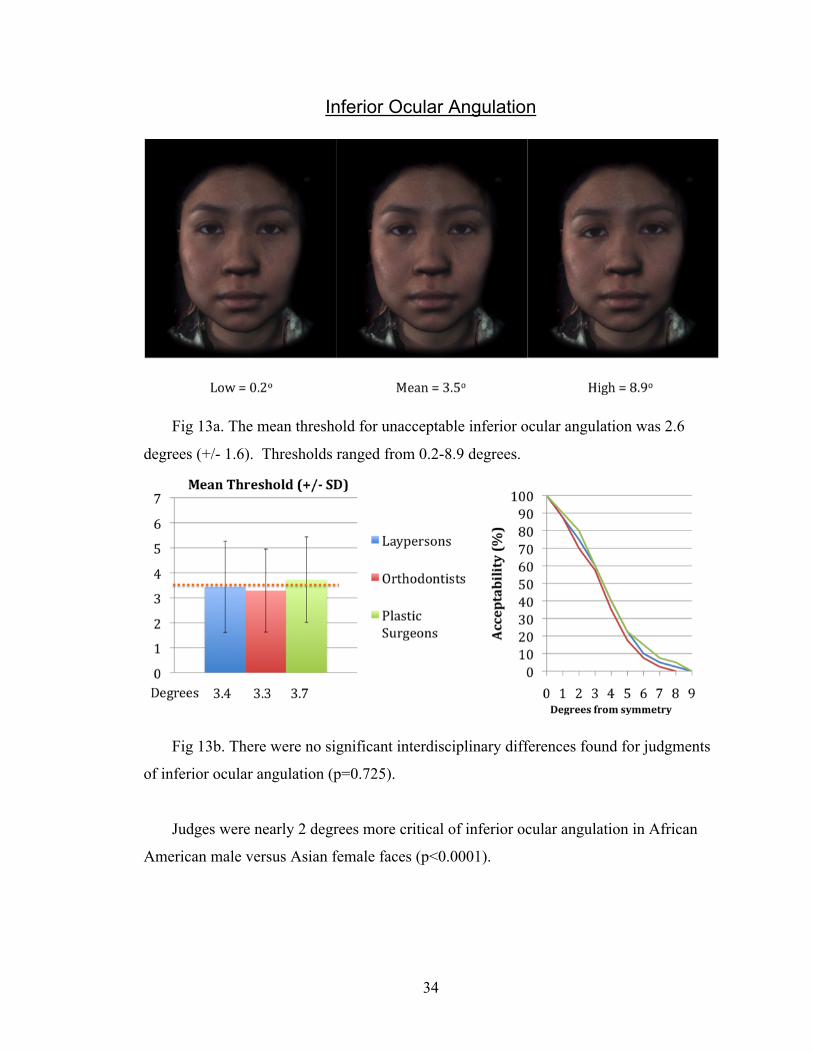
Fig 13a. The mean threshold for unacceptable inferior ocular angulation was 2.6
degrees (+/- 1.6). Thresholds ranged from 0.2-8.9 degrees.
Fig 13b. There were no significant interdisciplinary differences found for judgments
of inferior ocular angulation (p=0.725).
Judges were nearly 2 degrees more critical of inferior ocular angulation in African
American male versus Asian female faces (p<0.0001).
35
Superior Ocular Dystopia
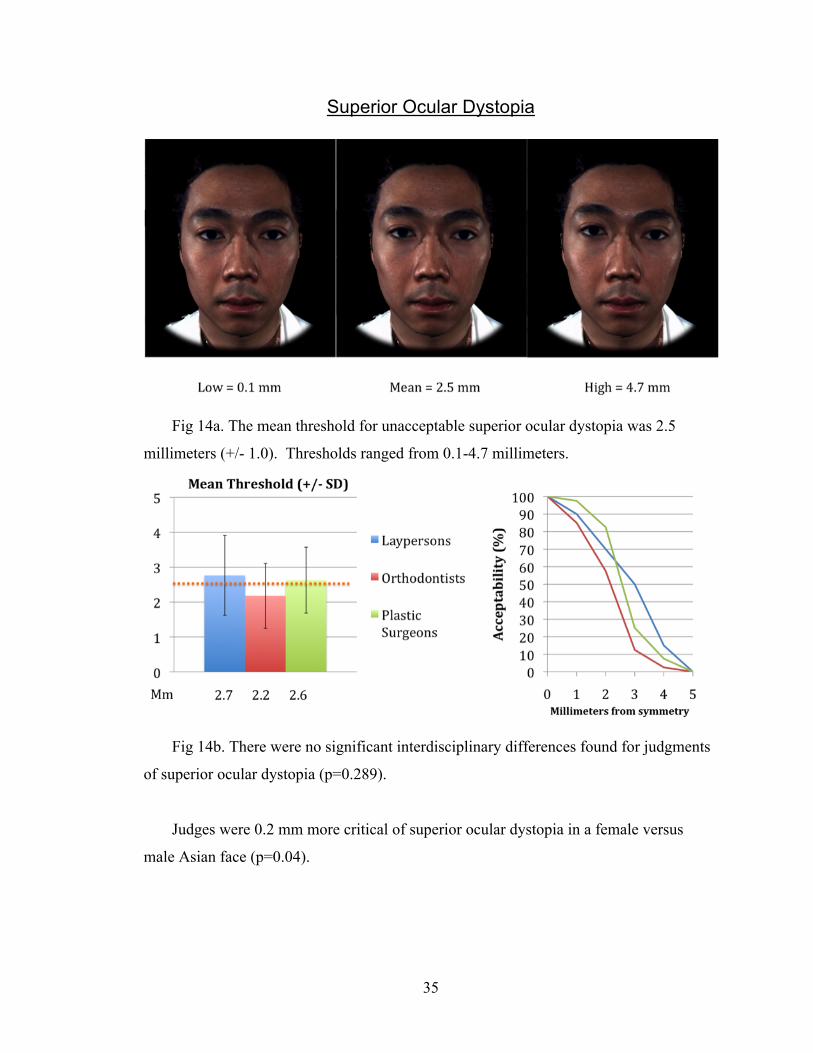
Fig 14a. The mean threshold for unacceptable superior ocular dystopia was 2.5
millimeters (+/- 1.0). Thresholds ranged from 0.1-4.7 millimeters.
Fig 14b. There were no significant interdisciplinary differences found for judgments
of superior ocular dystopia (p=0.289).
Judges were 0.2 mm more critical of superior ocular dystopia in a female versus
male Asian face (p=0.04).
36
Inferior Ocular Dystopia
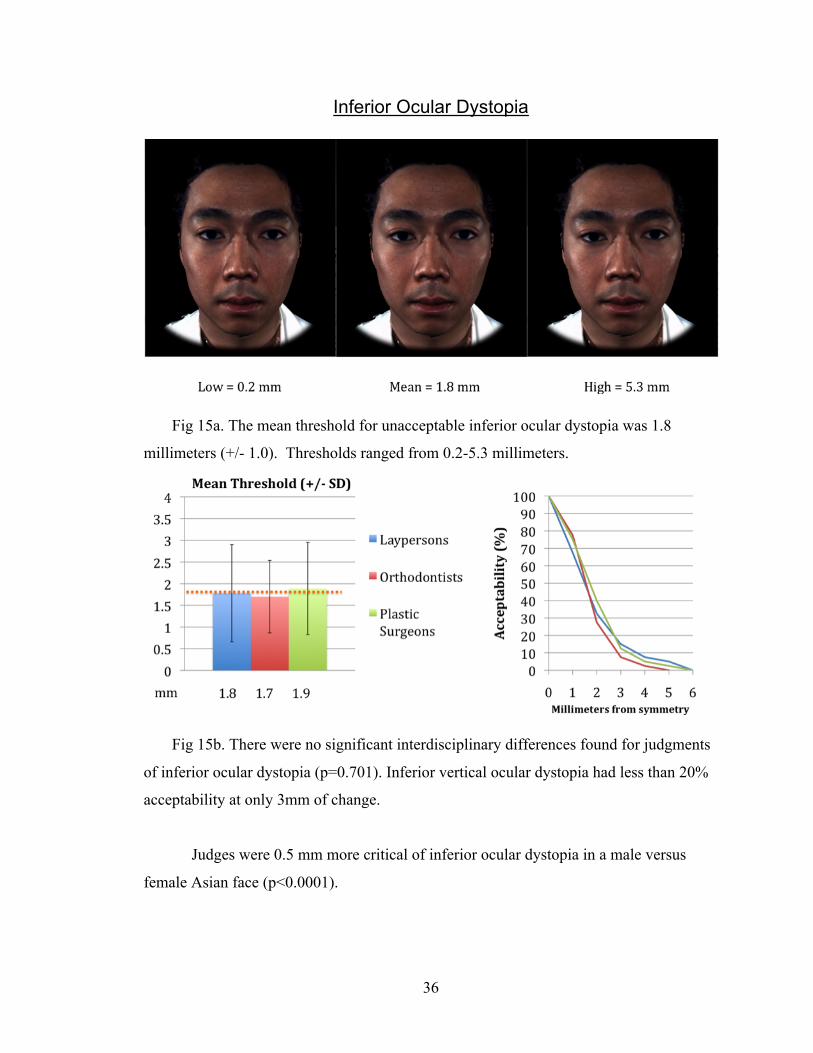
Fig 15a. The mean threshold for unacceptable inferior ocular dystopia was 1.8
millimeters (+/- 1.0). Thresholds ranged from 0.2-5.3 millimeters.
Fig 15b. There were no significant interdisciplinary differences found for judgments
of inferior ocular dystopia (p=0.701). Inferior vertical ocular dystopia had less than 20%
acceptability at only 3mm of change.
Judges were 0.5 mm more critical of inferior ocular dystopia in a male versus
female Asian face (p<0.0001).
37
Round Ocular Shape
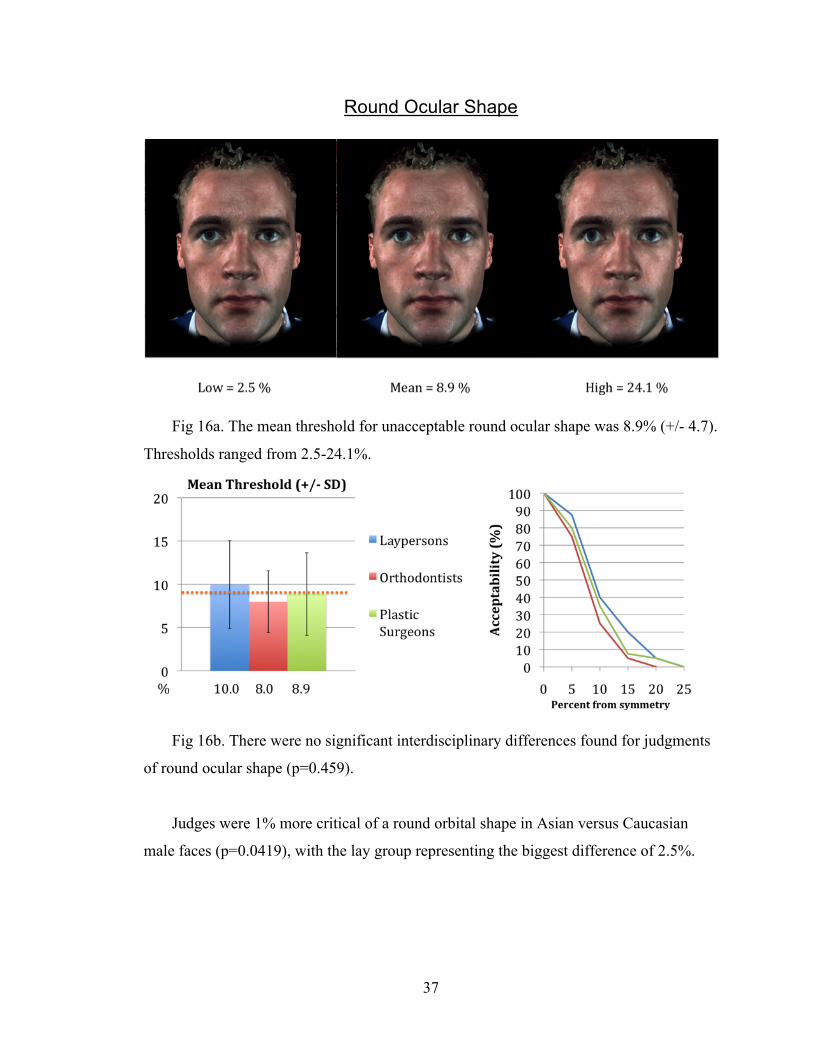
Fig 16a. The mean threshold for unacceptable round ocular shape was 8.9% (+/- 4.7).
Thresholds ranged from 2.5-24.1%.
Fig 16b. There were no significant interdisciplinary differences found for judgments
of round ocular shape (p=0.459).
Judges were 1% more critical of a round orbital shape in Asian versus Caucasian
male faces (p=0.0419), with the lay group representing the biggest difference of 2.5%.
38
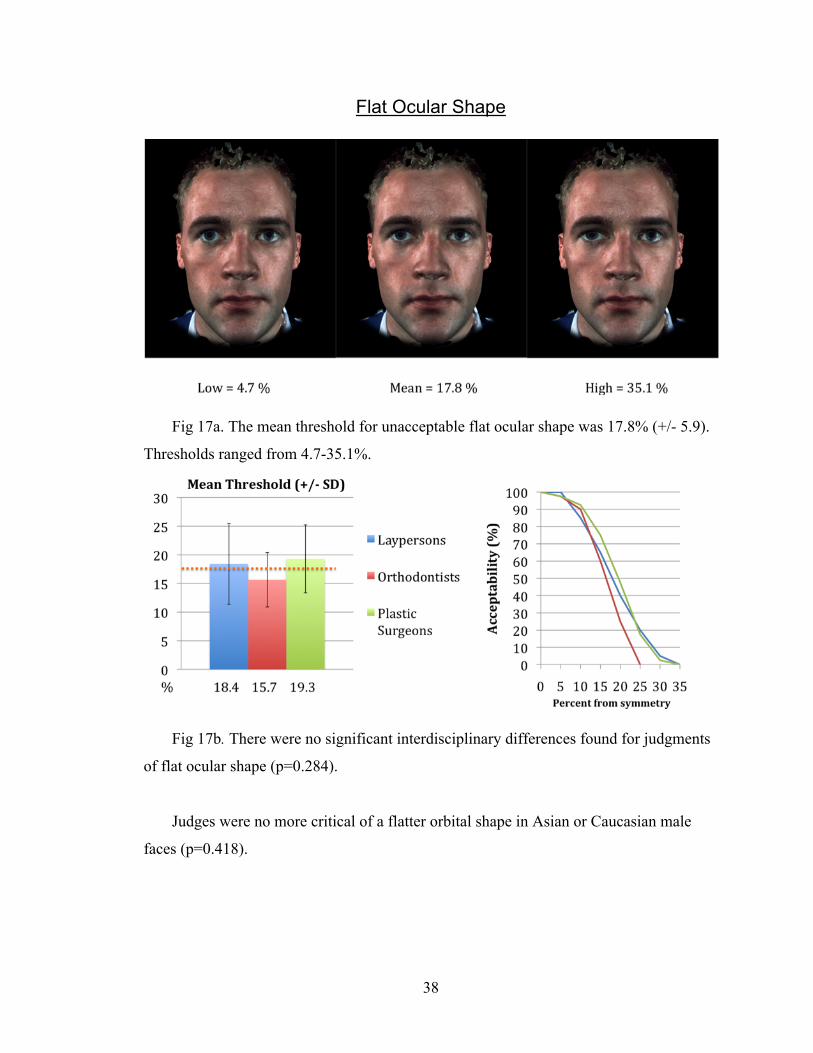
Flat Ocular Shape
Fig 17a. The mean threshold for unacceptable flat ocular shape was 17.8% (+/- 5.9).
Thresholds ranged from 4.7-35.1%.
Fig 17b. There were no significant interdisciplinary differences found for judgments
of flat ocular shape (p=0.284).
Judges were no more critical of a flatter orbital shape in Asian or Caucasian male
faces (p=0.418).
39
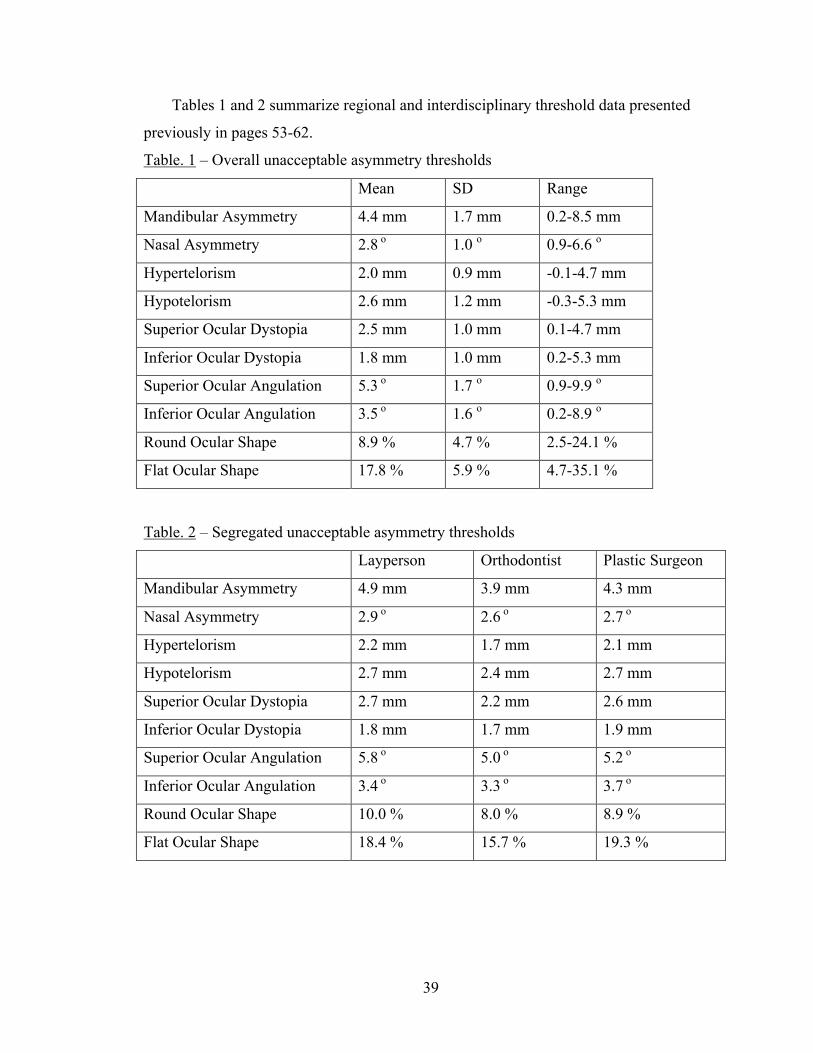
Tables 1 and 2 summarize regional and interdisciplinary threshold data presented
previously in pages 53-62.
Table. 1 – Overall unacceptable asymmetry thresholds
Mean SD Range
Mandibular Asymmetry 4.4 mm 1.7 mm 0.2-8.5 mm
Nasal Asymmetry 2.8 o 1.0 o 0.9-6.6 o
Hypertelorism 2.0 mm 0.9 mm -0.1-4.7 mm
Hypotelorism 2.6 mm 1.2 mm -0.3-5.3 mm
Superior Ocular Dystopia 2.5 mm 1.0 mm 0.1-4.7 mm
Inferior Ocular Dystopia 1.8 mm 1.0 mm 0.2-5.3 mm
Superior Ocular Angulation 5.3 o 1.7 o 0.9-9.9 o
Inferior Ocular Angulation 3.5 o 1.6 o 0.2-8.9 o
Round Ocular Shape 8.9 % 4.7 % 2.5-24.1 %
Flat Ocular Shape 17.8 % 5.9 % 4.7-35.1 %
Table. 2 – Segregated unacceptable asymmetry thresholds
Layperson Orthodontist Plastic Surgeon
Mandibular Asymmetry 4.9 mm 3.9 mm 4.3 mm
Nasal Asymmetry 2.9 o 2.6 o 2.7 o
Hypertelorism 2.2 mm 1.7 mm 2.1 mm
Hypotelorism 2.7 mm 2.4 mm 2.7 mm
Superior Ocular Dystopia 2.7 mm 2.2 mm 2.6 mm
Inferior Ocular Dystopia 1.8 mm 1.7 mm 1.9 mm
Superior Ocular Angulation 5.8 o 5.0 o 5.2 o
Inferior Ocular Angulation 3.4 o 3.3 o 3.7 o
Round Ocular Shape 10.0 % 8.0 % 8.9 %
Flat Ocular Shape 18.4 % 15.7 % 19.3 %
40
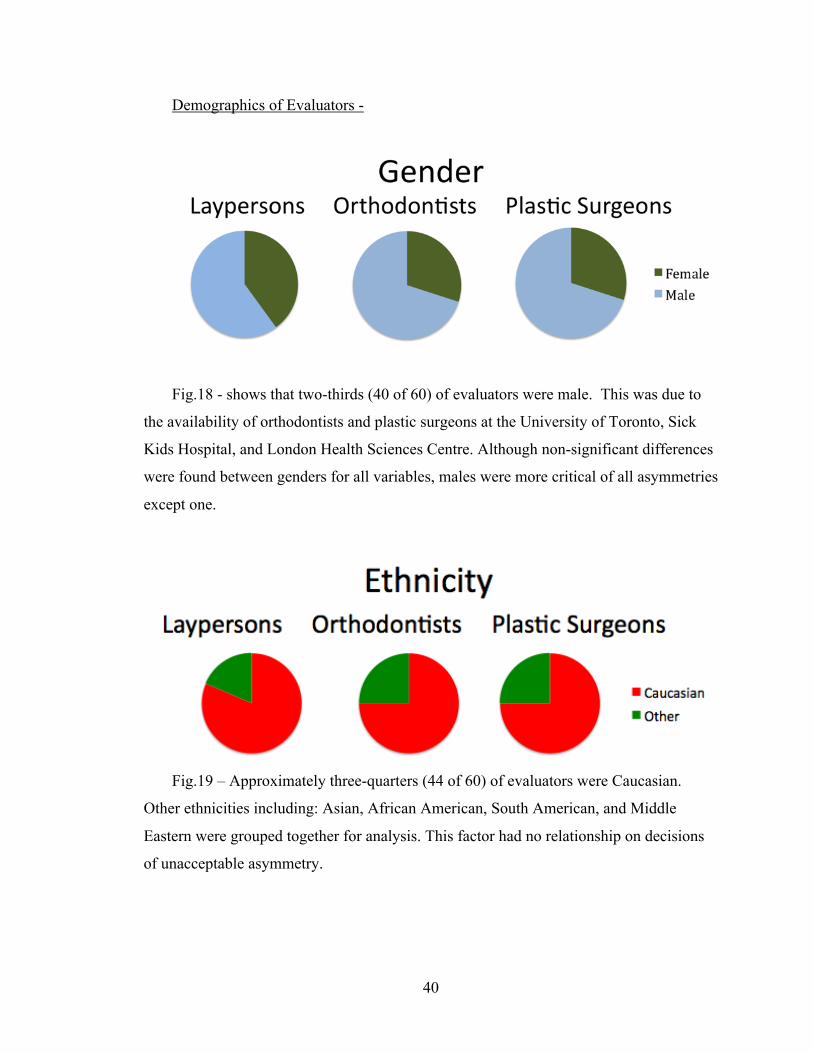
Demographics of Evaluators -
Fig.18 - shows that two-thirds (40 of 60) of evaluators were male. This was due to
the availability of orthodontists and plastic surgeons at the University of Toronto, Sick
Kids Hospital, and London Health Sciences Centre. Although non-significant differences
were found between genders for all variables, males were more critical of all asymmetries
except one.
Fig.19 – Approximately three-quarters (44 of 60) of evaluators were Caucasian.
Other ethnicities including: Asian, African American, South American, and Middle
Eastern were grouped together for analysis. This factor had no relationship on decisions
of unacceptable asymmetry.
41
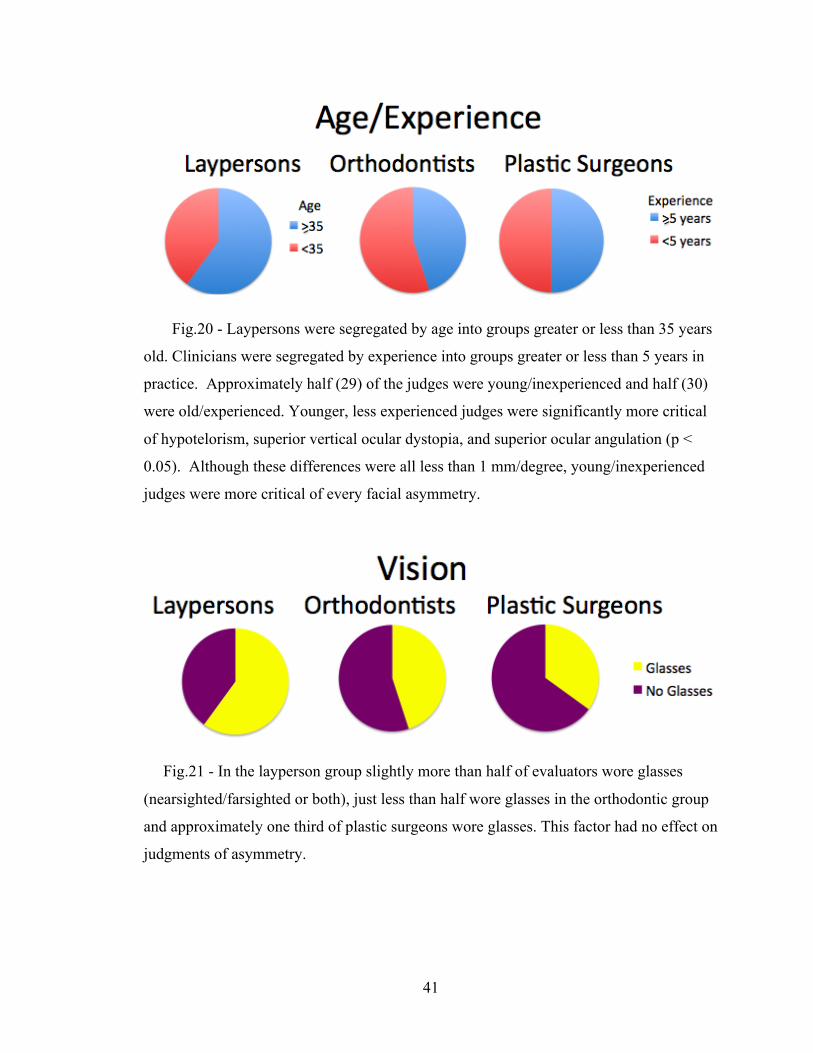
Fig.20 - Laypersons were segregated by age into groups greater or less than 35 years
old. Clinicians were segregated by experience into groups greater or less than 5 years in
practice. Approximately half (29) of the judges were young/inexperienced and half (30)
were old/experienced. Younger, less experienced judges were significantly more critical
of hypotelorism, superior vertical ocular dystopia, and superior ocular angulation (p <
0.05). Although these differences were all less than 1 mm/degree, young/inexperienced
judges were more critical of every facial asymmetry.
Fig.21 - In the layperson group slightly more than half of evaluators wore glasses
(nearsighted/farsighted or both), just less than half wore glasses in the orthodontic group
and approximately one third of plastic surgeons wore glasses. This factor had no effect on
judgments of asymmetry.
42
7 Discussion
No previous studies have established threshold levels of unacceptable facial
asymmetry by evaluating the perception of plastic surgeons, orthodontists and laypeople.
Regional differences were found for the thresholds of unacceptable asymmetry.
Judges were quicker to pick up on asymmetries in static regions of the face, where, for
example, changes to ocular position are not commonly encountered. Larger asymmetries
were required to evoke unacceptable responses in mobile areas of the face, where we are
accustomed to seeing changes in mandibular position during speech and mastication.
Mandibular asymmetry was judged to be unacceptable at 4.4 millimeters of
deviation. Orthodontists were most critical of African American mandibular asymmetry,
which was almost significantly different from laypersons judgments (p=0.06). Plastic
surgeons showed the most variability in their judgment, while orthodontists showed the
least.
Previous research by (Farkas 1994) indicates the maximum normal asymmetry
measured from tragion to menton was 2.7 millimeters, which correlates well with the
threshold found in the present study.
In similar studies separated by nearly 25 years, (Haxton 1984; Evans, Viana et al.
2005) tested the perception of mandibular asymmetry amongst five groups of people,
varying in familiarity and experience with craniofacial deviations. They both estimated a
range of acceptable appearances by increasing the cant of the mouth. Although the
present study did not measure the change in mouth angulation but rather the change in
distance from menton to midsagittal plane, their results mimic the fact that there was little
difference in judgment among the respondent groups (less than 1 mm).
Merging results, it could be stated that a change of approximately 3-4 degrees in
mouth angulation or 4 mm of chin deviation from midsagittal plane is considered
unacceptable, and could be considered a threshold for abnormal mandibular asymmetry.
The nose is the central feature of the face and its dimensions and proportions play an
important role in the overall assessment of facial esthetics. Nasal asymmetry was
considered unacceptable on average when the long axis of the nose deviated from the
43
midsagittal plane by 2.75 degrees. All groups were consistent with each other (means
within 0.4mm). Laypersons showed the most variability in their responses.
(Nouraei, Pulido et al. 2009) has recently demonstrated that objective changes in
nasal symmetry are significantly associated with changes in the perception of the face as
symmetrical or asymmetrical and that loss of nasal symmetry has a greater influence in
causing a negative perceptual shift than attainment of facial symmetry has in causing a
positive shift in perception. The objective measurements used in their study do not
correlate with the measurements in the present study and thus no direct comparison can
be made.
Interocular distance was found to be unacceptable at 2 millimeters of hypertelorism
and 2.6 millimeters of hypotelorism. In both ethnicities presented hypotelorism was
tolerated better than hypertelorism. Similar to nasal asymmetry, changes to interocular
distance were judged as unacceptable in the Caucasian face quicker than the African
American face.
These results correlate well with (Farkas 1994) measurements. He found a
maximum normal asymmetry of 1.7 mm between endocanthion and sellion.
(Haxton 1984) results concur with the fact that evaluators were more acute (smaller
overall values) in their discrimination of variations in the interocular distance than
changes to the mouth and chin. He also found little difference in judgment of
hypertelorism among the respondent groups.
The present results also agree with (Evans, Viana et al. 2005), who found that
although the different groups of judges equally discriminated changes to interocular
distance, the orthodontists (dental professionals) had the narrowest range of acceptability.
Superior ocular angulation was tolerated more (5.6 degrees) than inferior angulation
(3.5 degrees). This may be due to the fact that the eye normally inclines upward
(approximately 2 degrees) from a medial to lateral direction and therefore looks more
natural in this orientation.
Farkas (1994) found that only 2% of the population presented with asymmetries in
eye fissure angulation and the difference bilaterally was a maximum of 1.5 degrees. No
previous research has measured the perception of ocular angulation.
44
Vertical ocular dystopia was found to be unacceptable at a change of 1.8 millimeters
inferiorly and 2.5 millimeters superiorly. Inferior ocular movement was the least tolerated
asymmetric feature. No previous research has measured the perception of vertical ocular
height.
A general trend was established across judges that inferior movements of the eye,
both angular and vertical asymmetries, were less acceptable than superior movements.
In regards to the orbital index, a flatter orbital shape was tolerated twice as well as a
rounder orbital shape (9% versus 18%). Farkas (1994) found that the height and width of
the orbit were rarely asymmetric (<2%) and the linear differences were less than 1.4 mm.
No previous research has measured the perception of ocular shape.
When the data was segregated based on judge demographics several trends emerged.
There were no significant interdisciplinary differences when mean thresholds of
unacceptable asymmetry were compared. Even the features where perceptual differences
were greatest, large intra-group variability negated any significance. Given the very
subjective nature of the task given to the judges, this variability was not a surprise.
Averages between groups for each feature were within 1 mm, 1 degree, or 5 percent.
These results suggest that when averaged, plastic surgeons, orthodontists, and lay people
find facial asymmetries to be unacceptable at similar levels of deviation.
Keeping the previous fact in mind, it was interesting that for every regional
asymmetry, the unacceptable threshold was less for orthodontists than both the plastic
surgeon and layperson groups. This could be due to the fact that very minute occlusal
details are significant during orthodontic treatment. Although very similar in judgment to
laypersons, the plastic surgery group was the next most critical group of facial
asymmetry. Having much more familiarity with major craniofacial deformities, the
plastic surgeons may have a slightly increased tolerance of deviation from symmetry
compared to orthodontists.
Male judges were more critical than female judges (not significantly) of all
asymmetries except one. It has been suggested that anatomical differences in the
occipital cortex plays a part in a male’s fundamental task of seeking out a female mate.
45
Whether males or females are more visual beings remains debated, but in our sample of
subjects the males were more acute in their judgments.
During professional training inexperienced clinicians are taught to treat to ideal
results. It may be possible that with practical experience comes the realization that often
perfection is strived for but rarely achieved. This may help to explain why in this study
experienced clinician’s were more accepting of asymmetry. Another possible
explanation relates to a heightened exposure of digital facial images on social networks
(i.e. Facebook) in the younger generation. Whether to socially engage a person based
solely on their digital image is an experience repeatedly undertaken on these internet
sites.
All evaluator’s data were combined to see if there were overall threshold differences
when the ethnicities being judged was changed. Although there were significant
differences found for nasal asymmetry, vertical ocular positioning and ocular shape, no
trends were established as to which ethnicity carried asymmetry the best.
Limitations -
No attempt was made to control for differences in hand eye coordination (motor
skills) between judges. This may have impacted the results, as the main outcome was
dependent on this factor. Another potential flaw was the selection bias of judges that
were sampled by location convenience. This may limit the extent to which the results can
be generalized.
Future Research -
Opportunity for development exists for the technique and technologies applied in this
study.
a. There was no attempt within the study to have participants judge asymmetries
within their own face. As facial processing is enriched by emotional input, it would be
interesting to see if self-perception is more or less critical of asymmetry.

46
b. Using the same methods and software it would be interesting to test the
perception of changes to the vertical proportions of face – facial thirds, lower facial
thirds, vertical maxillary excess/gingival display on smile and rest. A comparison could
be made between the profile and frontal view to investigate the difference between
perspectives.
c. A comparison from the profile view, three-quarter view, and frontal view for the
perception of anteroposterior maxillary and mandibular dysplasia. It would be interesting
to quantify the probable decrease in appreciation of the discrepancy as the frontal view
was approached.
d. Software development allowing evaluators to “scroll and select” the limit of
acceptability rather than a constantly morphing face. This would also evaluate the
validity of the original technique and remove the “reaction” of the judges in making
decisions of acceptability. This would also eliminate dependence on the subject’s motor
ability.
e. If animations were to include multiple facial changes simultaneously,
characteristic of a craniofacial syndrome, a prompt at the completion of each movie as to
what drew the judge’s attention most in the face would help to evaluate the facial area
most indicative of a problem.
47
8 Conclusion
This study provides quantitative thresholds of unacceptable facial asymmetry as
judged by laypersons, orthodontists and plastic surgeons. The wide range of thresholds
for every feature should help clinicians realize that their own perception of preferences,
expectations and tolerance for change in facial symmetry may be different from those of
their patients.
The results of this study should not be interpreted as anything other than the average
assessment of a group of raters. A person behaves in response to their individualized
perception of a face, and caution must be used if applying group averages directly to a
patient presenting for treatment.
48
9 References Althoff, R. R. and N. J. Cohen (1999). "Eye-movement-based memory effect: a
reprocessing effect in face perception." J Exp Psychol Learn Mem Cogn 25(4): 997-1010.
Bell, W. H., W. R. Proffit, et al. (1980). Surgical correction of dentofacial deformities. Philadelphia, Saunders.
Bishara, S. E., P. S. Burkey, et al. (1994). "Dental and facial asymmetries: a review." Angle Orthod 64(2): 89-98.
Booth, P. W., Schendel, S.A., Hausamen J.E. (c2007). Maxillofacial surgery. St. Louis, Mo., Churchill Livingstone/Elsevier.
Borman, H., F. Ozgur, et al. (1999). "Evaluation of soft-tissue morphology of the face in 1,050 young adults." Ann Plast Surg 42(3): 280-8.
Bruce, V. and A. Young (1986). "Understanding face recognition." Br J Psychol 77 ( Pt 3): 305-27.
Burke, P. H. (1971). "Stereophotogrammetric measurement of normal facial asymmetry in children." Hum Biol 43(4): 536-48.
Chen, A. C., C. German, et al. (1997). "Brain asymmetry and facial attractiveness: facial beauty is not simply in the eye of the beholder." Neuropsychologia 35(4): 471-6.
Chen, C. C., K. L. Kao, et al. (2007). "Face configuration processing in the human brain: the role of symmetry." Cereb Cortex 17(6): 1423-32.
Dolan, R. J. (2002). "Emotion, cognition, and behavior." Science 298(5596): 1191-4. Evans, C. A., G. Viana, et al. (2005). "Tolerance of deviations in eye and mouth
position." Orthod Craniofac Res 8(2): 75-84. Farah, M. J., K. D. Wilson, et al. (1998). "What is "special" about face perception?"
Psychol Rev 105(3): 482-98. Farkas, L. G. (1994). Anthropometry of the Head and Face, 2nd Ed., Raven Press. Farkas, L. G., C. R. Forrest, et al. (2000). "Revision of neoclassical facial canons in
young adult Afro-Americans." Aesthetic Plast Surg 24(3): 179-84. Farkas, L. G., T. A. Hreczko, et al. (1985). "Vertical and horizontal proportions of the
face in young adult North American Caucasians: revision of neoclassical canons." Plast Reconstr Surg 75(3): 328-38.
Farkas, L. G. and I. R. Munro (1987). Anthropometric facial proportions in medicine. Springfield, Ill., USA, Thomas.
Ferrario, V. F., C. Sforza, et al. (1994). "Distance from symmetry: a three-dimensional evaluation of facial asymmetry." J Oral Maxillofac Surg 52(11): 1126-32.
Forsberg, C. T., C. J. Burstone, et al. (1984). "Diagnosis and treatment planning of skeletal asymmetry with the submental-vertical radiograph." Am J Orthod 85(3): 224-37.
Giddon, D. B. (1995). "Orthodontic applications of psychological and perceptual studies of facial esthetics." Semin Orthod 1(2): 82-93.
Gorno-Tempini, M. L., C. J. Price, et al. (1998). "The neural systems sustaining face and proper-name processing." Brain 121 (Pt 11): 2103-18.
Hargittai, I. and M. Hargittai (1994). Symmetry : a unifying concept. Bolinas, Calif. Berkeley, Calif., Shelter Publications ;
49
Distributed in the U.S. by Ten Speed Press. Haxton, J. M. (1984). "Quantitative of Tolerance for Cranio-Facial Deviation Deviation."
J Dent Res 64. Heike, C. L., M. L. Cunningham, et al. (2009). "Picture perfect? Reliability of
craniofacial anthropometry using three-dimensional digital stereophotogrammetry." Plast Reconstr Surg 124(4): 1261-72.
Isaacowitz, D. M., H. A. Wadlinger, et al. (2006). "Selective preference in visual fixation away from negative images in old age? An eye-tracking study." Psychol Aging 21(1): 40-8.
Janik, S. W., A. R. Wellens, et al. (1978). "Eyes as the center of focus in the visual examination of human faces." Percept Mot Skills 47(3 Pt 1): 857-8.
Katsumata, A., M. Fujishita, et al. (2005). "3D-CT evaluation of facial asymmetry." Oral Surg Oral Med Oral Pathol Oral Radiol Endod 99(2): 212-20.
Kwon, T. G., H. S. Park, et al. (2006). "A comparison of craniofacial morphology in patients with and without facial asymmetry--a three-dimensional analysis with computed tomography." Int J Oral Maxillofac Surg 35(1): 43-8.
Lane, C. and W. Harrell, Jr. (2008). "Completing the 3-dimensional picture." Am J Orthod Dentofacial Orthop 133(4): 612-20.
Langlois, J. H. and L. A. Roggman (1990). "Attractive Faces Are Only Average." Psychological Science 1(2): 115-121.
Langlois, J. H., L. A. Roggman, et al. (1994). "What Is Average and What Is Not Average About Attractive Faces." Psychological Science 5(4): 214-220.
Le, T. T., L. G. Farkas, et al. (2002). "Proportionality in Asian and North American Caucasian faces using neoclassical facial canons as criteria." Aesthetic Plast Surg 26(1): 64-9.
Lu, K. H. (1965). "Harmonic Analysis of the Human Face." Biometrics 21: 491-505. Mackworth, J. F. and N. H. Mackworth (1958). "Eye fixations recorded on changing
visual scenes by the television eye-marker." J Opt Soc Am 48(7): 439-45. Mackworth, N. H. and E. L. Thomas (1962). "Head-mounted eye-marker camera." J Opt
Soc Am 52: 713-6. Maeda, M., A. Katsumata, et al. (2006). "3D-CT evaluation of facial asymmetry in
patients with maxillofacial deformities." Oral Surg Oral Med Oral Pathol Oral Radiol Endod 102(3): 382-90.
Masella, R. S. and M. Meister (2007). "The neuroanatomic basis of facial perception and variable facial discrimination ability: implications for orthodontics." Am J Orthod Dentofacial Orthop 132(3): 293-301.
McKoy-White, J., C. A. Evans, et al. (2006). "Facial profile preferences of black women before and after orthodontic treatment." Am J Orthod Dentofacial Orthop 129(1): 17-23.
Miloro, M., G. E. Ghali, et al. (2004). Peterson's principles of oral and maxillofacial surgery. Hamilton, Ont. ; London, B C Decker.
Miner, R. M., N. K. Anderson, et al. (2007). "The perception of children's computer-imaged facial profiles by patients, mothers and clinicians." Angle Orthod 77(6): 1034-9.
Nguyen, H. T., D. M. Isaacowitz, et al. (2009). "Age- and fatigue-related markers of human faces: an eye-tracking study." Ophthalmology 116(2): 355-60.
50
Nouraei, S. A., M. A. Pulido, et al. (2009). "Impact of rhinoplasty on objective measurement and psychophysical appreciation of facial symmetry." Arch Facial Plast Surg 11(3): 198-202.
Oh, A. K., J. Wong, et al. (2008). "Facial asymmetry in unilateral coronal synostosis: long-term results after fronto-orbital advancement." Plast Reconstr Surg 121(2): 545-62.
Padwa, B. L., M. O. Kaiser, et al. (1997). "Occlusal cant in the frontal plane as a reflection of facial asymmetry." J Oral Maxillofac Surg 55(8): 811-6; discussion 817.
Peck, S., L. Peck, et al. (1991). "Skeletal asymmetry in esthetically pleasing faces." Angle Orthod 61(1): 43-8.
Peterson, L. J. (1992). Principles of oral and maxillofacial surgery. Philadelphia, Lippincott.
Proffit, W. R. (2003). Contemporary treatment of dentofacial deformity., Mosby. Ras, F., L. L. Habets, et al. (1995). "Method for quantifying facial asymmetry in three
dimensions using stereophotogrammetry." Angle Orthod 65(3): 233-9. Roark, D. A., S. E. Barrett, et al. (2003). "Psychological and neural perspectives on the
role of motion in face recognition." Behav Cogn Neurosci Rev 2(1): 15-46. Shah, S. M. and M. R. Joshi (1978). "An assessment of asymmetry in the normal
craniofacial complex." Angle Orthod 48(2): 141-8. Vig, P. S. and A. B. Hewitt (1975). "Asymmetry of the human facial skeleton." Angle
Orthod 45(2): 125-9. Walker-Smith, G. J., A. G. Gale, et al. (1977). "Eye movement strategies involved in face
perception." Perception 6(3): 313-26. Weinberg, S. M., S. Naidoo, et al. (2006). "Anthropometric precision and accuracy of
digital three-dimensional photogrammetry: comparing the Genex and 3dMD imaging systems with one another and with direct anthropometry." J Craniofac Surg 17(3): 477-83.
Wilkins, E. G., J. C. Lowery, et al. (1996). "Outcomes research: a primer for plastic surgeons." Ann Plast Surg 37(1): 1-11.
Wong, J. Y., A. K. Oh, et al. (2008). "Validity and reliability of craniofacial anthropometric measurement of 3D digital photogrammetric images." Cleft Palate Craniofac J 45(3): 232-9.
Woo, T. L. (1931). "On the Asymmetry of the Human Skull." Biometrika 22(3/4): 324-252.
Yarbus, A. L. (1961). "Eye movements during the examination of complicated objects." Biofizika 6(2): 52-6.
Zaidel, D. W. and C. Deblieck (2007). "Attractiveness of natural faces compared to computer constructed perfectly symmetrical faces." Int J Neurosci 117(4): 423-31.
51
Appendix I – Anthropometric Terminology
Head and Face
Vertex (v) - is the highest point of the head when the head is oriented in the
Frankfurt Horizontal (FH) plane.
Glabella (g) - is the most prominent midline point between the eyebrows and is
identical to the bony glabella on the frontal bone.
Opisthocranium (op) - is the point situated in the occipital regions of the head and is
most distant from the glabella; that is, it is the most posterior point of the line of greatest
head length. It is close to the midline on the posterior rim of the foramen magnum. The
location of this landmark depends on the shape of the occipitale.
Trichion (tr) - is the point on the hairline in the midline of the forehead.
Menton (or gnathion) (me/gn) - is the lowest median landmark on the lower border
of the mandible.
Orbits
Endocanthion (en) - is the point at the inner commissure of the eye fissure. The soft
endocanthion is located lateral to the bony landmark (MO) that is used in cephalometry.
Exocanthion (ex) - is the point at the outer commissure of the eye fissure. The soft
exocanthion is slightly medial to the bony exocanthion (LO).
Orbitale (or) - is the lowest point on the lower margin of each orbit. It is identical to
bony orbitale.
Palpebrale superius (ps) - is the highest point in the midportion of the free margin of
each upper eyelid.
Palpebrale inferius (pi) - is the lowest point in the midportion of the free margin of
each lower eyelid.
Orbitale superius (os) - in young adults is the highest point on the lower border of the
eyebrow, close to the highest bony point of the upper margin of each orbit, where the
bony supraorbitale landmark (sor) is located.

52
Superciliare (sci) - is the highest point on the upper borderline in the midportion of
each eyebrow.
Nose
Nasion (n) - is the point in the midline of both the nasal root and the nasofrontal
suture. The slight ridge on which it is situated can be felt by the observer’s fingernail.
This point always is above the line that connects the two inner canthi. The soft nasion
and the bony nasion are identical.
Sellion (se) - is the deepest landmark located on the bottom of the nasofrontal angle,
marked also as “m” (median). The point usually occurs somewhere between the levels of
the supratarsal fold and eyelash.
Alare (al) - is the most lateral point on each alar contour.
Subalare (sbal) - is the point at the lower limit of each alar base, where the alar base
disappears into the skin of the upper lip.
Alar crest (or alar curvature) (ac) - is the most lateral point in the curved base line of
each ala, indicating the facial insertion of the nasal wingbase.
Pronasale (prn) - is the most protruded point of the apex nasi, identified in lateral
view of the rest position of the head.
Subnasale (sn) - is the midpoint of the angle at the columella base where the lower
border of the nasal septum and the surface of the upper lip meet.
Subnasale’ (sn’) – indicates the midpoint of the columella crest where the thickness
of the columella is measured.
Lips and Mouth
Labiale superius (ls) - is the midpoint of the upper vermilion line.
Labiale superius’ (ls’) – laterally from the midpoint (ls) is also located on the upper
vermillion line vertically beneath the right and left subalare points
Cheilion (ch) - is the point located at each labial commissure.
Ears
Superaurale (sa) - is the highest point on the free margin of the auricle.
Subaurale (sba) – is the lowest point on the free margin of the ear lobe.

53
Otobasion superius (obs) – is the point of attachment of the helix in the temporal
region. It determines the upper border of the ear insertion.
Otobasion Inferius (obi) – is the point of attachment of the ear lobe to the cheek. It
determines the lower border of the ear insertion.
Tragion (t) - is the notch of the upper margin of the tragus.