Embed Size (px)
Citation preview
Prepared By: Corona Insights © Corona Insights, 2020 CoronaInsights.com
Public Opinion Surrounding Plastic Consumption and
Waste Management of Consumer Packaging A Report to World Wildlife Fund
Replace with photo cover
PUBLIC OPINION SURROUNDING
PLASTIC CONSUMPTION AND
WASTE MANAGEMENT OF
CONSUMER PACKAGING
2020
WWF
WWF is one of the world’s largest and most experienced independent
conservation organizations, with over 5 million supporters and a global
network active in more than 100 countries. WWF’s mission is to stop the
degradation of the planet’s natural environment and to build a future in
which humans live in harmony with nature, by conserving the world’s
biological diversity, ensuring that the use of renewable natural
resources is sustainable, and promoting the reduction of pollution and
wasteful consumption.
Corona Insights
Corona Insights, a Denver-based research, evaluation, and consulting
firm, designed the survey instrument, managed the execution of the
survey, performed all analyses, and provided this report. Corona
Insights would like to thank WWF for entrusting their research to us.
Project Team:
David Kennedy, Principal/CEO
Beth Mulligan, PhD, Principal
Matt Bruce, Director
CONTENTS
Executive Summary ........................................................ 1
Background ................................................................. 1
Methodology ................................................................ 1
Key Findings................................................................ 2
Detailed Findings ............................................................ 3
Plastic Waste in Context ............................................. 3
Attitudes Toward Plastics & Plastic Waste .................. 7
Attitudes About Personal Use and Disposal of Plastics
.................................................................................... 8
Plastic Use & Recycling Behavior ............................... 9
Responsible Parties & Support for Regulations......... 13
Messaging ................................................................. 18
Appendix ....................................................................... 20
Deliverables............................................................... 21
Definition of Terms .................................................... 22
Methods .................................................................... 23
Demographics ........................................................... 24
World Wildlife Fund
I am aware that we need to do
something.... but I don't know
what to do.
- Survey Respondent
World Wildlife Fund
| 1 |
EXECUTIVE SUMMARY
BACKGROUND
World Wildlife Fund (WWF) has made it a priority to combat plastic waste. To inform this
work, WWF retained Corona Insights in 2020 to develop and implement research to
understand the public’s awareness of the issue, current behaviors around usage and
recycling, and attitudes toward plastics in the United States. Of particular interest were
public views on plastic as a material, especially for consumer-packaged goods. Also
explored were support for possible solutions as well as understanding the perceived
responsibilities of different entities.
Though the results of this research can be used to inform messaging and campaigns
directed toward the general public, this report was created to primarily inform WWF’s
efforts to craft legislation around producer responsibility for plastic waste management by
providing a rigorous assessment of the current state of public awareness, opinion, and
actions.
METHODOLOGY
Careful consideration was given to the design and sampling plan for this research to
ensure the results would be representative of the overall adult population.
Survey design was informed by a literature review (provided in a separate document). The
survey sample was a probability-based sample from NORC’s AmeriSpeak® panel. All
surveys were conducted online between December 3-11, 2020. In total, 1,098 completed
surveys were included in this analysis.
Additional detail can be found in the Appendix.
The overall key findings are presented on the following page with additional analysis
provided under the Detailed Findings section of this report.
World Wildlife Fund
| 2 |
KEY FINDINGS
01
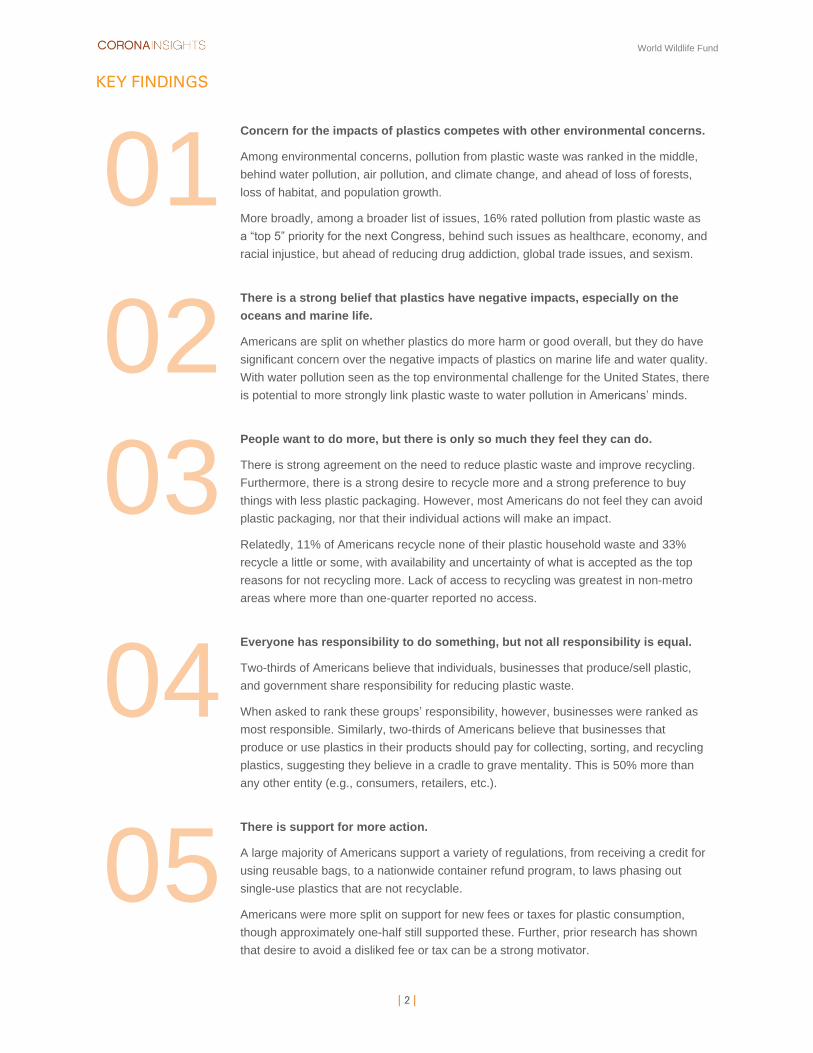
Concern for the impacts of plastics competes with other environmental concerns.
Among environmental concerns, pollution from plastic waste was ranked in the middle,
behind water pollution, air pollution, and climate change, and ahead of loss of forests,
loss of habitat, and population growth.
More broadly, among a broader list of issues, 16% rated pollution from plastic waste as
a “top 5” priority for the next Congress, behind such issues as healthcare, economy, and
racial injustice, but ahead of reducing drug addiction, global trade issues, and sexism.
02
There is a strong belief that plastics have negative impacts, especially on the
oceans and marine life.
Americans are split on whether plastics do more harm or good overall, but they do have
significant concern over the negative impacts of plastics on marine life and water quality.
With water pollution seen as the top environmental challenge for the United States, there
is potential to more strongly link plastic waste to water pollution in Americans’ minds.
03
People want to do more, but there is only so much they feel they can do.
There is strong agreement on the need to reduce plastic waste and improve recycling.
Furthermore, there is a strong desire to recycle more and a strong preference to buy
things with less plastic packaging. However, most Americans do not feel they can avoid
plastic packaging, nor that their individual actions will make an impact.
Relatedly, 11% of Americans recycle none of their plastic household waste and 33%
recycle a little or some, with availability and uncertainty of what is accepted as the top
reasons for not recycling more. Lack of access to recycling was greatest in non-metro
areas where more than one-quarter reported no access.
04
Everyone has responsibility to do something, but not all responsibility is equal.
Two-thirds of Americans believe that individuals, businesses that produce/sell plastic,
and government share responsibility for reducing plastic waste.
When asked to rank these groups’ responsibility, however, businesses were ranked as
most responsible. Similarly, two-thirds of Americans believe that businesses that
produce or use plastics in their products should pay for collecting, sorting, and recycling
plastics, suggesting they believe in a cradle to grave mentality. This is 50% more than
any other entity (e.g., consumers, retailers, etc.).
05
There is support for more action.
A large majority of Americans support a variety of regulations, from receiving a credit for
using reusable bags, to a nationwide container refund program, to laws phasing out
single-use plastics that are not recyclable.
Americans were more split on support for new fees or taxes for plastic consumption,
though approximately one-half still supported these. Further, prior research has shown
that desire to avoid a disliked fee or tax can be a strong motivator.
World Wildlife Fund
| 3 |
DETAILED F INDINGS
PLASTIC WASTE IN CONTEXT
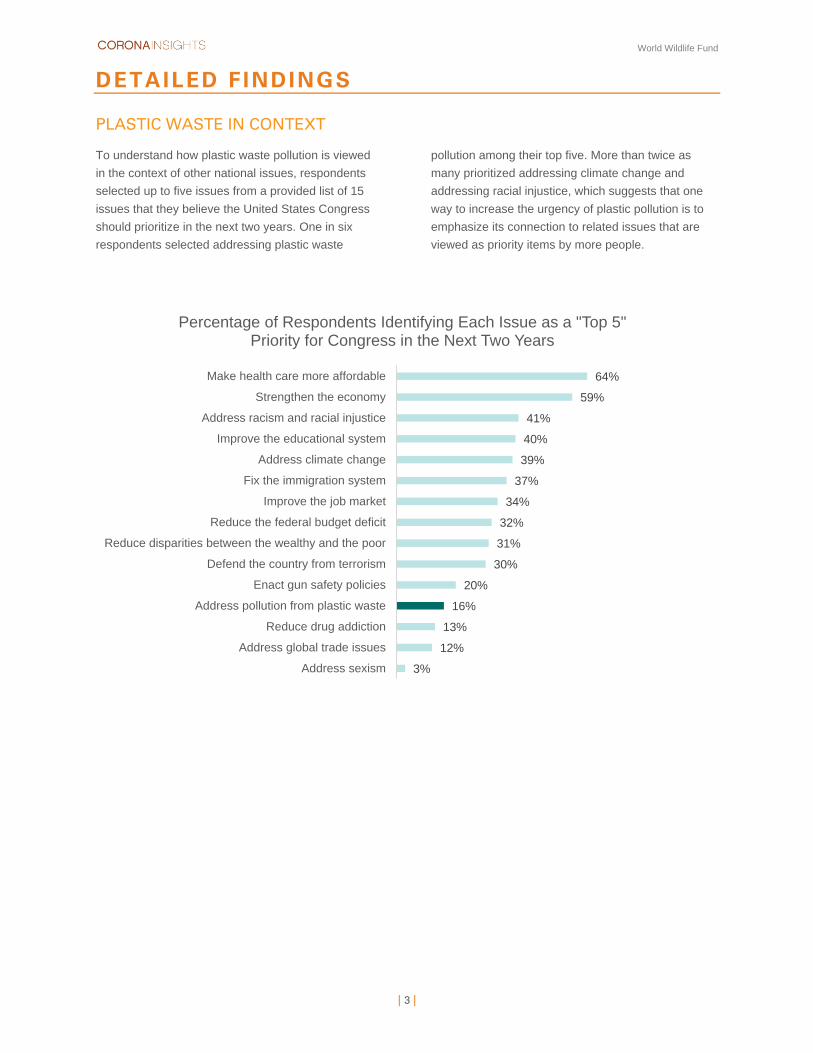
To understand how plastic waste pollution is viewed
in the context of other national issues, respondents
selected up to five issues from a provided list of 15
issues that they believe the United States Congress
should prioritize in the next two years. One in six
respondents selected addressing plastic waste
pollution among their top five. More than twice as
many prioritized addressing climate change and
addressing racial injustice, which suggests that one
way to increase the urgency of plastic pollution is to
emphasize its connection to related issues that are
viewed as priority items by more people.
64%
59%
41%
40%
39%
37%
34%
32%
31%
30%
20%
16%
13%
12%
3%
Make health care more affordable
Strengthen the economy
Address racism and racial injustice
Improve the educational system
Address climate change
Fix the immigration system
Improve the job market
Reduce the federal budget deficit
Reduce disparities between the wealthy and the poor
Defend the country from terrorism
Enact gun safety policies
Address pollution from plastic waste
Reduce drug addiction
Address global trade issues
Address sexism
Percentage of Respondents Identifying Each Issue as a "Top 5" Priority for Congress in the Next Two Years
World Wildlife Fund
| 4 |
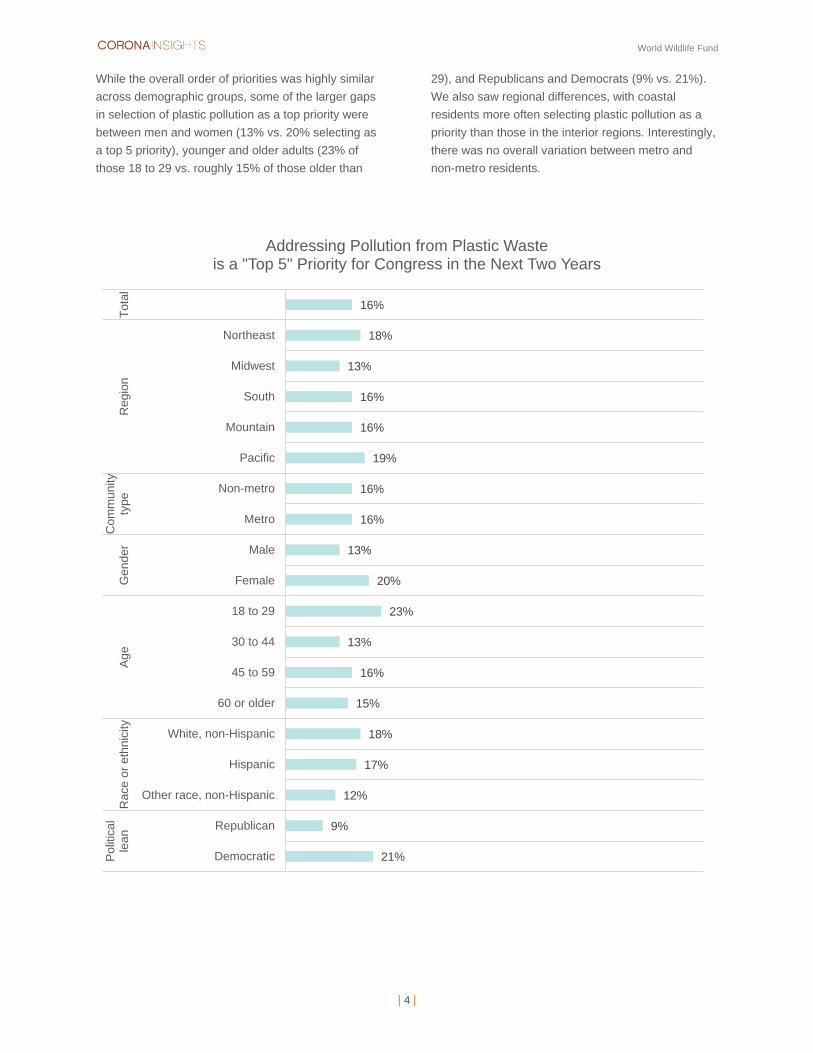
While the overall order of priorities was highly similar
across demographic groups, some of the larger gaps
in selection of plastic pollution as a top priority were
between men and women (13% vs. 20% selecting as
a top 5 priority), younger and older adults (23% of
those 18 to 29 vs. roughly 15% of those older than
29), and Republicans and Democrats (9% vs. 21%).
We also saw regional differences, with coastal
residents more often selecting plastic pollution as a
priority than those in the interior regions. Interestingly,
there was no overall variation between metro and
non-metro residents.
16%
18%
13%
16%
16%
19%
16%
16%
13%
20%
23%
13%
16%
15%
18%
17%
12%
9%
21%
Northeast
Midwest
South
Mountain
Pacific
Non-metro
Metro
Male
Female
18 to 29
30 to 44
45 to 59
60 or older
White, non-Hispanic
Hispanic
Other race, non-Hispanic
Republican
Democratic
To
tal
Regio
nC
om
munity
type
Gen
der
Ag
eR
ace o
r eth
nic
ity
Po
litic
al
lean
Addressing Pollution from Plastic Waste is a "Top 5" Priority for Congress in the Next Two Years
World Wildlife Fund
| 5 |
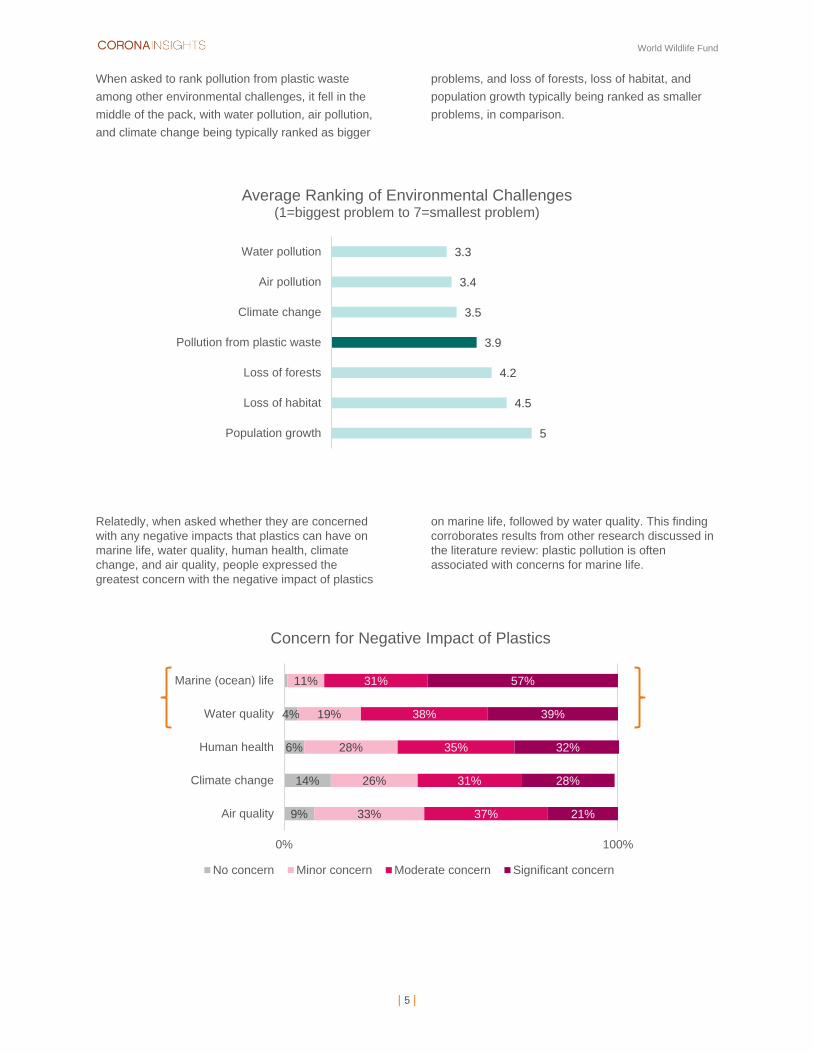
When asked to rank pollution from plastic waste
among other environmental challenges, it fell in the
middle of the pack, with water pollution, air pollution,
and climate change being typically ranked as bigger
problems, and loss of forests, loss of habitat, and
population growth typically being ranked as smaller
problems, in comparison.
Relatedly, when asked whether they are concerned
with any negative impacts that plastics can have on
marine life, water quality, human health, climate
change, and air quality, people expressed the
greatest concern with the negative impact of plastics
on marine life, followed by water quality. This finding
corroborates results from other research discussed in
the literature review: plastic pollution is often
associated with concerns for marine life.
3.3
3.4
3.5
3.9
4.2
4.5
5
Water pollution
Air pollution
Climate change
Pollution from plastic waste
Loss of forests
Loss of habitat
Population growth
Average Ranking of Environmental Challenges(1=biggest problem to 7=smallest problem)
9%
14%
6%
4%
33%
26%
28%
19%
11%
37%
31%
35%
38%
31%
21%
28%
32%
39%
57%
0% 100%
Air quality
Climate change
Human health
Water quality
Marine (ocean) life
Concern for Negative Impact of Plastics
No concern Minor concern Moderate concern Significant concern
World Wildlife Fund
| 6 |
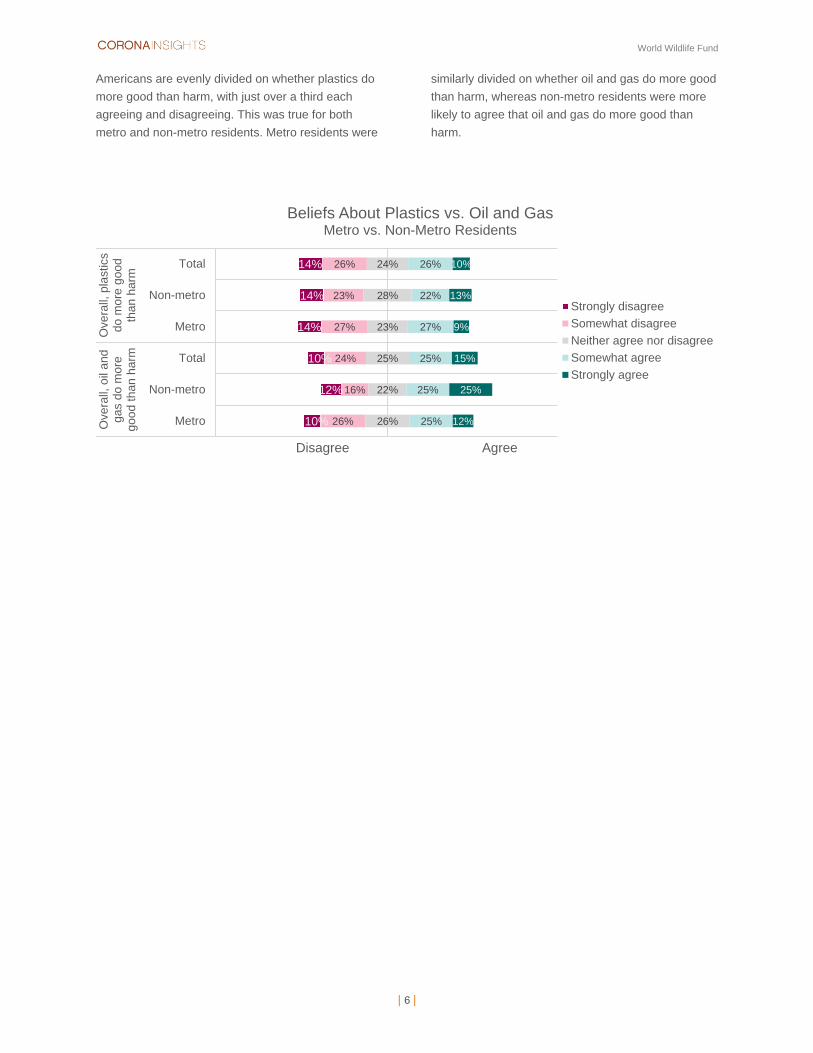
Americans are evenly divided on whether plastics do
more good than harm, with just over a third each
agreeing and disagreeing. This was true for both
metro and non-metro residents. Metro residents were
similarly divided on whether oil and gas do more good
than harm, whereas non-metro residents were more
likely to agree that oil and gas do more good than
harm.
14%
14%
14%
10%
12%
10%
26%
23%
27%
24%
16%
26%
24%
28%
23%
25%
22%
26%
26%
22%
27%
25%
25%
25%
10%
13%
9%
15%
25%
12%
Total
Non-metro
Metro
Total
Non-metro
Metro
Ove
rall,
pla
stics
do
mo
re g
oo
dth
an
ha
rm
Overa
ll, o
il a
nd
gas d
o m
ore
good t
han h
arm
Disagree Agree
Beliefs About Plastics vs. Oil and GasMetro vs. Non-Metro Residents
Strongly disagree
Somewhat disagree
Neither agree nor disagree
Somewhat agree
Strongly agree
World Wildlife Fund
| 7 |
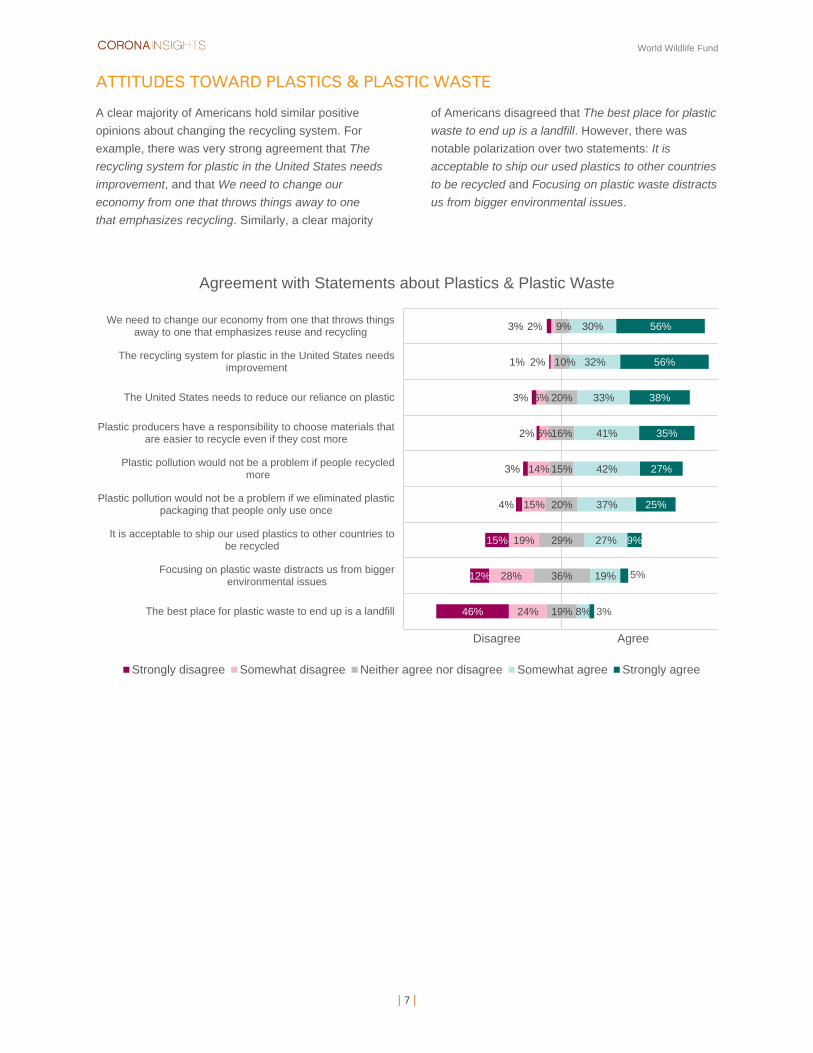
ATTITUDES TOWARD PLASTICS & PLASTIC WASTE
A clear majority of Americans hold similar positive
opinions about changing the recycling system. For
example, there was very strong agreement that The
recycling system for plastic in the United States needs
improvement, and that We need to change our
economy from one that throws things away to one
that emphasizes recycling. Similarly, a clear majority
of Americans disagreed that The best place for plastic
waste to end up is a landfill. However, there was
notable polarization over two statements: It is
acceptable to ship our used plastics to other countries
to be recycled and Focusing on plastic waste distracts
us from bigger environmental issues.
46%
12%
15%
4%
3%
2%
3%
1%
3%
24%
28%
19%
15%
14%
6%
6%
2%
2%
19%
36%
29%
20%
15%
16%
20%
10%
9%
8%
19%
27%
37%
42%
41%
33%
32%
30%
3%
5%
9%
25%
27%
35%
38%
56%
56%
The best place for plastic waste to end up is a landfill
Focusing on plastic waste distracts us from biggerenvironmental issues
It is acceptable to ship our used plastics to other countries tobe recycled
Plastic pollution would not be a problem if we eliminated plasticpackaging that people only use once
Plastic pollution would not be a problem if people recycledmore
Plastic producers have a responsibility to choose materials thatare easier to recycle even if they cost more
The United States needs to reduce our reliance on plastic
The recycling system for plastic in the United States needsimprovement
We need to change our economy from one that throws thingsaway to one that emphasizes reuse and recycling
Disagree Agree
Agreement with Statements about Plastics & Plastic Waste
Strongly disagree Somewhat disagree Neither agree nor disagree Somewhat agree Strongly agree
World Wildlife Fund
| 8 |
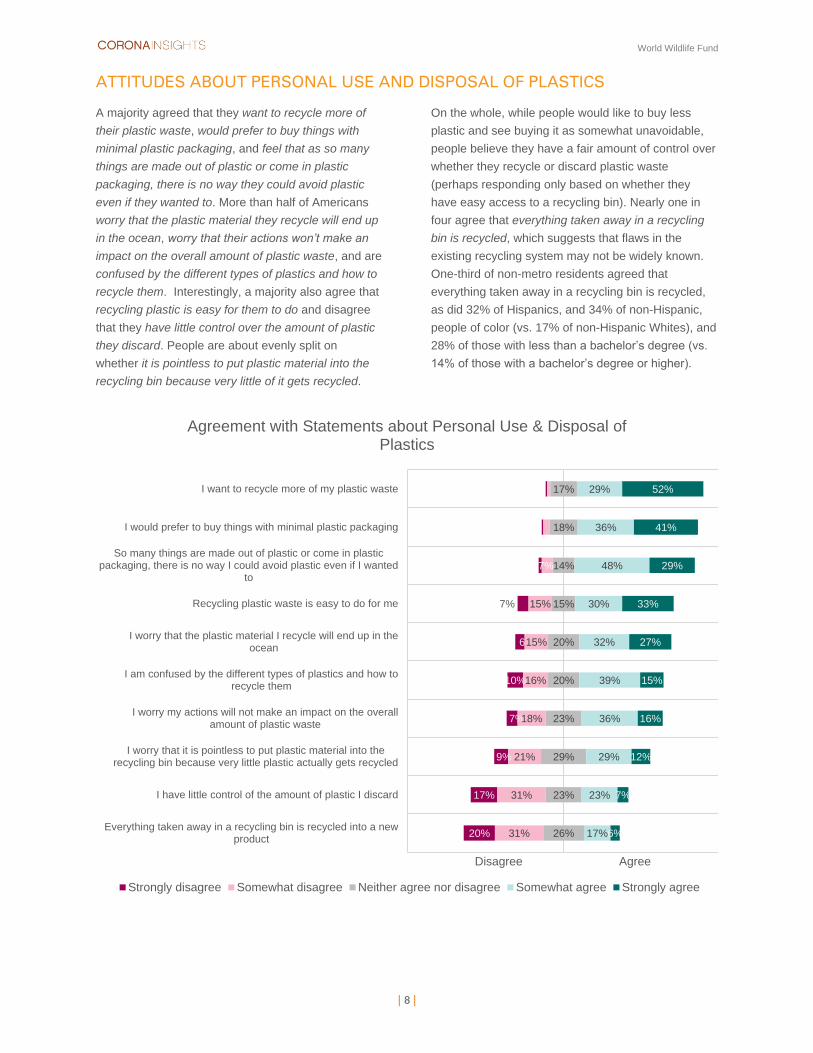
ATTITUDES ABOUT PERSONAL USE AND DISPOSAL OF PLASTICS
A majority agreed that they want to recycle more of
their plastic waste, would prefer to buy things with
minimal plastic packaging, and feel that as so many
things are made out of plastic or come in plastic
packaging, there is no way they could avoid plastic
even if they wanted to. More than half of Americans
worry that the plastic material they recycle will end up
in the ocean, worry that their actions won’t make an
impact on the overall amount of plastic waste, and are
confused by the different types of plastics and how to
recycle them. Interestingly, a majority also agree that
recycling plastic is easy for them to do and disagree
that they have little control over the amount of plastic
they discard. People are about evenly split on
whether it is pointless to put plastic material into the
recycling bin because very little of it gets recycled.
On the whole, while people would like to buy less
plastic and see buying it as somewhat unavoidable,
people believe they have a fair amount of control over
whether they recycle or discard plastic waste
(perhaps responding only based on whether they
have easy access to a recycling bin). Nearly one in
four agree that everything taken away in a recycling
bin is recycled, which suggests that flaws in the
existing recycling system may not be widely known.
One-third of non-metro residents agreed that
everything taken away in a recycling bin is recycled,
as did 32% of Hispanics, and 34% of non-Hispanic,
people of color (vs. 17% of non-Hispanic Whites), and
28% of those with less than a bachelor’s degree (vs.
14% of those with a bachelor’s degree or higher).
20%
17%
9%
7%
10%
6
7%
31%
31%
21%
18%
16%
15%
15%
7%
26%
23%
29%
23%
20%
20%
15%
14%
18%
17%
17%
23%
29%
36%
39%
32%
30%
48%
36%
29%
6%
7%
12%
16%
15%
27%
33%
29%
41%
52%
Everything taken away in a recycling bin is recycled into a newproduct
I have little control of the amount of plastic I discard
I worry that it is pointless to put plastic material into therecycling bin because very little plastic actually gets recycled
I worry my actions will not make an impact on the overallamount of plastic waste
I am confused by the different types of plastics and how torecycle them
I worry that the plastic material I recycle will end up in theocean
Recycling plastic waste is easy to do for me
So many things are made out of plastic or come in plasticpackaging, there is no way I could avoid plastic even if I wanted
to
I would prefer to buy things with minimal plastic packaging
I want to recycle more of my plastic waste
Disagree Agree
Agreement with Statements about Personal Use & Disposal of Plastics
Strongly disagree Somewhat disagree Neither agree nor disagree Somewhat agree Strongly agree
World Wildlife Fund
| 9 |
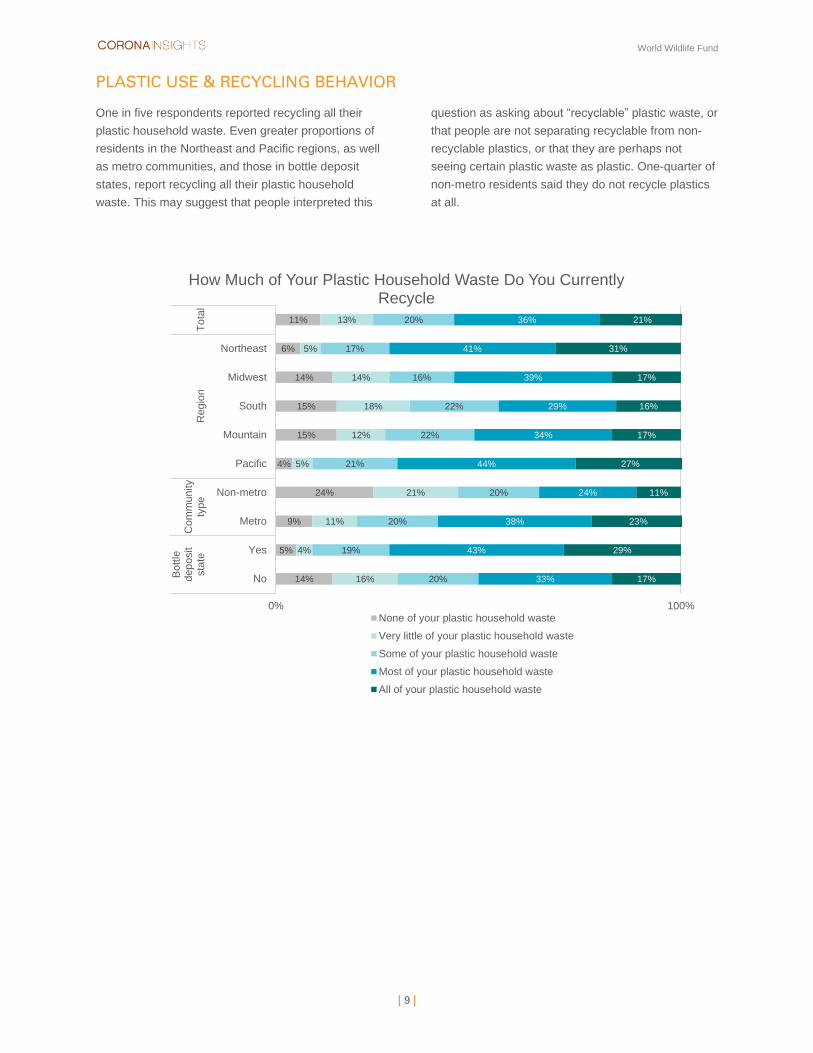
PLASTIC USE & RECYCLING BEHAVIOR
One in five respondents reported recycling all their
plastic household waste. Even greater proportions of
residents in the Northeast and Pacific regions, as well
as metro communities, and those in bottle deposit
states, report recycling all their plastic household
waste. This may suggest that people interpreted this
question as asking about “recyclable” plastic waste, or
that people are not separating recyclable from non-
recyclable plastics, or that they are perhaps not
seeing certain plastic waste as plastic. One-quarter of
non-metro residents said they do not recycle plastics
at all.
11%
6%
14%
15%
15%
4%
24%
9%
5%
14%
13%
5%
14%
18%
12%
5%
21%
11%
4%
16%
20%
17%
16%
22%
22%
21%
20%
20%
19%
20%
36%
41%
39%
29%
34%
44%
24%
38%
43%
33%
21%
31%
17%
16%
17%
27%
11%
23%
29%
17%
0% 100%
Northeast
Midwest
South
Mountain
Pacific
Non-metro
Metro
Yes
No
To
tal
Reg
ion
Com
munity
type
Bottle
dep
osit
sta
te
How Much of Your Plastic Household Waste Do You Currently Recycle
None of your plastic household waste
Very little of your plastic household waste
Some of your plastic household waste
Most of your plastic household waste
All of your plastic household waste
World Wildlife Fund
| 10 |
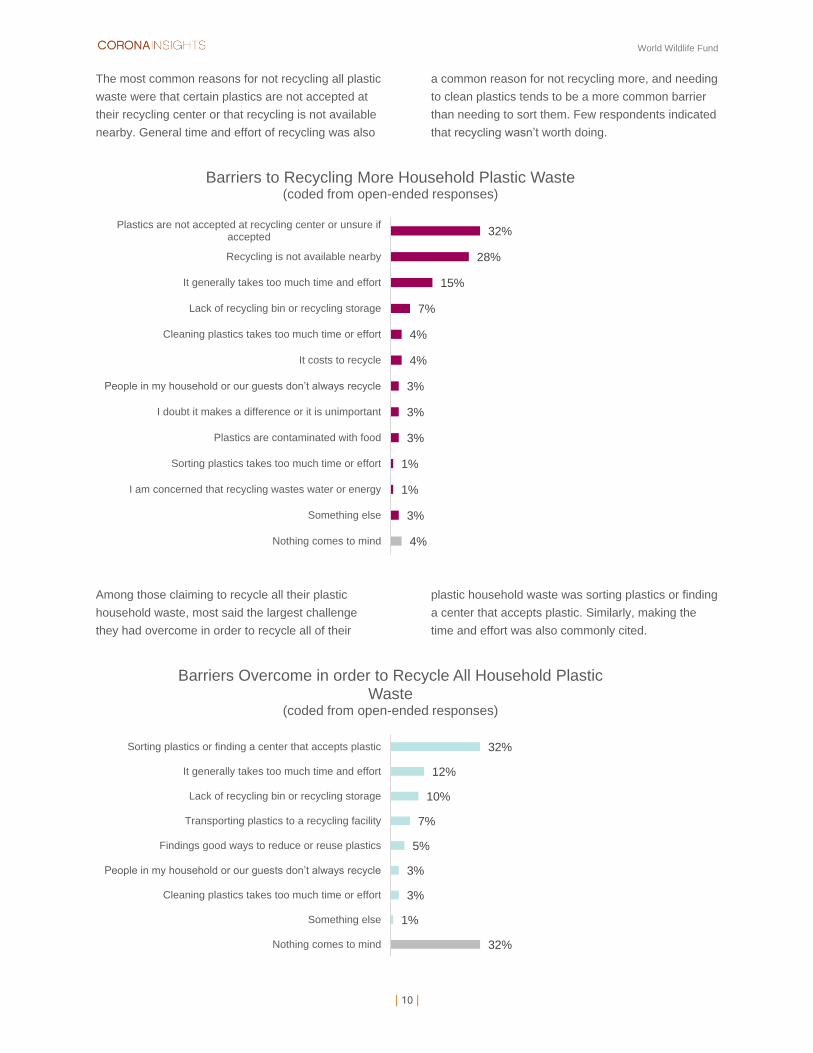
The most common reasons for not recycling all plastic
waste were that certain plastics are not accepted at
their recycling center or that recycling is not available
nearby. General time and effort of recycling was also
a common reason for not recycling more, and needing
to clean plastics tends to be a more common barrier
than needing to sort them. Few respondents indicated
that recycling wasn’t worth doing.
Among those claiming to recycle all their plastic
household waste, most said the largest challenge
they had overcome in order to recycle all of their
plastic household waste was sorting plastics or finding
a center that accepts plastic. Similarly, making the
time and effort was also commonly cited.
32%
28%
15%
7%
4%
4%
3%
3%
3%
1%
1%
3%
4%
Plastics are not accepted at recycling center or unsure ifaccepted
Recycling is not available nearby
It generally takes too much time and effort
Lack of recycling bin or recycling storage
Cleaning plastics takes too much time or effort
It costs to recycle
People in my household or our guests don’t always recycle
I doubt it makes a difference or it is unimportant
Plastics are contaminated with food
Sorting plastics takes too much time or effort
I am concerned that recycling wastes water or energy
Something else
Nothing comes to mind
Barriers to Recycling More Household Plastic Waste(coded from open-ended responses)
32%
12%
10%
7%
5%
3%
3%
1%
32%
Sorting plastics or finding a center that accepts plastic
It generally takes too much time and effort
Lack of recycling bin or recycling storage
Transporting plastics to a recycling facility
Findings good ways to reduce or reuse plastics
People in my household or our guests don’t always recycle
Cleaning plastics takes too much time or effort
Something else
Nothing comes to mind
Barriers Overcome in order to Recycle All Household Plastic Waste
(coded from open-ended responses)
World Wildlife Fund
| 11 |
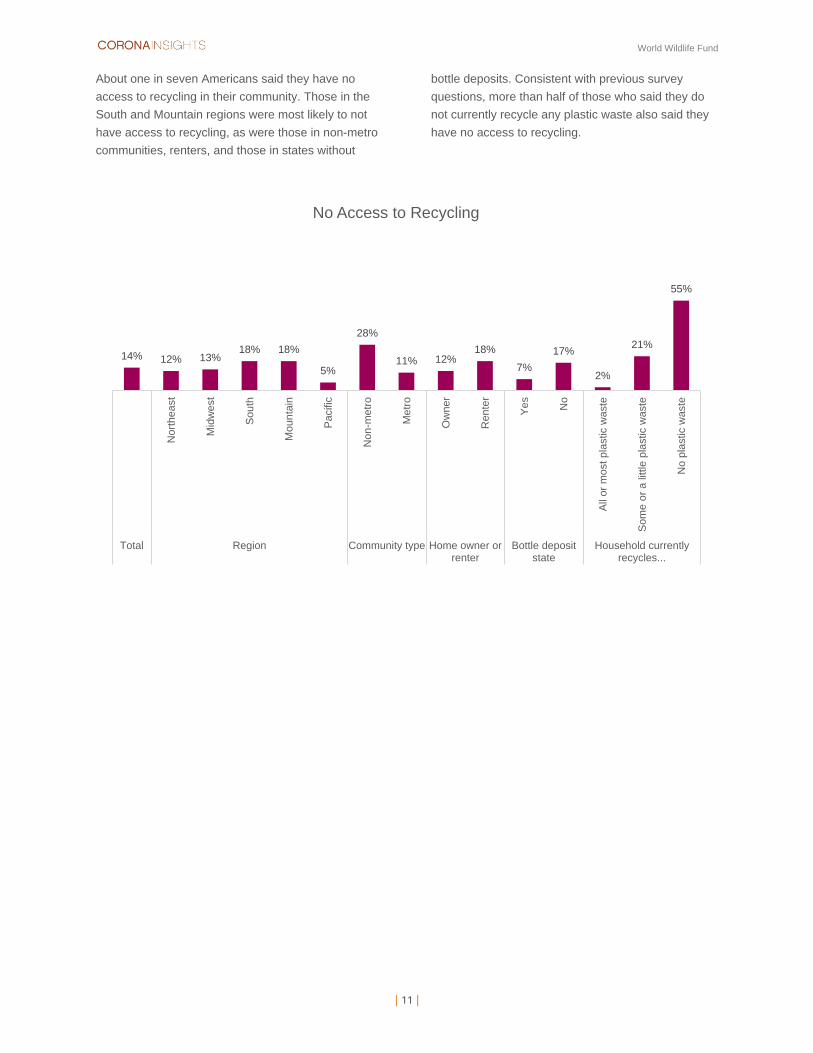
About one in seven Americans said they have no
access to recycling in their community. Those in the
South and Mountain regions were most likely to not
have access to recycling, as were those in non-metro
communities, renters, and those in states without
bottle deposits. Consistent with previous survey
questions, more than half of those who said they do
not currently recycle any plastic waste also said they
have no access to recycling.
14% 12% 13%18% 18%
5%
28%
11% 12%18%
7%
17%
2%
21%
55%
Nort
heast
Mid
west
South
Moun
tain
Pacific
Non
-metr
o
Metr
o
Ow
ner
Ren
ter
Yes
No
All
or
most pla
stic w
aste
Som
e o
r a little p
lastic w
aste
No p
lastic w
aste
Total Region Community type Home owner orrenter
Bottle depositstate
Household currentlyrecycles...
No Access to Recycling
World Wildlife Fund
| 12 |
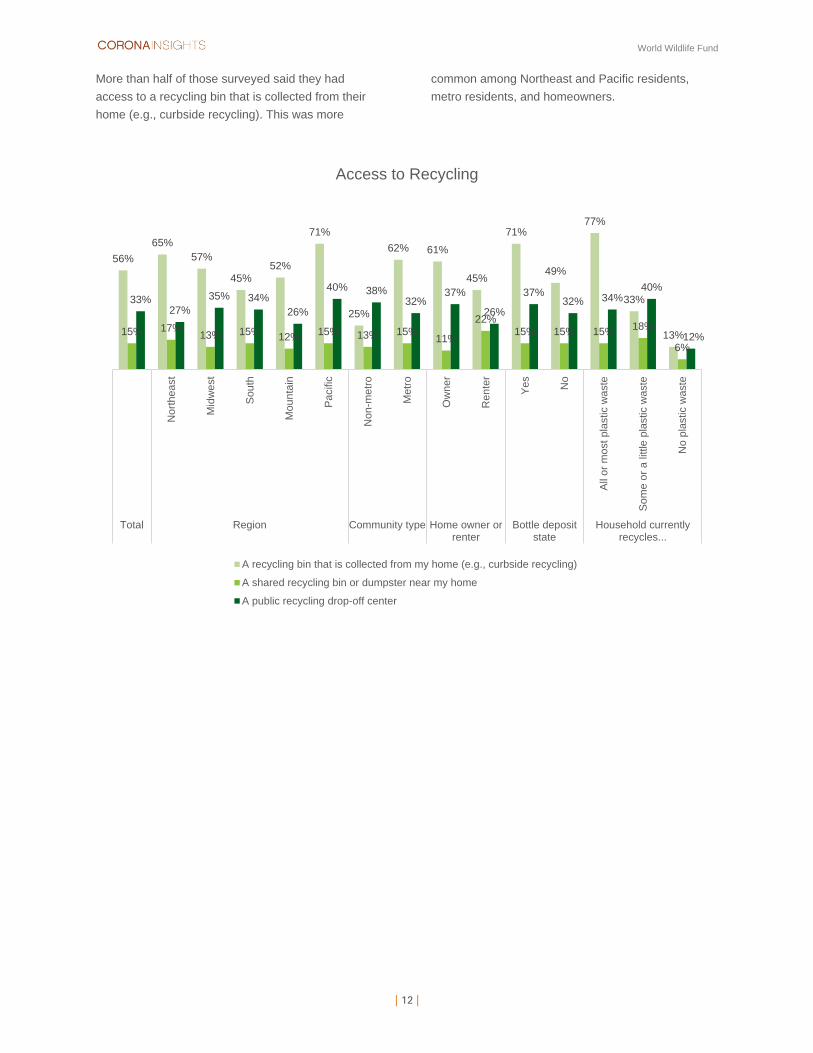
More than half of those surveyed said they had
access to a recycling bin that is collected from their
home (e.g., curbside recycling). This was more
common among Northeast and Pacific residents,
metro residents, and homeowners.
56%
65%
57%
45%
52%
71%
25%
62% 61%
45%
71%
49%
77%
33%
13%15% 17%13% 15%
12%15% 13% 15%
11%
22%
15% 15% 15%18%
6%
33%27%
35% 34%
26%
40% 38%32%
37%
26%
37%32% 34%
40%
12%
Nort
heast
Mid
west
South
Moun
tain
Pacific
Non
-metr
o
Metr
o
Ow
ner
Ren
ter
Yes
No
All
or
most pla
stic w
aste
Som
e o
r a little p
lastic w
aste
No p
lastic w
aste
Total Region Community type Home owner orrenter
Bottle depositstate
Household currentlyrecycles...
Access to Recycling
A recycling bin that is collected from my home (e.g., curbside recycling)
A shared recycling bin or dumpster near my home
A public recycling drop-off center
World Wildlife Fund
| 13 |
RESPONSIBLE PARTIES & SUPPORT FOR REGULATIONS
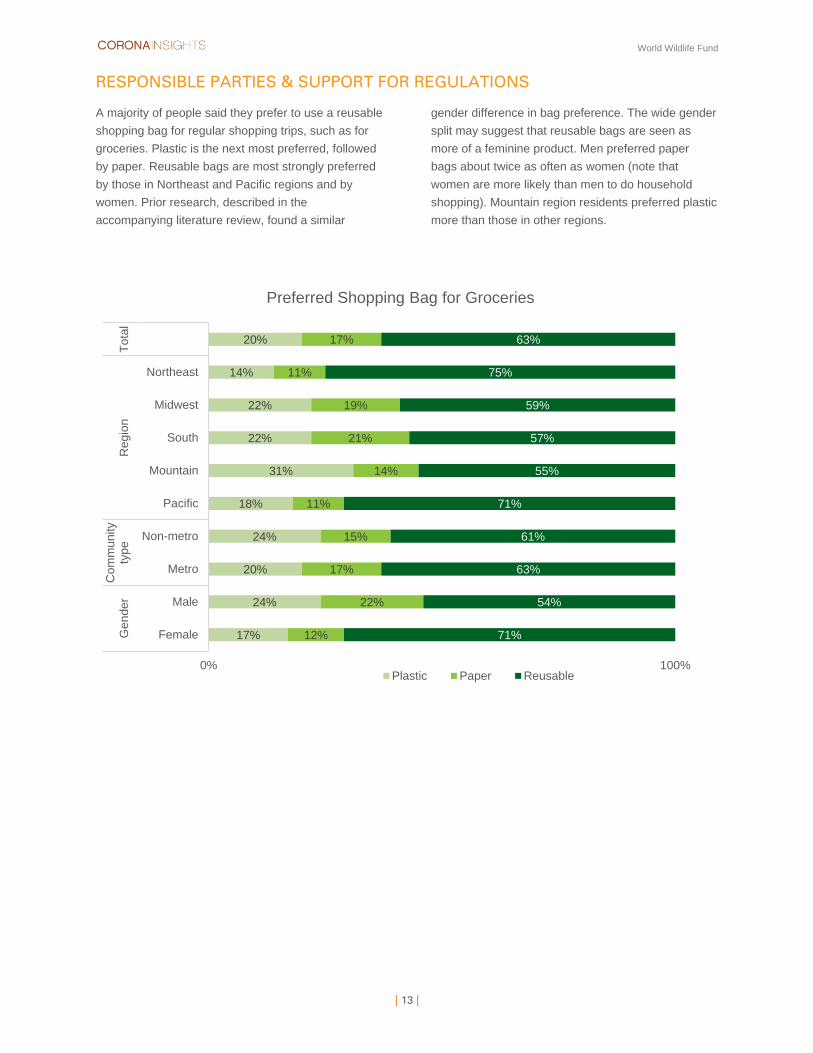
A majority of people said they prefer to use a reusable
shopping bag for regular shopping trips, such as for
groceries. Plastic is the next most preferred, followed
by paper. Reusable bags are most strongly preferred
by those in Northeast and Pacific regions and by
women. Prior research, described in the
accompanying literature review, found a similar
gender difference in bag preference. The wide gender
split may suggest that reusable bags are seen as
more of a feminine product. Men preferred paper
bags about twice as often as women (note that
women are more likely than men to do household
shopping). Mountain region residents preferred plastic
more than those in other regions.
20%
14%
22%
22%
31%
18%
24%
20%
24%
17%
17%
11%
19%
21%
14%
11%
15%
17%
22%
12%
63%
75%
59%
57%
55%
71%
61%
63%
54%
71%
0% 100%
Northeast
Midwest
South
Mountain
Pacific
Non-metro
Metro
Male
Female
To
tal
Regio
nC
om
munity
type
Gen
der
Preferred Shopping Bag for Groceries
Plastic Paper Reusable
World Wildlife Fund
| 14 |
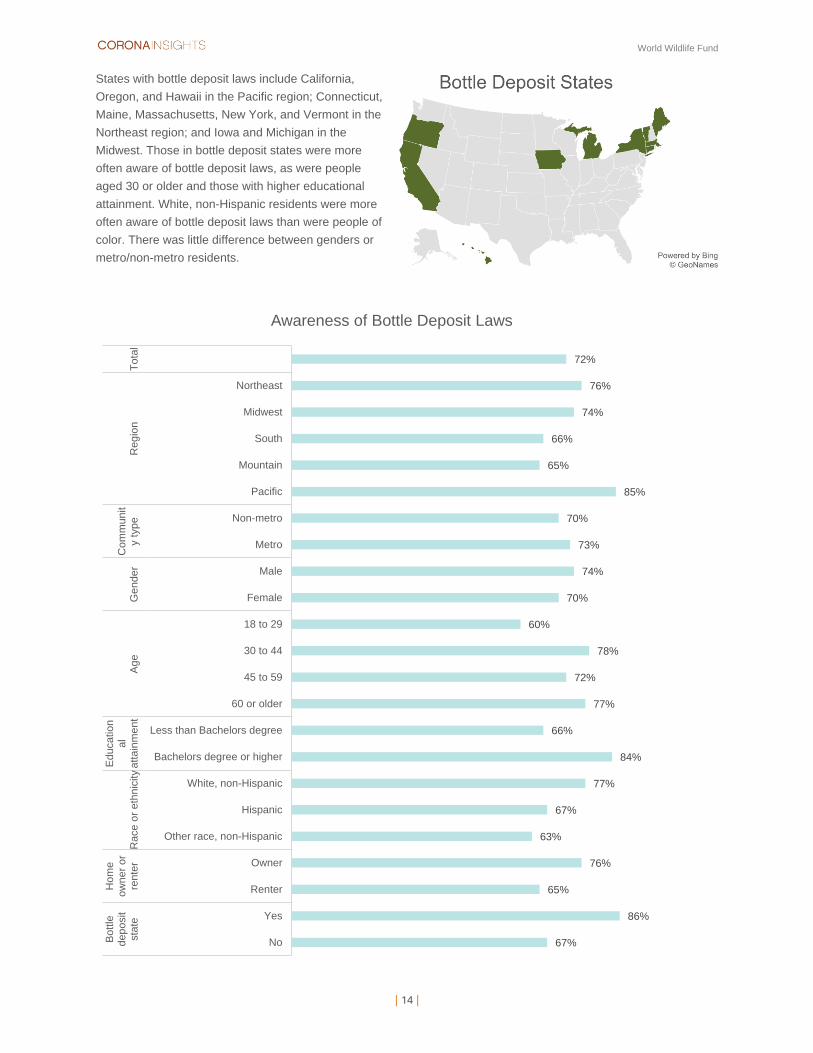
States with bottle deposit laws include California,
Oregon, and Hawaii in the Pacific region; Connecticut,
Maine, Massachusetts, New York, and Vermont in the
Northeast region; and Iowa and Michigan in the
Midwest. Those in bottle deposit states were more
often aware of bottle deposit laws, as were people
aged 30 or older and those with higher educational
attainment. White, non-Hispanic residents were more
often aware of bottle deposit laws than were people of
color. There was little difference between genders or
metro/non-metro residents.
72%
76%
74%
66%
65%
85%
70%
73%
74%
70%
60%
78%
72%
77%
66%
84%
77%
67%
63%
76%
65%
86%
67%
Northeast
Midwest
South
Mountain
Pacific
Non-metro
Metro
Male
Female
18 to 29
30 to 44
45 to 59
60 or older
Less than Bachelors degree
Bachelors degree or higher
White, non-Hispanic
Hispanic
Other race, non-Hispanic
Owner
Renter
Yes
No
To
tal
Reg
ion
Com
munit
y type
Gender
Age
Education
al
atta
inm
ent
Race o
r eth
nic
ity
Hom
eow
ner
or
rente
r
Bottle
dep
osit
sta
te
Awareness of Bottle Deposit Laws
World Wildlife Fund
| 15 |
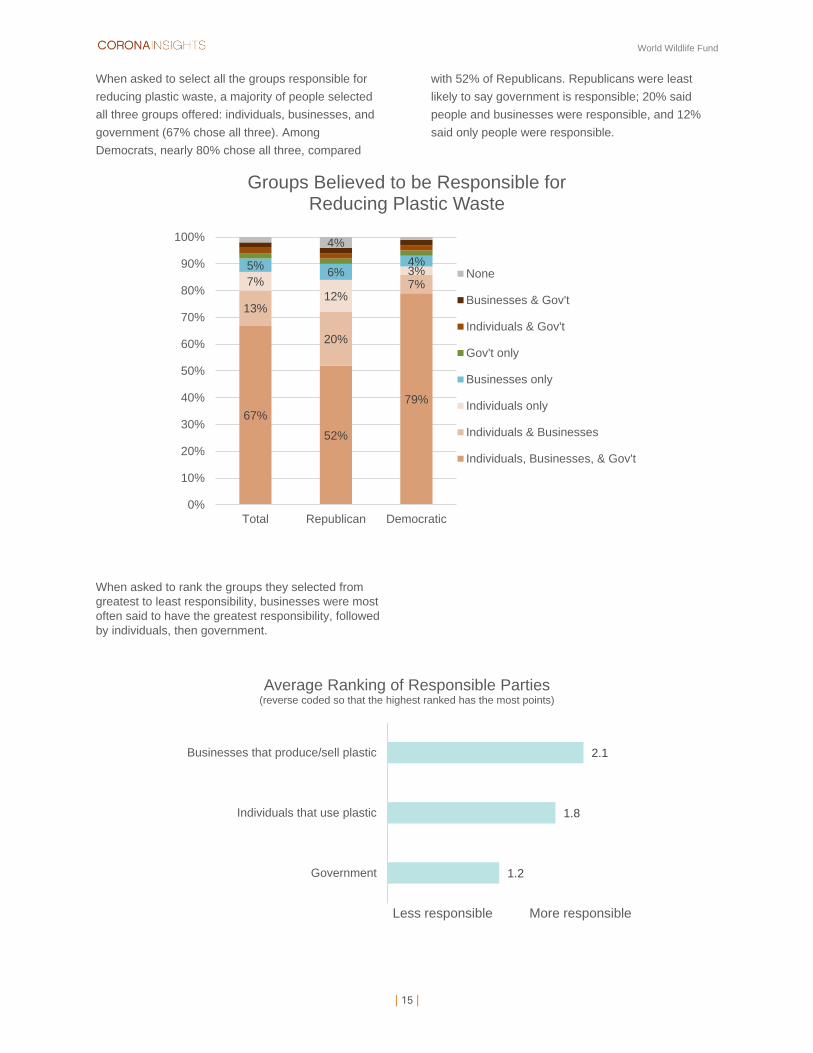
When asked to select all the groups responsible for
reducing plastic waste, a majority of people selected
all three groups offered: individuals, businesses, and
government (67% chose all three). Among
Democrats, nearly 80% chose all three, compared
with 52% of Republicans. Republicans were least
likely to say government is responsible; 20% said
people and businesses were responsible, and 12%
said only people were responsible.
When asked to rank the groups they selected from
greatest to least responsibility, businesses were most
often said to have the greatest responsibility, followed
by individuals, then government.
67%
52%
79%
13%
20%
7%7%
12%
3%5%6%
4%
4%
0%
10%
20%
30%
40%
50%
60%
70%
80%
90%
100%
Total Republican Democratic
Groups Believed to be Responsible for Reducing Plastic Waste
None
Businesses & Gov't
Individuals & Gov't
Gov't only
Businesses only
Individuals only
Individuals & Businesses
Individuals, Businesses, & Gov't
1.2
1.8
2.1
Government
Individuals that use plastic
Businesses that produce/sell plastic
Less responsible More responsible
Average Ranking of Responsible Parties(reverse coded so that the highest ranked has the most points)
World Wildlife Fund
| 16 |
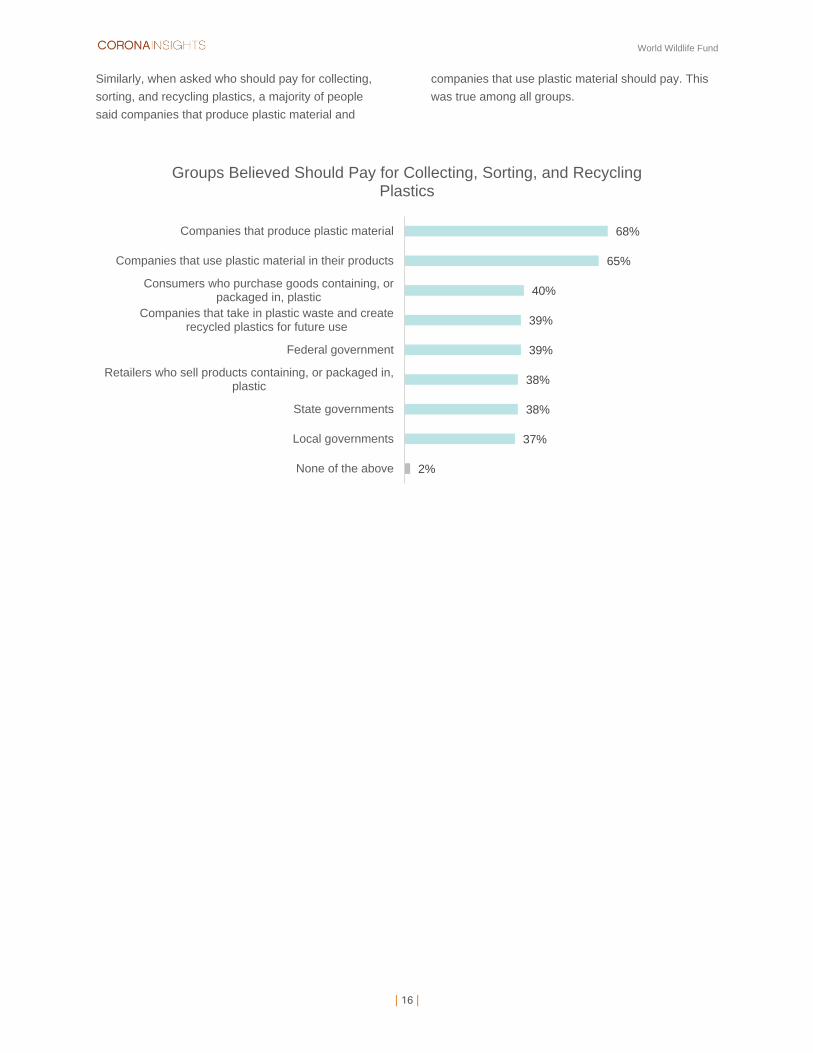
Similarly, when asked who should pay for collecting,
sorting, and recycling plastics, a majority of people
said companies that produce plastic material and
companies that use plastic material should pay. This
was true among all groups.
68%
65%
40%
39%
39%
38%
38%
37%
2%
Companies that produce plastic material
Companies that use plastic material in their products
Consumers who purchase goods containing, orpackaged in, plastic
Companies that take in plastic waste and createrecycled plastics for future use
Federal government
Retailers who sell products containing, or packaged in,plastic
State governments
Local governments
None of the above
Groups Believed Should Pay for Collecting, Sorting, and Recycling Plastics
World Wildlife Fund
| 17 |
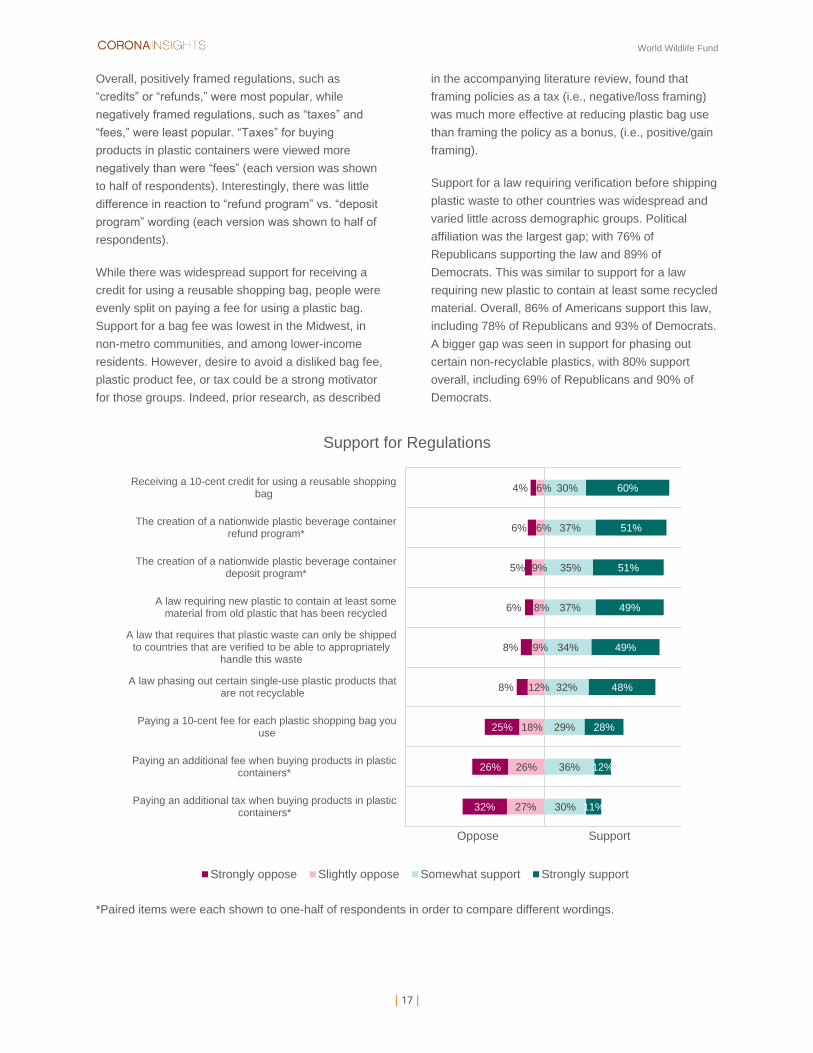
Overall, positively framed regulations, such as
“credits” or “refunds,” were most popular, while
negatively framed regulations, such as “taxes” and
“fees,” were least popular. “Taxes” for buying
products in plastic containers were viewed more
negatively than were “fees” (each version was shown
to half of respondents). Interestingly, there was little
difference in reaction to “refund program” vs. “deposit
program” wording (each version was shown to half of
respondents).
While there was widespread support for receiving a
credit for using a reusable shopping bag, people were
evenly split on paying a fee for using a plastic bag.
Support for a bag fee was lowest in the Midwest, in
non-metro communities, and among lower-income
residents. However, desire to avoid a disliked bag fee,
plastic product fee, or tax could be a strong motivator
for those groups. Indeed, prior research, as described
in the accompanying literature review, found that
framing policies as a tax (i.e., negative/loss framing)
was much more effective at reducing plastic bag use
than framing the policy as a bonus, (i.e., positive/gain
framing).
Support for a law requiring verification before shipping
plastic waste to other countries was widespread and
varied little across demographic groups. Political
affiliation was the largest gap; with 76% of
Republicans supporting the law and 89% of
Democrats. This was similar to support for a law
requiring new plastic to contain at least some recycled
material. Overall, 86% of Americans support this law,
including 78% of Republicans and 93% of Democrats.
A bigger gap was seen in support for phasing out
certain non-recyclable plastics, with 80% support
overall, including 69% of Republicans and 90% of
Democrats.
*Paired items were each shown to one-half of respondents in order to compare different wordings.
32%
26%
25%
8%
8%
6%
5%
6%
4%
27%
26%
18%
12%
9%
8%
9%
6%
6%
30%
36%
29%
32%
34%
37%
35%
37%
30%
11%
12%
28%
48%
49%
49%
51%
51%
60%
Paying an additional tax when buying products in plasticcontainers*
Paying an additional fee when buying products in plasticcontainers*
Paying a 10-cent fee for each plastic shopping bag youuse
A law phasing out certain single-use plastic products thatare not recyclable
A law that requires that plastic waste can only be shippedto countries that are verified to be able to appropriately
handle this waste
A law requiring new plastic to contain at least somematerial from old plastic that has been recycled
The creation of a nationwide plastic beverage containerdeposit program*
The creation of a nationwide plastic beverage containerrefund program*
Receiving a 10-cent credit for using a reusable shoppingbag
Oppose Support
Support for Regulations
Strongly oppose Slightly oppose Somewhat support Strongly support
World Wildlife Fund
| 18 |
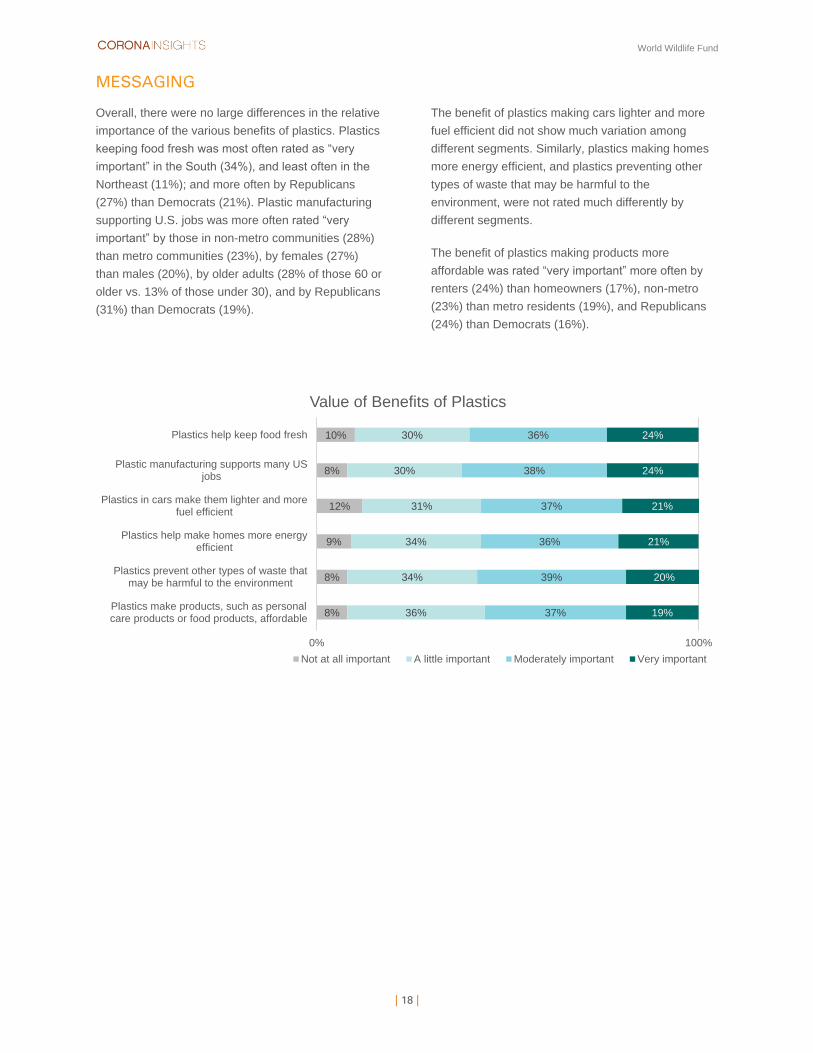
MESSAGING
Overall, there were no large differences in the relative
importance of the various benefits of plastics. Plastics
keeping food fresh was most often rated as “very
important” in the South (34%), and least often in the
Northeast (11%); and more often by Republicans
(27%) than Democrats (21%). Plastic manufacturing
supporting U.S. jobs was more often rated “very
important” by those in non-metro communities (28%)
than metro communities (23%), by females (27%)
than males (20%), by older adults (28% of those 60 or
older vs. 13% of those under 30), and by Republicans
(31%) than Democrats (19%).
The benefit of plastics making cars lighter and more
fuel efficient did not show much variation among
different segments. Similarly, plastics making homes
more energy efficient, and plastics preventing other
types of waste that may be harmful to the
environment, were not rated much differently by
different segments.
The benefit of plastics making products more
affordable was rated “very important” more often by
renters (24%) than homeowners (17%), non-metro
(23%) than metro residents (19%), and Republicans
(24%) than Democrats (16%).
10%
8%
12%
9%
8%
8%
30%
30%
31%
34%
34%
36%
36%
38%
37%
36%
39%
37%
24%
24%
21%
21%
20%
19%
0% 100%
Plastics help keep food fresh
Plastic manufacturing supports many USjobs
Plastics in cars make them lighter and morefuel efficient
Plastics help make homes more energyefficient
Plastics prevent other types of waste thatmay be harmful to the environment
Plastics make products, such as personalcare products or food products, affordable
Value of Benefits of Plastics
Not at all important A little important Moderately important Very important
World Wildlife Fund
| 19 |
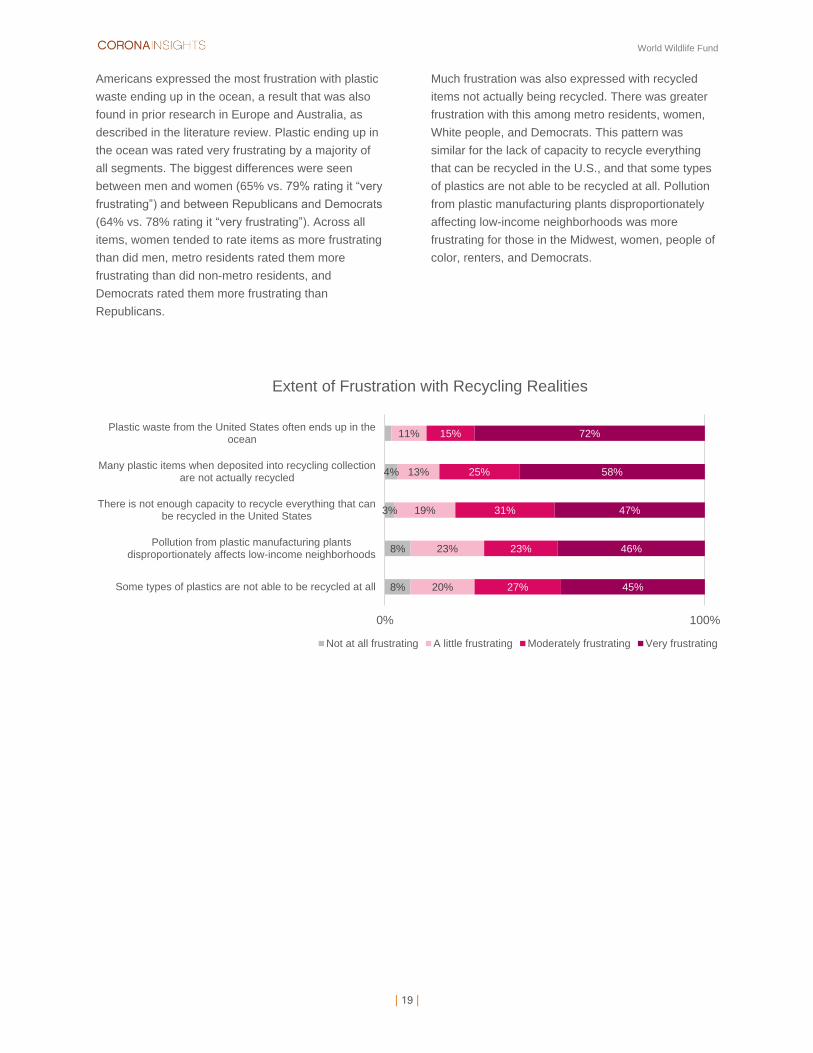
Americans expressed the most frustration with plastic
waste ending up in the ocean, a result that was also
found in prior research in Europe and Australia, as
described in the literature review. Plastic ending up in
the ocean was rated very frustrating by a majority of
all segments. The biggest differences were seen
between men and women (65% vs. 79% rating it “very
frustrating”) and between Republicans and Democrats
(64% vs. 78% rating it “very frustrating”). Across all
items, women tended to rate items as more frustrating
than did men, metro residents rated them more
frustrating than did non-metro residents, and
Democrats rated them more frustrating than
Republicans.
Much frustration was also expressed with recycled
items not actually being recycled. There was greater
frustration with this among metro residents, women,
White people, and Democrats. This pattern was
similar for the lack of capacity to recycle everything
that can be recycled in the U.S., and that some types
of plastics are not able to be recycled at all. Pollution
from plastic manufacturing plants disproportionately
affecting low-income neighborhoods was more
frustrating for those in the Midwest, women, people of
color, renters, and Democrats.
8%
8%
3%
4%
20%
23%
19%
13%
11%
27%
23%
31%
25%
15%
45%
46%
47%
58%
72%
0% 100%
Some types of plastics are not able to be recycled at all
Pollution from plastic manufacturing plantsdisproportionately affects low-income neighborhoods
There is not enough capacity to recycle everything that canbe recycled in the United States
Many plastic items when deposited into recycling collectionare not actually recycled
Plastic waste from the United States often ends up in theocean
Extent of Frustration with Recycling Realities
Not at all frustrating A little frustrating Moderately frustrating Very frustrating
World Wildlife Fund
| 20 |
APPENDIX
World Wildlife Fund
| 21 |
DELIVERABLES
The 2020 Public Opinion Surrounding Plastic Consumption and Waste Management Of
Consumer Packaging Report is comprised of the following deliverables:
Executive Summary: PDF including key findings of the Report.
Detailed Findings: PDF including additional analyses of the survey results, including
exhibits.
Tabulations: Excel file with all tabulations, including by multiple segments, of each survey
question. Verbatim comments are also included.
Survey Instrument: A copy of the survey instrument used in this study is also included for
reference.
Literature Review Memo: A separate PDF documenting findings from the literature
review as well as implications.
World Wildlife Fund
| 22 |
DEFINITION OF TERMS
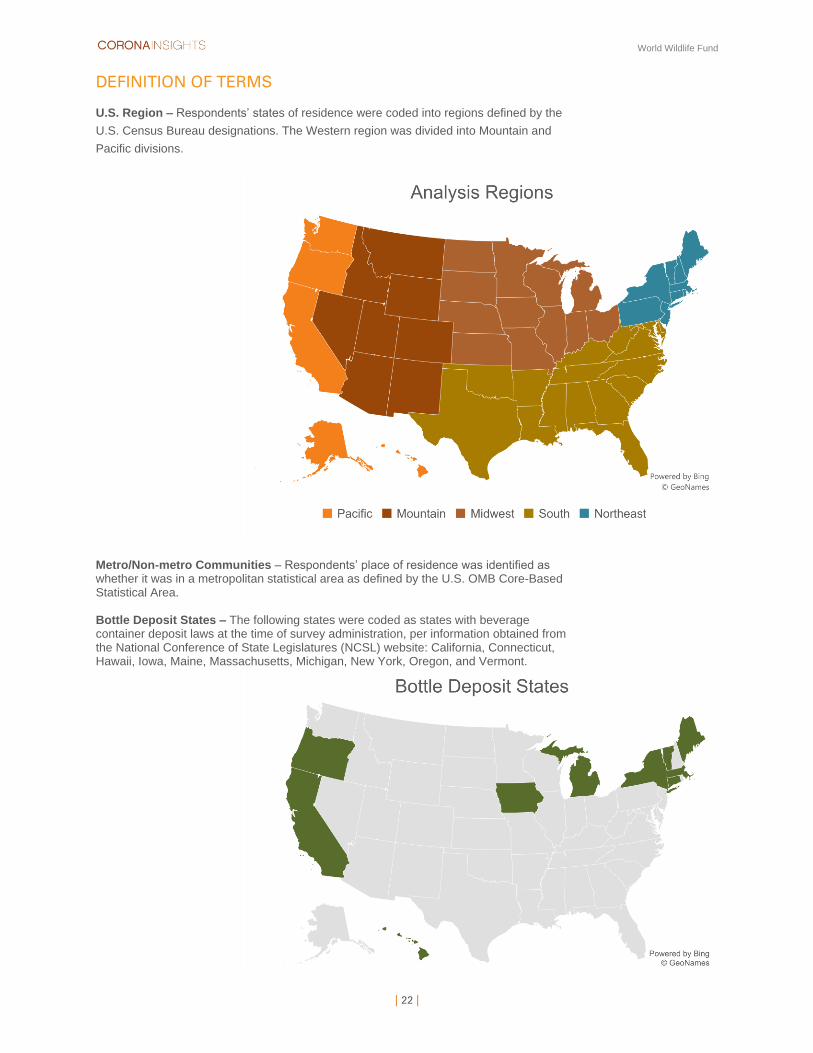
U.S. Region – Respondents’ states of residence were coded into regions defined by the
U.S. Census Bureau designations. The Western region was divided into Mountain and
Pacific divisions.
Metro/Non-metro Communities – Respondents’ place of residence was identified as whether it was in a metropolitan statistical area as defined by the U.S. OMB Core-Based Statistical Area. Bottle Deposit States – The following states were coded as states with beverage container deposit laws at the time of survey administration, per information obtained from the National Conference of State Legislatures (NCSL) website: California, Connecticut, Hawaii, Iowa, Maine, Massachusetts, Michigan, New York, Oregon, and Vermont.
World Wildlife Fund
| 23 |
METHODS
Survey sponsored & funded by: World Wildlife Fund (sponsor was blinded for survey
respondents)
Survey conducted by: Corona Insights, contact Matt Bruce at [email protected]
Survey population: Adult (age 18+) residents of U.S.
Fielding period: December 3-11, 2020
Sampling: Probability-based sample from NORC AmeriSpeak® panel (detailed technical
overview available here), stratified into 5 geographical regions
Mode: Online survey hosted by Corona Insights’ on the Alchemer survey platform, with
email invitations from the AmeriSpeak® panel
Language: English language only
Screening: No additional screening was performed
Data quality procedures: Respondents were disqualified from analysis if their survey
completion time was faster than 1/3 of the median survey completion time, or if they
answered fewer than half of the median number of questions answered.
Incentives: Incentives were provided by the AmeriSpeak® panel. Panelists were offered
the cash equivalent of $5.
Length: The median survey length was 15 minutes.
Sample size: 1,098 usable responses were collected.
Response rate: 5%
Weighting: Weighting was conducted by NORC and includes adjustments for non-
response in panel recruitment, as well as survey non-response. Final weights align the
survey population to the external population with regard to age (7 categories), gender (2
categories), education (4 categories), race/ethnicity (4 categories), housing tenure (2
categories), telephone status (3 categories), and Census Division (9 categories). The
average design effect is 1.93.
Margin of Error: ±4.11% for the overall results
Survey instrument: A copy of the survey instrument used in this study is also included for
reference.
World Wildlife Fund
| 24 |
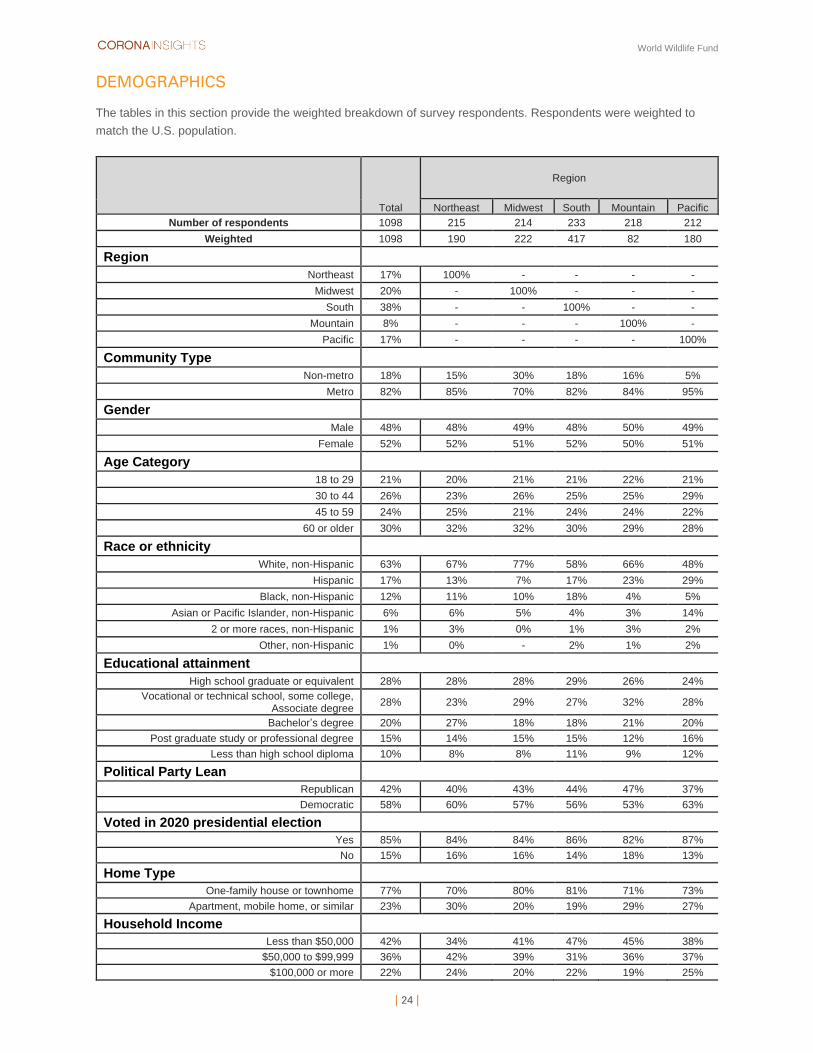
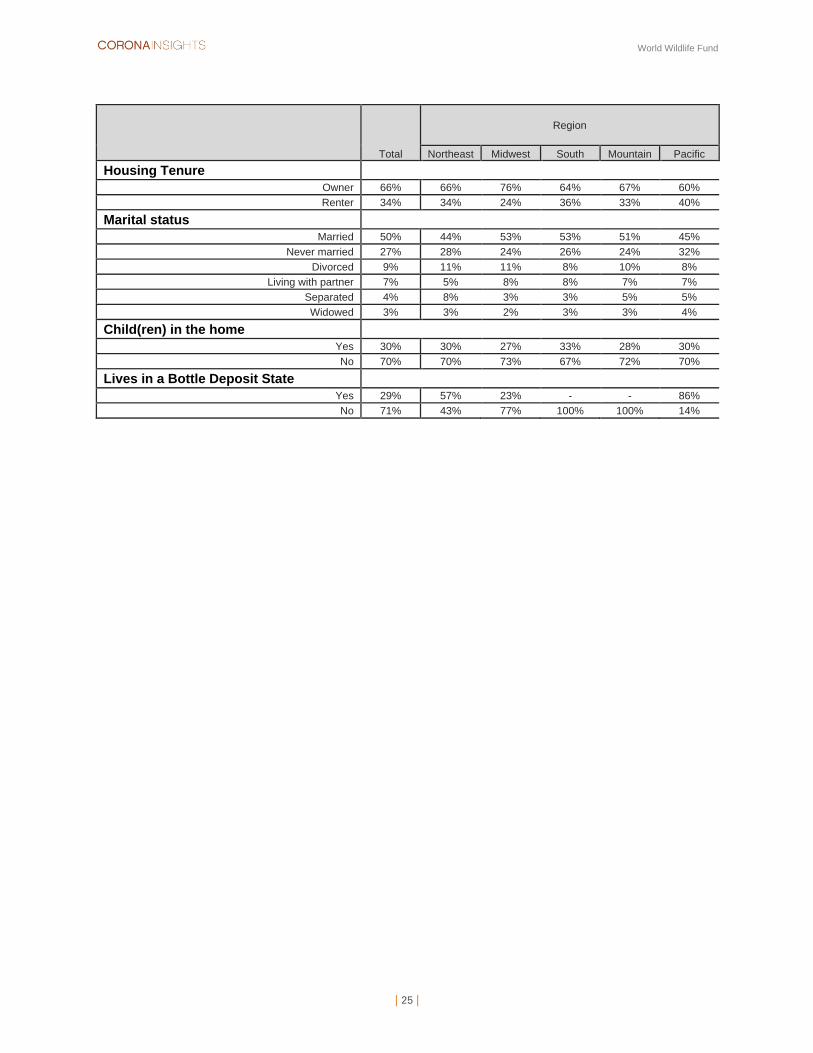
DEMOGRAPHICS
The tables in this section provide the weighted breakdown of survey respondents. Respondents were weighted to
match the U.S. population.
Total
Region
Northeast Midwest South Mountain Pacific
Number of respondents 1098 215 214 233 218 212
Weighted 1098 190 222 417 82 180
Region
Northeast 17% 100% - - - -
Midwest 20% - 100% - - -
South 38% - - 100% - -
Mountain 8% - - - 100% -
Pacific 17% - - - - 100%
Community Type
Non-metro 18% 15% 30% 18% 16% 5%
Metro 82% 85% 70% 82% 84% 95%
Gender
Male 48% 48% 49% 48% 50% 49%
Female 52% 52% 51% 52% 50% 51%
Age Category
18 to 29 21% 20% 21% 21% 22% 21%
30 to 44 26% 23% 26% 25% 25% 29%
45 to 59 24% 25% 21% 24% 24% 22%
60 or older 30% 32% 32% 30% 29% 28%
Race or ethnicity
White, non-Hispanic 63% 67% 77% 58% 66% 48%
Hispanic 17% 13% 7% 17% 23% 29%
Black, non-Hispanic 12% 11% 10% 18% 4% 5%
Asian or Pacific Islander, non-Hispanic 6% 6% 5% 4% 3% 14%
2 or more races, non-Hispanic 1% 3% 0% 1% 3% 2%
Other, non-Hispanic 1% 0% - 2% 1% 2%
Educational attainment
High school graduate or equivalent 28% 28% 28% 29% 26% 24%
Vocational or technical school, some college, Associate degree
28% 23% 29% 27% 32% 28%
Bachelor’s degree 20% 27% 18% 18% 21% 20%
Post graduate study or professional degree 15% 14% 15% 15% 12% 16%
Less than high school diploma 10% 8% 8% 11% 9% 12%
Political Party Lean
Republican 42% 40% 43% 44% 47% 37%
Democratic 58% 60% 57% 56% 53% 63%
Voted in 2020 presidential election
Yes 85% 84% 84% 86% 82% 87%
No 15% 16% 16% 14% 18% 13%
Home Type
One-family house or townhome 77% 70% 80% 81% 71% 73%
Apartment, mobile home, or similar 23% 30% 20% 19% 29% 27%
Household Income
Less than $50,000 42% 34% 41% 47% 45% 38%
$50,000 to $99,999 36% 42% 39% 31% 36% 37%
$100,000 or more 22% 24% 20% 22% 19% 25%
World Wildlife Fund
| 25 |
Total
Region
Northeast Midwest South Mountain Pacific
Housing Tenure
Owner 66% 66% 76% 64% 67% 60%
Renter 34% 34% 24% 36% 33% 40%
Marital status
Married 50% 44% 53% 53% 51% 45%
Never married 27% 28% 24% 26% 24% 32%
Divorced 9% 11% 11% 8% 10% 8%
Living with partner 7% 5% 8% 8% 7% 7%
Separated 4% 8% 3% 3% 5% 5%
Widowed 3% 3% 2% 3% 3% 4%
Child(ren) in the home
Yes 30% 30% 27% 33% 28% 30%
No 70% 70% 73% 67% 72% 70%
Lives in a Bottle Deposit State
Yes 29% 57% 23% - - 86%
No 71% 43% 77% 100% 100% 14%

Public Opinion Surrounding Plastic Consumption
and Waste Management of Consumer Packaging
2020
WWF
| 1 |
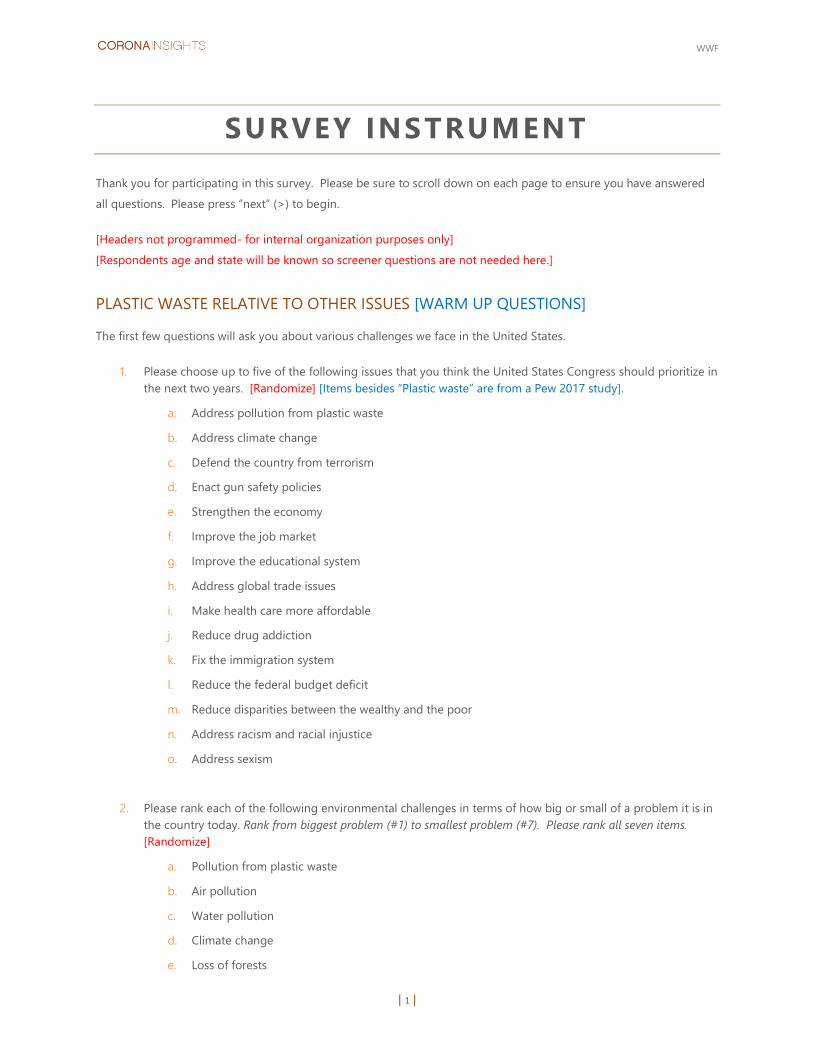
SURVEY INSTRUMENT
Thank you for participating in this survey. Please be sure to scroll down on each page to ensure you have answered
all questions. Please press “next” (>) to begin.
[Headers not programmed- for internal organization purposes only]
[Respondents age and state will be known so screener questions are not needed here.]
PLASTIC WASTE RELATIVE TO OTHER ISSUES [WARM UP QUESTIONS]
The first few questions will ask you about various challenges we face in the United States.
1. Please choose up to five of the following issues that you think the United States Congress should prioritize in
the next two years. [Randomize] [Items besides “Plastic waste” are from a Pew 2017 study].
a. Address pollution from plastic waste
b. Address climate change
c. Defend the country from terrorism
d. Enact gun safety policies
e. Strengthen the economy
f. Improve the job market
g. Improve the educational system
h. Address global trade issues
i. Make health care more affordable
j. Reduce drug addiction
k. Fix the immigration system
l. Reduce the federal budget deficit
m. Reduce disparities between the wealthy and the poor
n. Address racism and racial injustice
o. Address sexism
2. Please rank each of the following environmental challenges in terms of how big or small of a problem it is in
the country today. Rank from biggest problem (#1) to smallest problem (#7). Please rank all seven items.
[Randomize]
a. Pollution from plastic waste
b. Air pollution
c. Water pollution
d. Climate change
e. Loss of forests
WWF
| 2 |
f. Loss of habitat
g. Population growth
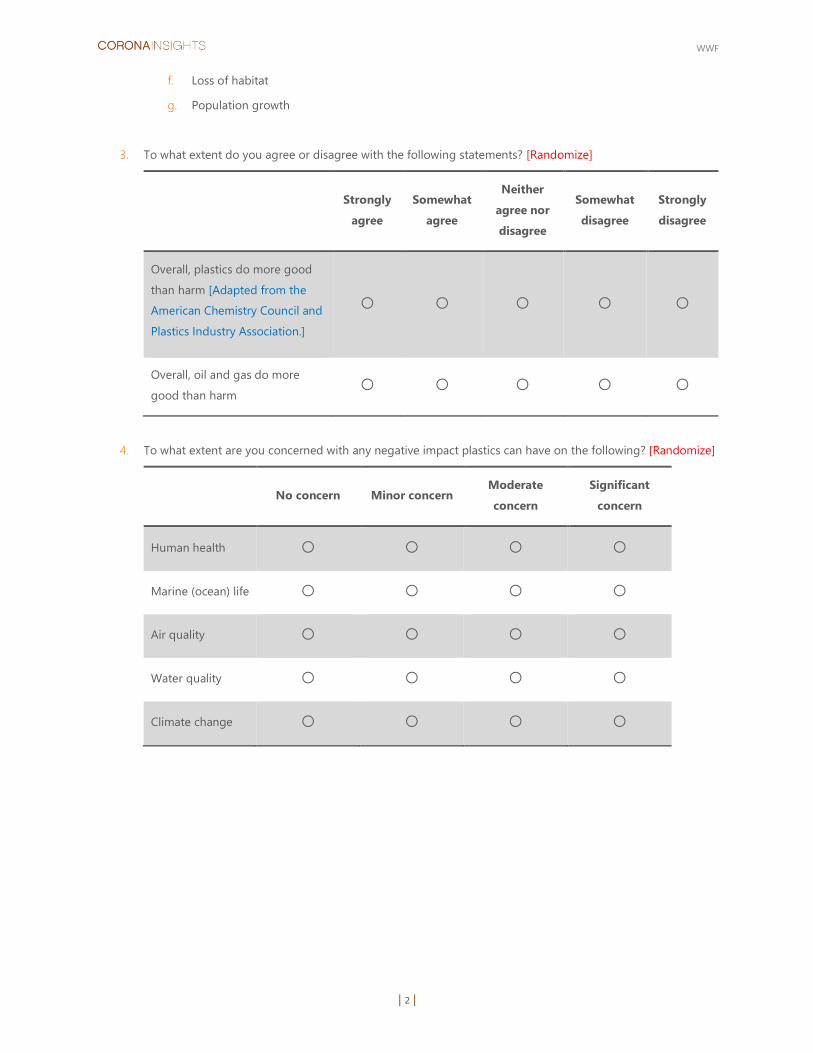
3. To what extent do you agree or disagree with the following statements? [Randomize]
Strongly
agree
Somewhat
agree
Neither
agree nor
disagree
Somewhat
disagree
Strongly
disagree
Overall, plastics do more good
than harm [Adapted from the
American Chemistry Council and
Plastics Industry Association.]
○ ○ ○ ○ ○
Overall, oil and gas do more
good than harm ○ ○ ○ ○ ○
4. To what extent are you concerned with any negative impact plastics can have on the following? [Randomize]
No concern Minor concern Moderate
concern
Significant
concern
Human health ○ ○ ○ ○
Marine (ocean) life ○ ○ ○ ○
Air quality ○ ○ ○ ○
Water quality ○ ○ ○ ○
Climate change ○ ○ ○ ○
WWF
| 3 |
ATTITUDES AROUND PLASTIC WASTE
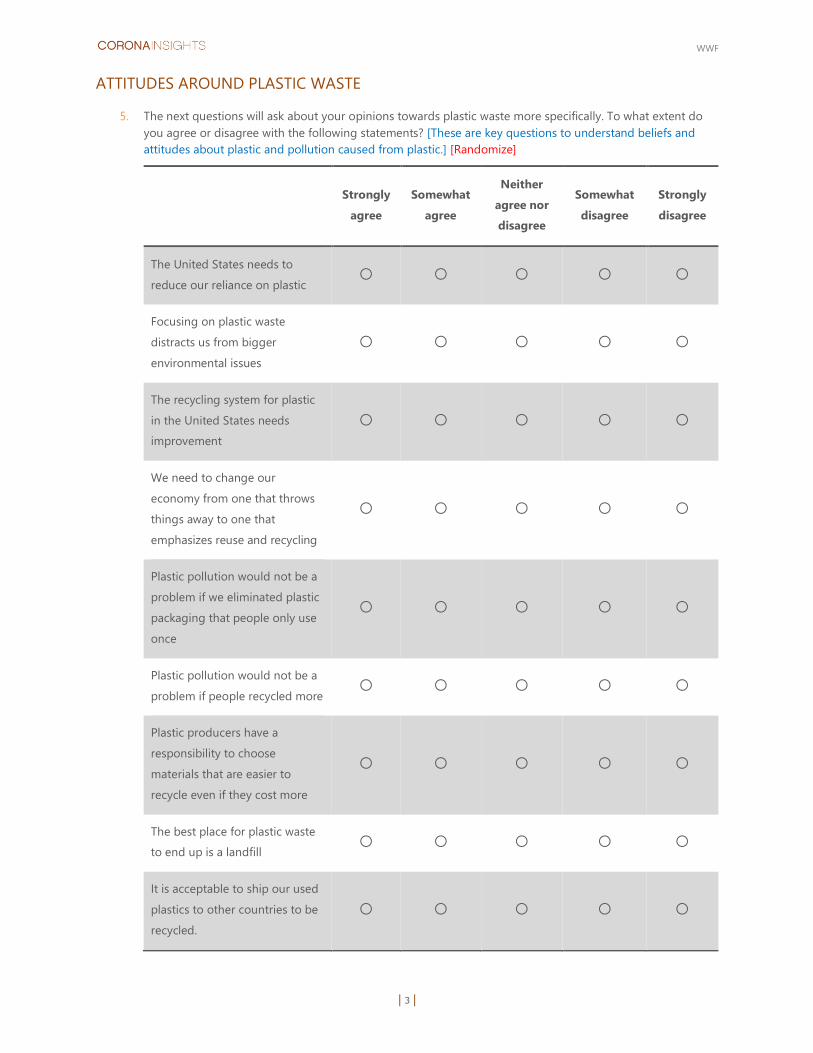
5. The next questions will ask about your opinions towards plastic waste more specifically. To what extent do
you agree or disagree with the following statements? [These are key questions to understand beliefs and
attitudes about plastic and pollution caused from plastic.] [Randomize]
Strongly
agree
Somewhat
agree
Neither
agree nor
disagree
Somewhat
disagree
Strongly
disagree
The United States needs to
reduce our reliance on plastic ○ ○ ○ ○ ○
Focusing on plastic waste
distracts us from bigger
environmental issues
○ ○ ○ ○ ○
The recycling system for plastic
in the United States needs
improvement
○ ○ ○ ○ ○
We need to change our
economy from one that throws
things away to one that
emphasizes reuse and recycling
○ ○ ○ ○ ○
Plastic pollution would not be a
problem if we eliminated plastic
packaging that people only use
once
○ ○ ○ ○ ○
Plastic pollution would not be a
problem if people recycled more ○ ○ ○ ○ ○
Plastic producers have a
responsibility to choose
materials that are easier to
recycle even if they cost more
○ ○ ○ ○ ○
The best place for plastic waste
to end up is a landfill ○ ○ ○ ○ ○
It is acceptable to ship our used
plastics to other countries to be
recycled.
○ ○ ○ ○ ○
WWF
| 4 |
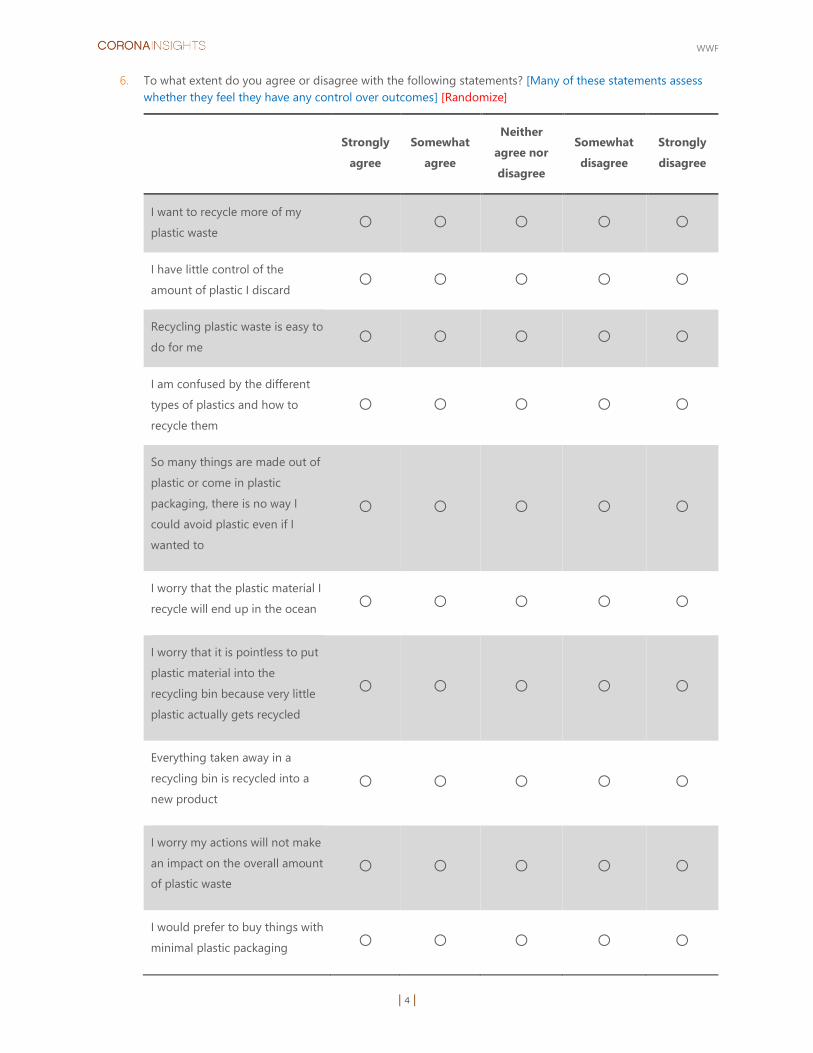
6. To what extent do you agree or disagree with the following statements? [Many of these statements assess
whether they feel they have any control over outcomes] [Randomize]
Strongly
agree
Somewhat
agree
Neither
agree nor
disagree
Somewhat
disagree
Strongly
disagree
I want to recycle more of my
plastic waste ○ ○ ○ ○ ○
I have little control of the
amount of plastic I discard ○ ○ ○ ○ ○
Recycling plastic waste is easy to
do for me ○ ○ ○ ○ ○
I am confused by the different
types of plastics and how to
recycle them
○ ○ ○ ○ ○
So many things are made out of
plastic or come in plastic
packaging, there is no way I
could avoid plastic even if I
wanted to
○ ○ ○ ○ ○
I worry that the plastic material I
recycle will end up in the ocean ○ ○ ○ ○ ○
I worry that it is pointless to put
plastic material into the
recycling bin because very little
plastic actually gets recycled
○ ○ ○ ○ ○
Everything taken away in a
recycling bin is recycled into a
new product
○ ○ ○ ○ ○
I worry my actions will not make
an impact on the overall amount
of plastic waste
○ ○ ○ ○ ○
I would prefer to buy things with
minimal plastic packaging ○ ○ ○ ○ ○
WWF
| 5 |
CURRENT BEHAVIORS
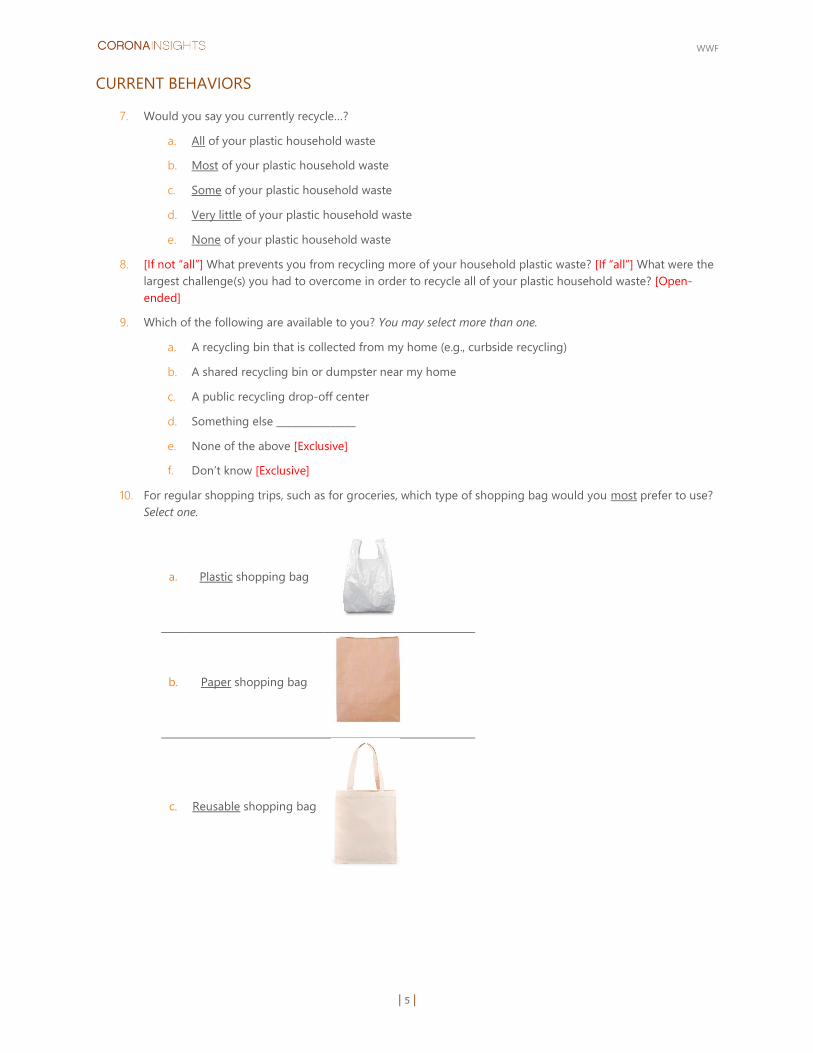
7. Would you say you currently recycle…?
a. All of your plastic household waste
b. Most of your plastic household waste
c. Some of your plastic household waste
d. Very little of your plastic household waste
e. None of your plastic household waste
8. [If not “all”] What prevents you from recycling more of your household plastic waste? [If “all”] What were the
largest challenge(s) you had to overcome in order to recycle all of your plastic household waste? [Open-
ended]
9. Which of the following are available to you? You may select more than one.
a. A recycling bin that is collected from my home (e.g., curbside recycling)
b. A shared recycling bin or dumpster near my home
c. A public recycling drop-off center
d. Something else ________________
e. None of the above [Exclusive]
f. Don’t know [Exclusive]
10. For regular shopping trips, such as for groceries, which type of shopping bag would you most prefer to use?
Select one.
a. Plastic shopping bag
b. Paper shopping bag
c. Reusable shopping bag
WWF
| 6 |
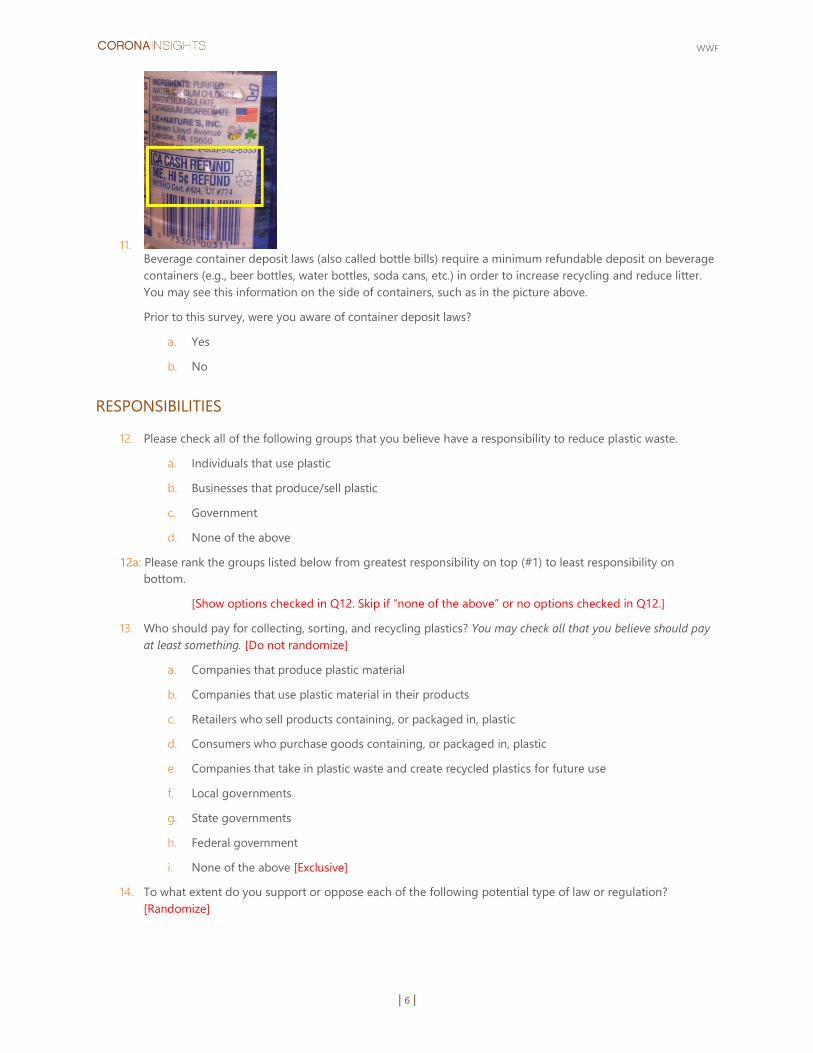
11. Beverage container deposit laws (also called bottle bills) require a minimum refundable deposit on beverage
containers (e.g., beer bottles, water bottles, soda cans, etc.) in order to increase recycling and reduce litter.
You may see this information on the side of containers, such as in the picture above.
Prior to this survey, were you aware of container deposit laws?
a. Yes
b. No
RESPONSIBILITIES
12. Please check all of the following groups that you believe have a responsibility to reduce plastic waste.
a. Individuals that use plastic
b. Businesses that produce/sell plastic
c. Government
d. None of the above
12a: Please rank the groups listed below from greatest responsibility on top (#1) to least responsibility on
bottom.
[Show options checked in Q12. Skip if “none of the above” or no options checked in Q12.]
13. Who should pay for collecting, sorting, and recycling plastics? You may check all that you believe should pay
at least something. [Do not randomize]
a. Companies that produce plastic material
b. Companies that use plastic material in their products
c. Retailers who sell products containing, or packaged in, plastic
d. Consumers who purchase goods containing, or packaged in, plastic
e. Companies that take in plastic waste and create recycled plastics for future use
f. Local governments
g. State governments
h. Federal government
i. None of the above [Exclusive]
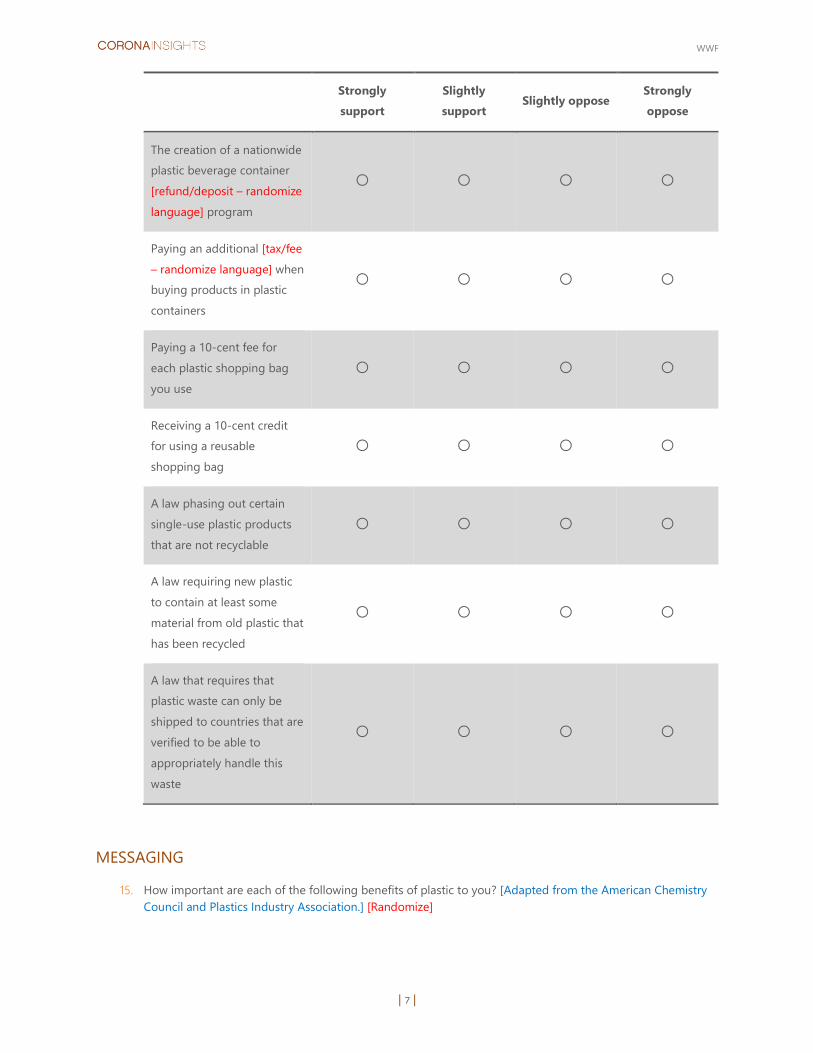
14. To what extent do you support or oppose each of the following potential type of law or regulation?
[Randomize]
WWF
| 7 |
Strongly
support
Slightly
support Slightly oppose
Strongly
oppose
The creation of a nationwide
plastic beverage container
[refund/deposit – randomize
language] program
○ ○ ○ ○
Paying an additional [tax/fee
– randomize language] when
buying products in plastic
containers
○ ○ ○ ○
Paying a 10-cent fee for
each plastic shopping bag
you use
○ ○ ○ ○
Receiving a 10-cent credit
for using a reusable
shopping bag
○ ○ ○ ○
A law phasing out certain
single-use plastic products
that are not recyclable
○ ○ ○ ○
A law requiring new plastic
to contain at least some
material from old plastic that
has been recycled
○ ○ ○ ○
A law that requires that
plastic waste can only be
shipped to countries that are
verified to be able to
appropriately handle this
waste
○ ○ ○ ○
MESSAGING
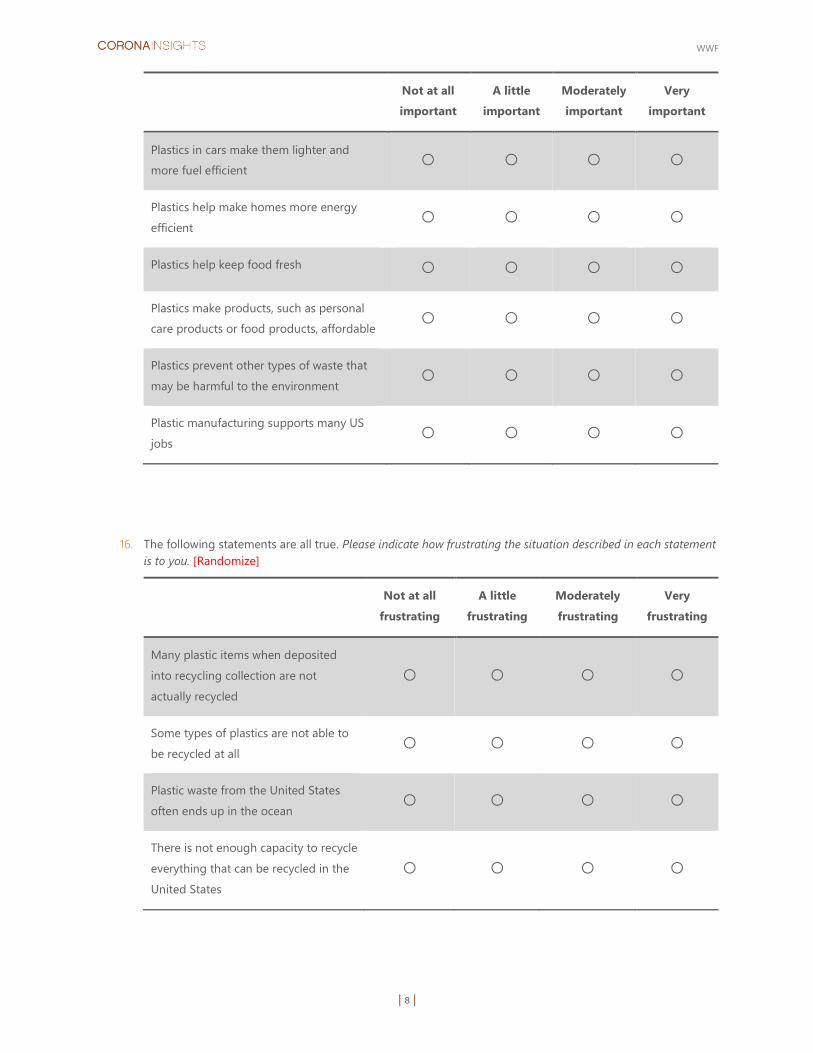
15. How important are each of the following benefits of plastic to you? [Adapted from the American Chemistry
Council and Plastics Industry Association.] [Randomize]
WWF
| 8 |
Not at all
important
A little
important
Moderately
important
Very
important
Plastics in cars make them lighter and
more fuel efficient ○ ○ ○ ○
Plastics help make homes more energy
efficient ○ ○ ○ ○
Plastics help keep food fresh ○ ○ ○ ○
Plastics make products, such as personal
care products or food products, affordable ○ ○ ○ ○
Plastics prevent other types of waste that
may be harmful to the environment ○ ○ ○ ○
Plastic manufacturing supports many US
jobs ○ ○ ○ ○
16. The following statements are all true. Please indicate how frustrating the situation described in each statement
is to you. [Randomize]
Not at all
frustrating
A little
frustrating
Moderately
frustrating
Very
frustrating
Many plastic items when deposited
into recycling collection are not
actually recycled
○ ○ ○ ○
Some types of plastics are not able to
be recycled at all ○ ○ ○ ○
Plastic waste from the United States
often ends up in the ocean ○ ○ ○ ○
There is not enough capacity to recycle
everything that can be recycled in the
United States
○ ○ ○ ○
WWF
| 9 |
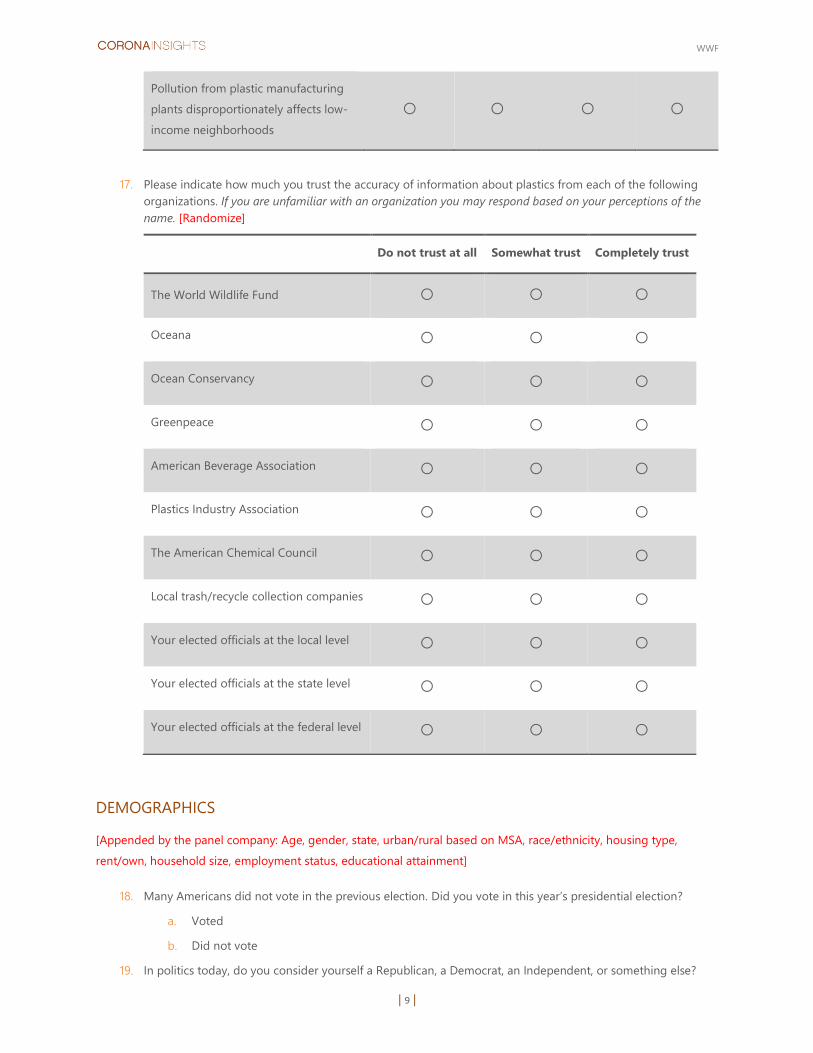
Pollution from plastic manufacturing
plants disproportionately affects low-
income neighborhoods
○ ○ ○ ○
17. Please indicate how much you trust the accuracy of information about plastics from each of the following
organizations. If you are unfamiliar with an organization you may respond based on your perceptions of the
name. [Randomize]
Do not trust at all Somewhat trust Completely trust
The World Wildlife Fund ○ ○ ○
Oceana ○ ○ ○
Ocean Conservancy ○ ○ ○
Greenpeace ○ ○ ○
American Beverage Association ○ ○ ○
Plastics Industry Association ○ ○ ○
The American Chemical Council ○ ○ ○
Local trash/recycle collection companies ○ ○ ○
Your elected officials at the local level ○ ○ ○
Your elected officials at the state level ○ ○ ○
Your elected officials at the federal level ○ ○ ○
DEMOGRAPHICS
[Appended by the panel company: Age, gender, state, urban/rural based on MSA, race/ethnicity, housing type,
rent/own, household size, employment status, educational attainment]
18. Many Americans did not vote in the previous election. Did you vote in this year’s presidential election?
a. Voted
b. Did not vote
19. In politics today, do you consider yourself a Republican, a Democrat, an Independent, or something else?
WWF
| 10 |
a. Republican
b. Democrat
c. Independent
d. Something else
20. [If Independent/Something else/no answer] As of today do you lean more to the Republican Party or the
Democratic Party?
a. Republican Party
b. Democratic Party
FINAL COMMENTS
21. If you have any additional comments on the topics covered in this survey, please provide them below.
[Open-ended]