Embed Size (px)
Citation preview

Social & Community Perspectives
Inequalities in Health and Health Care (1)
28th January 2003

Objectives
To recognise:• An individual’s experience of health and
health care vary according to:• Social class • Gender• Ethnicity
• That there are inequalities in:• Morbidity and mortality rates• Care and treatment

Definitions of Health
• Biomedicine – an absence of either disease or death.
• WHO – “Health is a state of complete and physical, mental and social well-being not merely the absence of disease or infirmity”

POVERTY• Absolute Poverty
– standard of living incapable of sustaining physically healthy life
• Relative Poverty– Standard of living below what is ‘normal’ or acceptable
in a particular society/culture, – Takes into account the idea of deprivation – being
excluded from ordinary life patterns, customs/activities.– Can include not being able to afford certain types of
food usually consumed by members of the society/ owning a car/ consumer durables.

Britain today:
• 19% of the population less that half the average weekly income.
• 18% of children are in receipt of income support.
• 0.9 million homes unfit for habitation.
• 0.45 million homes lack amenities.

Poverty typically hits
• Low waged • Disabled/chronically ill • Elderly and retired• Unemployed • Families headed by a lone parent.
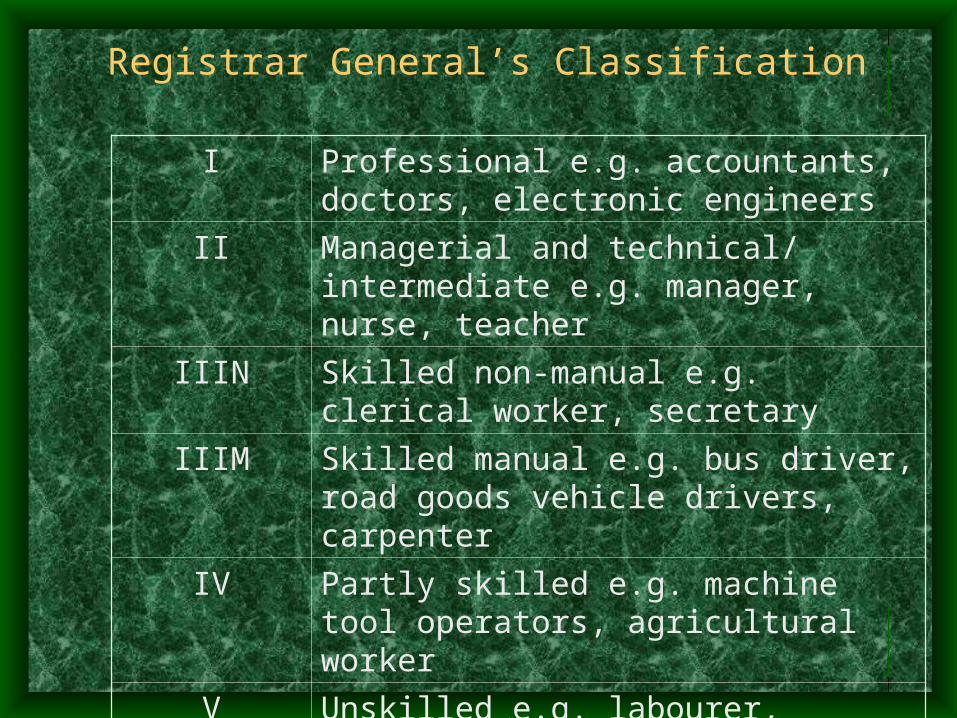
Registrar General’s Classification
I Professional e.g. accountants, doctors, electronic engineers
II Managerial and technical/ intermediate e.g. manager, nurse, teacher
IIIN Skilled non-manual e.g. clerical worker, secretary
IIIM Skilled manual e.g. bus driver, road goods vehicle drivers, carpenter
IV Partly skilled e.g. machine tool operators, agricultural worker
V Unskilled e.g. labourer, cleaner

The Black Report - 1980
• Clear class gradient in both illness and mortality. • This gradient was replicated in access and use of
health care facilities.• Problem of inequality outside the NHS
• Income • Work • Environment • Housing • Education• Transport • ‘Lifestyles’

‘Our Healthier Nation’
• 1997 Sir Donald Acheson appointed to look into problem of inequality and health
• Premature death increases from Social Class I To V.
• Life expectancy gap between professional and unskilled workers:
• 9.5 years for men • 6.4 years for women.
• Mortality rates from CHD, lung cancer, accidents suicide all higher in social class V compared I. (exception breast cancer)
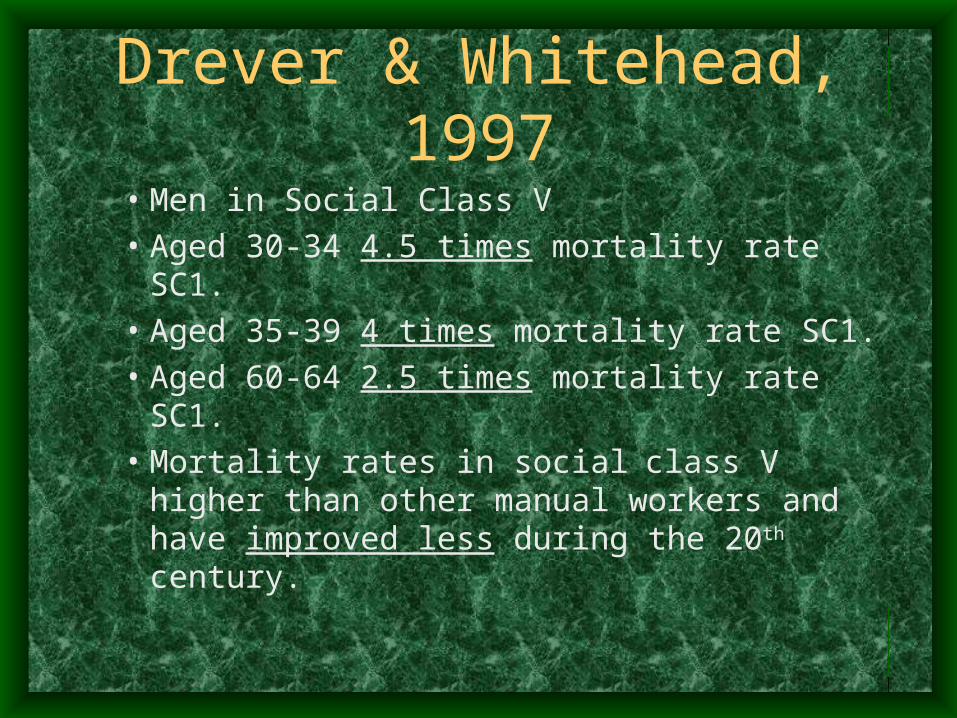
Drever & Whitehead, 1997
• Men in Social Class V• Aged 30-34 4.5 times mortality rate SC1.• Aged 35-39 4 times mortality rate SC1.• Aged 60-64 2.5 times mortality rate SC1.• Mortality rates in social class V higher than
other manual workers and have improved less during the 20th century.

Work & Health
• Work provides income, social contact, purpose, achievement and social status.
• Different jobs affect health in different ways e.g. manual work may be inherently dangerous and unhealthy, and historically more insecure.

Unemployment & Health• Major cause of ill health and death.
• Morris et al (1994) Compared those who’d experienced unemployment and those who worked throughout.– 96% of those in work survived – 91% of those
who’d experienced unemployment– Effect found even when class and health-related
behaviour taken into account
Unemployment also affects the health of families – e.g. children of the unemployed are 3xs as likely to
suffer a fatal accident.

Gender
• Women and men have different patterns of morbidity and mortality.
• “Experiences generally reflect gender roles.
• Men’s higher mortality rates explained by CHD, lung cancer, stroke and suicide
• Higher mortality rate throughout life - particularly youth & early adulthood
• Aged 15 - 44 = 3-4xs higher mortality accidents & suicide/violence than women

Changes
• Today longevity female advantage in Western societies
• First half 19thC life expectancy about the same
• 1960 women could expect to live 5.8 years longer
• Possible explanations for differences– Selection
• WW1 mortality during women’s reproductive years
• Adverse social circumstances for women and girls under conditions of economic scarcity

Gender and morbidity
• Women’s life expectancy may begin to decline if lifestyle becomes ‘more like men’
• Commonly accepted that women are in worse health than men.
• Women report more limiting long-standing illness & restricted activity

Men’s health
• Increased attention on men’s health
• Led way in smoking historically
• Still drink more
• Men exposed to occupational influences on health more
• Men still dominate in certain areas of mortality e.g. suicide – self-inflicted injury
• Significant number of men’s death associated with risk taking behaviour

Changes in job market affect men more than women.
• Shift from F-T manual work to flexible, less secure jobs unemployment
• 1970s male unemployment = <4% - mid 1990s =14%
• Unskilled manual groups early 1970s = 15% early 1990s = 30%
• Unemployment profound effect on health adverse psychological effects.
Women’s health
• Women more likely to become patients than men because of their reproductive capacity.
• Historically reproductive role used to suggest that women were less able.
• Iatrogenic illness.

Women’s health
• Disadvantaged home & labour market
• Link with higher rates of morbidity -poor mental health, anxiety and depression?
• Position not worsening – but need to think about social circumstances.
• More likely to be exposed to poor home environment with childcare responsibilities and low levels of social support.

Women and Work
• Twice as likely to be in temporary conditions • Twice as likely to be in such work because no
permanent employment.• Earn less then men for comparable job
• More roles better health - counterintuitive?
• Work outside home = income also social support and improved self esteem
• ‘Housewives’ tend to have worst health of all.

Women in Later Life • Greater level of functional disability• Suffer more chronic or disabling
illness • More likely to live in poverty• Since 1980 state pension decreased in
real terms (16% average earnings - 10% by 2021)
• Two thirds older men have pension compared with one quarter older women

Women as carers • Major role caring for others in
health/sickness• Caring for frail and/or disabled major
burden (both physical and mental impact)
time in hospital cost to private domain
• 1995 ~ 40% of women more than 50hrs/wk caring (Benzeval, 1998)
Lone mothers
• Lone parenthood = low income, exposure to poor material conditions in infancy
• 1971 ~8% households headed by lone mothers – mid 1990s = 20%
• Amongst most disadvantaged, small proportion employed & high rates of poverty

Benzeval’s work on Lone parents
• Majority lone mothers - lowest income quintile, not in f-t work, on income support and in social housing, only a minority of couples in this position.
• Increasingly lone mothers = younger, single (never married) with younger children for whom well-paid employment limited

DSS 1997 figures
• 1/3 people in Britain receive one or more means tested benefit
• 2.9 million children < 16 (1/4 children) living in households in receipt of income support
• 70% of these households headed by lone mothers.

Caring on low income is difficult
• Low income force mothers to behaviour which may compromise health.
• Food largest single household expenditure
• Concern immediate survival not future risk
• Parents protect child from worse effects of nutritional deprivation, but women in claimant households often have diets deficient in key nutrients and more likely to smoke.

Ethnicity
• Non-European minority ethnic population approx 3 million – about 6% population (about ½ born in UK)
• Higher concentration minority ethnic people in inner cities and industrial areas:– 48% minority ethnic population in Greater London
(2001)– High concentration in W Midlands (13%), North West
(8%), South East (7%), Yorkshire and Humberside (7%) (2001)
– Leicestershire 11.1 % - Leicester 28.5% (22.3% Indian) (1991)

Recording ethnicity data
1982 omitted from census – 1991/2001 included
Problems with ethnic categories:– Combines ‘race’, ethnicity & nationality– People may change way define themselves– Aggregates heterogeneous groups – Death certificates record country of birth –
mortality data based on this.

Minority ethnic groups in Britain more likely to be:
• Unemployed or in low paid work
• Live in poor and/or overcrowded housing
• Live in areas that lack adequate social and educational resources

Housing
Owner-occupied households:• 4/5 Indian and Pakistani • 1/3 white• ½ Caribbean, Bangladeshi and Chinese Overcrowding:• 1 in 50 white• 1 in 10 (approx) Caribbean and Indian• more than 1/3 Pakistani and Bangladeshi.

Age profile
• 1991 BMEGs younger than white population.
• Children = 1/3 compared to 1/5 of white population.
• 16% of white population over 65 compared to just over 3% of minority ethnic population.

Employment
• Historical legacy low-paid, vulnerable hazardous industries, shift work
• Variation between different groups• Unemployment
– Indian and African Asian and Chinese compare favourable to white population
– Pakistani and Bangladeshi men almost four times as high
– Caribbean over twice as high – Higher rates for persist regardless of geographic
location and qualification.

Social Class
• Chinese and Indian African Asian similar to white population.
• Social Class V
20% White population
30% Caribbean
33%Pakistani
40% Bangladeshi

Modood et al (1997) Fourth National Survey of Ethnic Minorities
INCOME White Caribbean Indian Pakistani Bangladeshi Chinese > 1.5 times average
23 12 14 1 2 22
0.5 – 1.5 times average
49 47 45 17 14 44
< 0.5 times average
28 41 42 82 84 34

Inequalities in access to health services
• Minority ethnic groups GP consulting behaviour is comparable with white population.
• Evidence that referral to secondary care may be less frequent for minority ethnic people

Minority ethnic patients more likely than white patients to:
• Find physical access to GP difficult
• Have longer waiting times in surgery
• Feel that time with GP was inadequate
• Be unhappy with consultation

Inequalities in health
• Not uniform across groups - some outcomes significantly better off than white population
Some groups particularly disadvantaged:• Caribbeans high rates stroke &hypertension• South Asians high rates of CHD• Socio-economic gradient in health within
BMEGs• Socio-economic differentials do not explain all
ethnic variation in health

Problems with relying on socio-economic data:
• Traditional class groupings inadequate
• Within occupational grades minority ethnic groups more likely to be found in less secure, more stressful working conditions and work unsocial hours.
• Occupation may be inflated on death certificate.

Rickets
• Disease of poverty - Increased prevalence South Asian communities
• Historically eradicated through fortification of food with vitamin D and free milk
• Response - very ethnocentric• ‘Culture’ to blame • Implied change in behaviour was needed. • As people became more ‘westernised’ ’Asian
rickets’ would decrease

Mental Illness
• Highest rates of hospital admissions = Irish migrants.
• High rates of psychosis and drug problems among 2nd generation BMEGs
• High suicide and attempted suicide among South Asians.
• Lower detection of depression in minorities ethnic groups.

Possible Explanations for High admission for schizophrenia among
young Caribbean men• Higher need? – socio-economic
circumstances• Use of psychiatric services associated with
high levels of deprivation and unemployment and within inner city areas.
• Cultural differences may contribute to misdiagnosis.
• Racial prejudice in NHS and CJS?• Stresses associated with dealing with racism,
poor housing and overcrowding

South Asian much lower rates for consultation for mental health problems
compared to white.
Possible explanations:
• Inequitable access to service?
• Appropriate response to lower need?

Conclusions
• Experiences of health and health care vary according to social factors including:– Social class– Gender– Ethnicity
• Next week consider explanations for inequalities