Embed Size (px)
Citation preview
Addressing Health inequalities
JHOSC meeting 12 March 2021
Summary This paper provides an overview of our work to reduce health inequalities covering:Content Slides1. Context and national expectations 3-42. Aims and link to Borough Partnerships 5-63. Impact to date 7-14
I. Funding accessed II. Strategic PlanningIII. Anchor institutionsIV. Digital inclusionV. Covid vaccination and inequalities
4. Next Steps 155. Appendices 16-32
1. Context
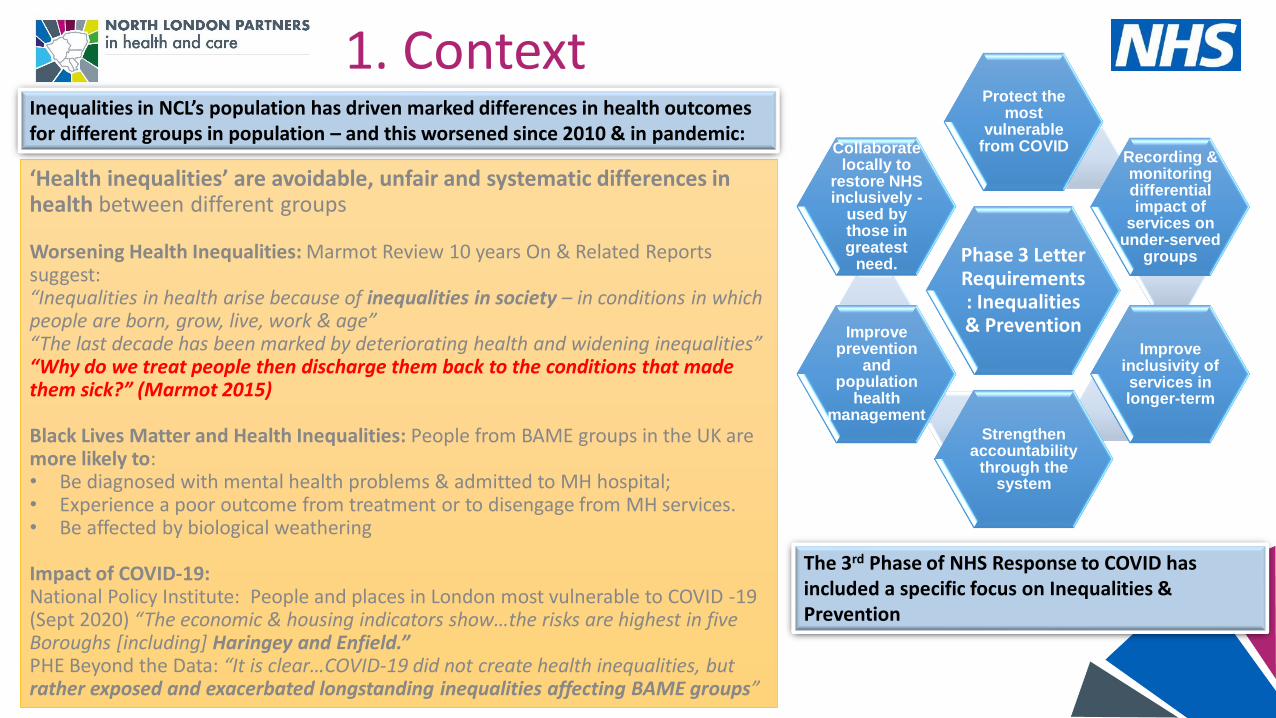
‘Health inequalities’ are avoidable, unfair and systematic differences in health between different groups
Worsening Health Inequalities: Marmot Review 10 years On & Related Reports suggest:“Inequalities in health arise because of inequalities in society – in conditions in which people are born, grow, live, work & age”“The last decade has been marked by deteriorating health and widening inequalities”“Why do we treat people then discharge them back to the conditions that made them sick?” (Marmot 2015)
Black Lives Matter and Health Inequalities: People from BAME groups in the UK are more likely to:• Be diagnosed with mental health problems & admitted to MH hospital;• Experience a poor outcome from treatment or to disengage from MH services.• Be affected by biological weathering
Impact of COVID-19:National Policy Institute: People and places in London most vulnerable to COVID -19 (Sept 2020) “The economic & housing indicators show…the risks are highest in five Boroughs [including] Haringey and Enfield.”PHE Beyond the Data: “It is clear…COVID-19 did not create health inequalities, but rather exposed and exacerbated longstanding inequalities affecting BAME groups”
Phase 3 Letter Requirements: Inequalities & Prevention
Protect the most
vulnerable from COVID
Recording & monitoring differential impact of
services on under-served
groups
Improve inclusivity of services in longer-term
Strengthen accountability
through the system
Improveprevention
and population
health management
Collaborate locally to
restore NHS inclusively -
used by those in greatest
need.
Inequalities in NCL’s population has driven marked differences in health outcomes for different groups in population – and this worsened since 2010 & in pandemic:
The 3rd Phase of NHS Response to COVID has included a specific focus on Inequalities & Prevention
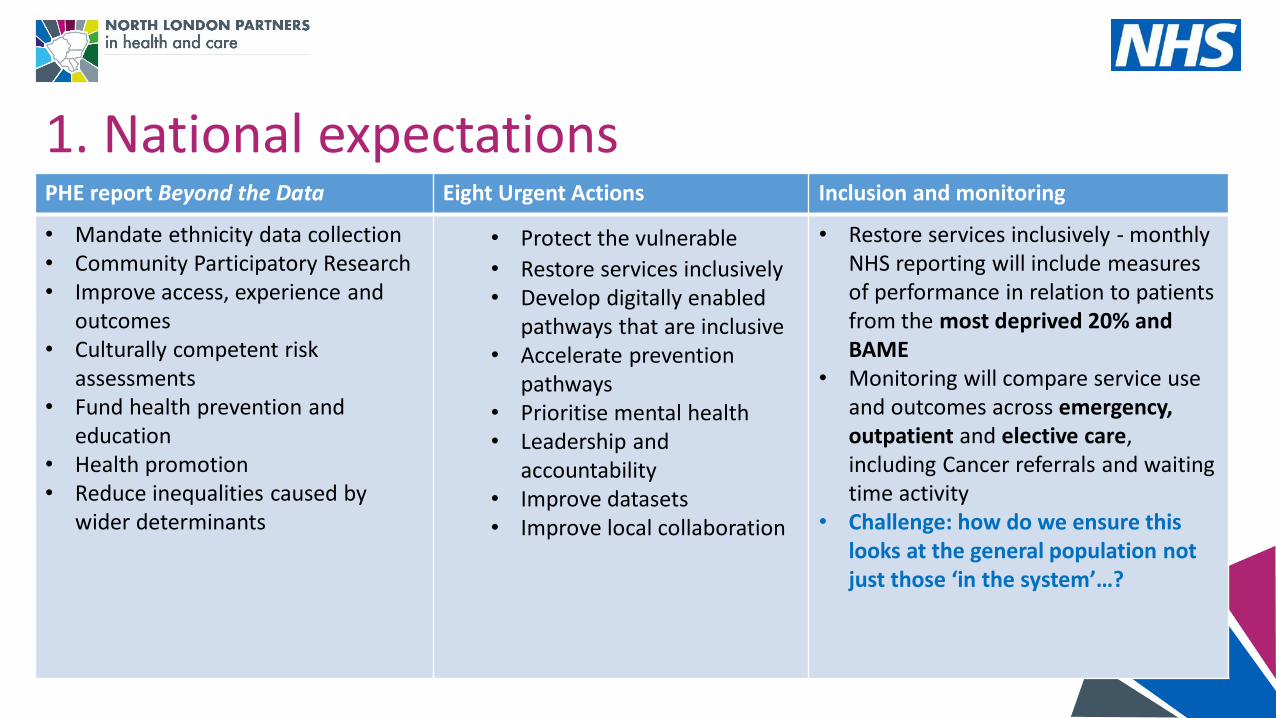
1. National expectationsPHE report Beyond the Data Eight Urgent Actions Inclusion and monitoring
• Mandate ethnicity data collection• Community Participatory Research• Improve access, experience and
outcomes• Culturally competent risk
assessments• Fund health prevention and
education• Health promotion• Reduce inequalities caused by
wider determinants
• Protect the vulnerable
• Restore services inclusively• Develop digitally enabled
pathways that are inclusive• Accelerate prevention
pathways• Prioritise mental health• Leadership and
accountability• Improve datasets• Improve local collaboration
• Restore services inclusively - monthly NHS reporting will include measures of performance in relation to patients from the most deprived 20% and BAME
• Monitoring will compare service use and outcomes across emergency, outpatient and elective care, including Cancer referrals and waiting time activity
• Challenge: how do we ensure this looks at the general population not just those ‘in the system’…?
2. NCL Clinical Commissioning Group: AimsTo ensure a continued focus across the work of the CCG we established the Communities portfolio and programme in late 2020. The team works across all Boroughs and with partners and is in place to:
➢Work with partners to operationalise NCL CCG commitment to health inequalities
➢Reduce variation in access, outcomes and experience across NCL
➢Identify the highest priority needs to address in order to achieve this – including a review of the traditional understanding of ‘need’
➢Develop projects and cases for interventions that would reduce health inequalities
➢Help shape decision making processes and funding arrangements to drive and enable a more equitable approach
➢Spread a culture where health inequalities is at the top of everyone’s agenda and an integral part of everyone’s role
➢Add value to work of Borough Partnerships by leveraging the benefits of NCL CCG and ICS working to focus areas of greatest need within each of the five Boroughs.
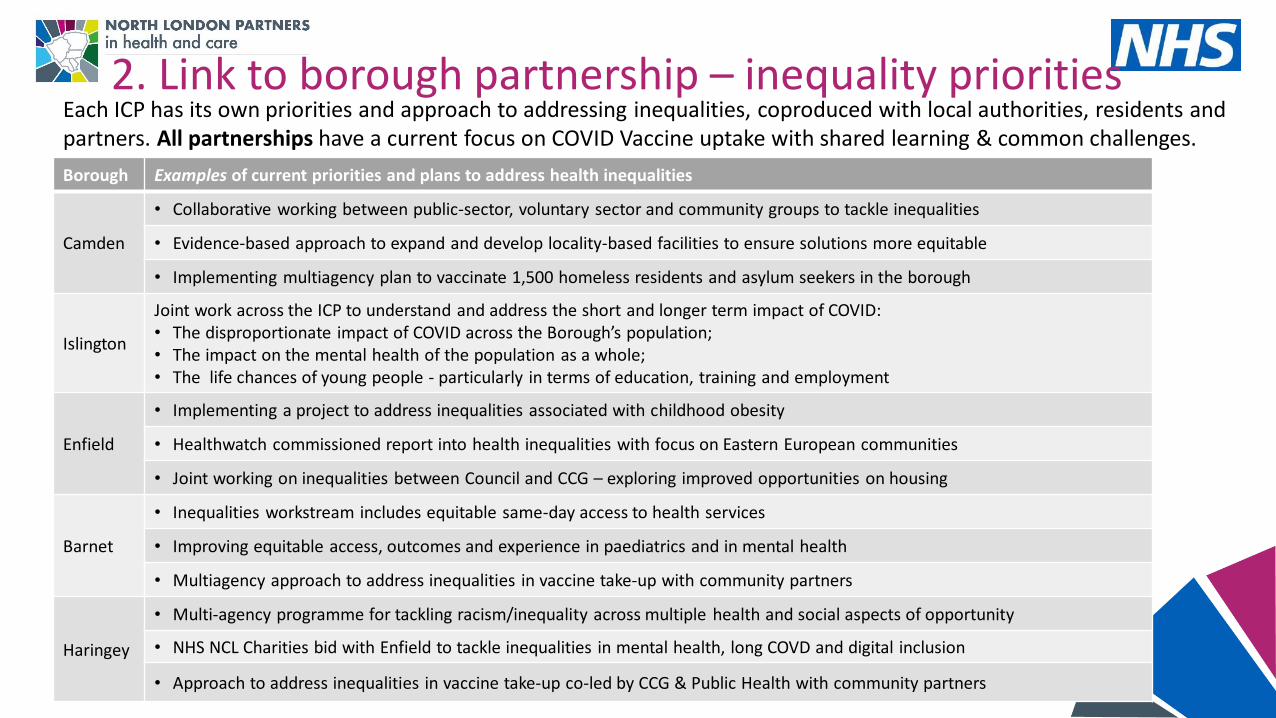
2. Link to borough partnership – inequality prioritiesEach ICP has its own priorities and approach to addressing inequalities, coproduced with local authorities, residents and partners. All partnerships have a current focus on COVID Vaccine uptake with shared learning & common challenges.
Borough Examples of current priorities and plans to address health inequalities
Camden
• Collaborative working between public-sector, voluntary sector and community groups to tackle inequalities
• Evidence-based approach to expand and develop locality-based facilities to ensure solutions more equitable
• Implementing multiagency plan to vaccinate 1,500 homeless residents and asylum seekers in the borough
Islington
Joint work across the ICP to understand and address the short and longer term impact of COVID:• The disproportionate impact of COVID across the Borough’s population;• The impact on the mental health of the population as a whole;• The life chances of young people - particularly in terms of education, training and employment
Enfield
• Implementing a project to address inequalities associated with childhood obesity
• Healthwatch commissioned report into health inequalities with focus on Eastern European communities
• Joint working on inequalities between Council and CCG – exploring improved opportunities on housing
Barnet
• Inequalities workstream includes equitable same-day access to health services
• Improving equitable access, outcomes and experience in paediatrics and in mental health
• Multiagency approach to address inequalities in vaccine take-up with community partners
Haringey
• Multi-agency programme for tackling racism/inequality across multiple health and social aspects of opportunity
• NHS NCL Charities bid with Enfield to tackle inequalities in mental health, long COVD and digital inclusion
• Approach to address inequalities in vaccine take-up co-led by CCG & Public Health with community partners
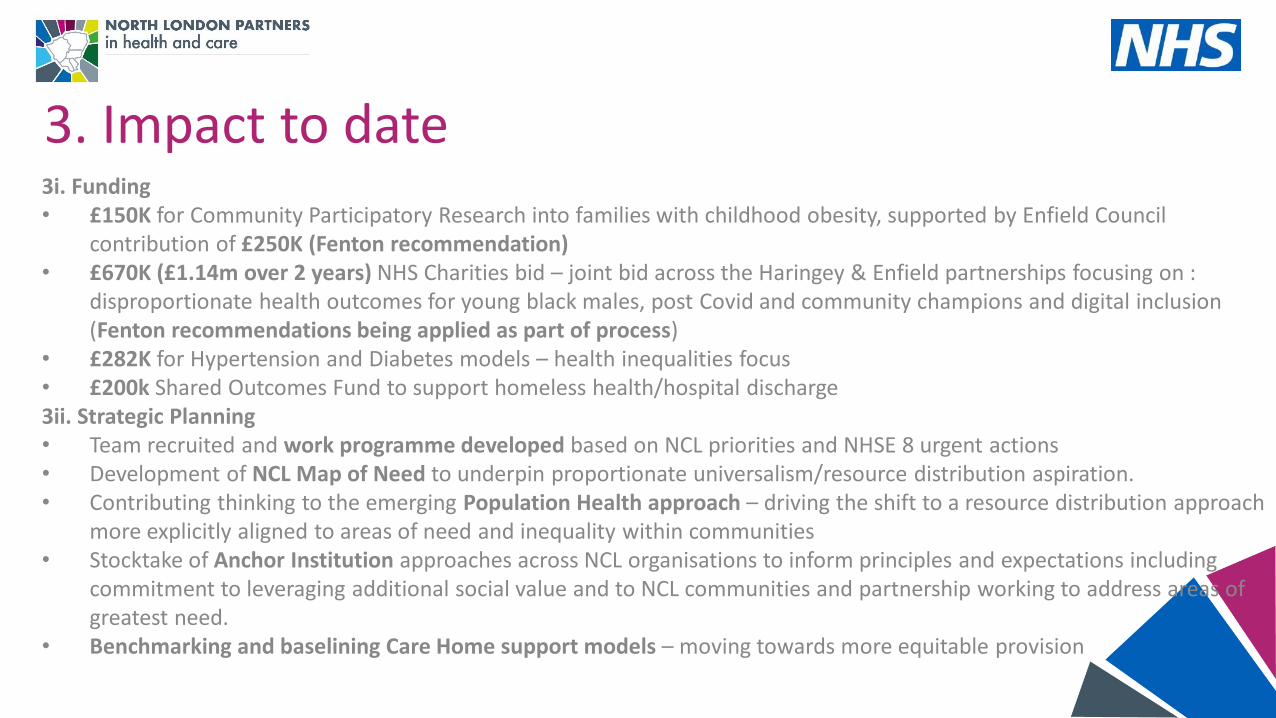
3. Impact to date3i. Funding• £150K for Community Participatory Research into families with childhood obesity, supported by Enfield Council
contribution of £250K (Fenton recommendation) • £670K (£1.14m over 2 years) NHS Charities bid – joint bid across the Haringey & Enfield partnerships focusing on :
disproportionate health outcomes for young black males, post Covid and community champions and digital inclusion (Fenton recommendations being applied as part of process)
• £282K for Hypertension and Diabetes models – health inequalities focus • £200k Shared Outcomes Fund to support homeless health/hospital discharge3ii. Strategic Planning• Team recruited and work programme developed based on NCL priorities and NHSE 8 urgent actions• Development of NCL Map of Need to underpin proportionate universalism/resource distribution aspiration.• Contributing thinking to the emerging Population Health approach – driving the shift to a resource distribution approach
more explicitly aligned to areas of need and inequality within communities • Stocktake of Anchor Institution approaches across NCL organisations to inform principles and expectations including
commitment to leveraging additional social value and to NCL communities and partnership working to address areas of greatest need.
• Benchmarking and baselining Care Home support models – moving towards more equitable provision
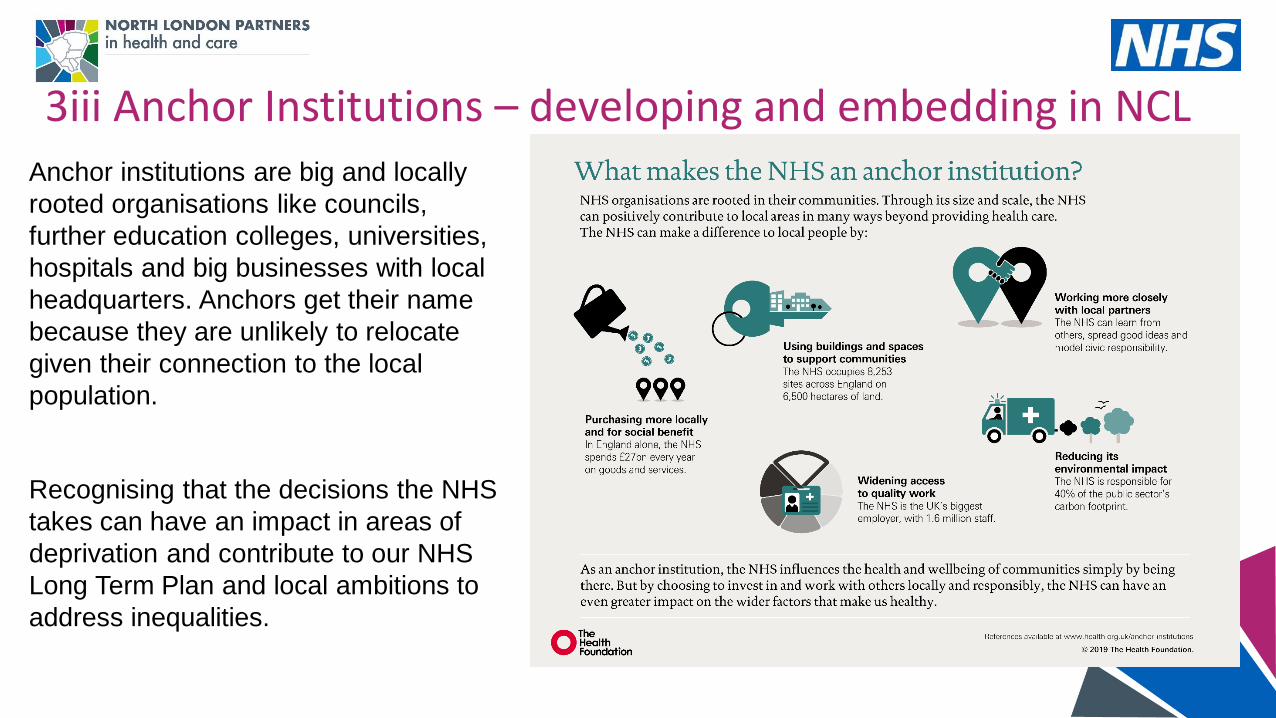
3iii Anchor Institutions – developing and embedding in NCL
Recognising that the decisions the NHS
takes can have an impact in areas of
deprivation and contribute to our NHS
Long Term Plan and local ambitions to
address inequalities.
Anchor institutions are big and locally
rooted organisations like councils,
further education colleges, universities,
hospitals and big businesses with local
headquarters. Anchors get their name
because they are unlikely to relocate
given their connection to the local
population.
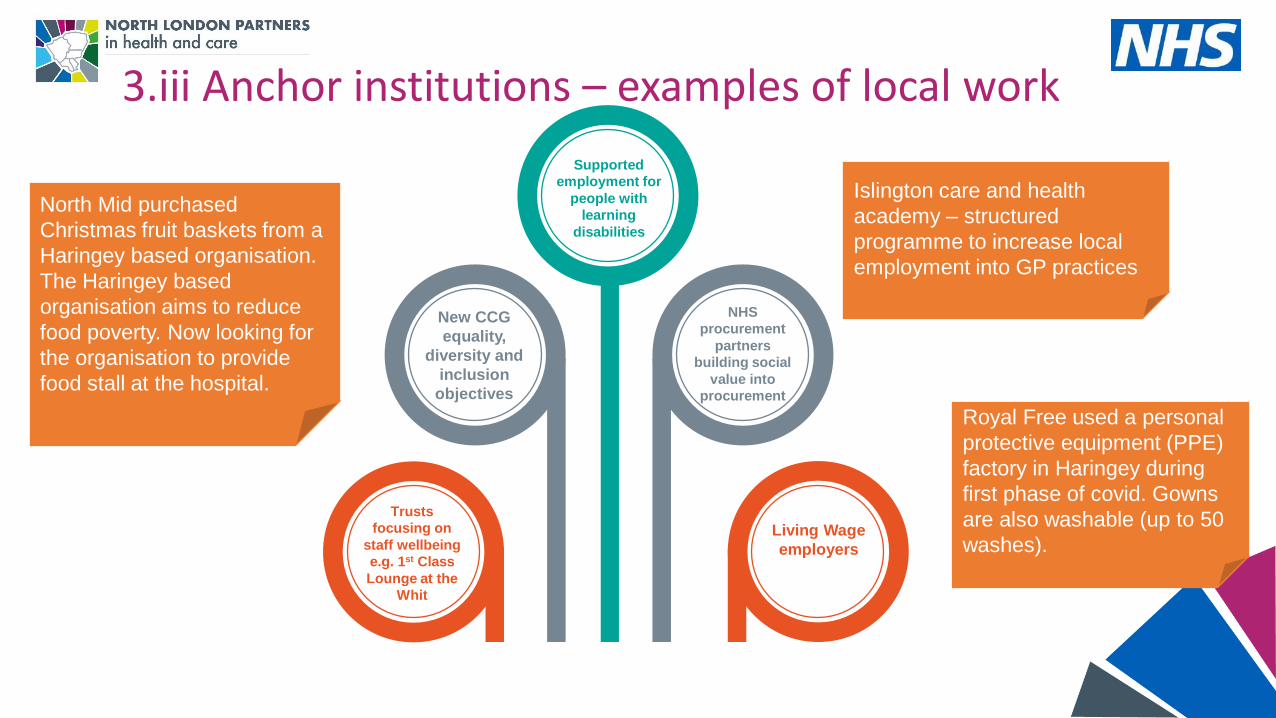
3.iii Anchor institutions – examples of local work
Royal Free used a personal
protective equipment (PPE)
factory in Haringey during
first phase of covid. Gowns
are also washable (up to 50
washes).
North Mid purchased
Christmas fruit baskets from a
Haringey based organisation.
The Haringey based
organisation aims to reduce
food poverty. Now looking for
the organisation to provide
food stall at the hospital.
New CCG
equality,
diversity and
inclusion
objectives
Supported
employment for
people with
learning
disabilities
NHS
procurement
partners
building social
value into
procurement
Living Wage
employers
Trusts
focusing on
staff wellbeing
e.g. 1st Class
Lounge at the
Whit
Islington care and health
academy – structured
programme to increase local
employment into GP practices
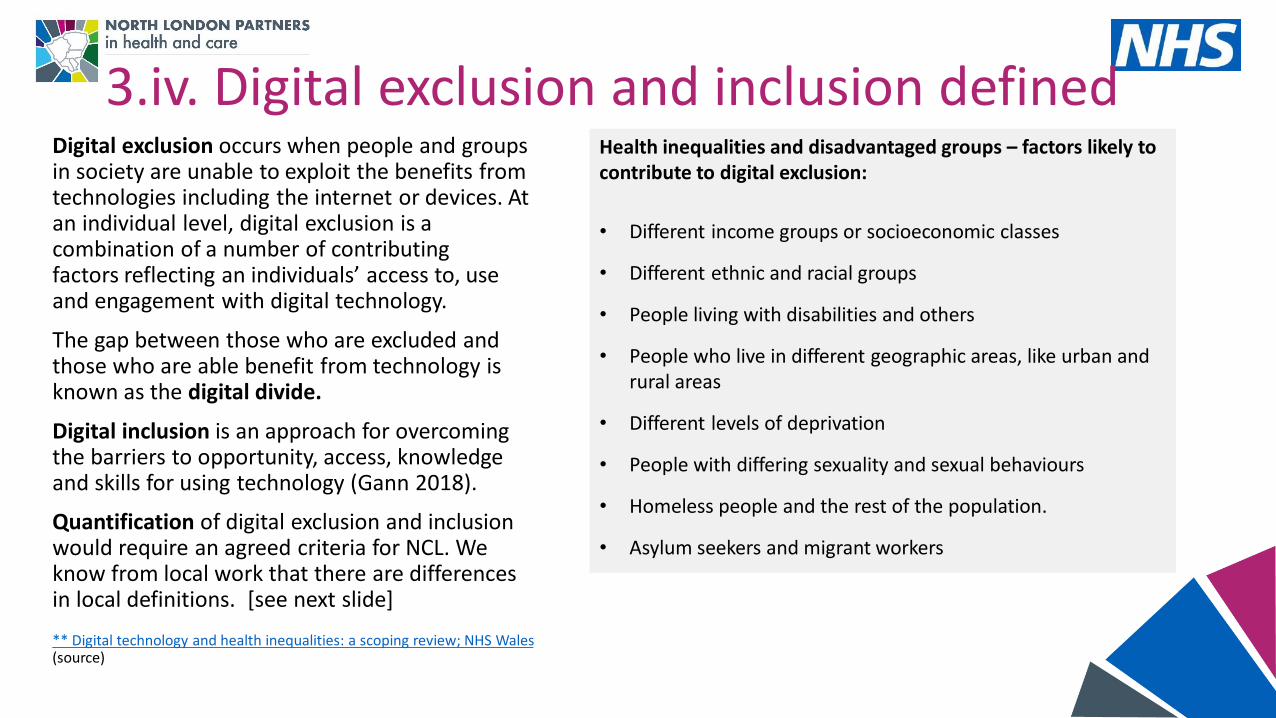
3.iv. Digital exclusion and inclusion defined
** Digital technology and health inequalities: a scoping review; NHS Wales(source)
Digital exclusion occurs when people and groups in society are unable to exploit the benefits from technologies including the internet or devices. At an individual level, digital exclusion is a combination of a number of contributing factors reflecting an individuals’ access to, use and engagement with digital technology.
The gap between those who are excluded and those who are able benefit from technology is known as the digital divide.
Digital inclusion is an approach for overcoming the barriers to opportunity, access, knowledge and skills for using technology (Gann 2018).
Quantification of digital exclusion and inclusion would require an agreed criteria for NCL. We know from local work that there are differences in local definitions. [see next slide]
Health inequalities and disadvantaged groups – factors likely to contribute to digital exclusion:
• Different income groups or socioeconomic classes
• Different ethnic and racial groups
• People living with disabilities and others
• People who live in different geographic areas, like urban and rural areas
• Different levels of deprivation
• People with differing sexuality and sexual behaviours
• Homeless people and the rest of the population.
• Asylum seekers and migrant workers
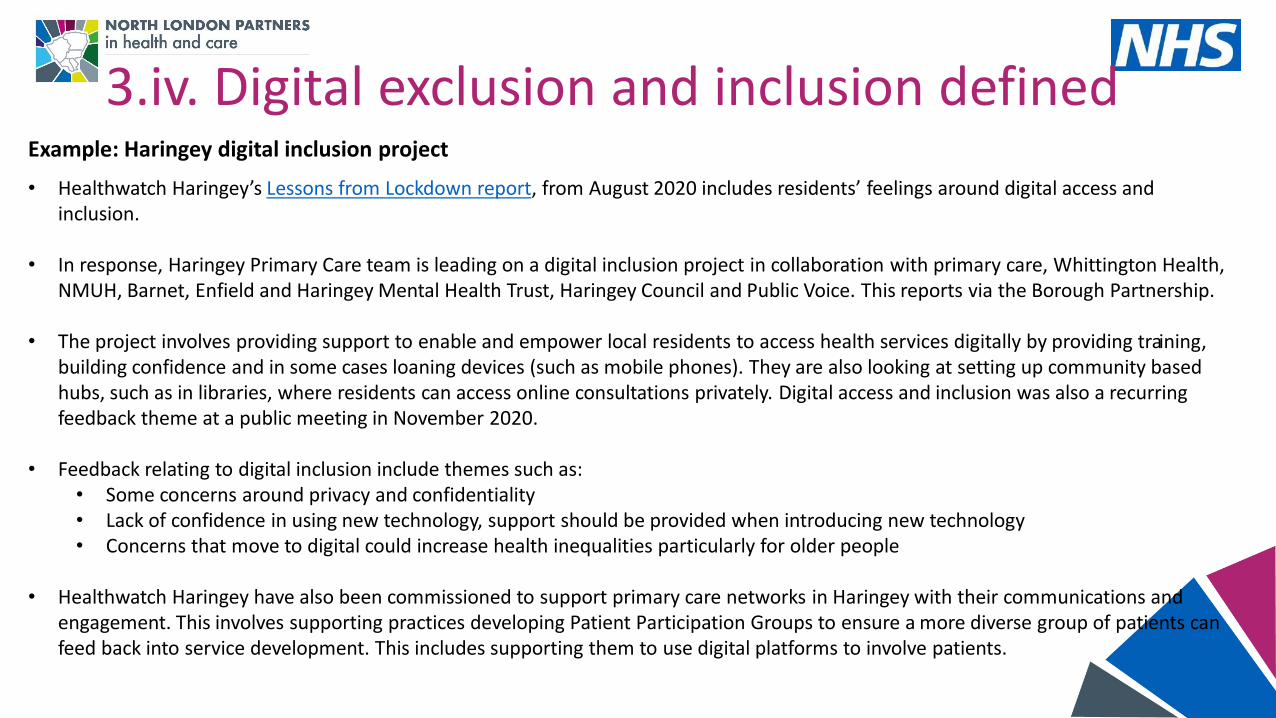
3.iv. Digital exclusion and inclusion defined Example: Haringey digital inclusion project
• Healthwatch Haringey’s Lessons from Lockdown report, from August 2020 includes residents’ feelings around digital access and inclusion.
• In response, Haringey Primary Care team is leading on a digital inclusion project in collaboration with primary care, Whittington Health, NMUH, Barnet, Enfield and Haringey Mental Health Trust, Haringey Council and Public Voice. This reports via the Borough Partnership.
• The project involves providing support to enable and empower local residents to access health services digitally by providing training, building confidence and in some cases loaning devices (such as mobile phones). They are also looking at setting up community based hubs, such as in libraries, where residents can access online consultations privately. Digital access and inclusion was also a recurring feedback theme at a public meeting in November 2020.
• Feedback relating to digital inclusion include themes such as:• Some concerns around privacy and confidentiality • Lack of confidence in using new technology, support should be provided when introducing new technology • Concerns that move to digital could increase health inequalities particularly for older people
• Healthwatch Haringey have also been commissioned to support primary care networks in Haringey with their communications and engagement. This involves supporting practices developing Patient Participation Groups to ensure a more diverse group of patients can feed back into service development. This includes supporting them to use digital platforms to involve patients.
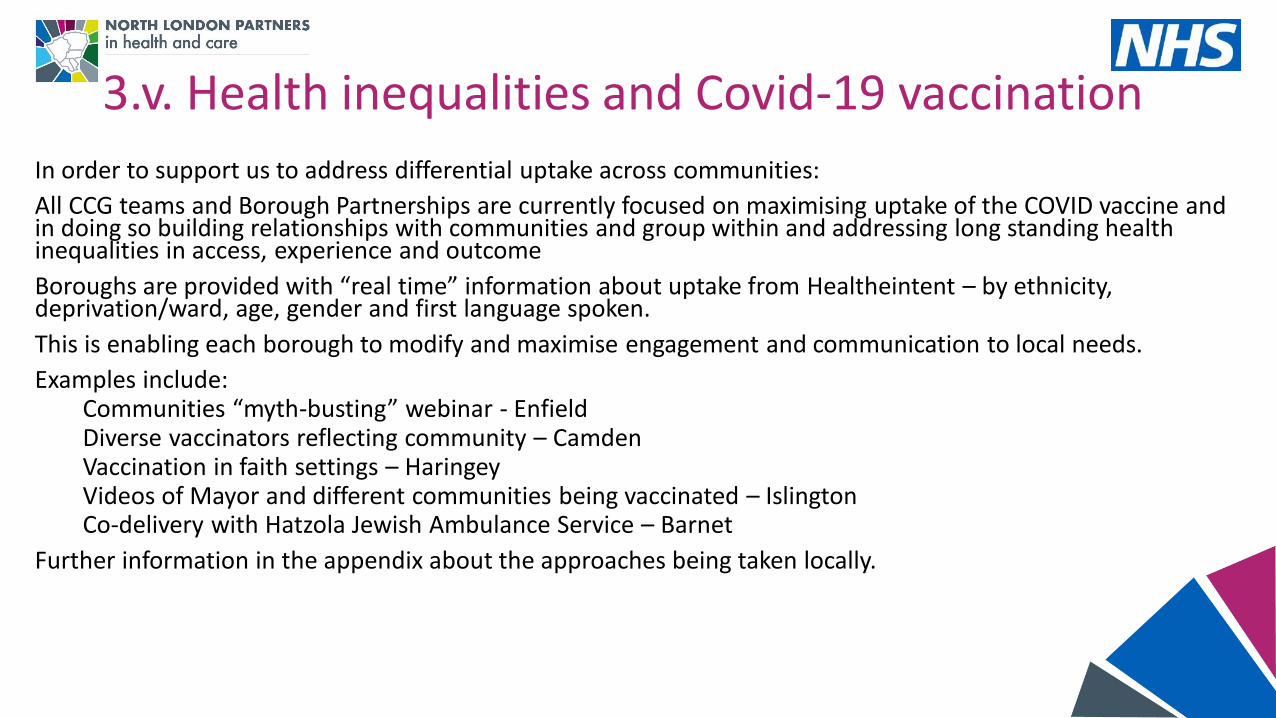
3.v. Health inequalities and Covid-19 vaccination
In order to support us to address differential uptake across communities:
All CCG teams and Borough Partnerships are currently focused on maximising uptake of the COVID vaccine and in doing so building relationships with communities and group within and addressing long standing health inequalities in access, experience and outcome
Boroughs are provided with “real time” information about uptake from Healtheintent – by ethnicity, deprivation/ward, age, gender and first language spoken.
This is enabling each borough to modify and maximise engagement and communication to local needs.
Examples include:Communities “myth-busting” webinar - EnfieldDiverse vaccinators reflecting community – CamdenVaccination in faith settings – HaringeyVideos of Mayor and different communities being vaccinated – IslingtonCo-delivery with Hatzola Jewish Ambulance Service – Barnet
Further information in the appendix about the approaches being taken locally.
3.v. Health inequalities and Covid-19 vaccination To support us to address inclusion health we are:
Working with Borough leads, primary care, public health and UCLH Find and Treat to develop programme to ensure vaccination uptake from underserved populations including people experiencing homelessness, asylum seekers, and traveller communities.
Links to wider focus on the health of these populations and is informing pan-London work/offer.
Key element is preparing people and accommodation providers to support programme –including provision of vaccination to front line staff.
This includes peer developed leaflets, webinars led by clinical lead and pre-visits.
We are working with peer and lived experience groups to inform engagement approaches.
Data is being collected to monitor uptake which will be reviewed ongoing through the NCL Vaccine Board. This will continue to inform planning and development of programme.
Considering innovative approaches to certain population groups – eg Vaxi Taxi and Doctors of the World.
Key link to wider health inequalities and support beyond covid vaccination.
3.v. Supporting vaccination for people with Learning disabilities and autism spectrum disorder
24th Feb JCVI amended the criteria for Priority Group 6 to include all adults with LD, including those with ‘mild to moderate’ needs. Carers are also to be prioritised as part of priority 6. In addition to this, NCL CCG has taken the decision to also provide access to the vaccine for people with Autism, aged 16+. In NCL we have also taken the following actions:
Identifying eligible individuals by cross-referencing LD team service user lists with GP registration dataIdentifying most vulnerable/high needs individuals known to services, particularly those who are known to struggle with vaccinations as learned through the flu vaccinationProviding easy read information and advice about the vaccine Identifying those who may not have capacity to make a decision about the vaccineDeveloping processes to support people w/LD who are needle-phobic. Needle desensitisation work will need to be delivered in advance for this group. Developing advice for marshals/ volunteers at vaccination centres - for recognising hidden disabilities (Barnet)Identifying opportunities to provide reasonable adjustments that support vaccine delivery, e.g. Enfield have reached agreement with BEH to use a space within Chase Farm hospital as a LD vaccination hub, which supports adjustments such as longer appointment times and sensory needs (e.g. quiet space). Clinical staff within local teams are receiving vaccine training, enabling them to support PCNs with delivering vaccines to people with LD, utilising their expertise of working with this cohort, and being able to adjust their approach so care is personalised. In many cases, locally trained LD colleagues will also know the individual being vaccinated, and this will provide further reassurance to individuals. In Islington, support is also being provided to residents to book vaccine appointments and arrange transport.Liaising with carers groups to share vaccine information, run Q&A sessions and encouraging carers to register their caring status with their GP, to ensure they are included within priority group 6.
4. Next steps• Health inequalities will widen and the cost to the system will increase if we don’t
intervene to support improved outcomes and reduce variation so we need a disproportionate focus on areas of highest need
• We are looking at ways of working and opportunities to apply data and insight to identify need and address it (population health) via local and system-wide interventions e.g. building relationships with communities; developing our insights; scoping a system investment fund for health inequalities
5. Appendices
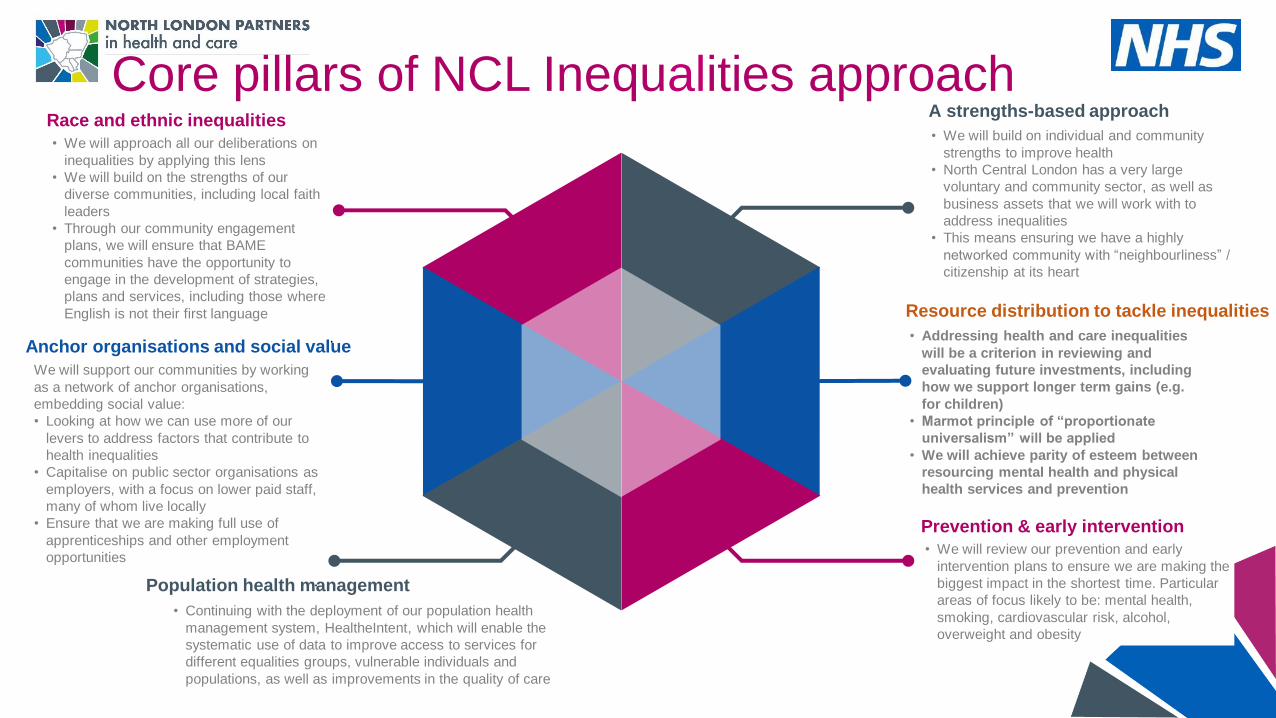
Core pillars of NCL Inequalities approach • We will build on individual and community
strengths to improve health
• North Central London has a very large
voluntary and community sector, as well as
business assets that we will work with to
address inequalities
• This means ensuring we have a highly
networked community with “neighbourliness” /
citizenship at its heart
A strengths-based approach
• Addressing health and care inequalities
will be a criterion in reviewing and
evaluating future investments, including
how we support longer term gains (e.g.
for children)
• Marmot principle of “proportionate
universalism” will be applied
• We will achieve parity of esteem between
resourcing mental health and physical
health services and prevention
Resource distribution to tackle inequalities
• We will review our prevention and early
intervention plans to ensure we are making the
biggest impact in the shortest time. Particular
areas of focus likely to be: mental health,
smoking, cardiovascular risk, alcohol,
overweight and obesity
Prevention & early intervention
• We will approach all our deliberations on
inequalities by applying this lens
• We will build on the strengths of our
diverse communities, including local faith
leaders
• Through our community engagement
plans, we will ensure that BAME
communities have the opportunity to
engage in the development of strategies,
plans and services, including those where
English is not their first language
.
Race and ethnic inequalities
We will support our communities by working
as a network of anchor organisations,
embedding social value:
• Looking at how we can use more of our
levers to address factors that contribute to
health inequalities
• Capitalise on public sector organisations as
employers, with a focus on lower paid staff,
many of whom live locally
• Ensure that we are making full use of
apprenticeships and other employment
opportunities
.
Anchor organisations and social value
• Continuing with the deployment of our population health
management system, HealtheIntent, which will enable the
systematic use of data to improve access to services for
different equalities groups, vulnerable individuals and
populations, as well as improvements in the quality of care
Population health management
Maps of need across NCL
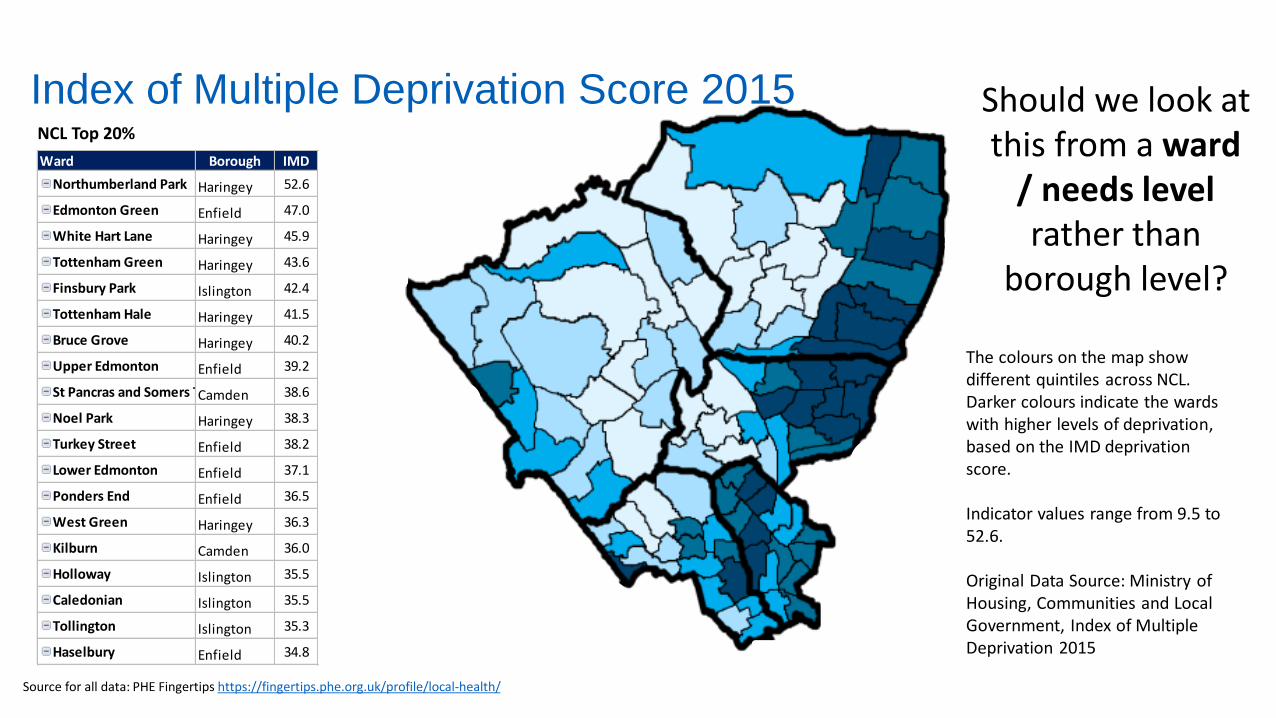
Ward Borough IMD
Northumberland Park Haringey 52.6
Edmonton Green Enfield 47.0
White Hart Lane Haringey 45.9
Tottenham Green Haringey 43.6
Finsbury Park Islington 42.4
Tottenham Hale Haringey 41.5
Bruce Grove Haringey 40.2
Upper Edmonton Enfield 39.2
St Pancras and Somers TownCamden 38.6
Noel Park Haringey 38.3
Turkey Street Enfield 38.2
Lower Edmonton Enfield 37.1
Ponders End Enfield 36.5
West Green Haringey 36.3
Kilburn Camden 36.0
Holloway Islington 35.5
Caledonian Islington 35.5
Tollington Islington 35.3
Haselbury Enfield 34.8
NCL Top 20%
The colours on the map show different quintiles across NCL. Darker colours indicate the wards with higher levels of deprivation, based on the IMD deprivation score.
Indicator values range from 9.5 to 52.6.
Original Data Source: Ministry of Housing, Communities and Local Government, Index of Multiple Deprivation 2015
Source for all data: PHE Fingertips https://fingertips.phe.org.uk/profile/local-health/
Index of Multiple Deprivation Score 2015 Should we look at this from a ward
/ needs level rather than
borough level?
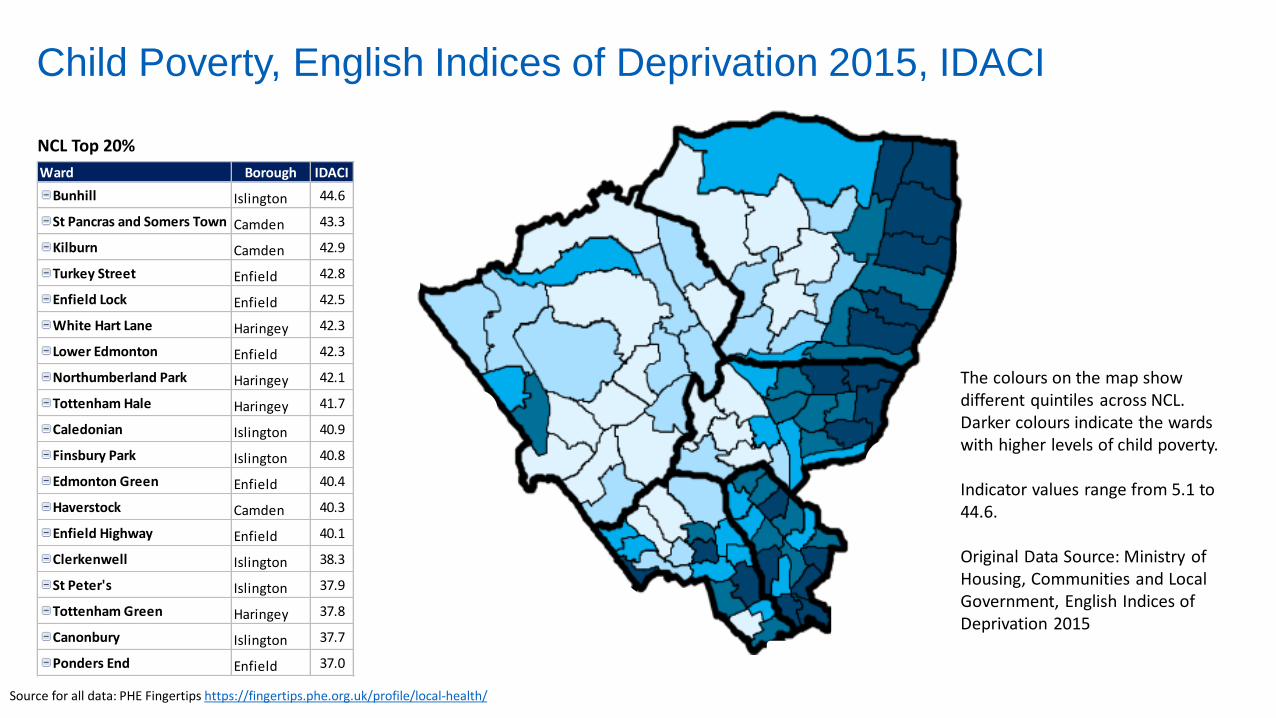
Child Poverty, English Indices of Deprivation 2015, IDACI
Ward Borough IDACI
Bunhill Islington 44.6
St Pancras and Somers Town Camden 43.3
Kilburn Camden 42.9
Turkey Street Enfield 42.8
Enfield Lock Enfield 42.5
White Hart Lane Haringey 42.3
Lower Edmonton Enfield 42.3
Northumberland Park Haringey 42.1
Tottenham Hale Haringey 41.7
Caledonian Islington 40.9
Finsbury Park Islington 40.8
Edmonton Green Enfield 40.4
Haverstock Camden 40.3
Enfield Highway Enfield 40.1
Clerkenwell Islington 38.3
St Peter's Islington 37.9
Tottenham Green Haringey 37.8
Canonbury Islington 37.7
Ponders End Enfield 37.0
NCL Top 20%
The colours on the map show different quintiles across NCL. Darker colours indicate the wards with higher levels of child poverty.
Indicator values range from 5.1 to 44.6.
Original Data Source: Ministry of Housing, Communities and Local Government, English Indices of Deprivation 2015
Source for all data: PHE Fingertips https://fingertips.phe.org.uk/profile/local-health/
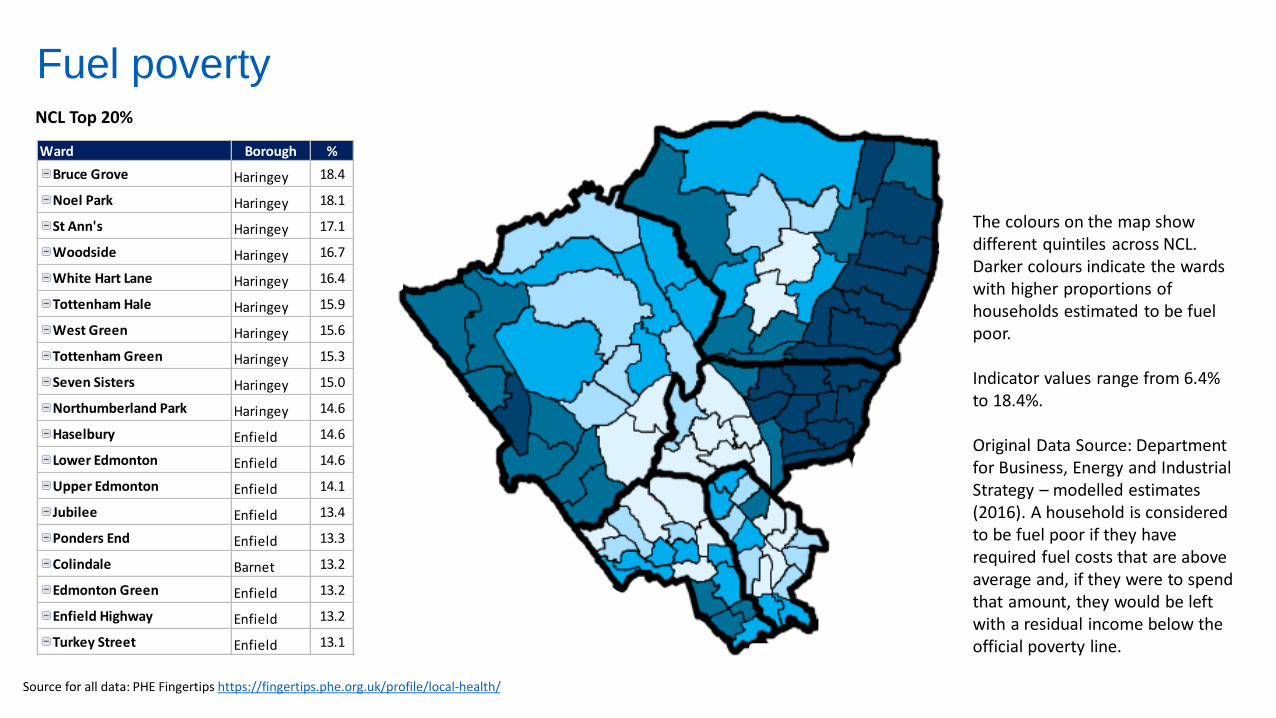
Fuel poverty
Ward Borough %
Bruce Grove Haringey 18.4
Noel Park Haringey 18.1
St Ann's Haringey 17.1
Woodside Haringey 16.7
White Hart Lane Haringey 16.4
Tottenham Hale Haringey 15.9
West Green Haringey 15.6
Tottenham Green Haringey 15.3
Seven Sisters Haringey 15.0
Northumberland Park Haringey 14.6
Haselbury Enfield 14.6
Lower Edmonton Enfield 14.6
Upper Edmonton Enfield 14.1
Jubilee Enfield 13.4
Ponders End Enfield 13.3
Colindale Barnet 13.2
Edmonton Green Enfield 13.2
Enfield Highway Enfield 13.2
Turkey Street Enfield 13.1
NCL Top 20%
The colours on the map show different quintiles across NCL. Darker colours indicate the wards with higher proportions of households estimated to be fuel poor.
Indicator values range from 6.4% to 18.4%.
Original Data Source: Department for Business, Energy and Industrial Strategy – modelled estimates (2016). A household is considered to be fuel poor if they have required fuel costs that are above average and, if they were to spend that amount, they would be left with a residual income below the official poverty line.
Source for all data: PHE Fingertips https://fingertips.phe.org.uk/profile/local-health/
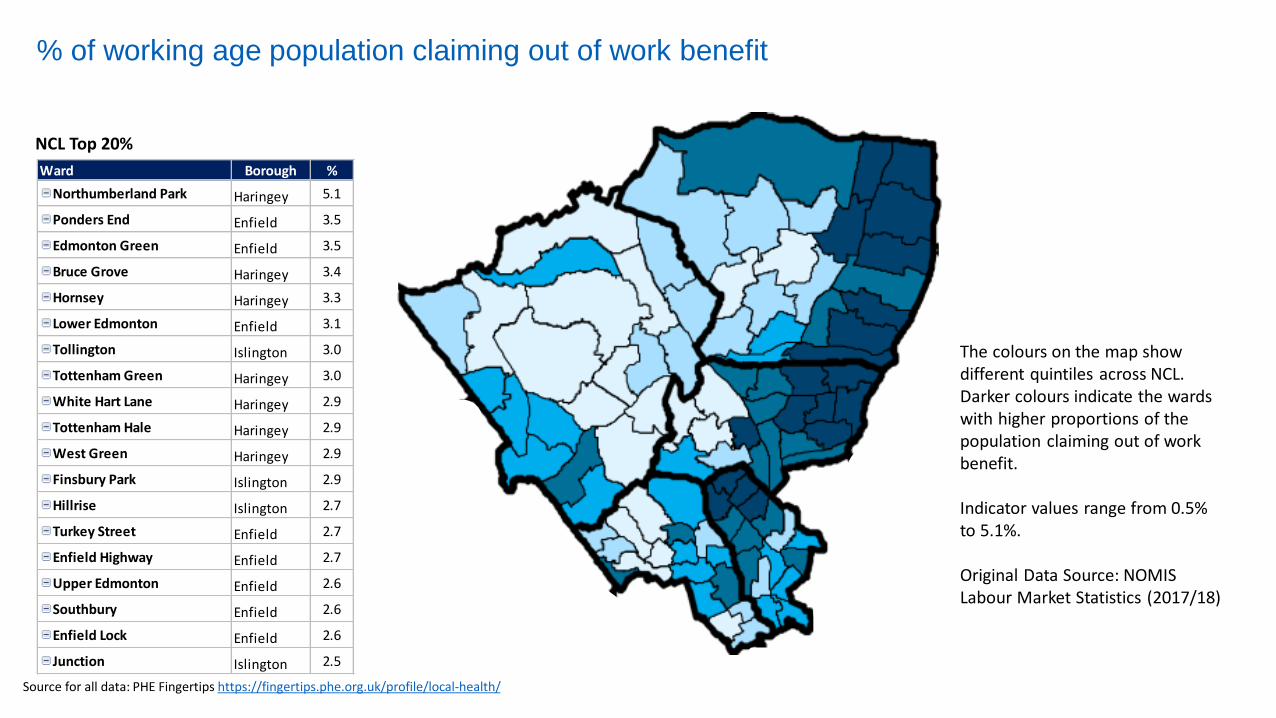
% of working age population claiming out of work benefit
Ward Borough %
Northumberland Park Haringey 5.1
Ponders End Enfield 3.5
Edmonton Green Enfield 3.5
Bruce Grove Haringey 3.4
Hornsey Haringey 3.3
Lower Edmonton Enfield 3.1
Tollington Islington 3.0
Tottenham Green Haringey 3.0
White Hart Lane Haringey 2.9
Tottenham Hale Haringey 2.9
West Green Haringey 2.9
Finsbury Park Islington 2.9
Hillrise Islington 2.7
Turkey Street Enfield 2.7
Enfield Highway Enfield 2.7
Upper Edmonton Enfield 2.6
Southbury Enfield 2.6
Enfield Lock Enfield 2.6
Junction Islington 2.5
NCL Top 20%
The colours on the map show different quintiles across NCL. Darker colours indicate the wards with higher proportions of the population claiming out of work benefit.
Indicator values range from 0.5% to 5.1%.
Original Data Source: NOMIS Labour Market Statistics (2017/18)
Source for all data: PHE Fingertips https://fingertips.phe.org.uk/profile/local-health/
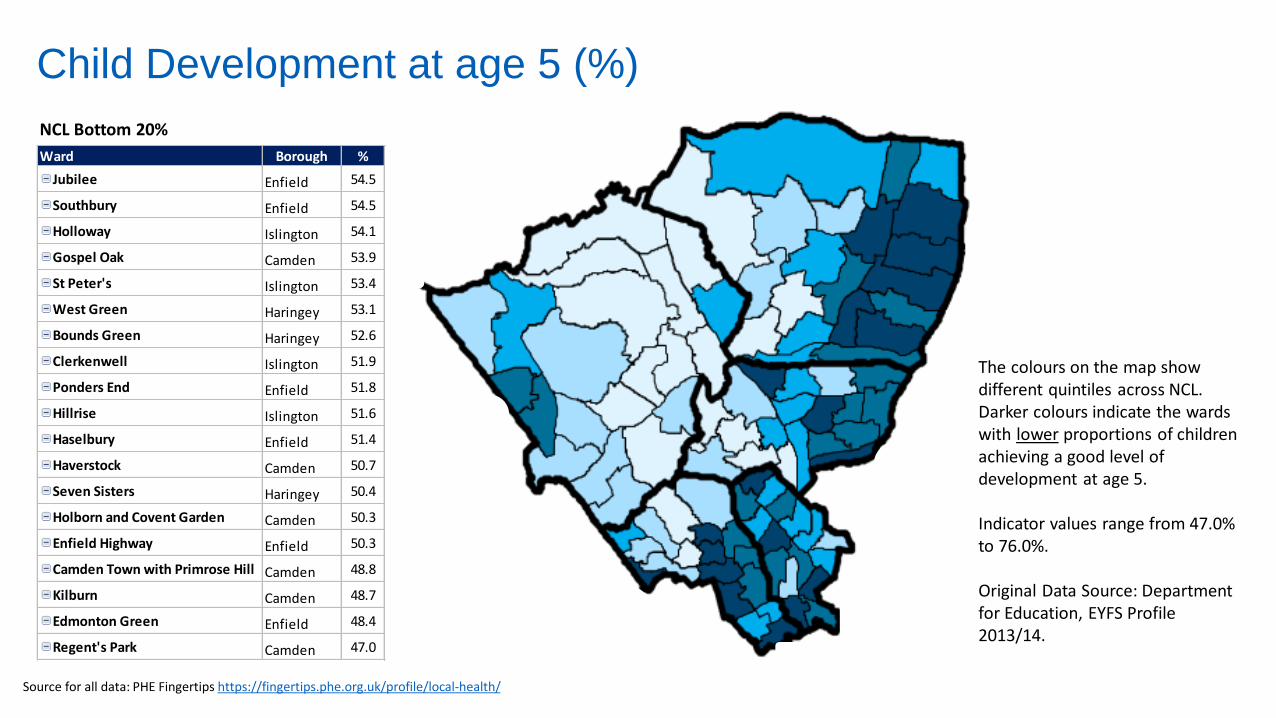
Child Development at age 5 (%)
Ward Borough %
Jubilee Enfield 54.5
Southbury Enfield 54.5
Holloway Islington 54.1
Gospel Oak Camden 53.9
St Peter's Islington 53.4
West Green Haringey 53.1
Bounds Green Haringey 52.6
Clerkenwell Islington 51.9
Ponders End Enfield 51.8
Hillrise Islington 51.6
Haselbury Enfield 51.4
Haverstock Camden 50.7
Seven Sisters Haringey 50.4
Holborn and Covent Garden Camden 50.3
Enfield Highway Enfield 50.3
Camden Town with Primrose Hill Camden 48.8
Kilburn Camden 48.7
Edmonton Green Enfield 48.4
Regent's Park Camden 47.0
NCL Bottom 20%
The colours on the map show different quintiles across NCL. Darker colours indicate the wards with lower proportions of children achieving a good level of development at age 5.
Indicator values range from 47.0% to 76.0%.
Original Data Source: Department for Education, EYFS Profile 2013/14.
Source for all data: PHE Fingertips https://fingertips.phe.org.uk/profile/local-health/
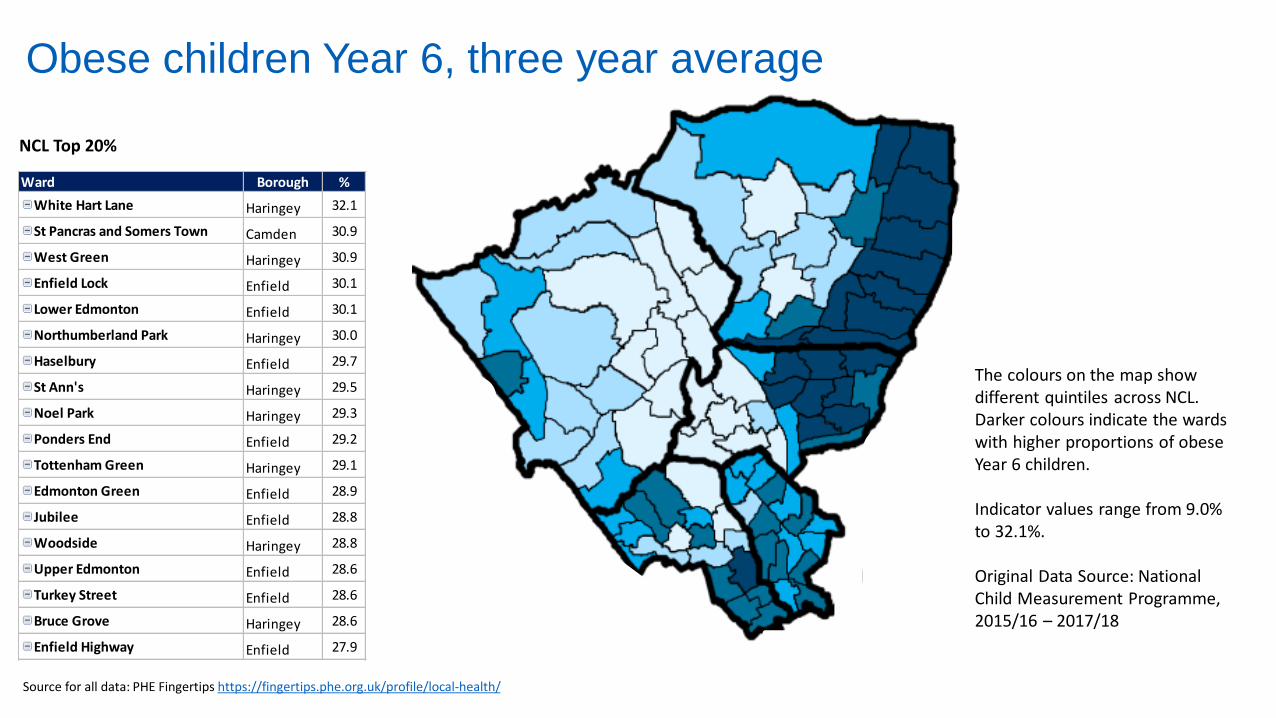
Obese children Year 6, three year average
Ward Borough %
White Hart Lane Haringey 32.1
St Pancras and Somers Town Camden 30.9
West Green Haringey 30.9
Enfield Lock Enfield 30.1
Lower Edmonton Enfield 30.1
Northumberland Park Haringey 30.0
Haselbury Enfield 29.7
St Ann's Haringey 29.5
Noel Park Haringey 29.3
Ponders End Enfield 29.2
Tottenham Green Haringey 29.1
Edmonton Green Enfield 28.9
Jubilee Enfield 28.8
Woodside Haringey 28.8
Upper Edmonton Enfield 28.6
Turkey Street Enfield 28.6
Bruce Grove Haringey 28.6
Enfield Highway Enfield 27.9
NCL Top 20%
The colours on the map show different quintiles across NCL. Darker colours indicate the wards with higher proportions of obese Year 6 children.
Indicator values range from 9.0% to 32.1%.
Original Data Source: National Child Measurement Programme, 2015/16 – 2017/18
Source for all data: PHE Fingertips https://fingertips.phe.org.uk/profile/local-health/
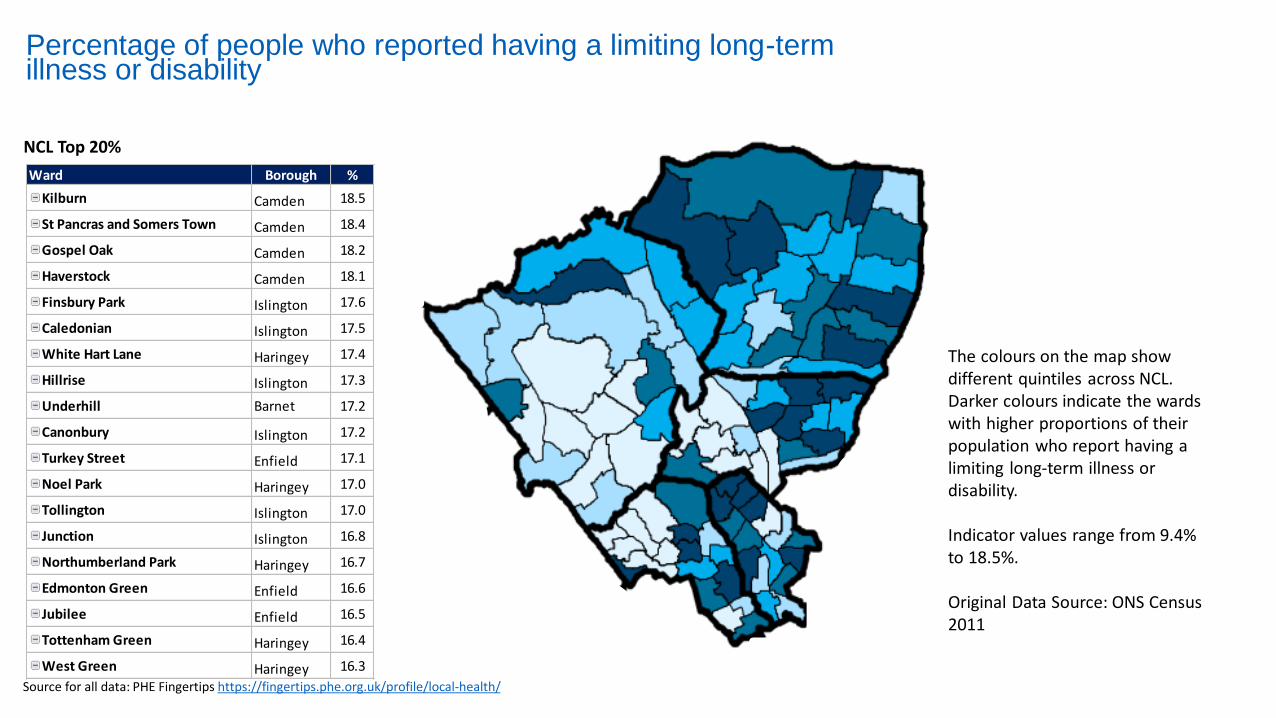
Percentage of people who reported having a limiting long-term illness or disability
Ward Borough %
Kilburn Camden 18.5
St Pancras and Somers Town Camden 18.4
Gospel Oak Camden 18.2
Haverstock Camden 18.1
Finsbury Park Islington 17.6
Caledonian Islington 17.5
White Hart Lane Haringey 17.4
Hillrise Islington 17.3
Underhill Barnet 17.2
Canonbury Islington 17.2
Turkey Street Enfield 17.1
Noel Park Haringey 17.0
Tollington Islington 17.0
Junction Islington 16.8
Northumberland Park Haringey 16.7
Edmonton Green Enfield 16.6
Jubilee Enfield 16.5
Tottenham Green Haringey 16.4
West Green Haringey 16.3
NCL Top 20%
The colours on the map show different quintiles across NCL. Darker colours indicate the wards with higher proportions of their population who report having a limiting long-term illness or disability.
Indicator values range from 9.4% to 18.5%.
Original Data Source: ONS Census 2011
Source for all data: PHE Fingertips https://fingertips.phe.org.uk/profile/local-health/
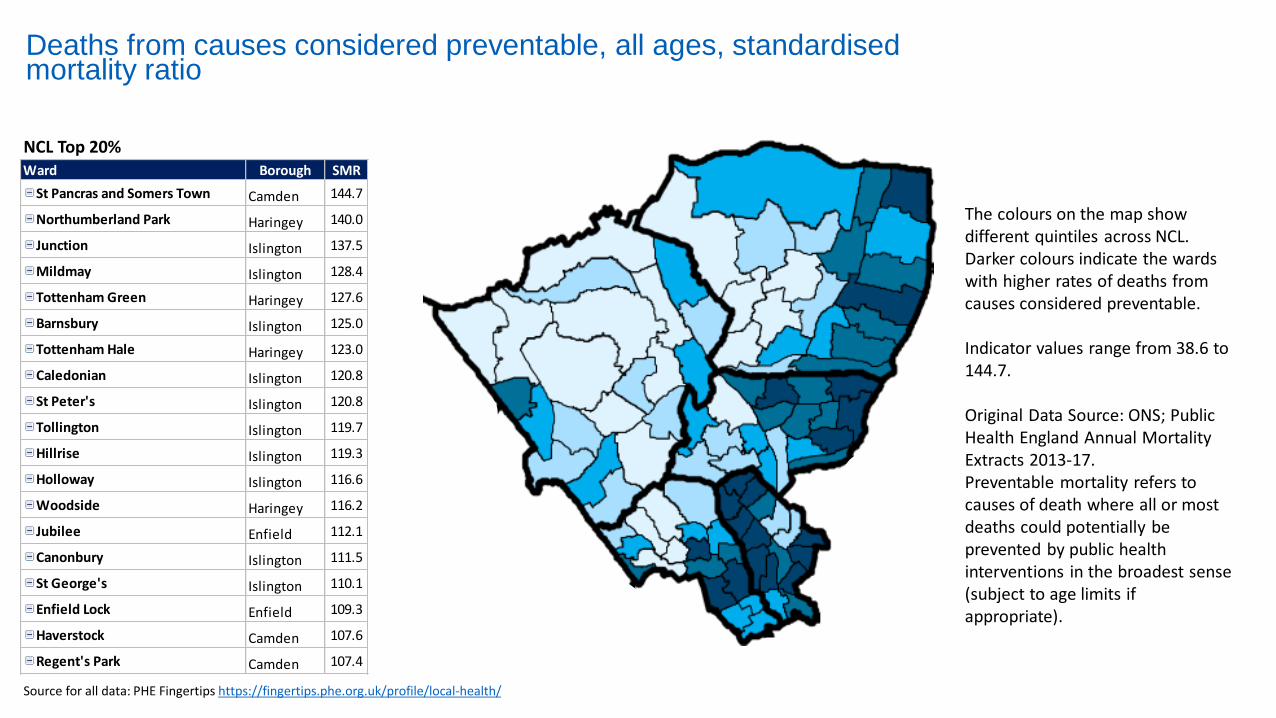
Deaths from causes considered preventable, all ages, standardised mortality ratio
NCL Top 20%Ward Borough SMR
St Pancras and Somers Town Camden 144.7
Northumberland Park Haringey 140.0
Junction Islington 137.5
Mildmay Islington 128.4
Tottenham Green Haringey 127.6
Barnsbury Islington 125.0
Tottenham Hale Haringey 123.0
Caledonian Islington 120.8
St Peter's Islington 120.8
Tollington Islington 119.7
Hillrise Islington 119.3
Holloway Islington 116.6
Woodside Haringey 116.2
Jubilee Enfield 112.1
Canonbury Islington 111.5
St George's Islington 110.1
Enfield Lock Enfield 109.3
Haverstock Camden 107.6
Regent's Park Camden 107.4
The colours on the map show different quintiles across NCL. Darker colours indicate the wards with higher rates of deaths from causes considered preventable.
Indicator values range from 38.6 to 144.7.
Original Data Source: ONS; Public Health England Annual Mortality Extracts 2013-17.Preventable mortality refers to causes of death where all or most deaths could potentially be prevented by public health interventions in the broadest sense (subject to age limits if appropriate).
Source for all data: PHE Fingertips https://fingertips.phe.org.uk/profile/local-health/
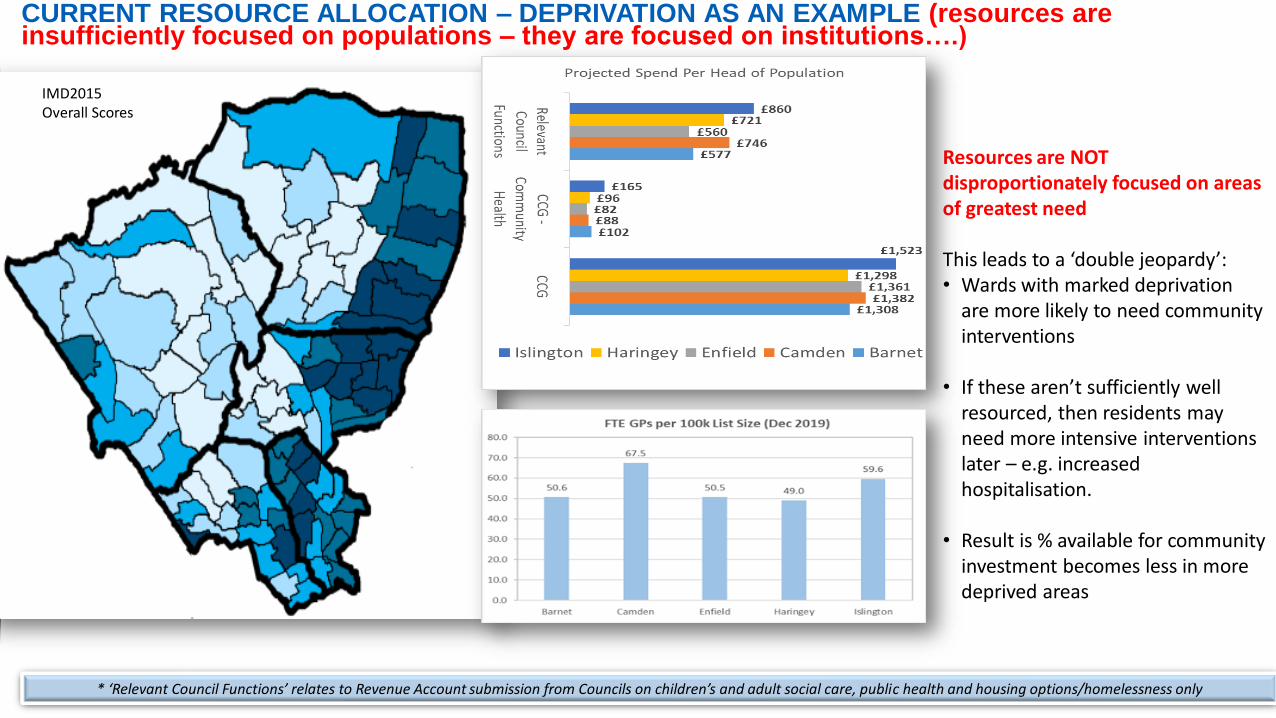
CURRENT RESOURCE ALLOCATION – DEPRIVATION AS AN EXAMPLE (resources are insufficiently focused on populations – they are focused on institutions….)
* ‘Relevant Council Functions’ relates to Revenue Account submission from Councils on children’s and adult social care, public health and housing options/homelessness only
Resources are NOT disproportionately focused on areas of greatest need
This leads to a ‘double jeopardy’:• Wards with marked deprivation
are more likely to need community interventions
• If these aren’t sufficiently well resourced, then residents may need more intensive interventions later – e.g. increased hospitalisation.
• Result is % available for community investment becomes less in more deprived areas
IMD2015 Overall Scores
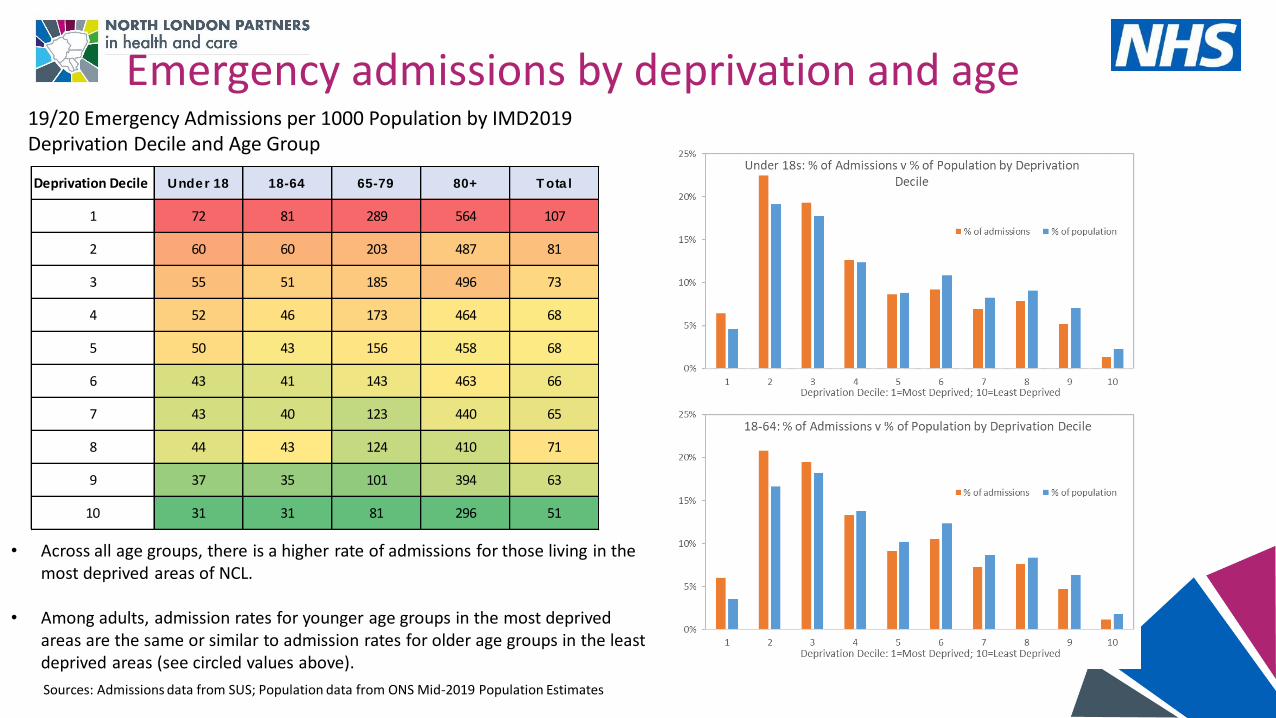
Emergency admissions by deprivation and age
Deprivation Decile Under 18 18-64 65-79 80+ T ota l
1 72 81 289 564 107
2 60 60 203 487 81
3 55 51 185 496 73
4 52 46 173 464 68
5 50 43 156 458 68
6 43 41 143 463 66
7 43 40 123 440 65
8 44 43 124 410 71
9 37 35 101 394 63
10 31 31 81 296 51
19/20 Emergency Admissions per 1000 Population by IMD2019 Deprivation Decile and Age Group
• Across all age groups, there is a higher rate of admissions for those living in the most deprived areas of NCL.
• Among adults, admission rates for younger age groups in the most deprived areas are the same or similar to admission rates for older age groups in the least deprived areas (see circled values above).
Sources: Admissions data from SUS; Population data from ONS Mid-2019 Population Estimates
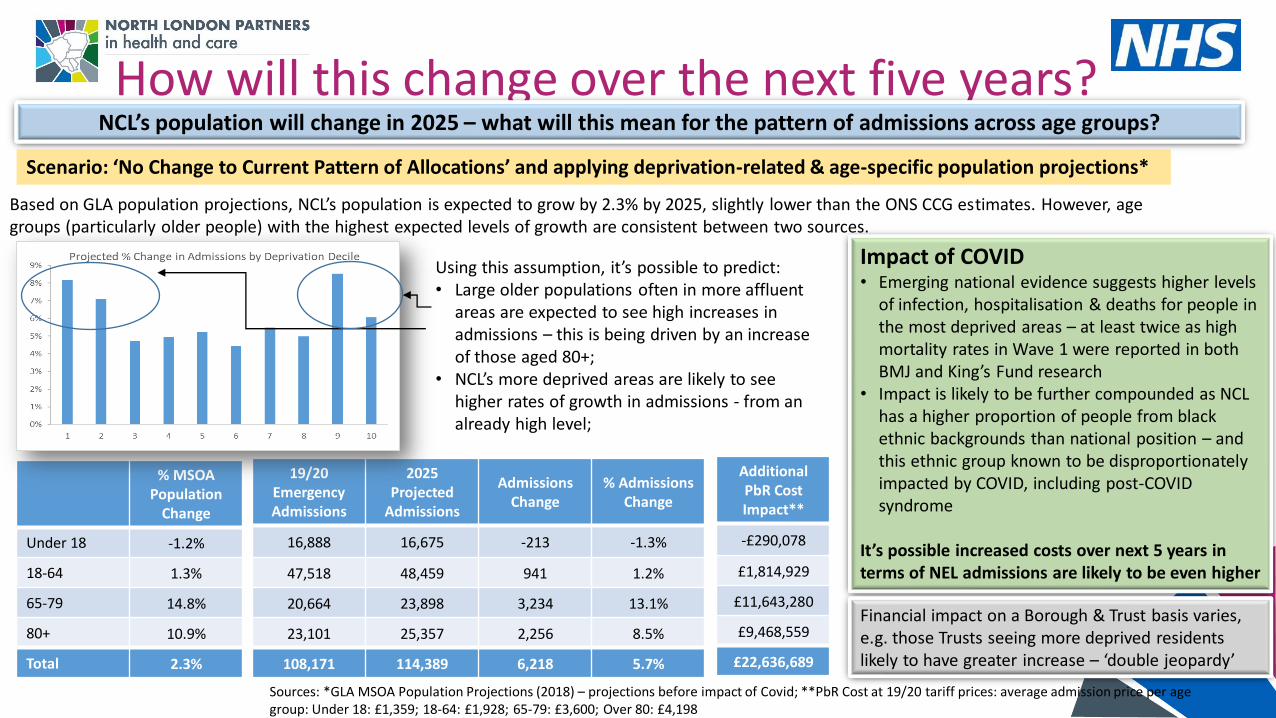
How will this change over the next five years?NCL’s population will change in 2025 – what will this mean for the pattern of admissions across age groups?
Sources: *GLA MSOA Population Projections (2018) – projections before impact of Covid; **PbR Cost at 19/20 tariff prices: average admission price per age group: Under 18: £1,359; 18-64: £1,928; 65-79: £3,600; Over 80: £4,198
Scenario: ‘No Change to Current Pattern of Allocations’ and applying deprivation-related & age-specific population projections*
Based on GLA population projections, NCL’s population is expected to grow by 2.3% by 2025, slightly lower than the ONS CCG estimates. However, age groups (particularly older people) with the highest expected levels of growth are consistent between two sources.
% MSOAPopulation
Change
Under 18 -1.2%
18-64 1.3%
65-79 14.8%
80+ 10.9%
Total 2.3%
19/20Emergency Admissions
2025 Projected
Admissions
Admissions Change
% Admissions Change
16,888 16,675 -213 -1.3%
47,518 48,459 941 1.2%
20,664 23,898 3,234 13.1%
23,101 25,357 2,256 8.5%
108,171 114,389 6,218 5.7%
AdditionalPbR Cost Impact**
-£290,078
£1,814,929
£11,643,280
£9,468,559
£22,636,689
Using this assumption, it’s possible to predict:• Large older populations often in more affluent
areas are expected to see high increases in admissions – this is being driven by an increase of those aged 80+;
• NCL’s more deprived areas are likely to see higher rates of growth in admissions - from an already high level;
Impact of COVID• Emerging national evidence suggests higher levels
of infection, hospitalisation & deaths for people in the most deprived areas – at least twice as high mortality rates in Wave 1 were reported in both BMJ and King’s Fund research
• Impact is likely to be further compounded as NCL has a higher proportion of people from black ethnic backgrounds than national position – and this ethnic group known to be disproportionately impacted by COVID, including post-COVID syndrome
It’s possible increased costs over next 5 years in terms of NEL admissions are likely to be even higher
Financial impact on a Borough & Trust basis varies, e.g. those Trusts seeing more deprived residents likely to have greater increase – ‘double jeopardy’
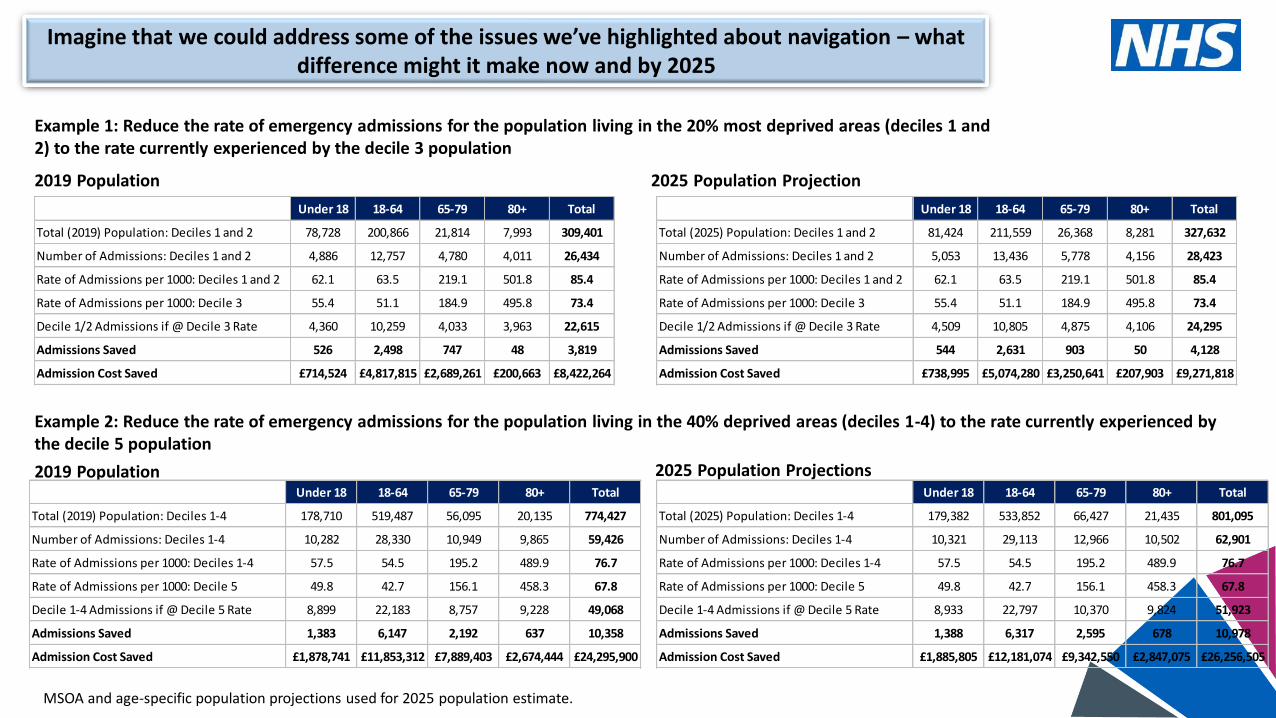
Imagine that we could address some of the issues we’ve highlighted about navigation – what difference might it make now and by 2025
Example 1: Reduce the rate of emergency admissions for the population living in the 20% most deprived areas (deciles 1 and 2) to the rate currently experienced by the decile 3 population
2019 Population
Under 18 18-64 65-79 80+ Total
Total (2019) Population: Deciles 1 and 2 78,728 200,866 21,814 7,993 309,401
Number of Admissions: Deciles 1 and 2 4,886 12,757 4,780 4,011 26,434
Rate of Admissions per 1000: Deciles 1 and 2 62.1 63.5 219.1 501.8 85.4
Rate of Admissions per 1000: Decile 3 55.4 51.1 184.9 495.8 73.4
Decile 1/2 Admissions if @ Decile 3 Rate 4,360 10,259 4,033 3,963 22,615
Admissions Saved 526 2,498 747 48 3,819
Admission Cost Saved £714,524 £4,817,815 £2,689,261 £200,663 £8,422,264
Under 18 18-64 65-79 80+ Total
Total (2025) Population: Deciles 1 and 2 81,424 211,559 26,368 8,281 327,632
Number of Admissions: Deciles 1 and 2 5,053 13,436 5,778 4,156 28,423
Rate of Admissions per 1000: Deciles 1 and 2 62.1 63.5 219.1 501.8 85.4
Rate of Admissions per 1000: Decile 3 55.4 51.1 184.9 495.8 73.4
Decile 1/2 Admissions if @ Decile 3 Rate 4,509 10,805 4,875 4,106 24,295
Admissions Saved 544 2,631 903 50 4,128
Admission Cost Saved £738,995 £5,074,280 £3,250,641 £207,903 £9,271,818
2025 Population Projection
Example 2: Reduce the rate of emergency admissions for the population living in the 40% deprived areas (deciles 1-4) to the rate currently experienced by the decile 5 population
2019 Population Under 18 18-64 65-79 80+ Total
Total (2019) Population: Deciles 1-4 178,710 519,487 56,095 20,135 774,427
Number of Admissions: Deciles 1-4 10,282 28,330 10,949 9,865 59,426
Rate of Admissions per 1000: Deciles 1-4 57.5 54.5 195.2 489.9 76.7
Rate of Admissions per 1000: Decile 5 49.8 42.7 156.1 458.3 67.8
Decile 1-4 Admissions if @ Decile 5 Rate 8,899 22,183 8,757 9,228 49,068
Admissions Saved 1,383 6,147 2,192 637 10,358
Admission Cost Saved £1,878,741 £11,853,312 £7,889,403 £2,674,444 £24,295,900
Under 18 18-64 65-79 80+ Total
Total (2025) Population: Deciles 1-4 179,382 533,852 66,427 21,435 801,095
Number of Admissions: Deciles 1-4 10,321 29,113 12,966 10,502 62,901
Rate of Admissions per 1000: Deciles 1-4 57.5 54.5 195.2 489.9 76.7
Rate of Admissions per 1000: Decile 5 49.8 42.7 156.1 458.3 67.8
Decile 1-4 Admissions if @ Decile 5 Rate 8,933 22,797 10,370 9,824 51,923
Admissions Saved 1,388 6,317 2,595 678 10,978
Admission Cost Saved £1,885,805 £12,181,074 £9,342,550 £2,847,075 £26,256,505
2025 Population Projections
MSOA and age-specific population projections used for 2025 population estimate.
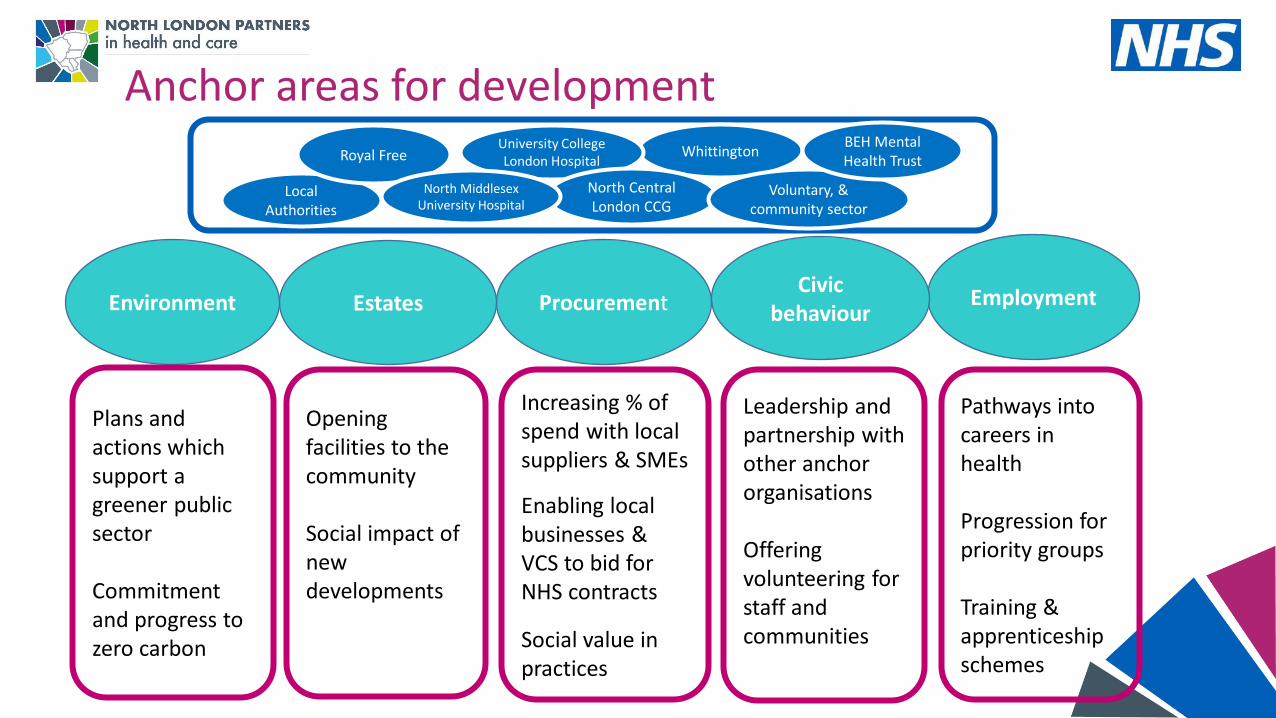
Anchor areas for development
Employment Civic
behaviourProcurement EstatesEnvironment
Plans and actions which support a greener public sector
Commitment and progress to zero carbon
Opening facilities to the community
Social impact of new developments
Increasing % of spend with local suppliers & SMEs
Enabling local businesses & VCS to bid for NHS contracts
Social value in practices
Leadership and partnership with other anchor organisations
Offering volunteering for staff and communities
Pathways into careers in health
Progression for priority groups
Training & apprenticeship schemes
Whittington
Local Authorities
University College London Hospital
North Central London CCG
Voluntary, & community sector
BEH Mental Health Trust Royal Free
North Middlesex University Hospital