Embed Size (px)
Citation preview
119
CHAPTER III
SOCIAL CHANGES IN
PATHANAMTHITTA DISTRICT
3.1 Introduction
Social change, a phenomenon inevitable for any society is a general term which is
used in the study of History, Sociology, Economics and Political Science. This chapter
deals with the major trends and patterns of the changes in the social arenas of
Pathanamthitta district since its formation in 1982. The social indicators like
demography, education, health, family, religion and human development are analyzed
in detail and the changes in these areas in these years are studied in a broad Kerala
perspective. The changes among the marginalized communities like the Scheduled
Castes and Scheduled tribes are also studied and a comparison with the general
population is made. The position of the women folk in the district and the changes
happened to them in these years is also studied. The chapter analyzes the changes in
these areas so as to understand how they influence each other and the economic
developments in a causal manner and, at the same time, get shaped by them. The
trends in demographic changes in the district and their influence on the education and
other areas and vice versa are specially focused to reach at understandings regarding
the social change in the district.
3.2 Human Development
Development in a State is the outcome of the interplay of a variety of factors, such as
political, economic, demographic and geographic. It could be maximizing human
potential, progressing towards a better condition. Human Development Index of the
United Nations Development Programme (UNDP) captures the possible essence of
human Development across the globe in terms of three indicators: health (life
120
expectancy) education (literacy) and standard of living (per capita income). It should
be noted that the first two are the outcomes of the social infrastructure, complemented
by economic ones, and the third that of economic infrastructure combined with human
resources. The last input human resources are in turn the outcome of the social
infrastructure supported by economic ones.
It goes without saying that Kerala continues to rank at the top among Indian States
with respect to the human development index (as per 1981, 1991, 2001 and 2011
estimates), with continuous improvement. There is little variation in human
development indices across the districts in Kerala and as a result absence in any
significant disparity in human development. Kerala‟s experience reveals that from
the wide regional differences at the time of Independence it is possible to achieve
remarkably high level of human development within a short span of one generation.
The Kingdom of Travancore, in which the study area was a part, had made significant
progress in the educational and health status of its population from very early times.
The base for this was facilitated by the strong revenue system of the area. This was
possible by the commercialization of agriculture and the expansion of trade. Before
that the Travancore Government brought a substantial proportion of the land under
State control and was cultivated by numerous tenants, who were subsequently
conferred ownership rights. This had the effect of strengthening the revenue base of
the area. All these facilitated the Travancore Government to allot an increasing
proportion of expenditure on social services especially education and health care.
Regarding education the government not only opened schools and hospitals of its own
but also promoted private agencies through Grants-in-aid. The activities of the
Christian missionaries decisively influenced the expansion and development of health
and educational facilities in Kerala as the lower classes were also given recognition.
The growth of modern institutions for education and health in Travancore had not
been at the cost of the indigenous systems prevailed here. Besides this the Travancore
showed a positive response to caste or religion base social reform movements and
later to organized political movements.
121
The district has achieved substantial progress in Human Resource Development. As
per the report of Economics and Statistics Department, the total job seekers in 1984
were 63978 which showed an increase in the later years. As on 31 March 2008, the
number of Total work seekers registered with employment exchange were 162626.
Out of this 98538 were women and 64088 were men. Among the total job seekers
155887 were with General qualifications and 6739 were with professional and
technical qualifications. These figures of educated work seekers show the supply side
of human resources in the district. The Human Development Index, a summary
measure of human development which measures the average achievements in three
basic dimensions of human development - a long and healthy life as measured by life
expectancy at birth, knowledge as measured by the adult literacy rate, a decent
standard of living as measured by GDP per capita. Analysing all the major indicators
of human development, Pathanamthitta district is in the third position just behind
Ernakulam and Kottayam district. In all the major indicators the district is above the
State average also.
3.3 Demography
The quality and size of population are two factors that are emphasized in the
development of human resource. Also a change in the size and composition of
population is a very important factor leading to social change.1 Social change may
occur in response to changes in demographic or ecological conditions and
demographic transition may occur as a result of social change.2 The decadal census
provides a detailed examination of demographic and economic characteristics for such
areas as the State and districts. The results of censuses allow researchers to analyze
the population as well as its demographic subgroups. As these data are available for
1 Kuppuswamy B., Social Change in India (New Delhi: Konark Publishers Private
Limited, 1996) 83.
2 Abusaleh Shariff, Fertility Transition in Rural South India (New Delhi: Gian
Publishing House, 1989) 1.
122
rural as well as urban areas it is useful to study not only individual areas, but also
different combinations of such areas, depending on the user‟s needs.
3.3.1 Population Profile
The district of Pathanamthitta accounts for 2637 sq.km which is 6.8% of the state‟s
area and its share in the state‟s population is 3.9%. In 1991 the population was
11,88,332 which was raised to 12,34,016 in 2001 and lowered to 11,97,412 in 2011.
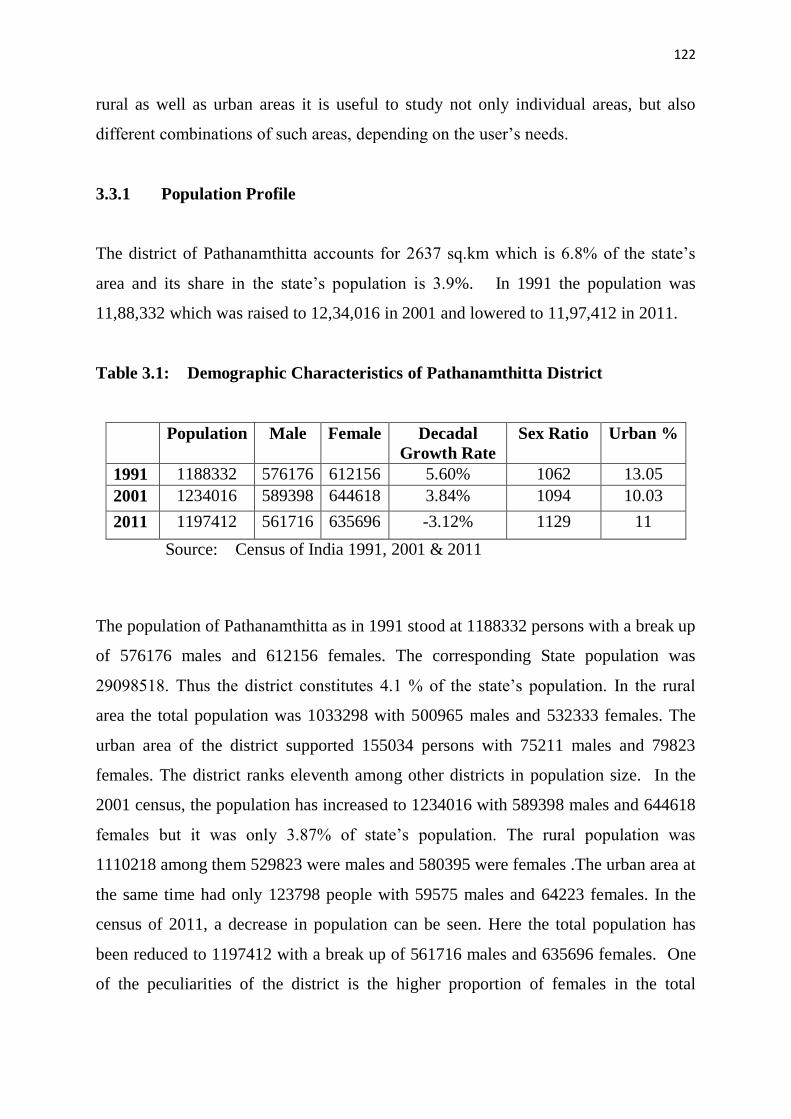
Table 3.1: Demographic Characteristics of Pathanamthitta District
Population Male Female Decadal
Growth Rate
Sex Ratio Urban %
1991 1188332 576176 612156 5.60% 1062 13.05
2001 1234016 589398 644618 3.84% 1094 10.03
2011 1197412 561716 635696 -3.12% 1129 11
Source: Census of India 1991, 2001 & 2011
The population of Pathanamthitta as in 1991 stood at 1188332 persons with a break up
of 576176 males and 612156 females. The corresponding State population was
29098518. Thus the district constitutes 4.1 % of the state‟s population. In the rural
area the total population was 1033298 with 500965 males and 532333 females. The
urban area of the district supported 155034 persons with 75211 males and 79823
females. The district ranks eleventh among other districts in population size. In the
2001 census, the population has increased to 1234016 with 589398 males and 644618
females but it was only 3.87% of state‟s population. The rural population was
1110218 among them 529823 were males and 580395 were females .The urban area at
the same time had only 123798 people with 59575 males and 64223 females. In the
census of 2011, a decrease in population can be seen. Here the total population has
been reduced to 1197412 with a break up of 561716 males and 635696 females. One
of the peculiarities of the district is the higher proportion of females in the total
123
population (51.5%in 1991 & 52.23 % in 2001 & 53.08% in 2011). Also the share of
minorities especially Christians in the population are more. The share of SC/ST
population is 13.3 and 0.6 in 1991 and 13.1 and 0.5 in 2001 and 13.7 and 0.67 in
2011. The percentage of urban population in the district in 1991 was 13.05% which
was lowered to 10.03% in 2001 retaining the 11th
rank in this respect. In Kerala also a
corresponding decline can be seen i.e. from 26.39 to 25.96%. In 2011 the increased
percentage in urban growth rate of the district as compared to 2001 is to the tune of
only about one percent, i.e., from 10.03% in 2001 to 11% in 2011.
3.3.2 Growth Rate
Even though the population is increasing slowly in the two census periods, the growth
rates showed fluctuations. The district observes a continuous declining trend in growth
rate in the study period. In both the periods the district was below the State average
and lowest among other districts of the State. In the 2011 census, a negative growth
rate of -3.12 is recorded against the State average of 4.86. While considered in
percentage terms the growth rate of female population has been observed more than
the growth rate of male population. In 1991 the district had a growth rate of 5.60%
which was the lowest in the State.
Though the rate of increase in total population is low in all taluks, it differs from taluk
to taluk. Among the taluks the highest growth rate in 1991 is reported in Adoor taluk
and the lowest in Mallappally taluk. Regarding rural-urban breakup Thiruvalla and
Adoor witnessed a decline in rural population. Thiruvalla municipality‟s area has been
extended which resulted in the decline of rural growth rate in Thiruvalla taluk, and the
formation of two new municipalities carved out from the rural areas of Adoor and
Pandalam Panchayats has contributed to the decline in rural population. In 2001 the
district had a growth rate of 3.8%. Here all the taluks witnessed a positive growth rate
124
except Ranni which had a negative growth rate. In 2001 the district holds only 3.8%
of Kerala‟s population. The present population growth rate of 3.8% in the district
over 1991 census is the lowest ever recorded in the last one hundred years.3
The growth rate of population in rural and urban areas of the district are 7.4% and
20.2% respectively in 2001. It was -2.8% for rural and 149.3% for urban areas in
1991. These wide fluctuations are due to the addition of two towns, Adoor and
Pandalam in 1991 and further the declassification of Pandalam municipality as rural in
2001. In 2011 both in the total as well as in the rural set up a negative growth rate
can be seen. If the decadal growth rate in the district is -3.12%, the rural areas and
urban areas reported -4.16% and 6.19% respectively. The decline in growth rate was
contributed to partly by decline in fertility and partly by net out migration.
3.3.4 Density of Population
Density, the land-people ratio is one of the important indices of population
concentration or pressure of population on land. The density of the district in 1991
was 450 persons per square kilometer which was lower than the density of the state
which is 749 persons per square kilometer. Pathanamthitta was 12th
among the
districts of Kerala with regard to density. The thick forests and hilly terrain in the
upland areas reduce the density of its population. In 2001 the density has increased to
468 persons, but retained the 12th
rank among the districts of Kerala. In 2011 it again
reduced to 453. The density has wide variations at Taluk level in the district. In 2001
the density varies from Thiruvalla the most thickly populated taluk to Ranni the least
populated one. Most of the taluks of the district are situated on highland where hills
3 District Census Hand Book, Pathanamthitta, Census of India 2001- Series -12
Kerala, Part XII-A&B, 35.
125
are thickly forested in upper ranges, while in the lower ranges the forests are
interspersed with plantations.
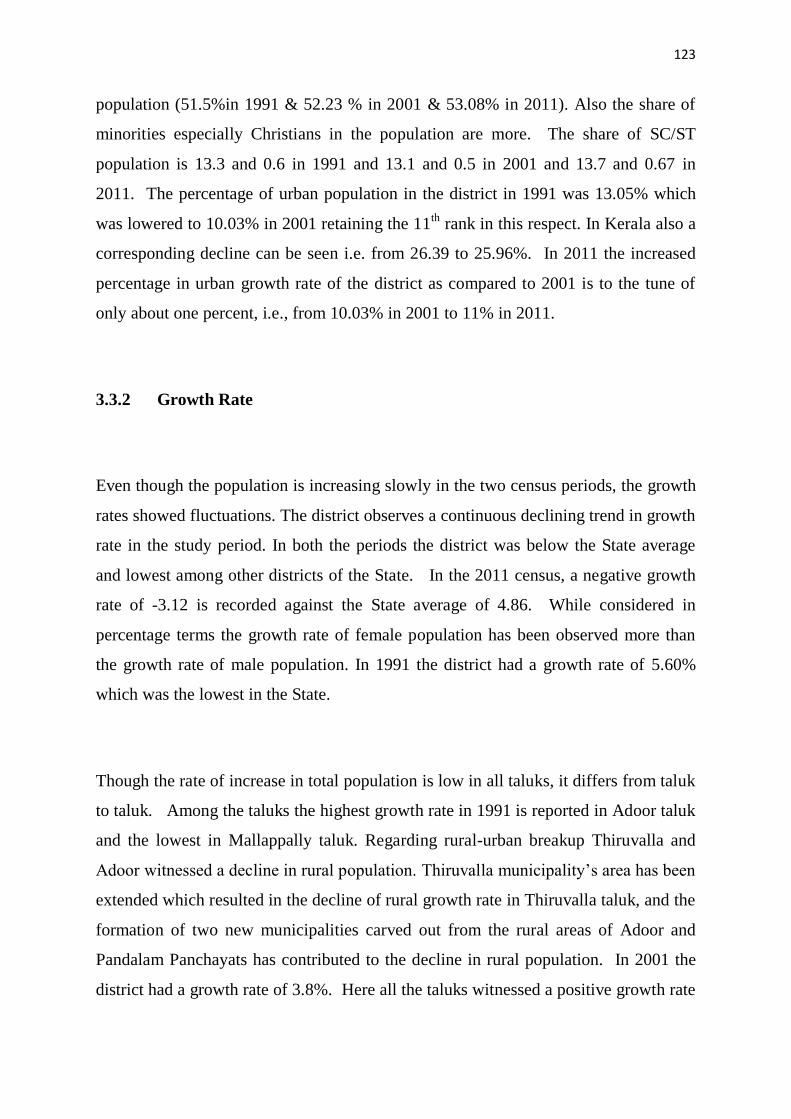
Table 3.2: Population Densities in the State and the District
1991 2001 2011
PATHANAMTHITTA 450 467 453
KERALA 749 819 859
Source- Census of India 1991 &2001 Primary Census Abstract, General
Population, Part II-B (i)
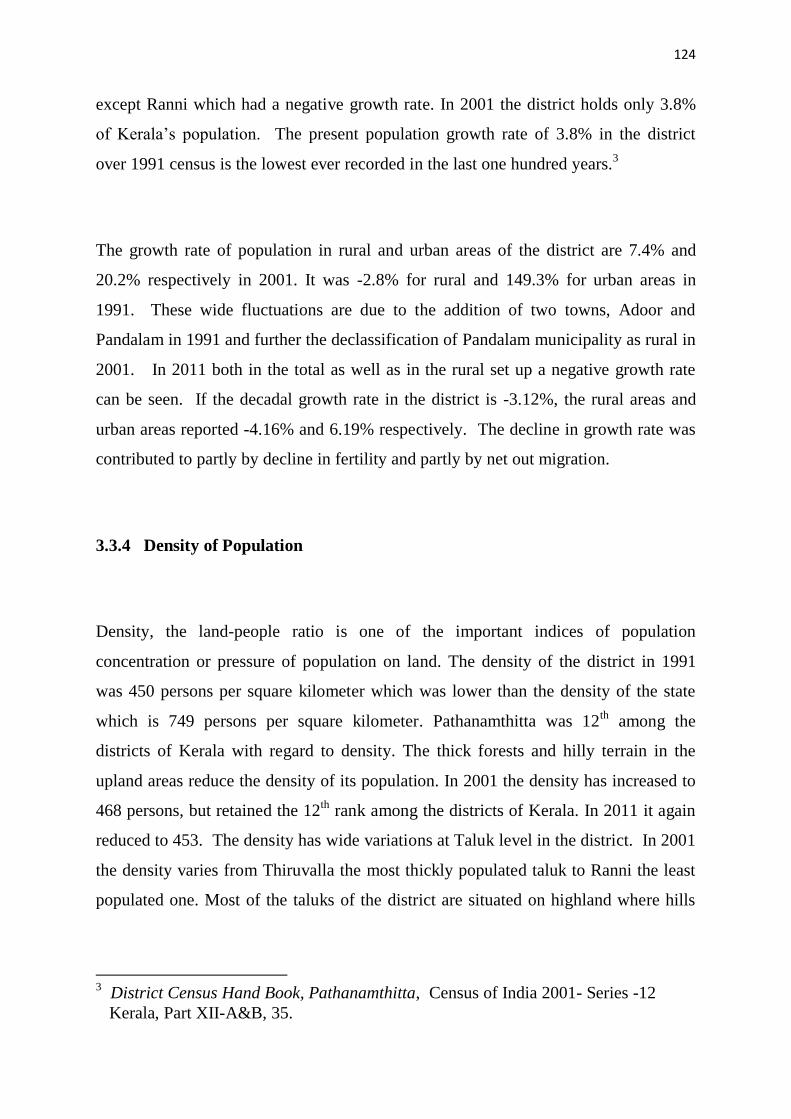
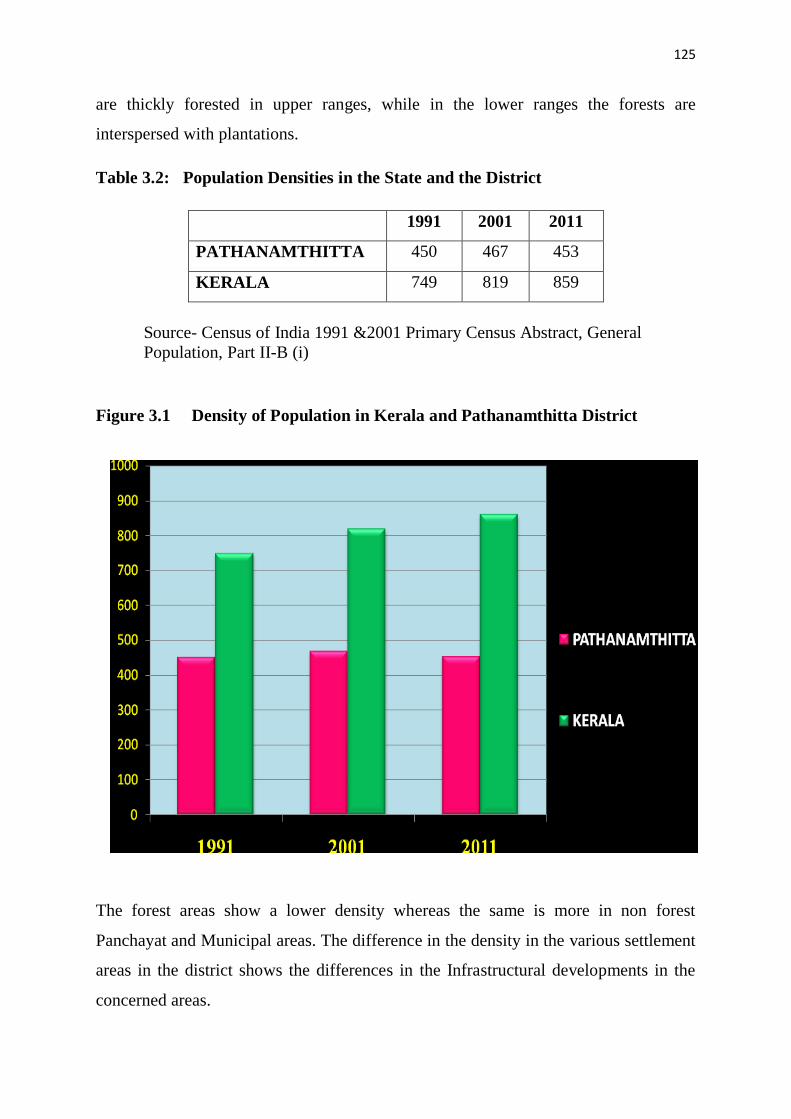
Figure 3.1 Density of Population in Kerala and Pathanamthitta District
The forest areas show a lower density whereas the same is more in non forest
Panchayat and Municipal areas. The difference in the density in the various settlement
areas in the district shows the differences in the Infrastructural developments in the
concerned areas.
126
3.3.5 Sex Ratio
Pathanamthitta district has a unique position with regard to sex ratio. The district has a
sex ratio favouring the female population. Sex ratio denotes the quantification of the
weight of females in a population. Migration of male workers, women literacy,
accesses to medical service etc influence the sex ratio.4 The sex ratio of the district
has steadily increased over the preceding decades. In all the censuses in the study
period females out number males and the district has the top most position in the State
in this regard.
In 1991 it was 1062 as against the State average of 1036 with second position in State.
In 2001 census, Pathanamthitta district has the first position among the districts of
Kerala with 1094 females per 1000 males as against 1058 females per 1000 males in
the State. In 2011 the sex ratio has been raised to 1129. For long the overall sex ratio
in Kerala has been favourable to females and has been the most widely discussed
indicator of women‟s status.5 Large scale male outmigration from the district for
better job opportunities coupled with women literacy and improvements in health
indicators can be cited as reasons for this.
Regarding the rural and urban sex ratio also the picture is not much different. The
rural area of the district has reported 1095 females per 1000 males in 2001 as against a
4 Amitabh Kundu and Mahesh Sahu. “Variation in Sex Ratio: Development
implications”, Economic and Political Weekly (Oct.12, 1991): 2341-2342.
Zachariah K.C, Mathew E.T. and Irudaya Rajan S., Socio Economic and
Demographic Consequences of Migration in Kerala (Thiruvananthapuram: Centre
for Development Studies, 2000) 44.
5 Government of Kerala, Human Development Report (Thiruvananthapuram: State
Planning Board, 2005) 21.
127
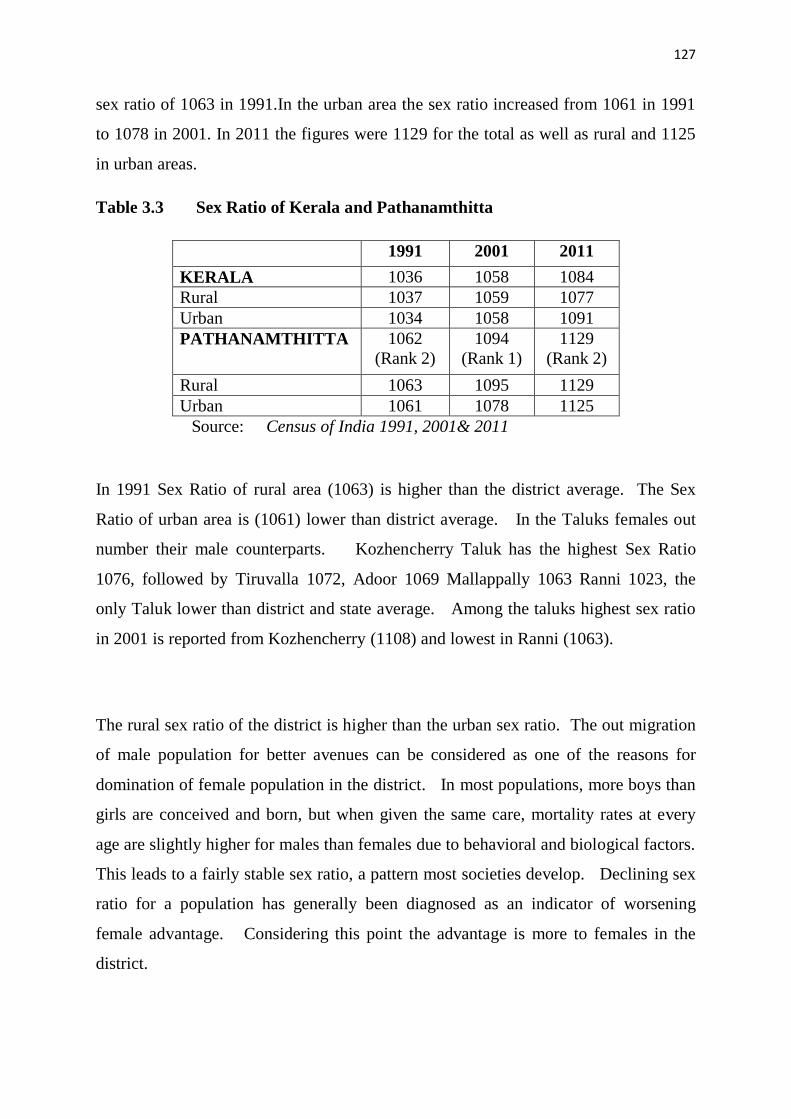
sex ratio of 1063 in 1991.In the urban area the sex ratio increased from 1061 in 1991
to 1078 in 2001. In 2011 the figures were 1129 for the total as well as rural and 1125
in urban areas.
Table 3.3 Sex Ratio of Kerala and Pathanamthitta
1991 2001 2011
KERALA 1036 1058 1084
Rural 1037 1059 1077
Urban 1034 1058 1091
PATHANAMTHITTA 1062
(Rank 2)
1094
(Rank 1)
1129
(Rank 2)
Rural 1063 1095 1129
Urban 1061 1078 1125
Source: Census of India 1991, 2001& 2011
In 1991 Sex Ratio of rural area (1063) is higher than the district average. The Sex
Ratio of urban area is (1061) lower than district average. In the Taluks females out
number their male counterparts. Kozhencherry Taluk has the highest Sex Ratio
1076, followed by Tiruvalla 1072, Adoor 1069 Mallappally 1063 Ranni 1023, the
only Taluk lower than district and state average. Among the taluks highest sex ratio
in 2001 is reported from Kozhencherry (1108) and lowest in Ranni (1063).
The rural sex ratio of the district is higher than the urban sex ratio. The out migration
of male population for better avenues can be considered as one of the reasons for
domination of female population in the district. In most populations, more boys than
girls are conceived and born, but when given the same care, mortality rates at every
age are slightly higher for males than females due to behavioral and biological factors.
This leads to a fairly stable sex ratio, a pattern most societies develop. Declining sex
ratio for a population has generally been diagnosed as an indicator of worsening
female advantage. Considering this point the advantage is more to females in the
district.
128
Sex ratios of total population and child population are very important from a social
perspective. In Kerala from 2001 to 2011 i.e., within a period of 10 years, the sex
ratio has achieved an increase of 26 females per 1000 males and is at 1084 females per
1000 males. Pathanamthitta enjoyed the first position with a sex ratio of 1094. This
order has been changed in 2011 and Pathanamthitta has the second place with 1129
females against 1000 males. All the taluks, sex ratio is above State average. Sex
Ratio of Child population also warrants attention with its social and demographic
relevance. In Pathanamthitta the total population in the 0-6 age group in 1991 was
137310 persons with 70167 males and 67143 females. The rural population was
119484 whereas the urban was 17826 only. In both the cases male members
outnumber females, a trend opposite to the general trend. The sex ratio of 0-6
population group is negative in 2001 census (967) with rural (967) and urban (966)
break up.
In 2011 Child sex ratio reported was 964, 965 and 967 in the total, rural and urban
sectors. Here a decline in the Child sex ratio can be noticed and it is a trend opposite
to the general trend in the District. The registering of child sex ratio below the State
average is noteworthy from demographic point of view. In 2011 period
Pathanamthitta district register higher child sex ratio in the urban areas as compared to
rural areas.
3.3.6 Literacy
Another characteristic of population is the literacy which shows the quality of life.
The literacy rate in 1991 census is calculated excluding the population up to the age of
7 years. Pathanamthitta has creditable achievements in the field of literacy. In the
1991 census it is 94.86% as against the State average of 89.81%. In 2001 the figure
was improved to 95.09% and again improved to 96.93%in 2011. The male literacy of
the district in the three periods is above the State average. Female literacy is very
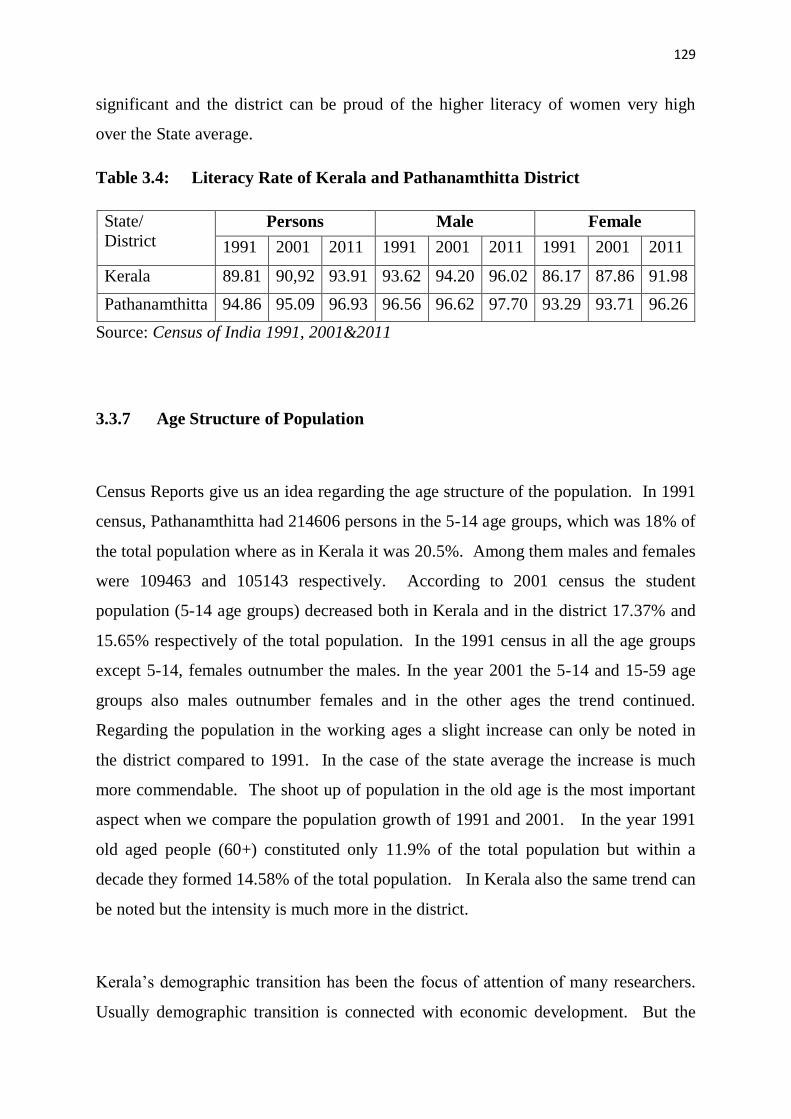
129
significant and the district can be proud of the higher literacy of women very high
over the State average.
Table 3.4: Literacy Rate of Kerala and Pathanamthitta District
State/
District Persons Male Female
1991 2001 2011 1991 2001 2011 1991 2001 2011
Kerala 89.81 90,92 93.91 93.62 94.20 96.02 86.17 87.86 91.98
Pathanamthitta 94.86 95.09 96.93 96.56 96.62 97.70 93.29 93.71 96.26
Source: Census of India 1991, 2001&2011
3.3.7 Age Structure of Population
Census Reports give us an idea regarding the age structure of the population. In 1991
census, Pathanamthitta had 214606 persons in the 5-14 age groups, which was 18% of
the total population where as in Kerala it was 20.5%. Among them males and females
were 109463 and 105143 respectively. According to 2001 census the student
population (5-14 age groups) decreased both in Kerala and in the district 17.37% and
15.65% respectively of the total population. In the 1991 census in all the age groups
except 5-14, females outnumber the males. In the year 2001 the 5-14 and 15-59 age
groups also males outnumber females and in the other ages the trend continued.
Regarding the population in the working ages a slight increase can only be noted in
the district compared to 1991. In the case of the state average the increase is much
more commendable. The shoot up of population in the old age is the most important
aspect when we compare the population growth of 1991 and 2001. In the year 1991
old aged people (60+) constituted only 11.9% of the total population but within a
decade they formed 14.58% of the total population. In Kerala also the same trend can
be noted but the intensity is much more in the district.
Kerala‟s demographic transition has been the focus of attention of many researchers.
Usually demographic transition is connected with economic development. But the
130
experience of Kerala demonstrates that fertility and mortality decline can occur
without substantial economic development and that good health outcomes can be
achieved at low cost.6 Kerala‟s demographic transition occurred through many
conventional social and health correlates and political will.7 Pathanamthitta is also
along the path of Kerala, a little bit ahead of it. The population growth in any area is
determined by the levels of births, deaths and migration in the specific geographical
area. When these three features of population are analyzed Pathanamthitta‟s position
is far ahead of Kerala.
3.3.8 Fertility
Fertility decline is perhaps the most important social change that has occurred in India
in recent years even in the absence of significant structural changes in the economy.8
It is one of the important social changes taking place in developing countries recently
defying conventional theories and belief.9 Fertility refers to the actual bearing of
children, the reproductive performance and is measured in terms of live births.10
Fertility estimates are done at the State level by the National Family Health Survey.
In the absence of reliable estimates of fertility indicators at the district level, some
attempt has been made to provide such estimates using indirect estimation techniques
6 Bhagat R.B. and Purujit Praharaj, “Hindu-Muslim Fertility Differentials”, Economic
and Political Weekly (29January 2005): 411-417.
7 Mari Bhat P.N. and Irudaya Rajan S.,”Demographic Transition in Kerala
Revisited”, Economic and Political Weekly (8 Sep. 1990) 1957-79.
8 James K.S. and Sajini Nair B., “Accelerated Decline in Fertility in India since the
1980s Trends among Hindus and Muslims”, Economic and Political Weekly (29
January 2005) 375-383.
9 Mahendra Dev S., James K S and Binayak Sen, “Causes of Fertility Decline in India
and Bangladesh Role of Community”, Economic and Political Weekly (26 October
2002) 4447-4454.
10
Malcolm Potts and Peter Selman, Society and Fertility (Macdonald and Evans Ltd.,
1979) 5.
131
from the census data. The Census of India 1981 for the first time canvassed the
information on children ever born and surviving among women of different age
groups at the district level. Individual researchers also have done independent
estimates.11
The Total Fertility Rate (TFR), a summary measure of fertility, is the
most significant demographic indicator in the analysis of the impact of national
population programmes - in particular, family planning programmes on individual or
group reproductive behaviour. High status of women, female literacy, age at marriage
and low infant mortality, were thought to be factors behind the rapid fall in the fertility
rate in the State.
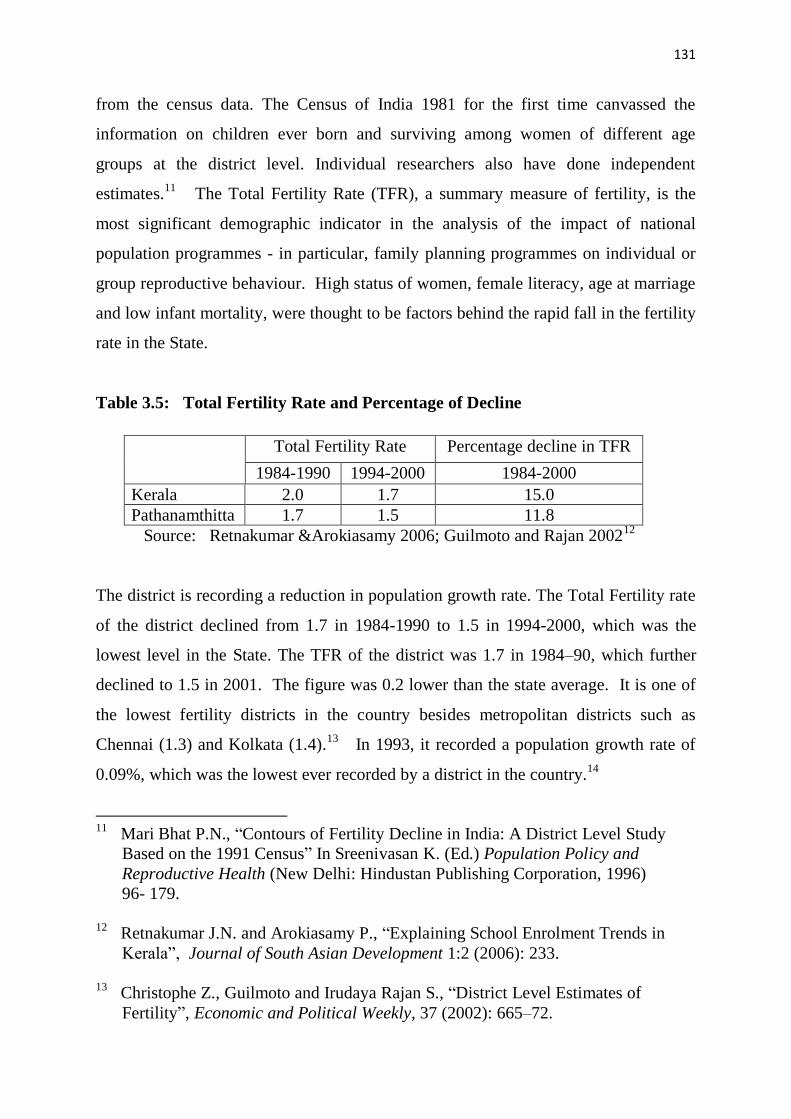
Table 3.5: Total Fertility Rate and Percentage of Decline
Total Fertility Rate Percentage decline in TFR
1984-1990 1994-2000 1984-2000
Kerala 2.0 1.7 15.0
Pathanamthitta 1.7 1.5 11.8
Source: Retnakumar &Arokiasamy 2006; Guilmoto and Rajan 200212
The district is recording a reduction in population growth rate. The Total Fertility rate
of the district declined from 1.7 in 1984-1990 to 1.5 in 1994-2000, which was the
lowest level in the State. The TFR of the district was 1.7 in 1984–90, which further
declined to 1.5 in 2001. The figure was 0.2 lower than the state average. It is one of
the lowest fertility districts in the country besides metropolitan districts such as
Chennai (1.3) and Kolkata (1.4).13
In 1993, it recorded a population growth rate of
0.09%, which was the lowest ever recorded by a district in the country.14
11
Mari Bhat P.N., “Contours of Fertility Decline in India: A District Level Study
Based on the 1991 Census” In Sreenivasan K. (Ed.) Population Policy and
Reproductive Health (New Delhi: Hindustan Publishing Corporation, 1996)
96- 179.
12
Retnakumar J.N. and Arokiasamy P., “Explaining School Enrolment Trends in
Kerala”, Journal of South Asian Development 1:2 (2006): 233.
13
Christophe Z., Guilmoto and Irudaya Rajan S., “District Level Estimates of
Fertility”, Economic and Political Weekly, 37 (2002): 665–72.
132
Among all the socio-economic factors, education especially female education is
considered to be one of the most important factors influencing fertility15
even though
it varies by residence, educational background and other background characteristics of
a woman. A large body of Indian and international evidence points to the role of rising
female education in lowering fertility16
.The inverse relationship between education
and fertility can be seen in the district. The literacy of the district in all the censuses
was in a high position in the state. Improvements in male literacy income, economic
status of the house hold, religion, labour force participation especially females,
urbanization, improvements in health services, poverty17
etc may also determine
fertility.
Marital fertility control through extensive use of family planning also resulted in a
steep fall in fertility rates. The Couple protection rate of the district is a proof of this
statement. Mean age at marriage can be considered as a determinant of fertility
decline, even though the reasons for delay in marriage were not restricting fertility
alone but socioeconomic too. According to an estimate from the Reproductive and
Child Health Survey (1998-99) the mean age at marriage in Kerala for males is 28.7
years and for females 22.7 years.18
In that survey Pathanamthitta‟s figures were 27.6
and 23.2 respectively. The mean age at marriage of girls is slightly higher than the
14
Retnakumar J. N and Arokiasamy P., “Fertility Decline and School Enrolment”,
Economic and Political Weekly, 38(2003) 4827–30.
15 Zachariah K.C., Navaneetham P.S., Gpoinathan Nair and Mishra U.S.,
“Demographic Transition in Kerala in the 1980‟s” (Thiruvananthapuram: Centre
for Development Studies, 1994) 8.
16
Jean Drèze and Mamta Murthi, Fertility, Education and Development (London:
Centre for Development Economics, Cambridge University, 2000) 17.
17
Alaka Malwade Basu, “Birth Control by Asset less Workers in Kerala: The
Possibility of a Poverty Induced Fertility Transition”, Development and Change,
17 (1986): 265-82.
18
Government of Kerala, Human Development Report (Thiruvananthapuram: State
Planning Board, 2005) 62.
133
state average. Delayed marriage age and a deliberate attempt by couples to limit
fertility were a response to the overall societal changes.
3.3.9 Mortality
Demographic transition cannot be achieved without mortality decline. Mortality
decline in all sphere especially infant, child, and maternal as well as general mortality
decline is needed. This health indicator plays a crucial role in population growth. In
most demographic literature, Kerala stands out as a positive example. The experience
of this state demonstrates that fertility and mortality decline can occur without
substantial economic development. Kerala‟s infant mortality rate (IMR) can be
compared to developed nations.
Infant Mortality Rate, the most remarkable change in the demographic sphere is
considered as an index which measures the quality of life in any given population. The
widespread healthcare facilities, the successful population control campaigns, state
supported nutrition programme for pregnant and new mothers and greater awareness
regarding the importance of breast feeding are some of the factors that pulled down
infant mortality rate. High level of female literacy and low gender gap in literacy are
some of the other factors. Apart from humanistic consideration, reducing infant
mortality rate is important to stabilize population.
Studies reveal that the infant mortality rate of Pathanamthitta District in 1991 was
considerably lower when compared to the all Kerala Average. The difference in rural-
urban infant mortality rate in Pathanamthitta registers a tendency just opposite to the
same in the all Kerala average. In Kerala level, total urban infant mortality rate is 8
point lower than total rural infant mortality rate. On the contrary in Pathanamthitta
total urban infant mortality rate is 8 point higher than the same for total rural infant
mortality rate. Coming to 2001, we see the difference in infant mortality rate between
134
Kerala averages and figures for Pathanamthitta thinning away to bring the figures as
well as trends roughly the same. The total infant mortality rate is same for
Pathanamthitta and Kerala. Only the female urban infant mortality rate is higher in
Pathanamthitta when compared to Kerala average. But the difference is only 3 points.
Regarding child mortality rate also Pathanamthitta‟s figures were low when compared
to State average. (An absolute difference of 13).The advantage of Pathanamthitta is
more among males than among females. Interestingly this low child mortality rate of
Pathanamthitta is due to the developments in rural areas. The rural child mortality rate
of Pathanamthitta in 1991 was 31 which were 17 points lower than the Kerala
average. On the other hand the child mortality rate is more or less the same in the case
of the urban Kerala and urban Pathanamthitta.
As in the case of infant mortality rate, over the 10 years from 1991 to 2001 child
mortality rate of Kerala average registered a higher reduction as against the figures for
Pathanamthitta to bring the figures more or less the same for both the state and
district. Child mortality rate is somewhat similar for Pathanamthitta and Kerala in all
its details like total, total male, total female, urban male etc. There was an overall
decrease in mortality rate in all age groups. High literacy rate, development of health
consciousness etc. can be cited as the main reasons.
3.3.10 Migration
Census Reports give details on district wise proportion of in-migrants by sex in rural
and urban areas. In migrants to any district are those persons who are enumerated in
the district at the time of enumeration but born outside the district of enumeration.
The percentage of in-migrants to total population of each district has been calculated
and is grouped into three ranges. The highest range of 12.01 and above percentage
135
has been occupied by Pathanamthitta in 1991 Census along with Idukki and
Wayanadu.
The migration survey conducted by the Centre for Development Studies,
Thiruvananthapuram, points out that Pathanamthitta district have out migration above
the State average.19
The Pathanamthitta district accounts for 13% of the total out
migration in the state. Regarding the Migration Prevalence Rate, the district is above
the State average. In Pathanamthitta district, the total number of migrants is almost
the same as the number of households, the Migration Prevalence Rate being 99
percent.
3.3.11 Consequences of Demographic Transition Process
The demographic transition process has various consequences. Age structural
transition is an integral part of a demographic transition. During the final stage of
the demographic transition, when both fertility and mortality reach the lowest level,
the share of old aged population increases. Thus, the dependency ratio increases
during the final stage of demographic transition due to an increase in the elderly
population. There has been a steady and more recently a sharper decline in the
proportion of children of school going age, while the proportion of the aged
population has increased significantly which is inevitable during transition. This has
contributed to an age pyramid that has a shrinking base consisting of children and a
swelling top consisting of senior citizens.
Since the proportion of children in the total population is reducing educational system
especially primary school system has been seriously affected. The reduction has been
19
IrudayaRajan S., Mishra U.S. and Sharma P.S., India’s Elderly: Burden or
Challenge? (New Delhi: Sage Publications, 1999) 64.
136
reflected in the school enrolment, particularly at the Lower Primary levels, and in the
case of Pathanamthitta it has been well studied and this has resulted in „uneconomic
schools‟ and „protected teachers‟.20
Not only this the cost of education and health
will be reduced due to a decline in the number of children per household and this
increases the expectations of parents and has resulted in a flow to English medium
and Aided schools. Keeping the cost per child constant, fertility decline will
contribute towards better quality of children with respect to education and health.
Another notable feature is the fast increasing number and proportion of elderly in the
population. Ageing is intrinsic to socio-economic transition. Demographic transition
leads to ageing, an increase in the proportion of the aged. The elderly is generally
defined as consisting of population above 60 years of age. Some demographers
distinguish categories of the old: young old (60-69 years), old (70-79 years), oldest
old (80-89 years) and the extreme old (90+ years).21
Pathanamthitta leads the state,
and perhaps the country, in the old-old (above 70 years) and the oldest-old (above 80
years) population. When the number and proportion of elderly in the district is
studied in detail it can be seen that the district is not in first position in number of
elderly. But in proportion of elderly (60+, 70+ and 80+) the district is in the first
position.
Pathanamthitta‟s story may present the most severe picture of an ageing society, but
the district is also representative of the general direction of the state‟s demography.
Decline in birthrate, decline in death rate and migration lead to ageing. In case of the
district the birth rate and death rate are lower than the State average and migration of
working age population and return migration of elderly also contribute a great share in
the process.
20
J.N. Retnakumar, op.cit. 231-48
21 Irudaya Rajan S., Home away from home; a survey of old aged homes and
inmates in Kerala, Journal of Housing for the Elderly, 16 (2002): 125-150.
137
The challenges for elderly are more complex because a majority of elderly is in the
rural areas, which are often left behind by migrating youth. This is a social issue in
Pathanamthitta, modernization in the form of migration, affects severely the care of
the old unlike in the past. Secondly, the gender dimension of the old age population
is also of importance. There is feminization of the elderly population. As age
advances, the sex ratio becomes more favourable to women.22
Longevity has increased significantly in the last few decades mainly due to the socio-
economic and health care developments. These factors are responsible for the higher
numerical presence of elderly people leading to higher dependency ratio. In fact, care
giving has emerged as a new need of the elderly due to increased longevity. Because
of globalization, the traditional joint family systems are breaking up as the young in
the family migrate for better livelihood options, leaving the elderly to fend for
themselves. Pathanamthitta happens to be one of the leading beneficiaries of Non
Resident Indian‟s remittances, and so the senior citizens of the district may be
relatively better off, but majority of seniors in Kerala face the challenging odds of
dependencies and healthcare expenses.
The ageing population has also brought with it a new gender dimension. In the ageing
society of the district the number of elderly females is considerably higher than those
of males, owing to the higher life expectancy among females.
The reduction in the growth rate of population has some political effects too. When
the Constituencies are reconstituted on the basis of population, in future, there are the
chances for losing some Constituencies. This in turn leads to the reduction in MLA
funds and consequently to the reduction in development.
22
Annamma Abraham, The Shift in the Social Conception of Old Age: A Case Study
of the Aged Population in Pathanamthitta District, Dissertation, (Kottayam:
Mahatma Gandhi University (2006) 203.
138
3.4 Education
Education and man power development are considered as catalytic factors for the
development of every nation. The earlier notion was that development of less
developed nations will happen only through material capital. Now the notion has
changed and in the place of material capital, human capital took the place.
Kerala‟s achievements in the field of education - near total literacy, free and universal
primary education, low dropout rate at the school level, easy access to educational
institutions, gender equality in access etc. are well known. She had a long and definite
lead in the history of Education among the Indian States. She stands miles ahead
among the other Indian states in social indicators like literacy rate, higher enrolment
of students, higher percentage of girl, Scheduled Castes and Scheduled Tribes students
in schools, low dropout rate among students etc. This unique position which Kerala
has achieved is not the result of a sudden spurt of activity in the field of education in
recent times, but the climax and culmination of the enlightened policies followed by
its rulers from the very early days and the intellectual pursuits of the people spread
over several centuries.23
3.4.1 Education and Modernization
Education has been used as a tool for economic, political and social modernization.24
Education is the key that unlocks the door to modernization. Missionary activities and
23
Sreedhara Menon A., Cultural Heritage of Kerala, An Introduction, (Cochin:
East West Publications Pvt. Ltd, 1978) 158.
24
Castells M., “Four Asian Tigers with a Dragon Head: A Comparative Analysis of
the State, Economy and Society in the Asian Pacific Rim”, In Appelbaum R. and
Henderson J. (eds) States and Development in the Asian Pacific Rim (London:
Sage Publications, 1992) 33–70.
139
Travancore government's educational policies were very vibrant and deeply
influencing the process of modernization in this region from the beginning of the
second half of the nineteenth century. Their zeal and outlook helped Kerala as well as
the region covered under this study overcome the caste and sex biases and constraints
in the field of social and educational progress.25
The way showed by the missionaries
was zealously followed by the rulers of the pre-independence period. The socio-
religious movements like Sree Narayana Dharma Paripalana, Nair Service Society etc.
gave their primary emphasis on education and at the time of independence - as a result
of all these and other minor factors - Kerala stood first among the states of India in
literacy and related aspects.
Modernity, if understood as a state of mind which is free from fears prejudices and
superstitions and endowed with a scientific attitude and approach, definitely had direct
causal relationship with the educational progress. Educational process spread ideals
like reason, liberty, equality, fraternity and logical thinking. From the field of
medicine to religion, modernity - even though colonial in essence - was ushered in
simultaneously and the backbone of the development was formed by education. One
may say that education was the cause and result of modernization at the same time in
this geographical area. We note progressive changes in the socio-political, religious
and economic structures – caste-ism, feudal land tenure, gender relations, semi-feudal
monarchy etc of the prior period experiencing changes - in the region during this
period as the light of modern western education and knowledge system penetrate the
society gradually. These changes further enhanced the socio-economic base of
education in return. Thus, the processes of development of education and
modernization were mutually reciprocal, complementary and directly proportional.
25 James Colman S., Education and Political Development (New Jersey:
Princeton,1965) 3
140
3.4.2 Education and Social Change
Social change implies not only the change of outer form of a community or society
but also in the social institutions as well as the ideas of the people living in that
society. The material aspects of a culture as well as the ideas, values and attitudes of
the people may change. The importance of the study of education and social change
arises from the fact that the process and pattern of society of the present period owes
its origin to a considerable extent from the developments taken before.
Among one of the most potent instruments of peaceful social change, education has
been in the limelight at present times to ascertain the nature and degree of its efficacy
as a harbinger of change. Changes may be good or bad but the effort of education is to
make the change desirable. Education must produce a readiness on the part of the
people to work for social change.
Educational progress can be seen behind many a social changes in the Pathanamthitta
district in a multifarious way. Many of these go in conformity with the trends in the
state as a whole.
Female education one of the most significant catalysts of the progressive social
changes in the district and the State in general. When females are educated, changed
attitudes are developed and imbibed by them and this can then be directly transmitted
to the next generation. Usually the hardest hindrance in the path of social change is
unlearning of the ideas and habits already imbibed and sometime cherished for
generations. When education of attitudes, ideas and ideals are limited to male
population, the female folk would continue to cherish the long-held but many a times
mistaken notions and habits and attitudes of many a generations and they would
probably transmit them to the younger generation which mainly they only bring up.
This is for two reasons: first, absence of education for women and thus lack of
modernization and change for their mindset and second, absence of education and the
consequent lack of chances to go out for study or work purposes and being confined to
141
the walls of house where the lady has to look after the kids. When educated, females
get a chance to go out for work or study. This coupled with education bring them
changed mindset and they would transmit it to the young generation. This avoids the
need to unlearning and thus hastens the process of social change.
In Kerala in general and in the District of Pathanamthitta in particular, female
education received great fillip due to historic and socio-cultural factors. The Nairs,
who constituted an affluent section of the Kerala society for ages practiced matrilineal
system of inheritance and polyandry was not unknown to them. This opened the doors
of public space for women in that community thus showed the way for the others too.
Being able to maintain a public space for themselves later helped women overcome
barriers to get formal education and public services in due course.
When men in large numbers embarked on migration for work, women had to maintain
the affairs of the public space in the locale and this further strengthened their role
there. Even though the female work participation is low, more and more women are
entering into the labour force from the district due to educational effects and gender
equality and this can often be a trigger of change.
Emergence of smaller families is a major result and cause of social change at the same
time. Education leads to better awareness and scientific knowledge on the one hand
and to enhanced ability to plan a family on the other hand. This results in smaller
families. Smaller families in return enable parents to educate their children better and
higher as their burden is lesser and their resources to spend on child per head are
larger. The structure of a small family in many ways brings about social change. The
Mean household size of the district reduced from 4.5 in 1991 census to 4.1 in 2001
census. Absence of grandparents, closer interaction between parents and children,
lesser burden on the shoulders of the parents, more importance to the fewer number of
142
children, their better bringing up, more leisure time, etc result and bring about changes
in the society.
3.4.3 Education and Social Mobility
Social mobility is usually defined as the movement or opportunities for movement
between different social classes or occupational groups.26
This concept can be seen
as a measure of equality of opportunity. The term social mobility refers to the ability
of someone to move from one position in the social order to another, from one class or
socio-economic status to another. It allows people to move up or down the class
ladder, upward or downward mobility. One of the most important aspects of social
change is the vertical mobility connected with it and this is related to education. Thus
the three variables Education, Social Change and Social Mobility are related to each
other.
Political power, marriage, education etc are some of the ways of facilitating social
mobility of which the primary channel for mobility is education. Social mobility has
been a central feature of modern systems of education. Since formal education is
essential for all established professions, education first of all maintains the class
positions and then acts as a mechanism for social mobility.
Education is a powerful instrument of social and cultural mobility. Socially
handicapped people as well as people suffering from poverty or illiteracy can be
uplifted or made socially mobile if they are given opportunities of education. The
educational policies of the State in general and the district in particular helped
26
Aldridge S., “The Facts about Social Mobility: A Survey of Recent Evidence on
Social Mobility and its Causes”, New Economy, 10 (2003): 189-193.
143
promote considerable vertical social mobility by making school education accessible
to students from all socio-economic strata.
Women are the foremost group enjoying the benefits of education and social mobility.
From house hold works and agricultural occupations, more and more women are
coming outside as higher education is being accessible to them. This change propelled
through educational achievements provides social mobility. Economists tend to
measure social mobility in terms of income and sociologists focus primarily on social
mobility in terms of occupational status.
3.4.4 Equality of Educational Opportunity
Educational institutions and their admission, selection and certification processes may
play a significant role in reducing or maintaining social inequalities. When the labour
pattern is analysed a change in the female employment pattern over the years can be
noticed.
The category “Other Workers” forms the major share of the workers in the district
Pathanamthitta. 60.9% of the male workers and 74.5% of the female workers come
under this category. Here the state average of the percentage of female workers
employed in the category is 66.0%. In other words, the percentage of female workers
employed in the category “Other Workers” in Pathanamthitta is 8.5% higher than the
same of the state average. The significantly higher representation of women in this
category may be due to the growth in employment in the tertiary sector and increase in
the literacy rate. Thus the changes in job pattern can be witnessed as a result of
education and equality of educational opportunity.
144
3.4.5 Educational History of the District
Pathanamthitta district has a unique position in the educational map of Kerala. The
district itself had a good educational tradition. Evidences are there stating that in the
earlier period itself educational institutions like Salais, Ezhuthupallis, Kalaris existed
here. The Thiruvalla Salai associated with Srivallabha Temple is well known for its
Gurukula system of Education. In the 19th
century several Sanskrit schools existed
here of which the most important was the “Vignana Santhayani‟, the one existed in
Omalloor.27
The contributions of Mulur S. Padmanabhapanikkar also deserve special
mention.
The princely State of Travancore had its own way of life and educational and social
institutions. Since the district was a part of the princely state of Travancore, She also
enjoyed all these benefits. The royal state of Travancore viewed Education as an
important factor in modernization and development and has given its Royal patronage
to Education. In Travancore education was started as a state programme as early as
1817, 53 years before England started that programme. The progressive policies
followed by the respective governments and the large scale economic expansions
resulting from the commercialization of agriculture have resulted in dynamism in the
educational field.
The role of Christian missionaries, who set up schools and colleges and imparted
western system of knowledge through the medium of English, was also important.
The missionaries were the pioneers in the field of female education as well as of the
depressed classes. The Christian missionaries took and started several schools that
27
Government of Kerala, District Plan Pathanamthitta. (Pathanamthitta: District
Planning Board, 2000) 323.
145
gave the required fillip to educational development.28
The missionary enterprise
helped partly to reduce the magnitude of the problem of educating the backward
classes.
The private enterprise in Travancore also helped the state in the educational endeavor.
The government has always pursued a liberal and progressive policy in the spread of
education and also encouraged other agencies in the field by providing them liberal
grants. The private enterprise comprised of individual efforts and efforts of institutions
like Nair Service Society, S.N.D.P and others.
Pathanamthitta District has two major educational divisions, viz, Pathanamthitta and
Thiruvalla. The Sub-Districts under Pathanamthitta educational district are Ranny,
Adoor, Pandalam, Kozhencherry,Konni and Pathanamthitta. Thiruvalla Educational
District has Pullad, Vennikkulam, Mallappally, Thiruvalla and Aranmula as Sub-
Districts.
3.4.6 Literacy
Literacy and educational attainments are the indicators of qualitative improvement in
human resources and can also be considered as an indicator of the economic progress
achieved by that country. Literacy, the basis of all education is as essential to survival
and development in modern society as food is to survival and development of human
body.29
28
Kunikrishnan A.C., “Educational Development in Kerala”, In Prakash B.A. (ed.),
Kerala's Economy: Performance, Problems, Prospects (New Delhi: Sage
Publications, 1994) 350.
29 Gethanjali, Social Change in India (New Delhi: Centrum Press , 2011) 31.
146
In the area of education, clear progress can be seen if one looks at the figures of
literacy rates over the years. The district had consistently maintained a much higher
literacy rate compared with other districts. Her literacy rate in 1991 and 2001 were
94.86 and 95.09 which shoulders above other districts except Kottayam. In 2011 it
again raised to 96.93% with second position in the State. Her female literacy rate of
93.29 in 1991 and 93.71 in 2001 and 96.26% in 2011 were unique against the state
average.
If we were to go back to the educational statistics of Travancore at the end of
nineteenth century, quite significantly, primary schools and vernacular schools had a
clear predominance. This pattern of distribution of schools was also helpful in
promoting mass literacy. Primary schools and vernacular education do help the
spread literacy more than secondary schools and education in English.30
The district of Pathanamthitta also deserves special mention in the following factors.
In 1991 Census, the Mallappally Taluk of the district is having the highest literacy rate
of 97.03% and the highest female literacy rate of 96.35%. In 2001 census also the
Taluk wise literacy rate shows a positive growth and above State average tendency.
Among the taluks in 2011 the highest literacy rate is noticed in Thiruvalla taluk
(98.09%) of this district. This is also true in the case of males (98.61%) and females
(97.63%) of Thiruvalla taluk. In the urban areas of the taluks, Thiruvalla taluk
continues to uphold its position as the taluk with the highest literacy rate among
females (97.99%).
30
Michael Tharakan, “Socio-Economic Factors in Educational Development: The
Case of Nineteenth Century Travancore”, Working Paper No.190, (Trivandrum:
Center for Development Studies, 1984) 5.
147
3.4.7 Educational Infrastructure
Enhanced social development is impossible without the required social infrastructure
as also complementary economic infrastructure. The latter is significant in
contributing to the efficient utilization of the former.31
The total number of schools in
the district in the year 1986-87 were 730, with Lower Primary (LP), Upper Primary
(UP) and High School (HS) being 431,134 and 165 respectively. The corresponding
Kerala figures were 6828, 2884, 2430 and the total number was 12142. Thus out of
the total number of schools in 1986-87, the lower primary schools, upper primary
schools and high schools account for 59.04%, 18.35% and 22.6% respectively as
against 56.23%, 23.75% and 20.02% respectively of all Kerala figures. In 90-91, the
figures changed to 58.73%, 18.56% and 22.71% in the case of the district and 55.7%,
24.1% and 20.20% in the case of the State.
However, the time trend reveals that the percentage of Lower Primary Schools has
declined over the period while the share of Upper Primary Schools and High School
has increased. There is a declining trend in the Lower Primary Schools in the district
up to 1994-95 and after that a slight progress can be seen even though the pace of the
progress is low. But the slight progress in the number of Lower Primary Schools is
due to the increase in unaided schools. Gradual decline in the enrollment in standard
one as a result of the drop in the birth rate and parents‟ desire for western education
are the reasons behind this.
When the total student strength is considered there has been a reduction of percentage
of students in Lower Primary Schools to total students. From 84-85 periods to 2005-
06 periods when we analyze the student strength it decreased continuously both in
31
Vijayamohanan Pillai N., Infrastructure, Growth and Human Development in
Kerala (Trivandrum: Center for Development Studies, 2008) 11.
148
Kerala as well as in the District but the decline is more felt in the district. The
presence of „uneconomic schools‟ and „protected teachers‟ are more prominent here.
This implies that the impact of demographic transition has been far greater in
Pathanamthitta compared to that of Kerala.
Regarding the type of Schools it can be seen that the educational sector is dominated
by Private agencies-both private aided and private unaided. As a consequence of
demographic transition and fertility decline the student strength has declined and that
adversely affected the Government as well as the Government aided section. There
has been also a rapid growth of schools affiliated to the Central Board of Secondary
Education (CBSE) and Indian Council of Secondary Education (ICSE).
Regarding the types of education changes in the structure of the education system is
seen at every level. The emphasis has been shifted toward higher and technical
education. The number of Polytechnics, Engineering Colleges, Medical and Para
medical institutions are increasing at a rapid pace. When the enrollment from 1989-90
to 1998-99 periods were studied out of the total 19755 students enrolled in Class I,
17555 reached standard X, i.e. 88.86%. But among the SC and ST such a high
percentage cannot be noted. In 1989, 3719 Scheduled Caste (SC) and 178 Scheduled
Tribe (ST) students were enrolled in standard one. But in 1999 only 2835 Scheduled
Caste students and 66 Scheduled Tribe students reached standard ten. The data reveals
that students reaching class ten are 76.23% in the case of Scheduled Caste students
and 37.08% in the case of Scheduled Tribe students.32
In 1999-2000, 175842
students were studying from classes 1 to 10. Out of this 89844 were boys and 85998
were girls. Among them there were 14454 Scheduled Caste boys and 13519
Scheduled Caste girls, the total constituting 27973. Among the total Scheduled Tribe
students of 1056, 559 were boys and 502 were girls.
32
Government of Kerala, District Plan Pathanamthitta (Pathanamthitta: District
Planning Board,2000) 325.
149
3.4.8 Impacts of Education
Education has contributed to the social and economic development of the district. If
we take the impact of education in the sphere of health it is clear that education,
particularly female education, which has been regarded by both academic researchers
and institutions as being the key that unlocks the door leading to fertility reductions,
has a fundamental influence on health and health seeking behaviour. Education has
also contributed to the decline in mortality rates. Besides this a strong correlation
between life expectancy and literacy can also be seen.
The achievements in the field of health have helped in achieving much renowned
changes in demographic transition. The reduction in birthrate as well as the death rate
has reduced the population growth to the minimum. The Travancore government
pursued certain policies in the field of education which contributed directly or
indirectly to the improvement in health status.33
The achievements of the district can
be cited as a continuation of these policies. The district is recording the minimum
growth rate even comparable with metropolitan cities.
Education has facilitated the large scale migration of people from the district whose
remittances sustain the economy. The old generation received their education from
these areas and migrated outside in search of better jobs. But now the major change is
that the new generation starts their life as out migrants in search of education. The
number of luxury buses from the district to neighboring states is the proof of this out
flow. Literacy is a foundational feature of Kerala's political culture, crucial in the
33
Krishnan T.N. and Kabir M., “Social Intermediation and Health Transition: Lessons
from Kerala”, Working Paper Number 251 (Thiruvananthapuram: Centre for
Development Studies, 1992) 22.
Panikar P.G.K and Soman C.R, Health Status of Kerala: The Paradox of Economic
Backwardness and Health Development, (Thiruvananthapuram : Centre for
Development Studies, 1984) 7.
150
creation of public opinion and essential to the consciousness of individual and
political rights that is so conspicuous a feature of social and political life in Kerala.
The decision making power of the women is also a by-product of education. It has
also role in political mobilization. Education, especially female education has a
profound role to play.34
High rate of female employment, higher age of marriage,
higher decision making roles, utilization of health care facilities are other advantages.
3.5 Health
According to World Health Organization, health is not just the absence of disease or
infirmity but is a state of complete physical, mental and social well being. The health
services help to make society physically and mentally sound and increase the capacity
of people to work more. Socio-economic development in a country is very much
linked with the improvement of overall health of the people. Improvement of health is
one of the primary goals of development. Better health has set the demographic
transition in motion.
In the mid-1970s, a group of researchers came to the conclusion that Kerala, a
relatively poor state, had made fairly impressive advances in health and education.35
Their study postulated that the sharp decline in birth rates in Kerala resulted from
societal changes in attitude to family size resulting from longer life expectation,
34
Mari Bhat P.N. and Irudaya Rajan S., “Demographic Transition in Kerala
Revisited”, Economic and Political Weekly, 25 (1990) 1957-79.
Panikar P.G.K, “Resources not the Constraint on Health Improvement: The Case
Study of Kerala”, Economic and Political Weekly, 3 (1979) 1802–1809.
35
United Nations, Poverty, Unemployment and Development Policy: A Case Study of
Selected Issues with reference to Kerala (New York: United Nations Department
of Economic and Social Affairs, 1975) 235.
151
reduction in infant and child mortality and female education. Kerala‟s achievements
in health care are far ahead of other states in the country and ranks first in attaining
low birth rate, infant mortality rate and in attaining high life expectancy especially of
females.36
The health of a nation is difficult to define in terms of a single set of measures. It is a
product of many factors and forces that combine and interact with each other. The
health status of any people can be measured in terms of birth rate, death rate, infant
mortality rate, expectation of life at birth etc. Measuring in terms of these health
indicators the district has commendable achievements in health standards.37
It
exceeds Kerala in the field of almost all Health indicators. The rapidly declining
growth rate, declining death rate, life expectancy especially female life expectancy,
acceptance of family planning programmes and fertility decline are some among them.
Better health has made the demographic transition more speedy, first ,increase in life
expectancy, next decline in general death rates, next sharper decline in infant mortality
finally a steeper fall in birth rate.
The health status of a population is a reflection of the socio-economic development of
the country and is shaped by a variety of factors like education, employment, level of
income,38
development of road networks and transportation, better utilization of health
care facilities etc. The private health facilities also contributed to a great share in the
health development of the area.39
Population Census, Civil Registration System and
36
Jean Dreze and Amarthya Sen, Hunger and Public Action (New York : Oxford
University Press, 1989) 221-25.
37
Gethanjali, op.cit. 44.
38
Subramanian S.V. and Kawachi Ichiro, “Income Inequality and Health: What
have We Learned so far?”, Epidemiologic Reviews, 26 (2004) 78–91.
39
Halstead S.B., Good Health at Low Cost (New York: Rockefeller Foundation,
1985) 57–77.
152
Sample Registration System are some of the most reliable source of time series
information on vital statistics in India. Regarding the major sources of the health
indicators Sample Registration system occupies the pivotal position.
3.5.1 Life Expectancy
Expectancy of life at birth is an important indicator for assessing the overall health
situation of any people and is one of the aspects of human development included in
the HDI. It represents the average lifespan of a new born and is an important indicator
for assessing the overall health situation of any population. The demographic
transition in Kerala brought about commendable improvements in the area of health
and life expectancy. In all the major reports40
Pathanamthitta exceeds Kerala in Life
Expectancy. Life Expectancy at birth for males is higher in Pathanamthitta among
the districts of Kerala. The figure is 76 which is 2.3 higher than the state average 73.7
which is quite notable.41
Because of natural advantage, women live longer than men
if they receive comparable care. Female life expectancy at birth is also higher in
Pathanamthitta compared to the state average. The advantage is of 1.9 years. But in
case of female life expectancy, Pathanamthitta is not in the first position.
3.5.2 Total Fertility Rate
The most commonly used measures of current fertility are the total fertility rate and its
components, age-specific fertility rates. The total fertility rate is the most significant
40
District Plan Pathanamthitta, op.cit, p.229
Human Development Report , op.cit., p.168
41 Human Development Report, op.cit.170.
153
demographic indicator in the analysis of the impact of national population
programmes - in particular, family planning programmes - on individual or group
reproductive behaviour.
Kerala made achievements in total fertility rate with a low per capita income. High
status of women, female literacy, age at marriage and low infant mortality were
thought to be factors behind the rapid fall in the fertility rate. Researchers in the field
of health have come to the conclusion that one of the most important factors behind
Kerala‟s remarkable performance in reducing fertility is the high level of female
education.42
The total fertility rate of the district was 1.7 in 1984–90, which further
declined to 1.5 in 2001. Pathanamthitta in 2001 registered the lowest total fertility
rate among the districts of Kerala which was 0.2 lower than the State average.43
In
other words the total fertility rate of the district Pathanamthitta was almost 12% lower
than that of the State average. It is one of the lowest fertility districts in the country
besides metropolitan districts such as Chennai (1.3) and Kolkata (1.4).
3.5.3 Infant Mortality Rates and Child Mortality Rates
A significant role in the dramatic decline in fertility in Kerala in the 1970s was played
by the sharp decline in infant mortality rates. Infant mortality rates are considered as
an index which measures the quality of life in any given population. Of all the
changes in the demographic sphere that have occurred in Kerala, the decline in infant
mortality rate is the most remarkable.
42
Mari Bhat P. N. and Irudaya Rajan S. “Demographic Transition in Kerala
Revisited”, Economic and Political Weekly, 25 (1990): 1957-79.
43
Christophe Z. Guilmoto and Irudaya Rajan S., “District Level Estimates of
Fertility from India‟s 2001 Census”, Economic and Political Weekly, 37 (2002):
665–72.
154
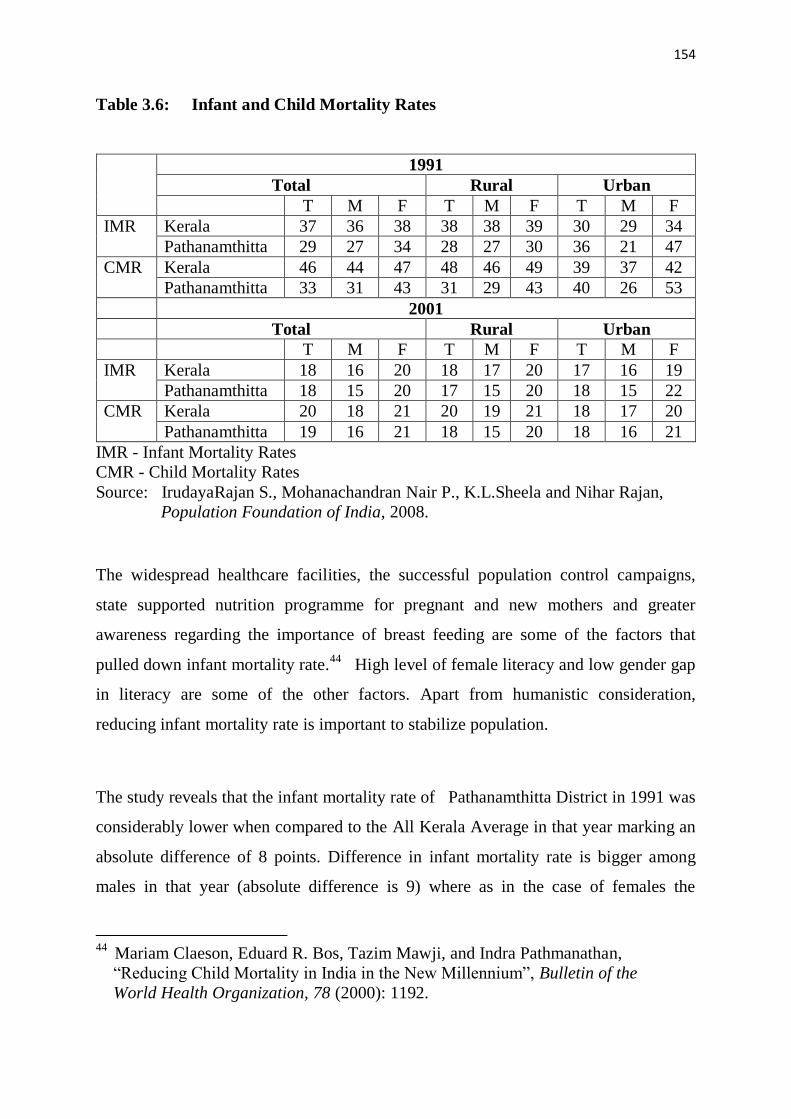
Table 3.6: Infant and Child Mortality Rates
1991
Total Rural Urban
T M F T M F T M F
IMR Kerala 37 36 38 38 38 39 30 29 34
Pathanamthitta 29 27 34 28 27 30 36 21 47
CMR Kerala 46 44 47 48 46 49 39 37 42
Pathanamthitta 33 31 43 31 29 43 40 26 53
2001
Total Rural Urban
T M F T M F T M F
IMR Kerala 18 16 20 18 17 20 17 16 19
Pathanamthitta 18 15 20 17 15 20 18 15 22
CMR Kerala 20 18 21 20 19 21 18 17 20
Pathanamthitta 19 16 21 18 15 20 18 16 21
IMR - Infant Mortality Rates
CMR - Child Mortality Rates
Source: IrudayaRajan S., Mohanachandran Nair P., K.L.Sheela and Nihar Rajan,
Population Foundation of India, 2008.
The widespread healthcare facilities, the successful population control campaigns,
state supported nutrition programme for pregnant and new mothers and greater
awareness regarding the importance of breast feeding are some of the factors that
pulled down infant mortality rate.44
High level of female literacy and low gender gap
in literacy are some of the other factors. Apart from humanistic consideration,
reducing infant mortality rate is important to stabilize population.
The study reveals that the infant mortality rate of Pathanamthitta District in 1991 was
considerably lower when compared to the All Kerala Average in that year marking an
absolute difference of 8 points. Difference in infant mortality rate is bigger among
males in that year (absolute difference is 9) where as in the case of females the
44
Mariam Claeson, Eduard R. Bos, Tazim Mawji, and Indra Pathmanathan,
“Reducing Child Mortality in India in the New Millennium”, Bulletin of the
World Health Organization, 78 (2000): 1192.
155
absolute difference is only 4 points. This difference is observed in the case of
Pathanamthitta when there is no such difference seen in the all Kerala average. Here
the absolute difference observed is only 2. Very notably, the figures vary
considerably between the urban and rural population. The total infant mortality rate of
rural Pathanamthitta in 1991 was 28 whereas in Kerala it was 38. The advantage of
Pathanamthitta is higher among rural males that are 11 points. The advantage of
Pathanamthitta rural females over Kerala rural female is 9 which is 2 less than the
same for Pathanamthitta. In the all Kerala average the infant mortality rate among
rural male is 38 and among female is 39 marking only an absolute difference of one
point between them. Coming to urban areas a difference can be noted. The total
infant mortality rate of Pathanamthitta is 6 points higher than that of Kerala average.
The difference in rural-urban infant mortality rate in Pathanamthitta registers a
tendency just opposite to the same in the all Kerala average. In Kerala level, total
urban infant mortality rate is 8 point lower than total rural infant mortality rate. On the
contrary in Pathanamthitta total urban infant mortality rate is 8 point higher than the
same for total rural infant mortality rate. Astonishingly among the males, infant
mortality rate in Pathanamthitta shows the tendency same as in the all Kerala average
and in a considerably advanced level. The total male infant mortality rate of
Pathanamthitta is lower than Kerala average in both rural and urban areas. The rural
male infant mortality rate of Pathanamthitta is 11 point lower than Kerala while the
urban male infant mortality rate of Pathanamthitta is 8 point lower than the Kerala
average.
The entire contrasting trend is seen in the case of the urban female infant mortality
rate. The urban female infant mortality rate in Pathanamthitta is 13 point higher than
the Kerala average. Coming to 2001, we see the difference in infant mortality rate
between Kerala averages and figures for Pathanamthitta thinning away to bring the
figures as well as trends roughly the same. The total infant mortality rate is same for
156
Pathanamthitta and Kerala. Only the female urban infant mortality rate is higher in
Pathanamthitta when compared to Kerala average. But the difference is only 3 points.
Comparing the 1991 and 2001 results it can be seen that in the all Kerala level, total
infant mortality rate got reduced to less than 50% over the 10 years. Infant mortality
rate in Pathanamthitta also got considerably reduced from 29 to 18. The development
in reducing infant mortality rate in all Kerala level was quite quicker than in the case
of Pathanamthitta over the period 1991 to 2001. Pathanamthitta could not catch up
with the race of Kerala in average.
Infant mortality rate is a robust indicator of health of the population despite being
limited only to a sub group of population.45
It reflects adequacy of nutrition
available to infants and women of reproductive age-group and utilization of protective
health care services and hygienic conditions like availability of clean water and
sanitation. Infant mortality rate is an important indicator of level of human
development and is considered an indicator of overall socio-economic development of
a society.
3.5 .4 Child Mortality Rate
Regarding Child Mortality Rate also Pathanamthitta„s figures were low when
compared to State average. The advantage of Pathanamthitta is more among males
than among females. Interestingly this low child mortality rate of Pathanamthitta is
due to the developments in rural areas. The rural child mortality rate of Pathanamthitta
in 1991 was 31 which were 17 points lower than the Kerala average. On the other
45
Ankush Agrawal, “Infant Mortality in India:1972-2007”, Journal of Social and
Economic Development, 12 (2010): 115-140.
157
hand the child mortality rate is more or less the same in the case of the urban Kerala
and urban Pathanamthitta.
Notably the advantage of Pathanamthitta in child mortality rate is confined to rural
areas only because of an increased child mortality rate among urban females. Among
urban males, child mortality rate in Pathanamthitta is 11 points lower than the Kerala
average. But female urban child mortality rate in 1991 in Pathanamthitta was 11
points higher than the state average. It is this high rate of child mortality rate among
the females of Pathanamthitta as against the state average that negates the district‟s
advantages in urban male child mortality rate. In 1991, female urban child mortality
rate of the district was more than 200% of the male urban child mortality rate of the
district.
As in the case of Infant mortality rate, over the 10 years from 1991 to 2001 child
mortality rate of Kerala average registered a higher reduction as against the figures for
Pathanamthitta to bring the figures more or less the same for both the state and
district. Child mortality rate is somewhat similar for Pathanamthitta and Kerala in all
its details like total, total male, total female, urban male etc. The reduction of child
mortality rate in all Kerala level is almost twice that of the Pathanamthitta district in
many of the above said categories. In other categories also the child mortality rate
reduction is considerably higher as in with the all Kerala average. In the case of urban
female only child mortality rate of Pathanamthitta achieved a higher reduction than
the all Kerala average.
3.5 .5 Birth Rates and Death Rates
Demographic data, which is very much useful for planning programme
implementation, is received through various ways, of which one of the important
158
sources is Registration of births and deaths. The Registrar General of India initiated a
Sample Registration of births and deaths in India on a full scale during 1969-70, to
provide reliable estimates of fertility and mortality in the absence of dependable vital
rates from the civil registration system. The registration records are primarily useful
for their value as their legal documents and secondarily as a source of vital statistics.46
In most of the studies birth rate is the lowest in Pathanamthitta district. In the
District Plan of 1997 Pathanamthitta registers a birth rate of 12 as against a Kerala
figure of 17.9
3.5.6 Crude Death Rate.
Crude death rate shows the frequency of deaths in the population and thus the overall
health status of a population. There was an overall decrease in mortality rate in all age
groups. High literacy rate, development of health consciousness etc can be cited as the
main reasons. In all the periods the crude death rate of Pathanamthitta was lower than
the state average. In 1994-2001 crude death rate was lowest in Pathanamthitta among
the districts of Kerala when the state average was 17.1. It means that crude death rate
of Pathanamthitta was 15.2% lower than that of the state average.
Death Rates and Birth rates are analyzed from Vital Statistics Reports. Over the
period from 1985 to2005 Death Rate in Pathanamthitta district has been almost static
with slight changes over years. It has been varying from 4.92 to 7.82. What is
noticeable specifically is the fact that all through the period death rate has been
doubled or even tripled in the urban Pathanamthitta when compared to the rural. Birth
Rate but shows a more declining tendency occasionally with a slight reverse trend in
some years. Birth Rate was 19.76 in1985. For the next four years it showed declining
slightly to bring it down to 17.84 in 1989. The year 1990 registered a slight reverse
46
Vital Statistics Division, Annual Vital Statistics Report 2008, (Trivandrum:
Department of Economics & Statistics, 2010) 8.
159
tendency. Then again the progressive decline in birth rate continued up to the year
2000 to bring the figure to the lowest 14.32 level. Generally speaking, the Birth Rate
in the district has shown a declining tendency from 1985 to 2000 and then it has
become somewhat stable. Notably, just like the Death Rate, in fact in a more increased
level, Birthrate was higher in urban parts of the district when compared to rural side.
The huge difference in Birth Rate in Rural and Urban areas may be due to the possible
fact that child births often take place in the hospitals in urban areas and even the
women from rural Pathanamthitta are delivering their kids in the urban hospitals.
3.5 .7 Couple Protection Rate
An important indicator showing the performance of family planning programmes is
the percentage of couples currently protected by various methods. Regarding the
Couple Protection Rate, during the district formation period it was 42.7 as against the
state average of 36.8. A difference of 5.9 points only can be seen. Gradually it
increases and by 2004 a difference of 18.2 points can be seen, but regarding the rank
of the district among other districts of the State, to it was the fifth highest in1981. In
1990 the position declined to eighth and to tenth in 1992. In 1981 it was 5.9 above the
state average but fell 2.3 below state average in 1990 and 2.4 by 1992. In 1999 it was
almost in par with the state average, just 0.93 below the state average but in 2004 a
clear cut increase had taken place. The couple protection ratio can be identified as a
prominent reason for fertility decline.
3.5.8 Health Infrastructure
Health development in Kerala, comparable to that of high-income countries, has been
the outcome of investment in health infrastructure in public, private and co-operative
160
sectors, along with people‟s health awareness and connectivity.47
Development of
health infrastructure ensures a country of healthy manpower for production of goods
and services. Health infrastructure includes hospitals, doctors, nurses and other Para-
medical professionals, beds, equipment required in hospitals and a well-developed
pharmaceutical industry. Other than the presence of infrastructure facilities,
utilization of the same is also important which can be explained in terms of
accessibility, better transportation facilities and better literacy.
There is a fairly good distribution of health facilities in the public sector as well as
private sector with the private sector fast growing in the urban as well as rural areas of
the district. Three systems of medicine viz., Allopathic, Ayurvedic and Homoeopathic
co-exist here. The facilities available for allopathic treatment in the public sector
include General Hospital, District Hospital Taluk hospitals and numerous Primary
Health Centres and sub centres under them. There are also institutions for infectious
diseases such as tuberculosis and leprosy. Community health centres and Family
Welfare Centres also work properly in the district.
During the district formation period the total number of institutions was 47 in the
Allopathic section which includes 4 hospitals, 11 Primary Health Centres, 31
dispensaries and 1 TB Centre. In the 80‟s itself the number started increasing.
Primary Health Centres registered a shoot whereas dispensaries reduced in numbers.
The district also supported other systems of medicine - Ayurveda and Homeopathy.
The three systems together have 227 medical institutions in the district.48
Of these
158 belong to allopathic including 10 hospitals, 7 dispensaries, 54 Primary Health
Centres. Ayurveda supports 14 hospitals and 31 dispensaries where as the
Homeopathic field had 26 dispensaries. Panchayat Statistics of 2006 states that the
47
Government of Kerala, Human Development Report (Thiruvananthapuram: State
Planning Board, 2005) 34.
48 Government of Kerala, Panchayat Statistics 2001 (Thiruvananthapuram:
Directorate of Economics and Statistics, 2001) 74.
161
total number increased to 425 out of which the share of Allopathic hospitals,
Ayurveda and Homeopathy was 343, 55 and 27 respectively.49
In the health sector the role of the private sector is significant and it has grown
phenomenally with facilities in all three systems of medicine. The private sector has
been particularly successful in providing facilities for sophisticated tertiary care.50
Both the three systems together have 465 medical institutions which is almost double
the number in the government sector. Allopathy was in the lead with 169 institutions
whereas Ayurveda and Homeopathy shares 95 and 201 respectively. In 2006 the
number increased to 495 i.e., 195 in Allopathic 95 in Ayurvedic and 207 in
Homeopathic.51
The density of government medical institutions (per lakh of
population) is higher in Pathanamthitta, largely because population density is lower.
The number of hospital beds was largely confined to the Allopathic section. In the
1983-84 period the district started with 707 beds in the government sector which had
increased to 1086 in 200152
and later to 1474 in 2006.53
Ayurveda was far behind in
this regard with only 50 in 1983-84 and to 58 in 2001 and 174 in 2006. The private
sector plays a pivotal role in medical care with three times the number in the
government sector. Panchayat Statistics 2001 and 2006 reports 3002 and 5750 beds
in the Allopathic section.
49
Government of Kerala, Panchayat Statistics 2006 (Thiruvananthapuram:
Directorate of Economics and Statistics, 2006) 104.
50
Vohra U., “Family Planning Success based on Equity: Human Development,
Health and Governance in the Indian State of Kerala”, Health for the Millions, 25
(1999) 40-42.
51
Government of Kerala, Statistics for planning 2006 (Thiruvananthapuram:
Directorate of Economics and Statistics, 2006) 26.
52 Panchayat Statistics 2001, op.cit., 403.
53
Panchayat Statistics 2006, op.cit., 104.
162
Thus to sum up, Pathanamthitta district was the first Polio-free district in India
(declaration on Oct 2, 1994), also the first district in India implementing eradication of
Tuberculosis with the help of World Bank and the district has commendable
achievements in the demographic area.54
These achievements especially in the field
of mortality and fertility were attributed to sufficient health coverage. The health
development is generally attributed to inter sectoral factors such as the spread of
education, political awareness, development of road networks and transportation and
social movements. Rather than the geographical distribution of health care facilities
better utilization of it is more important. Fertility rate is influenced by a variety of
factors. Socio-economic characteristics of the population influence fertility. Age
structure of the population has a major effect on fertility. If more people in a society
fall into the reproductive age group that society is bound to have a high fertility rate.
Rising per capita income has been associated with better health and lower fertility all
over the world.55
Besides income factor non income factors also play their roles in
lowering infant and child mortality as well as fertility.56
Education especially female
literacy is a factor in the field of health. Amarthya Sen attributes Kerala‟s better
social indicators to state involvement in education which started in 1817. It has been
54
“Focus”, Malayala Manorama Daily, 31 October 2007.
55
Alok Bhargava and Jiang Yu, “A Longitudinal Analysis of Infant and Child
Mortality Rates in Developing Countries”, Indian Economic Review, (1997)
141-153.
Lant Pritchett and Lawrence H. Summers, “Wealthier is Healthier”, The Journal of
Human Resources, 31 (1996): 841-68.
56 Murthi Mamta, Anne-Catherine Guio and Jean Dreze, “Mortality, Fertility and
Gender Bias in India”, Population and Development Review 34 (1996): 745-82.
Anrudh K. Jain, “The Impact of Development and Population Policies on Fertility
in India”, Studies in Family Planning, 16 (1985): 181-198.
Leela Visaria, “Infant Mortality in India - Level, Trends and Determinants”,
Economic and Political Weekly, 34 (1985): 1447.
163
considered a very important determining factor for effecting declines in mortality57
, in
reducing fertility58
in reducing infant mortality rates59
and making changes in
demography.
Higher female literacy in Kerala has contributed significantly toward higher utilization
of maternal and child health services by the women of the state. They are also less
inhibited regarding physical examinations and more open to traveling to the health
centers. Indirectly higher literacy has contributed to a higher level of political
participation of the rural poor, which, in turn, has forced the state government in the
post-independence era to cater to their health needs along with other needs. High
levels of female literacy, rapid gains in the sanitation front and an extensive network
of modern medical care institutions, both in rural and urban areas have served as push
factors in accelerating health development. The district was much ahead of other
districts in the State with regard to literacy. In both the two censuses the district
stood in the second rank.
Work participation rate has shown a negative relationship with fertility. When we
analyze the work participation rate of the district we get a dismal picture that it is
below the state average. Male work participation rate of Pathanamthitta was 48.0 in
1991 whereas the Female work participation rate was 12.3. The male work
57
Caldwell J.C., “Routes to Low Mortality in Poor Countries”, Population and
Development Review 12, (1986) 171-220
Soman C.R., “Nutrition and Health Development - Lessons from Kerala”
Proceedings of the Nutrition Society, 51 (1992): 81-92.
58
Mari Bhat P.N and Irudaya Rajan S., “Demographic Transition in Kerala
Revisited”, Economic and Political Weekly, 25 (1990): 1957-79.
Zachariah K.C., Irudaya.Rajan, Gpoinathan Nair and Mishra U.S., Demographic
Transition in Kerala in the 1980’s, (Thiruvananthapuram: Centre For
Development Studies, 1994) 74.
59
Murthi Mamta, Anne-Catherine Guio and Jean Dreze, op.cit. 42.
164
participation rate was almost 4 times the female work participation rate in 1991.
Changes in the female work participation rate in Pathanamthitta district from 1991 to
2001 show very different tendencies. In this head, Pathanamthitta marked a growth by
0.7%. The immunization programs launched by Kerala since late 1970s seem to have
played a great role in the development of the district. The expansion of immunization
into the whole of Kerala and the district in particular in the 1980s must have played an
important role in bringing down infant mortality. Good health is an essential
prerequisite not only for women‟s participation in economic activities but also for
their better control of their own lives.60
The fertility and mortality rates have declined
significantly over a period of time.
3.6 Family
Family, a basic unit of study in most Social Science disciplines, may be broadly
defined as a unit of two or more persons united by marriage, blood, adoption, or
consensual union, in general consulting a single household, interacting and
communicating with each other.61
Family in its various forms has been recognized
as a basic unit of society and social structures and is a link between individual and
community. It is a basic, cohesive, and integral unit of the larger social systems. The
family is the basic and important unit of society because of the role it plays in
generation of human capital resources and the power that is vested in it to influence
individual, household, and community behavior.62
60
Lakshmy Devi K.R., “Education, Health and Women‟s Empowerment - Kerala‟s
Experience in Linking the Triad”, Gender Issues and Empowerment of Women,
(2007): 1-13.
61
Desai M., Concepts and Conceptual Frameworks for understanding Family.
Enhancing the Role of the Family as an Agency for Social and Economic
Development, (Bombay: Unit for Family Studies Report, 1994) 16-41.
62
Sriram R., “Family Studies in India: Appraisal and New Directions”, In T.S.
Saraswati & B. Kaur (Eds.), Human Development and Family Studies in India: An
Agenda for Research and Policy (New Delhi: Sage Publishers, 1993) 122-128.
165
Families are undergoing rapid changes in their structure, functions and
responsibilities. In the economic sphere, the patterns of production, distribution and
consumption have changed greatly. Urbanization, commercialization, Migration to
foreign countries, change from caste oriented and hereditary occupations to new
patterns of employment has left their impact on the family. These changes in the
socio-economic milieu of our society have led to changes in the structures, functions,
roles, relationships and values of the family.
Family structure has changed markedly over these years. Families and households
become smaller, with frequent changes in size and composition. Globalization,
modernization and changes caused by demographic transition, internal and
international migration are some of the factors affecting families nowadays. Various
functional changes are also taking place in the family system. Families have been
attributed with biological functions such as reproduction, social functions like caring
the old, sick, and socialization of children etc., and Economic functions like catering
the needs of the members. Changes are taking place in all these arenas. Notable
changes have also been occurring in the life style, fashion, food habits, types of
residences etc.
It is through education in the family which is both of informal and formal types that
the individual acquires his primary and secondary values. Hence the role of family as
an agency of education cannot be ignored. The institution of family can be utilized in
bringing about desirable social changes if we at the same time keep in view its
education role. Human development can, thus, be enhanced by enriching family life.63
Makkathayam or the patrilineal system was the prevalent form of succession in the
civilized society. In Travancore, Marumakkathayam or the matrilineal system of
inheritance was in vogue among certain communities. The Nairs and Ezhavas of the
district also practiced the system. Due to rapid socio cultural and political changes
taken place in the state and especially with the spread of education, matrilineal system
63
Desai M., “Towards Family Policy Research”. Indian Journal of Social Work, 56,
(1995): 225-231.
166
declined in tune with that of the State.64
The concept of family has also undergone
extreme changes. As these societies shifted to patrilineal system men assumed the role
of providers. As a result of the changes households became less extended and more
nuclear and transition from joint families to nuclear families can also be witnessed.
Since a family may be defined as a group of persons related to a specific degree
through blood, adoption or marriage, comparative data in the broad definition of the
term is not available. The available statistics relate to households, defined by location,
community or living arrangements. The changes in family structure are amply
reflected by the National Census Data. When the last three census data are analyzed
the number of households grew at a faster pace than the population. This indicates
that nuclearization of families is growing in the district.
The district which is forefront in demographic transition and migration rates, changes
in family structure and functions occur mainly due to these factors. Over the years,
changes have been taking place in the socio-economic and demographic dimensions.
Low growth rate in population, low birth and mortality rate, higher life expectancy,
changes such as reduction in the number of children a couple has, changes in the age
structure of the population are some major factors that had their impact on the
traditional family system when the district is considered. Reduction in population
growth occurred due to fertility levels in turn result in reduction in family size.
Family is a major factor in the survival, health, education, development and protection
of children. Reduction in the number of children a couple has definitely made the
family more children centric.
64
Nagam Aiya V., Travancore State Manual, Vol. II (Trivandrum: Government
Press, 1906) 363.
167
Demographic transition also makes important changes within the family perhaps not
always favorable.65
In the developing societies due to great zeal for social change,
social institutions like family have suffered a lot. The old and aged people have to live
separately when the young son becomes employed and has his own family. This has
created problems not only for old parents but also children in the family.
Pathanamthitta and Kottayam are more advanced than other districts in their
demographic transition and naturally have more old age homes than other districts in
the State.66
The demographic transition provides an opportunity for women to enter into the
labour market. Due to drastic decline in fertility women had adequate extra time to
spend for productive employment outside. From being unpaid family workers, they
become wage earners. Such change is likely to enhance the independence of women
and to strengthen their role in decision making within the family. As a result there
were significant familial changes especially in the relationship within the family and
between generations. The female age at marriage went up, the proportion not married
have significantly increased, the elder care become difficult for the children etc. All
these changes had profound influence on the family relationship and particularly for
the elderly.
Migration both internal and international is yet another major factor that caused
changes in the family set up of the district. This factor itself is challenging family
structures. The migration of the younger generation has a significant impact on the
inter-generational contract and the dynamics of the family left behind. The prospect
of the younger people living with their parents is becoming increasingly difficult if not
65
James K.S. and Irudaya Rajan S., “Implications of Demographic Transition” In
Kerala in Demographic Changes and Challenges to Development, (ed.) T.M.
George (Muvattupuzha: Nirmala Academic and Research Publications, 2008) 43.
66
Zachariah K.C., Mathew E.T. and IrudayaRajan S., “Social, Economic and
Demographic Consequences of Migration on Kerala”, Working Paper 303,
(Thiruvanathapuram: Centre For Development Studies, 2000) 52.
168
impractical, as the search for employment opportunities take them more to locations
away from their homes and to distant lands
Migration has fundamental implication for women and children. They suffer when the
male migrates either alone or with them. However, it has also been suggested that
rather than family disintegration, male migration could lead to more capable and self
confident women. The female headed households have become a steadily growing
phenomenon. The increase in female headed households could be due to variety of
reasons including widowhood, migration, non-marital fertility and marital
instability.67
The district which is ahead of the state in demographic transition
especially sex ratio and growth rate of population and female life expectancy, the
number of widows are likely to be more.
Likewise, the district which is in the forefront of demographic ageing the other group
of people who are adversely affected are the older generation. In the Indian context,
responsibility for care of the elderly is primarily borne by members of the family.
Besides the migration factor the other major factor that makes changes to the life of
elderly is the entry of women, the traditional caregivers, to labour market. Even
though the opportunity existing in the district and the state hampers the female entry
into the labour market, more and more women are now in the employed category.
Changes are taking place in women‟s roles in families. Even though the female work
participation of the district is low, the numbers of educated and employed women are
increasing. Here too the persons who are suffering the most are the elderly. Also the
breakup of the traditional joint family system to nuclear one also had its repercussions
on the elderly. Current trends indicate that there is a definite change in the basic
system of family, especially the role of elders. Elderly people experience a stage of
transition from independence to interdependence, then to total dependence, which
67
Indralal De Silva, “Family Transition in South Asia: Provision of Social Services
and Social Protection”, Asia-Pacific Population Journal (2005): 13
169
produces a crises and tension for all generations.68
Earlier they were given a high
status in family and always acted as the chief decision makers. But the breakup of the
traditional joint family system coupled with migration and female work participation
made the life miserable. The number of old age homes in the district testifies this. The
economic hardships are yet another problem of the elderly. As a result of ageing they
were exempted from formal occupations and become vulnerable to economic hazards.
All these point to the growth of an alternate family pattern here. Such families are,
therefore, not mere lifestyle experimentations but come out of certain circumstances.69
As the scale of labour migration grows ever larger by the day, transformation takes
place in the lives of the global migrants, their families as well as the local areas from
which the migrant flow initially took off. The increased physical mobility among
family members has resulted in families being spread across the globe. The emergence
of new family forms like transnational families calls for reorganization of the lives of
those staying behind - often women, children and elderly. Meanwhile aged family
members constitute a significant number within these transnational migrant families.
A number of changes have been observed in the patterns of marriage such as age at
marriage, inter-caste marriage, etc. A substantial increase of the proportions never
married, among both males and females, at young ages, has been noted in many
censuses. A consequence of the increase in the proportion of never married young
adults is the gradual upward trend of the average age at marriage. A major area of the
family that has been affected by the social and economic changes in the society is that
of the role performed or expected of the different members of the family. The role of
the father, the mother, the husband, the child and the elders in the family has all
undergone various changes.
68
Steinmetz S.K., Duty Bound: Elder Abuse and Family Care (Newbury: Sage
Publications, 1988) 73.
69
Bharat S., Alternate Family Patterns and Policies: Alternate Family Pattern
(Bombay: TISS, 1994) 72-76.
170
3.7 Women in Society
Women have been an integral part of the social structure not only because of their
importance in the reproduction and caring of human race but also by virtue of their
significant contribution to socio-economic progress. Gender analysis views women
and men in terms of the roles they play in society, roles that change as societies
change. Improvement in the status of women is a crucial factor in the development of
a region.
The study of social status of women is important because it forms one of the most
trustworthy and reliable indices of the state of society and indicates the nature and
direction of social change.70
The socio economic status of women in Kerala related
to that of men reveals that the position of feminine folk in the State is much advanced
than that in other states of the country. Laudable achievements are there in the socio-
demographic realms, such as favourable sex ratio, high levels of literacy, high health
standards unseen in other parts of the country.71
Thus, it has become a commonplace
in development studies literature that the agency of women has contributed
significantly to high social development in Malayalee society. The women in
Travancore also enjoyed a high status thanks to the ruling class, the Christian
missionaries and the socio reform movements.
For measuring the status of women in the district the following indicators are used.
Sex ratio, literacy rate and access to education, work Participation rate and
improvements in the field of health.
70
Abha Chauhan, Tribal Women and Social Change in India, (Bombay: A.C.
Brothers, 1990) 34.
71
Robin Jeffrey, Politics, Women and Well-being: How Kerala became a Model
(New Delhi: Macmillan, 1993) 11.
171
3.7.1 Sex Ratio
Sex Ratio is the most credible pointer towards status of women in a society. Declining
sex ratio for a population has generally been diagnosed as an indicator of worsening
female advantage.72
Pathanamthitta district has a sex ratio favoring the female
population. The sex ratio of the district has steadily increased over the preceding
decades. In all the censuses in the study period females out number males and the
district has the top most position in the Kerala State in this regard.
In Pathanamthitta district, according to 1991 Census there are 1062 women for every
thousand men against the all Kerala figure of 1036. The district had the second
position in the State too. In 2001 the district improved its position to rank one with
1094 females per thousand males as against 1058 in the State. In 2011 it again raised
to 1129 with the second position in the State. Large scale male outmigration from the
district for better job opportunities coupled with women literacy and improvements in
health indicators, low infant mortality rate, long life expectancy etc can be cited as
reasons behind this.
3.7.2 Access to Education
Education, a fundamental human right confers various advantages on individuals.
Besides economic and political development, Education‟s multi dimensional
advantage also includes social development. This is more possible when gender equity
is achieved. Gender justice gets a boost when women have access to education, which,
by enhancing women‟s knowledge and employment capacity, increases their sense of
autonomy and self worth. When Education acts as a vehicle for professionalization
72
Dhairiyarayar Jayaraj and Sreenivasan Subramanian, “Women‟s Wellbeing and the
Sex Ratio at Birth: Some Suggestive Evidence from India”, The Journal of
Development Studies, 40, (2004): 91-119.
172
and social mobility among women an upward movement can be witnessed. In Kerala
in general and in the District of Pathanamthitta in particular, female education
received great fillip due to historic and socio-cultural factors.
In the process of human development, literacy‟s role cannot be minimized.
Attainment of literacy improves people‟s productivity by strengthening their
knowledge and skill base, and this, in turn, increases their income. In the case of
female literacy it enhances the capacities of women choices about their lives and
about their rights as citizens in a democracy, open up avenues of knowledge, give high
health awareness, employment capacity as well as equity and social justice.
Pathanamthitta district has a high position in the case of literacy especially female
literacy. In 1991, 2001 and 2011 census, the district had a female literacy rate above
the State average. In 1991 it was 93.29, 93.71 in 2001 and 96.26 in 2011. In that place
Kerala had 86.17, 87.86 and 91.98. In the two Censuses it retained the second
position in the State and in the last one bagged the top position.
3.7.3 Health
Health is one of the important indicators for assessing the status of women in any
society. The state of an Indian woman's health is intrinsically related to her socio-
economic status and affects all aspects of her life. Nutrition levels remain low in the
lower socio-economic groups. This is mainly due to poverty and the burden of family
responsibilities. In the lower middle income groups, the general neglect of food
intake, accentuated by discrimination in favour of males, has also resulted in low
levels of nutrition.
Access to better education in a way has positive effects on the health standards of the
people. The major indicators of good health like more life-expectancy among females,
less fertility rate, less maternal mortality rate etc point to the health standards of
women in the district. Because of natural advantage, women live longer than men if
173
they receive comparable care. Female life expectancy at birth is also higher in
Pathanamthitta compared to the State average. The advantage is of 1.9 years.
3.7.4 Participation in the Labour Force
In the modern society, women have assumed greater responsibility, both at home and
in the world of work. With progressive change in the economic structure of the
country, more and more women are living out of their homes in search of
employment. The new role of women of sharing in the income earning activity has
come to co-exist with their primary status as mothers and house wives. Consequently,
working women are expected to be both traditional and modern in domestic and
public jurisdictions.73
The Work Participation Rate of a State indicates to a great extent the economic
empowerment of women in the society. There still exists a large difference between
the work participation rates of males and females, which is an important aspect of
gender inequality.74
The status of women is intimately connected with their economic
position, which in turn depends on opportunities for participation in economic
activities. Women in the state in spite of enjoying better status and position compared
to other parts of the country have low levels of participation in economic activity.75
73
Deepa Mathur, Women, Family and Work (New Delhi: Rawat Publication, 1992)
6-7.
74
Lakshmy Devi K.R., Education, “Health and Women‟s Empowerment - Kerala‟s
Experience in Linking the Triad”, Gender Issues and Empowerment of Women,
(2007): 1-13.
Lakshmy Devi K.R., “Education, Employment and Job Preference of Women in
Kerala: A micro-level case study”, Discussion Paper No. 42, Thiruvananthapuram:
Kerala Research Programme on Local Level Development Centre for Development
Studies, 2002) 7.
75
Sumit Mazumdar and Guruswamy M., Female Labour Force Participation in
Kerala: Problems and Prospects (Mumbai: International Institute for Population
Sciences) 10.
174
Female Work Participation Rate of Pathanamthitta marked an exceptional growth
during the period 1991-2001 even though it stood only in the 12th
place among the
districts of Kerala. Changes in the female Work Participation Rate in Pathanamthitta
district from 1991 to 2001 show very different tendencies. In this head,
Pathanamthitta marked a growth by 0.7%. This growth is significant because it was
achieved when 9 districts of Kerala showed decline in female Work Participation
Rate.
Regarding rural woman Work Participation Rate Pathanamthitta stands 11th
among the
districts of Kerala when the Work Participation Rate of rural women in 1991 is
considered. It was 12.6 in 1991 and the figure is only slightly higher (0.1) than the
total woman Work Participation Rate. But the district marks a 1.8% positive change
when compared to the state average. Regarding the urban women Work Participation
Rate in the year 1991 it was 11.8. In 2001 we find her almost in the same position
and figure in comparison with the other districts of Kerala. She marked only a 0.2%
of increase over the period. We may note that the growth in urban women Work
Participation Rate of Pathanamthitta from 1991 to 2001 falls 0.3% behind the state
average of change over the period when the rural woman Work Participation Rate of
Pathanamthitta registered an increase of 1.8% above the state average of Kerala. The
Work Participation Rate of female main workers show same tendency during the
period. When a majority of districts in Kerala showed considerable decrease in the
Work Participation Rate of female main workers, Pathanamthitta almost maintained
status quo with a slight decline by 0.2%.
Pathanamthitta had attained 0.9 point increase in the Work Participation Rate of
female marginal workers over the period 1991 to 2001. The rate of change in
Pathanamthitta‟s Work Participation Rate of female marginal workers from 1991 to
Mridul Eapen, "Fertility and Female Labour Force Participation in Kerala",
Economic and Political Weekly (1992): 2179-88.
175
2001 is 0.5 points below the state average. The demise of many traditional household
industries such as handloom and weaving may account for the lower representation of
women in the marginal category, at least in the rural area of Kerala.76
In the all Kerala
level, the tendency of change in the Work Participation Rate of female marginal
workers is opposite to the tendency of change in the Work Participation Rate of
female main workers. Pathanamthitta showed a tendency of change similar to that of
the all Kerala tendency, but with a lesser degree of change.
In the case of Pathanamthitta district the role and status of women in the district is
influenced by a variety of factors. The geographical area included in the present
Pathanamthitta district had a good tradition in female education pioneered by
missionaries and other socio religious reformers. Now the district with a high
demographic advantage, and a lower fertility rate even compared to metropolitan
cities in India, the role and status of women is changing. Women had adequate extra
time to spend for productive employment outside. Even though the female work
participation is low, that does not mean that the supply of female labour is low since a
certain percentage of women would be unemployed. Due to educational effects and
gender equality more women are changing their traditional occupational structure and
this can often be a trigger of change.
Significant familial changes especially in the relationship within the family and
between generations and especially for the elderly are being witnessed in the district.
The district which is ahead of the state in demographic transition especially sex ratio
and growth rate of population and female life expectancy, the number of widows are
more.
76
Mridul Eapen, “Women in Informal Sector in Kerala: Need for Re-examination”
Economic and political weekly (2001): 2390-2392.
176
Education, especially female education pioneered by the missionaries has a profound
role to play in the condition of women folk of the district. It is the key factor for
women to be employed. Now gender equity opens avenues for more women to higher
education. Besides this, education gave a chance for females to go out for work or for
further study. This triggers social mobility and upward mobilization among the
women folk. Female education acts as a good catalyst for progressive social changes
in the district like changes in family and life patterns and changing social norms,
improvement in scientific knowledge and ability to plan a family.
The district with a high migration prevalence ratio, migration had its effects on
women in the district. Migration and its consequent income effect can be cited as a
reason for the lower female work participation in the district. Migration is also the
reason for the increasing female headed households in the district. When men in large
numbers embarked on migration for work, women had to maintain the affairs of the
public space in the locale and this further strengthened their role there.
The Gender Development Index which is often used to state the development of the
countries of the world by the Human Development Report place the district in the
pathway of the State. Except life expectancy in all other indicators males are ahead of
females. But a comparison with the State reveals that in all the indicators except Real
Percapita Income and Gross Enrollment, the rates of the district are above the State
average.
3.8 Religion
Religion is an important characteristic of the people in any country. As far as religion
is concerned, Pathanamthitta district is special in many ways. This hilly terrain is well
known as the headquarters of pilgrim worship in Kerala. Historically, from the
beginning of the Christian era, the district has been able to house new religions and
religious sects. When the Brahmins from the other parts of the country established 32
settlements in Kerala, some of them like Aranmula Thiruvalla,Venmani were also in
177
this district. Some other settlements are close to the district on the banks of river
Pamba. This had geographical factors behind. The rich and fertile river valleys in the
district made it best suitable for wetland agriculture and thus the Brahmins chose to
settle down there.77
One of the most popular pilgrim centers of India, Sabarimala is located in this district.
Recently, a number of new sects and new religious formations have either originated
or come to prevalence in the district. The trend of emergence of new sects is seen
mainly in Christianity and Hinduism. The geography, history and economy of the
district along with migration and such factors influence the religious profile of the
district and the change in it over the course of years.
3.8.1 Population by Religion
The major religions groups in the district are Hindus, Christians and Muslims. The
other religious communities like Sikhs, Jains and Buddhists are insignificant as their
percentage to total population is very negligible.
Demographically speaking Hindus constitute more than half of the population in the
district in the two censuses which is in accordance with the all Kerala pattern. In 1991
out of the total population of 1188332, 660432 were Hindus. i.e., Hindus constitute
55.58% of the total population. In 2001 the total Hindu population of the district
increased to 56.28% against the all Kerala figures where it reduced to 56% from
57.28%. In the case of male-female break up also 1991 figures correspond to the
77
Raghava Varier and Rajan Gurukkal, Kerala Charithram (Sukapuram: Vallathol
Vidhyapeedom, 1992) 111.
178
Kerala figures of approximately 49% and 51%. In 2001 the male figures reduced to
47.8% and a slight improvement in female figures can be seen.
Regarding the Muslim population Pathanamthitta is the district with the least Muslim
population in both the censuses. In 1991 census period the district had only 4.03% of
the total population as Muslims whereas in Kerala they constitute 23.33%. But in the
2001 census period a slight increase in the Muslim population can be seen (4.57%).
Here also the percentage of female population is more than that of the male population
in both the censuses. But the percentage of male to total population is seen decreasing
whereas the female percentage is seen increasing against the Kerala trend.
The Christian population constitutes 40.36% of the total population whereas in Kerala
as a whole they constitute only 19.32%. But in 2001 the percentage decreased to
39% of the total population even though it retained the third rank among the districts
of Kerala. Christians were the only major religious group in the district that showed a
reduction in population proportion. Likewise the female percentage has increased and
a reduction in male percentage can be seen against the Kerala trend. Though all the
three major religious groups have grown in numbers, the rate of growth among
Christians (0.45%) is the lowest as compared to Muslims (17.82%) and Hindus
(5.17%) during 1991-2001.
Besides the three above said religious groups in the district, there were 14 Sikhs, 10
Jains and 86 people belonging to other religious persuasions. In 2001 the number of
these people has changed to 81, 42 and 45 respectively. In 1991 census Buddhists
were not reported but in 2001 census 64 Buddhists were noted. The numbers of
persons who have not stated their religion due to reasons unknown were 403 in 1991
and 1165 in 2001.
179
3.8.2 Profile of Religious Communities
The co-existence of different religions was the specific feature of pre-modern
Travancore. Among the Hindus, the Nairs and Ezhavas were numerically superior.
These two were identified as two distinct communities within the Hindu fold having
their own distinct features and characteristics.
The Nairs occupied an important position in the social life of Travancore. The Nairs
mostly land lords, controlled their respective villages, constituted the bulk of the
militia of the principalities.78
Nairs are the Savarna Hindus who constituted the
warriors, landed gentry and yeoman of Kerala.79
Their status and honour came from
the fact that they belonged to the militia of Travancore attached to feudal nobles.80
The majority of Nairs cultivated their own land. This dominant position continued up
to the time of Marthanda Varma, who killed the chiefs of Nair families and sold their
women to low caste fishermen. Later the British who had wide political powers also
considered the Nairs as a martial race and employed them in their militia but were de-
listed after rebelling against them under Velu Thampi Dalawa. This also dealt a blow
to the Nair dominance.
Nairs were traditionally matrilineal, which means that the family traces its roots
through the women in the family. In this Marumakkathayam system the inheritance is
through maternal line and they lived in units called Tharavadu (matrilineal joint
78
Ramachandran Nair R., Social Structure and Political Development in Kerala
(Trivandrum: The Kerala Academy of Political Science, 1976) 18.
79
Robin Jeffrey, The Decline of Nayar Dominance, Society and Politics in
Travancore (1847-1908) (New Delhi: Manohar Publications, 1976) 28.
80
George Mathew, Communal Road to a Secular Kerala (New Delhi: Concept
Publishing Company, 1989) 26.
180
family). The senior most male member was generally deputed to administer the
affairs. He was known as the karnavar. Other male members had no say in anything
in the house neither did they had the basic right to lead a normal family life, as they
were not allowed to bring their spouses home. The Marumakkathayam system and
Tharavadu system are not viable anymore and has declined in tune with the social and
cultural changes which have taken their toll on many old institutions.
The Nair Service Society (NSS) is an organization created for the upliftment and
welfare of the Nair community under the leadership of Mannath Padmanabhan.
Though initially started to reorganize, strengthen and empower the Nair community
the N.S.S, has extended the benefits of its service beyond communal and religious
boundaries and has been playing significant roles in the social, economic, educational
and political transformations of the concerned areas.81
The NSS is a three tier organization with Karayogams at the base level, Taluk Unions
at the intermediate and Headquarters at the apex level. Pathanamthitta district is
covered by six unions - Adoor, Ranni, Pathanamthitta, Thiruvalla, Mallappally and
Pandalam with Head Quarters at Changanacherry.82
The various departments
functioning under the auspices of NSS brings in no small measure the social and
economic mobility of that community. Besides concentrating on the educational
section they also give much importance to agriculture, health, social services etc
through their various sections.
81
NSS official website: http://www.nss.org.in/
82
Nair Service Society, Administrative Report 2009-10 (Changanacherry: Nair
Service Society, 2010) 217-220.
181
The newly established departments like the Human Resource Department aimed at
exploiting the human resources to the maximum is an example of the changed ideas of
N.S.S. aiming at progress through changes in perspective. Besides the above
mentioned aim the department also aims to establish various programmes suiting the
current needs and also exhort the community members against the social challenges. 83
Premarital counseling, career guidance, personality development and leader ship
training classes, value education classes, as well as knowledge in modern technology
are provided.
The Ezhavas occupied an important position in Travancore. They were subdued for
centuries under the dominating influences of Brahmins and Nairs and they constituted
the upper layer among the lower castes. They were called Chovan or Chekavan in
South and in some parts of Central Travancore.84
The Head Office of Shree Narayana
Dharma Paripalana, an organization created for the upliftment and welfare of Ezhava
community is at Quilon. In the structure of Shree Narayana Dharma Paripalana
Yogam, SNDP unions are the strongest part. Under each SNDP union, SNDP
branches or Sakhas are coming whose activities are controlled by unions.
Pathnamthitta had 5 Unions and 289 Branches.
The Christians were yet another important social group in Travancore even though
numerically less than the Hindus. The introduction of early Christianity in this part of
Indian subcontinent might have happened because of the trade relations that this
region had established with countries in the Mediterranean region from ancient
times.85
By the closing decades of the nineteenth century, the Christian community
83
Nair Service Society, Administrative Report 2010-11 (Changanacherry: Nair
Service Society, 2010) 299.
84
Padmanabha Menon K.P., History of Kerala, Vol.III (Cochin: Government Press,
1933) 424.
85
Mathew Varghese, “The Indigenous Tradition of Syrian Christians of Kerala, A
182
of Travancore came to reflect all the three broad streams of this religion: the Roman
Catholics, the Protestants and the Orthodox. Pentecost movement had also its
adherence in Travancore. It had its beginning in Mulakuzha near Chenganoor as early
as 1925.
3.8.3 Changes in Religion
Demographic changes in the Christian community especially the Syrian Christians,
who constitute nearly half of the state's six million Christian population, are heading
towards a zero or even negative population growth regime. Earlier the community
was characterized by high death and birth rates, very early age marriage and 10 to 12
children per woman where she had no control over the number and timing of
childbirth.86
Syrian Christians were not a very migratory community and
concentrated in a small number of taluks. But when they began their demographic
transition all the above said characteristics changed a lot. Now the community has a
low level of mortality and fertility rates. Most Syrian Christian women have full
control over when and how many children they would like to bear in their lifetime.
They had high migration rate and are now spread out not only all over India, but also
all over the globe.
Since Pathanamthitta district holds the largest number of Syrian Christian population87
the study and the results are applicable here. When we compare the 1991and 2001
census periods Christians were the only community that showed a reduction in
Perspective Based on Their folk Songs: Marriage, Customs and History”, Indian
Folklore Research Journal, 5 (2005): 34.
86
Zachariah K.C., The Syrian Christians of Kerala, Demographic and Socio
Economic Transition in the Twentieth Century (New Delhi: Orient Longman
Private Limited, 2006) 21.
87
George Mathew, op.cit. 20.
183
population proportion. Syrian Christians are the major emigrant group in
Pathanamthitta.88
The large scale out migration of people is search of job coupled
with the high practice of family planning can be attributed to the reasons behind this
fall in population proportion.
The demographic transition has thrown up new concerns in the district. Christians
were a prosperous community commanding extraordinary political clout in Kerala.
This is likely to be affected in future if the decline in the numerical strength is
continuing. The most important structural changes that occur here is the rapid rise in
the population of the elderly and the decline in the number of children. Even though
the State is also in tune with these changes it is more among the Christians.
There also occurred movements originated within the framework of Missionary
Christianity, but moved beyond the limits of the missionary project and eventually
offered a critique of it like Prathyaksha Raksha Daiva Sabha (PRDS), the assembly of
those who are saved by God.89
This is a socio-religious organization founded by
Poikayil Sree Kumara Guru Devan aimed to articulate the interests of the Dalits.90
The assembly with no sacred books, ritualistic practices and priestly classes was the
culmination of the efforts of its founder for a democratic church capable of embracing
all those who were joining to worship God. Poikayil Sree Kumara Guru was the son
of Lechi, a lower caste woman of Eraviperur near Thiruvalla. The members of his
family were the slaves of the aristocratic Christian family, Sankaramangalam. The
88
Zachariah K.C., Mathew E.T. and Irudaya Rajan S., Impact of Migration on
Kerala's Economy and Society, (Thiruvananthapuram: Centre for Development
Studies 1999) 72.
89
Sanal Mohan P., “Religion, Social Space and Identity: The Prathyaksha Raksha
Daiva Sabha and the Making of Cultural Boundaries in Twentieth Century Kerala”,
Journal of South Asian Studies, 28 (2005): 82.
90
Mariam George, “Pratyaksha Raksha Daiva Sabha and Dalit Unity in Kerala”,
Review of Social Sciences, 7 (2006): 37.
184
family gave him literacy and lessons in Bible reading under the discipleship of
Muthoottu Kochukunju Upadeshi. Soon he became a crowd pulling Bible reader and
Preacher. After 1905 he began to distance himself from Christianity on his
understanding that no major religion accepted the Dalits into its castles. He began to
organize the lower sections and teach them cleanliness and wearing white dress.
According to him Bible was the book of the Jews and the priests and thus it was not
helpful for his people. Thus he put the Bible to fire and taught his people a number of
simple songs containing his message. At present, Pratyaksha Raksha Daiva Sabha
(PRDS) is a religious movement that signifies the lower caste assertion and a
consciousness on their part which prompts them to leave the established paths of the
traditional religions and to embark on attempts aimed at the creation and development
of religious identities for themselves.91
Dravidian Class United Front (DCUF) is another new religious formation which owed
its inspiration mainly to Pratyaksha Raksha Daiva Sabha (PRDS). The headquarters
of DCUF is at Mukkada, only a few meters north of the Pathanamthitta district, in
Kottayam district. Dravidian Class United Front (DCUF) was founded by Sabharaj,
who was born on 2nd
October, 1926. He began his life as a porter in Kottayam town
and worked as a member in the Communist Party of India and Revolutionary Socialist
Party. Soon he distanced himself from these parties and in May 1958 his DCUF was
inaugurated. A decade after its foundation, the organization began to concentrate on
the spiritual and religious aspects of life in the area. Sabharaj died in July 2002 before
when he codified the needs and demands of his lower caste followers in 78 points and
later got himself engaged in social and political issues and strikes. Main contention
that the DCUF raised against and faced was with the Christians as they were the major
powers in the region.
91
Suresh Thoompumkal, Sree Kumara Darsanavum Dalit Vishayangalum,
(Kottayam: Swathy Books, 2008) 47.
185
The Dravidian Class United Front (DCUF) was named with a specific sense and care
about terminology. Instead of using the name of any existing class or caste to show its
identity, it calls itself “Dravidian”. This was to show that the members belonged to the
race that really owned and authored the earliest of the Indian civilizations - the
Harappan. Incidentally, the mouth organ of the DCUF was named Saindhavamozhi
which means “the word of the Indus valley people”. This was part of the argument
that they were not really slaves but the ancient original and real inhabitants and
owners of this land.92
Evidently, DCUF was predominantly a political formation
which had its roots in the social milieu of the period and was expressed in religious
terms.
The new religious formations have certain characteristics: (i) they are founded and
fostered by the lower castes themselves; (ii) they distance themselves from the
traditional religions in organization and faith; (iii) the founder is often deified; (iv)
they uphold the enlightenment values like equality, equal opportunity for all and
respect for the constitution etc.; (v) Pratyaksha Raksha Daiva Sabha (PRDS) can be
seen imbibed many of the notions and ideological traits and even terminology from
Christianity even though it is a totally different and new religion; (vi) the new
religious formations were predominantly political in nature; (vii) they base themselves
on the unjust social scenario.
This trend has bearings on globalisation which foster localisation and the
deconstruction of meta- narratives. The general, universal and common codes give
way to the particular and individual expressions and constructions. Religious identities
now get closer to the socio-economic identity of the followers and because there is a
multitude of the latter, the former also get multiplied and diversified. Without the
creation of a new religious identity, the upward movement or the attempt to upward
movement would not probably be complete or even effective. This is also because
92
Manoj M.B. and Anuraj Thirumeni, Thiru P. J. Sabharaj, Ormma, Rashtriyam,
Adayalam, (Mal.) (Kottayam: Kottayam Dalit Centre for Social and Cultural
Initiatives, 2009) 26.
186
almost every other aspect of life here is deeply related to religion. This could be a
factor working behind the origin and growth of the new sects.
Pathanamthitta is renowned as the head quarters of pilgrim tourism in Kerala. Belief
in God is like breathing air to the pilgrim district of the State. Due to this reason the
river sand beds of the district is rich with a religious colour. Conventions of all
Christian denominations as well as Hindus are being held here every year. Neither the
pilgrimage nor the convention is wholly a religious event. They both have social,
political and economic implications and they respond to the material needs of the
concerned communities. For instance, the Maramon Convention of the Mar Thoma
Christians respond not only to the spiritual but the material needs of the followers of
the sect. The community is one with the widest range and rate of global Diaspora. At
the same time, as it is pointed already, their demographic growth rate is very low. This
results in an acute difficulty for the parents of the young men and women to find
matrimonial alliances for their sons and daughters. The Convention, besides other
things, becomes a stage for search for suitable alliances. People of all ages from
different parts of the world flock together here on the occasion and thus the effort is
more effective than anywhere else.
3.9 Changes among the Marginalized Communities.
The two major marginalized social groups, namely Scheduled Castes and Scheduled
Tribes are recognized communities that have suffered from immense backwardness
and deprivation and belonged to the lowest rungs of the Indian stratification system.
The disabilities imposed upon them by the privileged castes of the society covered the
whole gamut of economic, social, political and cultural spheres.
Here the social and economic changes among these communities are analyzed with
certain selected indicators like changes in demography, education and literacy rate,
labour force etc. The Primary Census Abstract of 2011 gives general details of SC/ST
Population. But the specific details of this Census are yet to be published.
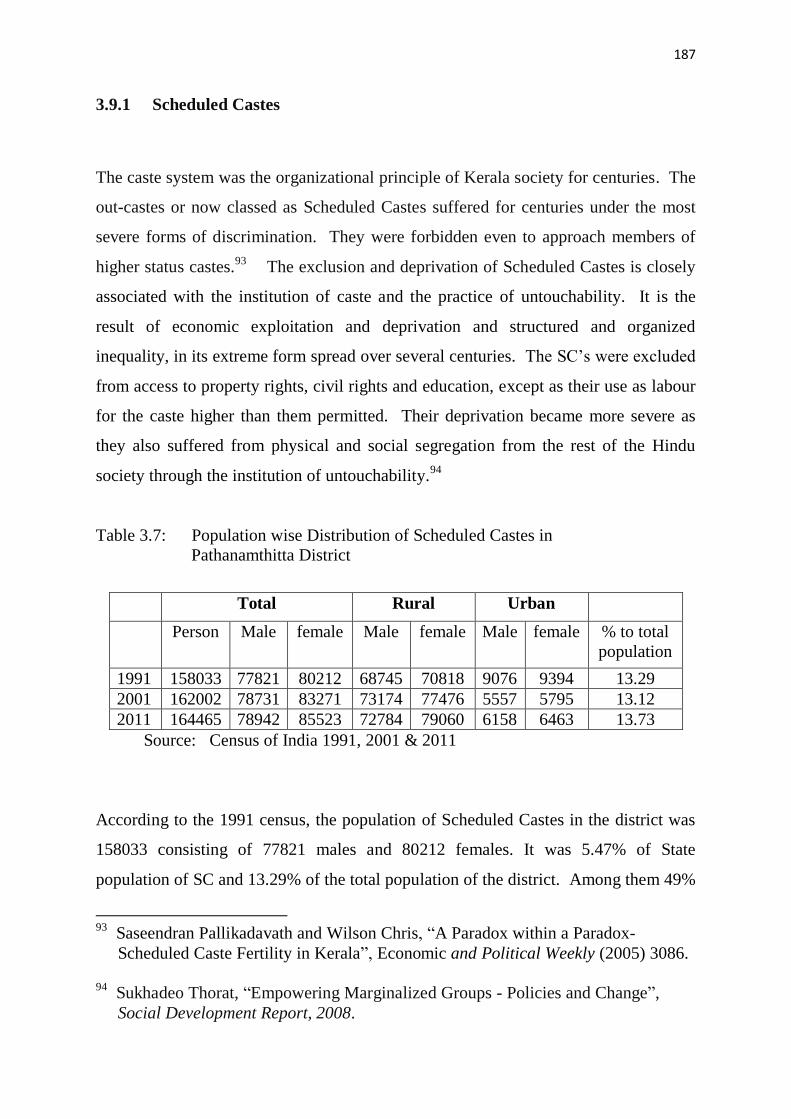
187
3.9.1 Scheduled Castes
The caste system was the organizational principle of Kerala society for centuries. The
out-castes or now classed as Scheduled Castes suffered for centuries under the most
severe forms of discrimination. They were forbidden even to approach members of
higher status castes.93
The exclusion and deprivation of Scheduled Castes is closely
associated with the institution of caste and the practice of untouchability. It is the
result of economic exploitation and deprivation and structured and organized
inequality, in its extreme form spread over several centuries. The SC‟s were excluded
from access to property rights, civil rights and education, except as their use as labour
for the caste higher than them permitted. Their deprivation became more severe as
they also suffered from physical and social segregation from the rest of the Hindu
society through the institution of untouchability.94
Table 3.7: Population wise Distribution of Scheduled Castes in
Pathanamthitta District
Source: Census of India 1991, 2001 & 2011
According to the 1991 census, the population of Scheduled Castes in the district was
158033 consisting of 77821 males and 80212 females. It was 5.47% of State
population of SC and 13.29% of the total population of the district. Among them 49%
93
Saseendran Pallikadavath and Wilson Chris, “A Paradox within a Paradox-
Scheduled Caste Fertility in Kerala”, Economic and Political Weekly (2005) 3086.
94
Sukhadeo Thorat, “Empowering Marginalized Groups - Policies and Change”,
Social Development Report, 2008.
Total Rural Urban
Person Male female Male female Male female % to total
population
1991 158033 77821 80212 68745 70818 9076 9394 13.29
2001 162002 78731 83271 73174 77476 5557 5795 13.12
2011 164465 78942 85523 72784 79060 6158 6463 13.73
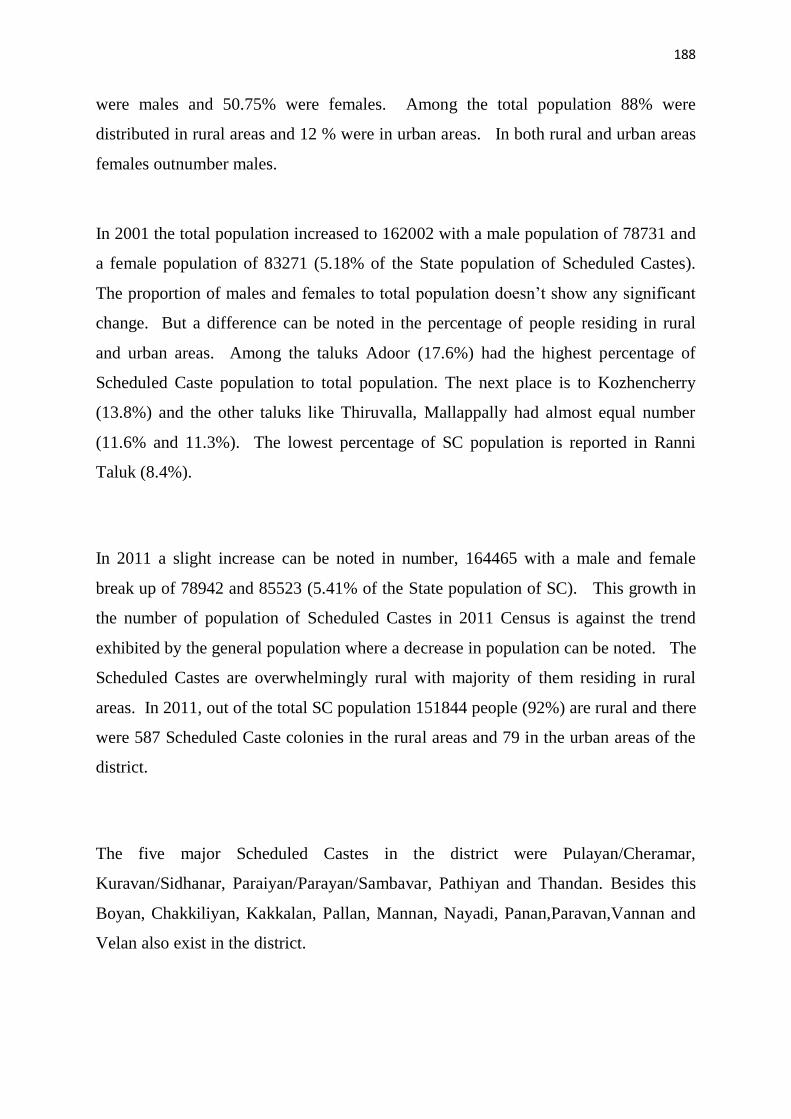
188
were males and 50.75% were females. Among the total population 88% were
distributed in rural areas and 12 % were in urban areas. In both rural and urban areas
females outnumber males.
In 2001 the total population increased to 162002 with a male population of 78731 and
a female population of 83271 (5.18% of the State population of Scheduled Castes).
The proportion of males and females to total population doesn‟t show any significant
change. But a difference can be noted in the percentage of people residing in rural
and urban areas. Among the taluks Adoor (17.6%) had the highest percentage of
Scheduled Caste population to total population. The next place is to Kozhencherry
(13.8%) and the other taluks like Thiruvalla, Mallappally had almost equal number
(11.6% and 11.3%). The lowest percentage of SC population is reported in Ranni
Taluk (8.4%).
In 2011 a slight increase can be noted in number, 164465 with a male and female
break up of 78942 and 85523 (5.41% of the State population of SC). This growth in
the number of population of Scheduled Castes in 2011 Census is against the trend
exhibited by the general population where a decrease in population can be noted. The
Scheduled Castes are overwhelmingly rural with majority of them residing in rural
areas. In 2011, out of the total SC population 151844 people (92%) are rural and there
were 587 Scheduled Caste colonies in the rural areas and 79 in the urban areas of the
district.
The five major Scheduled Castes in the district were Pulayan/Cheramar,
Kuravan/Sidhanar, Paraiyan/Parayan/Sambavar, Pathiyan and Thandan. Besides this
Boyan, Chakkiliyan, Kakkalan, Pallan, Mannan, Nayadi, Panan,Paravan,Vannan and
Velan also exist in the district.
189
Table 3.8: Caste Wise Distribution of Scheduled Castes in Pathanamthitta
Pulayan Kuravan Paraiyan/Parayan/
Sambavar
Pathiyan Thandan
Total Total Total Total Total
1991 64581 53906 18121 6703 3613
2001 63457 57431 18644 7061 3943
Census of India 1991 & 2001- Series -12 Kerala, Part XII-A&B, District
Census Hand Book, Pathanamthitta.
In 1991 census, the total population of Pulayan/Cheramar was 64581. Of this male
and female division were 31871 and 32710 respectively. More than 90% of this group
of people lives in the rural areas of the district. In 2001 their number decreased to
63457 and the male and female divisions were 30,876 and 32,581 respectively. In
this census period also the people were overwhelmingly rural. The population of
Kuravan/Sidhanar was slightly lower to the Pulayan and it was 53906 in which 26428
were males and 27478 were females. The number increased to 57431 in 2001. Their
corresponding male and female population was 27,757 and 29,674. Next in number is
the group called Paraiyan/Parayan/Sambavar whose population was 18121 in 1991.
A slight increase in population can be noted with males being 9,153 in number and
females being 9,491. The next two groups Pathiyan and Thandan were 6703 and
3613 respectively. Their number increased to 7061 (male 3,409 and female 3,652)
and 3943 (1,869 males and 2,074 females) respectively.
The table shows that Pulayan numerically the largest caste accounts for the highest
number among the total Scheduled Caste population in the district in the two census
periods. But their number can be seen reduced in the 2001 census. Kuravan the next
numerically higher caste shows an increase in population in the 2001 census. All other
castes also record the same growth.
Age wise distribution of total Scheduled Castes in 2001 census shows that the
working class group (15-59) occupies the highest strata with 107244 persons with a
male and female break up of 51809 and 55435 respectively. It is followed by
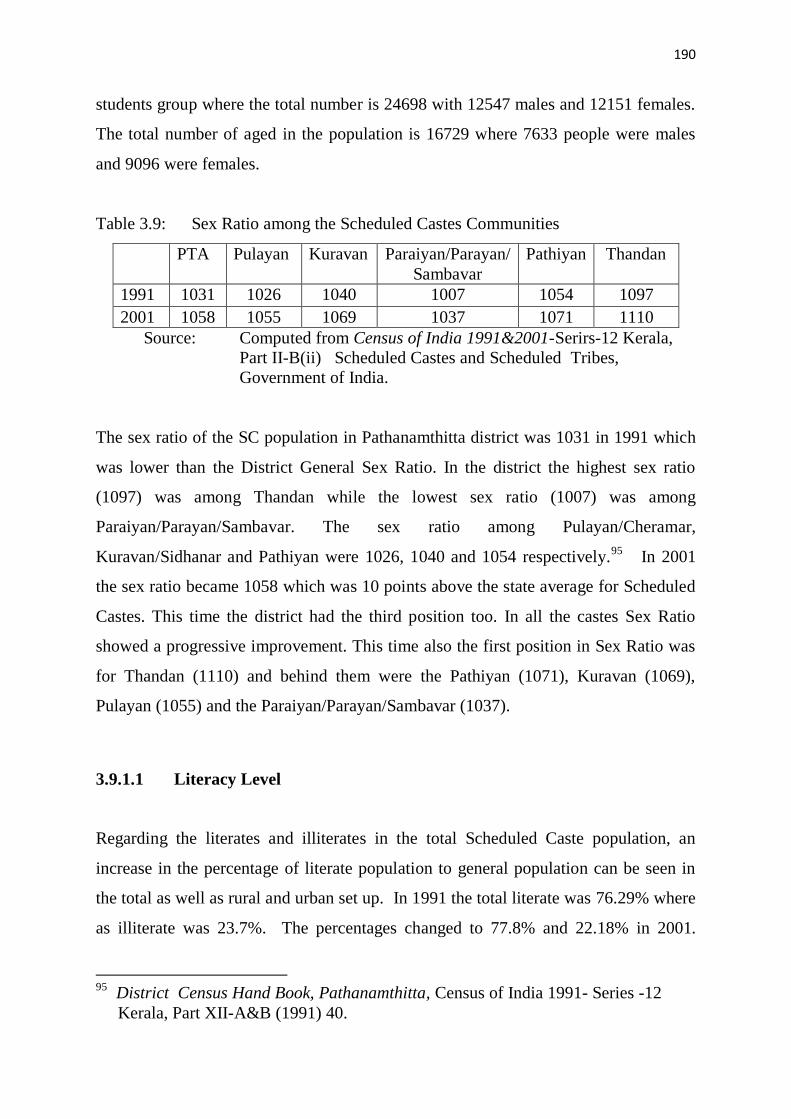
190
students group where the total number is 24698 with 12547 males and 12151 females.
The total number of aged in the population is 16729 where 7633 people were males
and 9096 were females.
Table 3.9: Sex Ratio among the Scheduled Castes Communities
PTA Pulayan Kuravan Paraiyan/Parayan/
Sambavar
Pathiyan Thandan
1991 1031 1026 1040 1007 1054 1097
2001 1058 1055 1069 1037 1071 1110
Source: Computed from Census of India 1991&2001-Serirs-12 Kerala,
Part II-B(ii) Scheduled Castes and Scheduled Tribes,
Government of India.
The sex ratio of the SC population in Pathanamthitta district was 1031 in 1991 which
was lower than the District General Sex Ratio. In the district the highest sex ratio
(1097) was among Thandan while the lowest sex ratio (1007) was among
Paraiyan/Parayan/Sambavar. The sex ratio among Pulayan/Cheramar,
Kuravan/Sidhanar and Pathiyan were 1026, 1040 and 1054 respectively.95
In 2001
the sex ratio became 1058 which was 10 points above the state average for Scheduled
Castes. This time the district had the third position too. In all the castes Sex Ratio
showed a progressive improvement. This time also the first position in Sex Ratio was
for Thandan (1110) and behind them were the Pathiyan (1071), Kuravan (1069),
Pulayan (1055) and the Paraiyan/Parayan/Sambavar (1037).
3.9.1.1 Literacy Level
Regarding the literates and illiterates in the total Scheduled Caste population, an
increase in the percentage of literate population to general population can be seen in
the total as well as rural and urban set up. In 1991 the total literate was 76.29% where
as illiterate was 23.7%. The percentages changed to 77.8% and 22.18% in 2001.
95
District Census Hand Book, Pathanamthitta, Census of India 1991- Series -12
Kerala, Part XII-A&B (1991) 40.
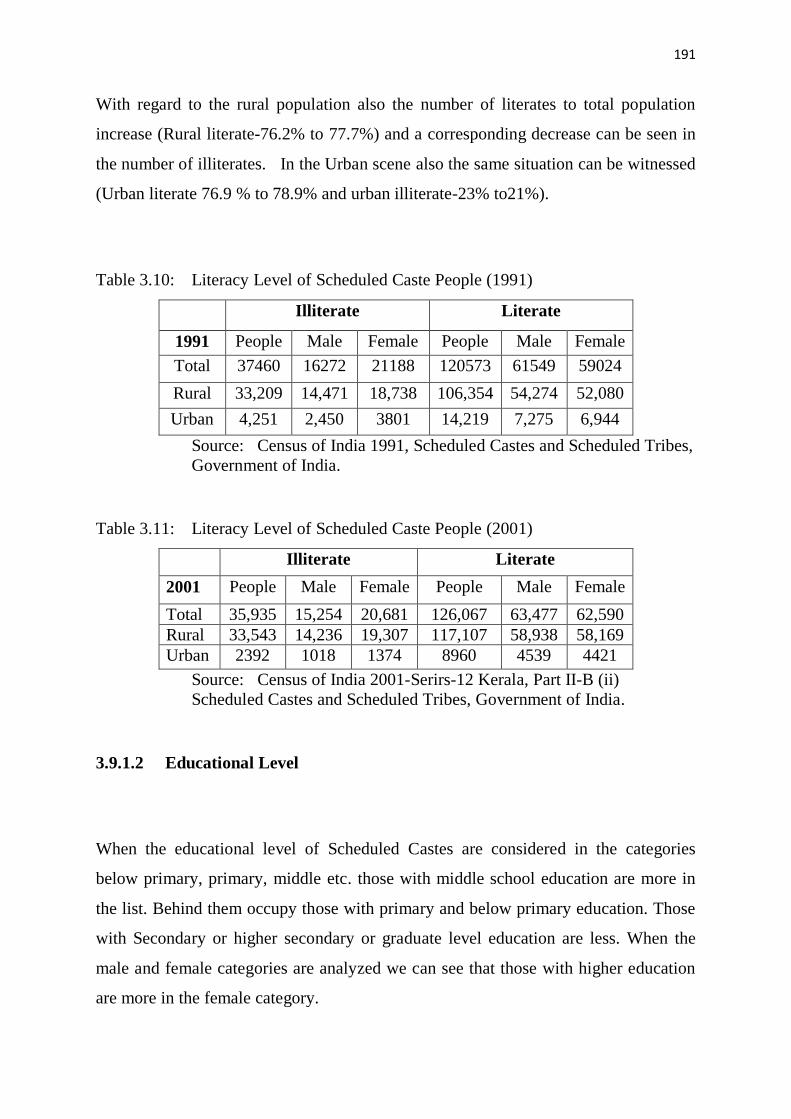
191
With regard to the rural population also the number of literates to total population
increase (Rural literate-76.2% to 77.7%) and a corresponding decrease can be seen in
the number of illiterates. In the Urban scene also the same situation can be witnessed
(Urban literate 76.9 % to 78.9% and urban illiterate-23% to21%).
Table 3.10: Literacy Level of Scheduled Caste People (1991)
Illiterate Literate
1991 People Male Female People Male Female
Total 37460 16272 21188 120573 61549 59024
Rural 33,209 14,471 18,738 106,354 54,274 52,080
Urban 4,251 2,450 3801 14,219 7,275 6,944
Source: Census of India 1991, Scheduled Castes and Scheduled Tribes,
Government of India.
Table 3.11: Literacy Level of Scheduled Caste People (2001)
Illiterate Literate
2001 People Male Female People Male Female
Total 35,935 15,254 20,681 126,067 63,477 62,590
Rural 33,543 14,236 19,307 117,107 58,938 58,169
Urban 2392 1018 1374 8960 4539 4421
Source: Census of India 2001-Serirs-12 Kerala, Part II-B (ii)
Scheduled Castes and Scheduled Tribes, Government of India.
3.9.1.2 Educational Level
When the educational level of Scheduled Castes are considered in the categories
below primary, primary, middle etc. those with middle school education are more in
the list. Behind them occupy those with primary and below primary education. Those
with Secondary or higher secondary or graduate level education are less. When the
male and female categories are analyzed we can see that those with higher education
are more in the female category.
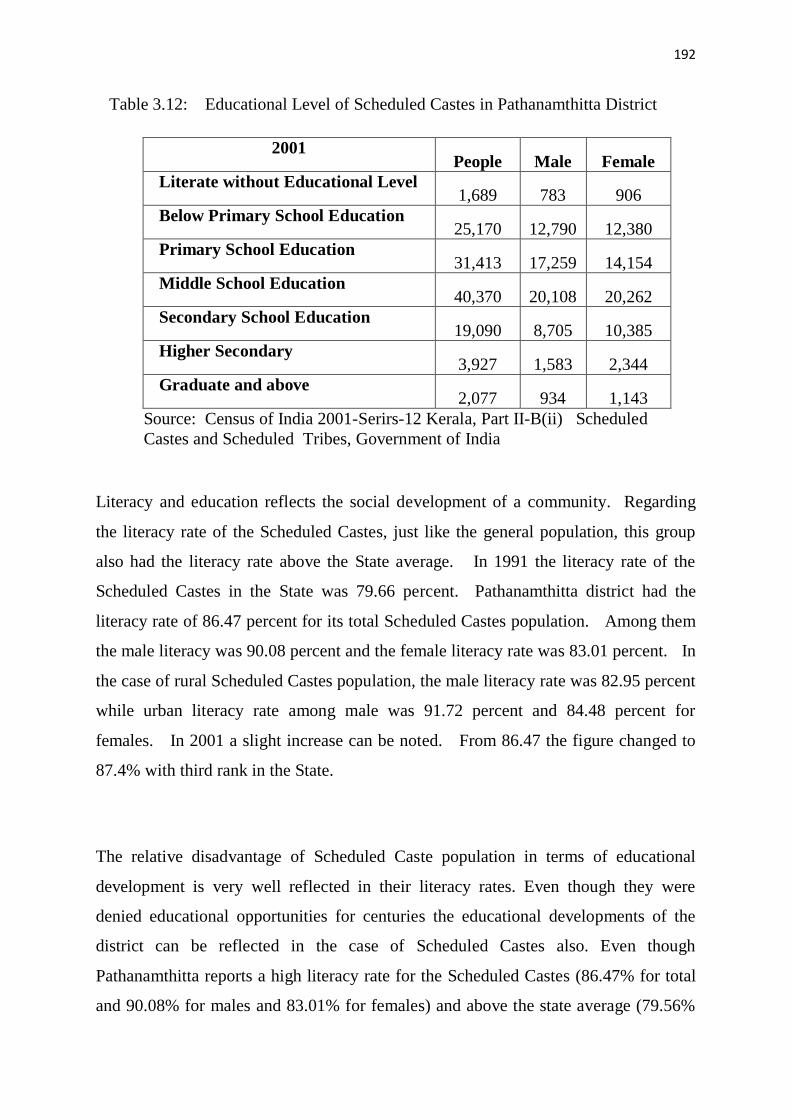
192
Table 3.12: Educational Level of Scheduled Castes in Pathanamthitta District
2001 People Male Female
Literate without Educational Level 1,689 783 906
Below Primary School Education 25,170 12,790 12,380
Primary School Education 31,413 17,259 14,154
Middle School Education 40,370 20,108 20,262
Secondary School Education 19,090 8,705 10,385
Higher Secondary 3,927 1,583 2,344
Graduate and above 2,077 934 1,143
Source: Census of India 2001-Serirs-12 Kerala, Part II-B(ii) Scheduled
Castes and Scheduled Tribes, Government of India
Literacy and education reflects the social development of a community. Regarding
the literacy rate of the Scheduled Castes, just like the general population, this group
also had the literacy rate above the State average. In 1991 the literacy rate of the
Scheduled Castes in the State was 79.66 percent. Pathanamthitta district had the
literacy rate of 86.47 percent for its total Scheduled Castes population. Among them
the male literacy was 90.08 percent and the female literacy rate was 83.01 percent. In
the case of rural Scheduled Castes population, the male literacy rate was 82.95 percent
while urban literacy rate among male was 91.72 percent and 84.48 percent for
females. In 2001 a slight increase can be noted. From 86.47 the figure changed to
87.4% with third rank in the State.
The relative disadvantage of Scheduled Caste population in terms of educational
development is very well reflected in their literacy rates. Even though they were
denied educational opportunities for centuries the educational developments of the
district can be reflected in the case of Scheduled Castes also. Even though
Pathanamthitta reports a high literacy rate for the Scheduled Castes (86.47% for total
and 90.08% for males and 83.01% for females) and above the state average (79.56%
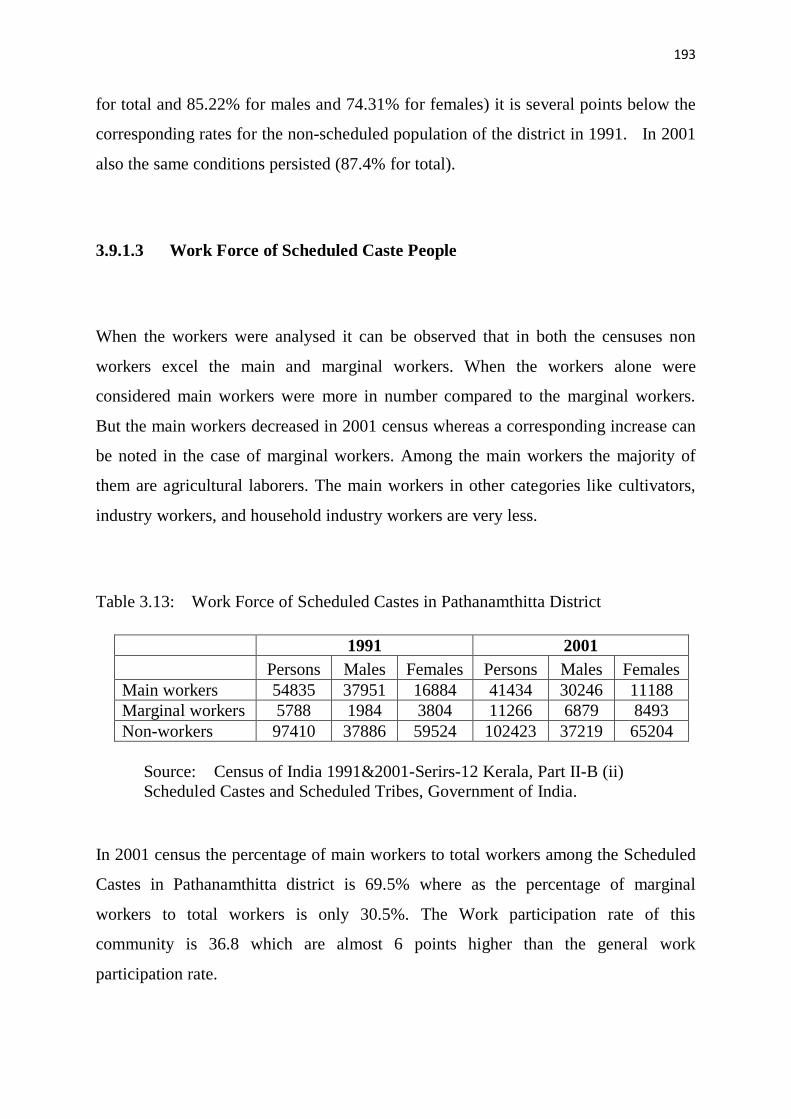
193
for total and 85.22% for males and 74.31% for females) it is several points below the
corresponding rates for the non-scheduled population of the district in 1991. In 2001
also the same conditions persisted (87.4% for total).
3.9.1.3 Work Force of Scheduled Caste People
When the workers were analysed it can be observed that in both the censuses non
workers excel the main and marginal workers. When the workers alone were
considered main workers were more in number compared to the marginal workers.
But the main workers decreased in 2001 census whereas a corresponding increase can
be noted in the case of marginal workers. Among the main workers the majority of
them are agricultural laborers. The main workers in other categories like cultivators,
industry workers, and household industry workers are very less.
Table 3.13: Work Force of Scheduled Castes in Pathanamthitta District
1991 2001
Persons Males Females Persons Males Females
Main workers 54835 37951 16884 41434 30246 11188
Marginal workers 5788 1984 3804 11266 6879 8493
Non-workers 97410 37886 59524 102423 37219 65204
Source: Census of India 1991&2001-Serirs-12 Kerala, Part II-B (ii)
Scheduled Castes and Scheduled Tribes, Government of India.
In 2001 census the percentage of main workers to total workers among the Scheduled
Castes in Pathanamthitta district is 69.5% where as the percentage of marginal
workers to total workers is only 30.5%. The Work participation rate of this
community is 36.8 which are almost 6 points higher than the general work
participation rate.
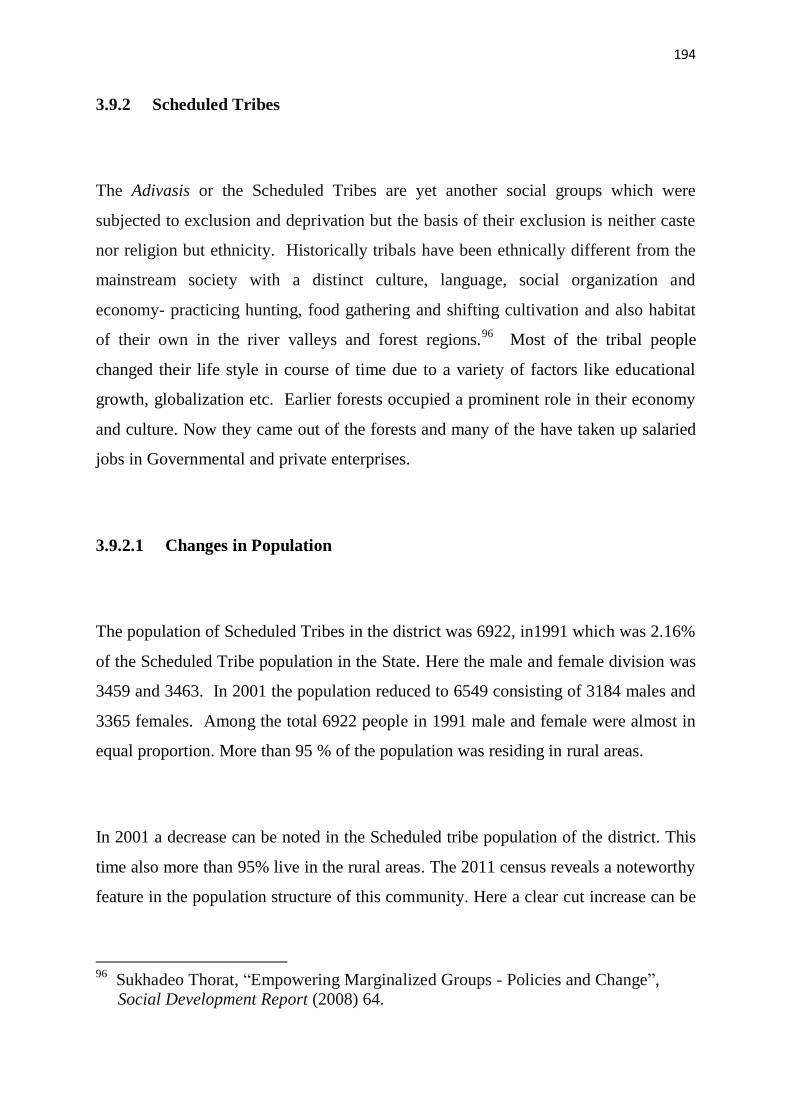
194
3.9.2 Scheduled Tribes
The Adivasis or the Scheduled Tribes are yet another social groups which were
subjected to exclusion and deprivation but the basis of their exclusion is neither caste
nor religion but ethnicity. Historically tribals have been ethnically different from the
mainstream society with a distinct culture, language, social organization and
economy- practicing hunting, food gathering and shifting cultivation and also habitat
of their own in the river valleys and forest regions.96
Most of the tribal people
changed their life style in course of time due to a variety of factors like educational
growth, globalization etc. Earlier forests occupied a prominent role in their economy
and culture. Now they came out of the forests and many of the have taken up salaried
jobs in Governmental and private enterprises.
3.9.2.1 Changes in Population
The population of Scheduled Tribes in the district was 6922, in1991 which was 2.16%
of the Scheduled Tribe population in the State. Here the male and female division was
3459 and 3463. In 2001 the population reduced to 6549 consisting of 3184 males and
3365 females. Among the total 6922 people in 1991 male and female were almost in
equal proportion. More than 95 % of the population was residing in rural areas.
In 2001 a decrease can be noted in the Scheduled tribe population of the district. This
time also more than 95% live in the rural areas. The 2011 census reveals a noteworthy
feature in the population structure of this community. Here a clear cut increase can be
96
Sukhadeo Thorat, “Empowering Marginalized Groups - Policies and Change”, Social Development Report (2008) 64.
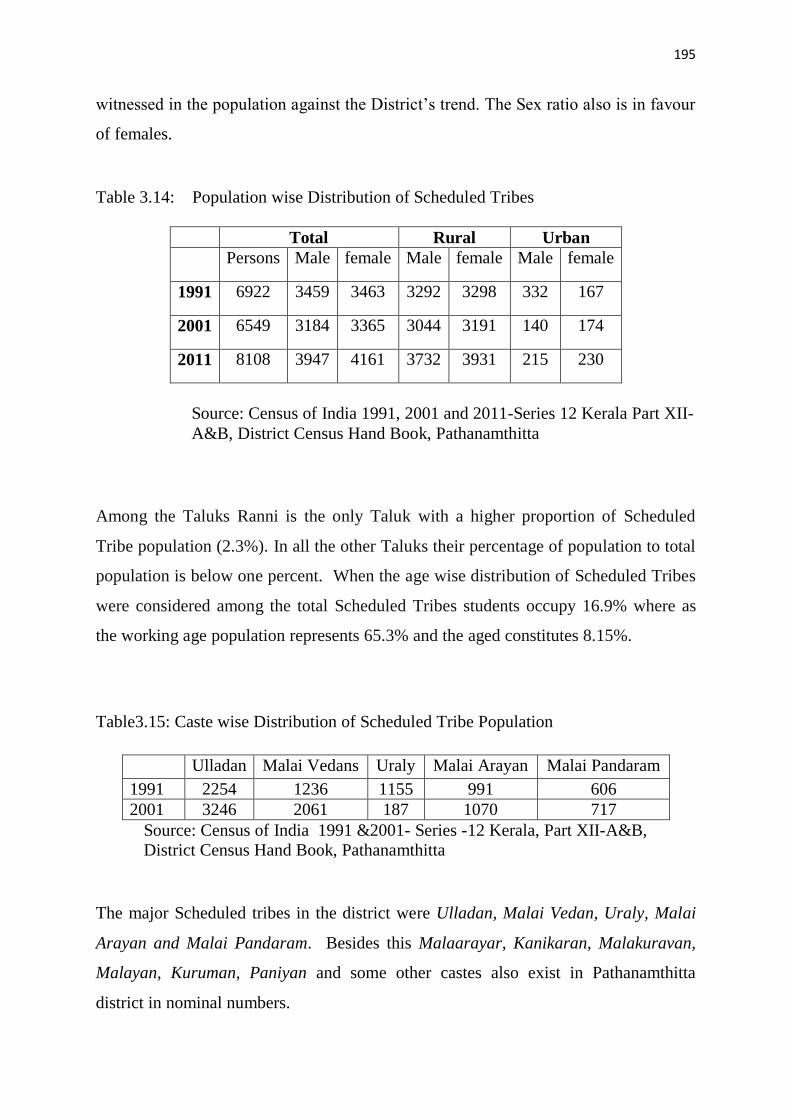
195
witnessed in the population against the District‟s trend. The Sex ratio also is in favour
of females.
Table 3.14: Population wise Distribution of Scheduled Tribes
Total Rural Urban
Persons Male female Male female Male female
1991 6922 3459 3463 3292 3298 332 167
2001 6549 3184 3365 3044 3191 140 174
2011 8108 3947 4161 3732 3931 215 230
Source: Census of India 1991, 2001 and 2011-Series 12 Kerala Part XII-
A&B, District Census Hand Book, Pathanamthitta
Among the Taluks Ranni is the only Taluk with a higher proportion of Scheduled
Tribe population (2.3%). In all the other Taluks their percentage of population to total
population is below one percent. When the age wise distribution of Scheduled Tribes
were considered among the total Scheduled Tribes students occupy 16.9% where as
the working age population represents 65.3% and the aged constitutes 8.15%.
Table3.15: Caste wise Distribution of Scheduled Tribe Population
Ulladan Malai Vedans Uraly Malai Arayan Malai Pandaram
1991 2254 1236 1155 991 606
2001 3246 2061 187 1070 717
Source: Census of India 1991 &2001- Series -12 Kerala, Part XII-A&B,
District Census Hand Book, Pathanamthitta
The major Scheduled tribes in the district were Ulladan, Malai Vedan, Uraly, Malai
Arayan and Malai Pandaram. Besides this Malaarayar, Kanikaran, Malakuravan,
Malayan, Kuruman, Paniyan and some other castes also exist in Pathanamthitta
district in nominal numbers.
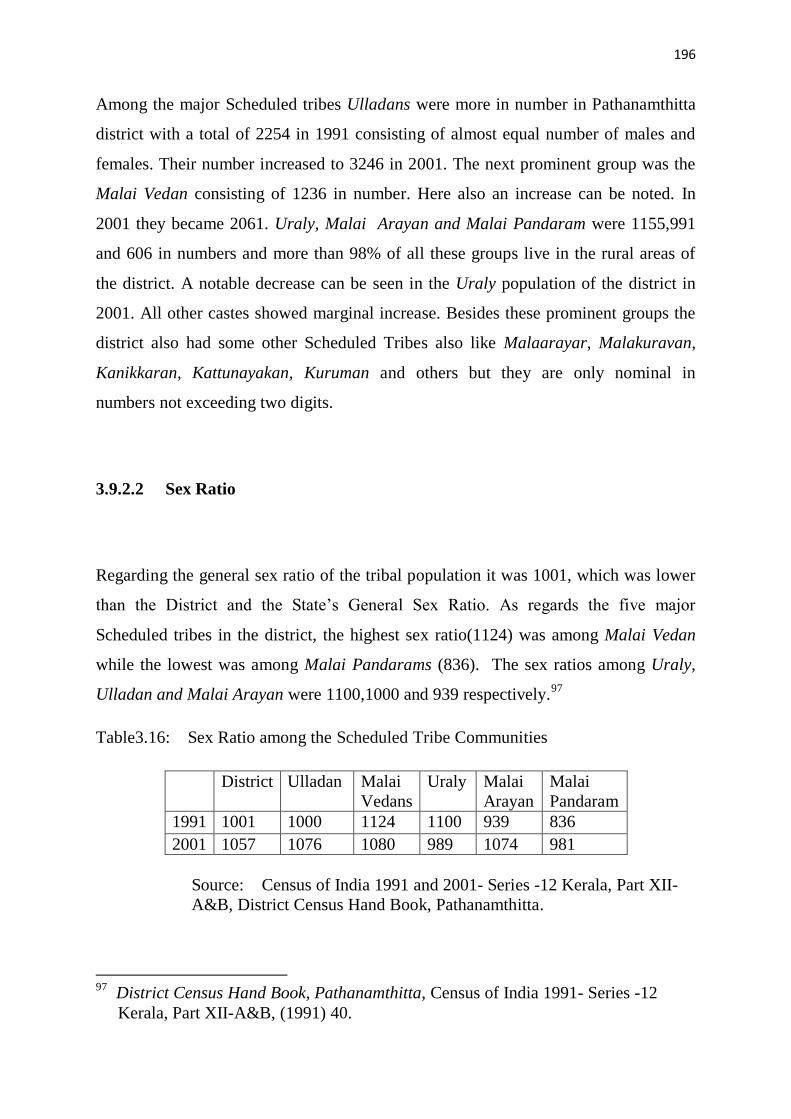
196
Among the major Scheduled tribes Ulladans were more in number in Pathanamthitta
district with a total of 2254 in 1991 consisting of almost equal number of males and
females. Their number increased to 3246 in 2001. The next prominent group was the
Malai Vedan consisting of 1236 in number. Here also an increase can be noted. In
2001 they became 2061. Uraly, Malai Arayan and Malai Pandaram were 1155,991
and 606 in numbers and more than 98% of all these groups live in the rural areas of
the district. A notable decrease can be seen in the Uraly population of the district in
2001. All other castes showed marginal increase. Besides these prominent groups the
district also had some other Scheduled Tribes also like Malaarayar, Malakuravan,
Kanikkaran, Kattunayakan, Kuruman and others but they are only nominal in
numbers not exceeding two digits.
3.9.2.2 Sex Ratio
Regarding the general sex ratio of the tribal population it was 1001, which was lower
than the District and the State‟s General Sex Ratio. As regards the five major
Scheduled tribes in the district, the highest sex ratio(1124) was among Malai Vedan
while the lowest was among Malai Pandarams (836). The sex ratios among Uraly,
Ulladan and Malai Arayan were 1100,1000 and 939 respectively.97
Table3.16: Sex Ratio among the Scheduled Tribe Communities
District Ulladan Malai
Vedans
Uraly Malai
Arayan
Malai
Pandaram
1991 1001 1000 1124 1100 939 836
2001 1057 1076 1080 989 1074 981
Source: Census of India 1991 and 2001- Series -12 Kerala, Part XII-
A&B, District Census Hand Book, Pathanamthitta.
97
District Census Hand Book, Pathanamthitta, Census of India 1991- Series -12
Kerala, Part XII-A&B, (1991) 40.
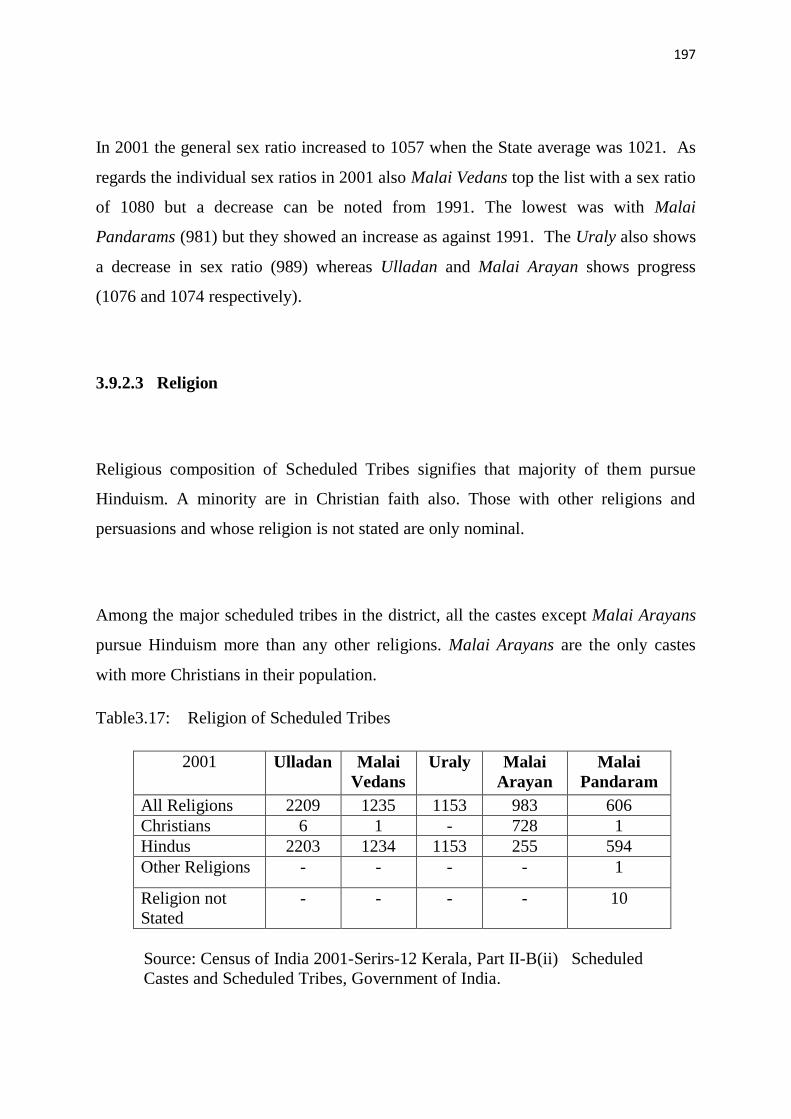
197
In 2001 the general sex ratio increased to 1057 when the State average was 1021. As
regards the individual sex ratios in 2001 also Malai Vedans top the list with a sex ratio
of 1080 but a decrease can be noted from 1991. The lowest was with Malai
Pandarams (981) but they showed an increase as against 1991. The Uraly also shows
a decrease in sex ratio (989) whereas Ulladan and Malai Arayan shows progress
(1076 and 1074 respectively).
3.9.2.3 Religion
Religious composition of Scheduled Tribes signifies that majority of them pursue
Hinduism. A minority are in Christian faith also. Those with other religions and
persuasions and whose religion is not stated are only nominal.
Among the major scheduled tribes in the district, all the castes except Malai Arayans
pursue Hinduism more than any other religions. Malai Arayans are the only castes
with more Christians in their population.
Table3.17: Religion of Scheduled Tribes
2001 Ulladan Malai
Vedans
Uraly Malai
Arayan
Malai
Pandaram
All Religions 2209 1235 1153 983 606
Christians 6 1 - 728 1
Hindus 2203 1234 1153 255 594
Other Religions - - - - 1
Religion not
Stated
- - - - 10
Source: Census of India 2001-Serirs-12 Kerala, Part II-B(ii) Scheduled
Castes and Scheduled Tribes, Government of India.
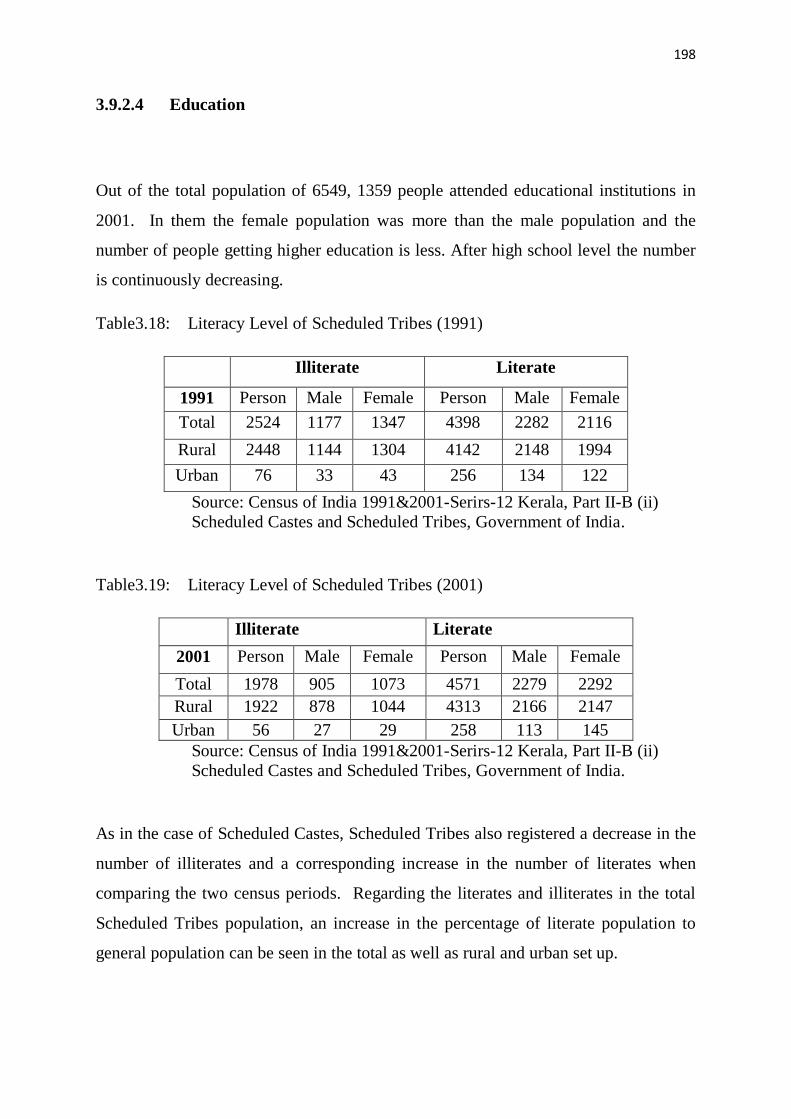
198
3.9.2.4 Education
Out of the total population of 6549, 1359 people attended educational institutions in
2001. In them the female population was more than the male population and the
number of people getting higher education is less. After high school level the number
is continuously decreasing.
Table3.18: Literacy Level of Scheduled Tribes (1991)
Illiterate Literate
1991 Person Male Female Person Male Female
Total 2524 1177 1347 4398 2282 2116
Rural 2448 1144 1304 4142 2148 1994
Urban 76 33 43 256 134 122
Source: Census of India 1991&2001-Serirs-12 Kerala, Part II-B (ii)
Scheduled Castes and Scheduled Tribes, Government of India.
Table3.19: Literacy Level of Scheduled Tribes (2001)
Illiterate Literate
2001 Person Male Female Person Male Female
Total 1978 905 1073 4571 2279 2292
Rural 1922 878 1044 4313 2166 2147
Urban 56 27 29 258 113 145
Source: Census of India 1991&2001-Serirs-12 Kerala, Part II-B (ii)
Scheduled Castes and Scheduled Tribes, Government of India.
As in the case of Scheduled Castes, Scheduled Tribes also registered a decrease in the
number of illiterates and a corresponding increase in the number of literates when
comparing the two census periods. Regarding the literates and illiterates in the total
Scheduled Tribes population, an increase in the percentage of literate population to
general population can be seen in the total as well as rural and urban set up.
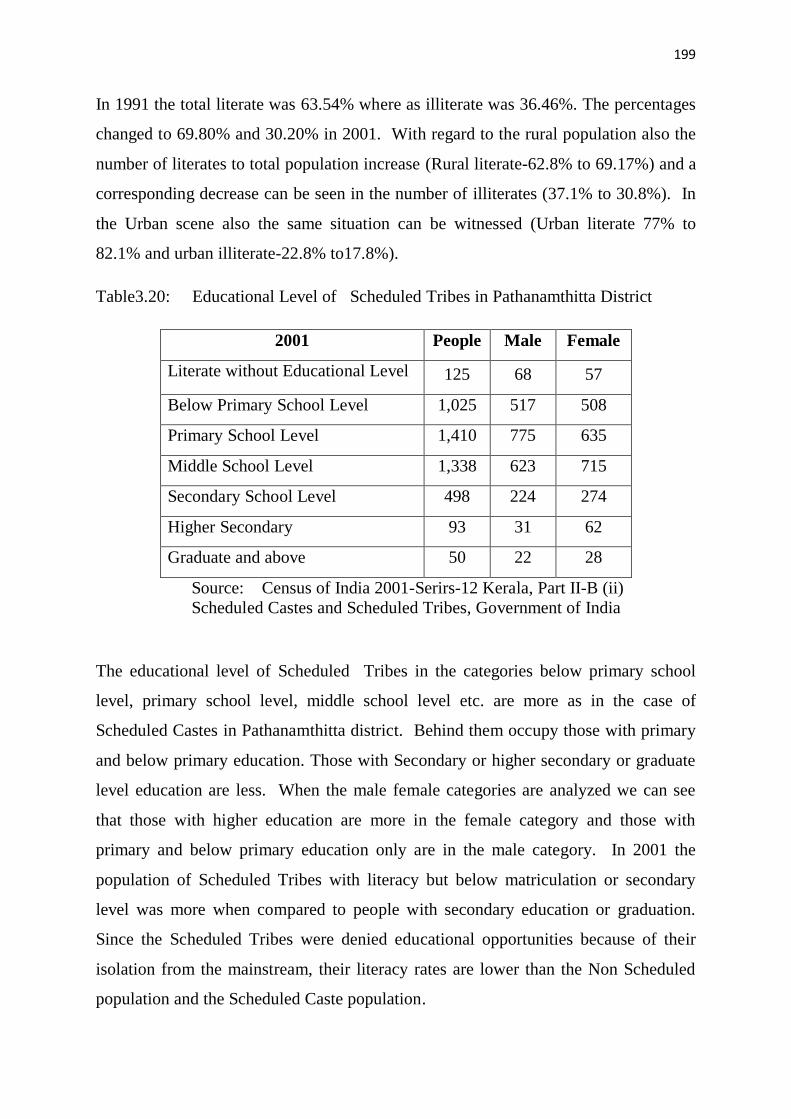
199
In 1991 the total literate was 63.54% where as illiterate was 36.46%. The percentages
changed to 69.80% and 30.20% in 2001. With regard to the rural population also the
number of literates to total population increase (Rural literate-62.8% to 69.17%) and a
corresponding decrease can be seen in the number of illiterates (37.1% to 30.8%). In
the Urban scene also the same situation can be witnessed (Urban literate 77% to
82.1% and urban illiterate-22.8% to17.8%).
Table3.20: Educational Level of Scheduled Tribes in Pathanamthitta District
2001 People Male Female
Literate without Educational Level 125 68 57
Below Primary School Level 1,025 517 508
Primary School Level 1,410 775 635
Middle School Level 1,338 623 715
Secondary School Level 498 224 274
Higher Secondary 93 31 62
Graduate and above 50 22 28
Source: Census of India 2001-Serirs-12 Kerala, Part II-B (ii)
Scheduled Castes and Scheduled Tribes, Government of India
The educational level of Scheduled Tribes in the categories below primary school
level, primary school level, middle school level etc. are more as in the case of
Scheduled Castes in Pathanamthitta district. Behind them occupy those with primary
and below primary education. Those with Secondary or higher secondary or graduate
level education are less. When the male female categories are analyzed we can see
that those with higher education are more in the female category and those with
primary and below primary education only are in the male category. In 2001 the
population of Scheduled Tribes with literacy but below matriculation or secondary
level was more when compared to people with secondary education or graduation.
Since the Scheduled Tribes were denied educational opportunities because of their
isolation from the mainstream, their literacy rates are lower than the Non Scheduled
population and the Scheduled Caste population.
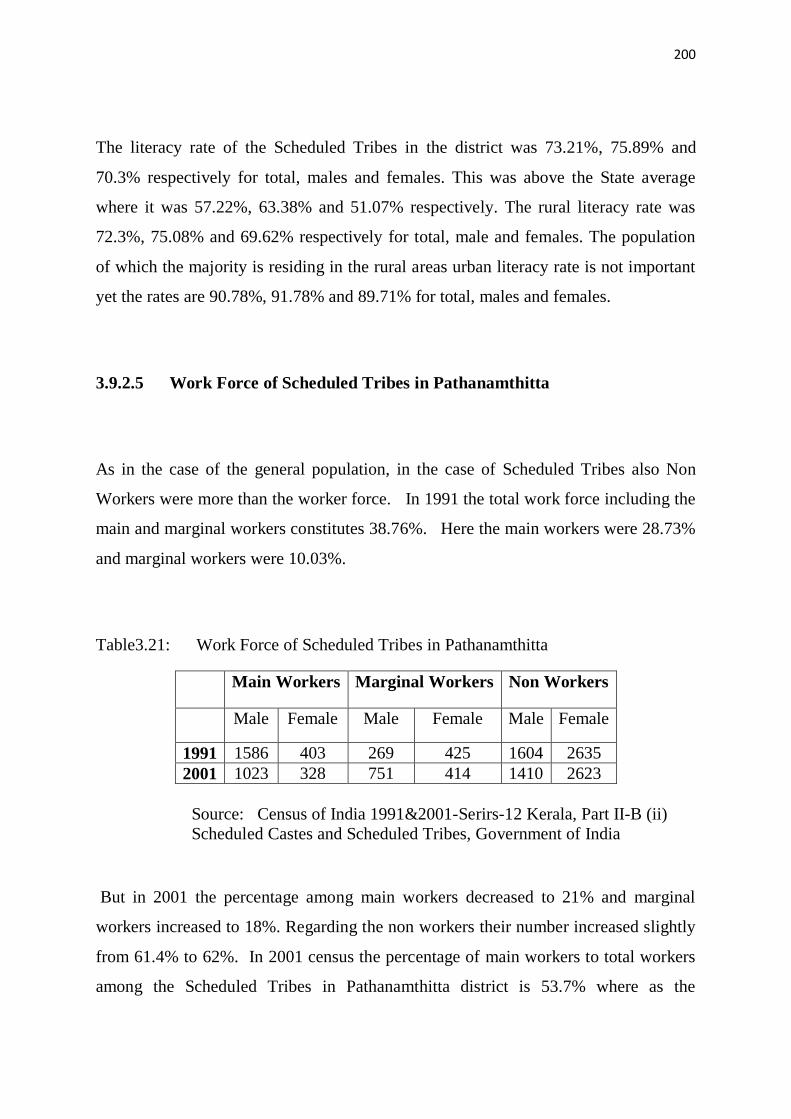
200
The literacy rate of the Scheduled Tribes in the district was 73.21%, 75.89% and
70.3% respectively for total, males and females. This was above the State average
where it was 57.22%, 63.38% and 51.07% respectively. The rural literacy rate was
72.3%, 75.08% and 69.62% respectively for total, male and females. The population
of which the majority is residing in the rural areas urban literacy rate is not important
yet the rates are 90.78%, 91.78% and 89.71% for total, males and females.
3.9.2.5 Work Force of Scheduled Tribes in Pathanamthitta
As in the case of the general population, in the case of Scheduled Tribes also Non
Workers were more than the worker force. In 1991 the total work force including the
main and marginal workers constitutes 38.76%. Here the main workers were 28.73%
and marginal workers were 10.03%.
Table3.21: Work Force of Scheduled Tribes in Pathanamthitta
Main Workers Marginal Workers Non Workers
Male Female Male Female Male Female
1991 1586 403 269 425 1604 2635
2001 1023 328 751 414 1410 2623
Source: Census of India 1991&2001-Serirs-12 Kerala, Part II-B (ii)
Scheduled Castes and Scheduled Tribes, Government of India
But in 2001 the percentage among main workers decreased to 21% and marginal
workers increased to 18%. Regarding the non workers their number increased slightly
from 61.4% to 62%. In 2001 census the percentage of main workers to total workers
among the Scheduled Tribes in Pathanamthitta district is 53.7% where as the
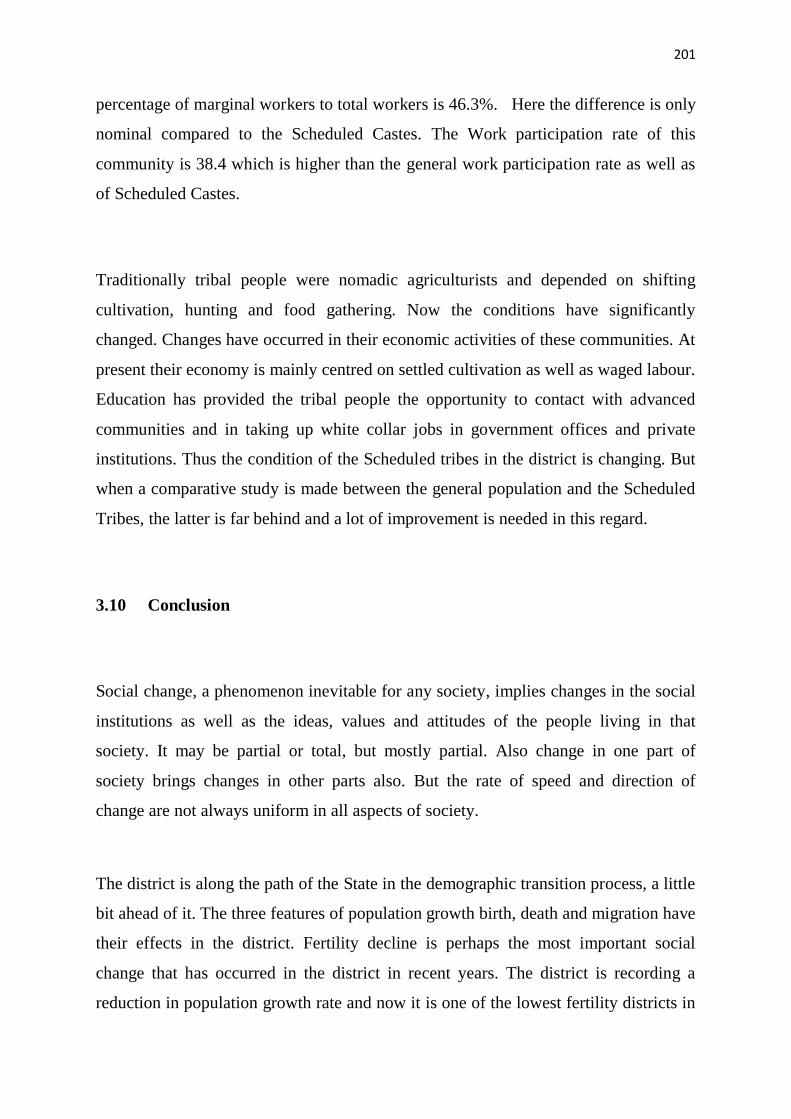
201
percentage of marginal workers to total workers is 46.3%. Here the difference is only
nominal compared to the Scheduled Castes. The Work participation rate of this
community is 38.4 which is higher than the general work participation rate as well as
of Scheduled Castes.
Traditionally tribal people were nomadic agriculturists and depended on shifting
cultivation, hunting and food gathering. Now the conditions have significantly
changed. Changes have occurred in their economic activities of these communities. At
present their economy is mainly centred on settled cultivation as well as waged labour.
Education has provided the tribal people the opportunity to contact with advanced
communities and in taking up white collar jobs in government offices and private
institutions. Thus the condition of the Scheduled tribes in the district is changing. But
when a comparative study is made between the general population and the Scheduled
Tribes, the latter is far behind and a lot of improvement is needed in this regard.
3.10 Conclusion
Social change, a phenomenon inevitable for any society, implies changes in the social
institutions as well as the ideas, values and attitudes of the people living in that
society. It may be partial or total, but mostly partial. Also change in one part of
society brings changes in other parts also. But the rate of speed and direction of
change are not always uniform in all aspects of society.
The district is along the path of the State in the demographic transition process, a little
bit ahead of it. The three features of population growth birth, death and migration have
their effects in the district. Fertility decline is perhaps the most important social
change that has occurred in the district in recent years. The district is recording a
reduction in population growth rate and now it is one of the lowest fertility districts in
202
the country besides some metropolitan districts. Among all the socio-economic factors
which determine fertility, education especially female education is considered to be
one of the most important factors along with other factors like improvements in male
literacy , income, economic status of the house hold, religion, labour force
participation especially females, improvements in health services, extensive use of
family planning etc.
The various consequences of the demographic transition process are also felt in the
district. As a result of age structural transition, the share of old aged population
increases and the dependency ratio increases. Consequently the challenges for them
are more complex because majority of elderly is in the rural areas, which are often left
behind by migrating youth. Also the feminization of the elderly population increases
the higher dependency ratio. Also there has been a steady and more recently a sharper
decline in the proportion of children of school going age. The reduction in the school
going population has its effects in the educational system especially the primary
school system.
Demographic transition cannot be achieved without mortality decline. Mortality
decline in all sphere especially infant, child, and maternal as well as general mortality
decline is studied and the figures for the district were lower when compared to the
State level in most cases. Migration yet another factor determining population also
work in the district. Regarding the Migration Prevalence Rate, the district is above the
State average. In this district, the total number of migrants is almost the same as the
number of households, the Migration Prevalence Rate being 99 percent.
Education, a catalyst for progressive social changes produce a readiness on the part of
the people to work for social change and make desirable changes in the society.
Educational progress, especially female education can be seen behind many a social
changes in the Pathanamthitta district. A district with a good educational tradition,
coupled with economic expansion from commercialization of agriculture and
203
remittances from migration, qualitative improvement in human resources is desirable.
Education thus fastens the process of social change and in other words education was
the cause and result of modernization at the same time in this geographical area. The
educational policies of the State in general and the district in particular helped
promote considerable vertical social mobility by making school education accessible
to students from all socio-economic strata. Women are the foremost group enjoying
the benefits of education and social mobility.
Socio-economic development in a country is very much linked with the improvement
of overall health of the people. Improvement of health is one of the primary goals of
development. Better health has set the demographic transition in motion. The district
has commendable achievements in the demographic area. These achievements
especially in the field of mortality and fertility were attributed to sufficient health
coverage.
Families are undergoing rapid changes in their structure, functions and
responsibilities. The district which is forefront in demographic transition and
migration rates, changes in family structure and functions occur mainly due to these
factors. Pathanamthitta even though advanced than other districts in demographic
transition have more old age homes than other districts in the State. Emergence of
smaller families is a major result and cause of social change at the same time. Smaller
families in return enable parents to educate their children better and higher as their
burden is lesser and their resources to spend on child per head are larger. The structure
of a small family in many ways brings about social change. Absence of grandparents,
closer interaction between parents and children, lesser burden on the shoulders of the
parents, more importance to the fewer number of children, their better bringing up,
more leisure time, etc result and bring about changes in the society.
Also the breakup of the traditional joint family system to nuclear one also had its
repercussions on the elderly. The breakup of the traditional joint family system
204
coupled with migration and female work participation made the life miserable. The
number of old age homes and paid old age homes in the district testifies this. Even in
one‟s own houses the „isolated elderly‟ has also been a growing phenomenon in the
district.
The demographic transition and migration of men in search of employment provides
an opportunity for women to enter into the labour market. . As a result there were
significant familial changes especially in the relationship within the family and
between generations. The female age at marriage went up, the proportion not married
have significantly increased, the elder care become difficult for the children etc.
The migration of the younger generation has a significant impact on the inter-
generational contract and the dynamics of the family left behind.
Migration has fundamental implication for women and children. They suffer when the
male migrates either alone or with them. However, it has also been suggested that
rather than family disintegration, male migration could lead to more capable and self
confident women. The female headed households have become a steadily growing
phenomenon.
As the scale of labour migration at the global level grows ever larger by the day, lives
of the global migrants, their families as well as the local areas from which the migrant
flow initially took off, are being transformed. The increased physical mobility among
family members has resulted in families being spread across the globe.
Changes are taking place in women‟s roles in families. Even though the female work
participation of the district is low, many are educated and employed. Even though the
female work participation is low, more and more women are entering into the labour
force from the district due to educational effects and gender equality and this can often
be a trigger of change.
Religion which is like breathing air to this pilgrim district also is undergoing changes.
Recently, a number of new sects and new religious formations have either originated
205
or come to prevalence mainly in Christianity and Hinduism in the district. The
geography, history and economy of the district along with migration and such factors
influence the religious profile of the district and the change in it over the course of
years.
Marginalized Communities like the Scheduled Castes and Scheduled tribes are also
present in the district. Some of the indicators like sex ratio, literacy etc changed in
tune with the changes in the general population. The improvement in educational
standards and corresponding difference in job pattern and settlement pattern are yet
other prominent points to be noted.
Development in a state is the outcome of the interplay of a variety of factors, such as
political, economic, demographic and geographic. It could be maximizing human
potential, progressing towards a better condition. Analysing all the major indicators of
human development, Pathanamthitta district is in the third position just behind
Ernakulam and Kottayam district. In all the major indicators the district is above the
State average also.


![[A.] MAP OF KANYAKUMARI DISTRICTshodhganga.inflibnet.ac.in/bitstream/10603/87777/15/15_annexure.pdf · the town is 6.47 sq. kilometer. The population on the municipality town as per](https://img.pdfslide.us/doc/110x75/5e698cb662257571ca0c9bd9/a-map-of-kanyakumari-the-town-is-647-sq-kilometer-the-population-on-the-municipality.jpg)