Embed Size (px)
DESCRIPTION
By simply putting a structured tag, here called “Simple Statistical Signature” on web pages that holdstatistical data, we can considerably reduce the cost of searching statistical data on African countries ,while providing a fully decentralized mechanism for the collaboration of statistical communities to assessdata quality, and even build a reputation mechanism for data producers covering both estimated andforecasted data . This article proposes such a decentralised social bookmarking mechanism for statisticaldata that can be a very useful collaboration tool for data communities in the context of the DataRevolution.
Citation preview
1
Social bookmarking for the data revolution: a decentralized and collaborativemechanism for online statistical data identification and tagging
Issoufou Seidou Sanda, ACS
Note: A fully working experimental implementation of the principles of the Simple Statistical Signature based on aWordpress1 blog for declaring the data and an OpenSearchServer2search engine for indexing the declarations (bothfree and open source) can be found at: http://testdata.onafrica.info/.
A key principle of the data revolution: Data usability and curation
Too often data is presented in ways that cannot be understood by most people. The data architectureshould therefore place great emphasis on user-centred design and user friendly interfaces. Communities of“information intermediaries” should be fostered to develop new tools that can translate raw data intoinformation for a broader constituency of non-technical potential users and enable citizens and other datausers to provide feedback.Extract from United Nations (2014): A World That Counts – Mobilising the Data Revolution for Sustainable Development
Summary
By simply putting a structured tag, here called “Simple Statistical Signature” on web pages that holdstatistical data, we can considerably reduce the cost of searching statistical data on African countries ,while providing a fully decentralized mechanism for the collaboration of statistical communities to assessdata quality, and even build a reputation mechanism for data producers covering both estimated andforecasted data . This article proposes such a decentralised social bookmarking mechanism for statisticaldata that can be a very useful collaboration tool for data communities in the context of the DataRevolution.
In August 2014, the United Nations Secretary-General Ban Ki-moon tasked an Independent Expert AdvisoryGroup to come-up with concrete recommendations on bringing about a data revolution in sustainabledevelopment3. The report produced by the group made recommendations on “fostering and promotinginnovation to fill data gaps, mobilizing resources to overcome inequalities between developed anddeveloping countries and between data-poor and data-rich people and leadership and coordination toenable the data revolution to play its full role in the realisation of sustainable development” 4. The reportcalled “on governments and the UN to act to enable data to play its full role in the realisation of sustainabledevelopment by closing key gaps in access and use of data (United Nations, 2014, p.5).
In the same line, the need to “demystify and democratise statistics by making statistics more intelligible,accessible to and usable by a whole range of data users across society” (Kiregyera, 2015, p xiv) has beenstressed in order to make the data revolution a reality. How can we make the statistical data on Africancountries accessible to all potential users when the sources are multiple and the data are rare and very
1 https://wordpress.org/2 http://www.opensearchserver.com/3 http://www.un.org/apps/news/story.asp?NewsID=48594#.VeVLVyWqpHw accessed 1st September 20154 http://hdr.undp.org/en/data-revolution accessed 1st September 2015
2
dispersed? This article proposes a mechanism that aims to contributes to that objective.
“The data revolution means more demand, more data, more communities, more usage, more results andmore engagement – an inspiring vision of a world of fast-flowing data deployed for the public good, and ofcitizens and governments excited and empowered by the possibilities this creates.” (UNECA, 2015). Thesefast-flowing data can be tamed and used for the public good only if adequate tools are made available tothe general public so as to avoid being “drawn in information but starved for knowledge” as rightly said byNaisbitt (1986). Without adequate tools for generating useful knowledge from the expected massiveamount of information, more data will never translate into more usage, more results and moreengagement. The data revolution requires new ways of working supported by new tools. So how can weachieve that given that, even with the limited amount of data that we have currently, our existing tools arehardly coping?
Let’s imagine the following scenarios:
Scenario 1 : In order to conduct economic analysis that would help in strategic decision-making, aneconomist needs to know the level of the portfolio investment for an African country for the year 2014. Heknows a certain number of statistical databases published by national and international organisations thatmay contain the data he is looking for. He navigates to the web page of the first statistical database, entersthe search criteria for the data he is looking for, and finds out that the series he was looking for wascompletely missing. He goes to the second statistical database, enter the search criteria and realize that theseries exists in the database, but stops at the year 2013. He goes to the website of the National StatisticalInstitute of the country, which has an online database. But the online database of the national statisticalinstitute is out of date and does not contain the data point the economist was looking for. The economistgoes through all the online statistical databases he knows, but is unable to find the information that heneeds for his analysis.
In reality, an advanced estimation of the indicator is in a report that was published by the government ofthe country of interest, but our analyst was not aware of the existence of the report. Furthermore, thereport has been published online as a scanned document, which makes retrieving it by a search engineusing keywords very difficult. A model-based projection of the same indicator has been produced by aresearch institute and the results have been made available online to the public as pdf document.Unfortunately, most of the statistical databases of international organizations do not report model-basedprojections of research institutes as they are not considered as official statistics. Our analyst arrives at theconclusion that the data he needs does not exist. This kind of scenario is unfortunately very common withtraditional statistical databases when one is looking for statistical data on African countries.
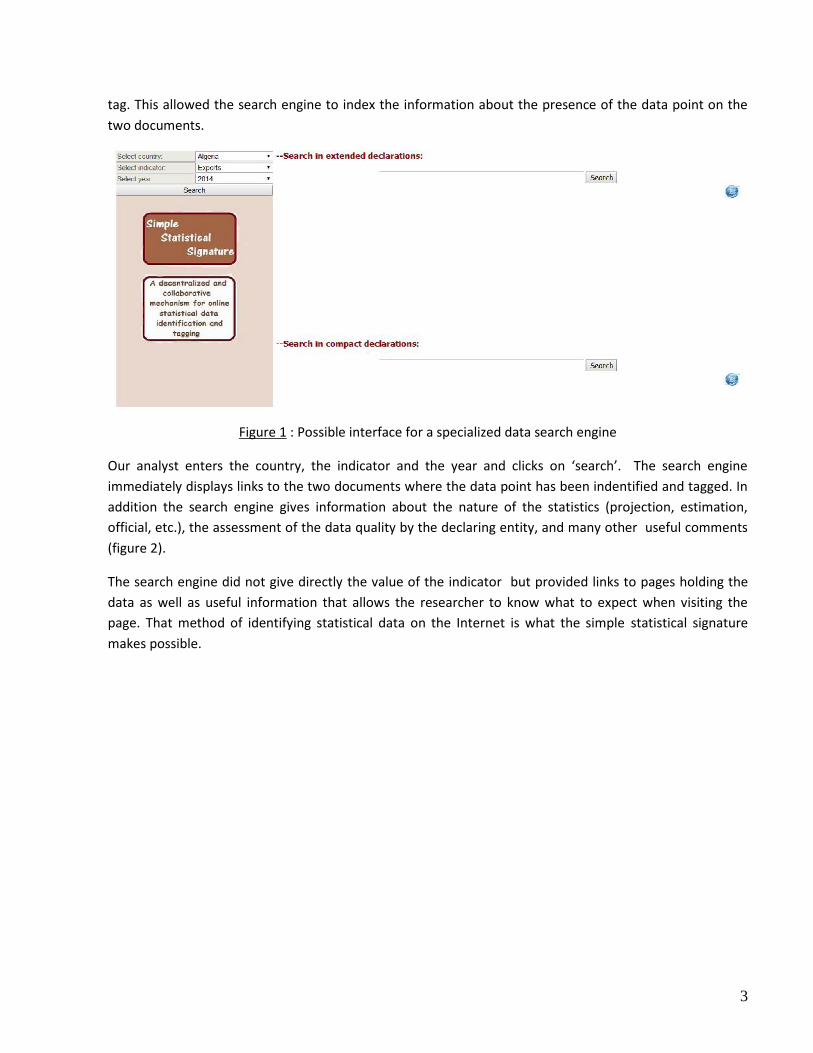
Scenario 2 : Our analyst learns about the existence of a search engine specialized on data that works thesame way Google or Yahoo! work for text data. The search engine detects the presence of statistical dataon an Internet page using a simple declaration of the statistical content of the page done by the author thepage, a third party or even a data mining program capable of identifying statistical data on internet pages.Both the organisation that has produced an advanced estimate of the data point our analyst was lookingfor and the research institute that has produced a projection of the same data point have put that simple
3
tag. This allowed the search engine to index the information about the presence of the data point on thetwo documents.
Figure 1 : Possible interface for a specialized data search engine
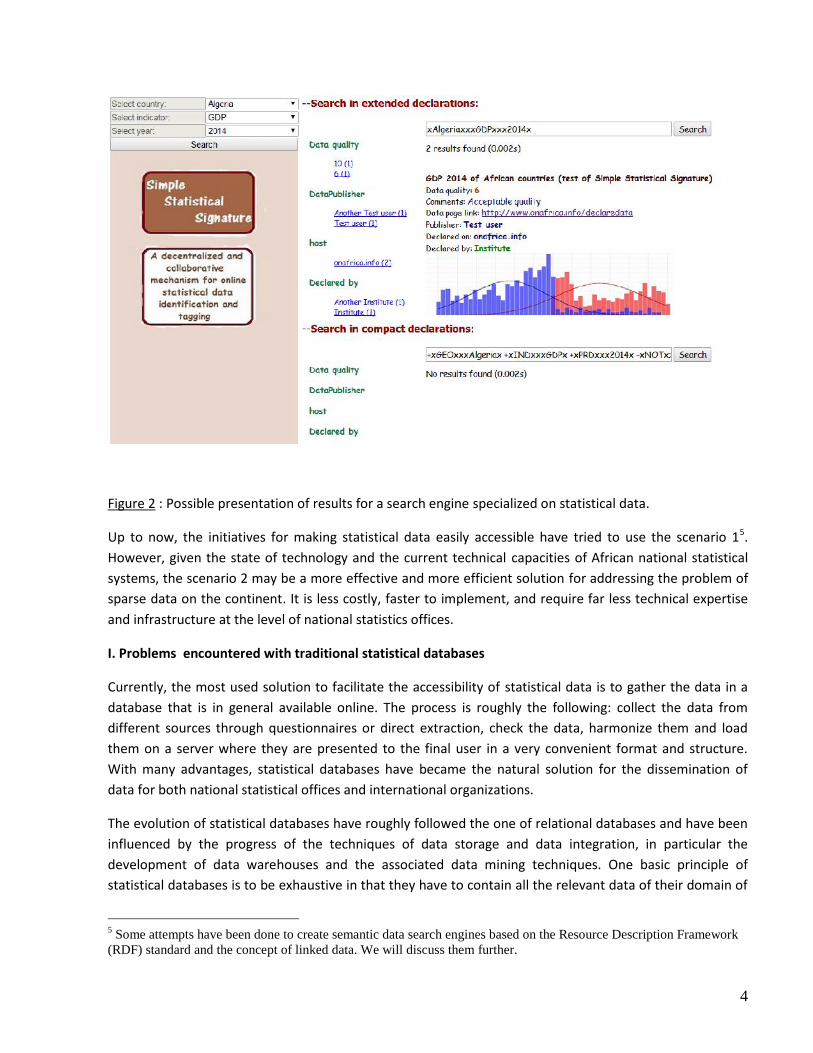
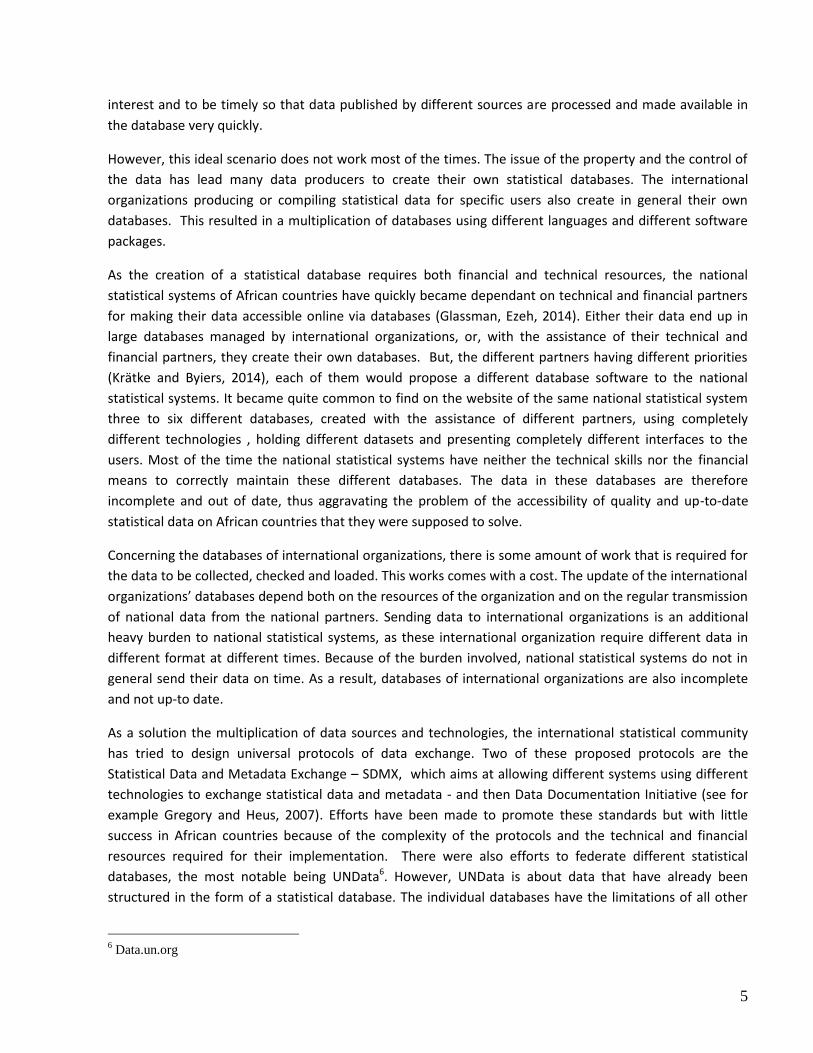
Our analyst enters the country, the indicator and the year and clicks on ‘search’. The search engineimmediately displays links to the two documents where the data point has been indentified and tagged. Inaddition the search engine gives information about the nature of the statistics (projection, estimation,official, etc.), the assessment of the data quality by the declaring entity, and many other useful comments(figure 2).
The search engine did not give directly the value of the indicator but provided links to pages holding thedata as well as useful information that allows the researcher to know what to expect when visiting thepage. That method of identifying statistical data on the Internet is what the simple statistical signaturemakes possible.
4
Figure 2 : Possible presentation of results for a search engine specialized on statistical data.
Up to now, the initiatives for making statistical data easily accessible have tried to use the scenario 15.However, given the state of technology and the current technical capacities of African national statisticalsystems, the scenario 2 may be a more effective and more efficient solution for addressing the problem ofsparse data on the continent. It is less costly, faster to implement, and require far less technical expertiseand infrastructure at the level of national statistics offices.
I. Problems encountered with traditional statistical databases
Currently, the most used solution to facilitate the accessibility of statistical data is to gather the data in adatabase that is in general available online. The process is roughly the following: collect the data fromdifferent sources through questionnaires or direct extraction, check the data, harmonize them and loadthem on a server where they are presented to the final user in a very convenient format and structure.With many advantages, statistical databases have became the natural solution for the dissemination ofdata for both national statistical offices and international organizations.
The evolution of statistical databases have roughly followed the one of relational databases and have beeninfluenced by the progress of the techniques of data storage and data integration, in particular thedevelopment of data warehouses and the associated data mining techniques. One basic principle ofstatistical databases is to be exhaustive in that they have to contain all the relevant data of their domain of
5 Some attempts have been done to create semantic data search engines based on the Resource Description Framework(RDF) standard and the concept of linked data. We will discuss them further.
5
interest and to be timely so that data published by different sources are processed and made available inthe database very quickly.
However, this ideal scenario does not work most of the times. The issue of the property and the control ofthe data has lead many data producers to create their own statistical databases. The internationalorganizations producing or compiling statistical data for specific users also create in general their owndatabases. This resulted in a multiplication of databases using different languages and different softwarepackages.
As the creation of a statistical database requires both financial and technical resources, the nationalstatistical systems of African countries have quickly became dependant on technical and financial partnersfor making their data accessible online via databases (Glassman, Ezeh, 2014). Either their data end up inlarge databases managed by international organizations, or, with the assistance of their technical andfinancial partners, they create their own databases. But, the different partners having different priorities(Krätke and Byiers, 2014), each of them would propose a different database software to the nationalstatistical systems. It became quite common to find on the website of the same national statistical systemthree to six different databases, created with the assistance of different partners, using completelydifferent technologies , holding different datasets and presenting completely different interfaces to theusers. Most of the time the national statistical systems have neither the technical skills nor the financialmeans to correctly maintain these different databases. The data in these databases are thereforeincomplete and out of date, thus aggravating the problem of the accessibility of quality and up-to-datestatistical data on African countries that they were supposed to solve.
Concerning the databases of international organizations, there is some amount of work that is required forthe data to be collected, checked and loaded. This works comes with a cost. The update of the internationalorganizations’ databases depend both on the resources of the organization and on the regular transmissionof national data from the national partners. Sending data to international organizations is an additionalheavy burden to national statistical systems, as these international organization require different data indifferent format at different times. Because of the burden involved, national statistical systems do not ingeneral send their data on time. As a result, databases of international organizations are also incompleteand not up-to date.
As a solution the multiplication of data sources and technologies, the international statistical communityhas tried to design universal protocols of data exchange. Two of these proposed protocols are theStatistical Data and Metadata Exchange – SDMX, which aims at allowing different systems using differenttechnologies to exchange statistical data and metadata - and then Data Documentation Initiative (see forexample Gregory and Heus, 2007). Efforts have been made to promote these standards but with littlesuccess in African countries because of the complexity of the protocols and the technical and financialresources required for their implementation. There were also efforts to federate different statisticaldatabases, the most notable being UNData6. However, UNData is about data that have already beenstructured in the form of a statistical database. The individual databases have the limitations of all other
6 Data.un.org
6
statistical databases.
As a result, despite the efforts made, traditional statistical databases have not been able to democratisethe access to statistical data on African countries: these data are still sparse and very difficult to find online,even when they exist.
II. The Simple Statistical Signature
The problems encountered with traditional statistical databases come from the costs associated with theeffort of data collection, the work of data harmonization, the acquisition of the required infrastructure, themaintenance of the systems, and the training required to understand and use multiple technologies. Hencethe main idea of the simple statistical signature: rather than trying to collect the data, process them andstore them in the same place, why not simply leave them where they are and mark them with a specialbookmark so that any one who needs them can easily retrieve them using a system similar to a GPSsystem? The simple statistical signature is a proposal of a format for such bookmark. It allows taggingstatistical data online in order to make them easy to retrieve and index with computer programs, thereforemaking possible the development of data search engines that help retrieving statistical data the same waytraditional search engines help retrieving text data.
In fact, the simple statistical signature is a way for internet pages (as well as any resource identifiable andretrievable using an url) to declare their statistical content so that the content can be indexed and retrievedon demand. In order to avoid the problems that have limited the effectiveness of traditional statisticaldatabase, the simple statistical signature should have the following characteristics:
- Be easy to retrieve, to parse and to index by a search engine specialized in parsing text.
- Be precise enough to avoid for a user looking for a particular data to be sent to an internet page that doesnot contain the data (like incomplete series holing data for previous years but not for the year the user waslooking for).
- Allow giving information on the data quality as well as any other useful information (collaboration tool fordata communities).
- Use a data format that is universally accepted.
- Allow uniquely identifying the one declaring the data as both a reward for giving useful information orpenalty for giving poor quality information.
- Allow a form of advertising of the organization or person declaring the data as incentive to participate tothe collective effort of identifying and tagging useful statistical data pages (taking into account the politicaleconomy of the production of statistics and giving incentive to the private sector to contribute).
- Ideally, the page containing statistical data should also hold its own statistical signature in order to beeasily retrieved by those searching for the data. However, even when a page has not declared its own data,it should be possible for a third party to declare the statistical signature of that page, link it to the url of the
7
page and publish it on another internet page. Therefore the simple statistical signature should also be aform of social bookmarking for pages holding statistical data.
Before continuing, we should mention past attempts for making tools for statistical data discovery onlineand how they differ from the solution proposed in this article. For example, an attempt to make datadiscoverable using the SDMX standard has been made by Capadisli, Sören, and Ngonga Ngomo (2013). Thefact that it was built on the SDMX standard and that generalizing the use of SDMX in African nationalStatistical System has proven difficult to achieve does not make it a good candidate for the simplestatistical signature.
There is also a work by Capadisli on statistical linked dataspaces that still builds on RDF (Capadisli, 2012)and therefore, comes with the associated complexity of implementation and learning requirements.However the concept that is closest to the one of simple statistical signature is the concept of linked data.Linked data is about creating links between related data that are available online and allows a form of datadiscovery by following the links (Bizer, Heath, Berners-Lee, 2009).
All these initiatives are about structuring the data themselves rather than simply declaring the presence ofthe data with quality assessment and comments. They are therefore much more complex to implementthan the proposed simple statistical signature. In addition, both the tools and standards mentioned abovedo not provides the features of quality scoring, comments and self-promotion that have been set asrequirements above and that are important aspects for the collaboration of data communities.
II-a-) Proposed architecture for the simple statistical signature
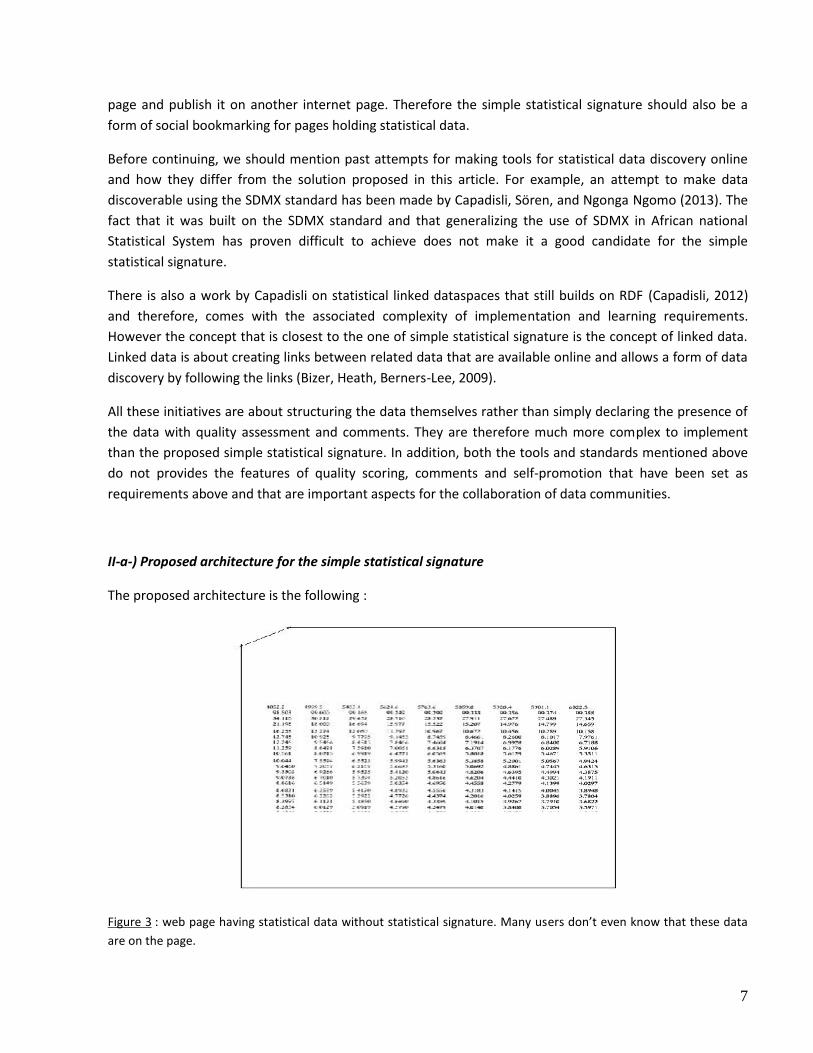
The proposed architecture is the following :
Figure 3 : web page having statistical data without statistical signature. Many users don’t even know that these dataare on the page.
8
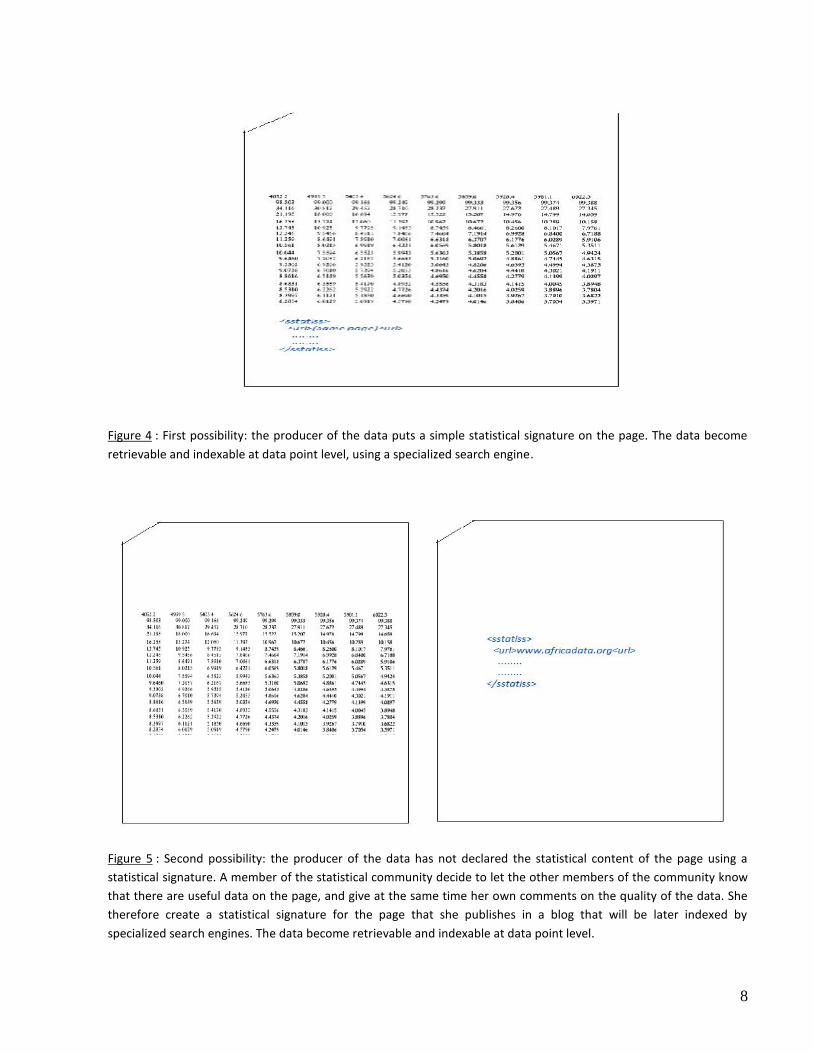
Figure 4 : First possibility: the producer of the data puts a simple statistical signature on the page. The data becomeretrievable and indexable at data point level, using a specialized search engine.
Figure 5 : Second possibility: the producer of the data has not declared the statistical content of the page using astatistical signature. A member of the statistical community decide to let the other members of the community knowthat there are useful data on the page, and give at the same time her own comments on the quality of the data. Shetherefore create a statistical signature for the page that she publishes in a blog that will be later indexed byspecialized search engines. The data become retrievable and indexable at data point level.
9
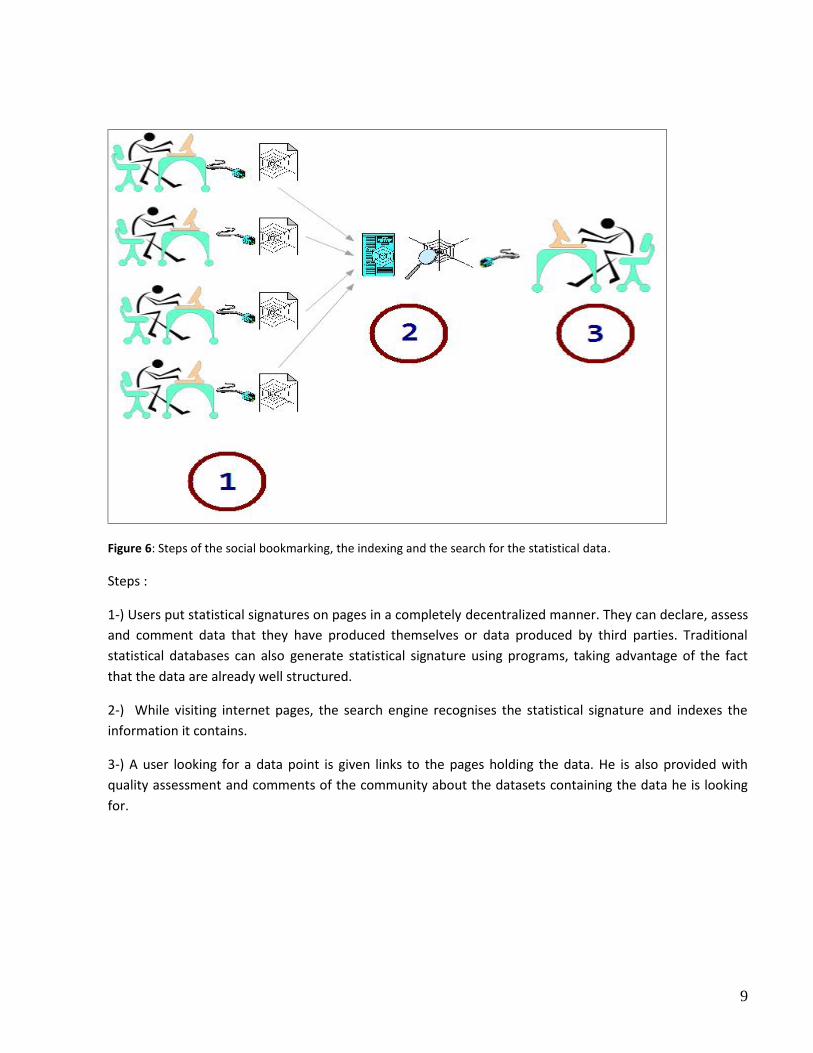
Figure 6: Steps of the social bookmarking, the indexing and the search for the statistical data.
Steps :
1-) Users put statistical signatures on pages in a completely decentralized manner. They can declare, assessand comment data that they have produced themselves or data produced by third parties. Traditionalstatistical databases can also generate statistical signature using programs, taking advantage of the factthat the data are already well structured.
2-) While visiting internet pages, the search engine recognises the statistical signature and indexes theinformation it contains.
3-) A user looking for a data point is given links to the pages holding the data. He is also provided withquality assessment and comments of the community about the datasets containing the data he is lookingfor.
10
II-b-) Proposed format for the simple statistical signature
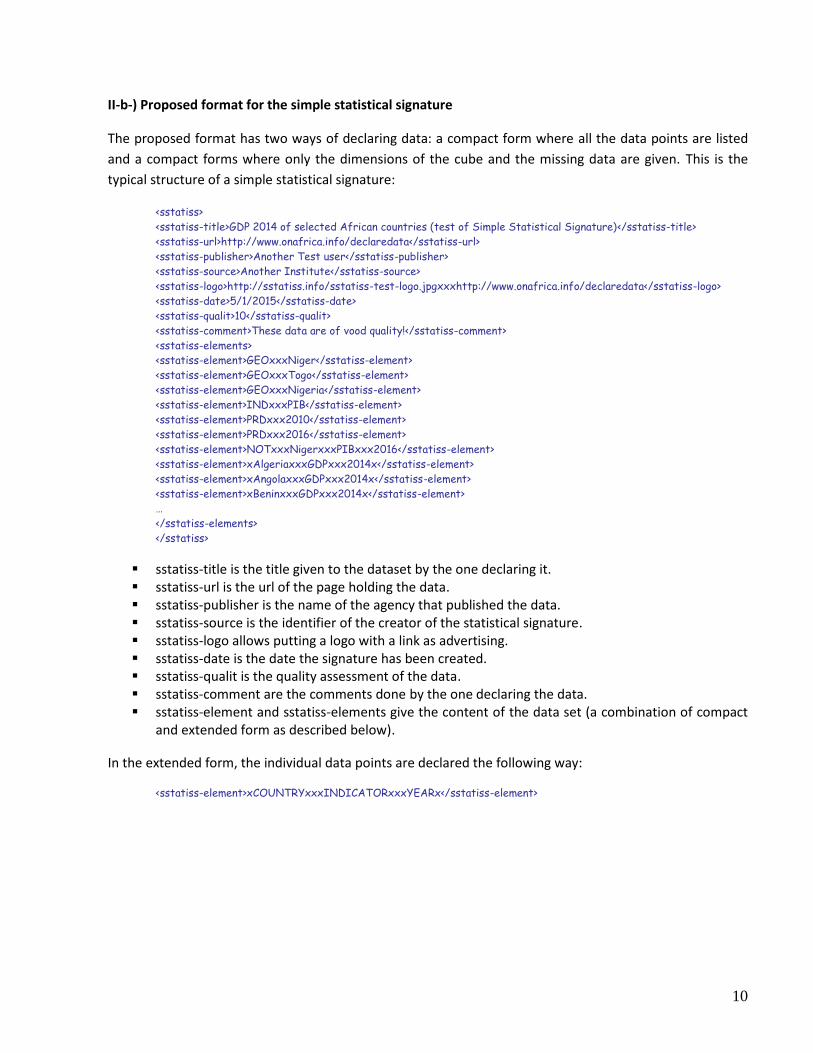
The proposed format has two ways of declaring data: a compact form where all the data points are listedand a compact forms where only the dimensions of the cube and the missing data are given. This is thetypical structure of a simple statistical signature:
<sstatiss><sstatiss-title>GDP 2014 of selected African countries (test of Simple Statistical Signature)</sstatiss-title><sstatiss-url>http://www.onafrica.info/declaredata</sstatiss-url><sstatiss-publisher>Another Test user</sstatiss-publisher><sstatiss-source>Another Institute</sstatiss-source><sstatiss-logo>http://sstatiss.info/sstatiss-test-logo.jpgxxxhttp://www.onafrica.info/declaredata</sstatiss-logo><sstatiss-date>5/1/2015</sstatiss-date><sstatiss-qualit>10</sstatiss-qualit><sstatiss-comment>These data are of vood quality!</sstatiss-comment><sstatiss-elements><sstatiss-element>GEOxxxNiger</sstatiss-element><sstatiss-element>GEOxxxTogo</sstatiss-element><sstatiss-element>GEOxxxNigeria</sstatiss-element><sstatiss-element>INDxxxPIB</sstatiss-element><sstatiss-element>PRDxxx2010</sstatiss-element><sstatiss-element>PRDxxx2016</sstatiss-element><sstatiss-element>NOTxxxNigerxxxPIBxxx2016</sstatiss-element><sstatiss-element>xAlgeriaxxxGDPxxx2014x</sstatiss-element><sstatiss-element>xAngolaxxxGDPxxx2014x</sstatiss-element><sstatiss-element>xBeninxxxGDPxxx2014x</sstatiss-element>…</sstatiss-elements></sstatiss>
sstatiss-title is the title given to the dataset by the one declaring it. sstatiss-url is the url of the page holding the data. sstatiss-publisher is the name of the agency that published the data. sstatiss-source is the identifier of the creator of the statistical signature. sstatiss-logo allows putting a logo with a link as advertising. sstatiss-date is the date the signature has been created. sstatiss-qualit is the quality assessment of the data. sstatiss-comment are the comments done by the one declaring the data. sstatiss-element and sstatiss-elements give the content of the data set (a combination of compact
and extended form as described below).
In the extended form, the individual data points are declared the following way:
<sstatiss-element>xCOUNTRYxxxINDICATORxxxYEARx</sstatiss-element>
11
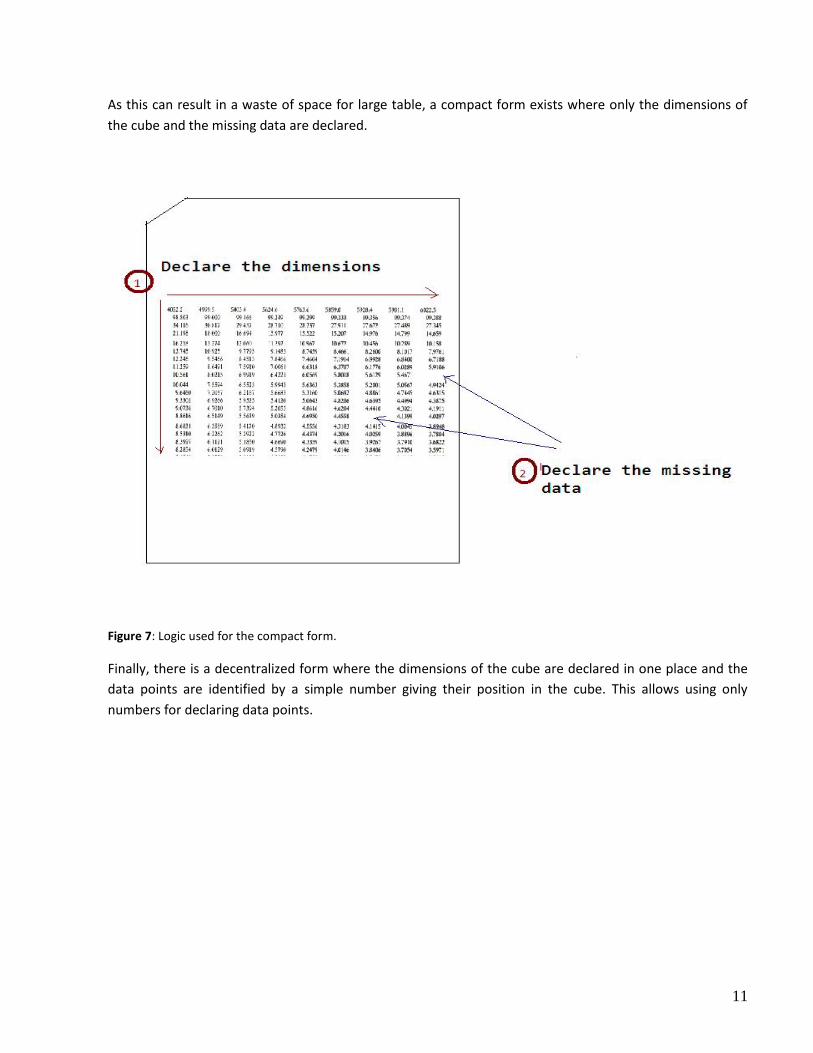
As this can result in a waste of space for large table, a compact form exists where only the dimensions ofthe cube and the missing data are declared.
Figure 7: Logic used for the compact form.
Finally, there is a decentralized form where the dimensions of the cube are declared in one place and thedata points are identified by a simple number giving their position in the cube. This allows using onlynumbers for declaring data points.
12
II-c-) Finding commonly agreed codes for the indicators
Agreeing on universal codes to use for exchanging statistical data has always been a majorchallenge for previous attempts to design statistical data exchange standards. SDMX, for example,requires creating committees that would agree on codes for a given domain. It is a quite heavyprocess that have slowed the adoption of the standard. The easiest way to avoid this problem is tosimply use the codes that have already been agreed on in international standards: systems ofnational accounts, manual of the balance of payment, international classifications such as ISIC,COICOP, etc.
We need a method that can generate a code from any existing classification in a simple andreproducible way. The proposed process is the following:
Agree on the short name of the standard. For example, if we are planning to use ISICRevision 4, we agree to use the short name ISIC Rev.4, as used in the UNSD website.
Use the standard table of the classification as published by the custodian organization. Forexample, for ISIC Rev.4, the first lines are:
o A - Agriculture, forestry and fishing
01 - Crop and animal production, hunting and related service activities
02 - Forestry and logging
03 - Fishing and aquaculture
Use the following simple method to generate a unique code for any line of the classification:
o In the short name of the classification, put everything in upper cases, eliminate allspaces and replace any character that is not a to z or 1 to 9 by lower case o. Forexample ISIC Rev.4 becomes ISICREVo4.
o Take the code of the line of interest in the classification (with dots for separatingdifferent levels) and apply the same process as above. For example, if we aresearching for the code for “Fishing and aquaculture”, the code would be A.03 andthe recoding would give Ao03.
o Concatenate the recoded classification code and level code with “ooo” betweenthem. The code for “Fishing and aquaculture”, in ISIC Rev.4 would then be:ISICREVo4oooAo03. This create a unique name for any level an any existingstatistical classification as long as there is a standard table of the classification withcodes for each line. GDP, as per the SNA 2008 code would be coded SNA2008B1Gusing the same method.
o Note: the use of alphabet characters rather than special characters for concatenatingdifferent parts of the indicator is a way to make the processing and searching of thesignature easy for standard search engines (who have tendency to split words overspecial characters while is important to be able to search the indicator code as oneword).
13
There will be indicators with two codes in case the same indicator is referred to in twoversions of the same classification, or in two different classifications, but using alternativescodes for searching can deal with this problem in a first stage.
In general, the classification code is not enough to identify an indicator as we needadditional information such as current or constant prices, national or international currency,etc. Sometimes the classification only defines a domain and we still need to answer thesetwo questions in order to get an indicator: what quantity are we measuring about thedomain? How are we measuring it? When necessary - .i.e. when is not already unambiguousfrom the classification - we need to add to the code generated above another combination oftow shorts code for this additional information. The following standard short codes areproposed and should cover the majority of the cases:
1- What are we measuring about the domain defined by the classification level?
PRD: Production
VAD: value added
PRC: Price
VOL: Volume
VAL: value in monetary units
Etc. (others to be defined as needed).
2- In which prices and which units are we measuring it?
KPNC - Constant prices, national currency
KPICPPP - Constant prices, international currency, PPP
KPICXR - Constant prices, international currency, exchange rates
KPICOTHER - Constant prices, international currency, other
CNC - Current prices, national currency
CPICPPP - Current prices, international currency, PPP
CPICXR - Current prices, international currency, exchange rates
(see full list in annex).
This should cover the majority of the cases. For example:
o SNA2008B1GoooVADoKPICPPP is the GDP at constant prices in internationalcurrency, converted using PPPs. Any additional information (which currency, etc.)would go into the keywords and the comments of the declaration. If we consider thatis clear that GDP is value added, we can just use the codeSNA2008B1GoooKPICPPP.
o ISICREVo4oooAo03oooPRDoCPNC is the production of the branch “Fishing andaquaculture”, in current prices and national currency.
14
II-d-) Declaring only partial information
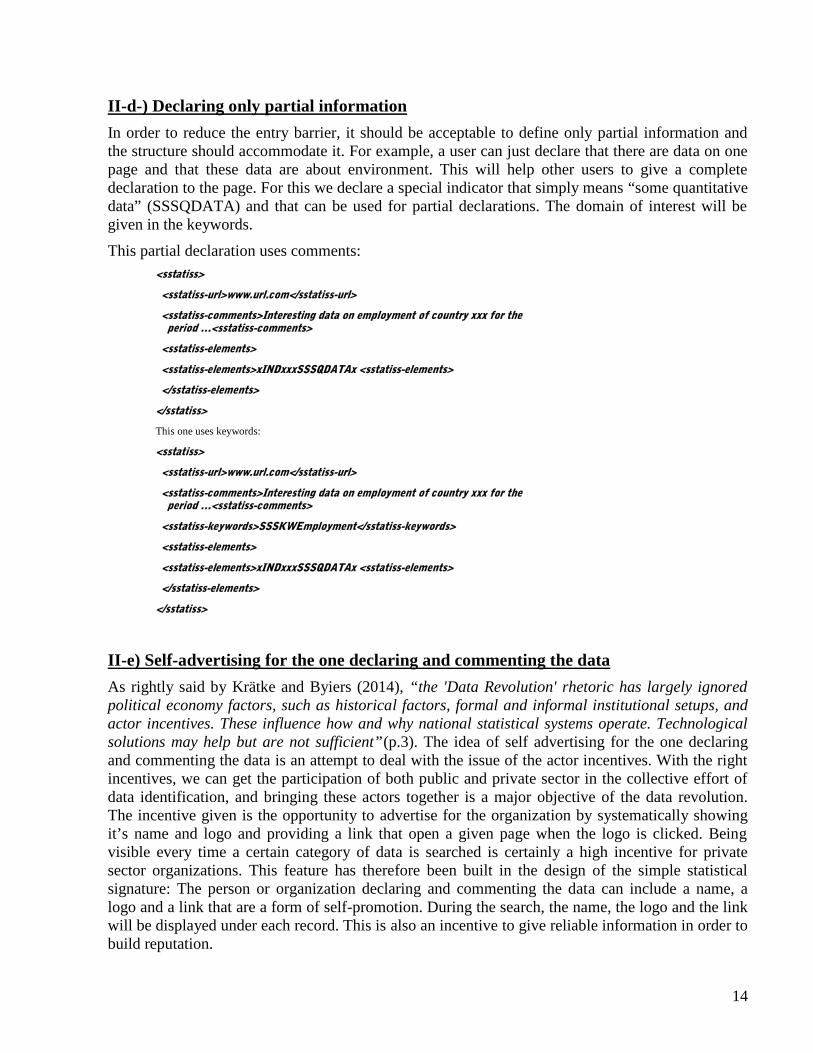
In order to reduce the entry barrier, it should be acceptable to define only partial information andthe structure should accommodate it. For example, a user can just declare that there are data on onepage and that these data are about environment. This will help other users to give a completedeclaration to the page. For this we declare a special indicator that simply means “some quantitativedata” (SSSQDATA) and that can be used for partial declarations. The domain of interest will begiven in the keywords.
This partial declaration uses comments:<sstatiss>
<sstatiss-url>www.url.com</sstatiss-url>
<sstatiss-comments>Interesting data on employment of country xxx for the period …<sstatiss-comments>
<sstatiss-elements>
<sstatiss-elements>xINDxxxSSSQDATAx <sstatiss-elements>
</sstatiss-elements>
</sstatiss>
This one uses keywords:
<sstatiss>
<sstatiss-url>www.url.com</sstatiss-url>
<sstatiss-comments>Interesting data on employment of country xxx for the period …<sstatiss-comments>
<sstatiss-keywords>SSSKWEmployment</sstatiss-keywords>
<sstatiss-elements>
<sstatiss-elements>xINDxxxSSSQDATAx <sstatiss-elements>
</sstatiss-elements>
</sstatiss>
II-e) Self-advertising for the one declaring and commenting the data
As rightly said by Krätke and Byiers (2014), “the 'Data Revolution' rhetoric has largely ignoredpolitical economy factors, such as historical factors, formal and informal institutional setups, andactor incentives. These influence how and why national statistical systems operate. Technologicalsolutions may help but are not sufficient”(p.3). The idea of self advertising for the one declaringand commenting the data is an attempt to deal with the issue of the actor incentives. With the rightincentives, we can get the participation of both public and private sector in the collective effort ofdata identification, and bringing these actors together is a major objective of the data revolution.The incentive given is the opportunity to advertise for the organization by systematically showingit’s name and logo and providing a link that open a given page when the logo is clicked. Beingvisible every time a certain category of data is searched is certainly a high incentive for privatesector organizations. This feature has therefore been built in the design of the simple statisticalsignature: The person or organization declaring and commenting the data can include a name, alogo and a link that are a form of self-promotion. During the search, the name, the logo and the linkwill be displayed under each record. This is also an incentive to give reliable information in order tobuild reputation.
15
The name should be declared this way:
<sstatiss-source>Name</sstatiss-source>
The logo and the link that should open when the logo is clicked should be given this way:
<sstatiss-logo>(url to image)xxx(url to page) </sstatiss-logo>
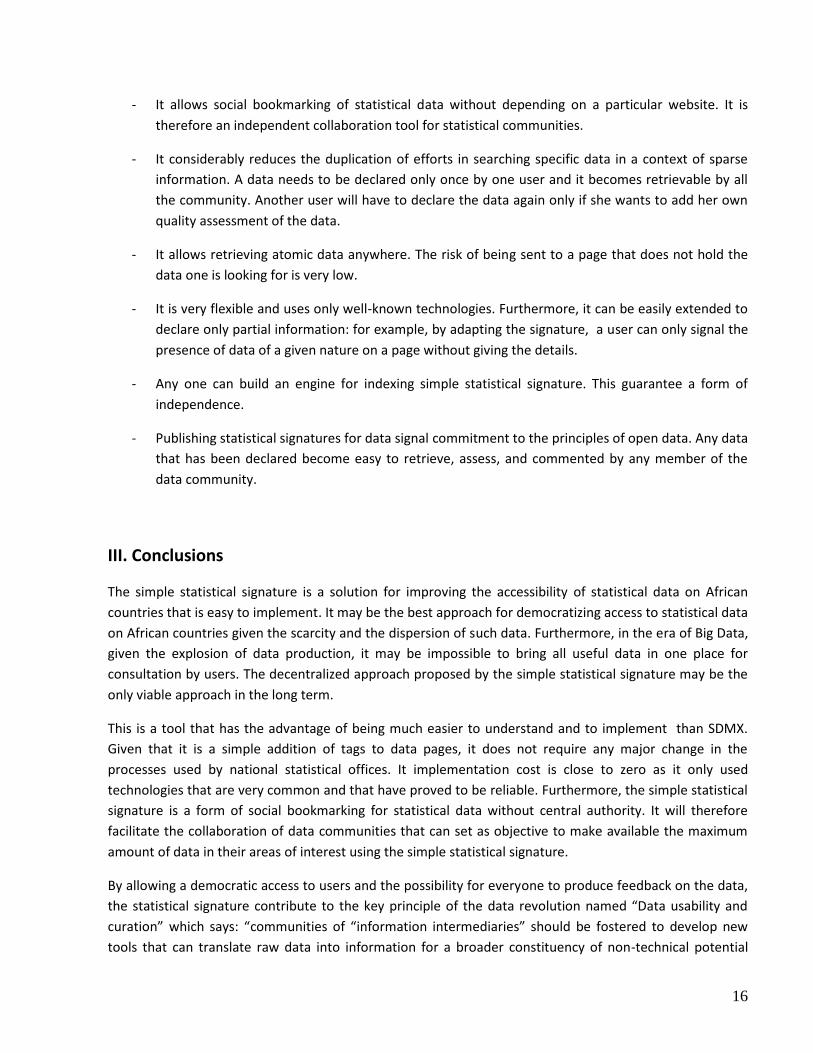
II-f-) Which technology for the search engine doing the indexing ?
There are already many open source software for building specialized search engines and that can be usedfor indexing simple statistical signature :
Apache Solr: http://lucene.apache.org/solr/
DataparkSearch Engine: http://www.dataparksearch.org/
OpenSearchServer : http://www.opensearchserver.com/fr/
Open Semantic Search : http://www.opensemanticsearch.org/
Sphinx: http://sphinxsearch.com/
For testing purposes, OpenSearchServer has been successfully used. The user interface for the test can befound at: http://testdada.onafrica.info.
III- Advantages of the simple statistical signature
The simple statistical signature has many advantages and meets the requirements to be a useful tool forthe data revolution in the context of decentralized information:
- It allows easily declaring for indexing even data that are not readable by a program, for exampledata that have been made available online as scanned images.
- It offers a collaborative approach for assessing the quality of the data and commenting on the datain the spirit of Open Data. Furthermore, it makes easier the collaboration of different institutionsfor making available to the public the same datasets produced by national organizations.
- The users retrieves the data in their original context, reducing the risk of wrong interpretation ortransmission errors. In addition, it gives the user access to the comments of the community on thedata.
- It is much simpler than SDMX and its implementation cost is close to zero. It therefore avoid theproblem of learning heavy new technologies for national statistical systems.
- It allows declaring other statistical information such as survey reports.
16
- It allows social bookmarking of statistical data without depending on a particular website. It istherefore an independent collaboration tool for statistical communities.
- It considerably reduces the duplication of efforts in searching specific data in a context of sparseinformation. A data needs to be declared only once by one user and it becomes retrievable by allthe community. Another user will have to declare the data again only if she wants to add her ownquality assessment of the data.
- It allows retrieving atomic data anywhere. The risk of being sent to a page that does not hold thedata one is looking for is very low.
- It is very flexible and uses only well-known technologies. Furthermore, it can be easily extended todeclare only partial information: for example, by adapting the signature, a user can only signal thepresence of data of a given nature on a page without giving the details.
- Any one can build an engine for indexing simple statistical signature. This guarantee a form ofindependence.
- Publishing statistical signatures for data signal commitment to the principles of open data. Any datathat has been declared become easy to retrieve, assess, and commented by any member of thedata community.
III. Conclusions
The simple statistical signature is a solution for improving the accessibility of statistical data on Africancountries that is easy to implement. It may be the best approach for democratizing access to statistical dataon African countries given the scarcity and the dispersion of such data. Furthermore, in the era of Big Data,given the explosion of data production, it may be impossible to bring all useful data in one place forconsultation by users. The decentralized approach proposed by the simple statistical signature may be theonly viable approach in the long term.
This is a tool that has the advantage of being much easier to understand and to implement than SDMX.Given that it is a simple addition of tags to data pages, it does not require any major change in theprocesses used by national statistical offices. It implementation cost is close to zero as it only usedtechnologies that are very common and that have proved to be reliable. Furthermore, the simple statisticalsignature is a form of social bookmarking for statistical data without central authority. It will thereforefacilitate the collaboration of data communities that can set as objective to make available the maximumamount of data in their areas of interest using the simple statistical signature.
By allowing a democratic access to users and the possibility for everyone to produce feedback on the data,the statistical signature contribute to the key principle of the data revolution named “Data usability andcuration” which says: “communities of “information intermediaries” should be fostered to develop newtools that can translate raw data into information for a broader constituency of non-technical potential

17
users and enable citizens and other data users to provide feedback.” (United Nations, 2014, p.22). Thesimple statistical signature has therefore many advantages that may allow it to become a useful tool at theservice of the data revolution on the continent.
18
Bibliography
Bizer, C., Heath, T., & Berners-Lee, T. (2009). Linked data-the story so far. Semantic Services,Interoperability and Web Applications: Emerging Concepts, 205-227.
Capadisli, S. (2012) Statistical linked dataspaces. Diss. Master’s thesis, National University of Ireland,Galway, College of Engineering and Informatics, Digital Enterprise Research Institute.
Capadisli, Sarven, Sören Auer, and A-C. Ngonga Ngomo (2013). "Linked SDMX data." Semantic Web Journal:1-8.
Glassman, A., & Ezeh, A. (2014). Delivering on a Data Revolution in Sub-Saharan Africa. Center for GlobalDevelopment Brief. Retrieved from h ttp://www. cgdev. org/sites/default/files/delivering-data-revolutionsub-saharan-africa-pdf. pdf.
Gregory, A., & Heus, P. (2007). DDI and SDMX: Complementary, not competing, standards. Paper, OpenData Foundation (July 2007).
Kiregyera, B. (2015). The Emerging Data Revolution in Africa: Strengthening the Statistics, Policy andDecision-making Chain. AFRICAN SUN MeDIA.
Krätke, Florian, and Bruce Byiers. "The Political Economy of Official Statistics." (2014).
Naisbitt, J. (1986) Megatrends. Warner Books, 6th edition.
UNECA (2015). Side-Event : Data Revolution in Africa - Setting the scene for a sustainable developmentagenda powered by Data Revolution in Africa. Proceedings of the 8th Joint Annual Meetings of the AfricanUnion Specialized Technical Committee on Finance, Monetary Affairs, Economic Planning and Integrationand the ECA Conference of African Ministers of Finance, Planning and Economic Development. AddisAbaba, Ethiopia, 25-31 March 2015. (http://www.uneca.org/datarevolution, accessed 31 August 2015).
United Nations (2014) A World That Counts – Mobilising the Data Revolution for Sustainable Development
19
Annexes
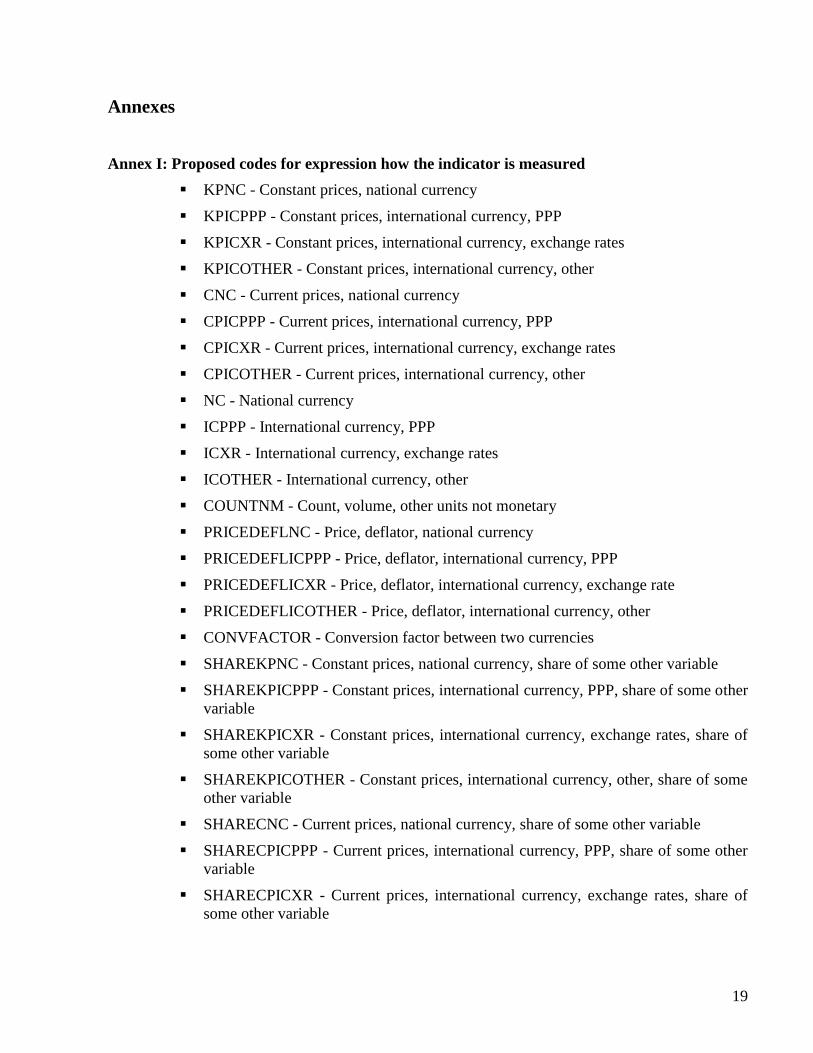
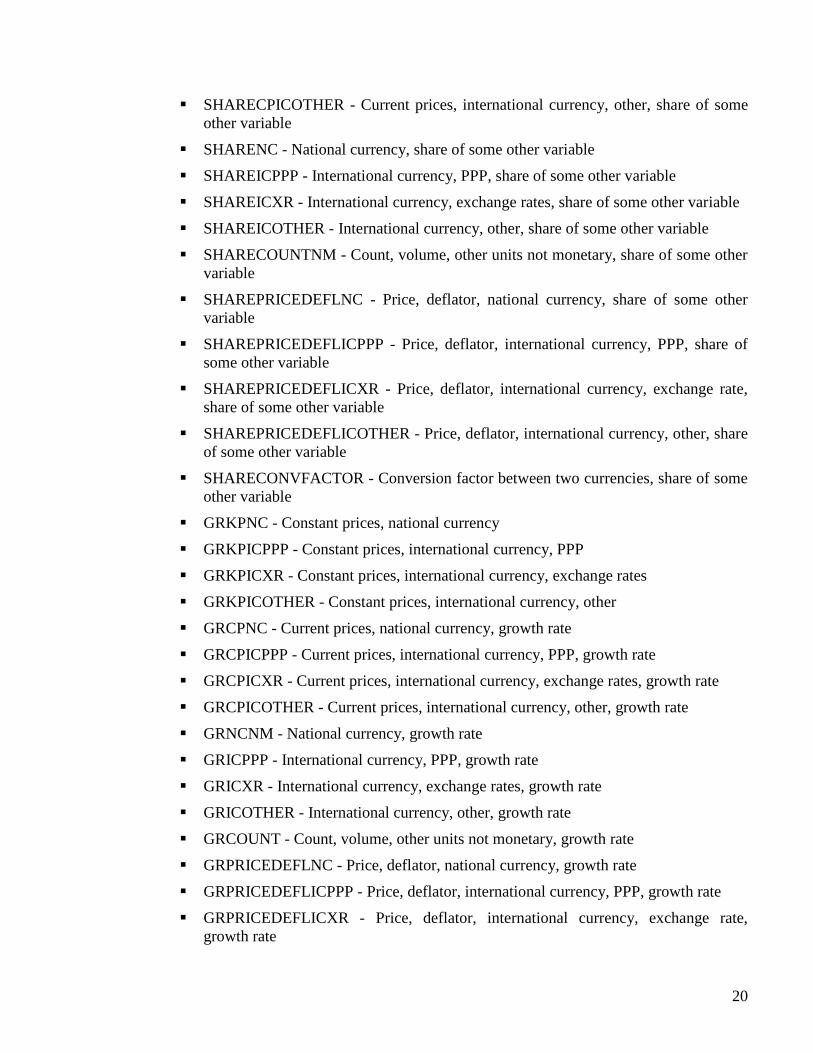
Annex I: Proposed codes for expression how the indicator is measured
KPNC - Constant prices, national currency
KPICPPP - Constant prices, international currency, PPP
KPICXR - Constant prices, international currency, exchange rates
KPICOTHER - Constant prices, international currency, other
CNC - Current prices, national currency
CPICPPP - Current prices, international currency, PPP
CPICXR - Current prices, international currency, exchange rates
CPICOTHER - Current prices, international currency, other
NC - National currency
ICPPP - International currency, PPP
ICXR - International currency, exchange rates
ICOTHER - International currency, other
COUNTNM - Count, volume, other units not monetary
PRICEDEFLNC - Price, deflator, national currency
PRICEDEFLICPPP - Price, deflator, international currency, PPP
PRICEDEFLICXR - Price, deflator, international currency, exchange rate
PRICEDEFLICOTHER - Price, deflator, international currency, other
CONVFACTOR - Conversion factor between two currencies
SHAREKPNC - Constant prices, national currency, share of some other variable
SHAREKPICPPP - Constant prices, international currency, PPP, share of some othervariable
SHAREKPICXR - Constant prices, international currency, exchange rates, share ofsome other variable
SHAREKPICOTHER - Constant prices, international currency, other, share of someother variable
SHARECNC - Current prices, national currency, share of some other variable
SHARECPICPPP - Current prices, international currency, PPP, share of some othervariable
SHARECPICXR - Current prices, international currency, exchange rates, share ofsome other variable
20
SHARECPICOTHER - Current prices, international currency, other, share of someother variable
SHARENC - National currency, share of some other variable
SHAREICPPP - International currency, PPP, share of some other variable
SHAREICXR - International currency, exchange rates, share of some other variable
SHAREICOTHER - International currency, other, share of some other variable
SHARECOUNTNM - Count, volume, other units not monetary, share of some othervariable
SHAREPRICEDEFLNC - Price, deflator, national currency, share of some othervariable
SHAREPRICEDEFLICPPP - Price, deflator, international currency, PPP, share ofsome other variable
SHAREPRICEDEFLICXR - Price, deflator, international currency, exchange rate,share of some other variable
SHAREPRICEDEFLICOTHER - Price, deflator, international currency, other, shareof some other variable
SHARECONVFACTOR - Conversion factor between two currencies, share of someother variable
GRKPNC - Constant prices, national currency
GRKPICPPP - Constant prices, international currency, PPP
GRKPICXR - Constant prices, international currency, exchange rates
GRKPICOTHER - Constant prices, international currency, other
GRCPNC - Current prices, national currency, growth rate
GRCPICPPP - Current prices, international currency, PPP, growth rate
GRCPICXR - Current prices, international currency, exchange rates, growth rate
GRCPICOTHER - Current prices, international currency, other, growth rate
GRNCNM - National currency, growth rate
GRICPPP - International currency, PPP, growth rate
GRICXR - International currency, exchange rates, growth rate
GRICOTHER - International currency, other, growth rate
GRCOUNT - Count, volume, other units not monetary, growth rate
GRPRICEDEFLNC - Price, deflator, national currency, growth rate
GRPRICEDEFLICPPP - Price, deflator, international currency, PPP, growth rate
GRPRICEDEFLICXR - Price, deflator, international currency, exchange rate,growth rate

21
GRPRICEDEFLICOTHER - Price, deflator, international currency, other, growthrate
GRCONVFACTOR - Conversion factor between two currencies, growth rate