Embed Size (px)
Citation preview
SFL 2018 CONSOLIDATED FINANCIAL STATEMENTS - 1
SOCIÉ TÉ FONCIÉ RÉ LYONNAISÉ
CONSOLIDATED FINANCIAL STATEMENTS
YEAR ENDED 31 DECEMBER 2018
A – Consolidated Statement of Financial Position B – Consolidated Statement of Comprehensive Income C – Consolidated Statement of Changes in Equity D – Consolidated Statement of Cash Flows E – Notes to the Consolidated Financial Statements I - Accounting Policies II - Significant Events of the Year III - Segment Information
IV - Intangible Assets, Property and Equipment, and Investment Property V - Operating Activities VI - Financing Activities
VII - Equity and Earnings Per Share VIII - Provisions IX - Remuneration and Other Employee Benefits X - Income Taxes XI - Off-Balance Sheet Commitments XII - Note to the Statement of Cash Flows XIII - Scope of Consolidation
The financial statements were approved for publication by the Board of Directors on 15 February 2019.
SFL 2018 CONSOLIDATED FINANCIAL STATEMENTS - 2
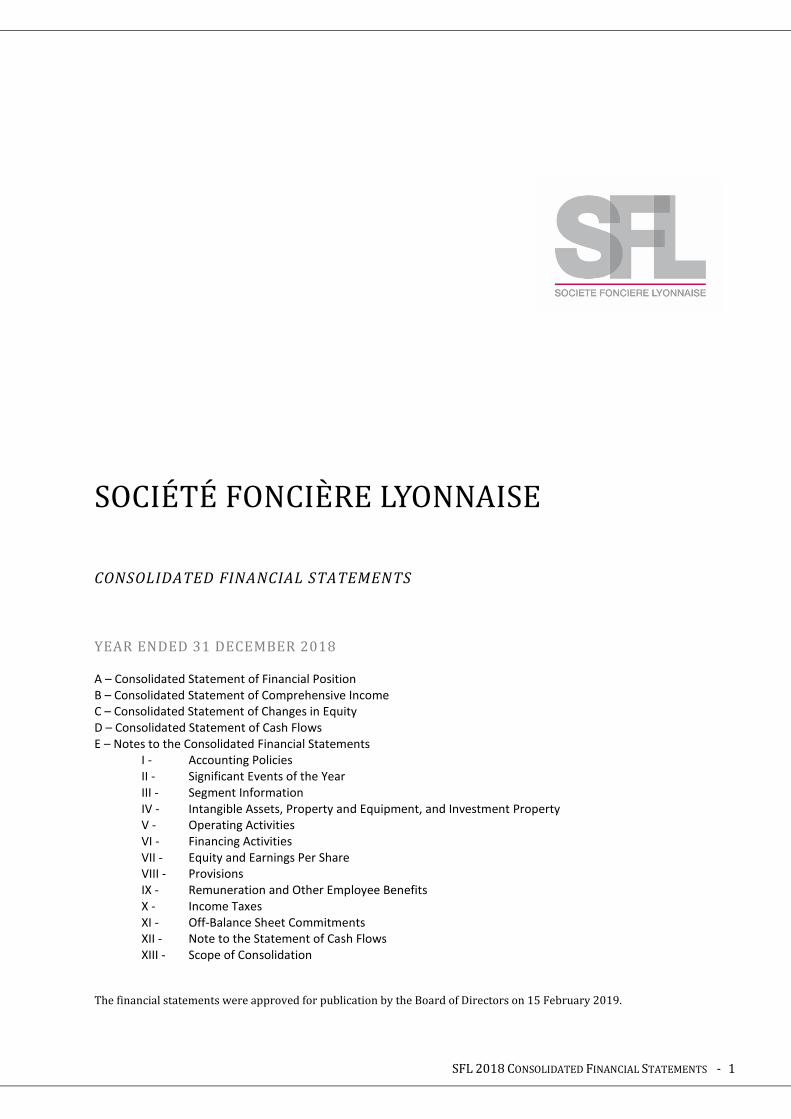
A – Consolidated Statement of Financial Position
(in thousands of euros) Notes 31 Dec. 2018 31 Dec. 2017
ASSETS Section E
Intangible assets IV-1 659 1,209
Property and equipment IV-2 20,834 21,606
Investment property IV-5 6,458,430 6,119,148
Non-current financial assets VI-5 820 2,181
Other non-current assets V-4 32 69
Total non-current assets 6,480,775 6,144,213
Trade and other receivables V-3 82,351 88,382
Other current assets V-4 371 290
Cash and cash equivalents VI-6 25,304 15,710
Total current assets 108,026 104,382
Total assets 6,588,801 6,248,595
(in thousands of euros) Notes 31 Dec. 2018 31 Dec. 2017
EQUITY AND LIABILITIES Section E
Share capital 93,058 93,058
Reserves 3,565,162 2,984,611
Profit for the year 351,636 685,284
Equity attributable to owners of the parent 4,009,856 3,762,953
Non-controlling interests 502,107 476,019
Total non-controlling interests 502,107 476,019
Total equity VII-1 4,511,963 4,238,972
Long-term borrowings and derivative instruments VI-1 1,494,080 1,661,231
Long-term provisions VIII-1 1,220 1,161
Deferred tax liabilities X-3 205,062 197,976
Accrued taxes X-1 13,368 21,390
Other non-current liabilities V-6 23,214 22,136
Total non-current liabilities 1,736,944 1,903,894
Trade and other payables V-5 25,320 16,798
Short-term borrowings and other interest-bearing debt VI-1 268,958 36,485
Short-term provisions VIII-1 1,349 369
Other current liabilities V-6 44,267 52,077
Total current liabilities 339,894 105,729
Total equity and liabilities 6,588,801 6,248,595
SFL 2018 CONSOLIDATED FINANCIAL STATEMENTS - 3
B – Consolidated Statement of Comprehensive Income
(in thousands of euros) Notes 2018 2017
Section E
Rental income 193,509 195,780
Property expenses, net of recoveries (10,773) (10,873)
Net property rentals V-1 182,736 184,907
Other income V-2 4,009 2,160
Depreciation, amortisation and impairment IV-3 (1,569) (1,345)
Provision (expense)/reversals, net VIII-2 (1,304) 1,667
Employee benefits expense IX-1 (12,788) (15,409)
Other expenses V-7 (8,987) (7,916)
Profit/(loss) on disposal of other assets IV-4 (6) -
Profit on disposal of investment property IV-6 22 80,290
Fair value adjustments on investment property IV-7 289,014 635,131
Operating profit 451,127 879,485
Finance costs and other financial expenses VI-2 (36,728) (42,861)
Financial income VI-2 4,276 1,522
Fair value adjustments to financial instruments VI-3 (18,987) 43
Discounting adjustments to receivables and payables (548) 606
Changes in provisions for financial assets, net - -
Profit before income tax 399,140 838,795
Income tax X-2-3 (14,494) (42,523)
Profit for the year 384,646 796,272
Attributable to owners of the parent 351,636 685,284
Attributable to non-controlling interests VII-5 33,010 110,988
Earnings per share VII-4 €7.60 €14.83
Other comprehensive income
Actuarial gains and losses VIII-1 8 53
Other items (15) -
Items that will not be reclassified to profit or loss (7) 53
Valuation gains and losses on financial instruments (cash flow hedges)
- -
Deferred tax impact of valuation gains and losses on financial instruments
- -
Items that may be reclassified subsequently to profit or loss - -
Other comprehensive income (7) 53
Comprehensive income 384,639 796,325
Attributable to owners of the parent 351,629 685,337
Attributable to non-controlling interests 33,010 110,988
SFL 2018 CONSOLIDATED FINANCIAL STATEMENTS - 4
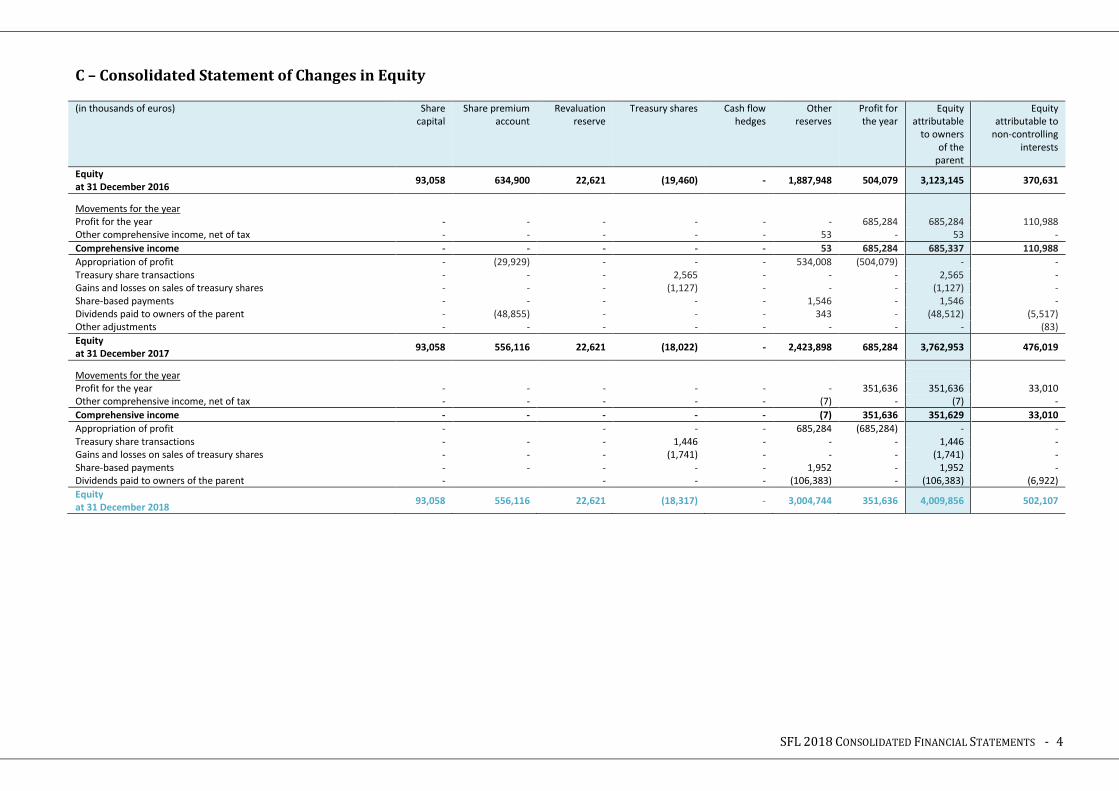
C – Consolidated Statement of Changes in Equity (in thousands of euros) Share
capital Share premium
account Revaluation
reserve Treasury shares Cash flow
hedges Other
reserves Profit for the year
Equity attributable
to owners of the
parent
Equity attributable to
non-controlling interests
Equity at 31 December 2016
93,058 634,900 22,621 (19,460) - 1,887,948 504,079 3,123,145 370,631
Movements for the year Profit for the year - - - - - - 685,284 685,284 110,988 Other comprehensive income, net of tax - - - - - 53 - 53 -
Comprehensive income - - - - - 53 685,284 685,337 110,988
Appropriation of profit - (29,929) - - - 534,008 (504,079) - - Treasury share transactions - - - 2,565 - - - 2,565 - Gains and losses on sales of treasury shares - - - (1,127) - - - (1,127) - Share-based payments - - - - - 1,546 - 1,546 - Dividends paid to owners of the parent - (48,855) - - - 343 - (48,512) (5,517) Other adjustments - - - - - - - - (83)
Equity at 31 December 2017
93,058 556,116 22,621 (18,022) - 2,423,898 685,284 3,762,953 476,019
Movements for the year Profit for the year - - - - - - 351,636 351,636 33,010 Other comprehensive income, net of tax - - - - - (7) - (7) -
Comprehensive income - - - - - (7) 351,636 351,629 33,010
Appropriation of profit - - - - 685,284 (685,284) - - Treasury share transactions - - - 1,446 - - - 1,446 - Gains and losses on sales of treasury shares - - - (1,741) - - - (1,741) - Share-based payments - - - - - 1,952 - 1,952 - Dividends paid to owners of the parent - - - - (106,383) - (106,383) (6,922)
Equity at 31 December 2018
93,058 556,116 22,621 (18,317) - 3,004,744 351,636 4,009,856 502,107
SFL 2018 CONSOLIDATED FINANCIAL STATEMENTS - 5
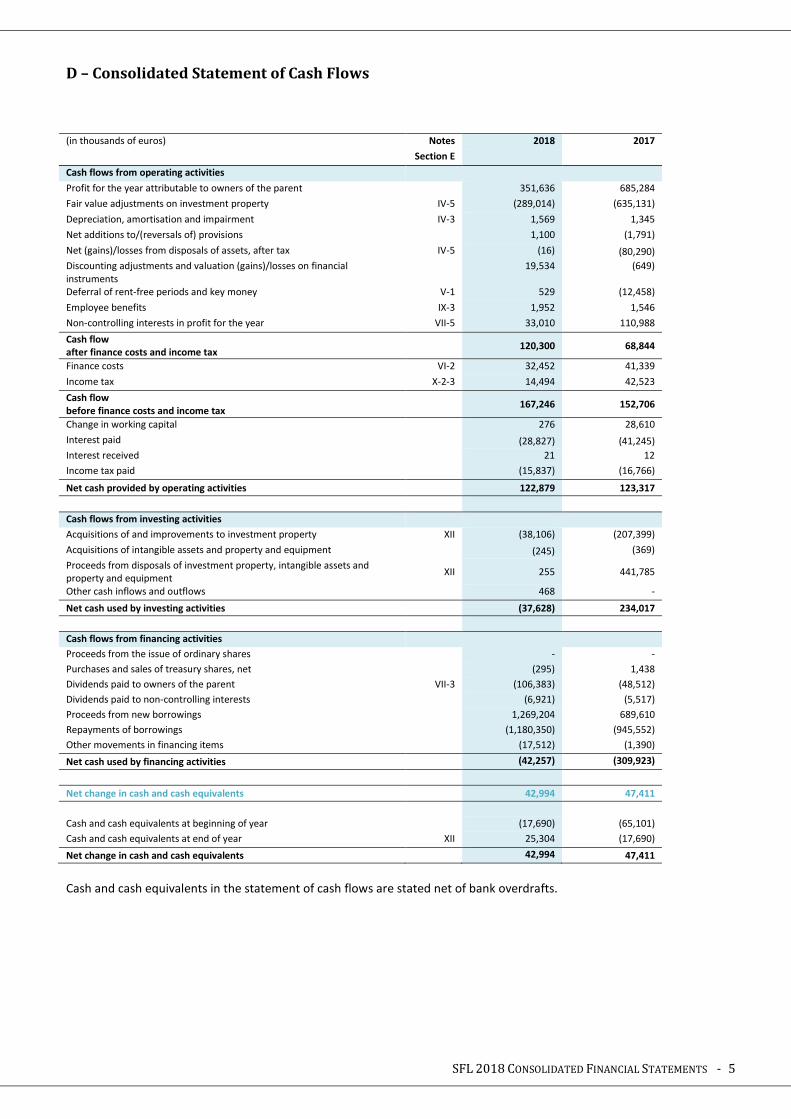
D – Consolidated Statement of Cash Flows
(in thousands of euros) Notes 2018 2017
Section E
Cash flows from operating activities
Profit for the year attributable to owners of the parent 351,636 685,284
Fair value adjustments on investment property IV-5 (289,014) (635,131)
Depreciation, amortisation and impairment IV-3 1,569 1,345
Net additions to/(reversals of) provisions 1,100 (1,791)
Net (gains)/losses from disposals of assets, after tax IV-5 (16) (80,290)
Discounting adjustments and valuation (gains)/losses on financial instruments
19,534 (649)
Deferral of rent-free periods and key money V-1 529 (12,458)
Employee benefits IX-3 1,952 1,546
Non-controlling interests in profit for the year VII-5 33,010 110,988
Cash flow after finance costs and income tax
120,300 68,844
Finance costs VI-2 32,452 41,339
Income tax X-2-3 14,494 42,523
Cash flow before finance costs and income tax
167,246 152,706
Change in working capital 276 28,610
Interest paid (28,827) (41,245)
Interest received 21 12
Income tax paid (15,837) (16,766)
Net cash provided by operating activities 122,879 123,317
Cash flows from investing activities
Acquisitions of and improvements to investment property XII (38,106) (207,399)
Acquisitions of intangible assets and property and equipment (245) (369)
Proceeds from disposals of investment property, intangible assets and property and equipment
XII 255 441,785
Other cash inflows and outflows 468 -
Net cash used by investing activities (37,628) 234,017
Cash flows from financing activities
Proceeds from the issue of ordinary shares - -
Purchases and sales of treasury shares, net (295) 1,438
Dividends paid to owners of the parent VII-3 (106,383) (48,512)
Dividends paid to non-controlling interests (6,921) (5,517)
Proceeds from new borrowings 1,269,204 689,610
Repayments of borrowings (1,180,350) (945,552)
Other movements in financing items (17,512) (1,390)
Net cash used by financing activities (42,257) (309,923)
Net change in cash and cash equivalents 42,994 47,411
Cash and cash equivalents at beginning of year (17,690) (65,101)
Cash and cash equivalents at end of year XII 25,304 (17,690)
Net change in cash and cash equivalents 42,994 47,411
Cash and cash equivalents in the statement of cash flows are stated net of bank overdrafts.
SFL 2018 CONSOLIDATED FINANCIAL STATEMENTS - 6
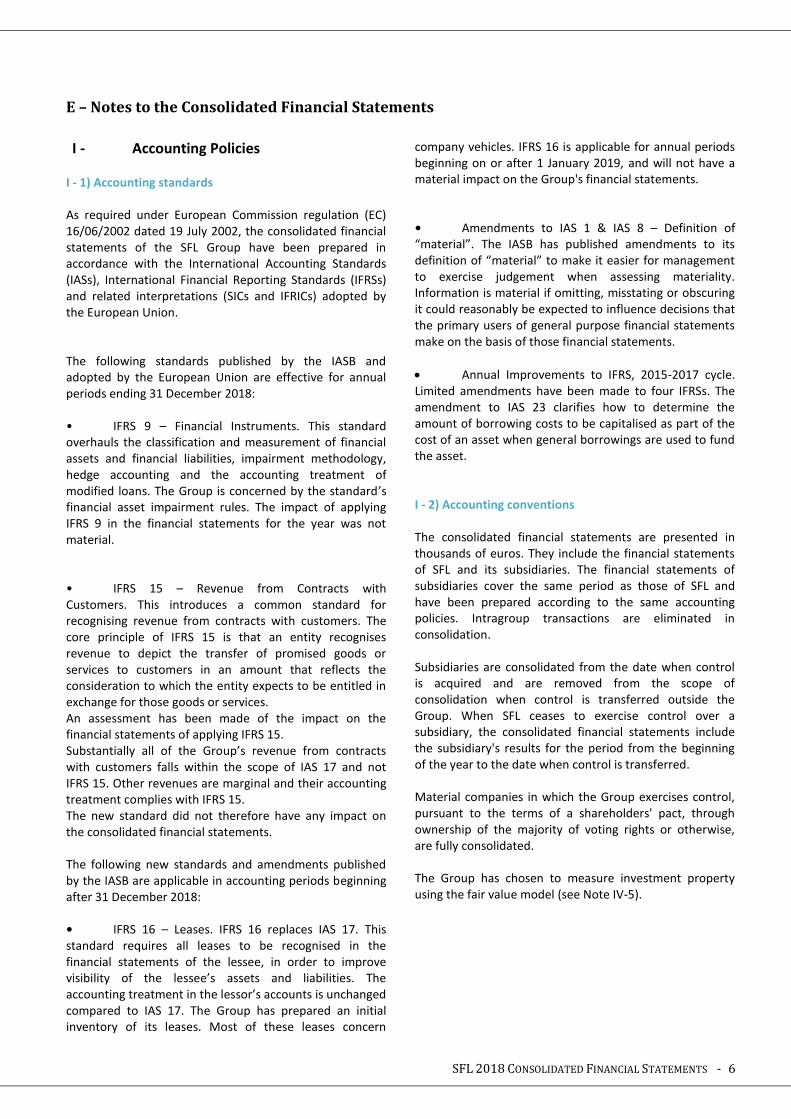
E – Notes to the Consolidated Financial Statements
I - Accounting Policies
I - 1) Accounting standards As required under European Commission regulation (EC) 16/06/2002 dated 19 July 2002, the consolidated financial statements of the SFL Group have been prepared in accordance with the International Accounting Standards (IASs), International Financial Reporting Standards (IFRSs) and related interpretations (SICs and IFRICs) adopted by the European Union. The following standards published by the IASB and adopted by the European Union are effective for annual periods ending 31 December 2018: • IFRS 9 – Financial Instruments. This standard overhauls the classification and measurement of financial assets and financial liabilities, impairment methodology, hedge accounting and the accounting treatment of modified loans. The Group is concerned by the standard’s financial asset impairment rules. The impact of applying IFRS 9 in the financial statements for the year was not material. • IFRS 15 – Revenue from Contracts with Customers. This introduces a common standard for recognising revenue from contracts with customers. The core principle of IFRS 15 is that an entity recognises revenue to depict the transfer of promised goods or services to customers in an amount that reflects the consideration to which the entity expects to be entitled in exchange for those goods or services. An assessment has been made of the impact on the financial statements of applying IFRS 15. Substantially all of the Group’s revenue from contracts with customers falls within the scope of IAS 17 and not IFRS 15. Other revenues are marginal and their accounting treatment complies with IFRS 15. The new standard did not therefore have any impact on the consolidated financial statements. The following new standards and amendments published by the IASB are applicable in accounting periods beginning after 31 December 2018: • IFRS 16 – Leases. IFRS 16 replaces IAS 17. This standard requires all leases to be recognised in the financial statements of the lessee, in order to improve visibility of the lessee’s assets and liabilities. The accounting treatment in the lessor’s accounts is unchanged compared to IAS 17. The Group has prepared an initial inventory of its leases. Most of these leases concern
company vehicles. IFRS 16 is applicable for annual periods beginning on or after 1 January 2019, and will not have a material impact on the Group's financial statements. • Amendments to IAS 1 & IAS 8 – Definition of “material”. The IASB has published amendments to its definition of “material” to make it easier for management to exercise judgement when assessing materiality. Information is material if omitting, misstating or obscuring it could reasonably be expected to influence decisions that the primary users of general purpose financial statements make on the basis of those financial statements.
• Annual Improvements to IFRS, 2015-2017 cycle. Limited amendments have been made to four IFRSs. The amendment to IAS 23 clarifies how to determine the amount of borrowing costs to be capitalised as part of the cost of an asset when general borrowings are used to fund the asset. I - 2) Accounting conventions The consolidated financial statements are presented in thousands of euros. They include the financial statements of SFL and its subsidiaries. The financial statements of subsidiaries cover the same period as those of SFL and have been prepared according to the same accounting policies. Intragroup transactions are eliminated in consolidation. Subsidiaries are consolidated from the date when control is acquired and are removed from the scope of consolidation when control is transferred outside the Group. When SFL ceases to exercise control over a subsidiary, the consolidated financial statements include the subsidiary's results for the period from the beginning of the year to the date when control is transferred. Material companies in which the Group exercises control, pursuant to the terms of a shareholders' pact, through ownership of the majority of voting rights or otherwise, are fully consolidated. The Group has chosen to measure investment property using the fair value model (see Note IV-5).
SFL 2018 CONSOLIDATED FINANCIAL STATEMENTS - 7
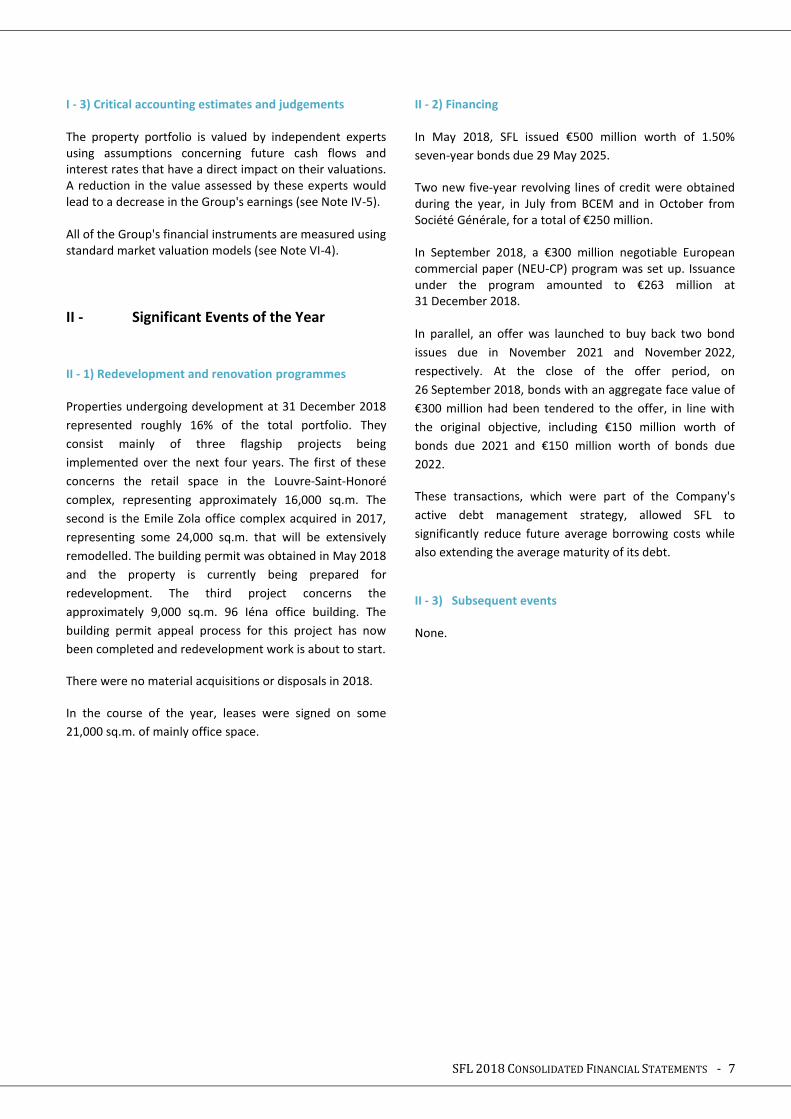
I - 3) Critical accounting estimates and judgements The property portfolio is valued by independent experts using assumptions concerning future cash flows and interest rates that have a direct impact on their valuations. A reduction in the value assessed by these experts would lead to a decrease in the Group's earnings (see Note IV-5). All of the Group's financial instruments are measured using standard market valuation models (see Note VI-4).
II - Significant Events of the Year
II - 1) Redevelopment and renovation programmes Properties undergoing development at 31 December 2018
represented roughly 16% of the total portfolio. They
consist mainly of three flagship projects being
implemented over the next four years. The first of these
concerns the retail space in the Louvre-Saint-Honoré
complex, representing approximately 16,000 sq.m. The
second is the Emile Zola office complex acquired in 2017,
representing some 24,000 sq.m. that will be extensively
remodelled. The building permit was obtained in May 2018
and the property is currently being prepared for
redevelopment. The third project concerns the
approximately 9,000 sq.m. 96 Iéna office building. The
building permit appeal process for this project has now
been completed and redevelopment work is about to start.
There were no material acquisitions or disposals in 2018.
In the course of the year, leases were signed on some
21,000 sq.m. of mainly office space.
II - 2) Financing In May 2018, SFL issued €500 million worth of 1.50%
seven-year bonds due 29 May 2025.
Two new five-year revolving lines of credit were obtained during the year, in July from BCEM and in October from Société Générale, for a total of €250 million. In September 2018, a €300 million negotiable European commercial paper (NEU-CP) program was set up. Issuance under the program amounted to €263 million at 31 December 2018. In parallel, an offer was launched to buy back two bond
issues due in November 2021 and November 2022,
respectively. At the close of the offer period, on
26 September 2018, bonds with an aggregate face value of
€300 million had been tendered to the offer, in line with
the original objective, including €150 million worth of
bonds due 2021 and €150 million worth of bonds due
2022.
These transactions, which were part of the Company's
active debt management strategy, allowed SFL to
significantly reduce future average borrowing costs while
also extending the average maturity of its debt.
II - 3) Subsequent events None.
SFL 2018 CONSOLIDATED FINANCIAL STATEMENTS - 8
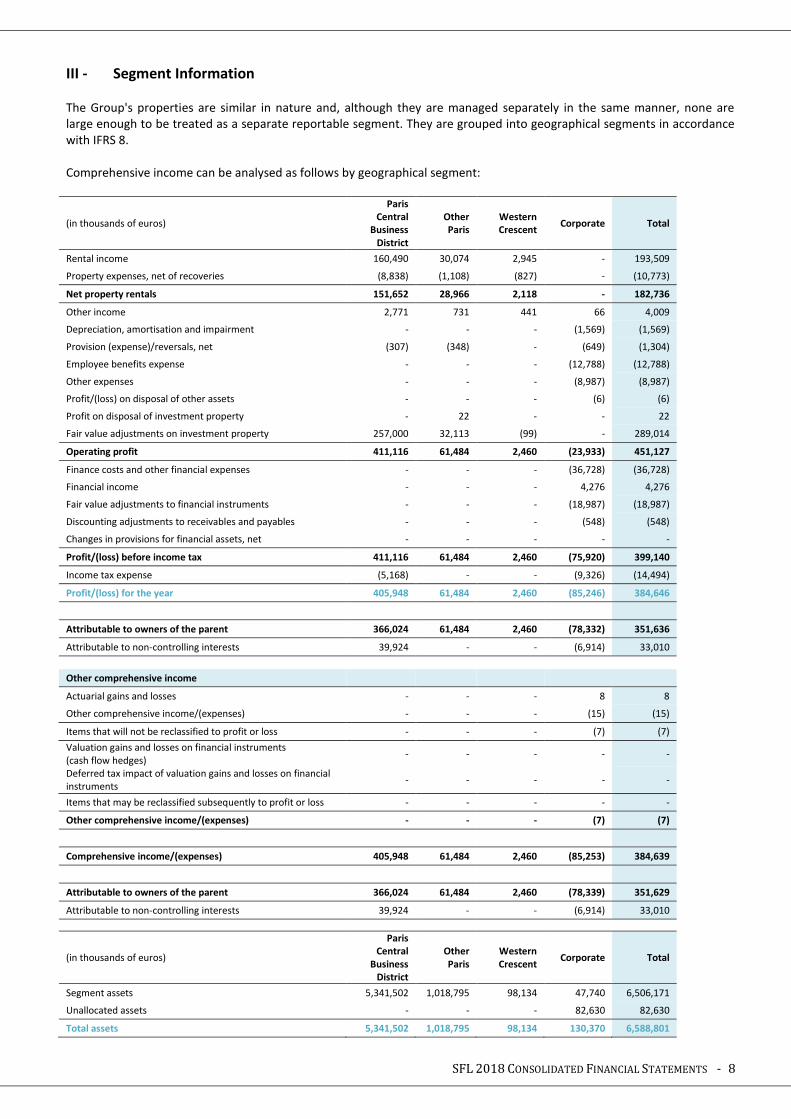
III - Segment Information
The Group's properties are similar in nature and, although they are managed separately in the same manner, none are large enough to be treated as a separate reportable segment. They are grouped into geographical segments in accordance with IFRS 8. Comprehensive income can be analysed as follows by geographical segment:
(in thousands of euros)
Paris Central
Business District
Other Paris
Western Crescent
Corporate Total
Rental income 160,490 30,074 2,945 - 193,509
Property expenses, net of recoveries (8,838) (1,108) (827) - (10,773)
Net property rentals 151,652 28,966 2,118 - 182,736
Other income 2,771 731 441 66 4,009
Depreciation, amortisation and impairment - - - (1,569) (1,569)
Provision (expense)/reversals, net (307) (348) - (649) (1,304)
Employee benefits expense - - - (12,788) (12,788)
Other expenses - - - (8,987) (8,987)
Profit/(loss) on disposal of other assets - - - (6) (6)
Profit on disposal of investment property - 22 - - 22
Fair value adjustments on investment property 257,000 32,113 (99) - 289,014
Operating profit 411,116 61,484 2,460 (23,933) 451,127
Finance costs and other financial expenses - - - (36,728) (36,728)
Financial income - - - 4,276 4,276
Fair value adjustments to financial instruments - - - (18,987) (18,987)
Discounting adjustments to receivables and payables - - - (548) (548)
Changes in provisions for financial assets, net - - - - -
Profit/(loss) before income tax 411,116 61,484 2,460 (75,920) 399,140
Income tax expense (5,168) - - (9,326) (14,494)
Profit/(loss) for the year 405,948 61,484 2,460 (85,246) 384,646
Attributable to owners of the parent 366,024 61,484 2,460 (78,332) 351,636
Attributable to non-controlling interests 39,924 - - (6,914) 33,010
Other comprehensive income
Actuarial gains and losses - - - 8 8
Other comprehensive income/(expenses) - - - (15) (15)
Items that will not be reclassified to profit or loss - - - (7) (7)
Valuation gains and losses on financial instruments (cash flow hedges)
- - - - -
Deferred tax impact of valuation gains and losses on financial instruments
- - - - -
Items that may be reclassified subsequently to profit or loss - - - - -
Other comprehensive income/(expenses) - - - (7) (7)
Comprehensive income/(expenses) 405,948 61,484 2,460 (85,253) 384,639
Attributable to owners of the parent 366,024 61,484 2,460 (78,339) 351,629
Attributable to non-controlling interests 39,924 - - (6,914) 33,010
(in thousands of euros)
Paris Central
Business District
Other Paris
Western Crescent
Corporate Total
Segment assets 5,341,502 1,018,795 98,134 47,740 6,506,171
Unallocated assets - - - 82,630 82,630
Total assets 5,341,502 1,018,795 98,134 130,370 6,588,801
SFL 2018 CONSOLIDATED FINANCIAL STATEMENTS - 9
Segment assets correspond mainly to the Group's property assets. No segment analysis of liabilities is presented, as they correspond primarily to unsecured financing for general corporate purposes and unsecured bonds that are not allocated to any specific segment. The Group's main geographical segments are as follows: * Paris Central Business District: market comprising the Golden Triangle and the Financial District, spanning parts of the 1st, 2nd, 9th, 8th, 16th and 17th arrondissements of Paris. The segment extends from Porte Maillot, avenue de Malakoff and Trocadéro in the west to rue Montmartre and rue du Louvre in the east, and from Porte Champerret, avenue de Villiers and Saint-Lazare railway station in the north to rue de Rivoli in the south.
* Other Paris: corresponding to the rest of Paris, outside the Central Business District. * Western Crescent: located to the west of Paris on the other side of the Boulevard Périphérique ring-road, comprising notably Neuilly-sur-Seine, Boulogne-Billancourt, Issy-les-Moulineaux and Levallois-Perret. These geographic segments have been defined by the main Paris-based real estate professionals by combining neighbourhoods with similar economic features.
IV - Intangible Assets, Property and Equipment, and Investment Property
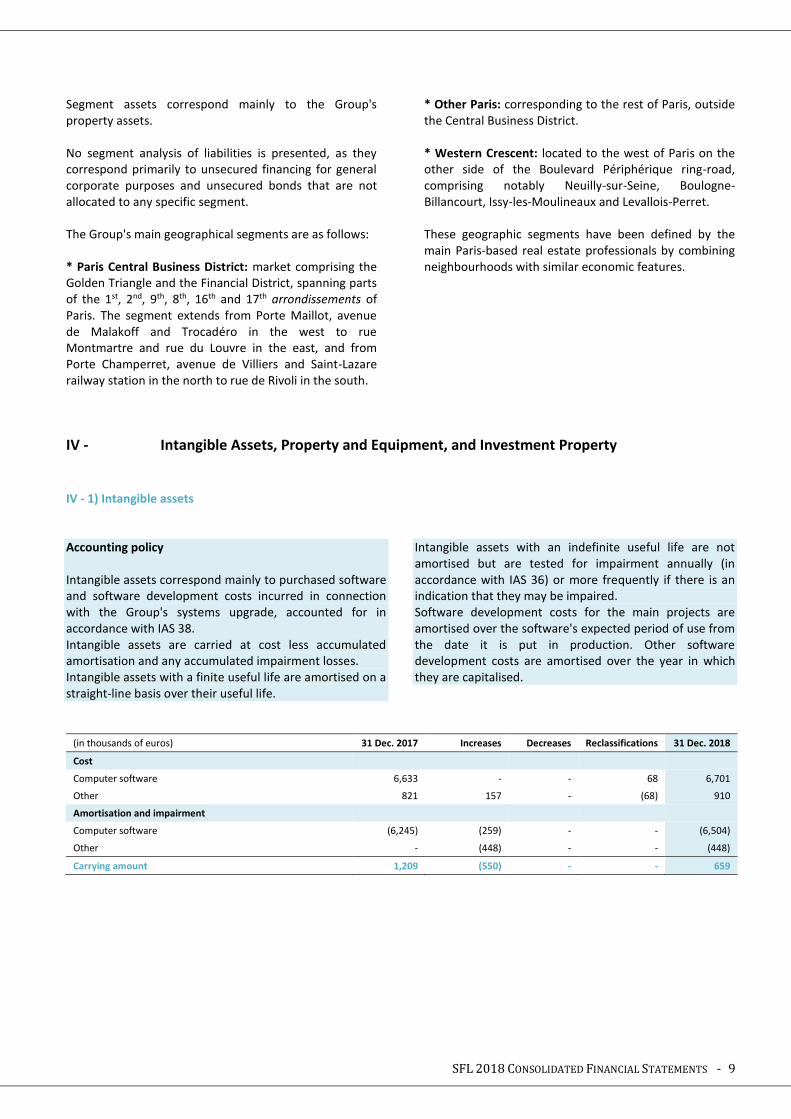
IV - 1) Intangible assets Accounting policy Intangible assets correspond mainly to purchased software and software development costs incurred in connection with the Group's systems upgrade, accounted for in accordance with IAS 38. Intangible assets are carried at cost less accumulated amortisation and any accumulated impairment losses. Intangible assets with a finite useful life are amortised on a straight-line basis over their useful life.
Intangible assets with an indefinite useful life are not amortised but are tested for impairment annually (in accordance with IAS 36) or more frequently if there is an indication that they may be impaired. Software development costs for the main projects are amortised over the software's expected period of use from the date it is put in production. Other software development costs are amortised over the year in which they are capitalised.
(in thousands of euros) 31 Dec. 2017 Increases Decreases Reclassifications 31 Dec. 2018
Cost
Computer software 6,633 - - 68 6,701
Other 821 157 - (68) 910
Amortisation and impairment
Computer software (6,245) (259) - - (6,504)
Other - (448) - - (448)
Carrying amount 1,209 (550) - - 659
SFL 2018 CONSOLIDATED FINANCIAL STATEMENTS - 10
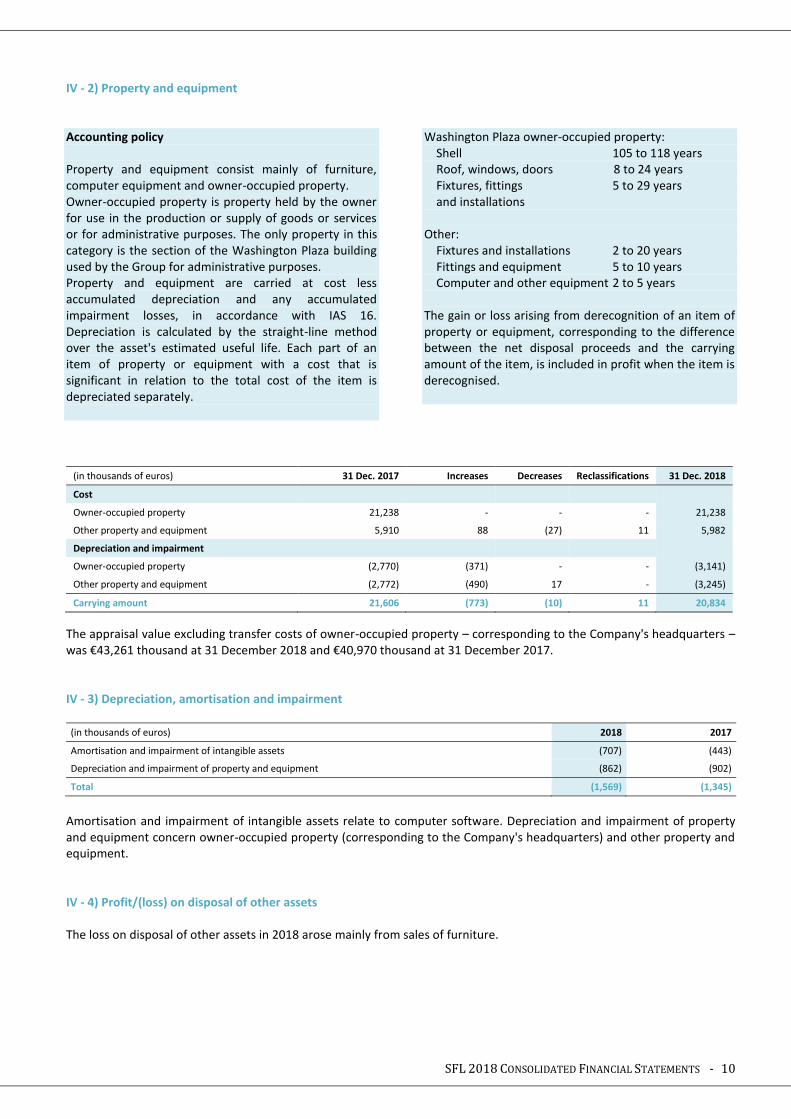
IV - 2) Property and equipment Accounting policy Property and equipment consist mainly of furniture, computer equipment and owner-occupied property. Owner-occupied property is property held by the owner for use in the production or supply of goods or services or for administrative purposes. The only property in this category is the section of the Washington Plaza building used by the Group for administrative purposes. Property and equipment are carried at cost less accumulated depreciation and any accumulated impairment losses, in accordance with IAS 16. Depreciation is calculated by the straight-line method over the asset's estimated useful life. Each part of an item of property or equipment with a cost that is significant in relation to the total cost of the item is depreciated separately.
Washington Plaza owner-occupied property: Shell 105 to 118 years Roof, windows, doors 8 to 24 years Fixtures, fittings 5 to 29 years and installations Other: Fixtures and installations 2 to 20 years Fittings and equipment 5 to 10 years Computer and other equipment 2 to 5 years The gain or loss arising from derecognition of an item of property or equipment, corresponding to the difference between the net disposal proceeds and the carrying amount of the item, is included in profit when the item is derecognised.
(in thousands of euros) 31 Dec. 2017 Increases Decreases Reclassifications 31 Dec. 2018
Cost
Owner-occupied property 21,238 - - - 21,238
Other property and equipment 5,910 88 (27) 11 5,982
Depreciation and impairment
Owner-occupied property (2,770) (371) - - (3,141)
Other property and equipment (2,772) (490) 17 - (3,245)
Carrying amount 21,606 (773) (10) 11 20,834
The appraisal value excluding transfer costs of owner-occupied property – corresponding to the Company's headquarters – was €43,261 thousand at 31 December 2018 and €40,970 thousand at 31 December 2017. IV - 3) Depreciation, amortisation and impairment
(in thousands of euros) 2018 2017
Amortisation and impairment of intangible assets (707) (443)
Depreciation and impairment of property and equipment (862) (902)
Total (1,569) (1,345)
Amortisation and impairment of intangible assets relate to computer software. Depreciation and impairment of property and equipment concern owner-occupied property (corresponding to the Company's headquarters) and other property and equipment. IV - 4) Profit/(loss) on disposal of other assets
The loss on disposal of other assets in 2018 arose mainly from sales of furniture.
SFL 2018 CONSOLIDATED FINANCIAL STATEMENTS - 11
IV - 5) Investment property Accounting policy Investment property is property held by the owner or by the lessee under a finance lease to earn rentals or for capital appreciation or both. Acquisitions of property companies that do not meet the definition of a business combination under IFRS 3 are treated as direct acquisitions of the underlying investment property. SFL has chosen to measure investment property using the fair value model as provided for in IAS 40 (paragraph 30). Under this model, investment property is measured at fair value and gains or losses arising from changes in fair value are recognised in profit. Investment property is not depreciated. The fair value of investment property is the amount at which the property could be exchanged between knowledgeable, willing parties in an arm's length transaction. The fair values of investment property carried in the Group's statement of financial position correspond
to the prices obtained from independent valuations performed using the method described below. Changes in fair value, which are recognised in the statement of comprehensive income under "Fair value adjustments to investment property", are calculated as follows: Change in fair value = Market value at the period-end – Market value at the prior period-end – Work and other costs capitalised during the period. The change in fair value is adjusted to exclude the effects of specific lease terms or provisions recognised under other asset captions and included in the fair value calculation, to avoid these effects being taken into account twice. In practice, investment property is reclassified as held for sale when the sale has been decided by the Board of Directors or a selling agent has been appointed. It continues to be measured at fair value after reclassification in accordance with IFRS 5.
Valuation method The Group's entire property portfolio was valued at 31 December 2018 by Jones Lang LaSalle and Cushman & Wakefield. The valuations were performed in accordance with the Charte de l'Expertise en Evaluation Immobilière (property valuation charter) included in the February 2000 report of France's securities regulator (COB, renamed AMF), and also complied with the standards issued by The European Group of Valuers' Associations (TEGoVA) as well as with Royal Institution of Chartered Surveyors (RICS) standards. Independent experts are rotated in compliance with the SIIC code of ethics, which states: "Regardless of the number of independent experts used by the SIIC, the following principles must be upheld: – Appointments should be based on a selection process evaluating each candidate’s independence, qualifications and competency to value property within the asset classes and geographical locations concerned. – When a firm of valuers is used, the SIIC should ensure that the firm’s internal valuation teams are rotated after a period of seven years. – An independent valuer may serve for no more than two four-year terms for any given client, unless that valuer is a company in which case the above team rotation rule applies." The Group's portfolio is appraised at half-yearly intervals by a group of two independent firms, each of which is responsible for valuing part of the total portfolio as follows
(the percentages below are determined by reference to the total value of the properties, excluding transfer costs): - Cushman & Wakefield: 55% - Jones Lang LaSalle: 45% The firms ensure that their internal teams are rotated as required. In addition, certain properties are assigned to different valuers each year to ensure a gradual rotation of assets among them. The valuers’ fees are agreed before the appraisal process begins and do not depend in any way on the value of the properties to be appraised. They are determined at a flat rate based exclusively on the number of properties to be valued and the complexity of the appraisal process. Fees paid to the valuers in 2018 other than for annual property appraisals amounted to €38 thousand. The properties are valued primarily by the discounted cash flows method, which consists of discounting projected future cash flows. Assumptions concerning future revenue flows take into account passing rents, estimated market rents for the period beyond the lease expiry dates, any rent-free periods and rent step-ups, vacancy risk and projected changes in the construction cost index (ICC), office rent index (ILAT) and retail rent index (ILC). Each property is analysed in detail, according to the type of use and the surface area of each unit, lease by lease. Based on information provided by the Group, the valuers noted that rents on certain units were above or below market rents for the period on similar properties. These differences were taken into account to value the properties according to their current occupancy, based on the duration of the underlying leases.
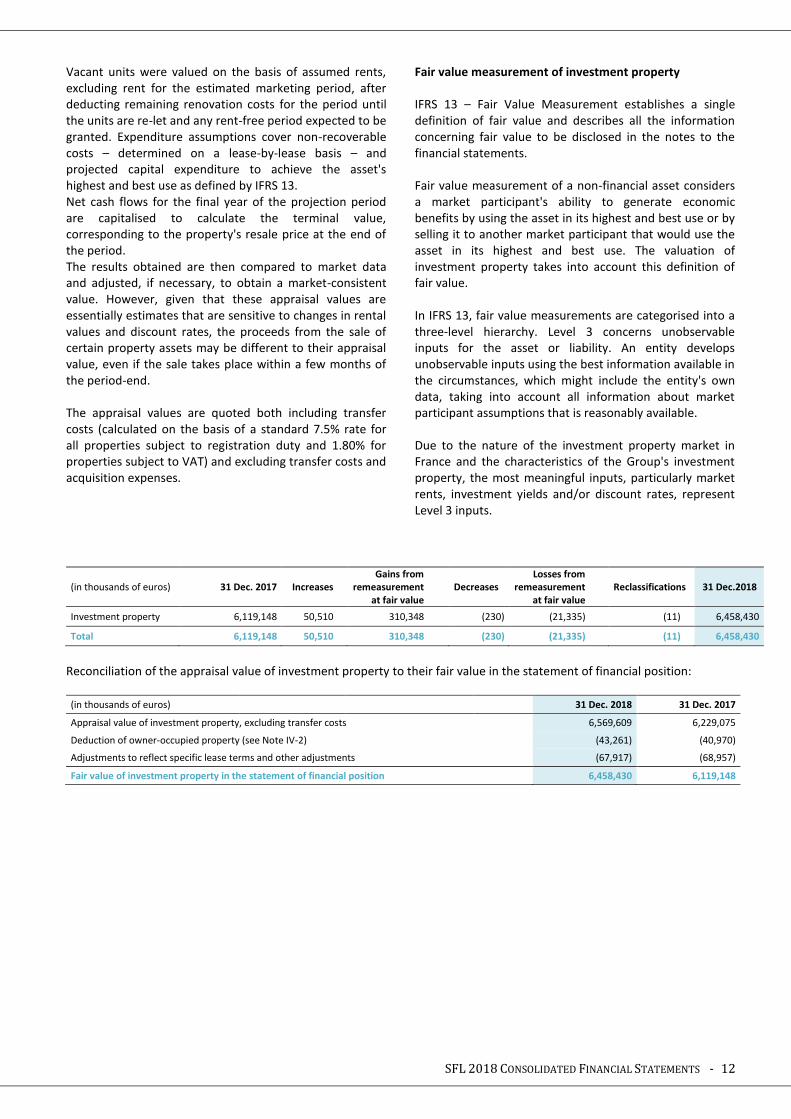
SFL 2018 CONSOLIDATED FINANCIAL STATEMENTS - 12
Vacant units were valued on the basis of assumed rents, excluding rent for the estimated marketing period, after deducting remaining renovation costs for the period until the units are re-let and any rent-free period expected to be granted. Expenditure assumptions cover non-recoverable costs – determined on a lease-by-lease basis – and projected capital expenditure to achieve the asset's highest and best use as defined by IFRS 13. Net cash flows for the final year of the projection period are capitalised to calculate the terminal value, corresponding to the property's resale price at the end of the period. The results obtained are then compared to market data and adjusted, if necessary, to obtain a market-consistent value. However, given that these appraisal values are essentially estimates that are sensitive to changes in rental values and discount rates, the proceeds from the sale of certain property assets may be different to their appraisal value, even if the sale takes place within a few months of the period-end. The appraisal values are quoted both including transfer costs (calculated on the basis of a standard 7.5% rate for all properties subject to registration duty and 1.80% for properties subject to VAT) and excluding transfer costs and acquisition expenses.
Fair value measurement of investment property IFRS 13 – Fair Value Measurement establishes a single definition of fair value and describes all the information concerning fair value to be disclosed in the notes to the financial statements. Fair value measurement of a non-financial asset considers a market participant's ability to generate economic benefits by using the asset in its highest and best use or by selling it to another market participant that would use the asset in its highest and best use. The valuation of investment property takes into account this definition of fair value. In IFRS 13, fair value measurements are categorised into a three-level hierarchy. Level 3 concerns unobservable inputs for the asset or liability. An entity develops unobservable inputs using the best information available in the circumstances, which might include the entity's own data, taking into account all information about market participant assumptions that is reasonably available. Due to the nature of the investment property market in France and the characteristics of the Group's investment property, the most meaningful inputs, particularly market rents, investment yields and/or discount rates, represent Level 3 inputs.
(in thousands of euros) 31 Dec. 2017
Increases Gains from
remeasurement at fair value
Decreases Losses from
remeasurement at fair value
Reclassifications 31 Dec.2018
Investment property 6,119,148 50,510 310,348 (230) (21,335) (11) 6,458,430
Total 6,119,148 50,510 310,348 (230) (21,335) (11) 6,458,430
Reconciliation of the appraisal value of investment property to their fair value in the statement of financial position:
(in thousands of euros) 31 Dec. 2018 31 Dec. 2017
Appraisal value of investment property, excluding transfer costs 6,569,609 6,229,075
Deduction of owner-occupied property (see Note IV-2) (43,261) (40,970)
Adjustments to reflect specific lease terms and other adjustments (67,917) (68,957)
Fair value of investment property in the statement of financial position 6,458,430 6,119,148
SFL 2018 CONSOLIDATED FINANCIAL STATEMENTS - 13
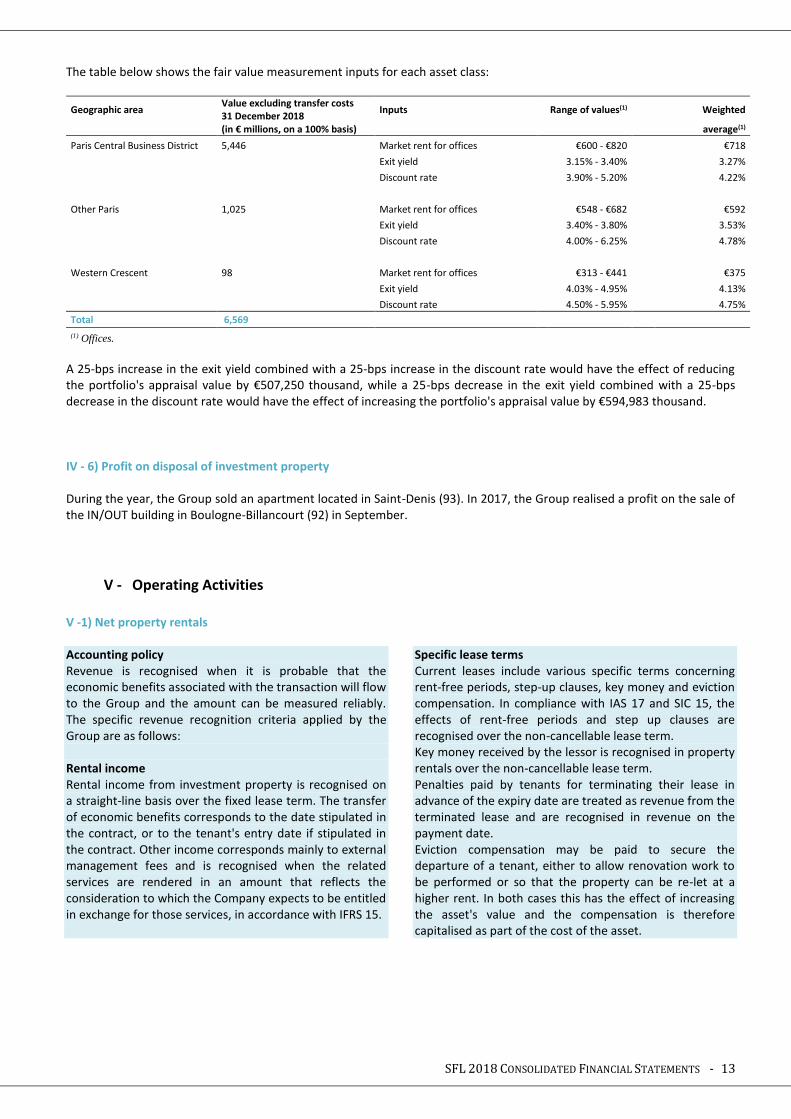
The table below shows the fair value measurement inputs for each asset class:
Geographic area Value excluding transfer costs 31 December 2018
Inputs Range of values(1) Weighted
(in € millions, on a 100% basis)
average(1)
Paris Central Business District 5,446 Market rent for offices €600 - €820 €718
Exit yield 3.15% - 3.40% 3.27%
Discount rate 3.90% - 5.20% 4.22%
Other Paris 1,025 Market rent for offices €548 - €682 €592
Exit yield 3.40% - 3.80% 3.53%
Discount rate 4.00% - 6.25% 4.78%
Western Crescent 98 Market rent for offices €313 - €441 €375
Exit yield 4.03% - 4.95% 4.13%
Discount rate 4.50% - 5.95% 4.75%
Total 6,569
(1) Offices.
A 25-bps increase in the exit yield combined with a 25-bps increase in the discount rate would have the effect of reducing the portfolio's appraisal value by €507,250 thousand, while a 25-bps decrease in the exit yield combined with a 25-bps decrease in the discount rate would have the effect of increasing the portfolio's appraisal value by €594,983 thousand. IV - 6) Profit on disposal of investment property
During the year, the Group sold an apartment located in Saint-Denis (93). In 2017, the Group realised a profit on the sale of the IN/OUT building in Boulogne-Billancourt (92) in September.
V - Operating Activities
V -1) Net property rentals Accounting policy Revenue is recognised when it is probable that the economic benefits associated with the transaction will flow to the Group and the amount can be measured reliably. The specific revenue recognition criteria applied by the Group are as follows: Rental income Rental income from investment property is recognised on a straight-line basis over the fixed lease term. The transfer of economic benefits corresponds to the date stipulated in the contract, or to the tenant's entry date if stipulated in the contract. Other income corresponds mainly to external management fees and is recognised when the related services are rendered in an amount that reflects the consideration to which the Company expects to be entitled in exchange for those services, in accordance with IFRS 15.
Specific lease terms Current leases include various specific terms concerning rent-free periods, step-up clauses, key money and eviction compensation. In compliance with IAS 17 and SIC 15, the effects of rent-free periods and step up clauses are recognised over the non-cancellable lease term. Key money received by the lessor is recognised in property rentals over the non-cancellable lease term. Penalties paid by tenants for terminating their lease in advance of the expiry date are treated as revenue from the terminated lease and are recognised in revenue on the payment date. Eviction compensation may be paid to secure the departure of a tenant, either to allow renovation work to be performed or so that the property can be re-let at a higher rent. In both cases this has the effect of increasing the asset's value and the compensation is therefore capitalised as part of the cost of the asset.
SFL 2018 CONSOLIDATED FINANCIAL STATEMENTS - 14
The Group's principal business is the rental of office and retail properties, which account for 98% of rental income. Net
property rentals take into account the net negative impact of recognising rent-free periods, rent step-ups and key money
over the non-cancellable lease term. In 2018, this impact was €529 thousand.
(in thousands of euros) 2018 2017
Rental income 193,509 195,780
Property operating expenses (43,334) (44,605)
Property expenses recovered from tenants 32,561 33,732
Property expenses, net of recoveries (10,773) (10,873)
Net property rentals 182,736 184,907
Future minimum lease payments receivable over the remaining term of non-cancellable operating leases break down as
follows:
(in thousands of euros) Total Due within 1 year Due in 1 to 5 years Due beyond 5 years
Rental income 696,698 181,486 432,270 82,942
V - 2) Other income
(in thousands of euros) 2018 2017
Own-work capitalised 58 4
Other income 3,951 2,156
Total 4,009 2,160
The caption "Other income" corresponds mainly to rental repairs and other work billed to tenants.
V - 3) Trade and other receivables Accounting policy Trade receivables are initially recognised at amortised cost, corresponding to the initial invoice amount. Upon origination, the receivables are written down based on the expected loss-to-maturity model, in accordance with
IFRS 9. In subsequent periods, the collection risk is systematically reviewed on a case-by-case basis, and a loss allowance is recorded if necessary to reflect the incurred risk.
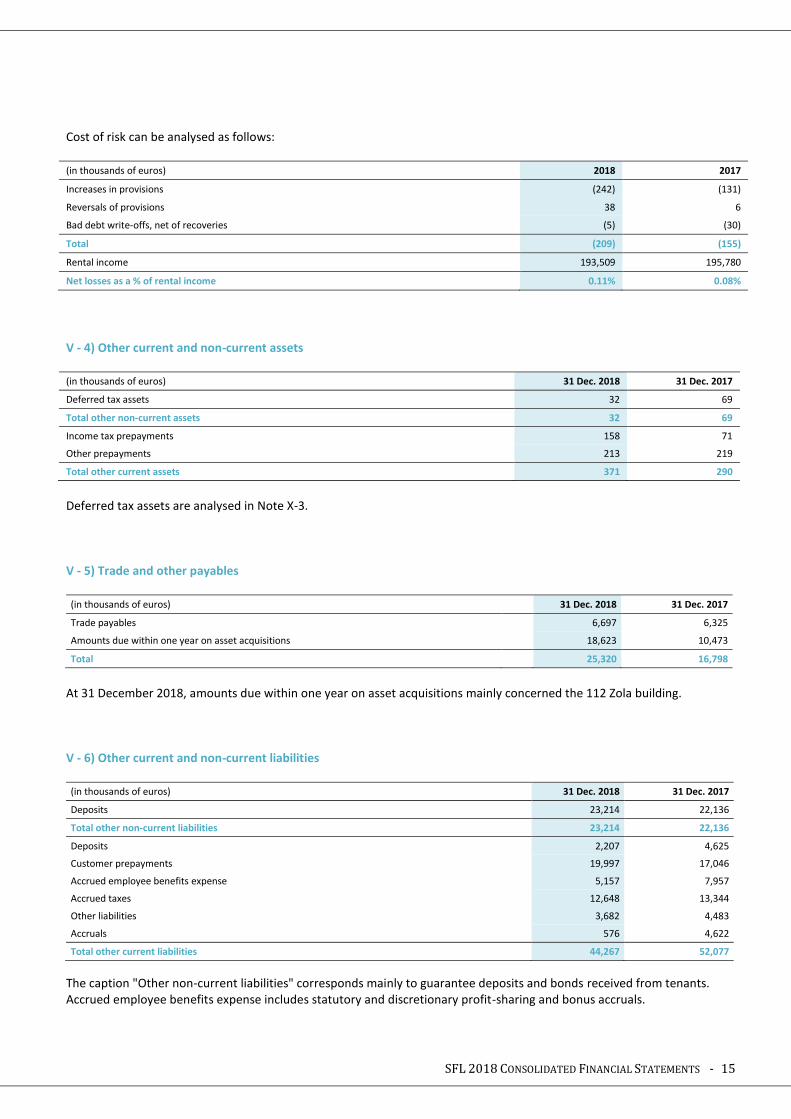
(in thousands of euros) 31 Dec. 2018 31 Dec. 2017
Total Due within 1 year Due in 1 year or more
Trade receivables 74,261 18,679 55,581 79,606
Provisions (1,575) - (1,575) (892)
Trade receivables 72,686 18,679 54,006 78,714
Prepayments to suppliers 27 27 - 52
Employee advances 19 19 - 8
Tax receivables (other than income tax) 7,393 7,393 - 6,506
Other operating receivables 1,994 1,994 - 2,398
Other receivables 232 232 - 704
Other receivables 9,665 9,665 - 9,668
Total 82,351 28,344 54,006 88,382
Trade receivables include €67,917 thousand (of which €14,307 thousand reported under current assets) corresponding to the impact of rent-free periods and other special lease terms that is deferred over the non-cancellable lease term in accordance with IFRS. Receivables do not bear interest.
SFL 2018 CONSOLIDATED FINANCIAL STATEMENTS - 15
Cost of risk can be analysed as follows:
(in thousands of euros) 2018 2017
Increases in provisions (242) (131)
Reversals of provisions 38 6
Bad debt write-offs, net of recoveries (5) (30)
Total (209) (155)
Rental income 193,509 195,780
Net losses as a % of rental income 0.11% 0.08%
V - 4) Other current and non-current assets (in thousands of euros) 31 Dec. 2018 31 Dec. 2017
Deferred tax assets 32 69
Total other non-current assets 32 69
Income tax prepayments 158 71
Other prepayments 213 219
Total other current assets 371 290
Deferred tax assets are analysed in Note X-3. V - 5) Trade and other payables
(in thousands of euros) 31 Dec. 2018 31 Dec. 2017
Trade payables 6,697 6,325
Amounts due within one year on asset acquisitions 18,623 10,473
Total 25,320 16,798
At 31 December 2018, amounts due within one year on asset acquisitions mainly concerned the 112 Zola building. V - 6) Other current and non-current liabilities (in thousands of euros) 31 Dec. 2018 31 Dec. 2017
Deposits 23,214 22,136
Total other non-current liabilities 23,214 22,136
Deposits 2,207 4,625
Customer prepayments 19,997 17,046
Accrued employee benefits expense 5,157 7,957
Accrued taxes 12,648 13,344
Other liabilities 3,682 4,483
Accruals 576 4,622
Total other current liabilities 44,267 52,077
The caption "Other non-current liabilities" corresponds mainly to guarantee deposits and bonds received from tenants. Accrued employee benefits expense includes statutory and discretionary profit-sharing and bonus accruals.
SFL 2018 CONSOLIDATED FINANCIAL STATEMENTS - 16
Accrued taxes include the exit tax instalments due in 2019 and related to the 131 Wagram and 112 Zola buildings, for a
total of €8,443 thousand.
The amounts reported under "Accruals" correspond to deferred revenue.
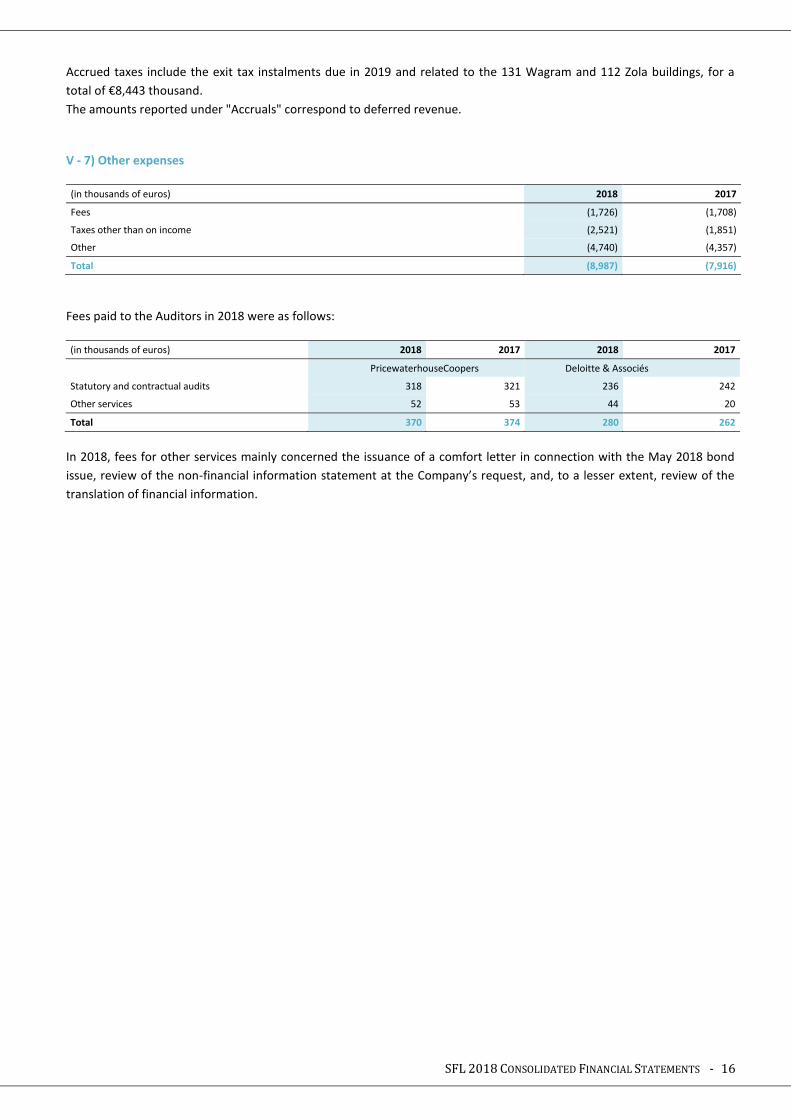
V - 7) Other expenses
(in thousands of euros) 2018 2017
Fees (1,726) (1,708)
Taxes other than on income (2,521) (1,851)
Other (4,740) (4,357)
Total (8,987) (7,916)
Fees paid to the Auditors in 2018 were as follows:
(in thousands of euros) 2018 2017 2018 2017
PricewaterhouseCoopers Deloitte & Associés
Statutory and contractual audits 318 321 236 242
Other services 52 53 44 20
Total 370 374 280 262
In 2018, fees for other services mainly concerned the issuance of a comfort letter in connection with the May 2018 bond
issue, review of the non-financial information statement at the Company’s request, and, to a lesser extent, review of the
translation of financial information.
SFL 2018 CONSOLIDATED FINANCIAL STATEMENTS - 17
VI - Financing Activities VI - 1) Borrowings and other interest-bearing debt
Accounting policy Loans and borrowings are initially recognised at cost, corresponding to the fair value of the consideration paid or received, net of directly attributable transaction costs. Interest-bearing loans and borrowings are subsequently measured at amortised cost, using the effective interest method. Amortised cost takes into account all debt
issuance costs and any difference between the initial amount and the amount at maturity. Finance costs are recalculated based on this amortised cost figure and the related effective interest rate. Borrowing costs directly attributable to the acquisition, construction or production of property assets are capitalised as part of the cost of the asset.
31 Dec. 2018 31 Dec. 2017 31 Dec. 2018 31 Dec. 2017
(in thousands of euros) Effective interest rate Expiry date Short-term portion Long-term portion
Bonds
€500 million bond issue, 2014-2021 1.875% 26 Nov. 2021 647 925 350,000 500,000
€500 million bond issue, 2015-2022 2.25% 16 Nov. 2022 993 1,418 350,000 500,000
€500 million bond issue, 2018-2025 1.50% 29 May 2025 4,459 - 500,000 -
Bank loans
Banco Sabadell Euribor + spread 5 June 2020 - 1 - 10,000
BNP Paribas 2016 Euribor + spread 24 May 2021 40 42 50,000 75,000
BECM Euribor + spread 23 April 2019 - 91 - 150,000
Cadif Euribor + spread 16 June 2023 - 16 - 175,000
Natixis – Deka – Deutsche Hypotheken 1.571% 16 July 2022 2,625 2,630 199,160 201,240
Negotiable European commercial Fixed rate (payable in advance) Due within 1 year 262,500 - - -
paper (NEU-CP)
Interest rate swaps
CA-CIB 5-year swap 0.23% 28 Nov. 2022 52 53 989 51
Bank overdrafts Various - 33,400 - -
Current account advances (liabilities) Various 40 55 52,246 55,646
Impact of deferred recognition of (2,398) (2,146) (8,315) (5,706)
debt arranging fees
Total 268,958 36,485 1,494,080 1,661,231
SFL 2018 CONSOLIDATED FINANCIAL STATEMENTS - 18
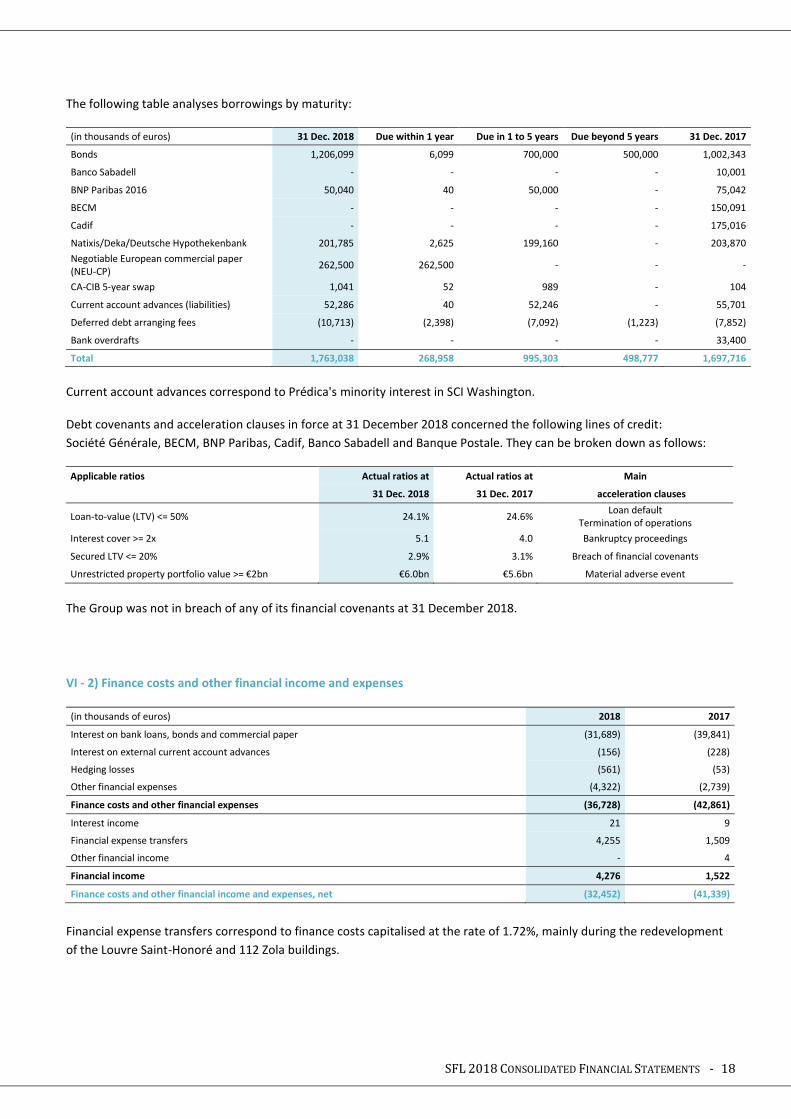
The following table analyses borrowings by maturity:
(in thousands of euros) 31 Dec. 2018 Due within 1 year Due in 1 to 5 years Due beyond 5 years 31 Dec. 2017
Bonds 1,206,099 6,099 700,000 500,000 1,002,343
Banco Sabadell - - - - 10,001
BNP Paribas 2016 50,040 40 50,000 - 75,042
BECM - - - - 150,091
Cadif - - - - 175,016
Natixis/Deka/Deutsche Hypothekenbank 201,785 2,625 199,160 - 203,870
Negotiable European commercial paper (NEU-CP)
262,500 262,500 - - -
CA-CIB 5-year swap 1,041 52 989 - 104
Current account advances (liabilities) 52,286 40 52,246 - 55,701
Deferred debt arranging fees (10,713) (2,398) (7,092) (1,223) (7,852)
Bank overdrafts - - - - 33,400
Total 1,763,038 268,958 995,303 498,777 1,697,716
Current account advances correspond to Prédica's minority interest in SCI Washington. Debt covenants and acceleration clauses in force at 31 December 2018 concerned the following lines of credit:
Société Générale, BECM, BNP Paribas, Cadif, Banco Sabadell and Banque Postale. They can be broken down as follows:
Applicable ratios Actual ratios at Actual ratios at Main
31 Dec. 2018 31 Dec. 2017 acceleration clauses
Loan-to-value (LTV) <= 50% 24.1% 24.6% Loan default
Termination of operations
Interest cover >= 2x 5.1 4.0 Bankruptcy proceedings
Secured LTV <= 20% 2.9% 3.1% Breach of financial covenants
Unrestricted property portfolio value >= €2bn €6.0bn €5.6bn Material adverse event
The Group was not in breach of any of its financial covenants at 31 December 2018.
VI - 2) Finance costs and other financial income and expenses
(in thousands of euros) 2018 2017
Interest on bank loans, bonds and commercial paper (31,689) (39,841)
Interest on external current account advances (156) (228)
Hedging losses (561) (53)
Other financial expenses (4,322) (2,739)
Finance costs and other financial expenses (36,728) (42,861)
Interest income 21 9
Financial expense transfers 4,255 1,509
Other financial income - 4
Financial income 4,276 1,522
Finance costs and other financial income and expenses, net (32,452) (41,339)
Financial expense transfers correspond to finance costs capitalised at the rate of 1.72%, mainly during the redevelopment
of the Louvre Saint-Honoré and 112 Zola buildings.
SFL 2018 CONSOLIDATED FINANCIAL STATEMENTS - 19
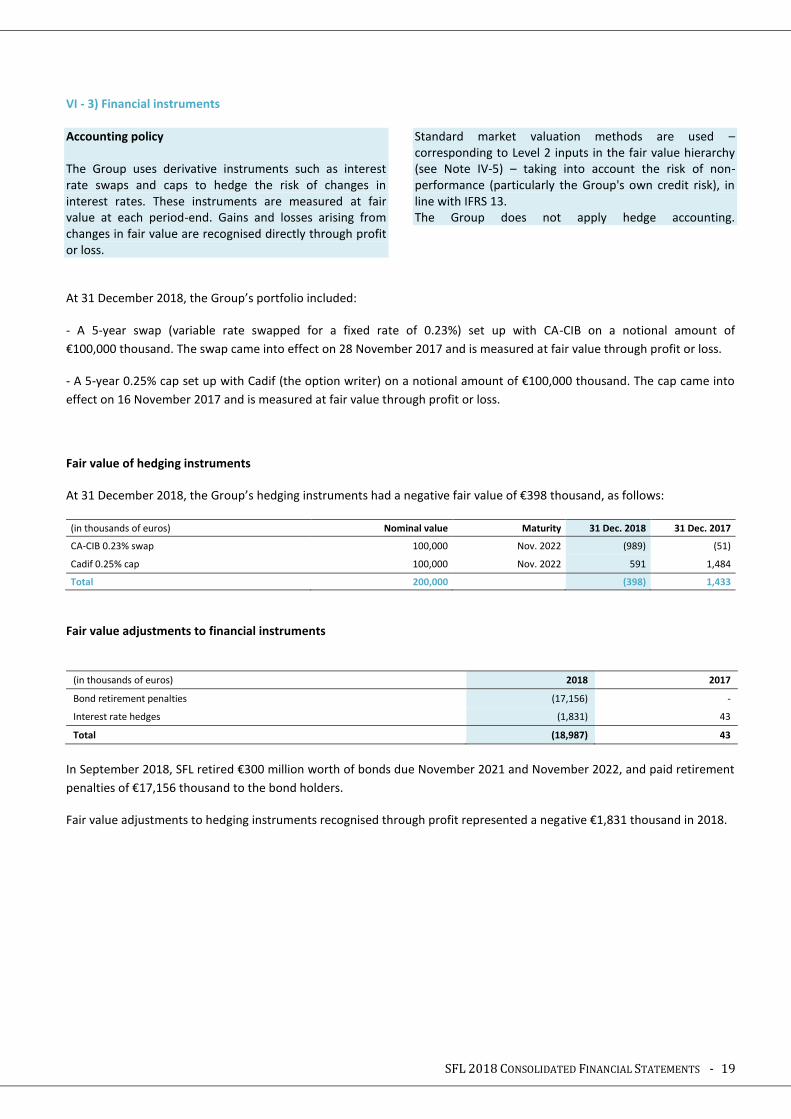
VI - 3) Financial instruments Accounting policy The Group uses derivative instruments such as interest rate swaps and caps to hedge the risk of changes in interest rates. These instruments are measured at fair value at each period-end. Gains and losses arising from changes in fair value are recognised directly through profit or loss.
Standard market valuation methods are used – corresponding to Level 2 inputs in the fair value hierarchy (see Note IV-5) – taking into account the risk of non-performance (particularly the Group's own credit risk), in line with IFRS 13. The Group does not apply hedge accounting.
At 31 December 2018, the Group’s portfolio included:
- A 5-year swap (variable rate swapped for a fixed rate of 0.23%) set up with CA-CIB on a notional amount of
€100,000 thousand. The swap came into effect on 28 November 2017 and is measured at fair value through profit or loss.
- A 5-year 0.25% cap set up with Cadif (the option writer) on a notional amount of €100,000 thousand. The cap came into
effect on 16 November 2017 and is measured at fair value through profit or loss.
Fair value of hedging instruments
At 31 December 2018, the Group’s hedging instruments had a negative fair value of €398 thousand, as follows: (in thousands of euros) Nominal value Maturity 31 Dec. 2018 31 Dec. 2017
CA-CIB 0.23% swap 100,000 Nov. 2022 (989) (51)
Cadif 0.25% cap 100,000 Nov. 2022 591 1,484
Total 200,000
(398) 1,433
Fair value adjustments to financial instruments
(in thousands of euros) 2018 2017
Bond retirement penalties (17,156) -
Interest rate hedges (1,831) 43
Total (18,987) 43
In September 2018, SFL retired €300 million worth of bonds due November 2021 and November 2022, and paid retirement
penalties of €17,156 thousand to the bond holders.
Fair value adjustments to hedging instruments recognised through profit represented a negative €1,831 thousand in 2018.
SFL 2018 CONSOLIDATED FINANCIAL STATEMENTS - 20
VI - 4) Financial risk management objectives and policy
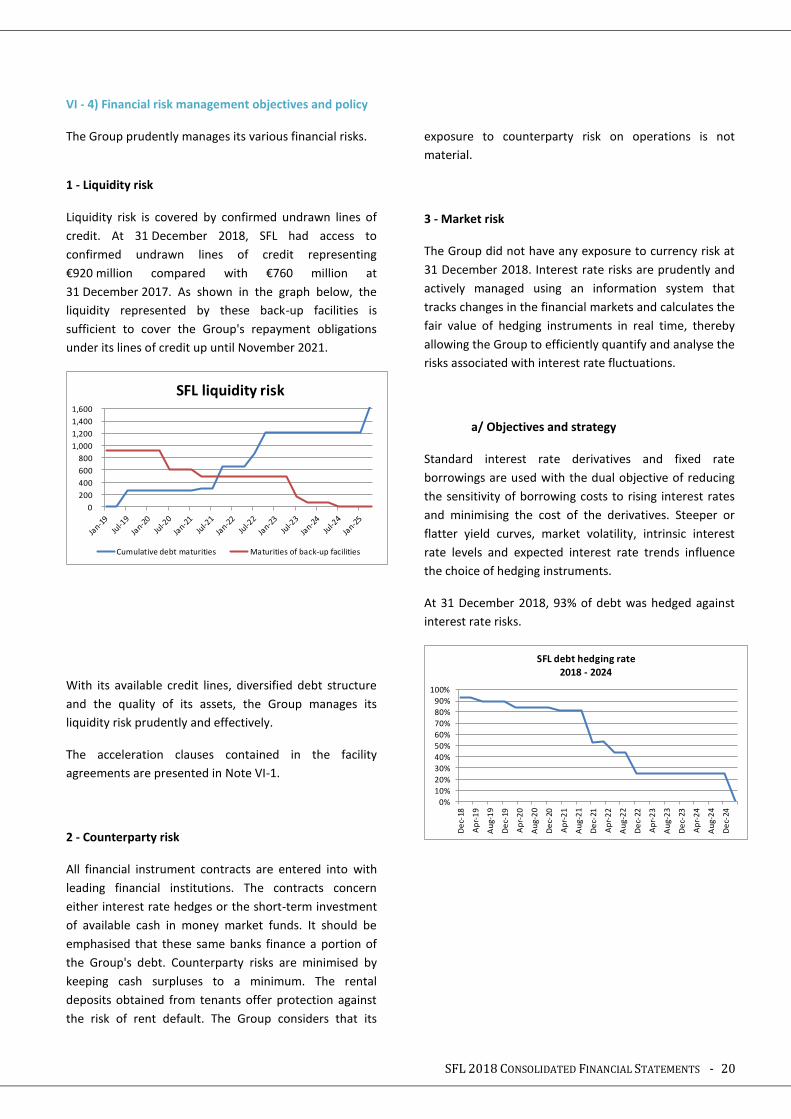
The Group prudently manages its various financial risks. 1 - Liquidity risk
Liquidity risk is covered by confirmed undrawn lines of
credit. At 31 December 2018, SFL had access to
confirmed undrawn lines of credit representing
€920 million compared with €760 million at
31 December 2017. As shown in the graph below, the
liquidity represented by these back-up facilities is
sufficient to cover the Group's repayment obligations
under its lines of credit up until November 2021.
With its available credit lines, diversified debt structure
and the quality of its assets, the Group manages its
liquidity risk prudently and effectively.
The acceleration clauses contained in the facility
agreements are presented in Note VI-1.
2 - Counterparty risk
All financial instrument contracts are entered into with
leading financial institutions. The contracts concern
either interest rate hedges or the short-term investment
of available cash in money market funds. It should be
emphasised that these same banks finance a portion of
the Group's debt. Counterparty risks are minimised by
keeping cash surpluses to a minimum. The rental
deposits obtained from tenants offer protection against
the risk of rent default. The Group considers that its
exposure to counterparty risk on operations is not
material.
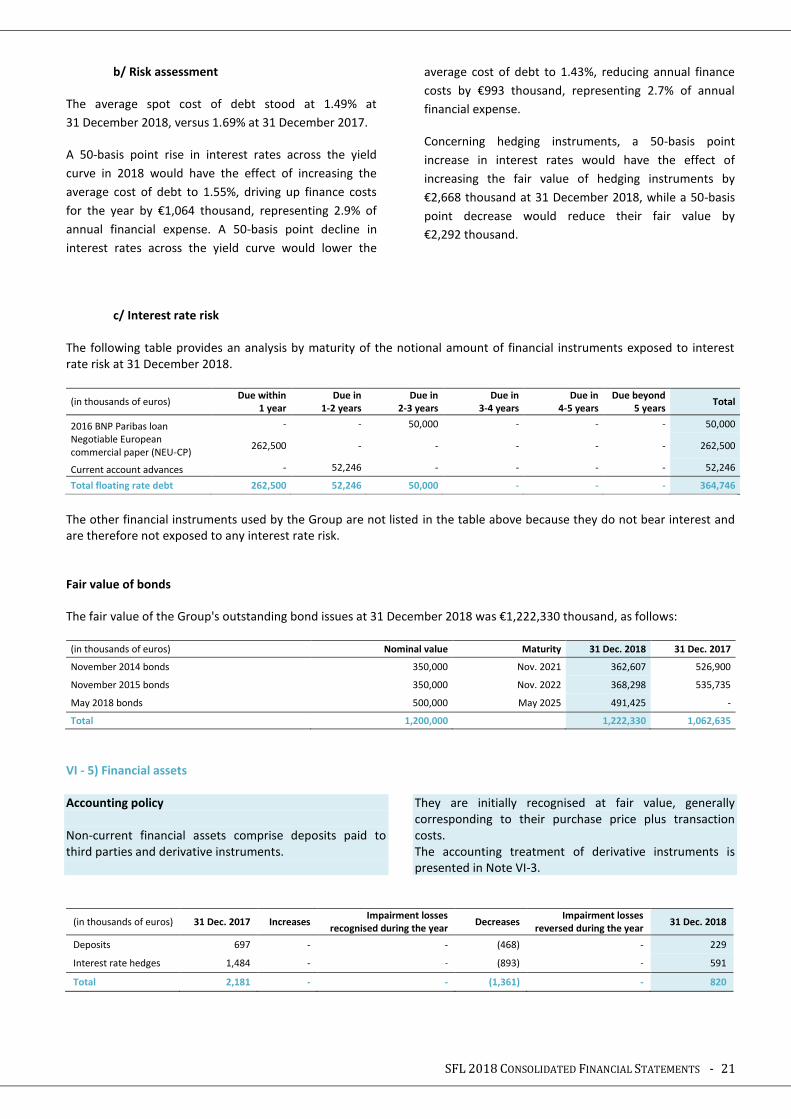
3 - Market risk
The Group did not have any exposure to currency risk at
31 December 2018. Interest rate risks are prudently and
actively managed using an information system that
tracks changes in the financial markets and calculates the
fair value of hedging instruments in real time, thereby
allowing the Group to efficiently quantify and analyse the
risks associated with interest rate fluctuations.
a/ Objectives and strategy
Standard interest rate derivatives and fixed rate
borrowings are used with the dual objective of reducing
the sensitivity of borrowing costs to rising interest rates
and minimising the cost of the derivatives. Steeper or
flatter yield curves, market volatility, intrinsic interest
rate levels and expected interest rate trends influence
the choice of hedging instruments.
At 31 December 2018, 93% of debt was hedged against
interest rate risks.
0
200
400
600
800
1,000
1,200
1,400
1,600
SFL liquidity risk
Cumulative debt maturities Maturities of back-up facilities
0%
10%
20%
30%
40%
50%
60%
70%
80%
90%
100%
De
c-18
Ap
r-1
9
Au
g-1
9
De
c-19
Ap
r-2
0
Au
g-2
0
De
c-20
Ap
r-2
1
Au
g-2
1
De
c-21
Ap
r-2
2
Au
g-2
2
De
c-22
Ap
r-2
3
Au
g-2
3
De
c-23
Ap
r-2
4
Au
g-2
4
De
c-24
SFL debt hedging rate
2018 - 2024
SFL 2018 CONSOLIDATED FINANCIAL STATEMENTS - 21
b/ Risk assessment
The average spot cost of debt stood at 1.49% at
31 December 2018, versus 1.69% at 31 December 2017.
A 50-basis point rise in interest rates across the yield
curve in 2018 would have the effect of increasing the
average cost of debt to 1.55%, driving up finance costs
for the year by €1,064 thousand, representing 2.9% of
annual financial expense. A 50-basis point decline in
interest rates across the yield curve would lower the
average cost of debt to 1.43%, reducing annual finance
costs by €993 thousand, representing 2.7% of annual
financial expense.
Concerning hedging instruments, a 50-basis point
increase in interest rates would have the effect of
increasing the fair value of hedging instruments by
€2,668 thousand at 31 December 2018, while a 50-basis
point decrease would reduce their fair value by
€2,292 thousand.
c/ Interest rate risk The following table provides an analysis by maturity of the notional amount of financial instruments exposed to interest rate risk at 31 December 2018.
(in thousands of euros) Due within
1 year Due in
1-2 years Due in
2-3 years Due in
3-4 years Due in
4-5 years Due beyond
5 years Total
2016 BNP Paribas loan - - 50,000 - - - 50,000
Negotiable European commercial paper (NEU-CP)
262,500 - - - - - 262,500
Current account advances - 52,246 - - - - 52,246
Total floating rate debt 262,500 52,246 50,000 - - - 364,746
The other financial instruments used by the Group are not listed in the table above because they do not bear interest and are therefore not exposed to any interest rate risk. Fair value of bonds
The fair value of the Group's outstanding bond issues at 31 December 2018 was €1,222,330 thousand, as follows: (in thousands of euros) Nominal value Maturity 31 Dec. 2018 31 Dec. 2017
November 2014 bonds 350,000 Nov. 2021 362,607 526,900
November 2015 bonds 350,000 Nov. 2022 368,298 535,735 May 2018 bonds 500,000 May 2025 491,425 -
Total 1,200,000
1,222,330 1,062,635
VI - 5) Financial assets Accounting policy Non-current financial assets comprise deposits paid to third parties and derivative instruments.
They are initially recognised at fair value, generally corresponding to their purchase price plus transaction costs. The accounting treatment of derivative instruments is presented in Note VI-3.
(in thousands of euros) 31 Dec. 2017 Increases Impairment losses
recognised during the year Decreases
Impairment losses reversed during the year
31 Dec. 2018
Deposits 697 - - (468) - 229
Interest rate hedges 1,484 - - (893) - 591
Total 2,181 - - (1,361) - 820
SFL 2018 CONSOLIDATED FINANCIAL STATEMENTS - 22
Hedging instruments with a positive fair value recognised in assets totalled €591 thousand at 31 December 2018 (see Note VI-3). VI - 6) Cash and cash equivalents Accounting policy Cash and cash equivalents carried in the statement of financial position include cash at bank and on hand and short-term deposits with original maturities of less than three months. They are short-term, highly liquid investments that are readily convertible into a known
amount of cash and that are subject to an insignificant risk of changes in value. Cash and cash equivalents in the statement of cash flows correspond to cash and cash equivalents less bank overdrafts.
(in thousands of euros) 31 Dec. 2018 31 Dec. 2017
Cash at bank and in hand 25,304 15,710
Total 25,304 15,710
VII - Equity and Earnings Per Share VII - 1) Equity Equity is analysed in the consolidated statement of changes in equity included in the financial statements. The Company's share capital amounts to €93,058 thousand, represented by 46,528,974 ordinary shares with a par value of €2. VII - 2) Treasury shares Accounting policy Acquisitions, disposals and cancellations of treasury shares are recorded as a deduction from equity.
(in thousands of euros) 31 Dec. 2017 Increases Decreases 31 Dec. 2018
Number of treasury shares 307,135 89,591 (122,452) 274,274
Average purchase/sale price, in euros €64.26 €59.46 €55.31 €66.69
Total 19,736 5,327 (6,773) 18,290
VII - 3) Dividends
(in thousands of euros) 2018 2017
Paid Per share Paid Per share
Prior year dividend paid in current year 106,383 €2.30 48,512 €1.05
Total 106,383 €2.30 48,512 €1.05
SFL 2018 CONSOLIDATED FINANCIAL STATEMENTS - 23
VII - 4) Earnings per share Basic earnings per share are calculated by dividing profit attributable to ordinary owners of the parent by the weighted average number of shares outstanding during the period, net of treasury shares held at the period-end.
(in thousands of euros) 2018 2017
Profit used to calculate basic earnings per share 351,636 685,284
Number of ordinary shares at 31 December 46,528,974 46,528,974
Number of treasury shares at 31 December (274,274) (307,135)
Number of ordinary shares at 31 December excluding treasury shares 46,254,700 46,221,839
Earnings per share €7.60 €14.83
Weighted average number of ordinary shares 46,528,974 46,528,974
Number of treasury shares at 31 December (274,274) (307,135)
Weighted average number of ordinary shares excluding treasury shares 46,254,700 46,221,839
Basic earnings per weighted average share €7.60 €14.83
There were no other transactions on ordinary shares or potential ordinary shares between the year-end and the date when these financial statements were drawn up. VII - 5) Non-controlling interests in net profit
(in thousands of euros) 2018 2017
SCI Washington 17,396 29,427
Rental income 7,862 6,940
Fair value adjustments on investment property 9,607 22,498
Net financial expense (151) (157)
Other 78 146 Parholding subgroup 15,614 81,561
Rental income 14,986 14,519
Fair value adjustments on investment property 10,357 90,979
Net financial expense (1,766) (1,852)
Deferred tax (3,543) (18,016)
Current tax (3,600) (3,096)
Other (820) (973)
Total 33,010 110,988
SFL 2018 CONSOLIDATED FINANCIAL STATEMENTS - 24
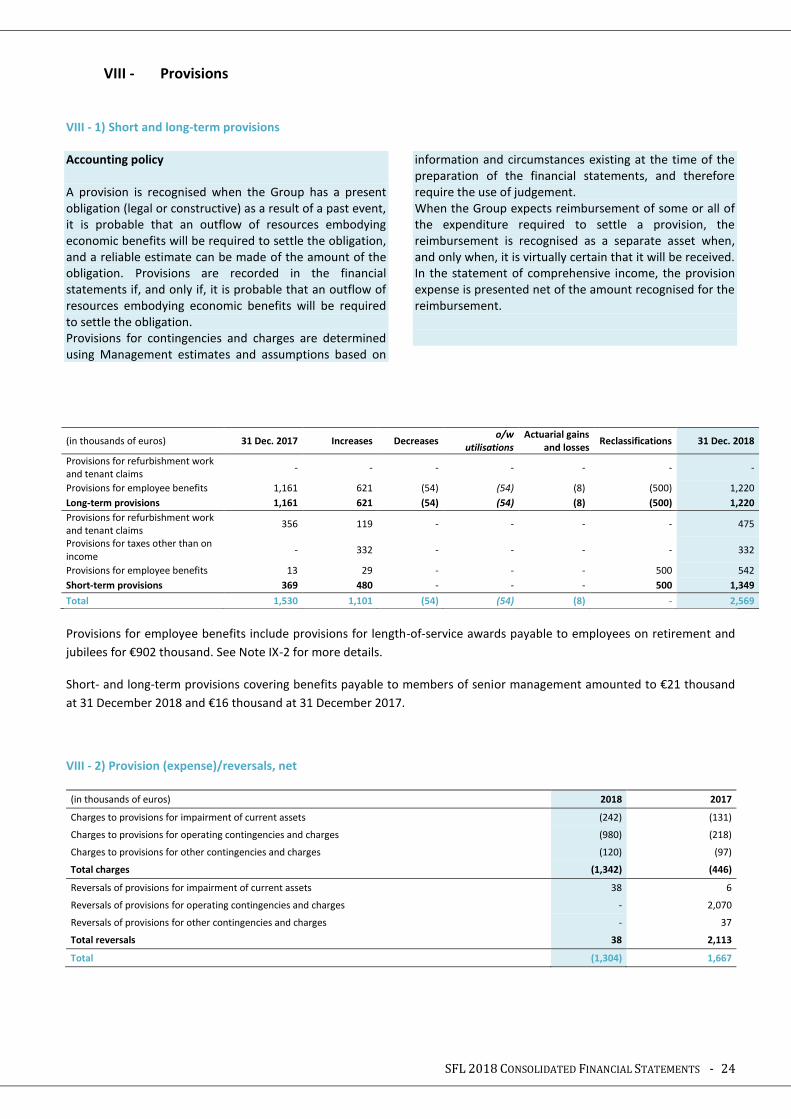
VIII - Provisions
VIII - 1) Short and long-term provisions Accounting policy A provision is recognised when the Group has a present obligation (legal or constructive) as a result of a past event, it is probable that an outflow of resources embodying economic benefits will be required to settle the obligation, and a reliable estimate can be made of the amount of the obligation. Provisions are recorded in the financial statements if, and only if, it is probable that an outflow of resources embodying economic benefits will be required to settle the obligation. Provisions for contingencies and charges are determined using Management estimates and assumptions based on
information and circumstances existing at the time of the preparation of the financial statements, and therefore require the use of judgement. When the Group expects reimbursement of some or all of the expenditure required to settle a provision, the reimbursement is recognised as a separate asset when, and only when, it is virtually certain that it will be received. In the statement of comprehensive income, the provision expense is presented net of the amount recognised for the reimbursement.
(in thousands of euros) 31 Dec. 2017 Increases Decreases o/w
utilisations Actuarial gains
and losses Reclassifications 31 Dec. 2018
Provisions for refurbishment work and tenant claims
- - - - - - -
Provisions for employee benefits 1,161 621 (54) (54) (8) (500) 1,220
Long-term provisions 1,161 621 (54) (54) (8) (500) 1,220
Provisions for refurbishment work and tenant claims
356 119 - - - - 475
Provisions for taxes other than on income
- 332 - - - - 332
Provisions for employee benefits 13 29 - - - 500 542
Short-term provisions 369 480 - - - 500 1,349
Total 1,530 1,101 (54) (54) (8) - 2,569
Provisions for employee benefits include provisions for length-of-service awards payable to employees on retirement and
jubilees for €902 thousand. See Note IX-2 for more details.
Short- and long-term provisions covering benefits payable to members of senior management amounted to €21 thousand
at 31 December 2018 and €16 thousand at 31 December 2017.
VIII - 2) Provision (expense)/reversals, net
(in thousands of euros) 2018 2017
Charges to provisions for impairment of current assets (242) (131)
Charges to provisions for operating contingencies and charges (980) (218)
Charges to provisions for other contingencies and charges (120) (97)
Total charges (1,342) (446)
Reversals of provisions for impairment of current assets 38 6
Reversals of provisions for operating contingencies and charges - 2,070
Reversals of provisions for other contingencies and charges - 37
Total reversals 38 2,113
Total (1,304) 1,667
SFL 2018 CONSOLIDATED FINANCIAL STATEMENTS - 25
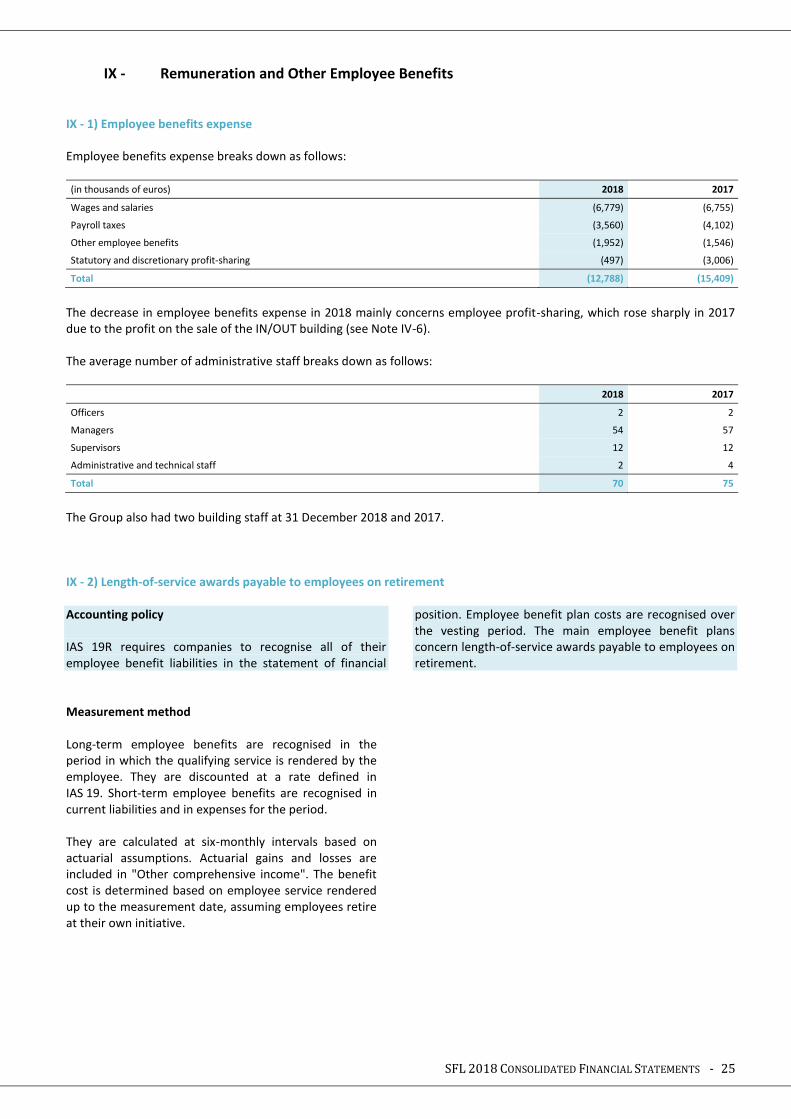
IX - Remuneration and Other Employee Benefits IX - 1) Employee benefits expense Employee benefits expense breaks down as follows:
(in thousands of euros) 2018 2017
Wages and salaries (6,779) (6,755)
Payroll taxes (3,560) (4,102)
Other employee benefits (1,952) (1,546)
Statutory and discretionary profit-sharing (497) (3,006)
Total (12,788) (15,409)
The decrease in employee benefits expense in 2018 mainly concerns employee profit-sharing, which rose sharply in 2017 due to the profit on the sale of the IN/OUT building (see Note IV-6). The average number of administrative staff breaks down as follows:
2018 2017
Officers 2 2
Managers 54 57
Supervisors 12 12
Administrative and technical staff 2 4
Total 70 75
The Group also had two building staff at 31 December 2018 and 2017.
IX - 2) Length-of-service awards payable to employees on retirement Accounting policy IAS 19R requires companies to recognise all of their employee benefit liabilities in the statement of financial
position. Employee benefit plan costs are recognised over the vesting period. The main employee benefit plans concern length-of-service awards payable to employees on retirement.
Measurement method Long-term employee benefits are recognised in the period in which the qualifying service is rendered by the employee. They are discounted at a rate defined in IAS 19. Short-term employee benefits are recognised in current liabilities and in expenses for the period. They are calculated at six-monthly intervals based on actuarial assumptions. Actuarial gains and losses are included in "Other comprehensive income". The benefit cost is determined based on employee service rendered up to the measurement date, assuming employees retire at their own initiative.
SFL 2018 CONSOLIDATED FINANCIAL STATEMENTS - 26
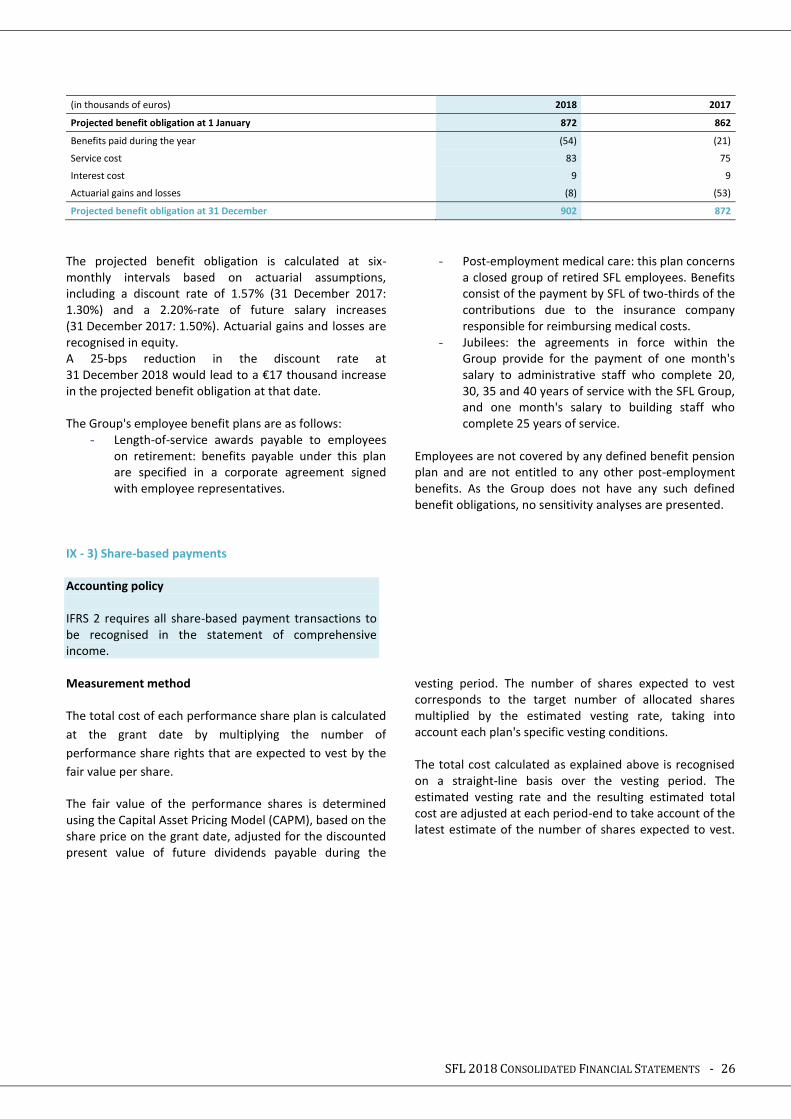
(in thousands of euros) 2018 2017
Projected benefit obligation at 1 January 872 862
Benefits paid during the year (54) (21)
Service cost 83 75
Interest cost 9 9
Actuarial gains and losses (8) (53)
Projected benefit obligation at 31 December 902 872
The projected benefit obligation is calculated at six-monthly intervals based on actuarial assumptions, including a discount rate of 1.57% (31 December 2017: 1.30%) and a 2.20%-rate of future salary increases (31 December 2017: 1.50%). Actuarial gains and losses are recognised in equity. A 25-bps reduction in the discount rate at 31 December 2018 would lead to a €17 thousand increase in the projected benefit obligation at that date. The Group's employee benefit plans are as follows:
- Length-of-service awards payable to employees on retirement: benefits payable under this plan are specified in a corporate agreement signed with employee representatives.
- Post-employment medical care: this plan concerns a closed group of retired SFL employees. Benefits consist of the payment by SFL of two-thirds of the contributions due to the insurance company responsible for reimbursing medical costs.
- Jubilees: the agreements in force within the Group provide for the payment of one month's salary to administrative staff who complete 20, 30, 35 and 40 years of service with the SFL Group, and one month's salary to building staff who complete 25 years of service.
Employees are not covered by any defined benefit pension plan and are not entitled to any other post-employment benefits. As the Group does not have any such defined benefit obligations, no sensitivity analyses are presented.
IX - 3) Share-based payments Accounting policy IFRS 2 requires all share-based payment transactions to be recognised in the statement of comprehensive income.
Measurement method The total cost of each performance share plan is calculated
at the grant date by multiplying the number of
performance share rights that are expected to vest by the
fair value per share.
The fair value of the performance shares is determined using the Capital Asset Pricing Model (CAPM), based on the share price on the grant date, adjusted for the discounted present value of future dividends payable during the
vesting period. The number of shares expected to vest corresponds to the target number of allocated shares multiplied by the estimated vesting rate, taking into account each plan's specific vesting conditions. The total cost calculated as explained above is recognised on a straight-line basis over the vesting period. The estimated vesting rate and the resulting estimated total cost are adjusted at each period-end to take account of the latest estimate of the number of shares expected to vest.
SFL 2018 CONSOLIDATED FINANCIAL STATEMENTS - 27
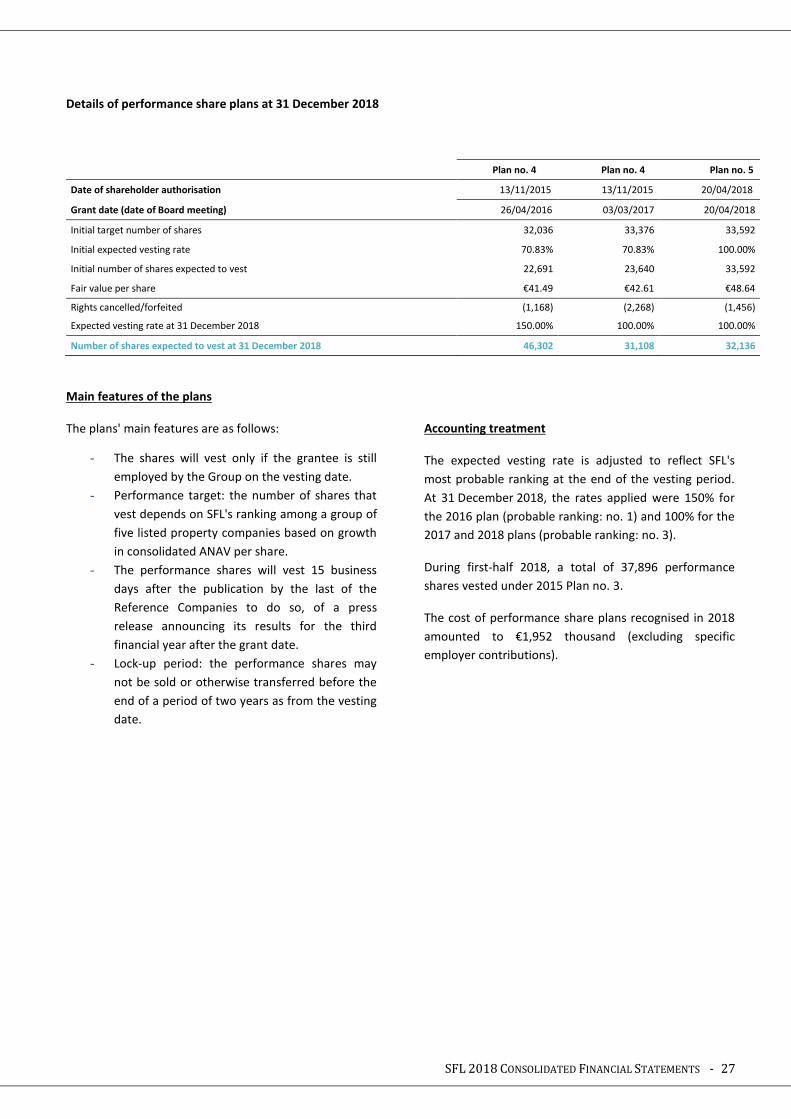
Details of performance share plans at 31 December 2018
Plan no. 4 Plan no. 4 Plan no. 5
Date of shareholder authorisation 13/11/2015 13/11/2015 20/04/2018
Grant date (date of Board meeting) 26/04/2016 03/03/2017 20/04/2018
Initial target number of shares 32,036 33,376 33,592
Initial expected vesting rate 70.83% 70.83% 100.00%
Initial number of shares expected to vest 22,691 23,640 33,592
Fair value per share €41.49 €42.61 €48.64
Rights cancelled/forfeited (1,168) (2,268) (1,456)
Expected vesting rate at 31 December 2018 150.00% 100.00% 100.00%
Number of shares expected to vest at 31 December 2018 46,302 31,108 32,136
Main features of the plans
The plans' main features are as follows:
- The shares will vest only if the grantee is still
employed by the Group on the vesting date.
- Performance target: the number of shares that
vest depends on SFL's ranking among a group of
five listed property companies based on growth
in consolidated ANAV per share.
- The performance shares will vest 15 business
days after the publication by the last of the
Reference Companies to do so, of a press
release announcing its results for the third
financial year after the grant date.
- Lock-up period: the performance shares may
not be sold or otherwise transferred before the
end of a period of two years as from the vesting
date.
Accounting treatment
The expected vesting rate is adjusted to reflect SFL's
most probable ranking at the end of the vesting period.
At 31 December 2018, the rates applied were 150% for
the 2016 plan (probable ranking: no. 1) and 100% for the
2017 and 2018 plans (probable ranking: no. 3).
During first-half 2018, a total of 37,896 performance
shares vested under 2015 Plan no. 3.
The cost of performance share plans recognised in 2018
amounted to €1,952 thousand (excluding specific
employer contributions).
SFL 2018 CONSOLIDATED FINANCIAL STATEMENTS - 28
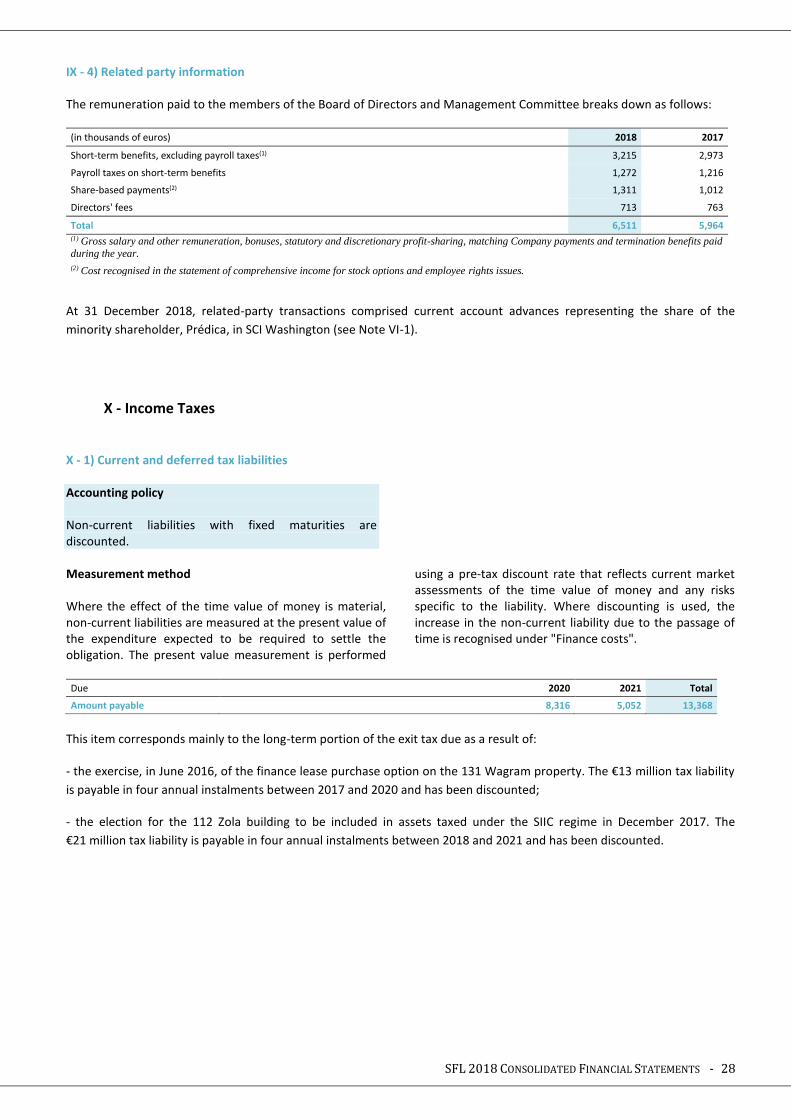
IX - 4) Related party information
The remuneration paid to the members of the Board of Directors and Management Committee breaks down as follows:
(in thousands of euros) 2018 2017
Short-term benefits, excluding payroll taxes(1) 3,215 2,973
Payroll taxes on short-term benefits 1,272 1,216
Share-based payments(2) 1,311 1,012
Directors' fees 713 763
Total 6,511 5,964 (1) Gross salary and other remuneration, bonuses, statutory and discretionary profit-sharing, matching Company payments and termination benefits paid
during the year. (2) Cost recognised in the statement of comprehensive income for stock options and employee rights issues.
At 31 December 2018, related-party transactions comprised current account advances representing the share of the
minority shareholder, Prédica, in SCI Washington (see Note VI-1).
X - Income Taxes X - 1) Current and deferred tax liabilities Accounting policy Non-current liabilities with fixed maturities are discounted.
Measurement method Where the effect of the time value of money is material, non-current liabilities are measured at the present value of the expenditure expected to be required to settle the obligation. The present value measurement is performed
using a pre-tax discount rate that reflects current market assessments of the time value of money and any risks specific to the liability. Where discounting is used, the increase in the non-current liability due to the passage of time is recognised under "Finance costs".
Due 2020 2021 Total
Amount payable 8,316 5,052 13,368
This item corresponds mainly to the long-term portion of the exit tax due as a result of:
- the exercise, in June 2016, of the finance lease purchase option on the 131 Wagram property. The €13 million tax liability
is payable in four annual instalments between 2017 and 2020 and has been discounted;
- the election for the 112 Zola building to be included in assets taxed under the SIIC regime in December 2017. The
€21 million tax liability is payable in four annual instalments between 2018 and 2021 and has been discounted.
SFL 2018 CONSOLIDATED FINANCIAL STATEMENTS - 29
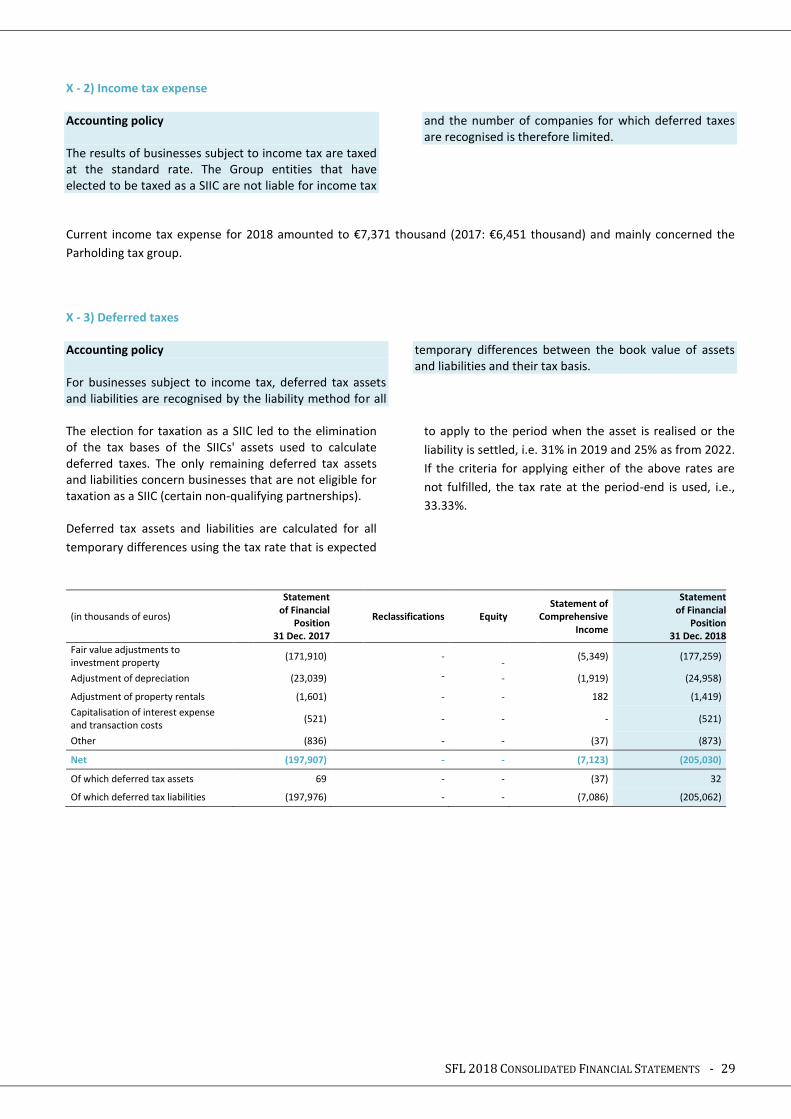
X - 2) Income tax expense Accounting policy The results of businesses subject to income tax are taxed at the standard rate. The Group entities that have elected to be taxed as a SIIC are not liable for income tax
and the number of companies for which deferred taxes are recognised is therefore limited.
Current income tax expense for 2018 amounted to €7,371 thousand (2017: €6,451 thousand) and mainly concerned the
Parholding tax group.
X - 3) Deferred taxes Accounting policy For businesses subject to income tax, deferred tax assets and liabilities are recognised by the liability method for all
temporary differences between the book value of assets and liabilities and their tax basis.
The election for taxation as a SIIC led to the elimination of the tax bases of the SIICs' assets used to calculate deferred taxes. The only remaining deferred tax assets and liabilities concern businesses that are not eligible for taxation as a SIIC (certain non-qualifying partnerships). Deferred tax assets and liabilities are calculated for all
temporary differences using the tax rate that is expected
to apply to the period when the asset is realised or the
liability is settled, i.e. 31% in 2019 and 25% as from 2022.
If the criteria for applying either of the above rates are
not fulfilled, the tax rate at the period-end is used, i.e.,
33.33%.
(in thousands of euros)
Statement of Financial
Position 31 Dec. 2017
Reclassifications Equity Statement of
Comprehensive Income
Statement of Financial
Position 31 Dec. 2018
Fair value adjustments to investment property
(171,910) -
- (5,349) (177,259)
Adjustment of depreciation (23,039) - - (1,919) (24,958)
Adjustment of property rentals (1,601) - - 182 (1,419)
Capitalisation of interest expense and transaction costs
(521) - - - (521)
Other (836) - - (37) (873)
Net (197,907) - - (7,123) (205,030)
Of which deferred tax assets 69 - - (37) 32
Of which deferred tax liabilities (197,976) - - (7,086) (205,062)
SFL 2018 CONSOLIDATED FINANCIAL STATEMENTS - 30
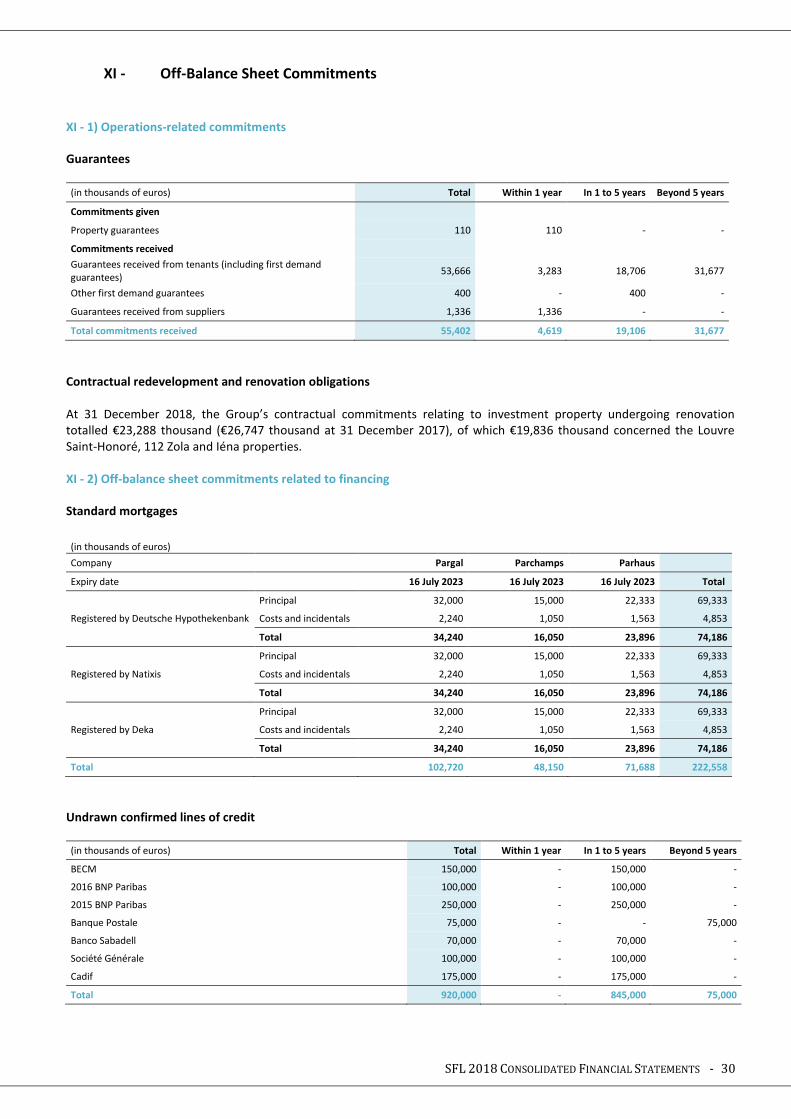
XI - Off-Balance Sheet Commitments
XI - 1) Operations-related commitments
Guarantees
(in thousands of euros) Total Within 1 year In 1 to 5 years Beyond 5 years
Commitments given
Property guarantees 110 110 - -
Commitments received
Guarantees received from tenants (including first demand guarantees)
53,666 3,283 18,706 31,677
Other first demand guarantees 400 - 400 -
Guarantees received from suppliers 1,336 1,336 - -
Total commitments received 55,402 4,619 19,106 31,677
Contractual redevelopment and renovation obligations At 31 December 2018, the Group’s contractual commitments relating to investment property undergoing renovation totalled €23,288 thousand (€26,747 thousand at 31 December 2017), of which €19,836 thousand concerned the Louvre Saint-Honoré, 112 Zola and Iéna properties. XI - 2) Off-balance sheet commitments related to financing
Standard mortgages
(in thousands of euros)
Company Pargal Parchamps Parhaus
Expiry date 16 July 2023 16 July 2023 16 July 2023 Total
Principal 32,000 15,000 22,333 69,333
Registered by Deutsche Hypothekenbank Costs and incidentals 2,240 1,050 1,563 4,853
Total 34,240 16,050 23,896 74,186
Principal 32,000 15,000 22,333 69,333
Registered by Natixis Costs and incidentals 2,240 1,050 1,563 4,853
Total 34,240 16,050 23,896 74,186
Principal 32,000 15,000 22,333 69,333
Registered by Deka Costs and incidentals 2,240 1,050 1,563 4,853
Total 34,240 16,050 23,896 74,186
Total 102,720 48,150 71,688 222,558
Undrawn confirmed lines of credit
(in thousands of euros) Total Within 1 year In 1 to 5 years Beyond 5 years
BECM 150,000 - 150,000 -
2016 BNP Paribas 100,000 - 100,000 -
2015 BNP Paribas 250,000 - 250,000 -
Banque Postale 75,000 - - 75,000
Banco Sabadell 70,000 - 70,000 -
Société Générale 100,000 - 100,000 -
Cadif 175,000 - 175,000 -
Total 920,000 - 845,000 75,000
SFL 2018 CONSOLIDATED FINANCIAL STATEMENTS - 31
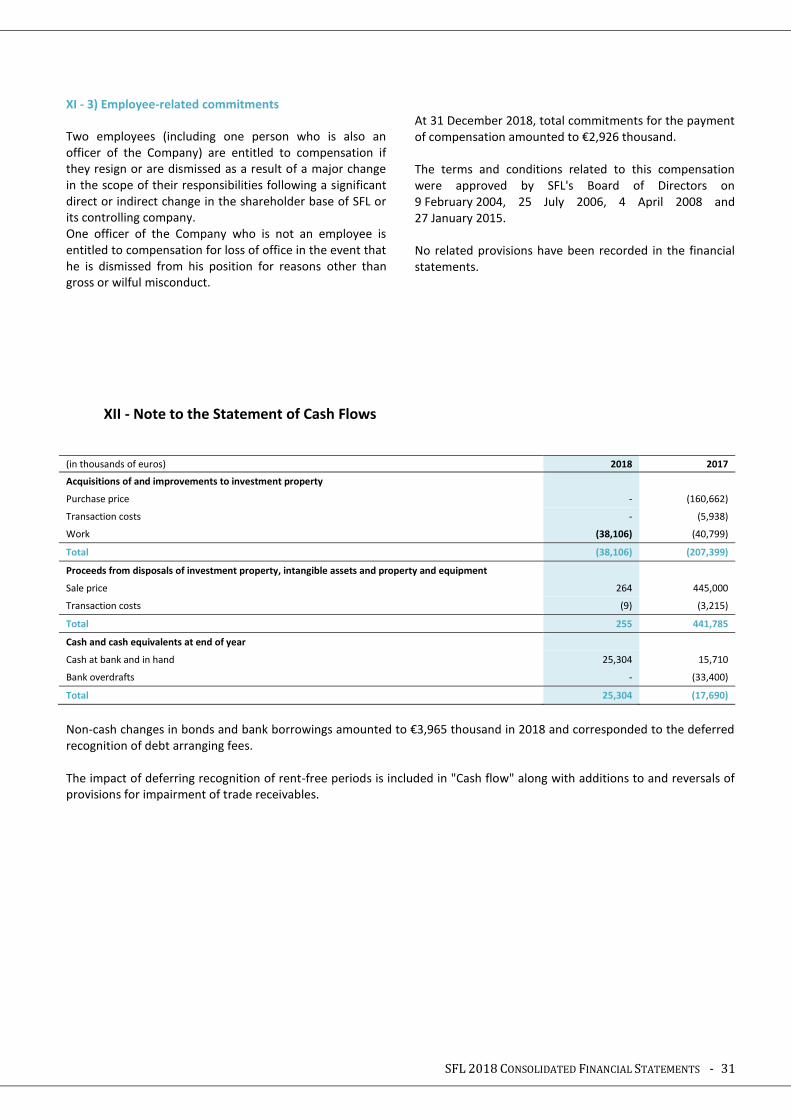
XI - 3) Employee-related commitments
Two employees (including one person who is also an officer of the Company) are entitled to compensation if they resign or are dismissed as a result of a major change in the scope of their responsibilities following a significant direct or indirect change in the shareholder base of SFL or its controlling company. One officer of the Company who is not an employee is entitled to compensation for loss of office in the event that he is dismissed from his position for reasons other than gross or wilful misconduct.
At 31 December 2018, total commitments for the payment of compensation amounted to €2,926 thousand. The terms and conditions related to this compensation were approved by SFL's Board of Directors on 9 February 2004, 25 July 2006, 4 April 2008 and 27 January 2015. No related provisions have been recorded in the financial statements.
XII - Note to the Statement of Cash Flows
(in thousands of euros) 2018 2017
Acquisitions of and improvements to investment property
Purchase price - (160,662)
Transaction costs - (5,938)
Work (38,106) (40,799)
Total (38,106) (207,399)
Proceeds from disposals of investment property, intangible assets and property and equipment
Sale price 264 445,000
Transaction costs (9) (3,215)
Total 255 441,785
Cash and cash equivalents at end of year
Cash at bank and in hand 25,304 15,710
Bank overdrafts - (33,400)
Total 25,304 (17,690)
Non-cash changes in bonds and bank borrowings amounted to €3,965 thousand in 2018 and corresponded to the deferred recognition of debt arranging fees. The impact of deferring recognition of rent-free periods is included in "Cash flow" along with additions to and reversals of provisions for impairment of trade receivables.
SFL 2018 CONSOLIDATED FINANCIAL STATEMENTS - 32
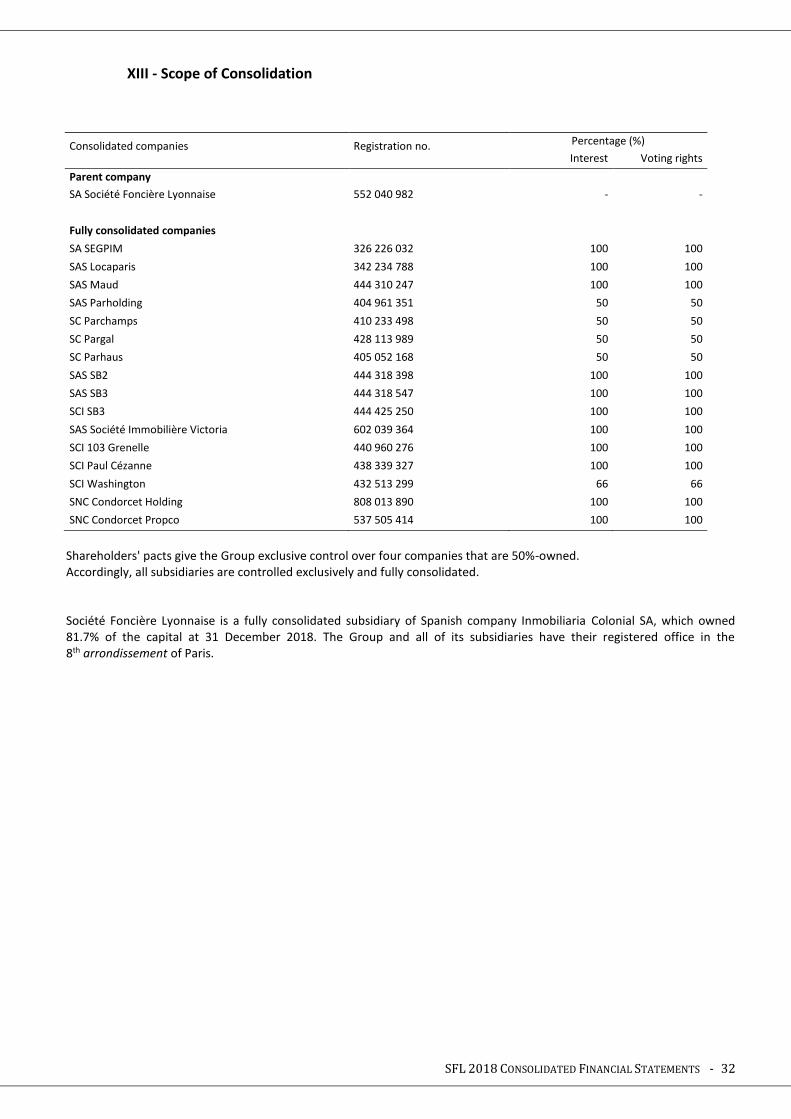
XIII - Scope of Consolidation
Consolidated companies Registration no. Percentage (%)
Interest Voting rights
Parent company
SA Société Foncière Lyonnaise 552 040 982 - -
Fully consolidated companies
SA SEGPIM 326 226 032 100 100
SAS Locaparis 342 234 788 100 100
SAS Maud 444 310 247 100 100
SAS Parholding 404 961 351 50 50
SC Parchamps 410 233 498 50 50
SC Pargal 428 113 989 50 50
SC Parhaus 405 052 168 50 50
SAS SB2 444 318 398 100 100
SAS SB3 444 318 547 100 100
SCI SB3 444 425 250 100 100
SAS Société Immobilière Victoria 602 039 364 100 100
SCI 103 Grenelle 440 960 276 100 100
SCI Paul Cézanne 438 339 327 100 100
SCI Washington 432 513 299 66 66
SNC Condorcet Holding 808 013 890 100 100
SNC Condorcet Propco 537 505 414 100 100
Shareholders' pacts give the Group exclusive control over four companies that are 50%-owned. Accordingly, all subsidiaries are controlled exclusively and fully consolidated. Société Foncière Lyonnaise is a fully consolidated subsidiary of Spanish company Inmobiliaria Colonial SA, which owned 81.7% of the capital at 31 December 2018. The Group and all of its subsidiaries have their registered office in the 8th arrondissement of Paris.


![(Ré)introduction à la compilation - ac-strasbourg.fr · 2016. 10. 3. · Introduction (Ré)introduction à la compilation Compilateur Définition [Wikipédia] Un compilateur est](https://img.pdfslide.us/doc/110x75/610afae098cf7506c74f25f2/rintroduction-la-compilation-ac-2016-10-3-introduction-rintroduction.jpg)


![Canon en ré majeur [For Strings and Continuo]](https://img.pdfslide.us/doc/110x75/626dfa8f0fe0e05f9611c990/canon-en-r-majeur-for-strings-and-continuo.jpg)


![tÉ Z] Energy House Academy](https://img.pdfslide.us/doc/110x75/628211e5d2ca6c20df7f2137/t-z-energy-house-academy.jpg)