Embed Size (px)
Citation preview

Please cite this paper as:
No. 198
Developing or Under-developing?
Implications of China’s “Going
out” for Late Development
by
Dic Lo
(July 2016)
Department of Economics
SOAS, University of London
Thornhaugh Street, Russell Square, London WC1H 0XG, UK
Phone: + 44 (0)20 7898 4730 Fax: 020 7898 4759
E-mail: [email protected]
http://www.soas.ac.uk/economics/
Dep
art
men
t of
Eco
nom
ics Working Paper Series
ISSN 1753 – 5816
Lo, Dic (2016), “Developing or Under-developing? Implications of China’s ‘Going out’ for
Late Development”, SOAS Department of Economics Working Paper No. 198, London:
SOAS, University of London.
The SOAS Department of Economics Working Paper Series is published electronically by
SOAS, University of London.
© Copyright is held by the author or authors of each working paper. SOAS Department of
Economics Working Papers cannot be republished, reprinted or reproduced in any format without
the written permission of the paper’s author or authors.
This and other papers can be downloaded without charge from:
SOAS Department of Economics Working Paper Series at
http://www.soas.ac.uk/economics/research/workingpapers/
Research Papers in Economics (RePEc) electronic library at
http://econpapers.repec.org/paper/

SOAS Department of Economics Working Paper No 198 – 2016
1
Developing or Under-developing?
Implications of China’s “Going out” for Late Development
Dic Lo*
Abstract
Since the turn of the century, China’s influence on world development has increased
enormously. This paper seeks to analyse major attributes of the influence of China’s “going
out”, centring on the argument that the influence has been in the main conducive to the rest of
the developing world. Specifically, this paper offers a critique of relevant, popular theses such
as “China’s neoliberalization crowds out world development”, “China under-cuts the
conditions of the world’s working class”, and “China exhibits a tendency towards
imperialism”, etc. It is argued that, in the context of a neoliberal world economy that is
increasingly speculation-oriented, China’s production-oriented activities can be seen as an
important countervailing force. Whether this China influence is to continue to be conducive to
world development in the future, or to turn to become detrimental, depends critically on the
broader political-economic context.
Keywords: China, trade, investment, world development.
JEL classification: F54, F60, O14, O50.
*SOAS, University of London. Address for correspondence: Department of Economics, SOAS, University of
London. Russell Square, London WC1H 0XG, UK. Tel: +44 207 898 4532. Email: [email protected]

SOAS Department of Economics Working Paper No 198 – 2016
2
1. Introduction
Since the turn of the century, China’s influence on the world economy has increased enormously. It
has become the biggest trading economy in the world. It is a major recipient of inward investment,
and exporter of capital both in the form of direct investment and financial flows. In recent years, it has
initiated a range of international programmes aimed at reshaping the economic landscapes of the
world. All these developments have given rise to widespread concerns over the nature of China’s
“going out”. Specifically, is it an intrinsic part of neoliberal globalization, or else? What are its
implications for the rest of the developing world?
There exists a body of studies that is fundamentally critical of China’s “going out”. In the
early years of the century, the concerned scholars put forth the argument that the expansion of China’s
international trade is to the detriment of world development, either because it crowds out
manufacturing exports from other developing economies or because it implies Chinese labour under-
cutting the working class of the world as a whole. This argument is closely related to the view that
Chinese political economy has already become neoliberal capitalist. In more recent years, there has
emerged the further view that Chinese political economy has even become imperialist. Hence, in this
view, China’s “going out” is in the main an imperialist force that exploits the rest of the developing
world – thereby pushing the world towards underdevelopment.
To engage with this body of studies needs both empirical analysis and theoretical
clarification. The purpose of this paper is precisely to undertake such a task. Foreshadowing, it will be
argued that the thesis of crowding-out might have elements of empirical truth, but this cannot be said
to be caused by China’s trade expansion. It is further argued that the under-cutting thesis is wrong,
because China’s trade expansion has been sustained mainly by productivity growth rather than the
(super)exploitation of labour. In consideration of the broader context of a neoliberal and financializing
world economy, and in terms of its working dynamics, Chinese political economy is not at all clearly
neoliberal. Even more dubious is the thesis of Chinese imperialism. In view of the actual form of
imperialism in our times, namely, the predominance of financial hegemony, it can be argued that
China’s “going out” has hitherto acted as a countervailing force, rather than an accomplice.
The paper is divided into six sections, of which this introduction is the first. Section two seeks
to construct a general picture of the main attributes of China’s “going out” thus far. Section three
critically reviews the theses of crowding-out and under-cutting, in relation to the indicated attributes.
Section four attempts a characterization of the dynamics of world development in the era of neoliberal
globalization. The proposition is that insofar as imperialism does exist, it takes the form of financial
hegemony on the world scale. Section five assesses China’s “going out” in the context of the world
dynamics characterized in the previous section. Section six concludes.

SOAS Department of Economics Working Paper No 198 – 2016
3
2. China’s “Going out”: the General Picture
China (mainland) became the world’s top merchandise exporter in the year 2009, and has remained in
that position thereafter. In 2014, its share of the world total of merchandise exports was 12%. In
comparison, the share accounted for by the United States, Japan and Germany was 9%, 4%, and 8%,
respectively. In terms of the sum of merchandise exports and imports, in 2014, the world share of
China, the United States, Japan and Germany was 11%, 11%, 4%, and 7%, respectively.1 Taking into
account of indirect trade via Hong Kong (a “special administrative region” that has the status as a
separate entity in the world trade system), China’s world share of merchandise exports and total
merchandise trade in 2014 reached 14% and 13%, respectively. These numbers indicate the
importance of China in world trade.2
Three characteristics of China’s international trade are of note.
First, trade balance: after a period of persistent trade deficits in the first decade of the reform
era, from the early 1990s onward, China has always run trade surpluses of hefty magnitudes
(Figure 1). This is true even in the period of continuous and rapid appreciation of the yuan
vis-à-vis the currencies of its major trading partners, in 2005-2014. According to Bank of
International Settlements data, between January 2005 and January 2015, China’s nominal
effective exchange rate appreciated by 46% while the real (consumer price index-based)
effective exchange rate appreciated by 54%.3
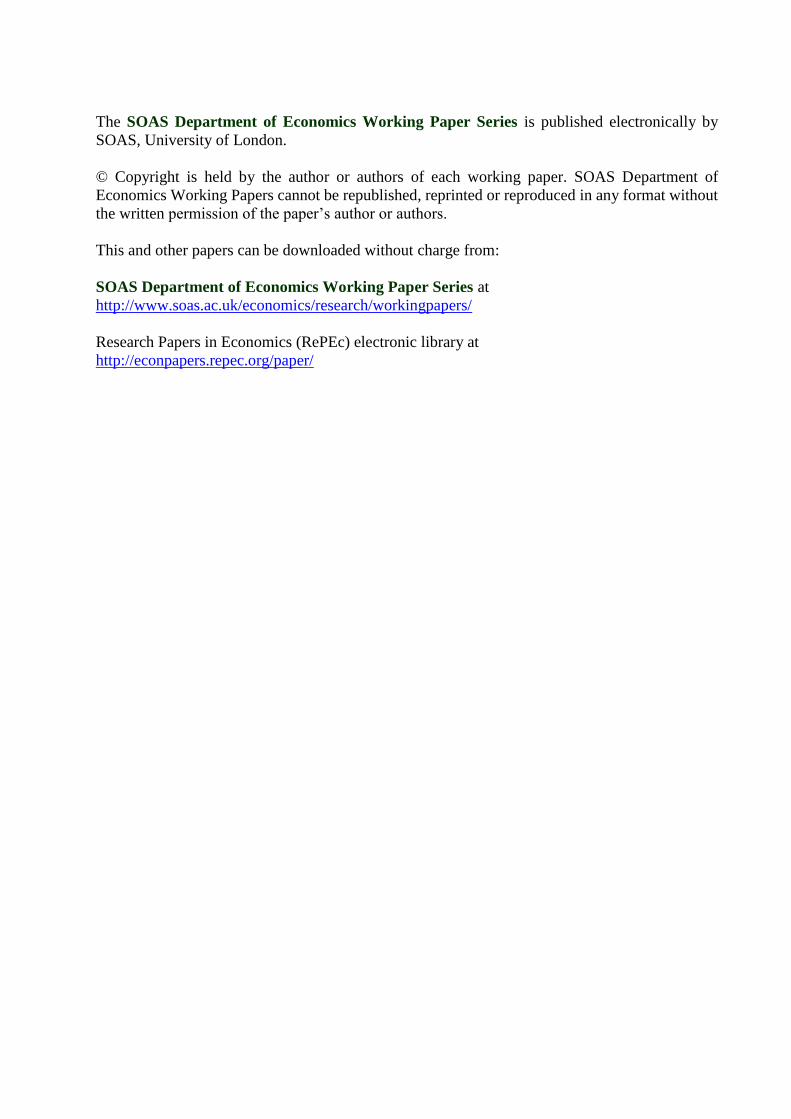
Second, growth: both exports and imports have registered a very substantial acceleration of
growth since the turn of the century. As can be computed from the data in Table 1, the
average rate of nominal annual growth of exports and imports was 14.0% and 12.9%,
respectively, in the period 1980-2000. The growth then accelerated to 17.4% and 16.7%,
respectively, in the period 2000-2014. Conversely, trade surpluses amounted to US dollar 382
billion in 2014, which was equivalent to 3.7% of GDP in that year (the ratio increased further
to 5.4% in 2015, which was almost unique amongst major trading economies of the world).
Third, composition of exports and imports: manufacturing exports have expanded much faster
than total exports, so that their share in total exports increased from 50% in 1980 to 95% in
2014. In contrast, manufacturing imports as a share of total imports increased only slightly,
from 65% to 67%. Meanwhile, exports under the trade category “machinery and transport
equipment” have registered the fastest expansion. Their shares in total exports increased from
5% in 1980 to 46% in 2014. And the ratio of exports to imports under this category increased
from 0.16 to 1.48. Exports under this category are not really labour-intensive relative to the
total of manufacturing exports. This is because, in terms of production characteristics, the
concerned industrial branches typically have a level of labour productivity that is on a par
with that of the manufacturing sector as a whole throughout the reform era.

SOAS Department of Economics Working Paper No 198 – 2016
4
[Figure 1 about here], [Table 1 about here]
These three developments are almost unique to China on the world scene. Taken together,
they suggest that the expansion of China’s international trade, particularly since the turn of the
century, cannot be in any significant measure accounted for by exchange rate manipulation. Nor can
the expansion be simply reduced to the working of the principle of endowment-determined
comparative advantage. Productivity growth, and industrial upgrading, might have been the far more
important driving forces.
Along with the expansion in the total of China’s international trade, the acceleration of the
expansion of its trade with the rest of the developing world has been even more spectacular. Between
2000 and 2014, the average nominal rate of growth in its total merchandise trade with developing
economies (“low-and-middle-income economies”) registered 23% per annum, compared to that with
developed economies (“high-income economies”) of 15%. Moreover, whilst China has been running
surpluses with developed economies, its trade with developing economies has persistently been in
sizeable deficits. The trade imbalances have been caused by China’s absorption of commodities from
other developing economies. Significantly, during this period, China witnessed continuous worsening
of its terms of trade, whereas the opposite was true for the developing world as a whole. Between
1998 and 2013, China’s net barter terms of trade decreased by a hefty magnitude of 32%. This stood
in contrast to the modest decrease (6%) for developed economies, and the massive increase (35%) for
all developing economies including China itself (Figure 2).
[Figure 2 about here]
In this connection, the expansion in both inward and outward flows of foreign direct
investment (FDI) has been equally spectacular (Figure 3). Since the early 1990s until the present time,
China has always been one of the world’s main recipient economies of inward FDI. Since the turn of
the century, China’s outward FDI has also expanded very fast. It has become a major supplier of FDI
in the world. In the year 2014, outward FDI flow from China (mainland) amounted to US$ 123
billion, accounting for 9.1% of the world total. This is the third biggest in the world, after the United
States and Hong Kong. And it is well-known that the main part of Hong Kong’s outward FDI has
actually been carried out by subsidiaries of mainland Chinese companies.
[Figure 3 about here]
Three characteristics of China’s outward FDI are of note.
First, geographical distribution: hitherto, the lion’s share of China’s outward FDI has flown to
the developing world, although investment in developed economies has increased at a faster
pace in recent years. In 2014, 79% of China’s outward FDI flows went to developing

SOAS Department of Economics Working Paper No 198 – 2016
5
economies (together with another 1.3% to transition economies). In the same year, of the total
stocks of China’s outward FDI, 84% were in developing economies (Table 2).
Second, sectoral distribution: hitherto, China’s outward FDI has concentrated in activities that
appear to be trade-related. These include business services, wholesale and retail sales, and
finance, which combined to account for 64% of the total stocks of China’s outward FDI in
2014. Nevertheless, there was a high degree of variation across different continents. In Asia,
the top four sectors were: business services (40.1% of the stocks of China’s outward FDI in
that region), wholesale and retail sales (13.5%), finance (13.5%), and construction (12.4%). In
Africa, the top four sectors were: construction (24.7%), extraction (24.5%), finance (16.4%),
and manufacturing (13.6%). In Latin America and Caribbean, the top four sectors were:
business services (57.0%), finance (18.3%), wholesale and retail sales (8.0%), and extraction
(5.1%). It can be observed that, whilst the patterns in Asia and Latin America and Caribbean
gear towards trade-related activities, that in Africa is typical of an exchange of “building
infrastructure for getting resources as compensation”.4
Third, agents of investment: hitherto, state-owned enterprises (SOEs) have played a more
important role than non-SOEs in carrying out the investment. By the end of 2008, of the
stocks of outward FDI, 70% was accounted for by SOEs. The share decreased to 55% by the
end of 2013 (and this share remained basically the same by the end of 2014), while, at the
same time, another 31% was accounted for by limited liabilities companies with mixed
ownership. This change reflects partly the ownership reform of Chinese SOEs. It also reflects
partly the division of labour between SOEs and non-SOEs: SOEs, typically of much bigger
sizes and much less profit-oriented, and their activities being associated with state strategies
and supports, tend to pave the way for the subsequent entry of non-SOEs.5
[Table 2 about here]
On the whole, as far as Chinese investment in the rest of the developing world is concerned,
serving merchandise trade seems to have been the main consideration. In conjunction with the
patterns of China’s international trade, particularly its trading relationship with developing economies,
it can be further inferred that the trading in question has been mainly an exchange of manufactures for
commodities. This seems true not only explicitly in China’s investment in Asia and Latin American
but also, more implicitly and specifically, in China’s investment in Africa in the form of “building
infrastructure for getting resources as compensation”. Incidentally, with the large-scale construction
work and the infrastructure in place, in recent years, Africa has also become a significant destination
of (mainly labour-intensive) industries relocated away from China. A capital-labour relationship has
thus gradually emerged in the economic relations between China and Africa.

SOAS Department of Economics Working Paper No 198 – 2016
6
3. The Theses of “Crowding-out” and “Under-cutting”
The tremendous expansion of China’s manufacturing exports since the turn of the century has given
rise to widespread concerns over its impact on industrialization in other developing economies. Have
Chinese products displaced the manufactures by other developing economies, in their home markets
and/or in the international markets? Or, have Chinese exports squashed the space that could have been
available for industrialization in the rest of the developing world? These questions are what the thesis
of “China crowding-out” has sought to answer.
Existing studies have tended to give an affirmative answer to one or both of the above two
questions. These include studies on the displacing effect of Chinese exports on the manufacturing
sectors in East Asia (Hart-Landsberg and Burkett 2005), in Sub Saharan Africa (Giovannetti and
Sanfilippo 2009; Kaplinsky 2008; Kaplinsky, McCormick and Morris 2007, 2010), and in Latin
America (Gallagher, Moreno-Brid and Porzecanski 2008; Jenkins 2008, 2010, 2012; Jenkins, Peters
and Moreira 2008). These are mostly case studies of particular regions, countries, or industries.
Yet, at the aggregate level, the world share of manufacturing exports from developing
economies excluding China actually increased during this period, from 11.5% in 1999 to 14.5% in
2014 (Figure 4). Given that the export share of East Asian developing economies outside China
remained basically unchanged during this period, at around 4.5% both in 1999 and 2014, this increase
in world export share has been entirely accounted for by developing economies outside East Asia. The
same pattern is observable regarding the world shares of manufacturing value-added: between 1999
and 2013, all developing economies excluding China increased from 11% to 16.2%, of which East
Asia excluding China increased from 2.2% to 3.9% (Figure 5). On the whole, displacement effect in
the absolute sense of directly suffocating industrialization in the rest of the developing world, though
found to be widely presence in the case studies, does not seem to be true for characterizing the overall
picture of the impact of China’s export expansion.
[Figure 4 about here], [Figure 5 about here]
How about displacement in the relative sense, of squashing the space for industrialization in
the rest of the developing world? Existing studies mostly point to the issue of “primarization”. It is
observable that, both due to competition by Chinese exports and the structure of their bilateral trade
with China, many developing economies have increasingly turned to specialize in the production and
export of primary commodities (Jenkins 2012; Rosales and Kuwayama 2012; Sandrey and Edinger
2011). In addition to this point, also note that the increase in the world share of manufacturing exports
from the rest of the developing world has very substantially lagged behind that from China. Between
1999 and 2014, China’s share increased by more than 12 percentage points, whereas the rest of the
developing world increased by merely three percentage points. The contrast in the increased world

SOAS Department of Economics Working Paper No 198 – 2016
7
shares of manufacturing value-added is even more spectacular: between 1999 and 2013, China had an
increase by 20.3 percentage points, while the rest of the developing world increased by 6.2 percentage
points (of which East Asia excluding China increased by 1.7 percentage points). Surely, should there
be no “China factors”, the rest of the developing world could have gained a much bigger space for
pursuing industrialization?
Or is the impact of “China factors” conjunctural in nature, rather than structural? The relative
performance of China vis-à-vis the rest of the developing world in manufacturing exports and value-
added appears to be correlated with differences in productive investment. Between 1999 and 2013,
China’s world share of gross capital formation increased by 18.5 percentage point, while the rest of
the developing world increased by 6.6 percentage points (of which East Asia excluding China
increased by 2.4 percentage point). This correlation gives rise to the question as to what is the
direction of causation between export and output performance, on the one hand, and investment, on
the other hand. Insofar as the causation starts with investment, the relative performance in export and
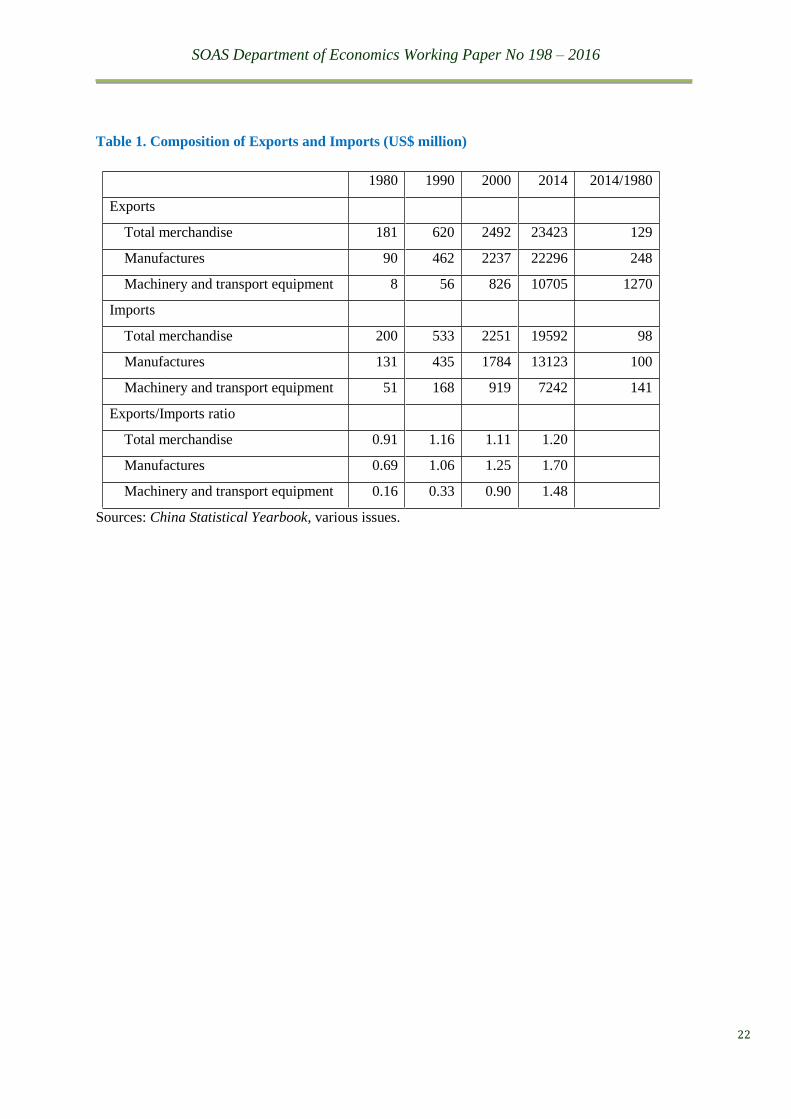
output might well be mainly caused by factors other than the crowding-out effects by China. As can
be seen from Table 3, the average ratio of gross capital formation to GDP, for the period 2000-2014,
is 43% for China and 24% for all developing economies excluding East Asia (and 27% for East Asia
excluding China). Compared with the average ratios in the preceding decades, there is a very
significant increase for China, whilst the rest of the developing world excluding East Asia remains
more or less at the same levels. Thus, both in international and historical comparisons, the rest of the
developing world has suffered from problems of insufficiency in productive investment.
[Table 3 about here]
The issue of “primarization” is relevant for considering the possibility of a reversed causation
that runs from underperformance in manufacturing exports and output to investment. Conceptually,
this causal relationship can be due to (lack of) capability and/or incentive. Industrialization requires
investment utilizing available economic surplus. Lack of capability refers to insufficiency in surplus
due to outflows, while lack of incentive refers to the misuse of surplus. The pattern of international
trade known as the “old (or colonial) international division of labour”, where backward economies
export commodities in exchange for importing manufactures from advanced economies, is often taken
as the classic case of “primarization” suffocating late industrialization.
The “China factors” – competition in the world market, bilateral trade, direct investment, etc.
– are at any rate unlikely to have caused surplus transfers from other developing economies to China.
Recall that, alongside the expansion of China trade, there was a trend of continuous improvement of
the terms of trade for the rest of the developing world. Take the examples of two countries, in Africa
and Latin America, respectively, which are representative of developing economies that export
commodities to China in exchange for manufactures, over the period 2000-2013, the net barter terms

SOAS Department of Economics Working Paper No 198 – 2016
8
of trade increased by 158% for Angola and 26% for Brazil. These numbers stand in contrast to the
decrease by 25% for China.6 Ostensibly, it is lack of incentive, due to broader political-economic
problems, that has blocked the utilization of incomes from the China-related commodity booms to
investing in industrialization in the relevant developing economies.
The contrast in productive investment, between China and the rest of the developing world,
can also serve as counter-evidence to the thesis of “under-cutting”. The thesis states that cheap labour
has been the main factor behind China’s export competiveness, and, through the pressure of
competition, it has also forced the rest of the developing world to cheapen labour. A process of the
“race to the bottom” in labour standards, where the bottom is allegedly defined by the conditions of
labour compensation and protection in China, has thus been at worked on the global scale (Chan
2003; Foster and McChesney 2012; Hart-Landsberg and Burkett 2006, 2011; Walker and Buck 2007).
This thesis is inconsistent with the characteristics of China’s international trade and industrial
production, noted in the previous section. Recall the rapidly rising share, in China’s total exports, of
machinery and transport equipment, which cannot be classified as labour-intensive judging from the
criterion of relative labour productivity. Recall also the fast expansion of China’s total exports, and
the persistence of hefty trade surpluses, amid the massive appreciation of the yuan. In addition, note
that wage rise was rather rapid precisely during this period of China’s rapid expansion in international
trade and outward investment. Between 2000 and 2014, the average annual growth of real wage rate
was 11.2% for urban registered employees and 10.3% for migrant workers, both exceeding the 9.2%
of the average annual growth of real per-capita GDP (Figure 6). To achieve the export expansion amid
the currency appreciation and wage rise thus required sufficiently fast growth in labour productivity.
Indeed, measured as per-worker real GDP, labour productivity on average grew by a very high rate of
9.3% per annum in the period 2000-2014. This is substantially higher than the average rate of 7.7% in
the preceding period of 1978-2000. It is conceivable that this acceleration of productivity growth was
associated with the concurrent acceleration of growth in productive investment.
[Figure 6 about here]
All these said, the “under-cutting” thesis appears to be far less convincing than the alternative
thesis that productive investment was the main driving force behind China’s productivity growth,
industrial upgrading, and therefore export competitiveness. Insofar as the rest of developing
economies did find themselves compelled to cheapen labour with a view of withstanding competition
by Chinese manufactures, this might have been mainly due to their insufficiency in productive
investment. Again, the sources of this insufficiency might have been related to problems of the
broader political-economic conditions.

SOAS Department of Economics Working Paper No 198 – 2016
9
4. The Broader Context: Imperialism in our Times?
The assertion, or suspicion, that China’s political economy is heading towards imperialism has been
raised mostly by journalistic commentators or political activists (see, e.g., Bond 2016; Rousset 2014;
Turner 2015). Nevertheless, this assertion does have its scholarly backing associated with the thesis of
“primarization”: the trend of (relative) de-industrialization in the developing economies that engage
with China’s international trade and outward investment has been taken as clear evidence of Chinese
imperialism. Ultimately, insofar as this assertion has intellectual insights (rather than simply judging
the real world from ideological doctrines), it has been based on a variety of theories of the “new
imperialism”, which have prevailed in the political left since the turn of the century.
Central to theories of the “new imperialism” are concerns over the relationship between
(national or transnational) capital and the state, and between rival states, in the context of
globalization (Callinicos 2009; Harvey 2003; Wood 2005). This approach does not presume that
capital-labour relations – which, after all, are the defining characteristic of capitalism – are
unimportant as underpinning of imperialism, but it is taken as given that capital-labour relations have
already fully penetrated into major parts of the world. And it is posited that China’s political
economy has already become capitalist. Indeed, China is considered to be an intrinsic part of the
neoliberal capitalist world economy (Hart-Landsberg 2005; Harvey 2005; Panitch and Gidin 2012).
With these theories plus the observations over China’s expansion in international trade and outward
investment, as well as China’s engagement in inter-state rivalries, the concerned scholars have little
hesitation to reach the judgement that China is heading towards imperialism.
But, theoretically, can global capitalism as a system be understood as simply a sum total of
individual capital-labour relations? This is plausible, but not necessarily so. It rests on the systemic
dynamics, or system-wide mode of capital accumulation, in the particular historical epoch. For one
thing, individual capitals have the natural inclination towards pursuing profits via speculation instead
of production, only to result in depressing productive investment at the aggregate level. For another,
at every level of investment, individual capitals have the natural inclination towards minimizing
labour cost, only to result in depressing aggregate consumption. Thus, the continuous existence of the
system of capitalism necessitates the working of some authorities of total capital, i.e., state power, as
countervailing force to the self-defeating natural inclinations of individual capitals. Whether the
arrangement of state power, at the global-systemic level, serves the general interests of total capital or
the special interests of sections of individual capitals is history-specific. It seems generally true,
however, that more powerful sections of capitals tend to have more influence over state power.
Capitalist imperialism entails the dominant sections of capitals, from the “North” (developed
economies), exploiting not only labour at home but also labour in the “South” (developing
economies). In other words, an essential characteristic of global capitalism is the division between

SOAS Department of Economics Working Paper No 198 – 2016
10
exploiting and exploited economies, and this division is more fundamental than capital-state relations
and inter-state rivalries in determining the welfare of the majority of the world population (Foster and
McChesney 2012; Smith 2016). The word “exploitation”, though, is not always accurate, if it is used
in the Marxian sense of the creation and extraction of surplus value within the capitalist mode of
production. For, capitalist globalization does not necessarily entail the spread of capital-labour
relations at the individual level. Globalization results in the spatial expansion of the system of
capitalism, but not necessarily the capitalist mode of production. A more general formulation can be
used instead: namely, surplus transfer from developing to developed economies. The precise content
of surplus transfer, including the importance of “exploitation” therein, depends on the systemic
dynamics in the particular historical epoch.
The systemic dynamics of capitalism in our times can be gauged by examining the core policy
doctrines of globalization. The doctrines, known as the Washington Consensus, are neoliberal in
nature and have been composed of three generations of policies: market and trade liberalization,
privatization of public assets and services, and financial liberalization especially concerning de-
regulation of cross-border capital flows. These three generations of policies combine to give rise to a
process of financialization, where economic resources have become increasingly financially tradable.
And speculative financial activities have increasingly dominated the world economy. It can be posited
that, since the early 1990s, financialization has been central to the systemic dynamics of capitalism,
and financial hegemony has been at the centre of the system.
Financialization, or capital being increasingly oriented towards speculative activities,
necessarily leads to crowding-out productive, long-term investment. This crowding-out also tends to
worsen income distribution, thereby depressing consumption growth. Consequently, there is a natural
tendency of contemporary capitalism heading towards systematic demand deficiency, and hence
economic crises. Meanwhile, the nature of speculative activities is such that they tend to focus on
redistributing profits, not creating profits. Economic crises thus tend to first erupt in the financial
sector, in the form of financial volatility or even financial collapse. The logic of financialization, in
short, is to make itself intrinsically unsustainable (Lazonick 2009; Wade 2006).
In reality, the paradox is that financialization has been sustained for a prolonged period of
time, at least up until the outbreak of systematic crises from 2007-08. Key to resolving the paradox is
the concept of “accumulation by dispossession”, i.e., cheapening productive inputs by means of
neoliberal reforms across the world. Put another way, capital accumulation in the era of globalization
is mainly based on the incorporation of productive resources that have been previously outside the
capitalist world economy. In its original formulation by Harvey (2005), the concept is referred mainly
to “predation, fraud, and thievery” particularly through various forms of wealth- or profit-seizing
speculative financial activities. Harvey also refers the concept to the expansion of the working class,

SOAS Department of Economics Working Paper No 198 – 2016
11
by means of incorporating workers in the developing world into the system. This second point
resembles the thesis of the “new international division of labour”, which is characterized by capital
chasing cheap labour around the world. A process of the “race to the bottom” could then arise if,
through the efforts of neoliberalism, labour supply expands faster than labour demand. The profits so
created and extracted could then serve to sustain the process of financialization.
Harvey in his exposition on the “new imperialism” tends to emphasize predatory activities
while downplaying the importance of labour absorption. This treatment does have its theoretical and
empirical reasons. Theoretically, in the context of financialization, capital in general is inclined to
pursue profits via speculation far more than via production. If possible at all, capital would tend to
dissociate itself from particular input-output configurations in particular spatial locations. Insofar as
production is necessary, avoiding large-scale sunk investment and pushing to the maximum degree of
the substitution of labour for capital, are logical of this inclination. Empirically, there appears to have
some validity with the claim, made by critics of the reality of financialization, that the political-
economic establishments of today’s world have been in a significant measure dominated by the Wall
Street-Treasury-IMF Complex (Bhagwati 2004; Wade and Veneroso 1998). Predatory activities by
speculative finance were quite evident in the series of developmental crises under globalization, most
notably in countries of the former Soviet bloc during the process of market transformation and East
Asian economies during the 1997-98 financial and economic crisis.
All these said about predatory activities, it can be observed and argued that labour absorption
is no less important for “accumulation by dispossession”. At one level, the scale of absorption implies
that its importance must be systematic. The IMF (2007) estimates that, in the period 1980-2005, the
number of workers effectively producing for the world market quadrupled, and that increase mostly
came from developing economies. It is no exaggeration to say that this is the first truly worldwide,
integrated labour market in history. At another level, such a rapid pace of labour absorption has most
likely created a situation that can be dubbed the “Lewis Model on the world scale”: a situation of
unlimited supply of labour from the “South” for employment by capital from the “North”. This being
the case, the implications for world development could be problematic in times of expansion, and
devastating in crisis-ridden times. In the times of expanding labour absorption, the unequal power
between capital and labour entails surplus transfer from the “South” to the “North”. This, in turn,
implies a tendency to induce the developing economies involved to fall into a “low technology, low
compensation” trap. In times of crises, the relevant developing economies tend to bear the brunt of the
systematic shocks arising from demand deficiency, especially because of the lack of domestic demand
as a buffer against the shocks. Predatory financial activities would then come to play in the
developing economies that have been engulfed into the crises.
[Figure 7 about here]

SOAS Department of Economics Working Paper No 198 – 2016
12
In summary, the preceding characterization of the systemic dynamics of capitalism today can
be illustrated by the logical flows in the upper part of Figure 7. Financialization in the “North”, and
across the world, leads to crowding-out of productive investment and systematic demand deficiency.
Continuous financialization thus tends to increasingly rely on “accumulation by dispossession”, i.e.,
surplus transfer from the “South”. This process of accumulation typically takes the form of predatory
financial activities, together with labour absorption. Predation can occur peacefully, where developing
economies pay seigniorage to developed economies (see below), or in more violent ways of the fire-
sale of productive assets of crisis-ridden developing economies to international financial agents.
Labour absorption, meanwhile, mostly occurs in times of economic expansion. Through the creation
of a situation of the “Lewis Model on the world scale”, surplus transfer from labour to capital, and
therefore from the “South” to the “North”, becomes systematic. Some developing economies could
benefit from this labour absorption, if they manage to raise their labour productivity fast enough to
more than compensate for the surplus transfer. But this must be exception, rather than the norm, in the
context of the crowding-out of productive investment and the tendency of the “race to the bottom”.
5. The “China Factors” in Perspectives
Has China been an exploiting, or exploited, economy vis-à-vis the rest of the developing world under
neoliberal globalization? This question is crucial for ascertaining whether or not it is heading towards
imperialism. Meanwhile, of a broader concern, has China’s “going out” been reinforcing, or
undermining, the systemic dynamics of global capitalism as characterized in the preceding section?
Answering this second question is important for world development, irrespective of any trace of
imperialism with China. The answer to both of these two questions, put succinctly, is that China has
been submissive-cum-resistant to the systemic dynamics of global capitalism.
Consider labour absorption. It is almost universal perception that China has followed a path of
labour-intensive, export-oriented industrialization in the main part of the reform era up until recently.
Incorporating Chinese labour into the world market has played a crucial role in the formation of the
“Lewis Model on the world scale”. Recall the IMF estimate that the effective labour force of the
world market quadrupled between 1980 and 2005. This estimate is constructed by summing over the
national data of total labour forces adjusted by their export-to-GDP ratios. Using a simpler aggregate
measure of the same indicator, the number of workers effectively producing for the world market in
2005 is founded to be 2.28 times of that in 1980, whilst the estimate for all developing countries is
3.79 times and that for China alone is 8.65 times. Put another way, China accounted for exactly 50%
of the increase in the world total of workers producing for the world market in the period 1980-2005.
The world share of the number of Chinese workers producing for the world market increased from 8%
in 1980 to 32% in 2005, although it then decreased gradually down to 19% by 2013.7

SOAS Department of Economics Working Paper No 198 – 2016
13
Along with labour absorption are the drawbacks as suggested by the literature on imperialism.
The renowned “Foxconn Model”, a model of manufacturing sweatshops controlled by transnational
capital, has often been cited as representative of the Chinese economy as the “world factory”. It is
symptomatic of such developmental drawbacks as low capital-labour ratio, high work intensity and
low compensation at the micro level, and under-consumption at the macro level. The ultimate result is
surplus outflows in times of expansion, and severe excess capacity in crisis-ridden times (Foster and
McChesney 2012; Hart-Landsberg and Burkett 2006; Smith 2016).
But, is the “Foxconn Model” really representative of the Chinese economy? At best, it might
be representative only of the sector of processing trade – manufacturing activities that import parts
and components, assemble into finished products, and re-export to the world market. Exports under
the category of processing trade have persistently accounted for approximately half of the total value
of China’s merchandise exports from the mid-1990s until recent years. Measured as the ratio of net to
gross exports, the ratio of domestic value-added of processing trade steadily increased from around
20% in the mid-1990s to reach 45% by 2009. The value-added in 2009 was equivalent to no more
than 5% of China’s GDP. In other words, the Chinese economy is of a dualistic structure, and
processing trade is no more than an enclave sector of it.8
The mainstay of Chinese economic development since the mid-1990s cannot be characterized
as a process of labour-intensive, export-oriented industrialization. Recall the analysis of China’s trade
performance in Section Two, and the critique of the thesis of under-cutting in Section Three. The
rising share of machinery and transport equipment in total exports, the persistence of trade surpluses
amid currency appreciation, the continuous wage rise, and, most fundamentally, the fast productivity
growth, all indicating that cheap labour can hardly be a significant underpinning of China’s export
and economic growth. Sustained rapid growth in productive investment, in defiance of the broader
context of financialization, is far more important. In fact, it has been suggested that, since the mid-
1990s, Chinese economic development has exhibited a tendency of converging to what can be termed
the “Golden Age Model”, i.e., the economic model that prevailed in advanced capitalist economies in
the era 1950-1973. Characteristic of the model is synchronous growth in labour productivity and the
wage rate, which, in turn, underpins synchronous growth in investment and consumption. It is with
this tendency that China has been able to sustain its income growth, and therefore its absorption of
primary commodities on a gigantic scale. This import appetite, together with the inclination to depress
export prices by the sector of the “Foxconn Model”, explains the spectacular trend of deterioration of
China’s terms of trade with the rest of the developing world.9
Now, consider issues of predation. In the first decade of the Twenty-first Century, amid
unprecedentedly fast economic growth in most developing economies, there was a notable trend in the
world of finance: massive increases in the official holding of reserves in foreign exchange by

SOAS Department of Economics Working Paper No 198 – 2016
14
developing economies. Measured as a ratio to their monthly-average import values, the official
holdings by developing economies increased from 5.2 months in 2000 to 11.8 months in 2010. The
ratio for China alone increased from 7.9 to 21.6 months. In contrast, the ratio for developed
economies increased only slightly, from 2.4 to 3.1 months (Figure 8). This trend of massive capital
flows from developing to developed economies appears to turn on the head of neoliberal doctrines of
globalization, which promise capital flows rather in the opposite direction to promote economic
development. It seems developing economies in general learned a lesson from the 1997-98 East Asian
financial and economic crisis: in the face of increasing financialization of the world economy, they
had to accumulate reserves for protecting their currencies against speculative runs. Yet, given the low
rates of returns to the reserves, the accumulation entails paying seigniorage to the developed countries
that issue reserves currencies – a tributary transfer of economic surplus to the financial hegemons of
the world.
[Figure 8 about here]
The situation with China could be considered as the extreme of this outward surplus transfer.
In addition to facing the general pressure of financial speculation in the world market, China has had
to confront conundrums arising from what McKinnon and Schnabl (2009) terms “currency
mismatches”. Whilst being the biggest trading economy in the world, with the biggest trade surplus,
China’s currency is not sufficiently important in the existing international monetary system for
financing the surplus. It thus had to accumulate reserves in the period 2000-2010. Worse, pressed by
its trading partners for reducing trade surplus, it had to allow its currency to continuously appreciate
after 2005, and this invited massive inflows of “hot money” only to further increase official reserves.
Currency mismatches cost China dearly not only in terms of surplus outflows, like other developing
economies, but also largely circumscribes its space for independent monetary policies.
Things seem to have worsened after 2008, both for China and the rest of the developing
world. Amid the unfolding Great Recession, predatory activities via hegemony in the international
monetary system have become all the more reckless. It is reported that the series of Quantitative
Easing in developed economies resulted in the flooding of “hot money” in developing economies,
and, with leveraged effects, generated serious asset bubbles (Palma 2015). The reverse flows after
2014, again with very large leveraged effects, resulted in bursting of the bubbles. These inflows and
outflows of “hot money”, manipulated by the financial hegemons of the world, have been exceedingly
harmful to developing economies. China, for one, has suffered from the associated booms and busts
with its asset markets over the era of the Great Recession. Its loss of foreign exchange in 2015 due to
capital flights, for instance, is estimated to amount to between 600 and 800 billion US dollar. The
severe fluctuations in its stock market in 2015, and with it fluctuations in its exchange rate, were to a
significant measure related to these inflows and outflows of “hot money”. Nevertheless, thanks to the

SOAS Department of Economics Working Paper No 198 – 2016
15
still existing controls over core items of its capital account, China appears to have suffered much less
than other developing economies from the erratic flows of “hot money”.10
McKinnon and Schnabl (2014) summarize the policy orientation of China’s state leadership
in response to the conundrums of “currency mismatches”. After 2008, China speeded up the process
of the internationalization of its currency, the Renminbi yuan, and one set of policy measures being
taken centre on opening up the domestic financial market. Yet, these measures have proved to be
problematic in the context of the existing hegemony in the international monetary system and its
manipulation under the Great Recession. As indicated in the preceding paragraph, the massive inflows
and outflows of “hot money” have caused booms and busts in the domestic asset markets. Worse, they
have also caused serious crowding-out effects on productive investment, forcing Chinese industrial
firms to become increasingly speculation-oriented. It appears that the Chinese leadership is confronted
with a dilemma today. The likely outcome of promoting yuan internationalization under the existing
international monetary system is, at best, to financialize the Chinese economy with a hope of sharing
the hegemony, i.e., to transform it into purely a part of neoliberal globalization. The more likely
outcome, however, is to fall prey to the existing financial hegemons of the world.
In summary, the logical flows in the lower part of Figure 7 illustrate the position of China in
relation to the systemic dynamics of capitalism today. It has been partly submissive to the dynamics,
in the form of the “Foxconn Model” in production and falling prey to international speculative
interests in finance. It has also been partly resistant to the dynamics, in the form of the domestic
structural-institutional arrangements that have generated the tendency of converging to the “Golden
Age Model”. In recent years, the Chinese leadership has initiated a range of international programmes
– the “One Belt, One Road” programme, the Asian Infrastructural Investment Bank, the New
Development Bank, etc. – aimed at reshaping the economic landscapes of the world. And one
objective of the programme is to promote yuan internationalization in a way that forces finance to
serve productive activities, rather than attempting to join the existing, speculation-oriented financial
hegemons of the world. The success or failure of this pursuit of an alternative to the existing systemic
dynamics of capitalism will be of fundamental importance, not only for China itself but also for the
future prospects for world development.
6. Conclusions
What has been the impact of China’s “going-out” on world development? The analysis in this paper
suggests that, on balance, the “China influences” have been more on the positive side than on the
negative side. This judgement is based on a critique of existing negative views in terms of what has
happened, and positing a positive view in terms of what would have happened without the influences.

SOAS Department of Economics Working Paper No 198 – 2016
16
Existing negative views have coalesced around the theses of “China crowding-out the
manufacturing production and export by other developing economies” and “China under-cutting the
wage rates of the world working class”. For the first thesis, this paper provides empirical evidence to
argue that it is flawed at the systematic level. The rest of the developing world has had considerable
expansion in manufacturing production and export, precisely in the period that China became a world-
significant player in international trade and investment. For the second thesis, this paper argues that it
is wrong because China’s trade expansion has been sustained mainly by productivity growth rather
than labour exploitation. In both instances, the contrast in production and trade performance is instead
attributed to the difference between China and other developing economies in productive investment.
In the construction of the positive view, this paper engages with the existing studies focusing
on what is meant by imperialism in the era of globalization. Scholars that insist on dubbing Chinese
political economy imperialist typically point to China as a capital-exporter, and its inclination to
driving other developing economies towards “primarization”. Yet, imperialism by nature necessarily
entails cross-country transfers of economic surplus, but there is no evidence of such transfers from
other developing economies to China. It is posited in this paper that, in the era of neoliberal
globalization, imperialism takes the specific forms of financial predation and labour absorption – both
leading to under investment across the world. In this context, China has been an exploited, rather than
exploiting, economy. Thanks to its elements of resistance against neoliberalism, Chinese political
economy has been mainly production-oriented in nature. This nature, by promoting productive
investment both domestically and in the broader developing world, has served as a countervailing
force against the speculation-oriented nature of the world market.
This positive view, to be sure, is no more than tentative. It rests on a particular interpretation
of imperialism in our times, which, whilst being consistent with a range of stylized facts of world
development as presented in the paper, is still mainly hypothetical in nature. Nor can the character of
Chinese political economy, and its impact on world development, be assumed to be fixed in the
future. Much depends on the rivalry between the submissive elements and the resistant elements vis-à-
vis the financialization-driven, speculation-oriented systematic dynamics of world capitalism.
Whether the influences of China’s “going out” are to continue to translate into world development in
the future, or to turn to become detrimental, therefore, is a matter of continuous evolution.
Footnotes:
1. Data from World Development Indicators, accessed 16 January 2016.
2. For various reasons including data consistency, “China” in this paper refers to mainland China
only, i.e., not including Hong Kong, Macau and Taiwan. China’s total exports to the world,

SOAS Department of Economics Working Paper No 198 – 2016
17
including indirect exports via Hong Kong, are estimated as the sum of China’s exports to the
world plus Hong Kong’s exports to the world minus Hong Kong’s imports from China. Indirect
trade data from Asian Development Bank, Key Indicators for Asia and the Pacific, various issues;
others from World Bank World Development Indicators.
3. Data from Bank of International Settlement, Effective Exchange Rate, accessed 5 March 2016.
4. Data from Ministry of Commerce of China, 2014 Statistical Bulletin of China’s Outward Direct
Investment.
5. Data from the same sources as note 4.
6. Data from the same sources as Figure 2
7. Data from UNCTADsta, accessed 8 May 2016.
8. See Lo (2013) for a detailed analysis.
9. See Lo (2016) for a detailed analysis of the convergence of Chinese economic transformation to
the “Golden Age Model” from the mid-1990s onward, and the interruption to this convergence
post-2008 due to the process of financialization.
10. In principle, given the existing system of capital controls in China, the sum total of the following
three items of cross-border capital flows should be approximately equal to zero: current account
balance, the balance in foreign direct investment, and the change in official reserves. Yet,
according to the 2015 balance of payment data, the actual sum total was a negative amount of US
dollar 958 billion. Possible reasons for this result include the revaluation of official reserves due
to exchange rate changes, net repayment for foreign debts, transfer of foreign exchange from
official reserves to private hands, and capital flights. Estimates of the scale of capital flights (and
“hot money” outflows) vary, from US dollar 600 to 800 billion.

SOAS Department of Economics Working Paper No 198 – 2016
18
References
Bhagwati, J. (2004) In Defense of Globalization, Oxford, Oxford University Press.
Bond, P. (2016) “China’s path into Africa blocked”, Pambazuka News,
http://www.pambazuka.org/global-south/china%E2%80%99s-path-africa-blocked.
Callinicos, A. (2009) Imperialism and Global Political Economy, Cambridge (U.K.): Polity.
Chan A. (2003) “A ‘race to the bottom’: globalisation and China’s labour standards”, China
Perspectives, no.46, http://chinaperspectives.revues.org/259
Foster, J.B. and R. McChesney (2012) The Endless Crisis: How Monopoly Finance Capital Produces
Stagnation and Upheaval from the USA to China, New York: Monthly Review Press.
Gallagher, K., J.C. Moreno-Brid, and R. Porzecanski (2008) “The dynamism of Mexican exports: lost
in (Chinese) translation?”, World Development, 36 (8): 1365-1380.
Giovannetti G., and M. Sanfilippo (2009) “Do Chinese exports crowd-out African Goods? An
econometric analysis by country and sector”, European Journal of Development Research, 21:
506-530.
Hart-Landsberg M. and P. Burkett (2005) China and Socialism: Market Reforms and Class Struggle,
New York: Monthly Review Press.
Hart-Landsberg M. and P. Burkett (2006) “China and the dynamics of transnational accumulation:
causes and consequences of global restructuring”, Historical Materialism, 14 (3): 3-43.
Hart-Landsberg M. and P. Burkett (2011) “The Chinese reform experience: a critical assessment”,
Review of Radical Political Economics, 43 (1): 56-76.
Harvey, D. (2003) The New Imperialism, Oxford, Oxford University Press.
Harvey, D. (2005) A Brief History of Neoliberalism, Oxford, Oxford University Press.
International Monetary Fund (IMF) (2007) World Economic Outlook, April.
Jenkins, R.O. (2008) “Measuring the competitive threat from China for other Southern exporters”,
The World Economy, 31 (10): 1351-1366.
Jenkins, R.O. (2010) “China’s global expansion and Latin America”, Journal of Latin American
Studies, 42: 809-837.

SOAS Department of Economics Working Paper No 198 – 2016
19
Jenkins, R.O. (2012) “Latin America and China: a new dependency?”, Third World Quarterly, 33 (7):
1337-1358.
Jenkins, R.O., E.D. Peters, and M.M. Moreira (2008) “The impact of China on Latin America and the
Caribbean”, World Development, 36 (2): 235-253.
Kaplinsky R. (2008) “What does the rise of China do for industrialisation in Sub Saharan Africa?”,
Review of African Political Economy, 35 (115): 7-22.
Kaplinsky, R., D. McCormick, and M. Morris (2007) “The impact of China on Sub Saharan Africa”,
IDS Working Paper no.291, http://www.ids.ac.uk/files/Wp291.pdf
Kaplinsky, R., D. McCormick, and M. Morris (2010) “China and Sub Saharan Africa: impacts and
challenges of a growing relationship”, in V. Padayachee ed., The Political Economy of Africa,
London: Routledge.
Lazonick, W. (2009) Sustainable Prosperity in the New Economy?, Kalamazoo, Michigan: W.E.
Upjohn Institute for Employment Research.
Lo, D. (2013) “China and world development – beyond the crisis”, in N. Yokogawa, J. Ghosh and R.
Rowthorn (eds.) Industrialization in China and India: Their Impacts on the World Economy,
London, Routledge
Lo, D. (2016) “China confronts the Great Recession: ‘rebalancing’ neoliberalism, or else?”, in P.
Arestis and M. Sawyer (eds.) Emerging Economies During and After the Great Recession,
(International Papers in Political Economy 2016 ), Basingstoke, Palgrave Macmillan.
McKinnon, R. and G. Schnabl (2009) “China’s financial conundrum and global imbalances”, BIS
Working Papers no.277, Bank of International Settlement,
http://www.bis.org/publ/work277.pdf
McKinnon, R. and G. Schnabl (2014) “China’s exchange rate and financial repression: the conflicted
emergence of the RMB as an international currency”, China & World Economy, 22 (3): 1-34.
Palma, J.G. (2015) “Why corporations in developing countries are likely to be even more susceptible
to the vicissitudes of international finance than their counterparts in the developed world: a
tribute to Ajit Singh”, Cambridge Working Papers in Economics, CWPE 1539,
http://www.econ.cam.ac.uk/research/repec/cam/pdf/cwpe1539.pdf
Panitch, L., and S. Gidin (2012) The Making of Global Capitalism: The Political Economy of
American Empire, London, Verso.

SOAS Department of Economics Working Paper No 198 – 2016
20
Rosales O., and M. Kuwayama (2012) China and Latin America and the Caribbean: Building a
Strategic Economic and Trade Relationship, Santiago, ECLAC.
Rousset, P. (2014) “Chinese ambitions – an imperialism in formation”, International Viewpoint,
no.474, http://www.internationalviewpoint.org/spip.php?article3468,
Sandrey, R., and H. Edinger (2011) “China’s manufacturing and industrialization in Africa”, African
Development Bank, working paper no.128,
http://www.afdb.org/fileadmin/uploads/afdb/Documents/Publications/Working%20128.pdf
Smith, J. (2016) Imperialism in the Twenty-First Century: Globalization, Super-Exploitation, and
Capitalism’s Final Crisis, New York: Monthly Review Press.
Turner, N.B. (2015) Is China an Imperialist Country? Considerations and Evidence, Kersplebedeb.
Walker, R., and D. Buck (2007) “The Chinese Road: cities in the transition to capitalism”, New Left
Review, no.46: 39-66.
Wade, R.H. (2006) “Choking the South”, New Left Review, 38: 115-127.
Wade, R.H. and F. Veneroso (1998a) “The Asian crisis: the high debt model versus the Wall Street-
Treasury-IMF Complex”, New Left Review, 228: 3-23.
Wood, E.M. (2005) Empire of Capital, London: Verso.

SOAS Department of Economics Working Paper No 198 – 2016
21
Figure 1. China’s Merchandise Trade (current US$ million)
Sources: World Bank World Development Indicators, accessed 16th January 2016.
0
400000
800000
1200000
1600000
2000000
2400000
19
80
19
82
19
84
19
86
19
88
19
90
19
92
19
94
19
96
19
98
20
00
20
02
20
04
20
06
20
08
20
10
20
12
20
14
Merchandise exports total
Merchandise exports to high-income economies
Merchandise exports to low and middle-income economies
Merchandise imports total
Merchandise imports from high-income economies
Merchandise imports from low and middle-income economies
SOAS Department of Economics Working Paper No 198 – 2016
22
Table 1. Composition of Exports and Imports (US$ million)
1980 1990 2000 2014 2014/1980
Exports
Total merchandise 181 620 2492 23423 129
Manufactures 90 462 2237 22296 248
Machinery and transport equipment 8 56 826 10705 1270
Imports
Total merchandise 200 533 2251 19592 98
Manufactures 131 435 1784 13123 100
Machinery and transport equipment 51 168 919 7242 141
Exports/Imports ratio
Total merchandise 0.91 1.16 1.11 1.20
Manufactures 0.69 1.06 1.25 1.70
Machinery and transport equipment 0.16 0.33 0.90 1.48
Sources: China Statistical Yearbook, various issues.

SOAS Department of Economics Working Paper No 198 – 2016
23
Figure 2. Net Barter Terms of Trade (1980 = 100)
Sources: IMF World Economic Outlook, various issues; and World Bank World Development
Indicators, accessed 9th November 2015.
40
50
60
70
80
90
100
110
120
1980
1982
1984
1986
1988
1990
1992
1994
1996
1998
2000
2002
2004
2006
2008
2010
2012
2014
China Advanced Emerging and Developing

SOAS Department of Economics Working Paper No 198 – 2016
24
Figure 3. China’s FDI (Flows, US$ million)
Sources: China Statistical Yearbook and Report on Development of China’s Outward Investment and
Economic Cooperation, various issues.
0
20000
40000
60000
80000
100000
120000
140000
2003 2004 2005 2006 2007 2008 2009 2010 2011 2012 2013 2014
outward
inward

SOAS Department of Economics Working Paper No 198 – 2016
25
Table 2. Regional Distribution of China’s Outward FDI
China's outward FDI (flows, US$ million) China's outward FDI (stocks, US$ million)
Total Developing LAC Africa Asia Total Developing LAC Africa Asia
2003 2855 2605 1038 75 1492 33222 31592 4619 491 26482
2004 5498 5065 1763 317 2985 44777 42454 8268 900 33286
2005 12261 11216 6466 392 4484 57206 53563 11470 1595 40954
2006 17634 16565 8469 520 7663 75026 69643 19694 2557 47978
2007 26506 22891 4902 1574 16593 117911 107264 24701 4462 79218
2008 55907 52055 3677 5491 43548 183971 169289 32240 7804 131317
2009 56529 48780 7328 1439 40410 245755 222975 30595 9332 185550
2010 68811 56736 10538 2112 44890 317211 281597 43876 13042 228150
2011 74654 60034 11936 3173 45494 424781 370117 55172 16244 303440
2012 87804 70017 6170 2517 64793 531941 445739 68212 21730 364407
2013 107844 91730 14359 3371 75614 660478 559690 86096 26186 447408
2014 123120 97680 10547 3202 84990 882642 739431 106111 32350 600970
% of
Total
2003 100% 91% 36% 3% 52% 100% 95% 14% 1% 80%
2004 100% 92% 32% 6% 54% 100% 95% 18% 2% 74%
2005 100% 91% 53% 3% 37% 100% 94% 20% 3% 72%
2006 100% 94% 48% 3% 43% 100% 93% 26% 3% 64%
2007 100% 86% 18% 6% 63% 100% 91% 21% 4% 67%
2008 100% 93% 7% 10% 78% 100% 92% 18% 4% 71%
2009 100% 86% 13% 3% 71% 100% 91% 12% 4% 76%
2010 100% 82% 15% 3% 65% 100% 89% 14% 4% 72%
2011 100% 80% 16% 4% 61% 100% 87% 13% 4% 71%
2012 100% 80% 7% 3% 74% 100% 84% 13% 4% 69%
2013 100% 85% 13% 3% 70% 100% 85% 13% 4% 68%
2014 100% 79% 9% 3% 69% 100% 84% 12% 4% 68%
Sources: China Statistical Yearbook and Report on Development of China’s Outward Investment and
Economic Cooperation, various issues.
Notes: LAC = Latin America and the Caribbean. “Developing Economies” do not include “Transition
Economies”.

SOAS Department of Economics Working Paper No 198 – 2016
26
Figure 4. World Shares of Manufacturing Exports
Sources: World Bank World Development Indicators, accessed 7th March 2016.
0.00%
5.00%
10.00%
15.00%
20.00%
25.00%
30.00%
35.00%
19
90
19
91
19
92
19
93
19
94
19
95
19
96
19
97
19
98
19
99
20
00
20
01
20
02
20
03
20
04
20
05
20
06
20
07
20
08
20
09
20
10
20
11
20
12
20
13
20
14
L&M income - East Asia
East Asia - China
China

SOAS Department of Economics Working Paper No 198 – 2016
27
Figure 5. World Shares of Manufacturing Value-added
Sources: World Bank World Development Indicators, accessed 15th March 2016.
0.00%
5.00%
10.00%
15.00%
20.00%
25.00%
30.00%
35.00%
40.00%
45.00%
19
91
19
92
19
93
19
94
19
95
19
96
19
97
19
98
19
99
20
00
20
01
20
02
20
03
20
04
20
05
20
06
20
07
20
08
20
09
20
10
20
11
20
12
20
13
Low&middle income - East Asia
East Asia - China
China
SOAS Department of Economics Working Paper No 198 – 2016
28
Table 3. Gross Capital Formation and Manufacturing Value-added (average % of GDP)
1960-1979 1980-2000 2000-2014
Gross capital formation (% of GDP)
China 29.86% 37.25% 43.04%
East Asia - China 21.64% 28.74% 26.68%
Low&middle income - East Asia 22.13% 22.45% 23.72%
Manufacturing value added (% of GDP)
China 36.08% 39.44% 39.62%
East Asia - China 16.01% 22.04% 24.97%
Low&middle income - East Asia 16.69% 17.57% 13.90%
Sources: World Bank World Development Indicators, accessed 7th February 2016.

SOAS Department of Economics Working Paper No 198 – 2016
29
Figure 6. Indices of Per-Capital Real GDP and Real Wage Rates (2000 = 100)
Sources: Per-capital GDP and urban wage rate data from China Statistical Yearbook, various issues;
wage rate data for migrant workers from Report on Monitoring and Surveying Migrant
Workers, various issues, and Lu Feng (2012) “Wage rate trends of China’s migrant workers,
1979-2010’, Zhongguo Shehui Kexue (Social Sciences in China), 2012, no.7: 47-67.
0.0
50.0
100.0
150.0
200.0
250.0
300.0
350.0
400.0
450.0
2000 2001 2002 2003 2004 2005 2006 2007 2008 2009 2010 2011 2012 2013 2014 2015
Per-capita real GDP
Real urban wage rate
Real wage rate for migrant workers

SOAS Department of Economics Working Paper No 198 – 2016
30
Figure 7. China Confronts Neoliberal Globalization: An Illustration
Notes: OBOR = One Belt, One Road; AIIB = Asian Infrastructural Investment Bank; Bricks Bank =
New Development Bank.
Neoliberal Globalization: financialization and financial hegemony
Crowding out productive investment + worsening income distribution
Surplus transfer from “South” to “North”
China submissive-cum-resistant to this systematic dynamics of (neoliberal) world capitalism
Pre-2008: dualistic economy Post-2008: increasing financialization
“Foxconn Model” vs. “Golden Age Model” Speculation vs. productive investment
Submissive to neoliberal globalization vs. Resistant to neoliberal globalization
Yuan internationalization by joining Yuan internationalization by forcing
Financialization finance to serve productive investment
(predation + labour absorption) (OBOR, AIIB, Bricks Bank…)
Predation
Seigniorage Bubbles +
capital flights
Labour absorption
Lewis Model on Labour/local capital bearing
the world scale the brunt of demand deficiency

SOAS Department of Economics Working Paper No 198 – 2016
31
Figure 8. Official Reserves in Foreign Exchange as Ratio to Average Values of Imports in Goods
and Services (Months)
Sources: International Monetary Fund (IMF), COFER, accessed 17th May 2015, and World Economic
Outlook, various issues.
Notes: Data are end-of-year foreign exchange reserves of central bank divided by the monthly
average import values of the previous 12 months.
0.00
5.00
10.00
15.00
20.00
25.00
30.00
19
95
19
96
19
97
19
98
19
99
20
00
20
01
20
02
20
03
20
04
20
05
20
06
20
07
20
08
20
09
20
10
20
11
20
12
20
13
20
14
Advanced
Emerging and Developing
China


![Journal of Financial Economics - scholar.harvard.edu · ARTICLE IN PRESS JID: FINEC [m3Gdc;October 30, 2018;1:9] Journal of Financial Economics xxx (xxxx) xxx Contents lists available](https://img.pdfslide.us/doc/110x75/5d5c3e4d88c993a1568bd3a9/journal-of-financial-economics-article-in-press-jid-finec-m3gdcoctober.jpg)
![Sport Utility Vehicle...Rated output1 (kW [HP] at rpm) XXX XXX XXX XXX XXX Acceleration from 0 to 100 km/h (s) XXX XXX XXX XXX XXX Top speed (km/h) XXX 3XXX XXX 3XXX XXX3 Fuel consumption4](https://img.pdfslide.us/doc/110x75/5e9ad03bae36bf4b5c045c78/sport-utility-vehicle-rated-output1-kw-hp-at-rpm-xxx-xxx-xxx-xxx-xxx-acceleration.jpg)