Embed Size (px)
Citation preview
Smith & Nephew Second Quarter and First Half 2017 Results Improved execution with revenue growth and trading profit margin on-track; full year guidance unchanged 27 July 2017 Smith & Nephew plc (LSE:SN, NYSE:SNN) results for second quarter and first half ended 1 July 2017: Reported Trading2
1 July 2 July Reported 1 July 2 July Underlying 2017 2016 growth 2017 2016 growth $m $m $m $m
Second Quarter Results1
Revenue 1,194 1,191 0% 1,194 1,191 3%
First Half Results1
Revenue 2,336 2,328 0% 2,336 2,328 3% Operating profit 414 357 Trading profit 493 483 Operating/trading profit margin (%) 17.7 15.3 21.1 20.8 EPS/ EPSA (cents) 37.0 27.0 43.0 37.4
Second Quarter Highlights1 • Q2 revenue of $1,194 million reflects 0% reported and 3% underlying growth. Reported growth
rate includes -1% FX headwind and -2% impact of 2016 disposal of Gynaecology • Sustained recovery in Emerging Markets with revenue up 13% in the quarter • Strong growth in Knee Implants and Advanced Wound Devices • Expansion of NAVIO◊ handheld robotics platform with launch of Total Knee application
First Half Highlights1 • H1 revenue of $2,336 million reflects 0% reported and 3% underlying growth. Reported growth
rate includes -1% FX headwind and -2% impact of 2016 disposal of Gynaecology • H1 operating profit of $414 million, with operating profit margin of 17.7%, an increase of 240bps • H1 trading profit of $493 million, with trading profit margin of 21.1%, an increase of 30bps • Strong growth in EPS (up 37%) and EPSA (up 15%) reflecting one-off tax benefit along with
improvements in trading profit margin and tax rate • Tax rate on trading is expected to reduce to around 22% in FY 2017 and around 25% thereafter • Cash generated from operating activities of $438 million (H1 2016: $380 million). Trading cash
flow of $327 million (H1 2016: $255 million) with trading profit to cash conversion ratio of 66% • Interim dividend of 12.3¢ per share, in-line with policy (2016: 12.3¢)
Olivier Bohuon, Chief Executive Officer of Smith & Nephew, said: “I am pleased with the first half of 2017, where our focus on execution is delivering improvements in performance at the top and bottom line. In particular, we have returned the Emerging Markets to double-digit growth and driven strong returns from disruptive innovations in areas such as Knee Implants and Negative Pressure Wound Therapy. “We are taking good momentum into the second half and I am confident that we are on-track to deliver our full year revenue and trading margin guidance, which is unchanged. We continue to expect underlying revenue growth of 3-4% and a 20-70bps improvement in trading profit margin for the full year. “Our new products, such as the Total Knee Application on our NAVIO robotics-assisted surgery system, position us well for further progress. I am also confident that our pipeline of innovation and improved execution will underpin our medium-term ambition to consistently outgrow our markets whilst building trading profit margin.”
News
Analyst conference call An analyst meeting and conference call to discuss Smith & Nephew’s second quarter trading and first half 2017 results for the period ended 1 July 2017 will be held today, Thursday 27 July at 9:00am BST / 4:00am EDT. This will be webcast live and available for replay shortly after. The details can be found on the Smith & Nephew website at www.smith-nephew.com/results. Enquiries Investors Ingeborg Øie +44 (0) 20 7960 2285 Smith & Nephew Media Charles Reynolds +44 (0) 20 7401 7646 Smith & Nephew Ben Atwell / Matthew Cole +44 (0) 20 3727 1000 FTI Consulting Notes
1. Unless otherwise specified as ‘reported’ all revenue growth throughout this document is ‘underlying’ after adjusting for the effects of
currency translation and including the comparative impact of acquisitions and excluding disposals. All percentages compare to the equivalent 2016 period.
Underlying revenue growth is used to compare the revenue in a given period to the comparative period on a like-for-like basis. Underlying revenue growth reconciles to reported revenue growth, the most directly comparable financial measure calculated in accordance with IFRS, by making adjustments for the effect of acquisitions and disposals and the impact of movements in exchange rates (currency impact), as described below.
The effect of acquisitions and disposals measures the impact on revenue from newly acquired business combinations and recent business disposals. This is calculated by comparing the current year, constant currency actual revenue (which include acquisitions and exclude disposals from the relevant date of completion) with prior year, constant currency actual revenue, adjusted to include the results of acquisitions and exclude disposals for the corresponding period in the prior year.
Currency impact measures the increase/decrease in revenue resulting from currency movements on non-US Dollar sales and is measured as the difference between: 1) the increase/decrease in current year revenue translated into US Dollars at the current year average rate and the prior year revenue translated at the prior year average rate; and 2) the increase/decrease being measured by translating current and prior year revenue into US Dollars using a constant fixed rate.
2. Certain items included in ‘trading results’, such as trading profit, trading profit margin, trading cash flow, EPSA and underlying growth are non-IFRS financial measures. The non-IFRS financial measures reported in this announcement are explained in Note 8 and are reconciled to the most directly comparable financial measure prepared in accordance with IFRS. Reported results represent IFRS financial measures as shown in the Condensed Consolidated Interim Financial Statements.
2
Smith & Nephew Second Quarter Trading and First Half 2017 Results Second Quarter 2017 Trading Update Our second quarter revenue was $1,194 million (2016: $1,191 million), flat on a reported basis including a foreign exchange headwind of -1% and the -2% effect of the disposal of Gynaecology in August 2016. Excluding these factors, underlying revenue growth was up 3% in the quarter, in-line with guidance. The second quarter 2017 comprised 63 trading days, one fewer than in the same period of 2016, which typically impacts our surgical businesses more than our Advanced Wound Management businesses and the Established Markets more than the Emerging Markets. Unless otherwise specified as ‘reported’ all revenue growth rates throughout this document are underlying increases/decreases after adjusting for the effects of currency translation and including the comparative impact of acquisitions and excluding disposals. All percentages compare to the equivalent 2016 period. Second Quarter Consolidated Revenue Analysis Smith & Nephew trading results for the second quarter ended 1 July 2017:
Consolidated revenue by franchise
1 July 2017
$m
2 July 2016
$m
Reported growth
%
Underlying Growth(i)
%
Acquisitions /disposals
%
Currency impact
% Sports Medicine, Trauma & Other 480 487 -2 3 -4 -1
Sports Medicine Joint Repair 152 147 4 5 - -1 Arthroscopic Enabling Technologies 151 160 -6 -4 - -2 Trauma & Extremities 127 119 7 7 - - Other Surgical Businesses 50 61 -19 11 -29 -1 Reconstruction 396 391 1 2 - -1 Knee Implants 246 238 3 4 - -1 Hip Implants 150 153 -2 -1 - -1 Advanced Wound Management 318 313 1 3 - -2 Advanced Wound Care 177 177 - 2 - -2 Advanced Wound Bioactives 92 93 -1 - - -1 Advanced Wound Devices 49 43 12 14 - -2 Total 1,194 1,191 - 3 -2 -1 Consolidated revenue by geography US 582 582 - 2 -2 - Other Established Markets(ii) 408 429 -5 -1 - -4 Emerging Markets 204 180 13 13 - - Total 1,194 1,191 - 3 -2 -1
(i) Underlying growth is defined in Note 1 on page 2 (ii) Other Established Markets are Europe, Canada, Japan, Australia and New Zealand
Regional performance Revenue grew 1% in the Established Markets in the quarter, with the US, our largest market, up 2%. In Europe we continue to make progress, although headline growth was held back by the impact of the Easter holiday which fell in the first quarter last year.
3
Performance in the Emerging Markets was good, with revenue up 13%. China maintained the improved dynamic seen last quarter and growth across our other Emerging Markets countries remained strong. Q2 2017 Franchise Highlights Sports Medicine Joint Repair delivered 5% revenue growth in the quarter, with a good performance from our shoulder repair portfolio. In Arthroscopic Enabling Technologies revenue was down -4% as the softness in resection continued. The roll-out of our LENS◊ visualisation system is proceeding at pace and the introduction of the WEREWOLF◊ COBLATION◊ system is accelerating. We expect growth from these new products to increasingly offset the drag from legacy resection. Trauma & Extremities delivered strong growth, with revenue up 7% in the quarter. We continued to build good momentum behind our TRIGEN◊ INTERTAN◊ hip fracture system and also benefitted from a tender order in the Middle East. Our Other Surgical Businesses franchise delivered revenue growth of 11% in the quarter. This included another strong quarter from our Ear, Nose & Throat (‘ENT’) business and continued strong demand for our hand-held robotics NAVIO Surgical System. During the quarter we launched the total knee arthroplasty (TKA) application on NAVIO. Total knees comprise 80% of all knee replacement surgeries globally. Knee Implants delivered another good quarter, with revenue up 4%. Our JOURNEY II Total Knee System continued to drive growth, and new additions to the LEGION Revision Knee System started to contribute. Revenue from our Hip Implants franchise was down -1%. We expect the new REDAPT◊ Revision System, where we launched a Monolithic Sleeved variant in the quarter, and the POLARSTEM◊ Cementless Stem System, to contribute more to growth in the second half of 2017. Advanced Wound Care delivered 2% revenue growth. This included strong double-digit growth in the US, led by the ALLEVYN◊ range of foam dressings and our comprehensive pressure ulcer prevention and treatment proposition. We returned China to positive growth, as expected, but continued to see softness in Europe, as previously reported. Advanced Wound Bioactives delivered an improved performance. Whilst SANTYL® returned to growth, OASIS◊ remained a headwind, meaning overall Q2 revenue growth for the franchise was flat. We continue to expect SANTYL to drive positive revenue growth in the second half of the year. Advanced Wound Devices delivered good revenue growth of 14% in the quarter. This was led by our disposable negative pressure wound therapy (‘NPWT’) device PICO◊, which continued to perform strongly in the quarter. First Half 2017 Review of Strategic Priorities We entered 2017 confident that we had the right structure and capability in place and focused on improving execution across the Group. We have a clear set of actions underway in areas such as commercial and R&D that are starting to deliver benefits to the top and bottom line. We take good momentum into the second half of 2017. Group revenue for the first half was $2,336 million (H1 2016: $2,328 million), flat on a reported basis (after -1% FX and -2% impact of the Gynaecology disposal) and up 3% on an underlying basis. There was one fewer sales day in the first half of 2017 over 2016. In the Established Markets we delivered 1% underlying revenue growth in the first half. Revenue in our US business grew 2%, driven by continued strong performance in areas such as Knee Implants and Advanced Wound Care and Advanced Wound Devices. Growth in our Other Established Markets was
4
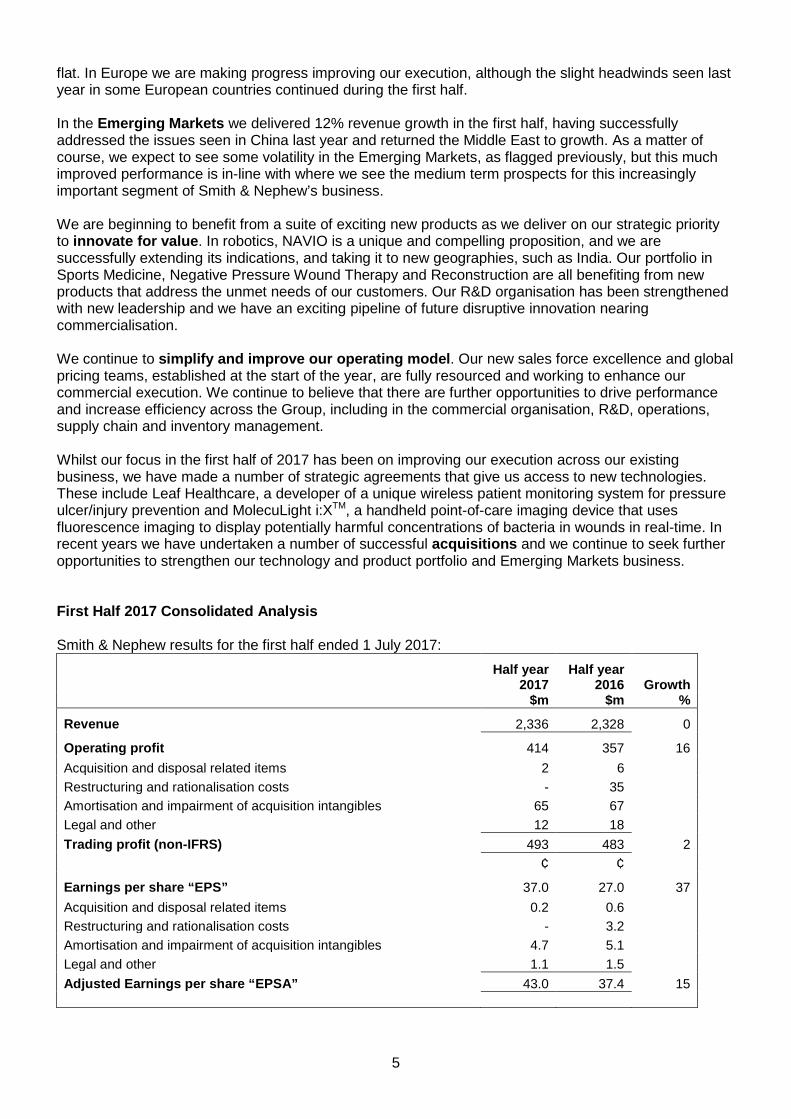
flat. In Europe we are making progress improving our execution, although the slight headwinds seen last year in some European countries continued during the first half. In the Emerging Markets we delivered 12% revenue growth in the first half, having successfully addressed the issues seen in China last year and returned the Middle East to growth. As a matter of course, we expect to see some volatility in the Emerging Markets, as flagged previously, but this much improved performance is in-line with where we see the medium term prospects for this increasingly important segment of Smith & Nephew’s business. We are beginning to benefit from a suite of exciting new products as we deliver on our strategic priority to innovate for value. In robotics, NAVIO is a unique and compelling proposition, and we are successfully extending its indications, and taking it to new geographies, such as India. Our portfolio in Sports Medicine, Negative Pressure Wound Therapy and Reconstruction are all benefiting from new products that address the unmet needs of our customers. Our R&D organisation has been strengthened with new leadership and we have an exciting pipeline of future disruptive innovation nearing commercialisation. We continue to simplify and improve our operating model. Our new sales force excellence and global pricing teams, established at the start of the year, are fully resourced and working to enhance our commercial execution. We continue to believe that there are further opportunities to drive performance and increase efficiency across the Group, including in the commercial organisation, R&D, operations, supply chain and inventory management. Whilst our focus in the first half of 2017 has been on improving our execution across our existing business, we have made a number of strategic agreements that give us access to new technologies. These include Leaf Healthcare, a developer of a unique wireless patient monitoring system for pressure ulcer/injury prevention and MolecuLight i:XTM, a handheld point-of-care imaging device that uses fluorescence imaging to display potentially harmful concentrations of bacteria in wounds in real-time. In recent years we have undertaken a number of successful acquisitions and we continue to seek further opportunities to strengthen our technology and product portfolio and Emerging Markets business. First Half 2017 Consolidated Analysis Smith & Nephew results for the first half ended 1 July 2017:
Half year
2017 Half year
2016 Growth $m $m %
Revenue 2,336 2,328 0
Operating profit 414 357 16 Acquisition and disposal related items 2 6 Restructuring and rationalisation costs - 35 Amortisation and impairment of acquisition intangibles 65 67 Legal and other 12 18 Trading profit (non-IFRS) 493 483 2 ¢ ¢
Earnings per share “EPS” 37.0 27.0 37 Acquisition and disposal related items 0.2 0.6 Restructuring and rationalisation costs - 3.2 Amortisation and impairment of acquisition intangibles 4.7 5.1 Legal and other 1.1 1.5 Adjusted Earnings per share “EPSA” 43.0 37.4 15
5
First Half 2017 Analysis Reported operating profit of $414 million (H1 2016: $357 million) is after integration and acquisition costs, as well as restructuring and rationalisation costs, amortisation of acquisition intangibles and legal and other items incurred in the first half (see Note 8 to the Interim Financial Statements). Trading profit was $493 million in the first half (H1 2016: $483 million), and the trading profit margin was 21.1% (H1 2016: 20.8%), up 30bps, in-line with guidance. The net interest charge within reported results was $25 million (H1 2016: $24 million). The tax rate on reported results for the 2017 half year was 15.4% compared to 26.3% for the 2016 half year reflecting the lower tax rate on trading results (see Note 8 for a reconciliation between tax rate on trading and reported results). The tax rate on trading results for the 2017 first half was 19.0% compared to 26.3% for the first half of 2016, with the reduction mainly due to a one-off benefit following the conclusion of a US tax audit. Basic earnings per share (‘EPS’) was up 37% at 37.0¢ (74.0¢ per ADS) (H1 2016: 27.0¢). Adjusted earnings per share (‘EPSA’) was up 15% at 43.0¢ (86.0¢ per ADS) (H1 2016: 37.4¢) primarily reflecting the one-off tax benefit, along with improvements in trading profit margin and tax rate on trading. Cash generated from operations was $438 million in the first half (H1 2016: $380 million), reflecting the higher profit-before-tax in the period. Trading cash flow was $327 million (H1 2016: $255 million) (see Note 8 for a reconciliation between cash generated from operating activities and trading cash flow). The trading profit to cash conversion ratio was 66% (H1 2016: 53%). Interim Dividend Consistent with previous periods, the interim dividend is set by a formula and is equivalent to 40% of the total dividend for the previous year. The interim dividend for the first half of 2017 is therefore 12.3¢ per share (24.6¢ per ADS), in-line with last year. This equates to 9.5 pence per share at prevailing exchange rates as of 21 July 2017. The interim dividend will be paid on 1 November 2017 to shareholders on the register at the close of business on 6 October 2017. Outlook Smith & Nephew is on-track to deliver on its full year revenue and trading margin guidance, which is unchanged. We continue to expect underlying revenue growth in the 3-4% range and a 20-70bps improvement in trading profit margin in 2017. On a reported basis, we expect 2017 revenue growth to be in the range of 2.5-3.5% based on prevailing exchange rates at 21 July 2017 and taking into account the 80bps headwind from the loss of revenues from the disposal of the Gynaecology business. We expect the 2017 tax rate on trading results for the full year to be around 22%. As a result of our progress improving our tax rate, and excluding the one-off benefit seen in H1 2017, we expect a tax rate on trading results of around 25% to be sustainable, barring any changes to tax legislation or other one-off items. Looking further ahead, we are confident that our pipeline of innovation and improved execution will underpin our medium-term ambition to consistently outgrow our markets whilst building trading profit margin.
6
Forward calendar The Q3 Trading Report will be released on 3 November 2017. About Smith & Nephew Smith & Nephew is a global medical technology business dedicated to supporting healthcare professionals in their daily efforts to improve the lives of their patients. With leadership positions in Orthopaedic Reconstruction, Advanced Wound Management, Sports Medicine and Trauma & Extremities, Smith & Nephew has more than 15,000 employees and a presence in more than 100 countries. Annual sales in 2016 were almost $4.7 billion. Smith & Nephew is a member of the FTSE100 (LSE:SN, NYSE:SNN). For more information about Smith & Nephew, please visit our corporate website www.smith-nephew.com, follow @SmithNephewplc on Twitter or visit SmithNephewplc on Facebook.com. Forward-looking Statements This document may contain forward-looking statements that may or may not prove accurate. For example, statements regarding expected revenue growth and trading margins, market trends and our product pipeline are forward-looking statements. Phrases such as "aim", "plan", "intend", "anticipate", "well-placed", "believe", "estimate", "expect", "target", "consider" and similar expressions are generally intended to identify forward-looking statements. Forward-looking statements involve known and unknown risks, uncertainties and other important factors that could cause actual results to differ materially from what is expressed or implied by the statements. For Smith & Nephew, these factors include: economic and financial conditions in the markets we serve, especially those affecting health care providers, payers and customers; price levels for established and innovative medical devices; developments in medical technology; regulatory approvals, reimbursement decisions or other government actions; product defects or recalls or other problems with quality management systems or failure to comply with related regulations; litigation relating to patent or other claims; legal compliance risks and related investigative, remedial or enforcement actions; disruption to our supply chain or operations or those of our suppliers; competition for qualified personnel; strategic actions, including acquisitions and dispositions, our success in performing due diligence, valuing and integrating acquired businesses; disruption that may result from transactions or other changes we make in our business plans or organisation to adapt to market developments; and numerous other matters that affect us or our markets, including those of a political, economic, business, competitive or reputational nature. Please refer to the documents that Smith & Nephew has filed with the U.S. Securities and Exchange Commission under the U.S. Securities Exchange Act of 1934, as amended, including Smith & Nephew's most recent annual report on Form 20-F, for a discussion of certain of these factors. Any forward-looking statement is based on information available to Smith & Nephew as of the date of the statement. All written or oral forward-looking statements attributable to Smith & Nephew are qualified by this caution. Smith & Nephew does not undertake any obligation to update or revise any forward-looking statement to reflect any change in circumstances or in Smith & Nephew's expectations. ◊ Trademark of Smith & Nephew. Certain marks registered US Patent and Trademark Office.
7
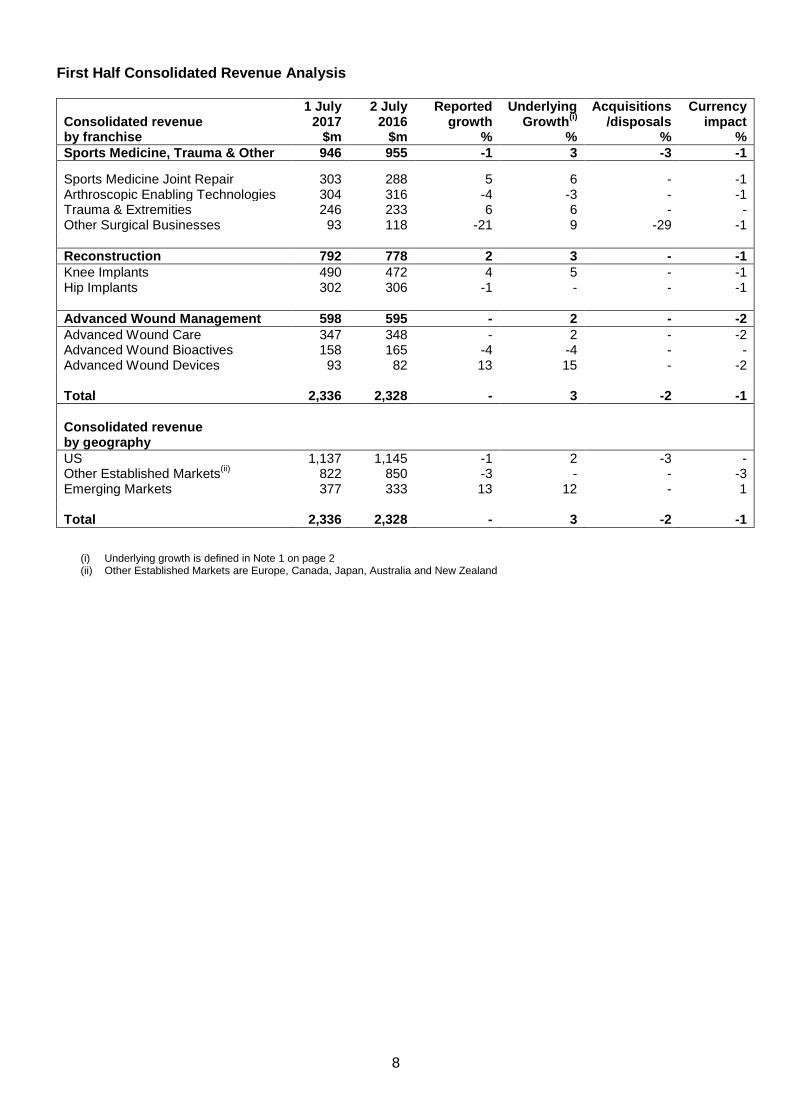
First Half Consolidated Revenue Analysis
Consolidated revenue by franchise
1 July 2017
$m
2 July 2016
$m
Reported growth
%
Underlying Growth(i)
%
Acquisitions /disposals
%
Currency impact
% Sports Medicine, Trauma & Other 946 955 -1 3 -3 -1
Sports Medicine Joint Repair 303 288 5 6 - -1 Arthroscopic Enabling Technologies 304 316 -4 -3 - -1 Trauma & Extremities 246 233 6 6 - - Other Surgical Businesses 93 118 -21 9 -29 -1 Reconstruction 792 778 2 3 - -1 Knee Implants 490 472 4 5 - -1 Hip Implants 302 306 -1 - - -1 Advanced Wound Management 598 595 - 2 - -2 Advanced Wound Care 347 348 - 2 - -2 Advanced Wound Bioactives 158 165 -4 -4 - - Advanced Wound Devices 93 82 13 15 - -2 Total 2,336 2,328 - 3 -2 -1 Consolidated revenue by geography US 1,137 1,145 -1 2 -3 - Other Established Markets(ii) 822 850 -3 - - -3 Emerging Markets 377 333 13 12 - 1 Total 2,336 2,328 - 3 -2 -1
(i) Underlying growth is defined in Note 1 on page 2 (ii) Other Established Markets are Europe, Canada, Japan, Australia and New Zealand
8
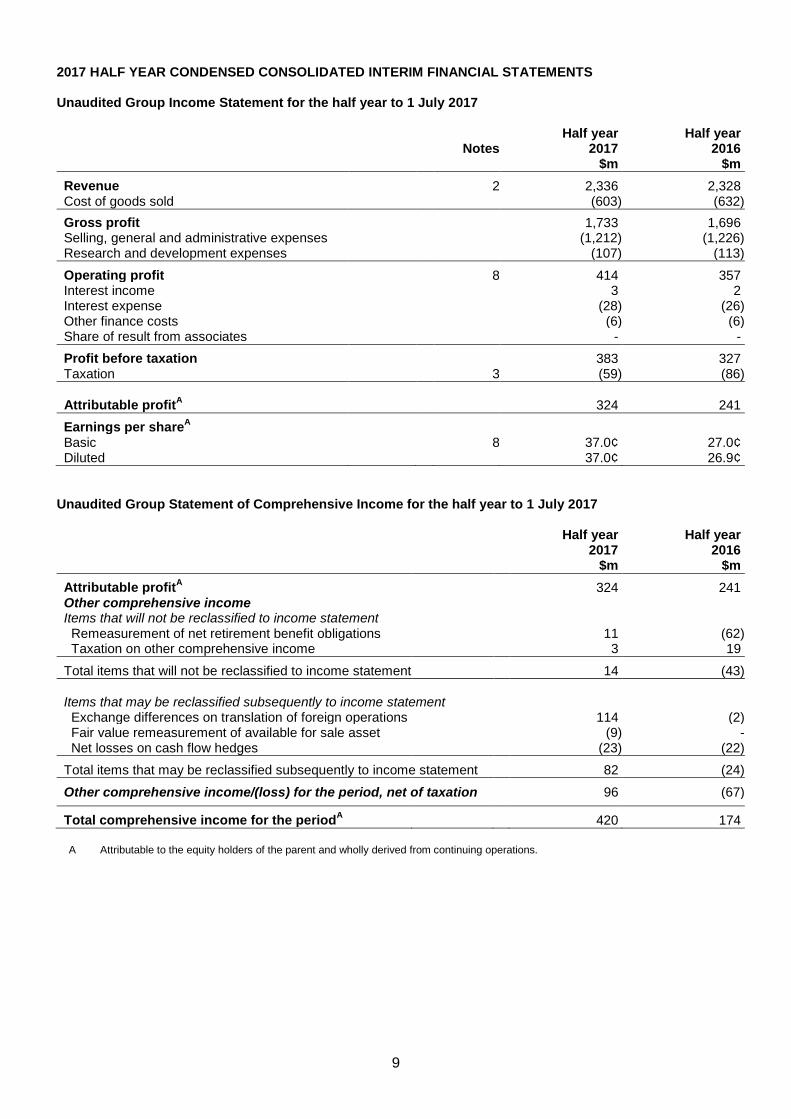
2017 HALF YEAR CONDENSED CONSOLIDATED INTERIM FINANCIAL STATEMENTS Unaudited Group Income Statement for the half year to 1 July 2017
Half year Half year Notes 2017 2016 $m $m
Revenue 2 2,336 2,328 Cost of goods sold (603) (632) Gross profit 1,733 1,696 Selling, general and administrative expenses (1,212) (1,226) Research and development expenses (107) (113)
Operating profit 8 414 357 Interest income 3 2 Interest expense (28) (26) Other finance costs (6) (6) Share of result from associates - -
Profit before taxation 383 327 Taxation 3 (59) (86) Attributable profitA 324 241
Earnings per shareA Basic 8 37.0¢ 27.0¢ Diluted 37.0¢ 26.9¢
Unaudited Group Statement of Comprehensive Income for the half year to 1 July 2017
Half year Half year 2017 2016 $m $m
Attributable profitA 324 241 Other comprehensive income Items that will not be reclassified to income statement Remeasurement of net retirement benefit obligations 11 (62) Taxation on other comprehensive income 3 19
Total items that will not be reclassified to income statement 14 (43) Items that may be reclassified subsequently to income statement Exchange differences on translation of foreign operations 114 (2) Fair value remeasurement of available for sale asset (9) - Net losses on cash flow hedges (23) (22)
Total items that may be reclassified subsequently to income statement 82 (24)
Other comprehensive income/(loss) for the period, net of taxation 96 (67)
Total comprehensive income for the periodA 420 174
A Attributable to the equity holders of the parent and wholly derived from continuing operations.
9
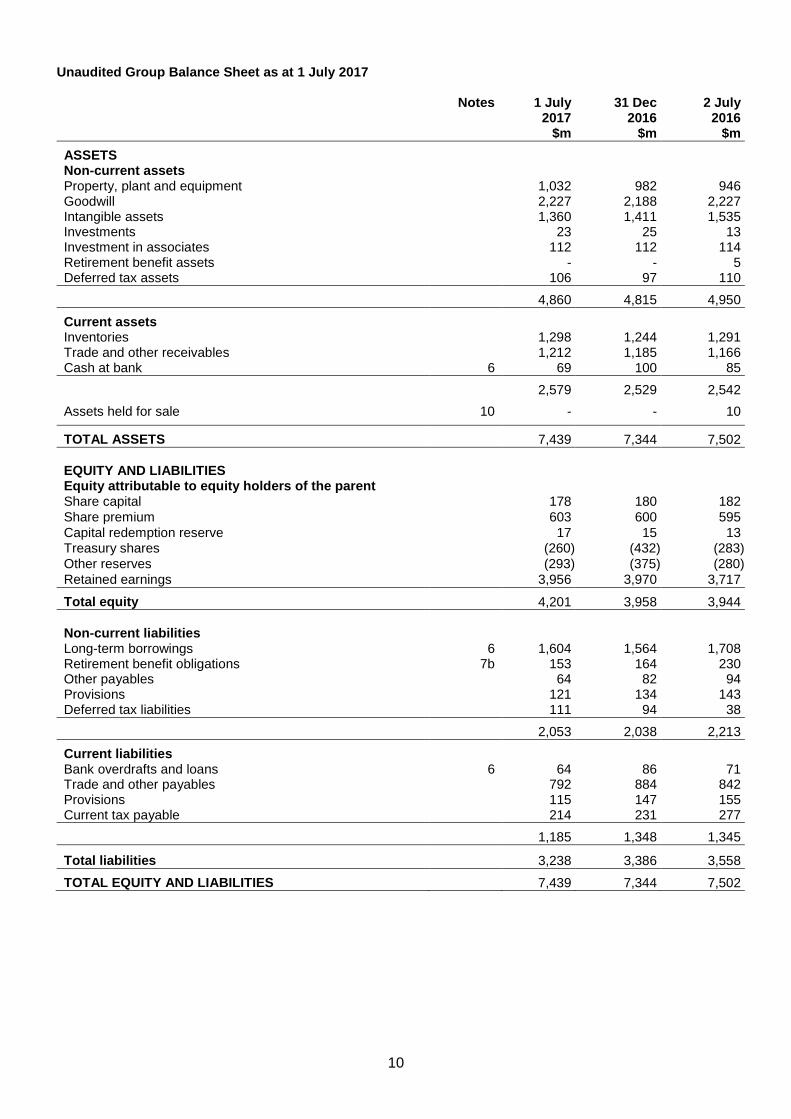
Unaudited Group Balance Sheet as at 1 July 2017
Notes 1 July 31 Dec 2 July
2017
$m 2016
$m 2016
$m
ASSETS Non-current assets Property, plant and equipment 1,032 982 946 Goodwill 2,227 2,188 2,227 Intangible assets 1,360 1,411 1,535 Investments 23 25 13 Investment in associates 112 112 114 Retirement benefit assets - - 5 Deferred tax assets 106 97 110
4,860 4,815 4,950
Current assets Inventories 1,298 1,244 1,291 Trade and other receivables 1,212 1,185 1,166 Cash at bank 6 69 100 85
2,579 2,529 2,542
Assets held for sale 10 - - 10
TOTAL ASSETS 7,439 7,344 7,502 EQUITY AND LIABILITIES Equity attributable to equity holders of the parent Share capital 178 180 182 Share premium 603 600 595 Capital redemption reserve 17 15 13 Treasury shares (260) (432) (283) Other reserves (293) (375) (280) Retained earnings 3,956 3,970 3,717
Total equity 4,201 3,958 3,944 Non-current liabilities Long-term borrowings 6 1,604 1,564 1,708 Retirement benefit obligations 7b 153 164 230 Other payables 64 82 94 Provisions 121 134 143 Deferred tax liabilities 111 94 38
2,053 2,038 2,213
Current liabilities Bank overdrafts and loans 6 64 86 71 Trade and other payables 792 884 842 Provisions 115 147 155 Current tax payable 214 231 277
1,185 1,348 1,345
Total liabilities 3,238 3,386 3,558
TOTAL EQUITY AND LIABILITIES 7,439 7,344 7,502
10
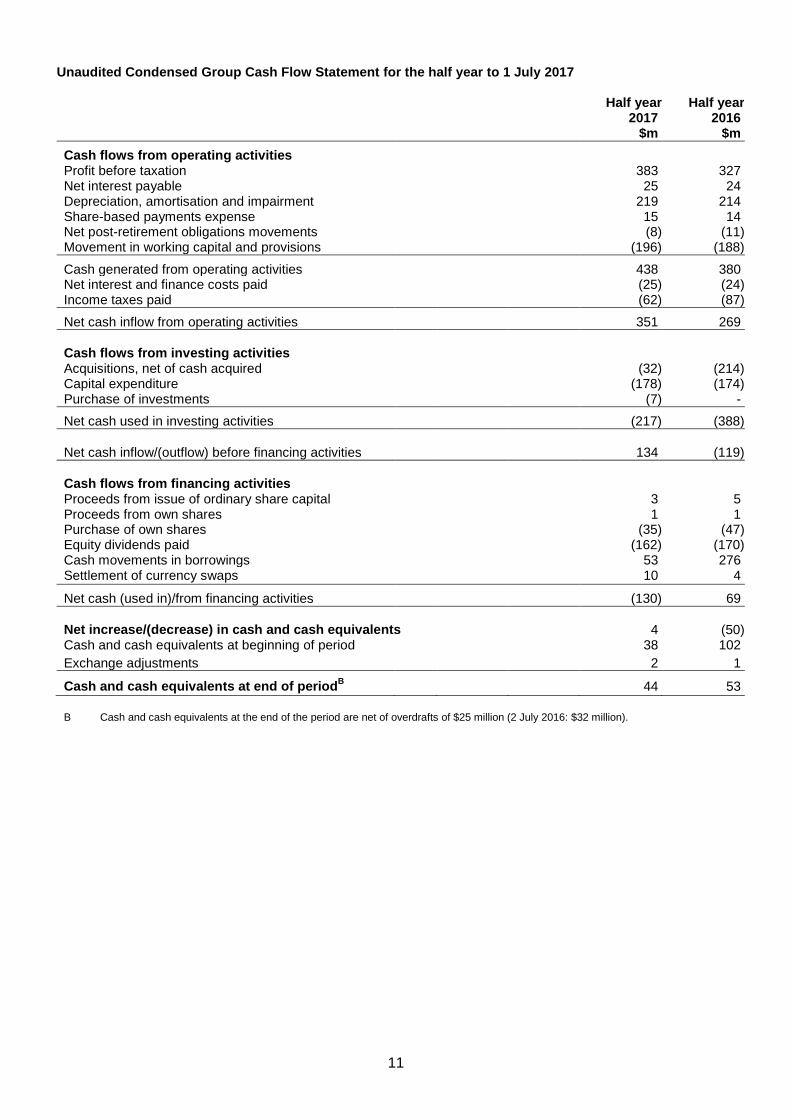
Unaudited Condensed Group Cash Flow Statement for the half year to 1 July 2017
Half year Half year 2017 2016 $m $m
Cash flows from operating activities Profit before taxation 383 327 Net interest payable 25 24 Depreciation, amortisation and impairment 219 214 Share-based payments expense 15 14 Net post-retirement obligations movements (8) (11) Movement in working capital and provisions (196) (188)
Cash generated from operating activities 438 380 Net interest and finance costs paid (25) (24) Income taxes paid (62) (87)
Net cash inflow from operating activities 351 269 Cash flows from investing activities Acquisitions, net of cash acquired (32) (214) Capital expenditure (178) (174) Purchase of investments (7) -
Net cash used in investing activities (217) (388) Net cash inflow/(outflow) before financing activities 134 (119) Cash flows from financing activities Proceeds from issue of ordinary share capital 3 5 Proceeds from own shares 1 1 Purchase of own shares (35) (47) Equity dividends paid (162) (170) Cash movements in borrowings 53 276 Settlement of currency swaps 10 4
Net cash (used in)/from financing activities (130) 69 Net increase/(decrease) in cash and cash equivalents 4 (50) Cash and cash equivalents at beginning of period 38 102 Exchange adjustments 2 1
Cash and cash equivalents at end of periodB 44 53
B Cash and cash equivalents at the end of the period are net of overdrafts of $25 million (2 July 2016: $32 million).
11
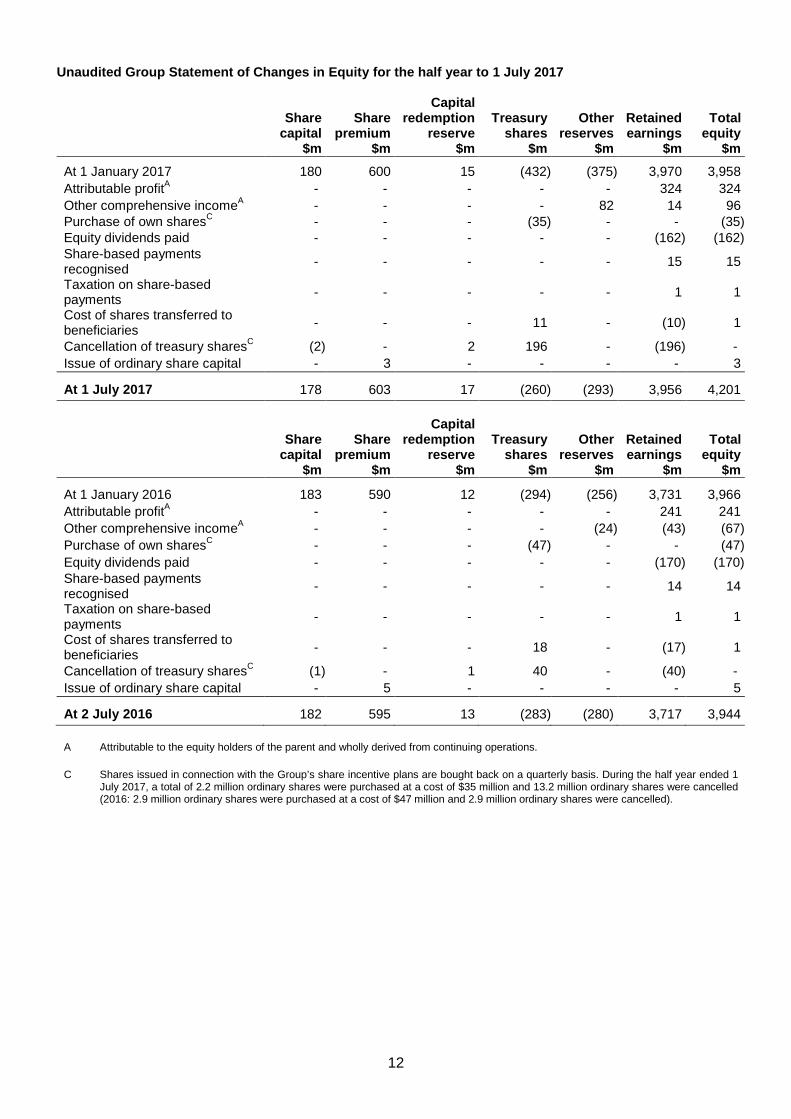
Unaudited Group Statement of Changes in Equity for the half year to 1 July 2017
Share Share
Capital redemption Treasury Other Retained Total
capital premium reserve shares reserves earnings equity $m $m $m $m $m $m $m
At 1 January 2017 180 600 15 (432) (375) 3,970 3,958 Attributable profitA - - - - - 324 324 Other comprehensive incomeA - - - - 82 14 96 Purchase of own sharesC - - - (35) - - (35) Equity dividends paid - - - - - (162) (162) Share-based payments recognised - - - - - 15 15
Taxation on share-based payments - - - - - 1 1
Cost of shares transferred to beneficiaries - - - 11 - (10) 1
Cancellation of treasury sharesC (2) - 2 196 - (196) - Issue of ordinary share capital - 3 - - - - 3
At 1 July 2017 178 603 17 (260) (293) 3,956 4,201
Share Share Capital
redemption Treasury Other Retained Total capital premium reserve shares reserves earnings equity $m $m $m $m $m $m $m
At 1 January 2016 183 590 12 (294) (256) 3,731 3,966 Attributable profitA - - - - - 241 241 Other comprehensive incomeA - - - - (24) (43) (67) Purchase of own sharesC - - - (47) - - (47) Equity dividends paid - - - - - (170) (170) Share-based payments recognised - - - - - 14 14
Taxation on share-based payments - - - - - 1 1
Cost of shares transferred to beneficiaries - - - 18 - (17) 1
Cancellation of treasury sharesC (1) - 1 40 - (40) - Issue of ordinary share capital - 5 - - - - 5
At 2 July 2016 182 595 13 (283) (280) 3,717 3,944
A Attributable to the equity holders of the parent and wholly derived from continuing operations.
C Shares issued in connection with the Group’s share incentive plans are bought back on a quarterly basis. During the half year ended 1 July 2017, a total of 2.2 million ordinary shares were purchased at a cost of $35 million and 13.2 million ordinary shares were cancelled (2016: 2.9 million ordinary shares were purchased at a cost of $47 million and 2.9 million ordinary shares were cancelled).
12
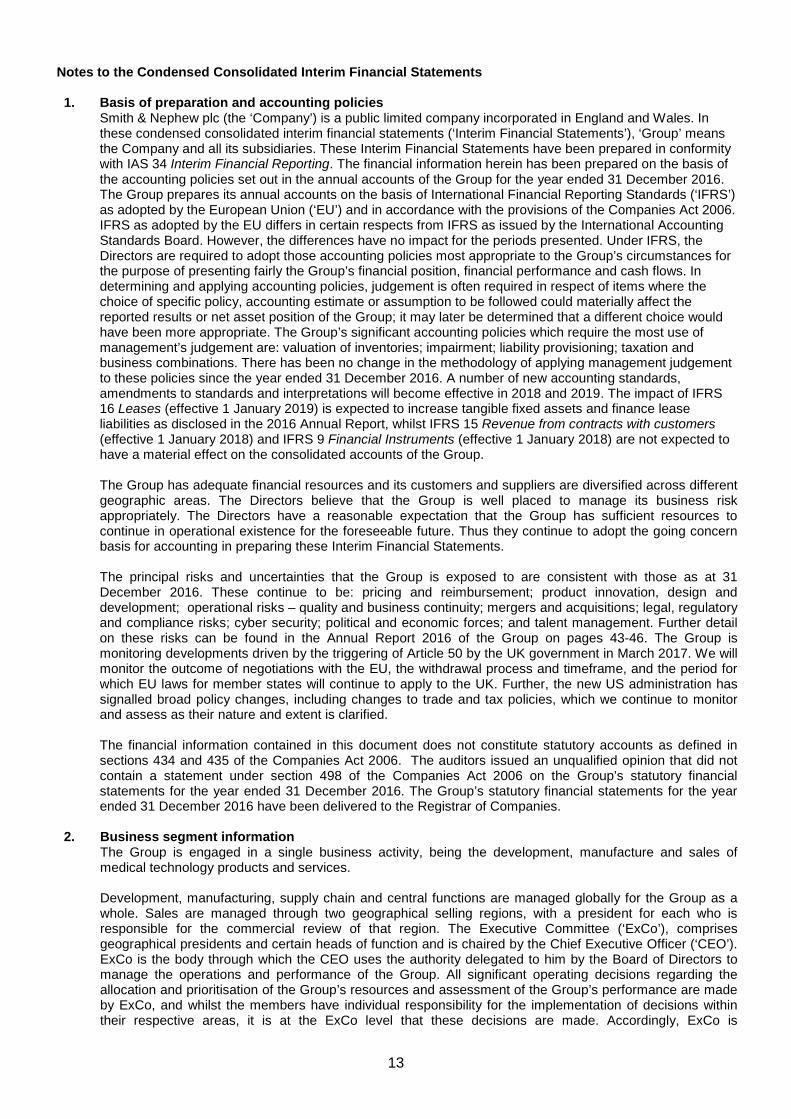
Notes to the Condensed Consolidated Interim Financial Statements 1. Basis of preparation and accounting policies Smith & Nephew plc (the ‘Company’) is a public limited company incorporated in England and Wales. In
these condensed consolidated interim financial statements (‘Interim Financial Statements’), ‘Group’ means the Company and all its subsidiaries. These Interim Financial Statements have been prepared in conformity with IAS 34 Interim Financial Reporting. The financial information herein has been prepared on the basis of the accounting policies set out in the annual accounts of the Group for the year ended 31 December 2016. The Group prepares its annual accounts on the basis of International Financial Reporting Standards (‘IFRS’) as adopted by the European Union (‘EU’) and in accordance with the provisions of the Companies Act 2006. IFRS as adopted by the EU differs in certain respects from IFRS as issued by the International Accounting Standards Board. However, the differences have no impact for the periods presented. Under IFRS, the Directors are required to adopt those accounting policies most appropriate to the Group’s circumstances for the purpose of presenting fairly the Group’s financial position, financial performance and cash flows. In determining and applying accounting policies, judgement is often required in respect of items where the choice of specific policy, accounting estimate or assumption to be followed could materially affect the reported results or net asset position of the Group; it may later be determined that a different choice would have been more appropriate. The Group’s significant accounting policies which require the most use of management’s judgement are: valuation of inventories; impairment; liability provisioning; taxation and business combinations. There has been no change in the methodology of applying management judgement to these policies since the year ended 31 December 2016. A number of new accounting standards, amendments to standards and interpretations will become effective in 2018 and 2019. The impact of IFRS 16 Leases (effective 1 January 2019) is expected to increase tangible fixed assets and finance lease liabilities as disclosed in the 2016 Annual Report, whilst IFRS 15 Revenue from contracts with customers (effective 1 January 2018) and IFRS 9 Financial Instruments (effective 1 January 2018) are not expected to have a material effect on the consolidated accounts of the Group.
The Group has adequate financial resources and its customers and suppliers are diversified across different geographic areas. The Directors believe that the Group is well placed to manage its business risk appropriately. The Directors have a reasonable expectation that the Group has sufficient resources to continue in operational existence for the foreseeable future. Thus they continue to adopt the going concern basis for accounting in preparing these Interim Financial Statements. The principal risks and uncertainties that the Group is exposed to are consistent with those as at 31 December 2016. These continue to be: pricing and reimbursement; product innovation, design and development; operational risks – quality and business continuity; mergers and acquisitions; legal, regulatory and compliance risks; cyber security; political and economic forces; and talent management. Further detail on these risks can be found in the Annual Report 2016 of the Group on pages 43-46. The Group is monitoring developments driven by the triggering of Article 50 by the UK government in March 2017. We will monitor the outcome of negotiations with the EU, the withdrawal process and timeframe, and the period for which EU laws for member states will continue to apply to the UK. Further, the new US administration has signalled broad policy changes, including changes to trade and tax policies, which we continue to monitor and assess as their nature and extent is clarified.
The financial information contained in this document does not constitute statutory accounts as defined in sections 434 and 435 of the Companies Act 2006. The auditors issued an unqualified opinion that did not contain a statement under section 498 of the Companies Act 2006 on the Group’s statutory financial statements for the year ended 31 December 2016. The Group’s statutory financial statements for the year ended 31 December 2016 have been delivered to the Registrar of Companies.
2. Business segment information The Group is engaged in a single business activity, being the development, manufacture and sales of
medical technology products and services. Development, manufacturing, supply chain and central functions are managed globally for the Group as a whole. Sales are managed through two geographical selling regions, with a president for each who is responsible for the commercial review of that region. The Executive Committee (‘ExCo’), comprises geographical presidents and certain heads of function and is chaired by the Chief Executive Officer (‘CEO’). ExCo is the body through which the CEO uses the authority delegated to him by the Board of Directors to manage the operations and performance of the Group. All significant operating decisions regarding the allocation and prioritisation of the Group’s resources and assessment of the Group’s performance are made by ExCo, and whilst the members have individual responsibility for the implementation of decisions within their respective areas, it is at the ExCo level that these decisions are made. Accordingly, ExCo is
13
considered to be the Group’s chief operating decision maker as defined by IFRS 8 Operating Segments. In making decisions about the prioritisation and allocation of the Group’s resources, ExCo reviews financial information on an integrated basis for the Group as a whole and determines the best allocation of resources to Group-wide projects. This information is prepared substantially on the same basis as the Group’s IFRS financial statements aside from the adjustments described in Note 8. In assessing performance, ExCo also considers financial information presented on a geographical selling region and product franchise basis for revenue. Financial information for corporate and functional costs is presented on a Group-wide basis. The results of the single segment are shown below.
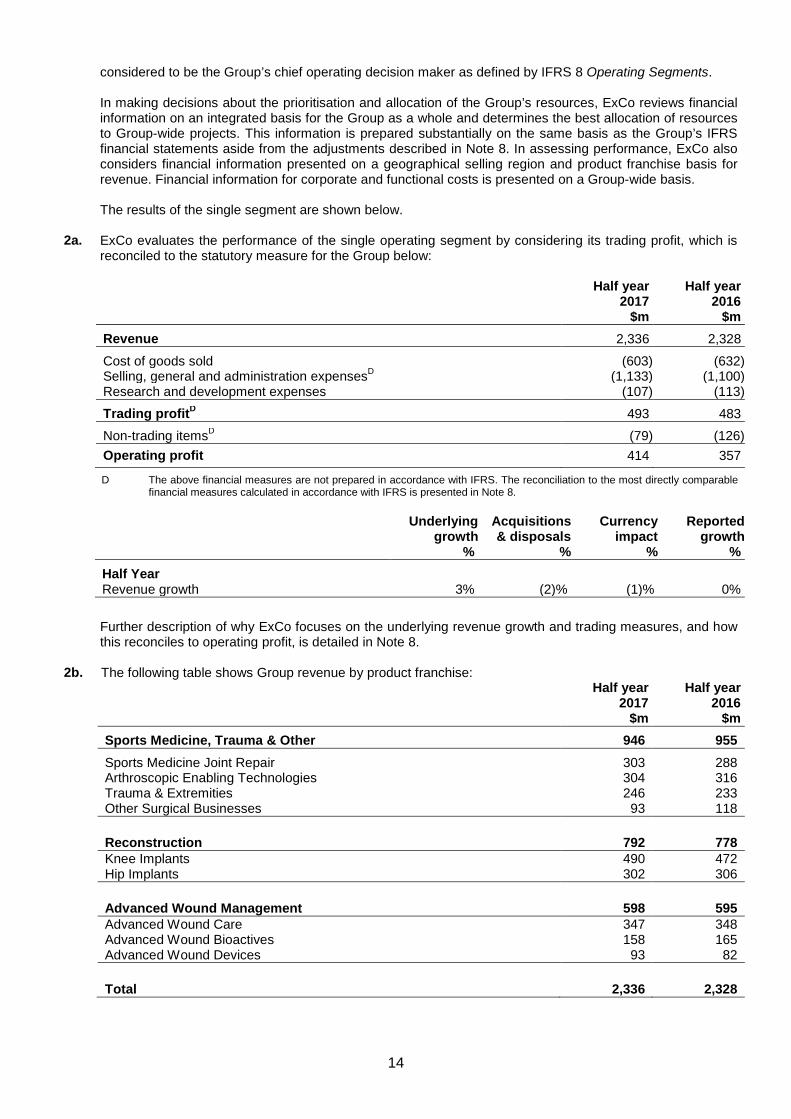
2a. ExCo evaluates the performance of the single operating segment by considering its trading profit, which is reconciled to the statutory measure for the Group below:
Half year Half year
2017 2016 $m $m
Revenue 2,336 2,328
Cost of goods sold (603) (632) Selling, general and administration expensesD (1,133) (1,100) Research and development expenses (107) (113)
Trading profitD 493 483
Non-trading itemsD (79) (126) Operating profit 414 357
D The above financial measures are not prepared in accordance with IFRS. The reconciliation to the most directly comparable financial measures calculated in accordance with IFRS is presented in Note 8.
Underlying Acquisitions Currency Reported growth & disposals impact growth % % % %
Half Year Revenue growth 3% (2)% (1)% 0%
Further description of why ExCo focuses on the underlying revenue growth and trading measures, and how
this reconciles to operating profit, is detailed in Note 8. 2b. The following table shows Group revenue by product franchise: Half year Half year 2017 2016
$m $m
Sports Medicine, Trauma & Other 946 955
Sports Medicine Joint Repair 303 288 Arthroscopic Enabling Technologies 304 316 Trauma & Extremities 246 233 Other Surgical Businesses 93 118 Reconstruction 792 778 Knee Implants 490 472 Hip Implants 302 306 Advanced Wound Management 598 595 Advanced Wound Care 347 348 Advanced Wound Bioactives 158 165 Advanced Wound Devices 93 82 Total 2,336 2,328
14
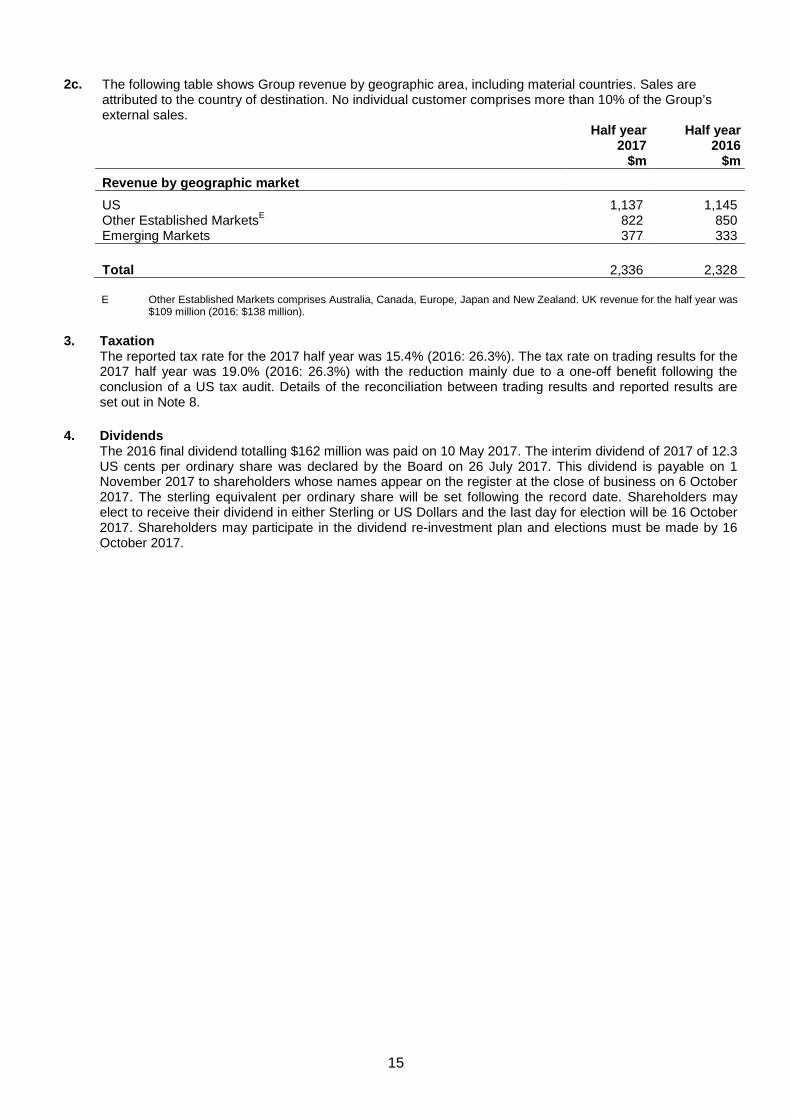
2c. The following table shows Group revenue by geographic area, including material countries. Sales are
attributed to the country of destination. No individual customer comprises more than 10% of the Group’s external sales.
Half year Half year 2017 2016 $m $m
Revenue by geographic market
US 1,137 1,145 Other Established MarketsE 822 850 Emerging Markets 377 333
Total 2,336 2,328
E Other Established Markets comprises Australia, Canada, Europe, Japan and New Zealand. UK revenue for the half year was
$109 million (2016: $138 million). 3. Taxation The reported tax rate for the 2017 half year was 15.4% (2016: 26.3%). The tax rate on trading results for the
2017 half year was 19.0% (2016: 26.3%) with the reduction mainly due to a one-off benefit following the conclusion of a US tax audit. Details of the reconciliation between trading results and reported results are set out in Note 8.
4. Dividends The 2016 final dividend totalling $162 million was paid on 10 May 2017. The interim dividend of 2017 of 12.3
US cents per ordinary share was declared by the Board on 26 July 2017. This dividend is payable on 1 November 2017 to shareholders whose names appear on the register at the close of business on 6 October 2017. The sterling equivalent per ordinary share will be set following the record date. Shareholders may elect to receive their dividend in either Sterling or US Dollars and the last day for election will be 16 October 2017. Shareholders may participate in the dividend re-investment plan and elections must be made by 16 October 2017.
15
5. Acquisitions
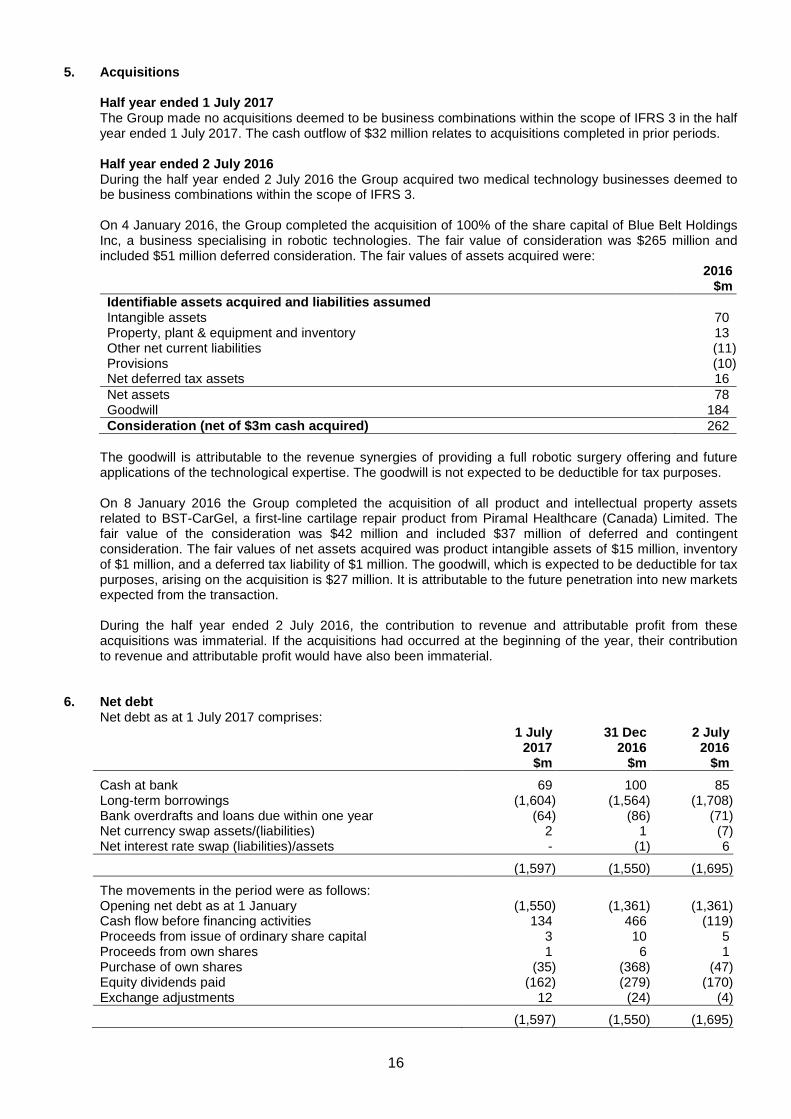
Half year ended 1 July 2017 The Group made no acquisitions deemed to be business combinations within the scope of IFRS 3 in the half year ended 1 July 2017. The cash outflow of $32 million relates to acquisitions completed in prior periods. Half year ended 2 July 2016 During the half year ended 2 July 2016 the Group acquired two medical technology businesses deemed to be business combinations within the scope of IFRS 3. On 4 January 2016, the Group completed the acquisition of 100% of the share capital of Blue Belt Holdings Inc, a business specialising in robotic technologies. The fair value of consideration was $265 million and included $51 million deferred consideration. The fair values of assets acquired were:
2016 $m
Identifiable assets acquired and liabilities assumed Intangible assets 70 Property, plant & equipment and inventory 13 Other net current liabilities (11) Provisions (10) Net deferred tax assets 16 Net assets 78 Goodwill 184 Consideration (net of $3m cash acquired) 262
The goodwill is attributable to the revenue synergies of providing a full robotic surgery offering and future applications of the technological expertise. The goodwill is not expected to be deductible for tax purposes. On 8 January 2016 the Group completed the acquisition of all product and intellectual property assets related to BST-CarGel, a first-line cartilage repair product from Piramal Healthcare (Canada) Limited. The fair value of the consideration was $42 million and included $37 million of deferred and contingent consideration. The fair values of net assets acquired was product intangible assets of $15 million, inventory of $1 million, and a deferred tax liability of $1 million. The goodwill, which is expected to be deductible for tax purposes, arising on the acquisition is $27 million. It is attributable to the future penetration into new markets expected from the transaction. During the half year ended 2 July 2016, the contribution to revenue and attributable profit from these acquisitions was immaterial. If the acquisitions had occurred at the beginning of the year, their contribution to revenue and attributable profit would have also been immaterial.
6. Net debt
Net debt as at 1 July 2017 comprises: 1 July 31 Dec 2 July 2017 2016 2016 $m $m $m
Cash at bank 69 100 85 Long-term borrowings (1,604) (1,564) (1,708) Bank overdrafts and loans due within one year (64) (86) (71) Net currency swap assets/(liabilities) 2 1 (7) Net interest rate swap (liabilities)/assets - (1) 6
(1,597) (1,550) (1,695)
The movements in the period were as follows: Opening net debt as at 1 January (1,550) (1,361) (1,361) Cash flow before financing activities 134 466 (119) Proceeds from issue of ordinary share capital 3 10 5 Proceeds from own shares 1 6 1 Purchase of own shares (35) (368) (47) Equity dividends paid (162) (279) (170) Exchange adjustments 12 (24) (4)
(1,597) (1,550) (1,695)
16
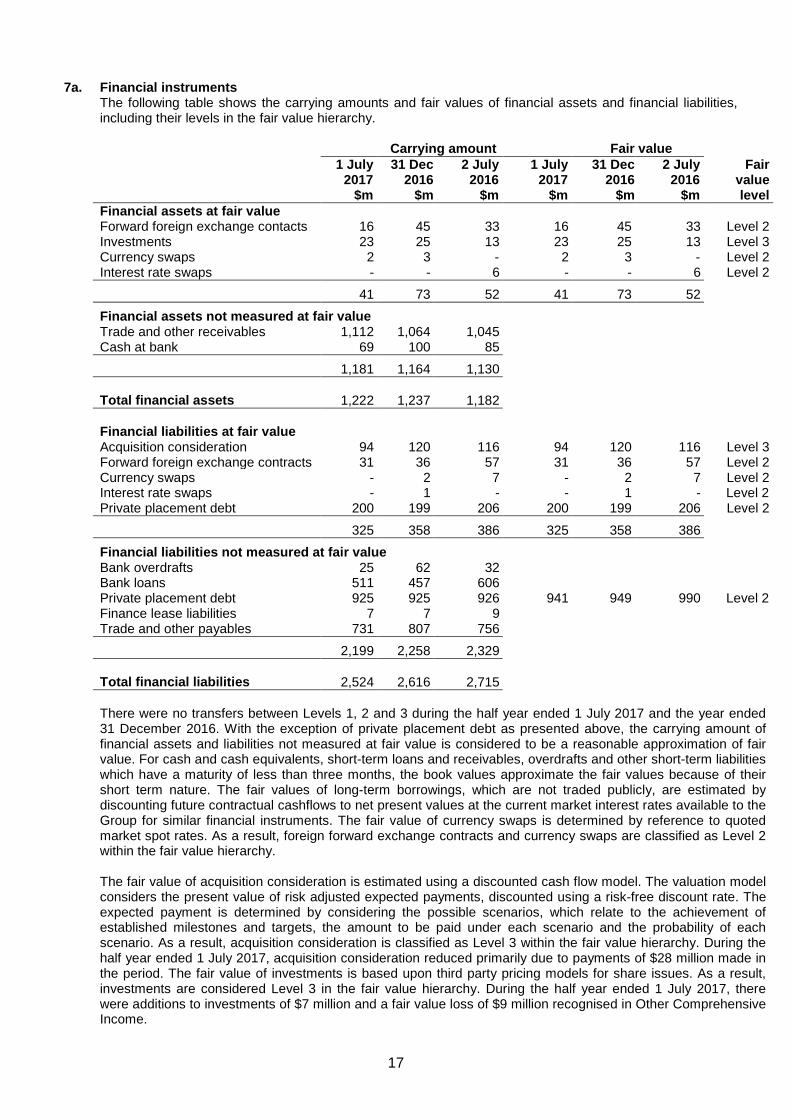
7a. Financial instruments The following table shows the carrying amounts and fair values of financial assets and financial liabilities,
including their levels in the fair value hierarchy.
Carrying amount Fair value 1 July 31 Dec 2 July 1 July 31 Dec 2 July Fair 2017 2016 2016 2017 2016 2016 value $m $m $m $m $m $m level Financial assets at fair value Forward foreign exchange contacts 16 45 33 16 45 33 Level 2 Investments 23 25 13 23 25 13 Level 3 Currency swaps 2 3 - 2 3 - Level 2 Interest rate swaps - - 6 - - 6 Level 2
41 73 52 41 73 52
Financial assets not measured at fair value Trade and other receivables 1,112 1,064 1,045 Cash at bank 69 100 85
1,181 1,164 1,130 Total financial assets 1,222 1,237 1,182 Financial liabilities at fair value Acquisition consideration 94 120 116 94 120 116 Level 3 Forward foreign exchange contracts 31 36 57 31 36 57 Level 2 Currency swaps - 2 7 - 2 7 Level 2 Interest rate swaps - 1 - - 1 - Level 2 Private placement debt 200 199 206 200 199 206 Level 2
325 358 386 325 358 386
Financial liabilities not measured at fair value Bank overdrafts 25 62 32 Bank loans 511 457 606 Private placement debt 925 925 926 941 949 990 Level 2 Finance lease liabilities 7 7 9 Trade and other payables 731 807 756
2,199 2,258 2,329 Total financial liabilities 2,524 2,616 2,715
There were no transfers between Levels 1, 2 and 3 during the half year ended 1 July 2017 and the year ended 31 December 2016. With the exception of private placement debt as presented above, the carrying amount of financial assets and liabilities not measured at fair value is considered to be a reasonable approximation of fair value. For cash and cash equivalents, short-term loans and receivables, overdrafts and other short-term liabilities which have a maturity of less than three months, the book values approximate the fair values because of their short term nature. The fair values of long-term borrowings, which are not traded publicly, are estimated by discounting future contractual cashflows to net present values at the current market interest rates available to the Group for similar financial instruments. The fair value of currency swaps is determined by reference to quoted market spot rates. As a result, foreign forward exchange contracts and currency swaps are classified as Level 2 within the fair value hierarchy.
The fair value of acquisition consideration is estimated using a discounted cash flow model. The valuation model considers the present value of risk adjusted expected payments, discounted using a risk-free discount rate. The expected payment is determined by considering the possible scenarios, which relate to the achievement of established milestones and targets, the amount to be paid under each scenario and the probability of each scenario. As a result, acquisition consideration is classified as Level 3 within the fair value hierarchy. During the half year ended 1 July 2017, acquisition consideration reduced primarily due to payments of $28 million made in the period. The fair value of investments is based upon third party pricing models for share issues. As a result, investments are considered Level 3 in the fair value hierarchy. During the half year ended 1 July 2017, there were additions to investments of $7 million and a fair value loss of $9 million recognised in Other Comprehensive Income.
17
7b. Retirement benefit obligations The discount rates applied to the future pension liabilities of the UK and US pension plans are based on the
yield on bonds that have a credit rating of AA denominated in the currency in which the benefits are expected to be paid with a maturity profile approximately the same as the obligations. These have decreased since 31 December 2016 by 10bps to 2.5% and 30bps to 3.7% respectively. This was more than offset by a decrease in inflation rates and favourable asset performances, led to a remeasurement gain of $11 million recognised in Other Comprehensive Income.
8. Definitions of and reconciliation to measures included within adjusted “trading” results These Interim Financial Statements include financial measures that are not prepared in accordance with IFRS. These measures, which include trading profit, trading profit margin, EPSA, trading cash flow and underlying growth, exclude the effect of certain cash and non-cash items that Group management believes are not related to the underlying performance of the Group. These non-IFRS financial measures are also used by management to make operating decisions because they facilitate internal comparisons of performance to historical results. Non-IFRS financial measures are presented in these Interim Financial Statements as the Group’s management believe that they provide investors with a means of evaluating performance of the business segment and the consolidated Group on a consistent basis, similar to the way in which the Group’s management evaluates performance, that is not otherwise apparent on an IFRS basis, given that certain non-recurring, infrequent or non-cash items that management does not otherwise believe are indicative of the underlying performance of the consolidated Group may not be excluded when preparing financial measures under IFRS. These non-IFRS measures should not be considered in isolation from, as substitutes for, or superior to financial measures prepared in accordance with IFRS. Underlying revenue growth Underlying revenue growth is used to compare the revenue in a given period to the previous period on a like-for-like basis. Underlying revenue growth reconciles to reported revenue growth (see Note 2), the most directly comparable financial measure calculated in accordance with IFRS, by making adjustments for the effect of acquisitions and disposals and the impact of movements in exchange rates (currency impact), as described below. The effect of acquisitions and disposals measures the impact on revenue from newly acquired material business combinations and recent material business disposals. This is calculated by comparing the current year, constant currency actual revenue (which include acquisitions and exclude disposals from the relevant date of completion) with prior year, constant currency actual revenue, adjusted to include the results of acquisitions and exclude disposals for the commensurate period in the prior year. Currency impact measures the increase/decrease in revenue resulting from currency movements on non-US Dollar sales and is measured as the difference between: 1) the increase/decrease in current year revenue translated into US Dollars at the current year average rate and the prior year revenue translated at the prior year average rate; and 2) the increase/decrease being measured by translating current and prior year revenue into US Dollars using the constant fixed rate. Trading profit, trading profit margin and trading cash flow Trading profit and trading cash flow are trend measures, which present the long-term profitability of the Group excluding the impact of specific transactions that management considers affect the Group’s short-term profitability and cash flows. The Group has identified the following items, where material, as those to be excluded from operating profit and cash generated from operations when arriving at trading profit and trading cash flow, respectively: acquisition and disposal related items arising in connection with business combinations, including amortisation of acquisition intangible assets, impairments and integration costs; restructuring events; gains and losses resulting from legal disputes and uninsured losses. In addition to these items, gains and losses that materially impact the Group’s profitability or cash flows on a short-term or one-off basis are excluded from operating profit and cash generated from operations when arriving at trading profit and trading cash flow, respectively. Underlying growth in trading profit and trading profit margin (trading profit expressed as a percentage of revenue) are measures, which present the growth trend in the long-term profitability of the Group. Underlying growth in trading profit is used to compare the period-on-period growth in trading profit on a like-for-like basis. This is achieved by adjusting for the impact of business combinations and disposals and for movements in exchange rates in the same manner as underlying revenue growth is determined, as described above.
18
Adjusted earnings per ordinary share (‘EPSA’) EPSA is a trend measure, which presents the long-term profitability of the Group excluding the post-tax impact of specific transactions that management considers affects the Group’s short-term profitability. The Group presents this measure to assist investors in their understanding of trends. Adjusted attributable profit is the numerator used for this measure and is determined by adjusting attributable profit for the items that are excluded from operating profit when arriving at trading profit and items that are recognised below operating profit that affect the Group’s short-term profitability. The most directly comparable financial measure calculated in accordance with IFRS is basic earnings per ordinary share (‘EPS’).
8. Definitions of and reconciliation to measures included within adjusted “trading” results (continued)
Revenue
$m
Operating profit1
$m
Profit before
tax2 $m
Taxation3 $m
Attributable profit4
$m
Cash generated
from operating activities5
$m
Earnings per share6
¢
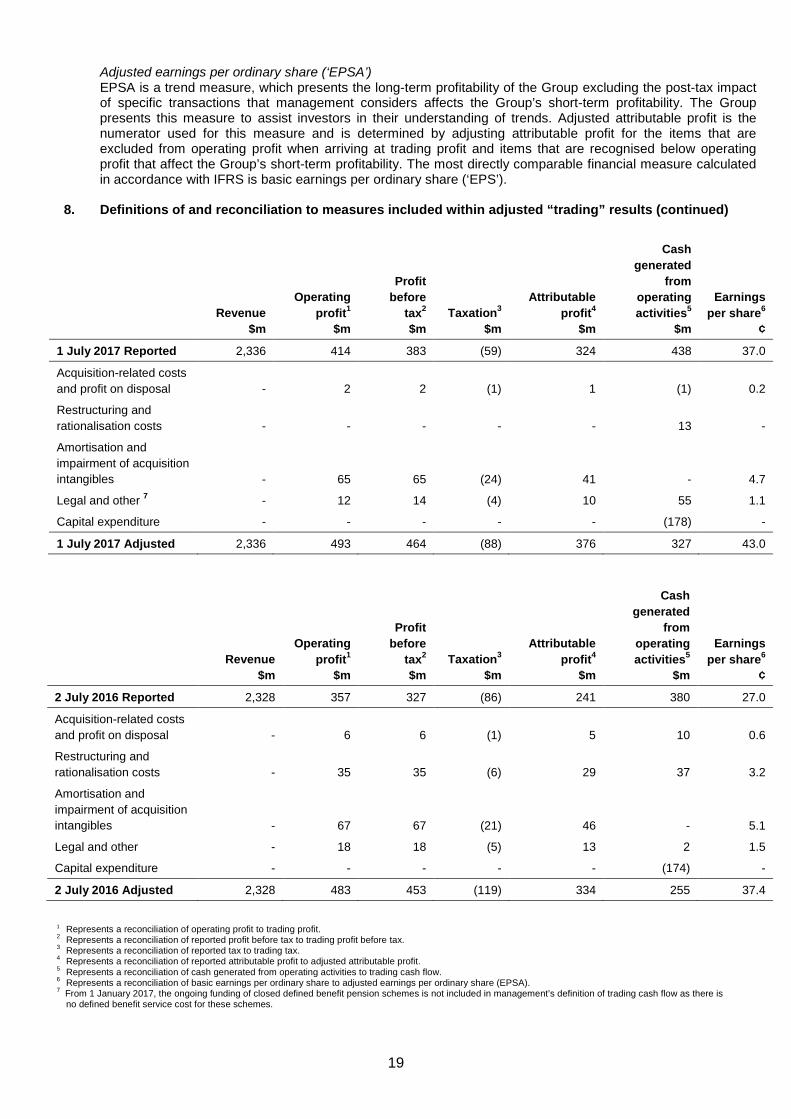
1 July 2017 Reported 2,336 414 383 (59) 324 438 37.0
Acquisition-related costs and profit on disposal - 2 2 (1) 1 (1) 0.2
Restructuring and rationalisation costs - - - - - 13 -
Amortisation and impairment of acquisition intangibles - 65 65 (24) 41 - 4.7
Legal and other 7 - 12 14 (4) 10 55 1.1
Capital expenditure - - - - - (178) -
1 July 2017 Adjusted 2,336 493 464 (88) 376 327 43.0
Revenue
$m
Operating profit1
$m
Profit before
tax2 $m
Taxation3 $m
Attributable profit4
$m
Cash generated
from operating activities5
$m
Earnings per share6
¢
2 July 2016 Reported 2,328 357 327 (86) 241 380 27.0
Acquisition-related costs and profit on disposal - 6 6 (1) 5 10 0.6
Restructuring and rationalisation costs - 35 35 (6) 29 37 3.2
Amortisation and impairment of acquisition intangibles - 67 67 (21) 46 - 5.1
Legal and other - 18 18 (5) 13 2 1.5
Capital expenditure - - - - - (174) -
2 July 2016 Adjusted 2,328 483 453 (119) 334 255 37.4 1 Represents a reconciliation of operating profit to trading profit. 2 Represents a reconciliation of reported profit before tax to trading profit before tax. 3 Represents a reconciliation of reported tax to trading tax. 4 Represents a reconciliation of reported attributable profit to adjusted attributable profit. 5 Represents a reconciliation of cash generated from operating activities to trading cash flow. 6 Represents a reconciliation of basic earnings per ordinary share to adjusted earnings per ordinary share (EPSA). 7 From 1 January 2017, the ongoing funding of closed defined benefit pension schemes is not included in management’s definition of trading cash flow as there is
no defined benefit service cost for these schemes.
19
Acquisition related costs and cash flows: For the half years to 1 July 2017 and 2 July 2016, these costs primarily relate to the costs associated with acquisitions completed in previous periods. Restructuring and rationalisation costs: For the half year to 2 July 2016, these costs relate to the implementation of the Group Optimisation plan that was announced in May 2014. Amortisation and impairment of acquisition intangibles: For both the half years to 1 July 2017 and 2 July 2016, charges relate to the amortisation of intangible assets acquired in material business combinations. Legal and other: For both the half years to 1 July 2017 and 2 July 2016, the charges relate primarily to legal expenses for patent litigation with Arthrex and ongoing metal-on-metal hip claims. For the half year to 1 July 2017 $12 million of cash funding to closed defined benefit pension schemes is excluded from trading cash flow following the closure of the UK scheme to future accrual in December 2016.
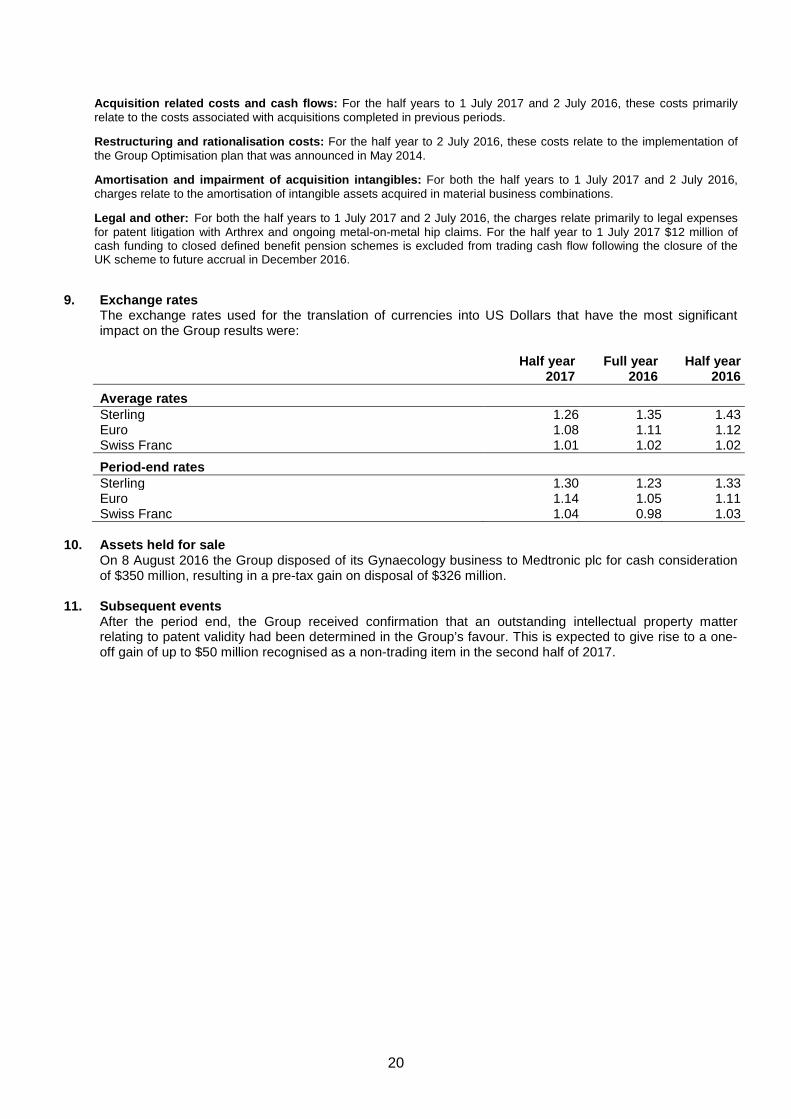
9. Exchange rates The exchange rates used for the translation of currencies into US Dollars that have the most significant
impact on the Group results were:
Half year Full year Half year 2017 2016 2016
Average rates Sterling 1.26 1.35 1.43 Euro 1.08 1.11 1.12 Swiss Franc 1.01 1.02 1.02
Period-end rates Sterling 1.30 1.23 1.33 Euro 1.14 1.05 1.11 Swiss Franc 1.04 0.98 1.03
10. Assets held for sale On 8 August 2016 the Group disposed of its Gynaecology business to Medtronic plc for cash consideration
of $350 million, resulting in a pre-tax gain on disposal of $326 million. 11. Subsequent events After the period end, the Group received confirmation that an outstanding intellectual property matter
relating to patent validity had been determined in the Group’s favour. This is expected to give rise to a one-off gain of up to $50 million recognised as a non-trading item in the second half of 2017.
20
Directors’ Responsibilities Statement The Directors confirm that to the best of their knowledge:
• this set of condensed consolidated Interim Financial Statements has been prepared in accordance
with IAS 34 as adopted by the European Union; and
• that the interim management report herein includes a fair review of the information required by:
a. DTR 4.2.7R of the Disclosure and Transparency Rules, being an indication of important events that have occurred during the first six months of the financial year and their impact on the condensed set of financial statements; and a description of the principal risks and uncertainties for the remaining six months of the year; and
b. DTR 4.2.8R of the Disclosure and Transparency Rules, being related party transactions that
have taken place in the first six months of the current financial year and that have materially affected the financial position or performance of the enterprise during that period, and any changes in the related party transactions described in the last annual report that could do so.
Apart from the resignation of Brian Larcombe with effect from 6 April 2017, the Board of Directors of Smith & Nephew plc are as listed in the Smith & Nephew plc 2016 Annual Report. By order of the Board:
Olivier Bohuon Chief Executive Officer 27 July 2017 Graham Baker Chief Financial Officer 27 July 2017
21
INDEPENDENT REVIEW REPORT TO SMITH AND NEPHEW PLC
Conclusion We have been engaged by the company to review the consolidated condensed set of financial statements in the interim financial report for the period ended 1 July 2017 which comprises Group Income Statement, Group Statement of Comprehensive Income, Group Balance Sheet, Condensed Group Cash Flow Statement, Group Statement of Changes in Equity and the related explanatory notes. Based on our review, nothing has come to our attention that causes us to believe that the consolidated condensed set of financial statements in the interim financial report for the period ended 1 July 2017 is not prepared, in all material respects, in accordance with IAS 34 Interim Financial Reporting as adopted by the EU and the Disclosure Guidance and Transparency Rules (“the DTR”) of the UK’s Financial Conduct Authority (“the UK FCA”). Scope of review We conducted our review in accordance with International Standard on Review Engagements (UK and Ireland) 2410 Review of Interim Financial Information Performed by the Independent Auditor of the Entity issued by the Auditing Practices Board for use in the UK. A review of interim financial information consists of making enquiries, primarily of persons responsible for financial and accounting matters, and applying analytical and other review procedures. We read the other information contained in the interim financial report and consider whether it contains any apparent misstatements or material inconsistencies with the information in the consolidated condensed set of financial statements. A review is substantially less in scope than an audit conducted in accordance with International Standards on Auditing (UK) and consequently does not enable us to obtain assurance that we would become aware of all significant matters that might be identified in an audit. Accordingly, we do not express an audit opinion. Directors’ responsibilities The interim financial report is the responsibility of, and has been approved by, the directors. The directors are responsible for preparing the interim financial report in accordance with the DTR of the UK FCA. As disclosed in note 1, the annual financial statements of the Group are prepared in accordance with International Financial Reporting Standards as adopted by the EU. The directors are responsible for preparing the consolidated condensed set of financial statements included in the interim financial report in accordance with IAS 34 as adopted by the EU. Our responsibility Our responsibility is to express to the company a conclusion on the consolidated condensed set of financial statements in the half-yearly financial report based on our review. The purpose of our review work and to whom we owe our responsibilities This report is made solely to the company in accordance with the terms of our engagement to assist the company in meeting the requirements of the DTR of the UK FCA. Our review has been undertaken so that we might state to the company those matters we are required to state to it in this report and for no other purpose. To the fullest extent permitted by law, we do not accept or assume responsibility to anyone other than the company for our review work, for this report, or for the conclusions we have reached. Stephen Oxley for and on behalf of KPMG LLP Chartered Accountants 15 Canada Square London E14 5GL 27 July 2017
22