Embed Size (px)
Citation preview

Smith & NephewFull Year 2018 Results

Forward looking statements and non-IFRS measures
This document may contain forward-looking statements that may or may not prove accurate. For example, statements regarding expected revenue growth andtrading margins, market trends and our product pipeline are forward-looking statements. Phrases such as "aim", "plan", "intend", "anticipate", "well-placed","believe", "estimate", "expect", "target", "consider" and similar expressions are generally intended to identify forward-looking statements. Forward-lookingstatements involve known and unknown risks, uncertainties and other important factors that could cause actual results to differ materially from what isexpressed or implied by the statements. For Smith & Nephew, these factors include: economic and financial conditions in the markets we serve, especially thoseaffecting health care providers, payers and customers; price levels for established and innovative medical devices; developments in medical technology;regulatory approvals, reimbursement decisions or other government actions; product defects or recalls or other problems with quality management systems orfailure to comply with related regulations; litigation relating to patent or other claims; legal compliance risks and related investigative, remedial or enforcementactions; disruption to our supply chain or operations or those of our suppliers; competition for qualified personnel; strategic actions, including acquisitions anddispositions, our success in performing due diligence, valuing and integrating acquired businesses; disruption that may result from transactions or otherchanges we make in our business plans or organisation to adapt to market developments; and numerous other matters that affect us or our markets, includingthose of a political, economic, business, competitive or reputational nature. Please refer to the documents that Smith & Nephew has filed with the U.S. Securitiesand Exchange Commission under the U.S. Securities Exchange Act of 1934, as amended, including Smith & Nephew's most recent annual report on Form 20-F,for a discussion of certain of these factors. Any forward-looking statement is based on information available to Smith & Nephew as of the date of the statement.All written or oral forward-looking statements attributable to Smith & Nephew are qualified by this caution. Smith & Nephew does not undertake any obligation toupdate or revise any forward-looking statement to reflect any change in circumstances or in Smith & Nephew's expectations.
Certain items included in ‘trading results’, such as trading profit, trading profit margin, tax rate on trading results, trading cash flow, trading profit to cashconversion ratio, EPSA and underlying growth are non-IFRS financial measures. The non-IFRS financial measures in this announcement are explained andreconciled to the most directly comparable financial measure prepared in accordance with IFRS in our Fourth Quarter and Full Year 2018 Results announcementdated 7 February 2019.
2

Namal NawanaChief Executive Officer
3

Full Year 2018 – 3% reported revenue growth, 2% underlying
Full Year
2018$m
2017$m
Revenue 4,904 4,765
Trading profit 1,123 1,048
Trading profit margin 22.9% 22.0%
Trading cash flow 951 940
IFRS Operating profit 863 934
IFRS Operating profit margin 17.6% 19.6%
EPS 76.0¢ 87.8¢
EPSA 100.9¢ 94.5¢
4
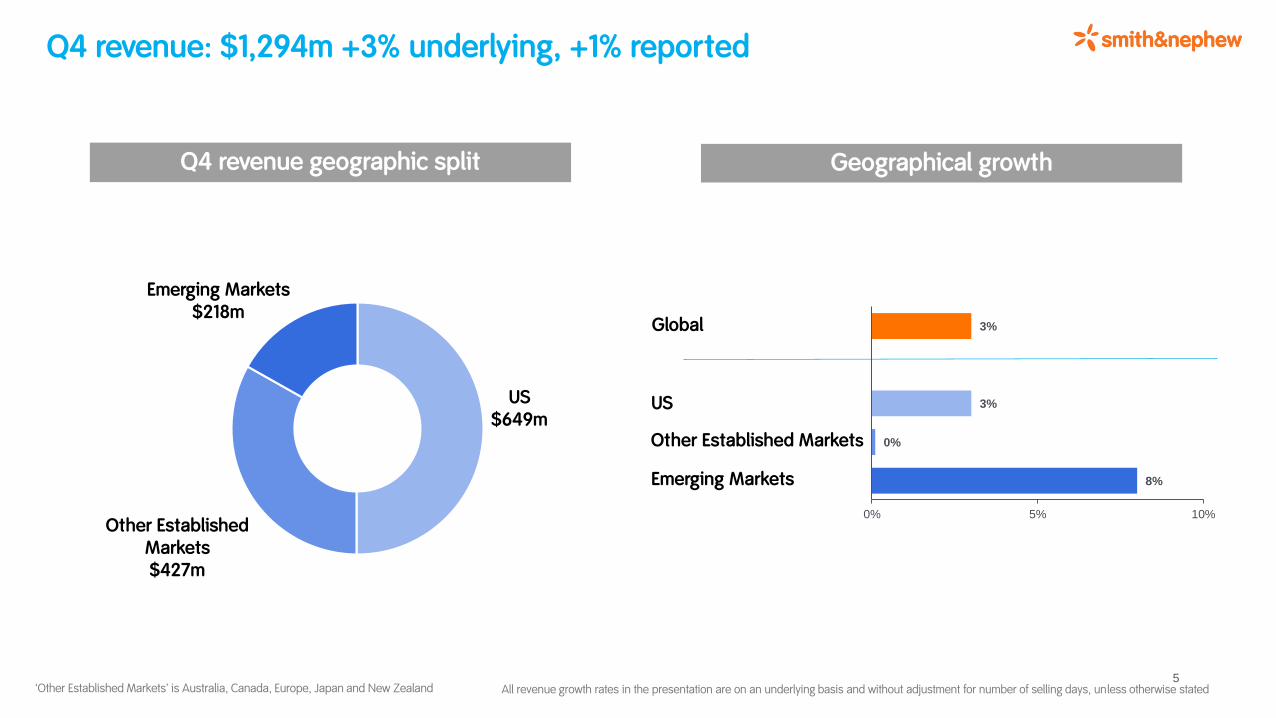
Q4 revenue: $1,294m +3% underlying, +1% reported
All revenue growth rates in the presentation are on an underlying basis and without adjustment for number of selling days, unless otherwise stated
Global
US
Other Established Markets
Emerging Markets
Q4 revenue geographic split Geographical growth
US$649m
Other Established Markets $427m
Emerging Markets$218m
‘Other Established Markets’ is Australia, Canada, Europe, Japan and New Zealand
8%
0%
3%
3%
0% 5% 10%
5

Reconstruction: $429m, +3% underlying
Q4 revenue performance• Knees: global +3%, US +1%, OUS +5%
• Hips: global +4%, US +3%, OUS +5%
Commentary• US knees market slightly slower in Q4
• Strong hips momentum maintained from Q3
Hips $160m
Q4 revenue split
REDAPT™ acetabular cup
Knees $269m
6

Sports Medicine & Trauma: $528m, +3% underlying
Q4 revenue performance• Sports Medicine Joint Repair +9%
• Arthroscopic Enabling Technologies -4%
• Trauma & Extremities +1%
• Other Surgical Businesses* +11%
Commentary• REGENETEN™ accelerated further in Q4, US sales force now
fully trained on product
• Legacy RF remains under pressure
• EVOS™ Small rollout continuing
• Strong quarter of NAVIO™ capital sales
REGENETEN™ Bioinductive Implant
SMJR $188m
AET $157m
T&E $127m
OSB $56m
Q4 revenue split
* ‘Other Surgical Businesses’ includes ENT, other recon, and robotics sales (excluding implant sales)7

Advanced Wound Management: $337m, +2% underlying
Q4 revenue performance• Advanced Wound Care +2%
• Advanced Wound Bioactives -3%
• Advanced Wound Devices +14%
Commentary• Double digit growth for AWC in US
• REGRANEX™ to be relaunched in 2019
• AWD acceleration continued, strongest quarter of 2018
PICO™ 7YSingle Use Negative
Pressure Wound Therapy System
AWC $185m
AWB $94m
AWD $58m
Q4 revenue split
8

1 32
Grow
5
Effectively
4
Together
Achieve the full potential of our
portfolio
Transform the business through
enabling technologies
Expand in high-growth segments
Strengthen talent and capabilities
Become the best owner
Strategic imperatives for the company
9

1 32
Grow
5
Effectively
4
Together
Achieve the full potential of our
portfolio
Transform the business through
enabling technologies
Expand in high-growth segments
Strengthen talent and capabilities
Become the best owner
Strategic imperatives for the company
10

Commercial presidents now appointed
Skip KiilPresident,
Orthopaedics
Brad CannonPresident,
Sports Medicine & ENT
Simon FraserPresident, Advanced Wound Management
Max ColellaPresident,
EMEA
11
Rodrigo BianchiPresident,
APAC

Graham BakerChief Financial Officer
12
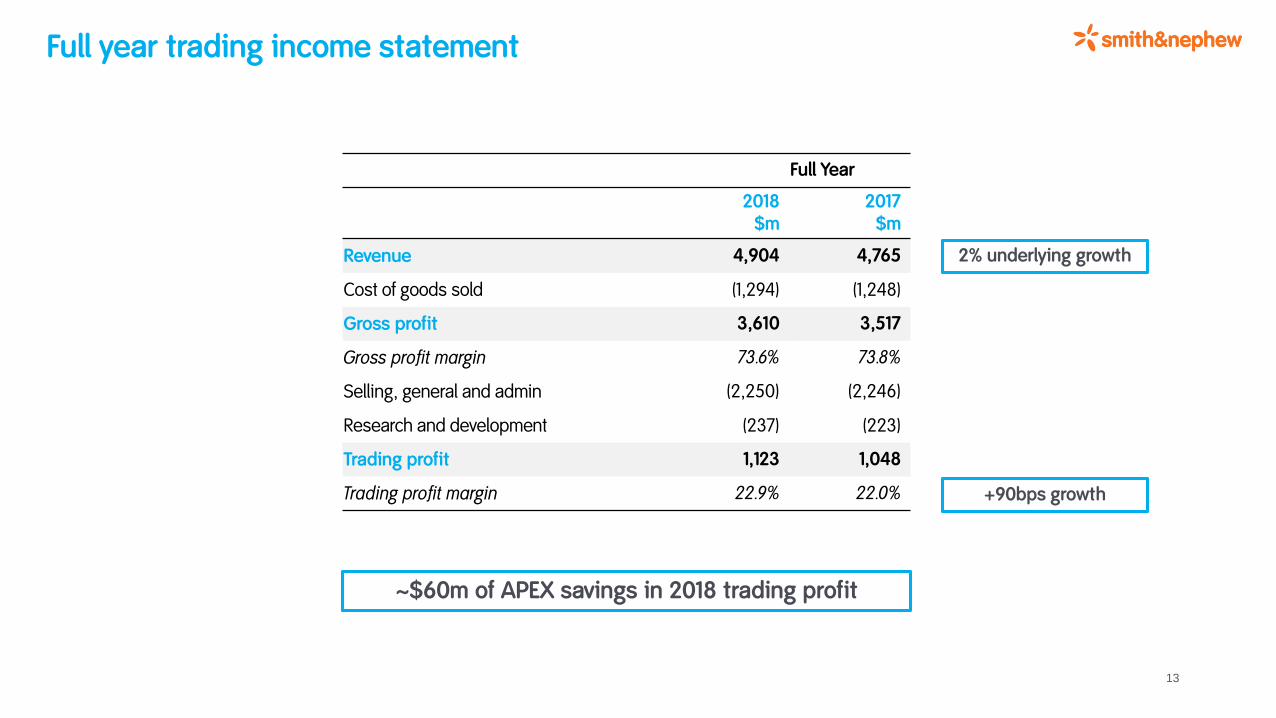
Full year trading income statement
13
Full Year
2018$m
2017$m
Revenue 4,904 4,765
Cost of goods sold (1,294) (1,248)
Gross profit 3,610 3,517
Gross profit margin 73.6% 73.8%
Selling, general and admin (2,250) (2,246)
Research and development (237) (223)
Trading profit 1,123 1,048
Trading profit margin 22.9% 22.0%
2% underlying growth
+90bps growth
~$60m of APEX savings in 2018 trading profit
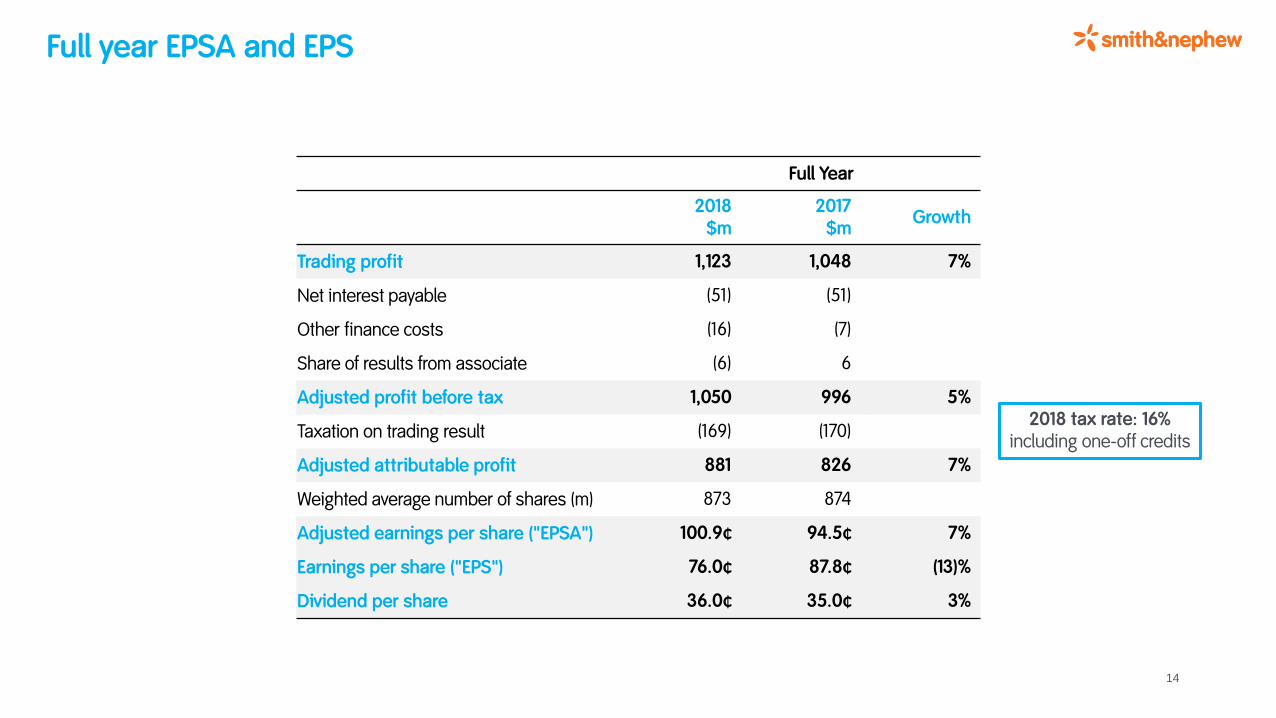
Full year EPSA and EPS
14
Full Year
2018$m
2017$m
Growth
Trading profit 1,123 1,048 7%
Net interest payable (51) (51)
Other finance costs (16) (7)
Share of results from associate (6) 6
Adjusted profit before tax 1,050 996 5%
Taxation on trading result (169) (170)
Adjusted attributable profit 881 826 7%
Weighted average number of shares (m) 873 874
Adjusted earnings per share ("EPSA") 100.9¢ 94.5¢ 7%
Earnings per share ("EPS") 76.0¢ 87.8¢ (13)%
Dividend per share 36.0¢ 35.0¢ 3%
2018 tax rate: 16% including one-off credits

Full year cash flow
15
Full Year
2018$m
2017$m
Trading profit 1,123 1,048
Share based payment 35 31
Depreciation and amortisation 335 320
Capital expenditure (347) (376)
Movements in working capital and other (195) (83)
Trading cash flow 951 940
Trading cash conversion 85% 90%
Restructuring, acquisition, legal & other (190) (43)
Net interest paid (52) (48)
Taxation paid (125) (135)
Free cash flow 584 714

Net debt and capital allocation
16
1,2811,104347
32129 57
931
0
200
400
600
800
1,000
1,200
1,400
Net Debt
at 31 Dec 17
Free cash flow
pre capex
Capex Dividends Acquisitions Other Net Debt
at 31 Dec 18
$m
1Reinvest fororganic growth
2 3Return excessto shareholders
Progressive dividend policy
Acquisitions inline with strategy
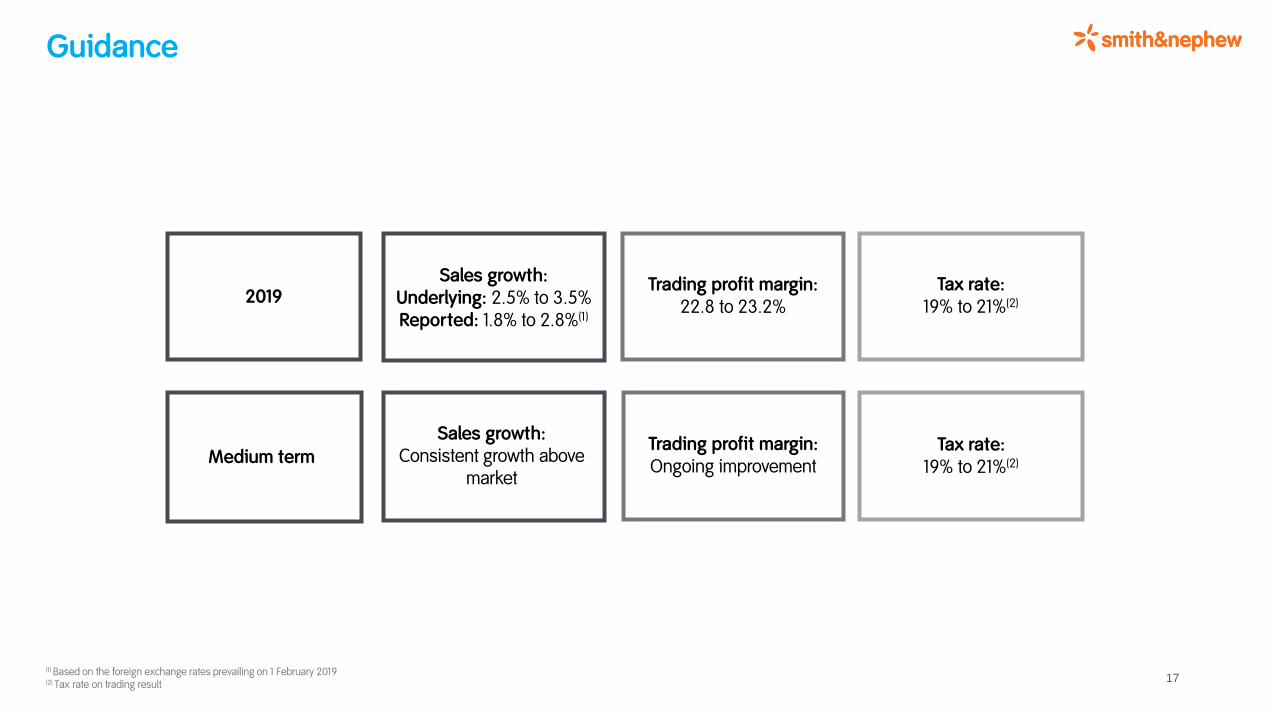
Guidance
17
Sales growth:Underlying: 2.5% to 3.5%Reported: 1.8% to 2.8%(1)
Tax rate:19% to 21%(2)
Trading profit margin:22.8 to 23.2%
2019
Medium termTrading profit margin:Ongoing improvement
Tax rate:19% to 21%(2)
Sales growth:Consistent growth above
market
(1) Based on the foreign exchange rates prevailing on 1 February 2019(2) Tax rate on trading result

Summary

19
Appendices

Technical guidance
20
Guidance February 2019
Foreign exchange and other revenue impact
Impact of translational FX on revenue(1) -0.8%
Acquisition impact on revenue +0.1%
Non-trading items
Restructuring costs c. $100-120m
Acquisition and integration costs c. $5m
European Medical Device Regulation (MDR) compliance costs c. $60m
Other
Amortisation of acquisition intangibles c. $110m
Income from associates c. $5m
Net interest $45m - $50m
Other finance costs c. $15m
Tax rate on trading result 19%-21%
(1) Based on the foreign exchange rates prevailing on 1 February 2019

Full Year IFRS reconciliation
21
Full Year
2018$m
2017$m
Growth
Trading profit 1,123 1,048 7%
Trading margin 22.9% 22.0% +90bps
Acquisition and disposal related items 7 10
Restructuring and rationalisation (120) -
Amortisation of acquisition intangibles (113) (140)
Legal and other items (34) 16
IFRS Operating profit 863 934 (8)%
Operating margin 17.6% 19.6% (200)bps

Franchise revenue analysis
22
2017 2018
Q1 Q2 Q3 Q4FullYear
Q1 Q2 Q3 Q4FullYear
Growth Growth Growth Growth Growth Growth Growth Growth Growth Revenue Growth
% % % % % % % % % $m %
Sports Medicine, Trauma & OSB 4 3 2 2 3 1 2 4 3 1,999 2
Sports Medicine Joint Repair 7 5 8 6 6 6 8 8 9 697 8
Arthroscopic Enabling Technologies (1) (4) (3) (3) (3) (5) (1) (2) (4) 600 (3)
Trauma & Extremities 5 7 (2) 5 4 (2) (5) 3 1 493 (1)
Other Surgical Businesses 7 11 6 4 7 9 8 12 11 209 10
Reconstruction 3 2 4 4 3 0 3 4 3 1,630 3
Knee Implants 5 4 6 6 5 2 3 4 3 1,017 3
Hip Implants 0 (1) 1 1 0 (2) 1 4 4 613 2
Advanced Wound Management 1 3 2 0 2 (2) 1 1 2 1,275 0
Advanced Wound Care 1 2 (1) (3) 0 0 2 1 2 740 1
Advanced Wound Bioactives (8) 0 7 0 0 (12) (6) (7) (3) 320 (6)
Advanced Wound Devices 16 14 8 14 13 2 9 11 14 215 9
Group 3 3 3 2 3 0 2 3 3 4,904 2
All revenue growth rates are on an underlying basis and without adjustment for number of selling days

Regional revenue analysis
23
2017 2018
Q1 Q2 Q3 Q4FullYear
Q1 Q2 Q3 Q4FullYear
Growth Growth Growth Growth Growth Growth Growth Growth Growth Revenue Growth
% % % % % % % % % $m %
Geographic regions
US 1 2 2 1 2 (2) 1 4 3 2,354 1
Other Established Markets 1 (1) 0 (1) 0 (2) 1 (1) 0 1,693 0
Established Markets 1 1 1 0 1 (2) 1 2 2 4,047 1
Emerging Markets 12 13 9 14 12 9 6 10 8 857 8
Group 3 3 3 2 3 0 2 3 3 4,904 2
Other Established Markets’ is Australia, Canada, Europe, Japan and New Zealand. All revenue growth rates are on an underlying basis and without adjustment for number of selling days

Trading days per quarter
24
Q1 Q2 Q3 Q4 Full Year
2017 64 63 63 60 250
2018 63 64 63 61 251
2019 63 63 63 62 251
Year-on-year differences in the number of trading days typically impacts our surgical businesses in the Established Markets more than our wholesaler and distributor-supported businesses. We define trading days as weekdays adjusted for significant holidays in our principal countries.