Embed Size (px)
Citation preview

Smart Tool Suite
Documentation
Users Manual
Version 1.0
1
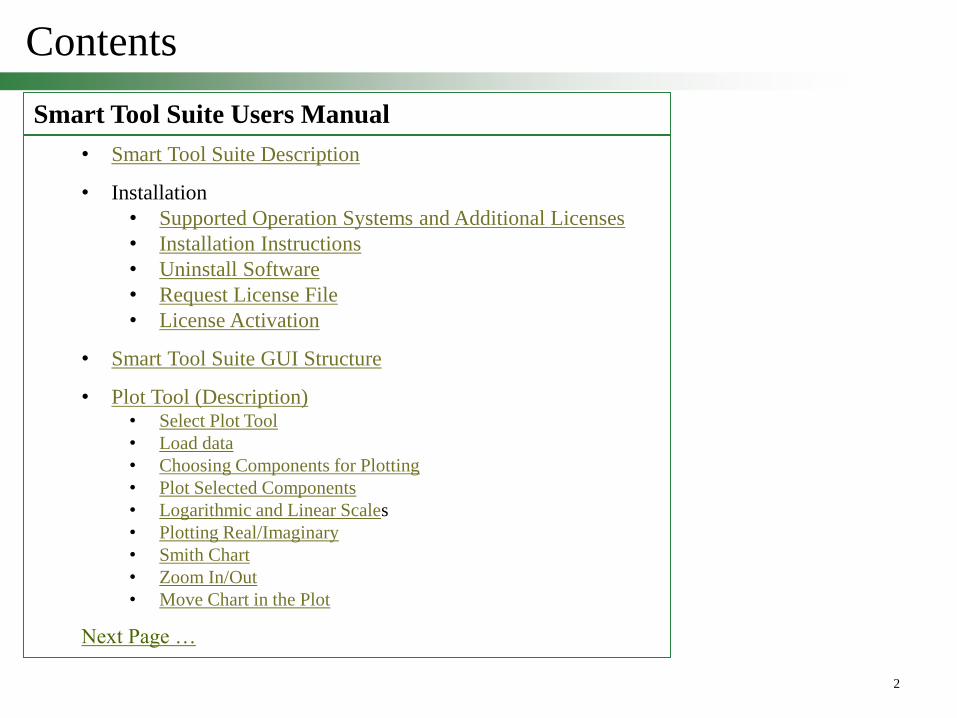
Contents
Smart Tool Suite Users Manual
• Smart Tool Suite Description
• Installation
• Supported Operation Systems and Additional Licenses
• Installation Instructions
• Uninstall Software
• Request License File
• License Activation
• Smart Tool Suite GUI Structure
• Plot Tool (Description) • Select Plot Tool
• Load data
• Choosing Components for Plotting
• Plot Selected Components
• Logarithmic and Linear Scales
• Plotting Real/Imaginary
• Smith Chart
• Zoom In/Out
• Move Chart in the Plot
Next Page …
2
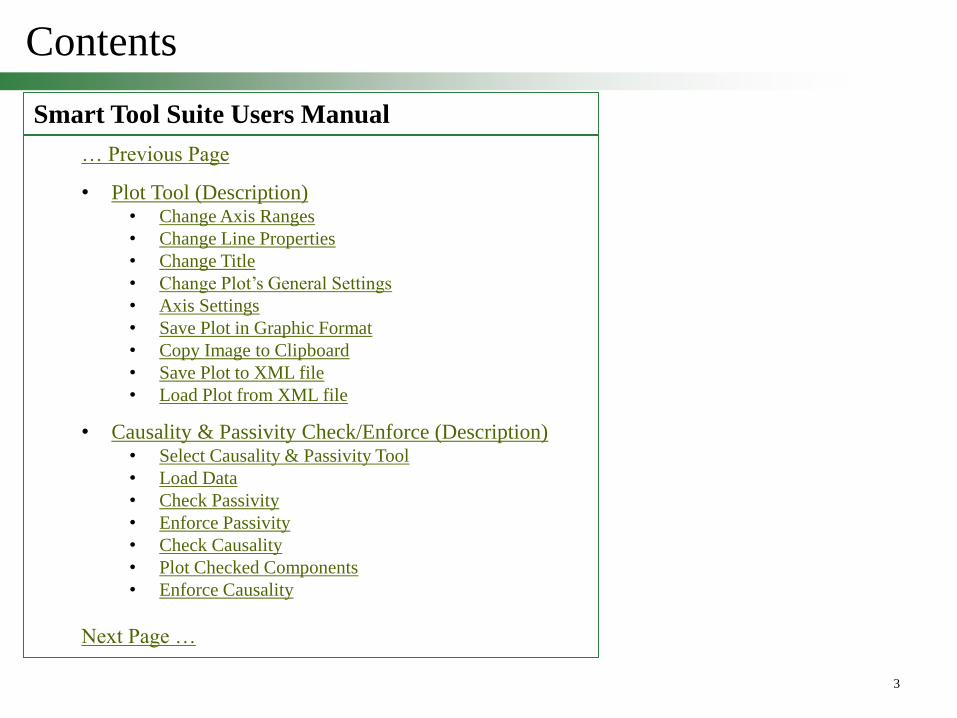
Contents
Smart Tool Suite Users Manual
… Previous Page
• Plot Tool (Description) • Change Axis Ranges
• Change Line Properties
• Change Title
• Change Plot’s General Settings
• Axis Settings
• Save Plot in Graphic Format
• Copy Image to Clipboard
• Save Plot to XML file
• Load Plot from XML file
• Causality & Passivity Check/Enforce (Description) • Select Causality & Passivity Tool
• Load Data
• Check Passivity
• Enforce Passivity
• Check Causality
• Plot Checked Components
• Enforce Causality
Next Page …
3

Contents
Smart Tool Suite Users Manual
… Previous Page
• TDR/TDT Tool (Description) • Select TDR/TDT Tool
• Load Data
• Channel assignment
• Source assignment
• Source settings
• Input signal settings
• Calculation settings
• Results
• Smart Fixture De-embedding (Description) • Run Wizard
• Start Ssection
• Load DUT with Fixtures
• Load 2x Fixtures
• Fixture Verification
• Define De-embedding
• Results
4

Smart Tool Suite Description
Smart Tool Suite is a software tool to help engineers perform various types of
electromagnetic analysis very rapidly. Smart Tool Suite consists of a Graphical User
Interface (GUI) and a number of kernels depending on the functions that are
included. At this time, the available functions include:
• Plotting S/Z/Y-parameter files from Touchstone format or CSV format. Multiple curves can be
included on a single plot, and the plot can be modified to change scales, line widths, grid
format, and many other attributes. The plots can then be saved in PNG format for later
inclusion into other documents and presentations.
• Causality and passivity (CaP) analysis on multiport S-parameter files. A visual indication
whether each of the individual S-parameters are causal and/or passive is shown, as well as
details on which portions (if any) are not causal or passive.
•The TDR/TDT tool provides functionality to calculate time domain responses for reflections as
well as the through. The tool requires s-parameter blocks in Touchstone files as input. Any
number of ports are supported. Calculations are based on a FFT algorithm.
• Smart Fixture De-embedding (SFD). SFD Extracts DUT from “Fixture + DUT + Fixture”
structure. Tool requires S-Parameters for total structure and S-Parameters for Fixture. Fixture
also can de loaded as a symmetric 2x structure – Fixture + swapped(Fixture). In this case,
before de-embedding tool will extract 1x structure from the symmetric 2x structure.
Contents
5

Smart Tool Suite Supported Operation Systems
Supported Operating systems:
• Linux 32-bit (i686) – e.g. Smart_Tool_Suite-<version>-linux.i686.tar.bz2
• Linux 64-bit (x86-64) – e.g. Smart_Tool_Suite-<version>-linux.x86-64.tar.bz2
• Windows 32-bit (i686) – e.g. f Smart_Tool_Suite-<version>-win32.exe
• Windows 64-bit (x86-64) – e.g. Smart_Tool_Suite-<version>-win64.exe
Additional Licenses:
Qt Library
Intel® Math Kernel Library
Contents
6

Smart Tool Suite Installation
Linux:
Unpack the archive (no installation is needed). To run the program, execute the “Smart Tool
Suite” file from the created directory.
Windows
Uninstall the previous version (if any), then execute the installation file.
Contents
Press the “Next” button. 7

Smart Tool Suite Installation Contents
Press the “I Agree” button.
The license agreement window will appear:
8
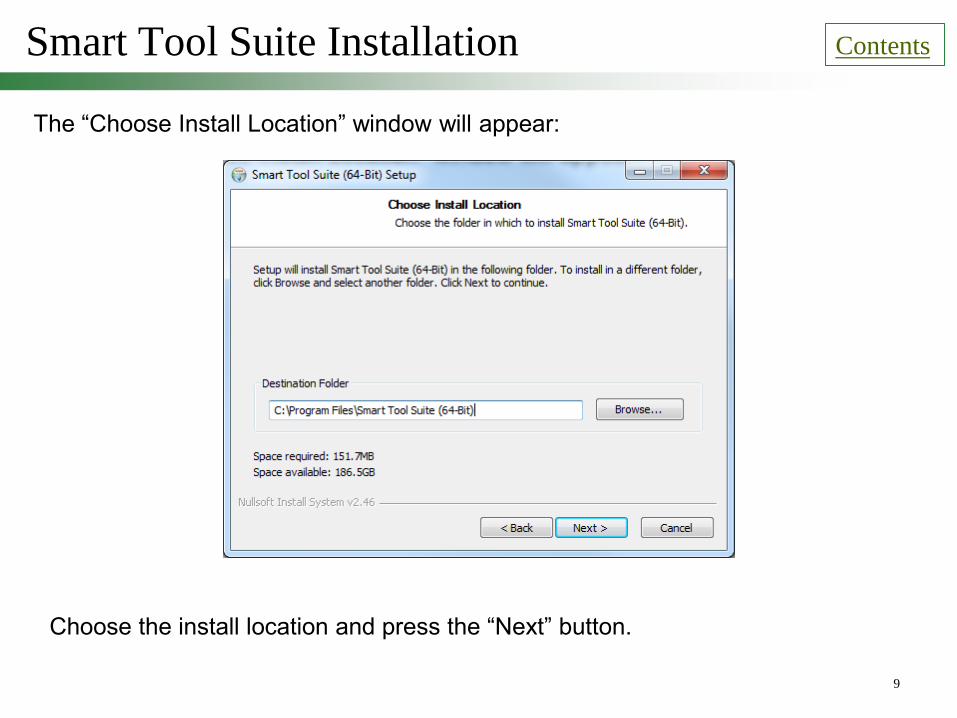
Smart Tool Suite Installation Contents
Choose the install location and press the “Next” button.
The “Choose Install Location” window will appear:
9

Smart Tool Suite Installation Contents
Choose a folder in the Start Menu where you want to place shortcuts to the Smart
Tool Suite executable files. Check “Do not create shortcuts” if you do not want to
place the shortcuts in the Start Menu.
Press “Next” button.
The “Choose Start Menu Folder” window will appear:
10

Smart Tool Suite Installation Contents
Check the components you want to install and press the “Install” button. It is
recommended that the checkboxes be left in their default state.
The “Choose Components” window will appear:
11
Smart Tool Suite Installation Contents
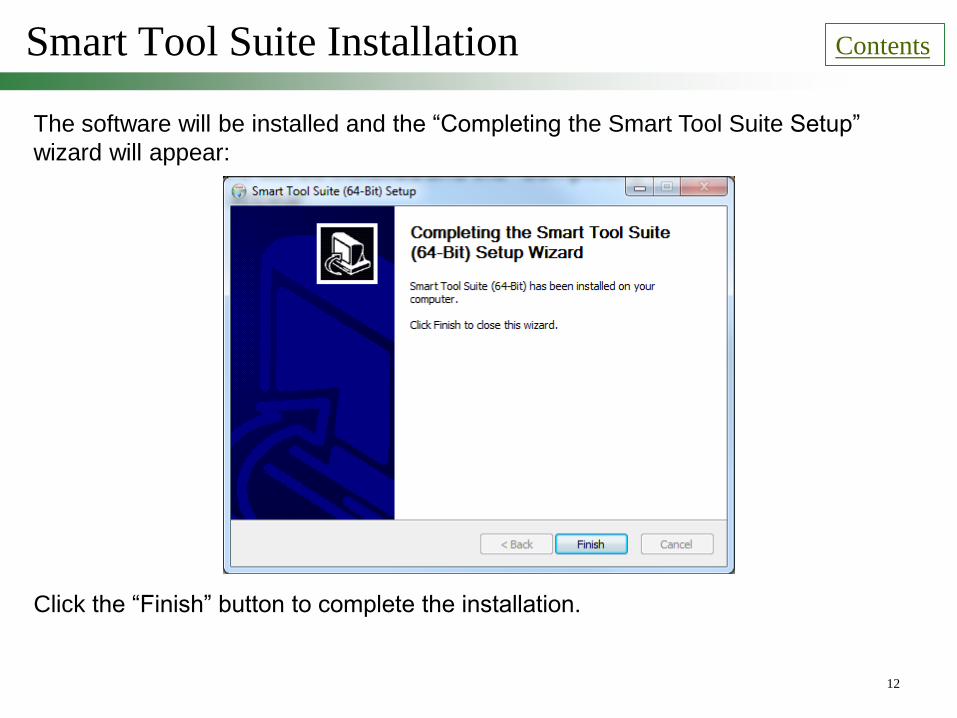
Click the “Finish” button to complete the installation.
The software will be installed and the “Completing the Smart Tool Suite Setup”
wizard will appear:
12

Smart Tool Suite Uninstall Contents
The “Uninstall” window will appear:
To uninstall the Smart Tool Suite software, go to the Start Menu/ Smart Tool Suite
Installation Folder and choose “Uninstall.” Another way would be to go directly to
the Smart Tool Suite installation folder and click on “Uninstall.exe”
Click “Uninstall” to uninstall the software. 13
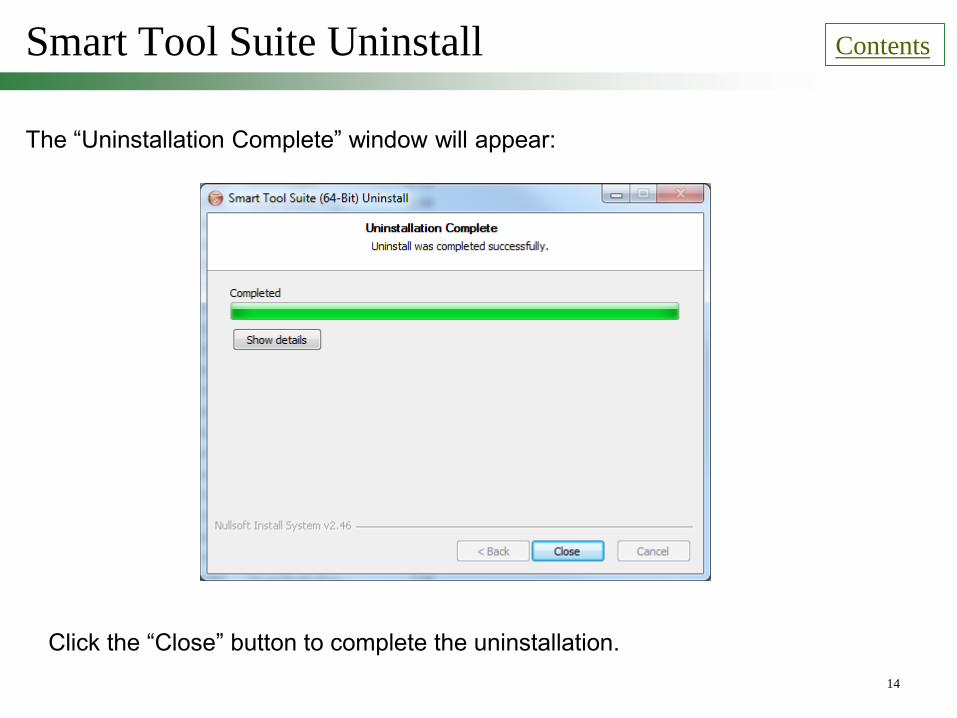
Smart Tool Suite Uninstall Contents
The “Uninstallation Complete” window will appear:
Click the “Close” button to complete the uninstallation.
14
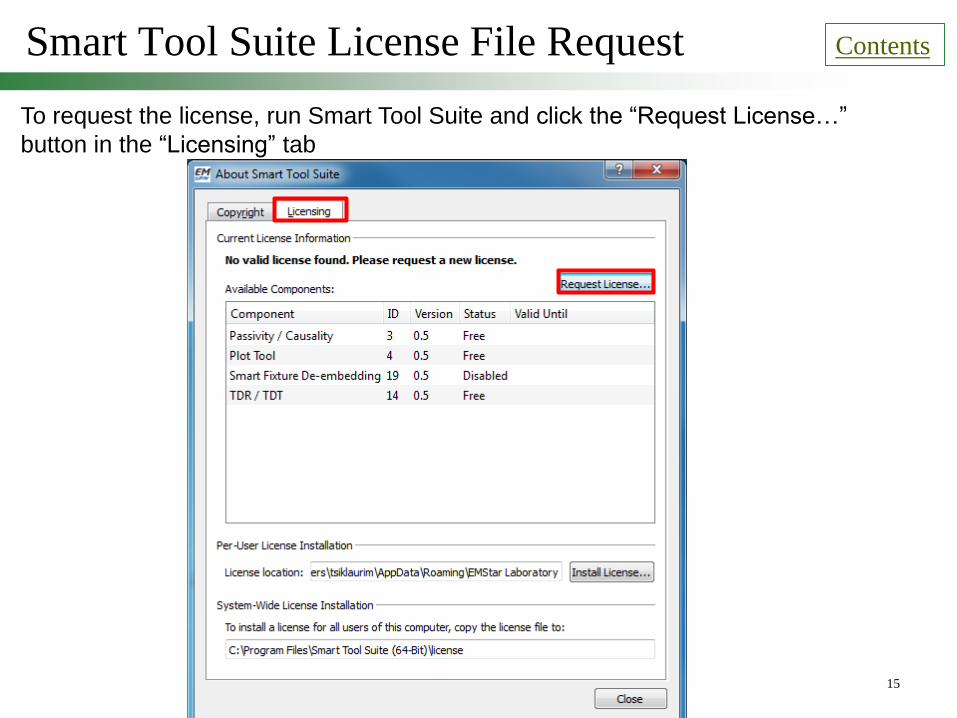
Smart Tool Suite License File Request Contents
To request the license, run Smart Tool Suite and click the “Request License…”
button in the “Licensing” tab
15
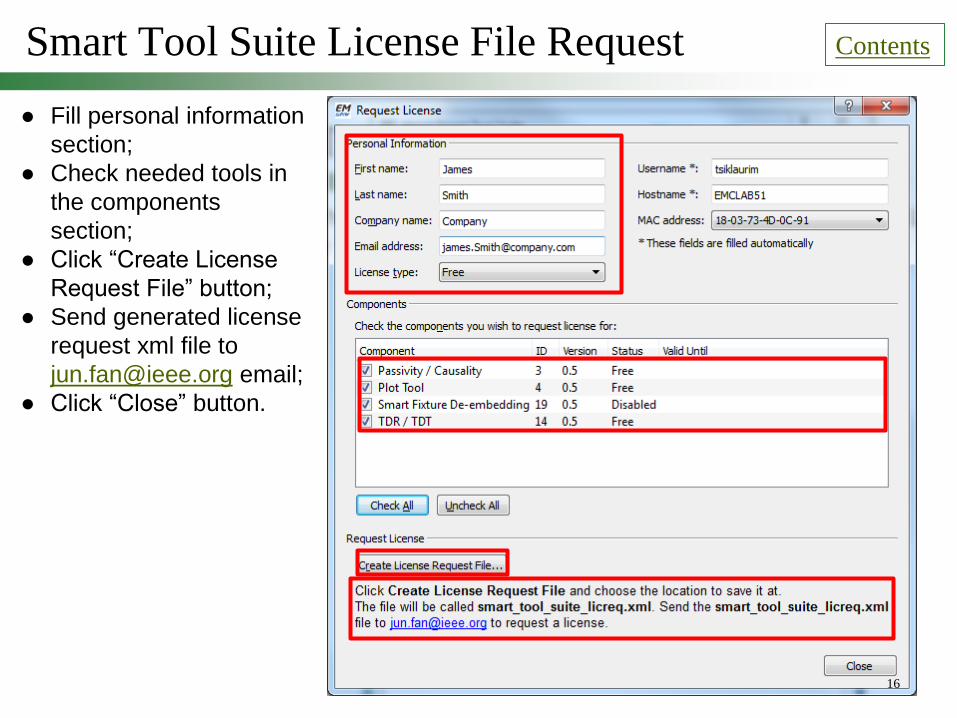
Smart Tool Suite License File Request Contents
● Fill personal information
section;
● Check needed tools in
the components
section;
● Click “Create License
Request File” button;
● Send generated license
request xml file to
[email protected] email;
● Click “Close” button.
16
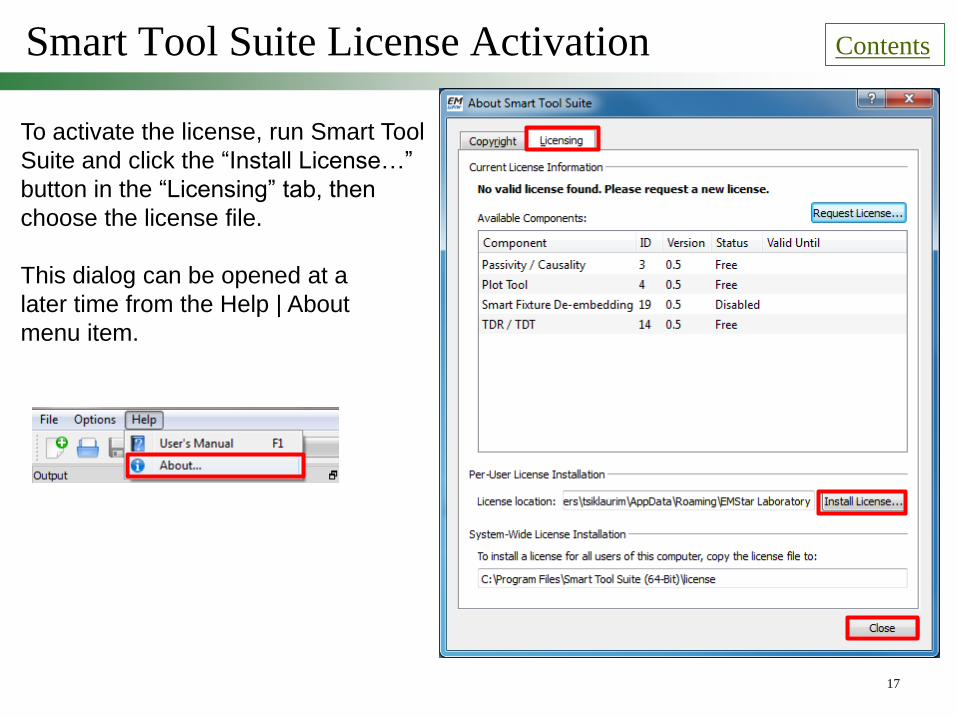
Smart Tool Suite License Activation Contents
To activate the license, run Smart Tool
Suite and click the “Install License…”
button in the “Licensing” tab, then
choose the license file.
This dialog can be opened at a
later time from the Help | About
menu item.
17

Smart Suite Tool GUI Structure Contents
Tools and wizards
Section:
The Tools and wizards
tabs show the
available tools and
wizards that can be
launched to perform
quick calculations or
plotting.
Output Window: Diagnostic messages and calculation results are printed here.
Control Toolbar: This toolbar is used to show the progress of currently running calculation, general project controls and
tool- or task-specific controls.
Main Menu
Main Window: Schematic representation or controls corresponding to selected tool or
wizard are shown here.
18
Plot Tool: Description
Description
Smart Tool Suite includes a plotting tool that allows the user to quickly and easily
make professional-looking plots of S-parameter data from Touchstone files.
Users can select any number of files and plot magnitude, phase, real, or imaginary
data from any number of files. Users have full control over line color, font size,
linear/log scales and much more. When the desired look of the plot is achieved, the
plot can exported as a PNG file for inclusion in reports and presentations. The user
can also export the plot (plotted data and all parameters: line colors, labels, legend
…) to XML file to continue working on it at a later stage.
Plots can be generated by other Smart Tool Suite tools and/or data from external
sources. This is an easy-to-use tool that allows the user to create plots to look as
they wish.
Contents
19
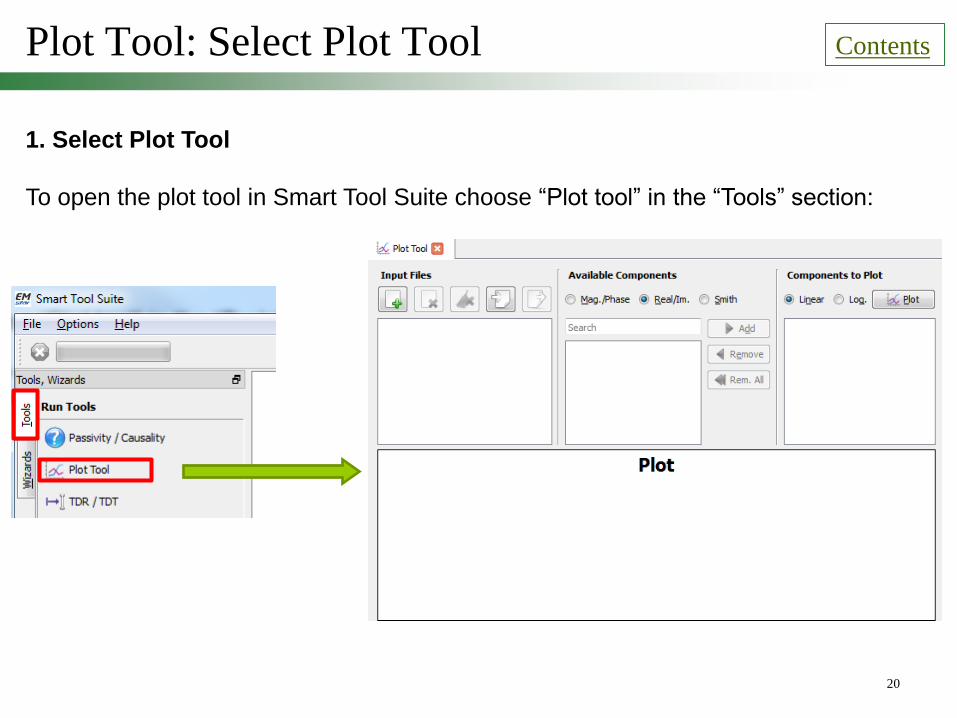
Plot Tool: Select Plot Tool
1. Select Plot Tool
To open the plot tool in Smart Tool Suite choose “Plot tool” in the “Tools” section:
Contents
20
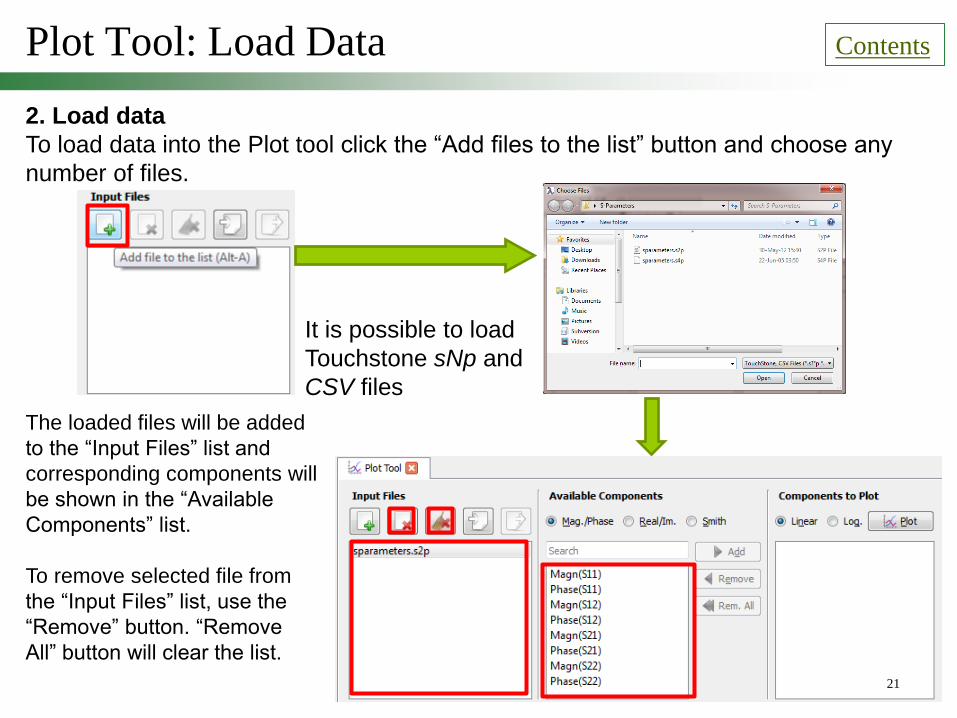
Plot Tool: Load Data
2. Load data
To load data into the Plot tool click the “Add files to the list” button and choose any
number of files.
Contents
It is possible to load
Touchstone sNp and
CSV files
The loaded files will be added
to the “Input Files” list and
corresponding components will
be shown in the “Available
Components” list.
To remove selected file from
the “Input Files” list, use the
“Remove” button. “Remove
All” button will clear the list.
21
Plot Tool: Choose Components for Plotting
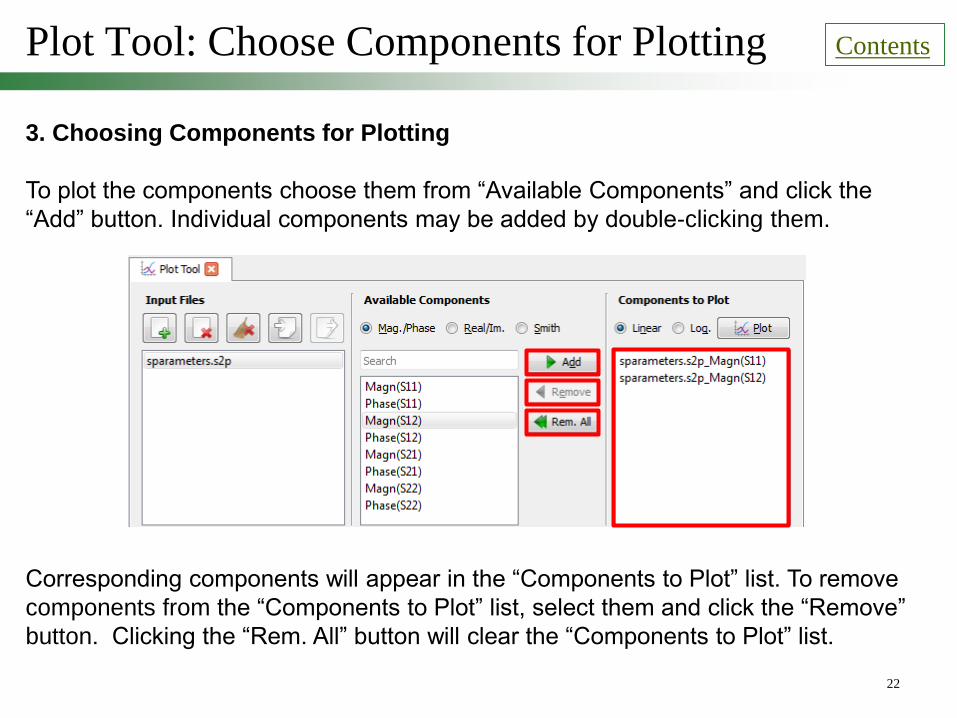
3. Choosing Components for Plotting
To plot the components choose them from “Available Components” and click the
“Add” button. Individual components may be added by double-clicking them.
Contents
Corresponding components will appear in the “Components to Plot” list. To remove
components from the “Components to Plot” list, select them and click the “Remove”
button. Clicking the “Rem. All” button will clear the “Components to Plot” list.
22
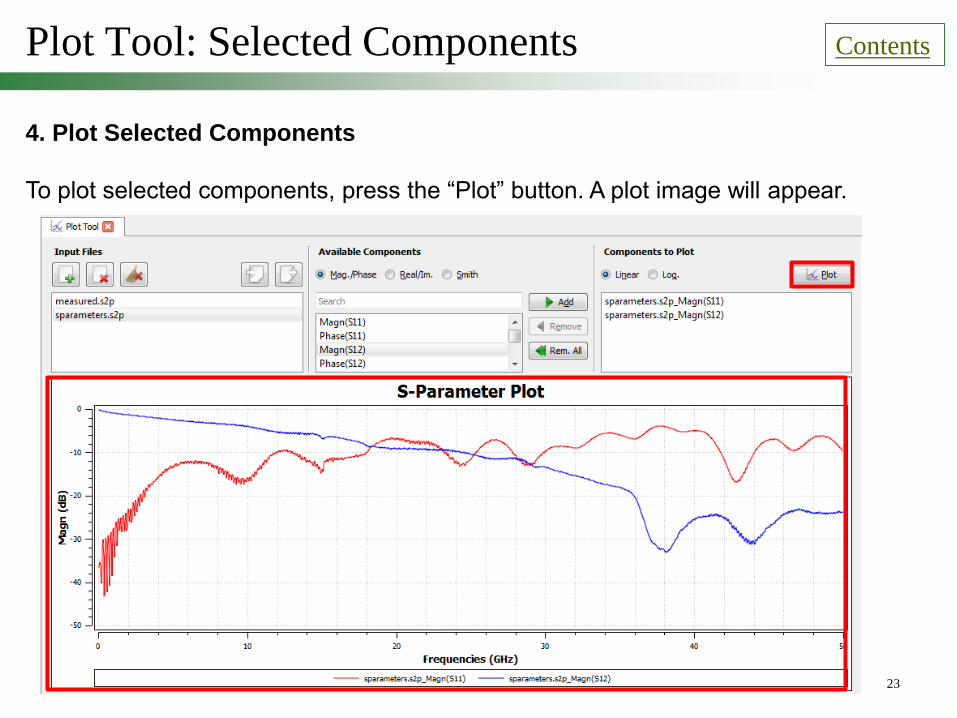
Plot Tool: Selected Components
4. Plot Selected Components
To plot selected components, press the “Plot” button. A plot image will appear.
Contents
23

Plot Tool: Logarithmic and Linear Scales
5. Logarithmic and Linear Scales
To choose between logarithmic and linear scales, use the “Linear” or “Log” radio
buttons, then press the “Plot” button again.
Contents
24

Plot Tool: Plotting Real/Imaginary
6. Real/Imaginary
To plot real/imaginary parts of selected components (as opposed to
magnitude/phase), click the “Real/Imag” radio button, choose appropriate
components, and press the “Plot” button again.
Contents
25
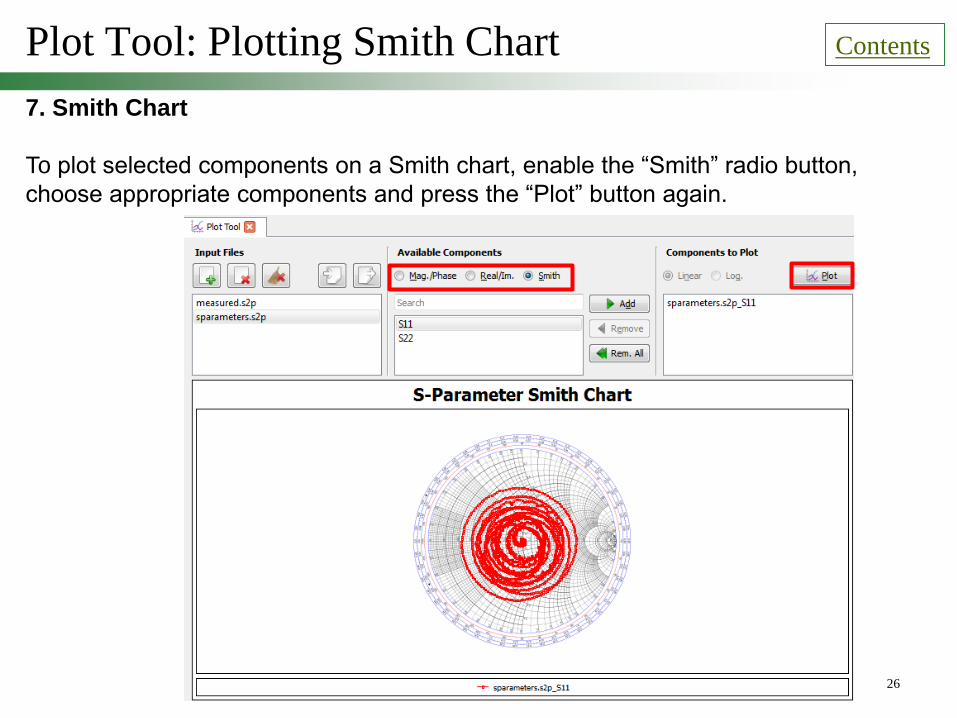
Plot Tool: Plotting Smith Chart
7. Smith Chart
To plot selected components on a Smith chart, enable the “Smith” radio button,
choose appropriate components and press the “Plot” button again.
Contents
26
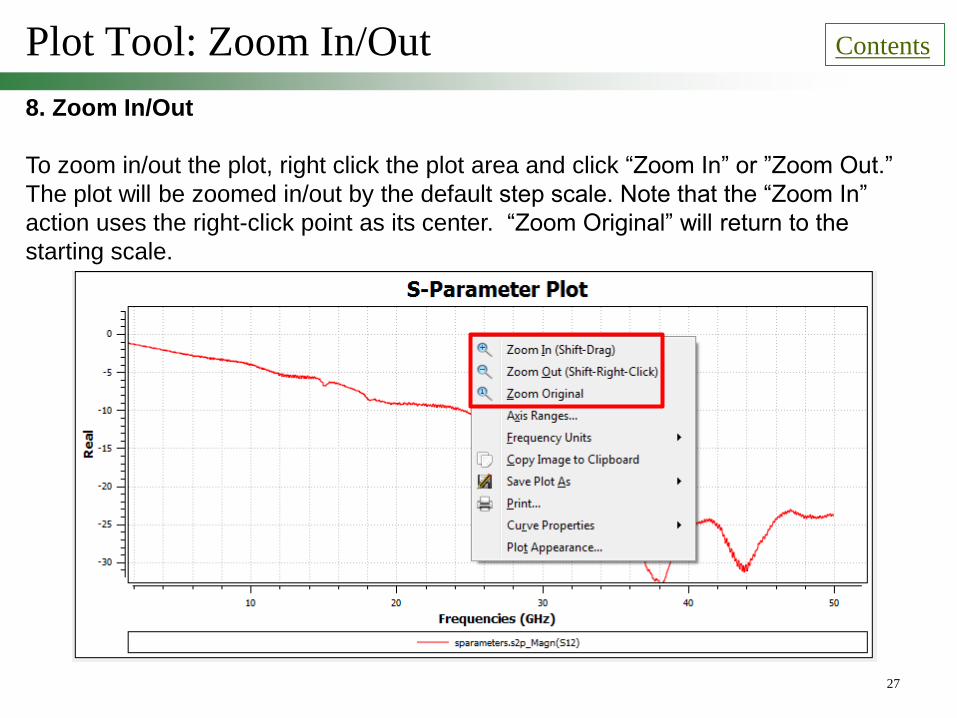
Plot Tool: Zoom In/Out
8. Zoom In/Out
To zoom in/out the plot, right click the plot area and click “Zoom In” or ”Zoom Out.”
The plot will be zoomed in/out by the default step scale. Note that the “Zoom In”
action uses the right-click point as its center. “Zoom Original” will return to the
starting scale.
Contents
27
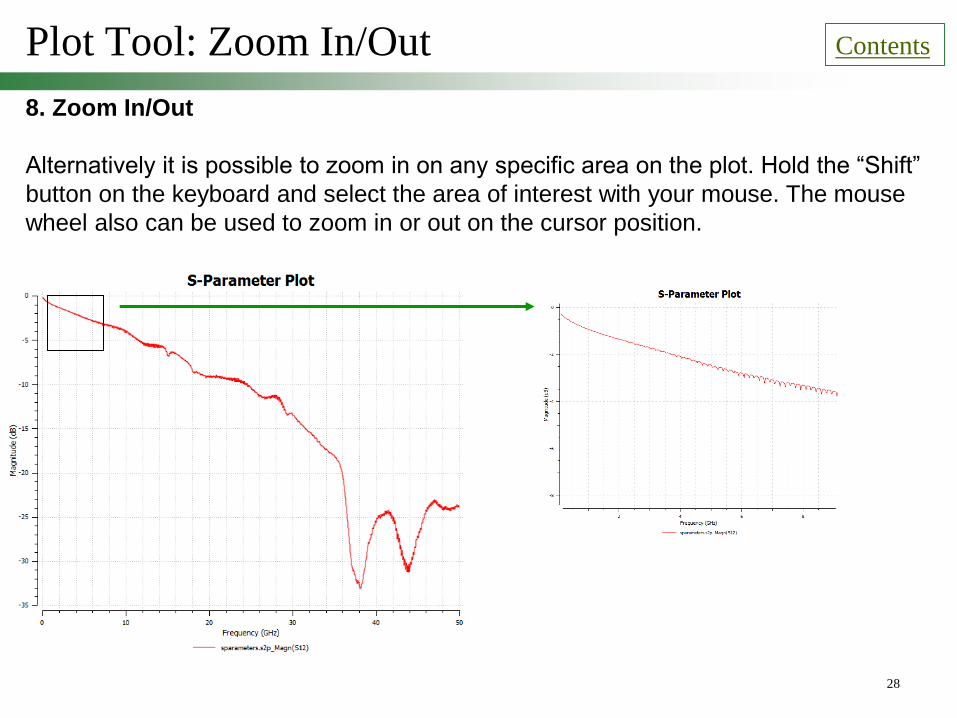
Plot Tool: Zoom In/Out
8. Zoom In/Out
Alternatively it is possible to zoom in on any specific area on the plot. Hold the “Shift”
button on the keyboard and select the area of interest with your mouse. The mouse
wheel also can be used to zoom in or out on the cursor position.
Contents
28

Plot Tool: Move Chart in the Plot
9. Move Chart in the Plot
To move the chart on the plot, press and hold the left mouse button and move the
mouse.
Contents
29
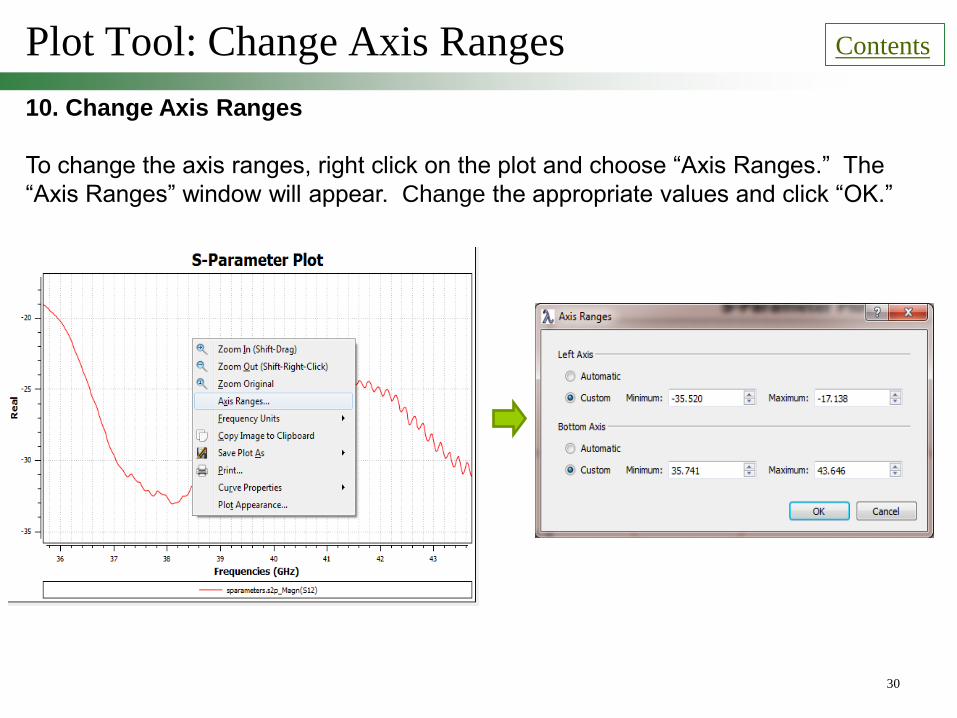
Plot Tool: Change Axis Ranges
10. Change Axis Ranges
To change the axis ranges, right click on the plot and choose “Axis Ranges.” The
“Axis Ranges” window will appear. Change the appropriate values and click “OK.”
Contents
30
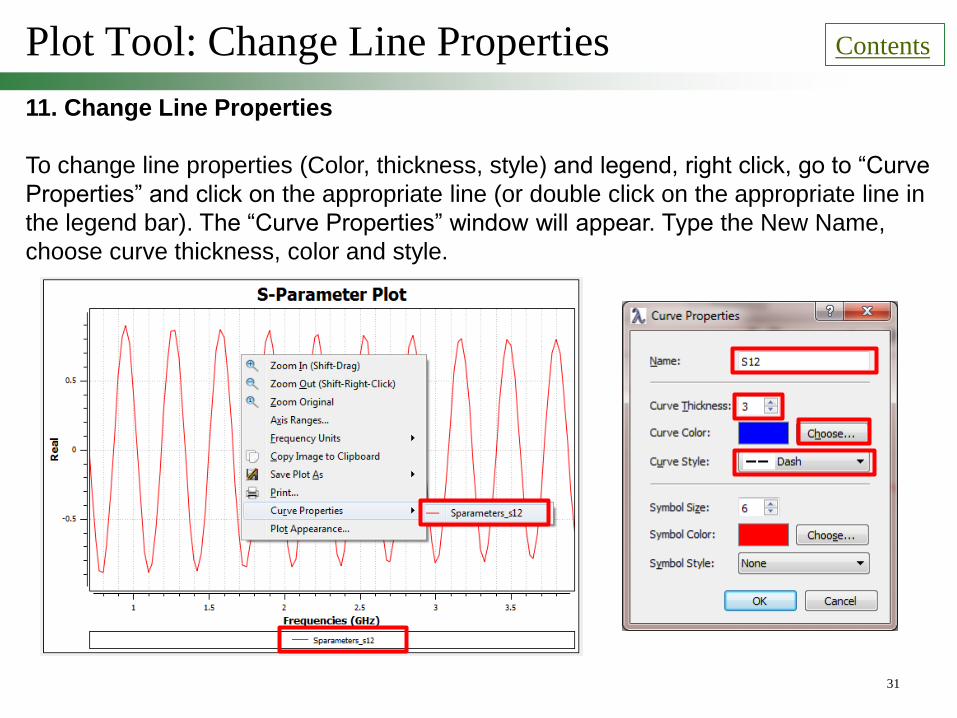
Plot Tool: Change Line Properties
11. Change Line Properties
To change line properties (Color, thickness, style) and legend, right click, go to “Curve
Properties” and click on the appropriate line (or double click on the appropriate line in
the legend bar). The “Curve Properties” window will appear. Type the New Name,
choose curve thickness, color and style.
Contents
31

Plot Tool: Change Line Properties
12. Change Line Properties
It is also possible to choose the symbol size, color and line style. Select the desired
line properties, then press the “OK” button. A new line on the plot will be generated
Contents
32

Plot Tool: Change Title
13. Change Title
To change title text, color and font, right click on the plot and choose “Plot
Appearance.” The “Plot Appearance” window will appear. Choose the “General” tab.
Contents
33
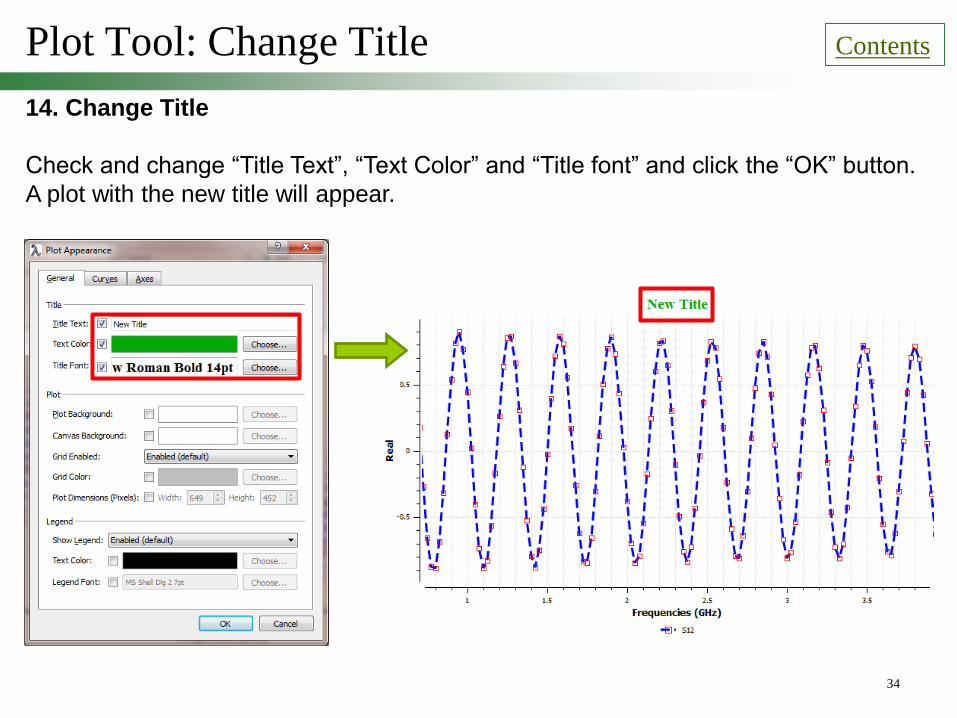
Plot Tool: Change Title
14. Change Title
Check and change “Title Text”, “Text Color” and “Title font” and click the “OK” button.
A plot with the new title will appear.
Contents
34

Plot Tool: Change General Settings
15. Change Plot’s General Settings
It is also possible to change the plot and canvas background, enable/disable the grid,
change grid color, change plot dimensions, show/hide legend, change legend text,
color, and font.
Contents
35
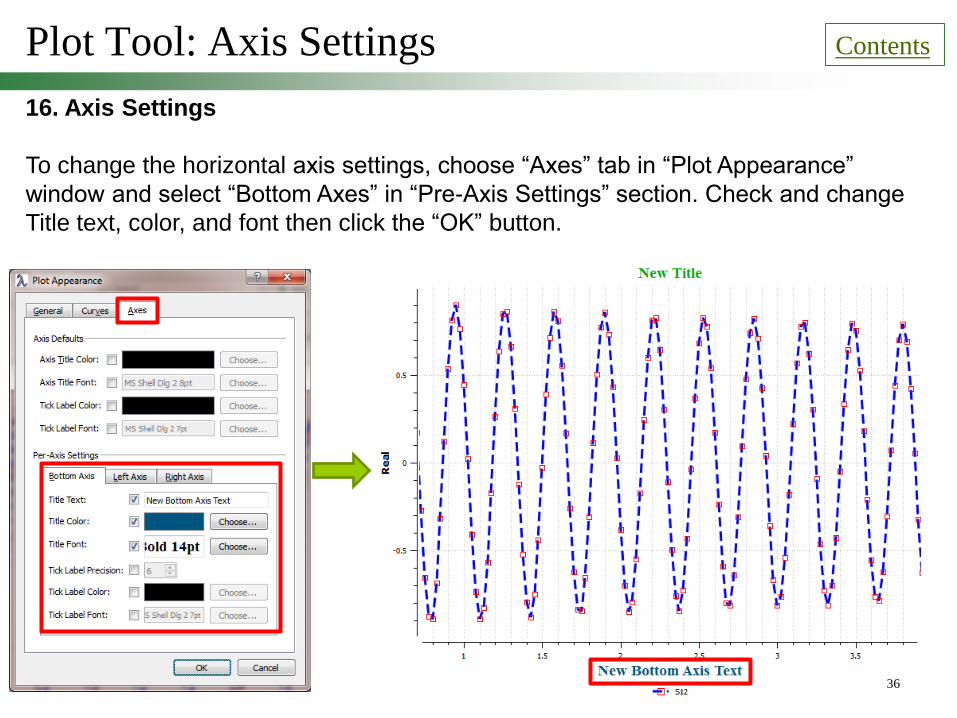
Plot Tool: Axis Settings
16. Axis Settings
To change the horizontal axis settings, choose “Axes” tab in “Plot Appearance”
window and select “Bottom Axes” in “Pre-Axis Settings” section. Check and change
Title text, color, and font then click the “OK” button.
Contents
36
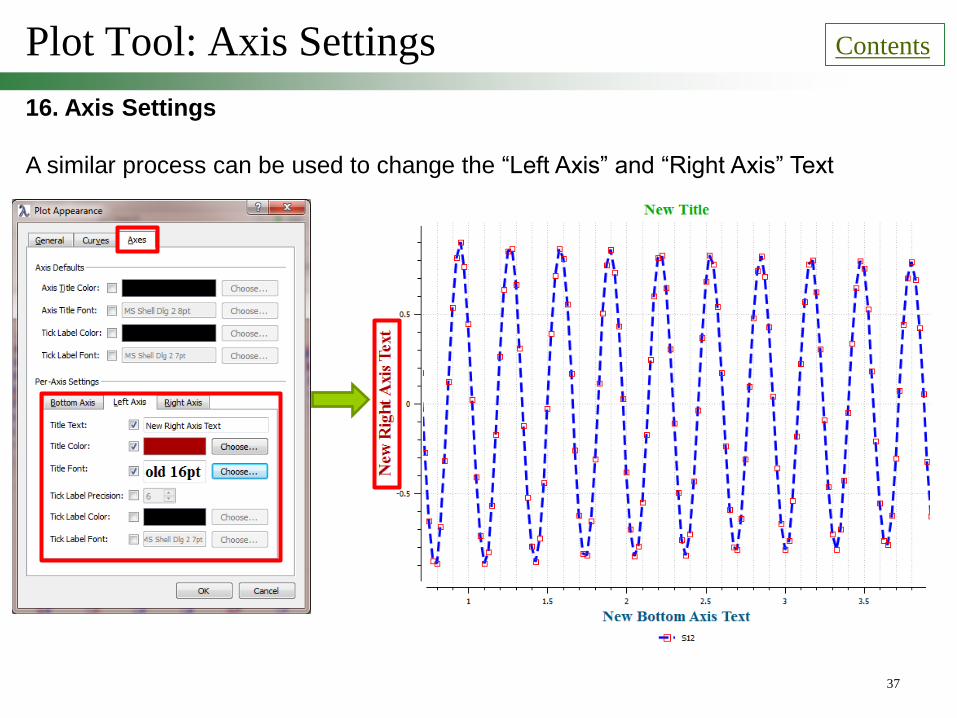
Plot Tool: Axis Settings
16. Axis Settings
A similar process can be used to change the “Left Axis” and “Right Axis” Text
Contents
37
Plot Tool: Save Plot in Graphic Format
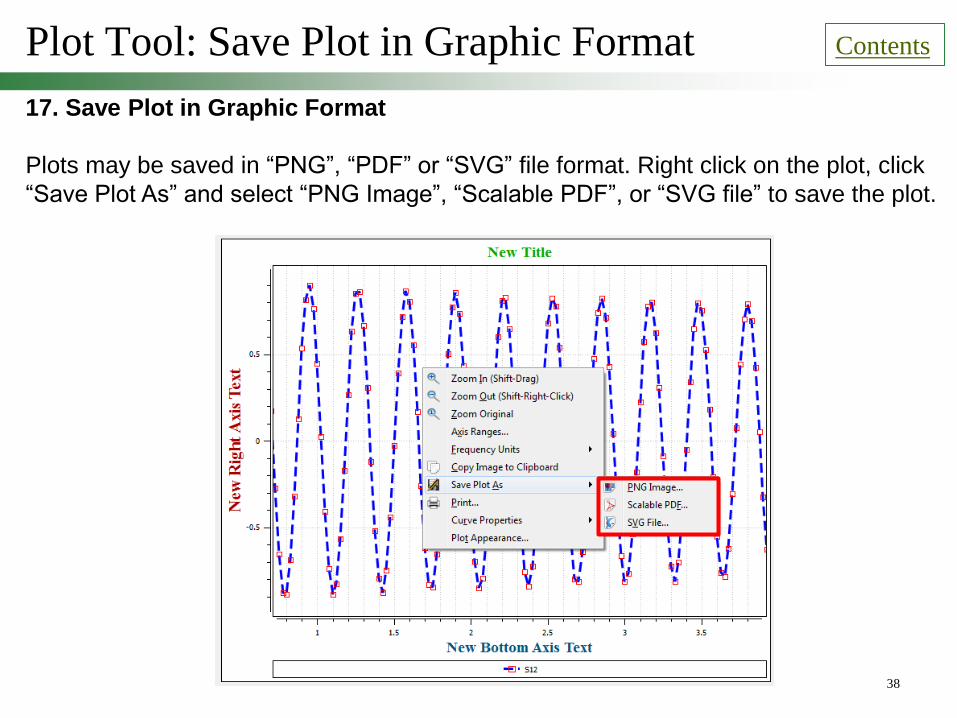
17. Save Plot in Graphic Format
Plots may be saved in “PNG”, “PDF” or “SVG” file format. Right click on the plot, click
“Save Plot As” and select “PNG Image”, “Scalable PDF”, or “SVG file” to save the plot.
Contents
38

Plot Tool: Copy Image to Clipboard
18. Copy Image to Clipboard
To paste a plot image into a presentation or some other document, right click on the
plot, select “Copy Image to Clipboard”, then go to the other document and “paste” the
image.
Contents
39
Plot Tool: Save Plot to XML File
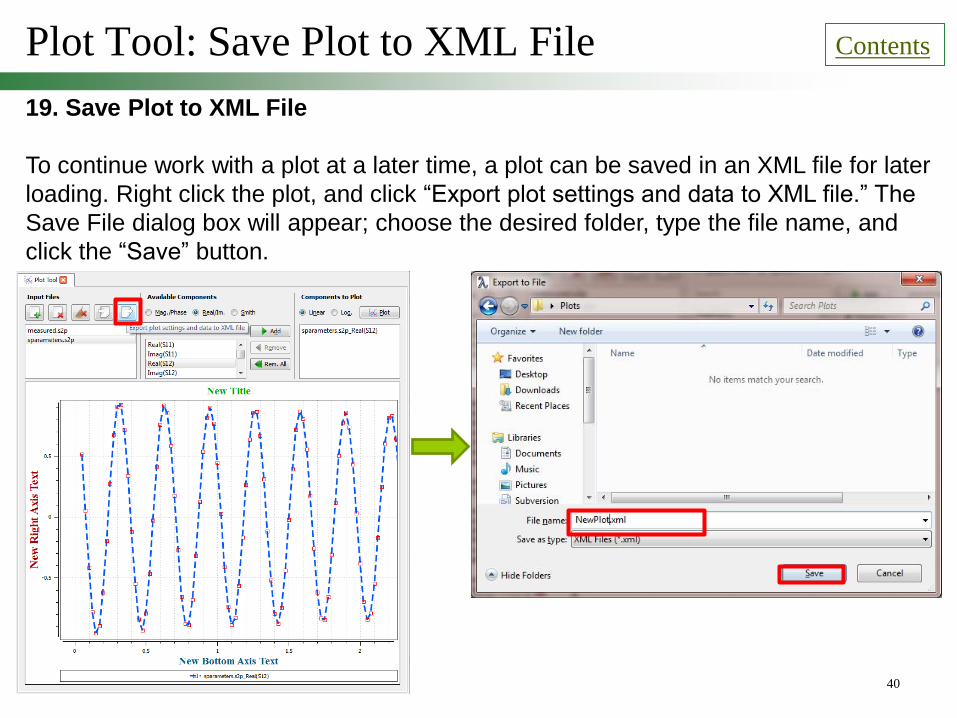
19. Save Plot to XML File
To continue work with a plot at a later time, a plot can be saved in an XML file for later
loading. Right click the plot, and click “Export plot settings and data to XML file.” The
Save File dialog box will appear; choose the desired folder, type the file name, and
click the “Save” button.
Contents
40
Plot Tool: Load Plot from XML File
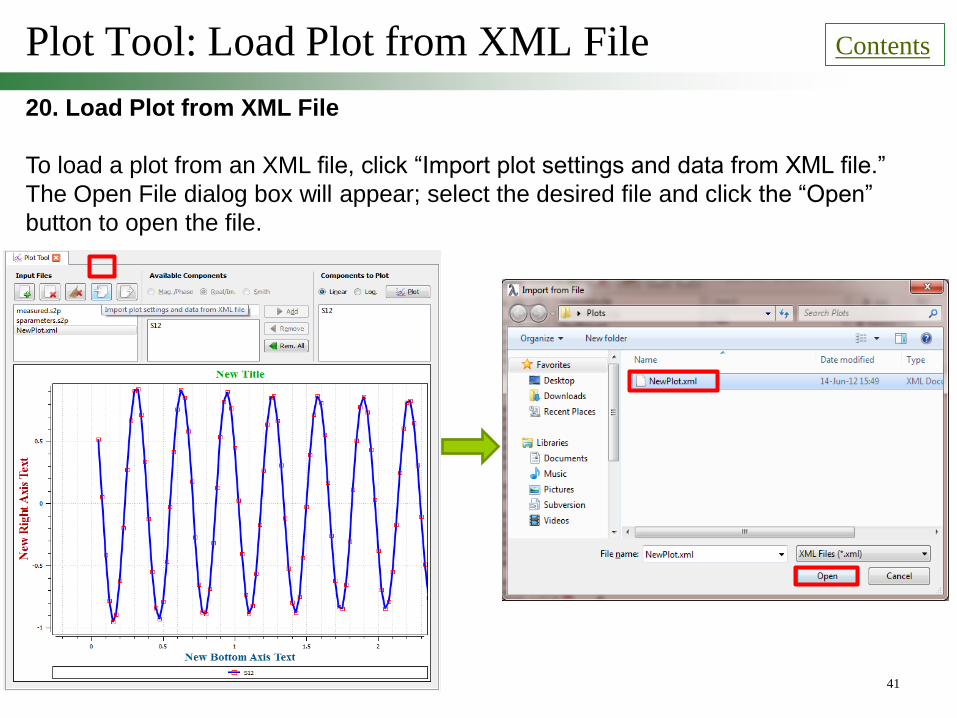
20. Load Plot from XML File
To load a plot from an XML file, click “Import plot settings and data from XML file.”
The Open File dialog box will appear; select the desired file and click the “Open”
button to open the file.
Contents
41
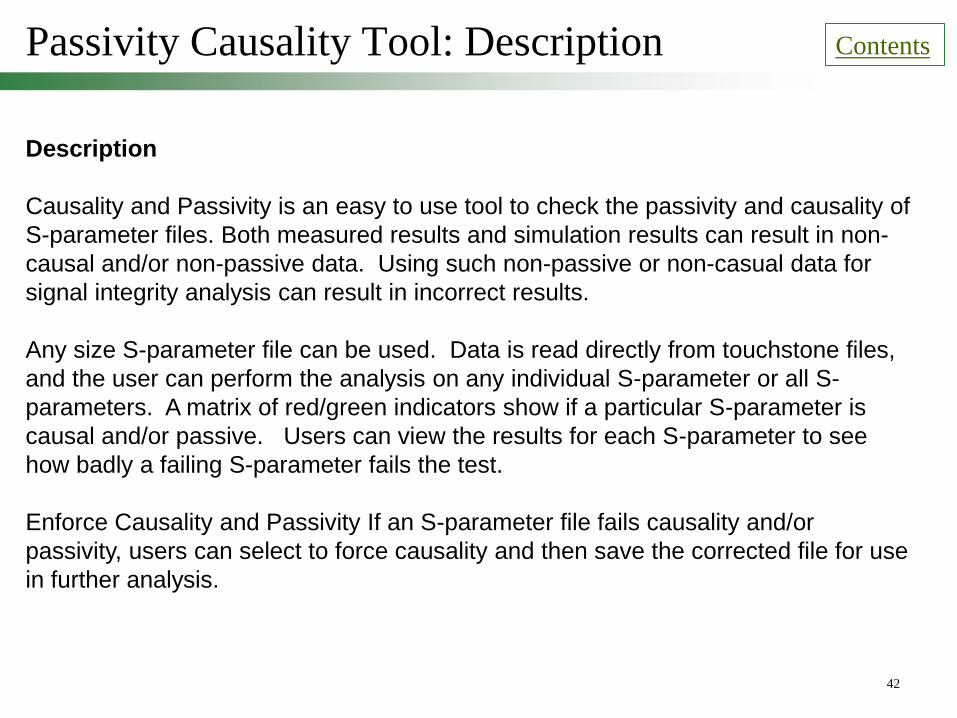
Passivity Causality Tool: Description Contents
42
Description
Causality and Passivity is an easy to use tool to check the passivity and causality of
S-parameter files. Both measured results and simulation results can result in non-
causal and/or non-passive data. Using such non-passive or non-casual data for
signal integrity analysis can result in incorrect results.
Any size S-parameter file can be used. Data is read directly from touchstone files,
and the user can perform the analysis on any individual S-parameter or all S-
parameters. A matrix of red/green indicators show if a particular S-parameter is
causal and/or passive. Users can view the results for each S-parameter to see
how badly a failing S-parameter fails the test.
Enforce Causality and Passivity If an S-parameter file fails causality and/or
passivity, users can select to force causality and then save the corrected file for use
in further analysis.
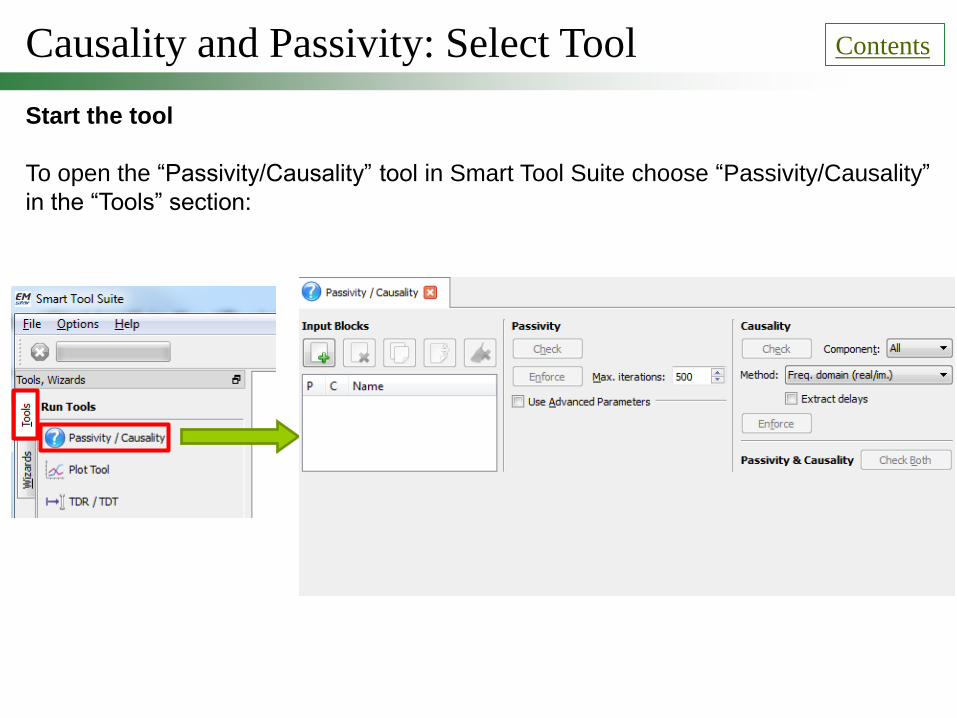
Causality and Passivity: Select Tool
Start the tool
To open the “Passivity/Causality” tool in Smart Tool Suite choose “Passivity/Causality”
in the “Tools” section:
Contents
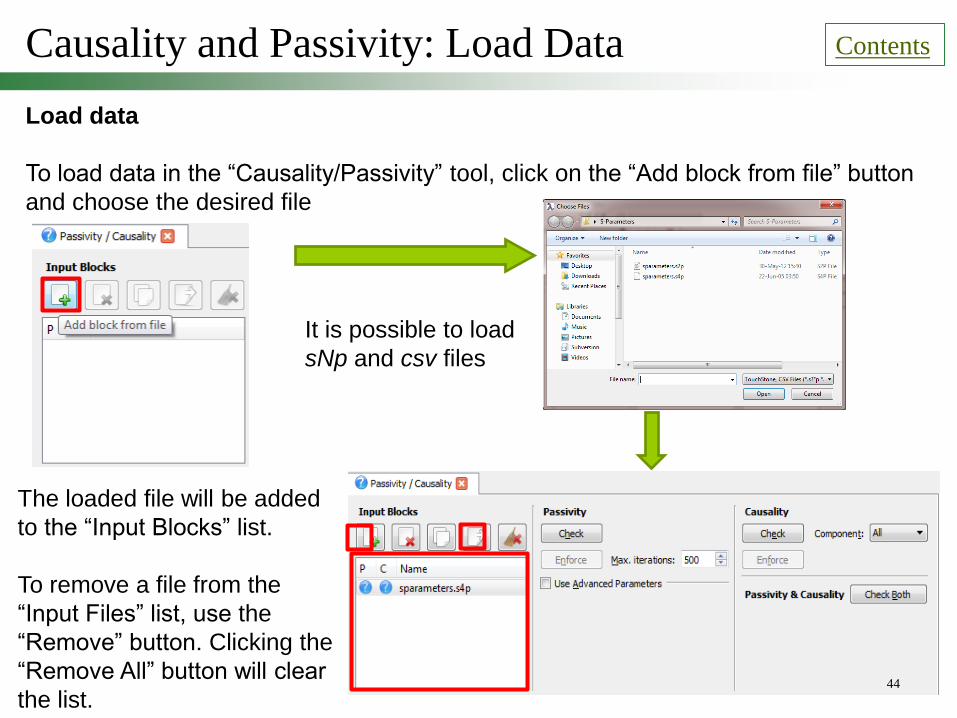
Causality and Passivity: Load Data
Load data
To load data in the “Causality/Passivity” tool, click on the “Add block from file” button
and choose the desired file
It is possible to load
sNp and csv files
The loaded file will be added
to the “Input Blocks” list.
To remove a file from the
“Input Files” list, use the
“Remove” button. Clicking the
“Remove All” button will clear
the list.
Contents
44
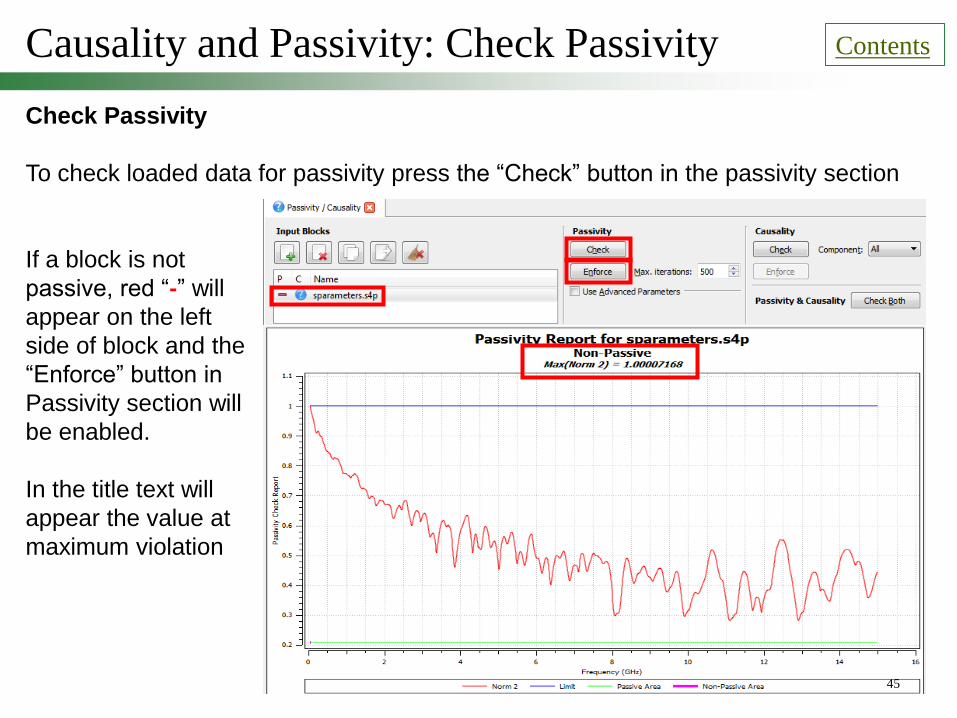
Causality and Passivity: Check Passivity
Check Passivity
To check loaded data for passivity press the “Check” button in the passivity section
If a block is not
passive, red “-” will
appear on the left
side of block and the
“Enforce” button in
Passivity section will
be enabled.
In the title text will
appear the value at
maximum violation
Contents
45
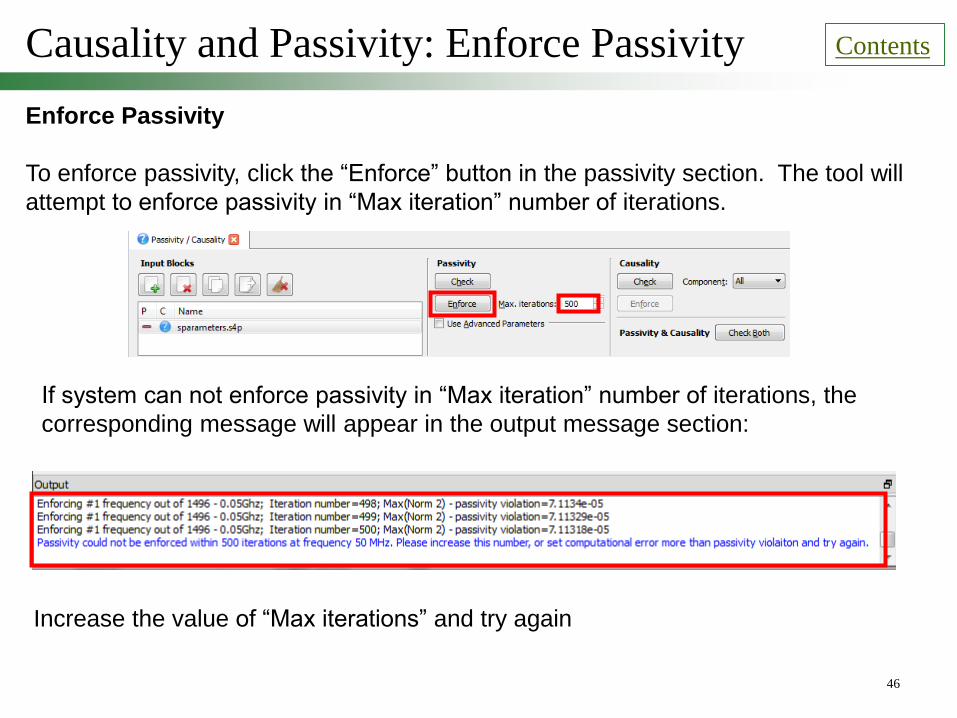
Causality and Passivity: Enforce Passivity
Enforce Passivity
To enforce passivity, click the “Enforce” button in the passivity section. The tool will
attempt to enforce passivity in “Max iteration” number of iterations.
If system can not enforce passivity in “Max iteration” number of iterations, the
corresponding message will appear in the output message section:
Increase the value of “Max iterations” and try again
Contents
46
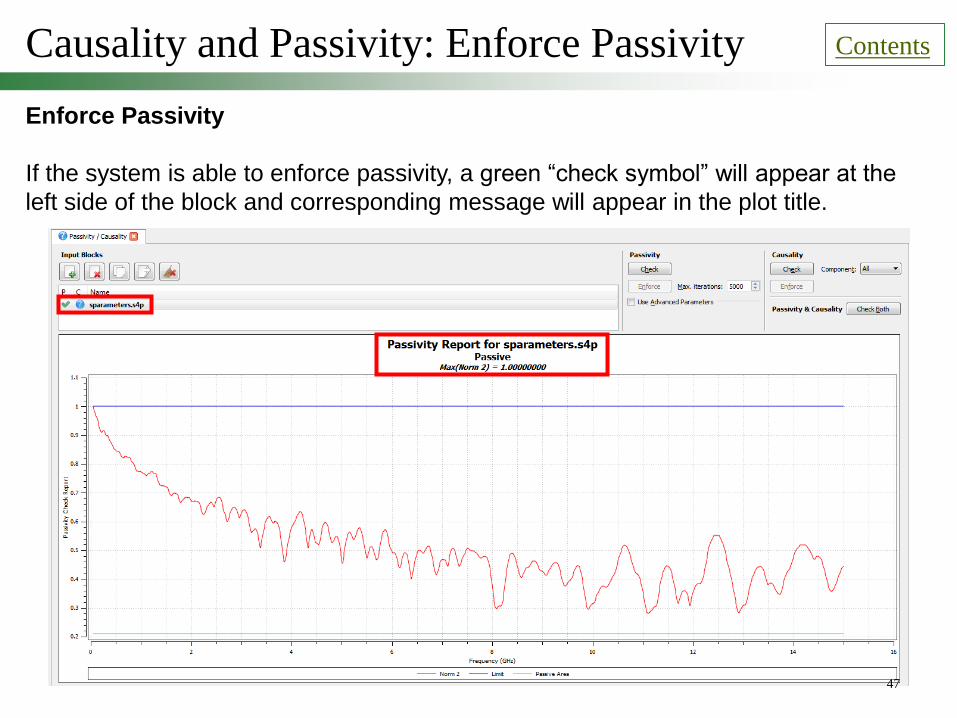
Causality and Passivity: Enforce Passivity
Enforce Passivity
If the system is able to enforce passivity, a green “check symbol” will appear at the
left side of the block and corresponding message will appear in the plot title.
Contents
47
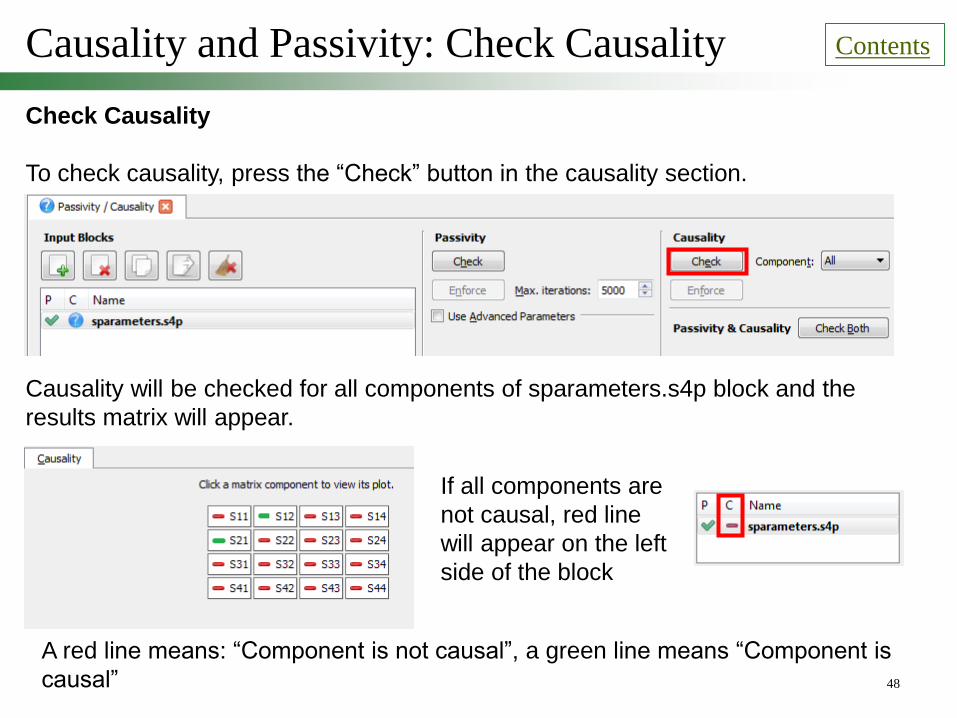
Causality and Passivity: Check Causality
Check Causality
To check causality, press the “Check” button in the causality section.
Causality will be checked for all components of sparameters.s4p block and the
results matrix will appear.
A red line means: “Component is not causal”, a green line means “Component is
causal”
If all components are
not causal, red line
will appear on the left
side of the block
Contents
48

Check Causality
To check causality for one component of an s-parameters block, use the
“Components” combo box.
To check passivity and causality simultaneously, click the “Check Both” button in
“Passivity & Causality section.”
Causality and Passivity: Check Causality Contents
49
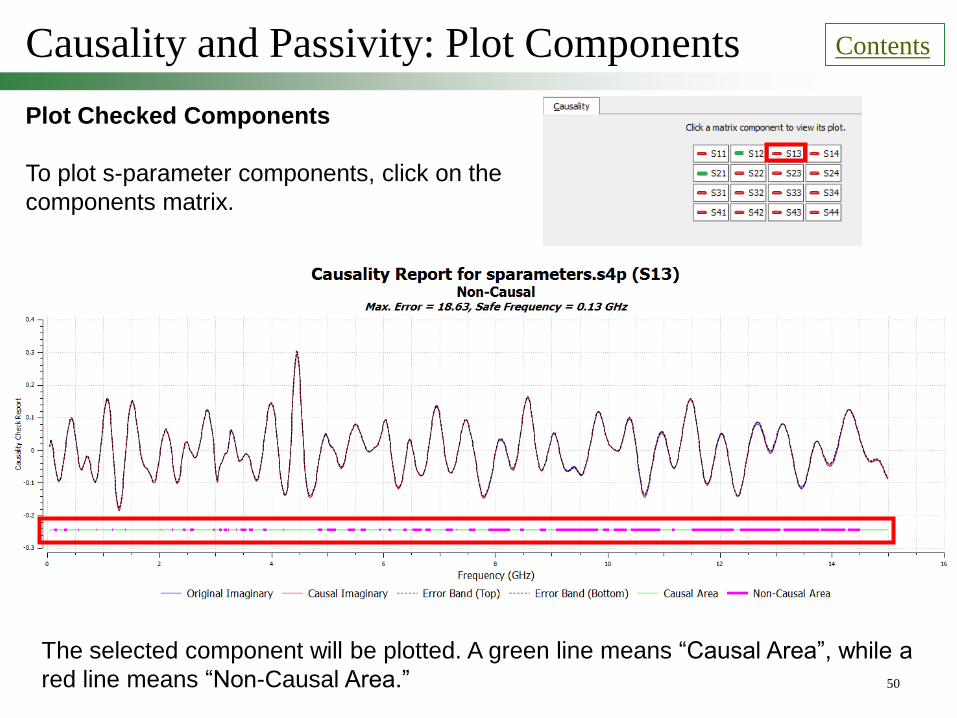
Plot Checked Components
To plot s-parameter components, click on the
components matrix.
The selected component will be plotted. A green line means “Causal Area”, while a
red line means “Non-Causal Area.”
Causality and Passivity: Plot Components Contents
50
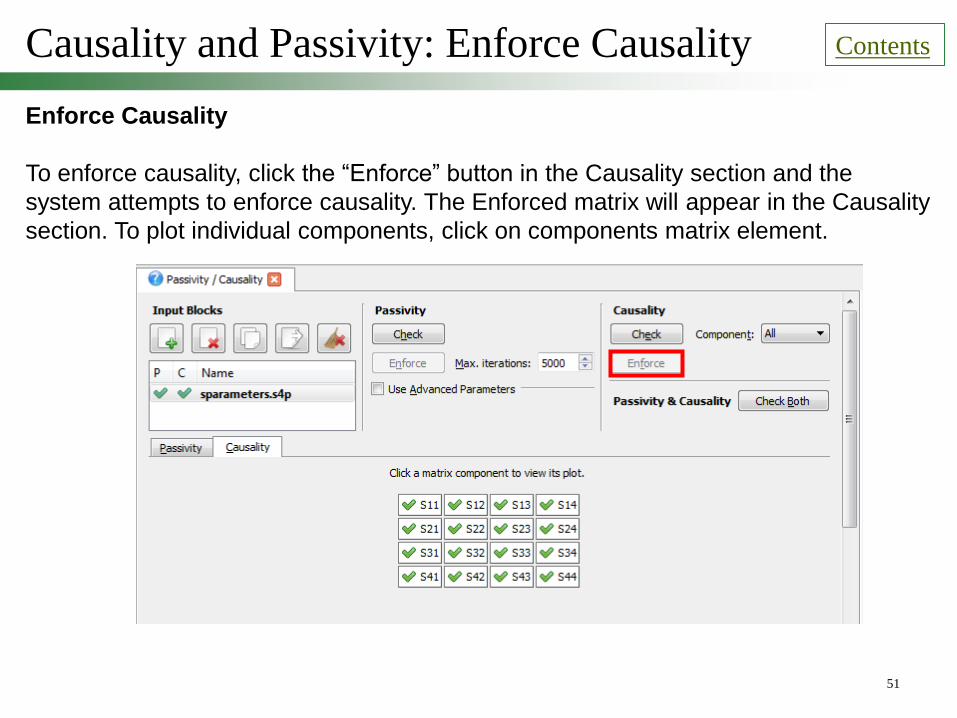
Enforce Causality
To enforce causality, click the “Enforce” button in the Causality section and the
system attempts to enforce causality. The Enforced matrix will appear in the Causality
section. To plot individual components, click on components matrix element.
Causality and Passivity: Enforce Causality Contents
51

TDR/TDT Tool Contents
TDR/TDT Tool – Description
The TDR/TDT tool provides functionality to calculate time domain responses for
reflections as well as the through.
The tool requires s-parameter blocks in Touchstone files as input.
Any number of ports are supported.
Calculations are based on a FFT algorithm.
52
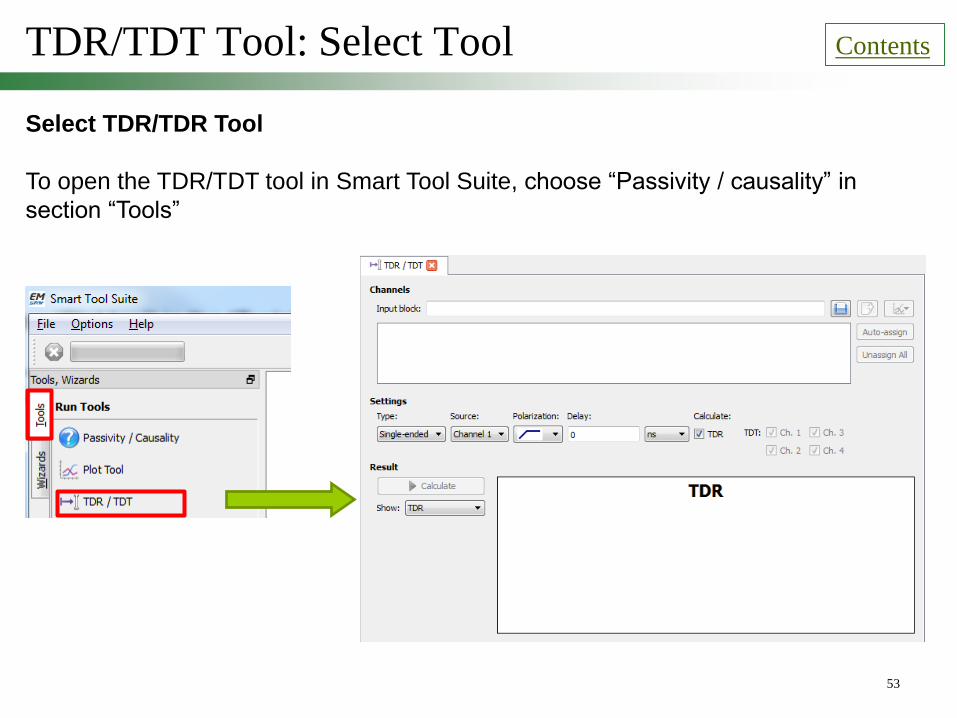
TDR/TDT Tool: Select Tool
Select TDR/TDR Tool
To open the TDR/TDT tool in Smart Tool Suite, choose “Passivity / causality” in
section “Tools”
Contents
53
TDR/TDT Tool: Load S-parameters
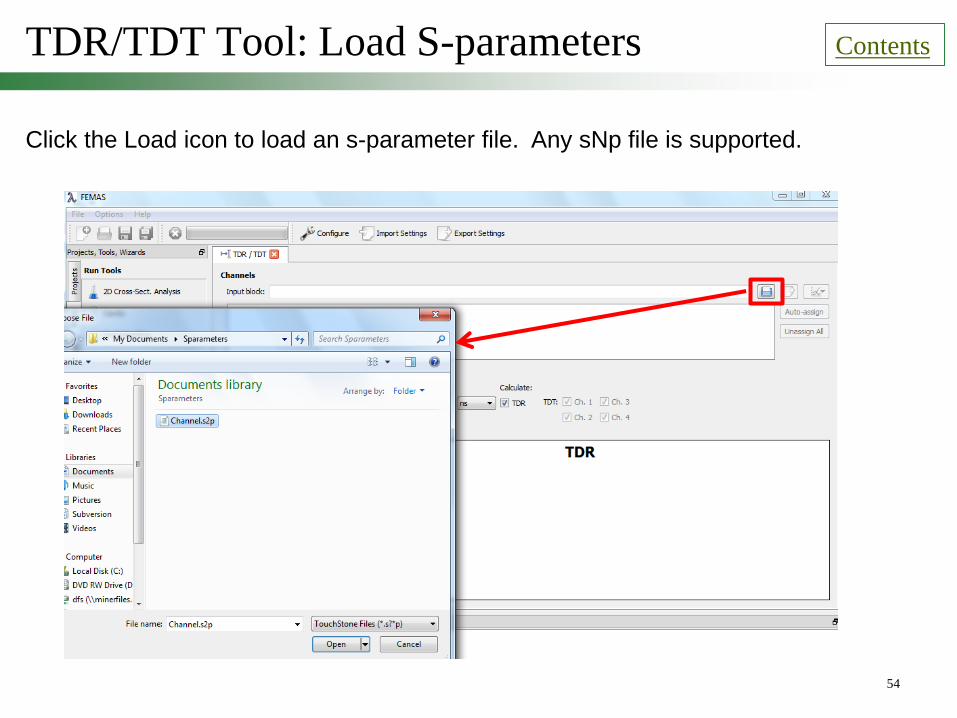
Click the Load icon to load an s-parameter file. Any sNp file is supported.
Contents
54
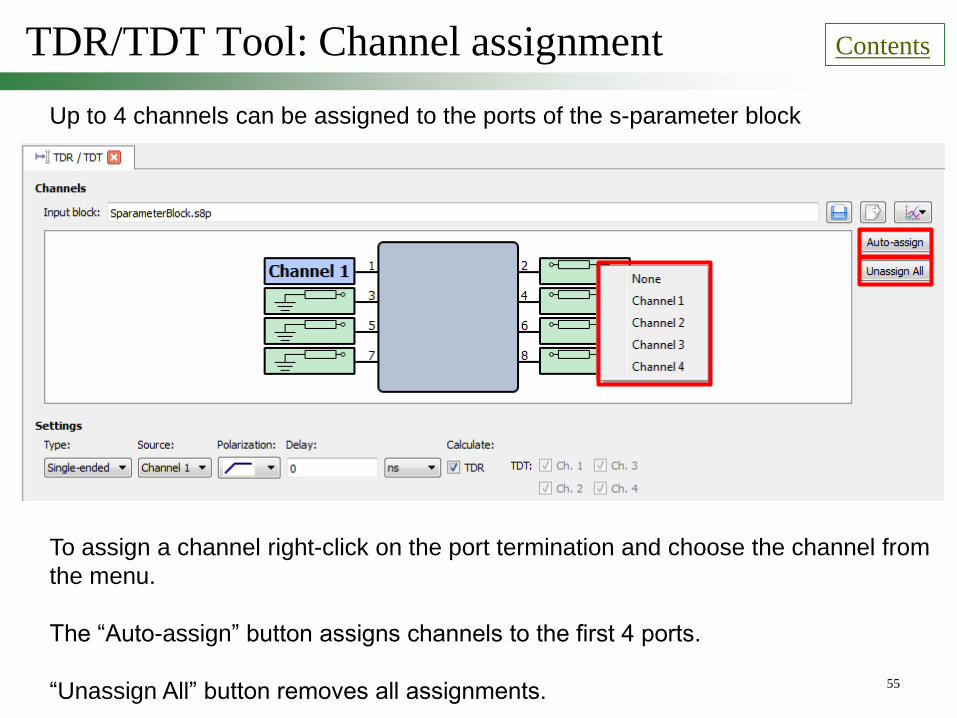
TDR/TDT Tool: Channel assignment Contents
Up to 4 channels can be assigned to the ports of the s-parameter block
To assign a channel right-click on the port termination and choose the channel from
the menu.
The “Auto-assign” button assigns channels to the first 4 ports.
“Unassign All” button removes all assignments. 55

TDR/TDT Tool: Source assignment Contents
1
1. Choose Single-ended or
Differential mode for TDR/TDT
2a. Choose one of the channels
to be a single-ended source
2b. Choose two channels
to be a differential pair source
2b
2a
56
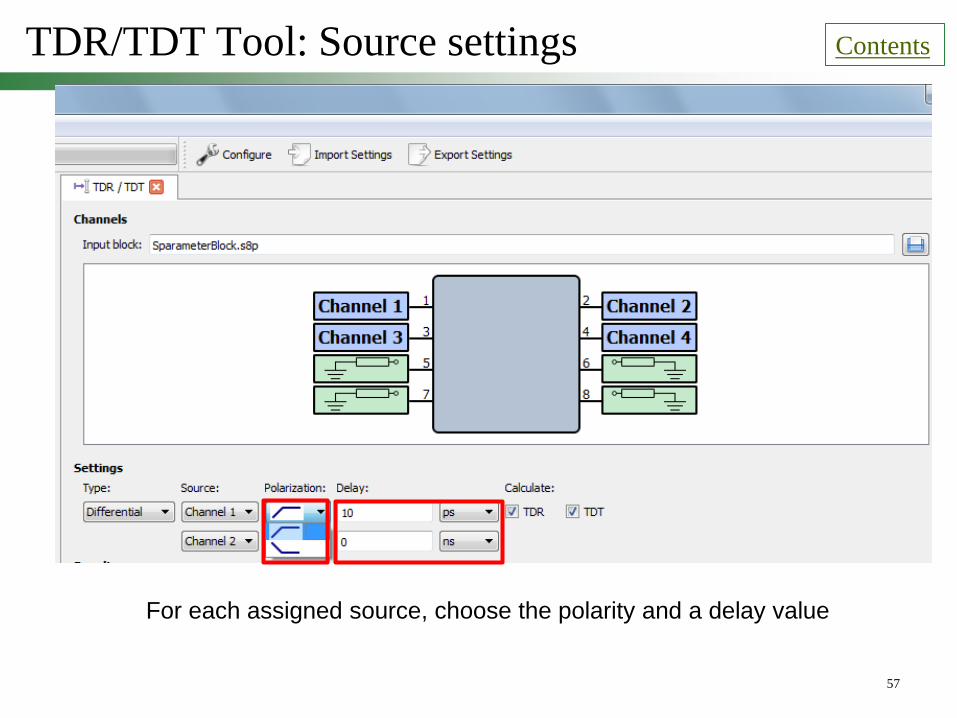
TDR/TDT Tool: Source settings Contents
For each assigned source, choose the polarity and a delay value
57

TDR/TDT Tool: Input step settings Contents
Click on “Configure” to launch the Input step settings menu.
Amplitude
Period
Rise time
Input values of rise time,
period, time step,
and amplitude or use the
defaults.
58
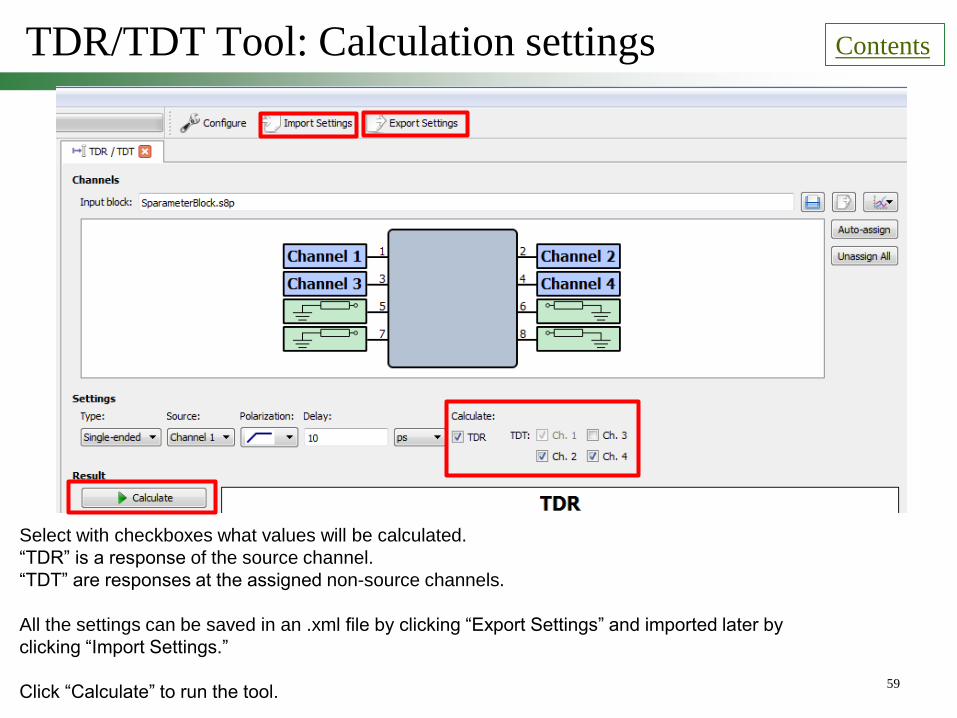
TDR/TDT Tool: Calculation settings Contents
Select with checkboxes what values will be calculated.
“TDR” is a response of the source channel.
“TDT” are responses at the assigned non-source channels.
All the settings can be saved in an .xml file by clicking “Export Settings” and imported later by
clicking “Import Settings.”
Click “Calculate” to run the tool. 59

TDR/TDT Tool: Results Contents
Choose the type of results to show from the drop-down menu:
1. TDR in voltage scale
2. TDR in Impedance scale
3. Reflection coefficient
4. TDT in voltage scale
In the case of a differential pair source, additionally choose with checkboxes single-ended
responses, differential response, or common mode response :
60
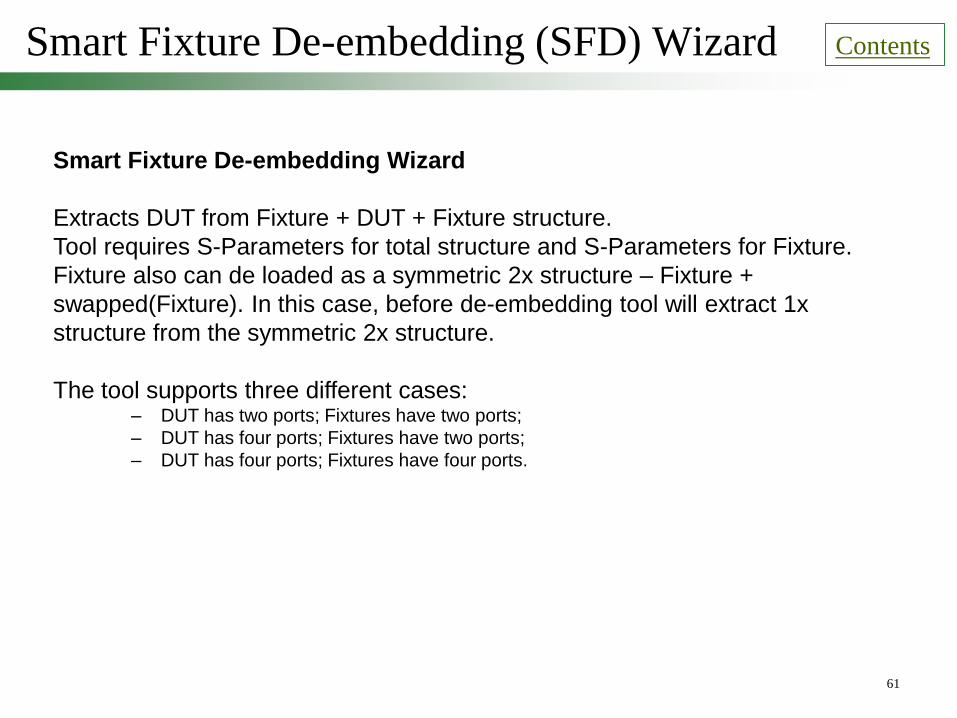
Smart Fixture De-embedding (SFD) Wizard Contents
Smart Fixture De-embedding Wizard
Extracts DUT from Fixture + DUT + Fixture structure.
Tool requires S-Parameters for total structure and S-Parameters for Fixture.
Fixture also can de loaded as a symmetric 2x structure – Fixture +
swapped(Fixture). In this case, before de-embedding tool will extract 1x
structure from the symmetric 2x structure.
The tool supports three different cases: – DUT has two ports; Fixtures have two ports;
– DUT has four ports; Fixtures have two ports;
– DUT has four ports; Fixtures have four ports.
61

SFD: Run Wizard Contents
To run Smart Fixture De-embedding wizard, go to “Wizards section” and click
“Smart Fixture De-embedding”
62
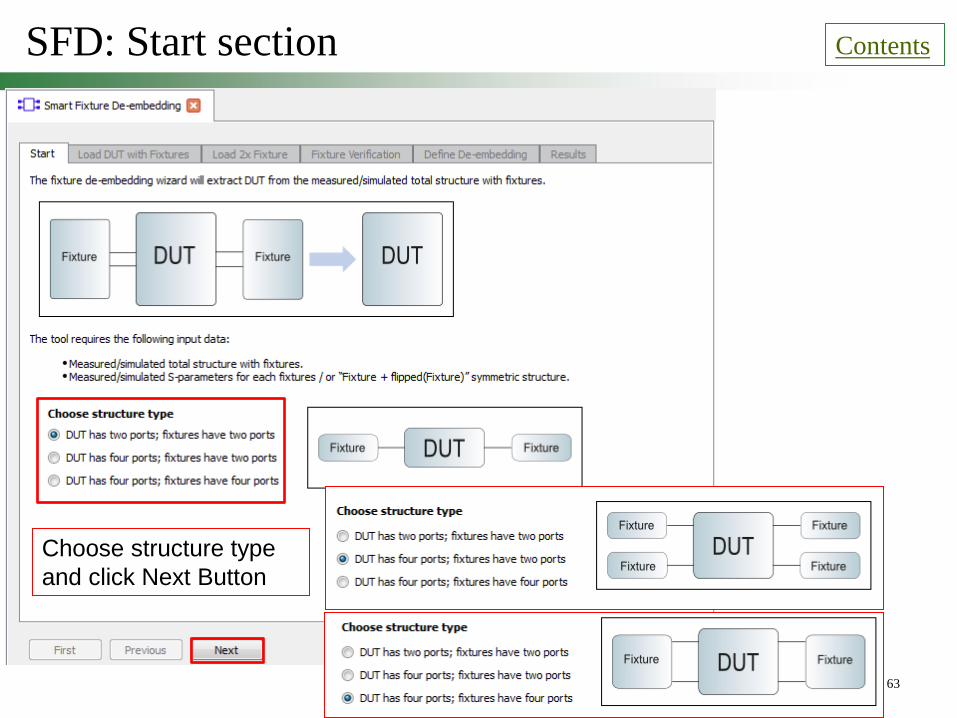
SFD: Start section Contents
Choose structure type
and click Next Button
63
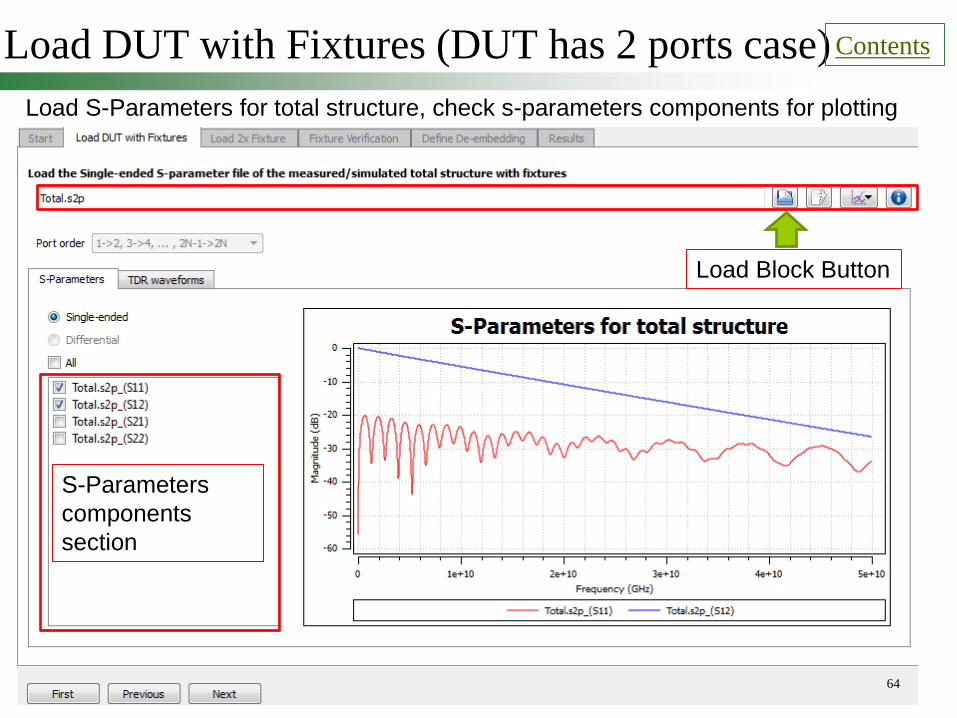
Load DUT with Fixtures (DUT has 2 ports case) Contents
Load S-Parameters for total structure, check s-parameters components for plotting
64
Load Block Button
S-Parameters
components
section

Load DUT with Fixtures - TDR Contents
To plot TDR for loaded total structure click “TDR waveforms” section
65
It is possible to change delay time length value: change the value and click update button
To decrease time step, check “time step” section, enter the value and click update
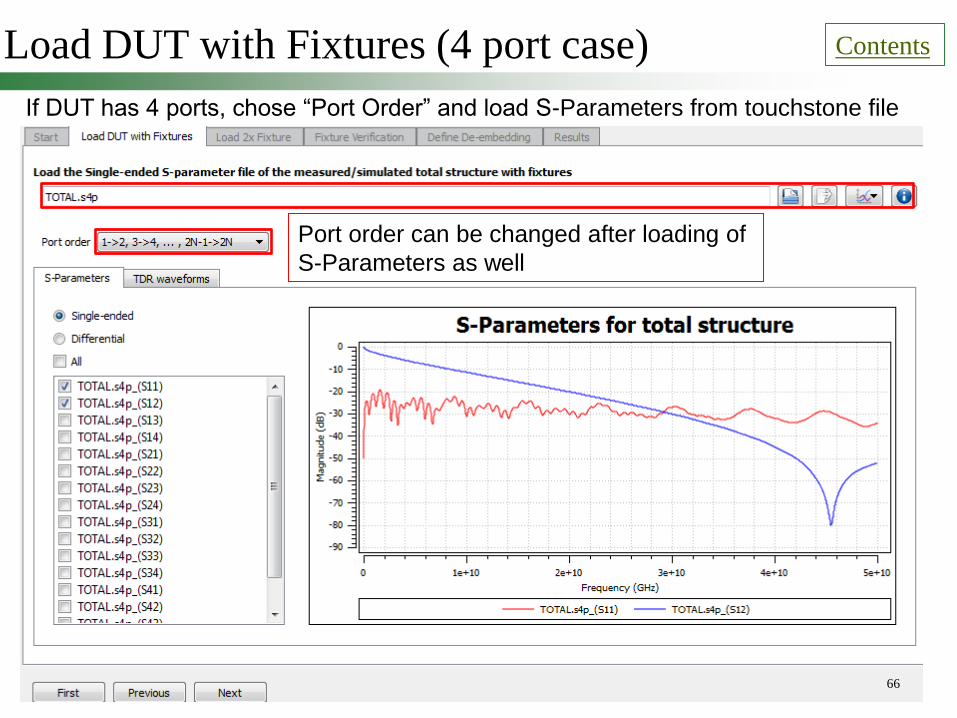
Load DUT with Fixtures (4 port case) Contents
If DUT has 4 ports, chose “Port Order” and load S-Parameters from touchstone file
66
Port order can be changed after loading of
S-Parameters as well
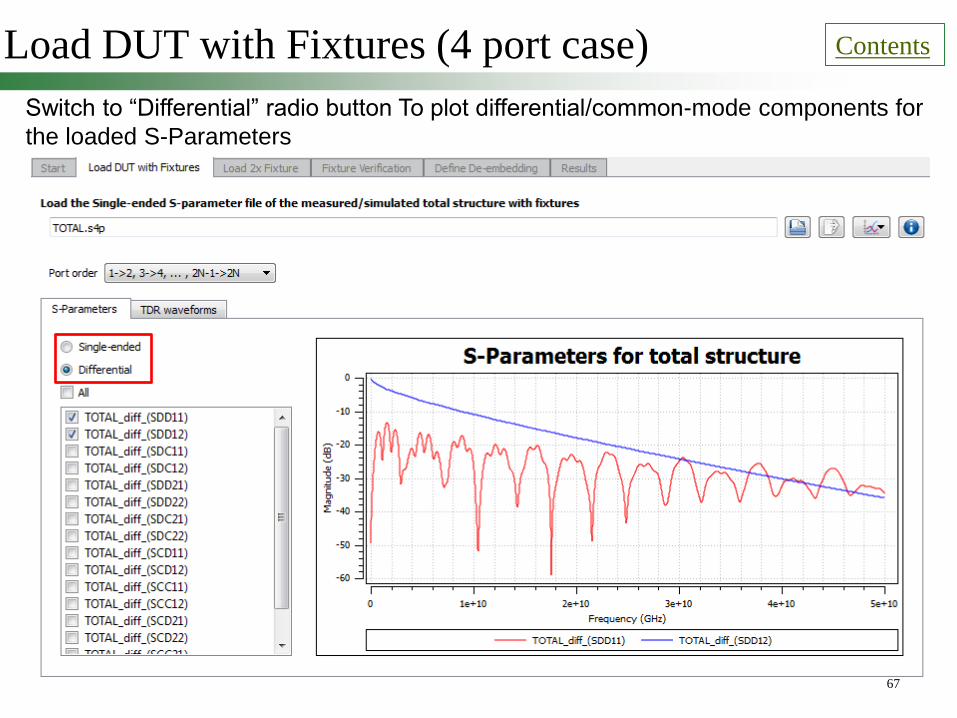
Load DUT with Fixtures (4 port case) Contents
Switch to “Differential” radio button To plot differential/common-mode components for
the loaded S-Parameters
67

Load DUT with Fixtures Differential TDR Contents
To plot differential/common-mode TDR, click “TDR” waveform section
68 To Proceed to the next stage, click “Next” button

Load 2x Fixtures Contents
If fixture is given as a symmetric 2x structure, click load 2x structure button, otherwise
skip this section. Click “Next button” to proceed to the next stage
69
To see TDR of the loaded 2x structure
click “TDR waveform” section
Load 2x
Fixture
button
Buttons for
Removing
selected and
all 2x Fixtures
To increase plot area,
click “Hide load 2x
fixture table” button
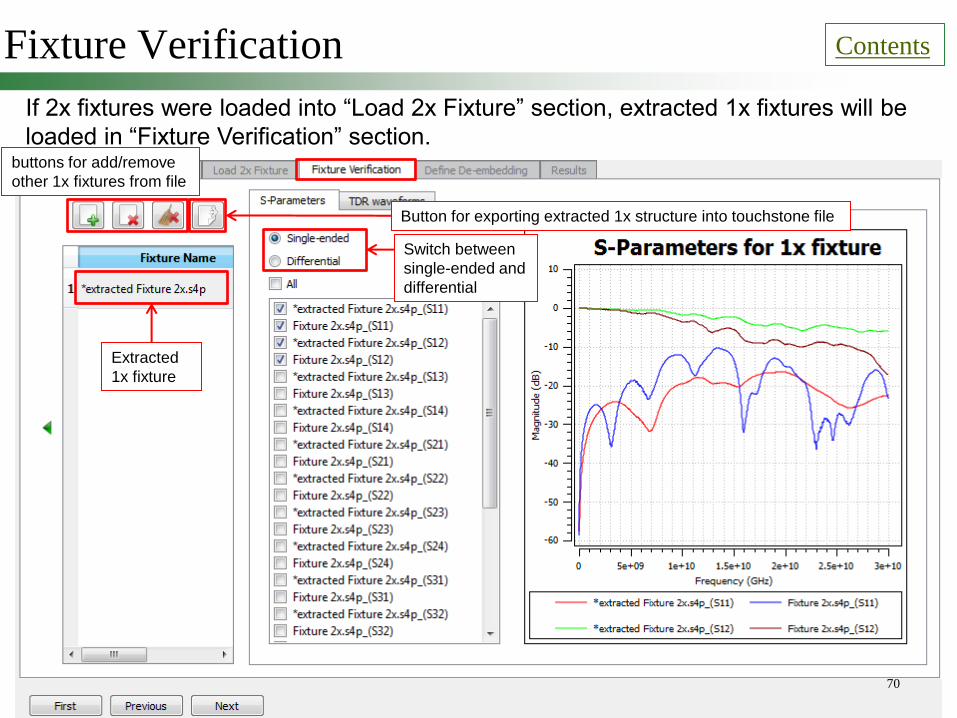
Fixture Verification Contents
If 2x fixtures were loaded into “Load 2x Fixture” section, extracted 1x fixtures will be
loaded in “Fixture Verification” section.
70
Extracted
1x fixture
buttons for add/remove
other 1x fixtures from file
Button for exporting extracted 1x structure into touchstone file
Switch between
single-ended and
differential
Fixture Verification Contents
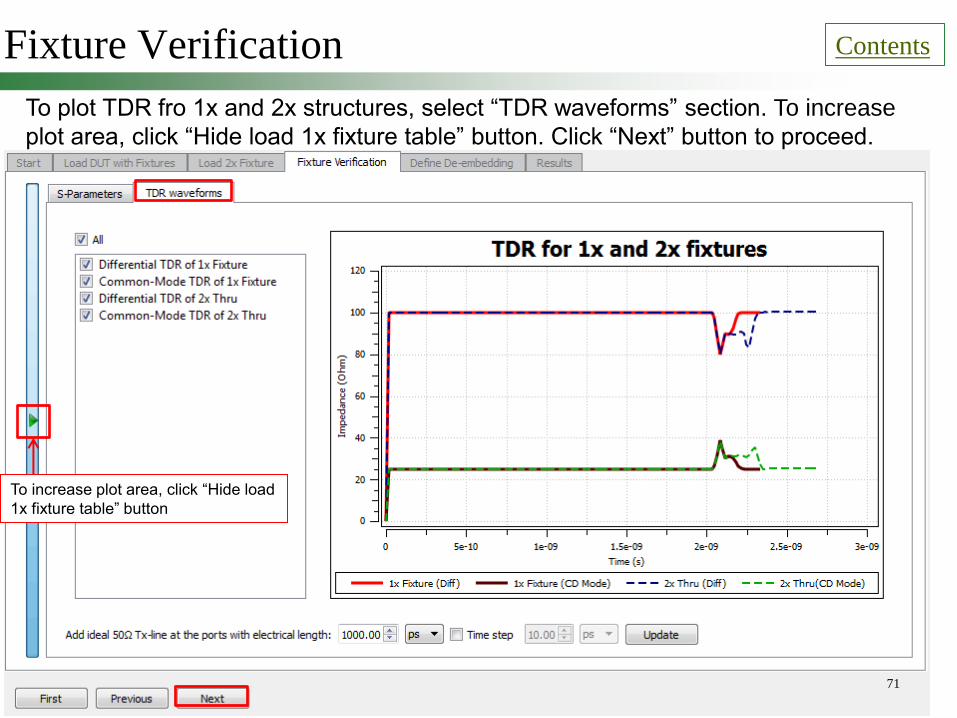
To plot TDR fro 1x and 2x structures, select “TDR waveforms” section. To increase
plot area, click “Hide load 1x fixture table” button. Click “Next” button to proceed.
71
To increase plot area, click “Hide load
1x fixture table” button
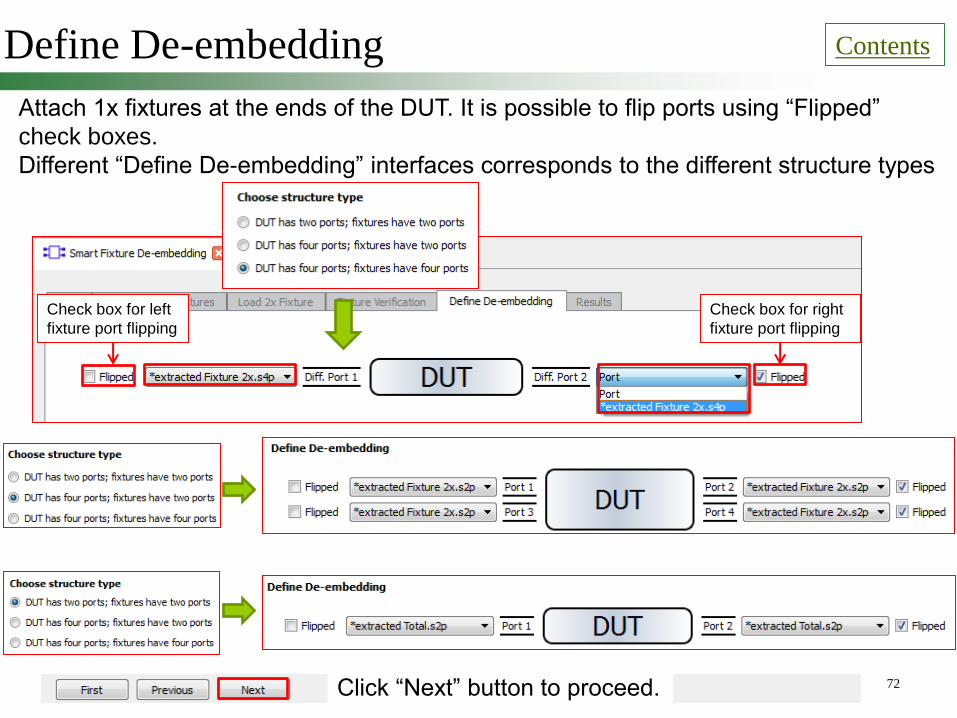
Define De-embedding Contents
Attach 1x fixtures at the ends of the DUT. It is possible to flip ports using “Flipped”
check boxes.
Different “Define De-embedding” interfaces corresponds to the different structure types
72
Check box for left
fixture port flipping
Check box for right
fixture port flipping
Click “Next” button to proceed.
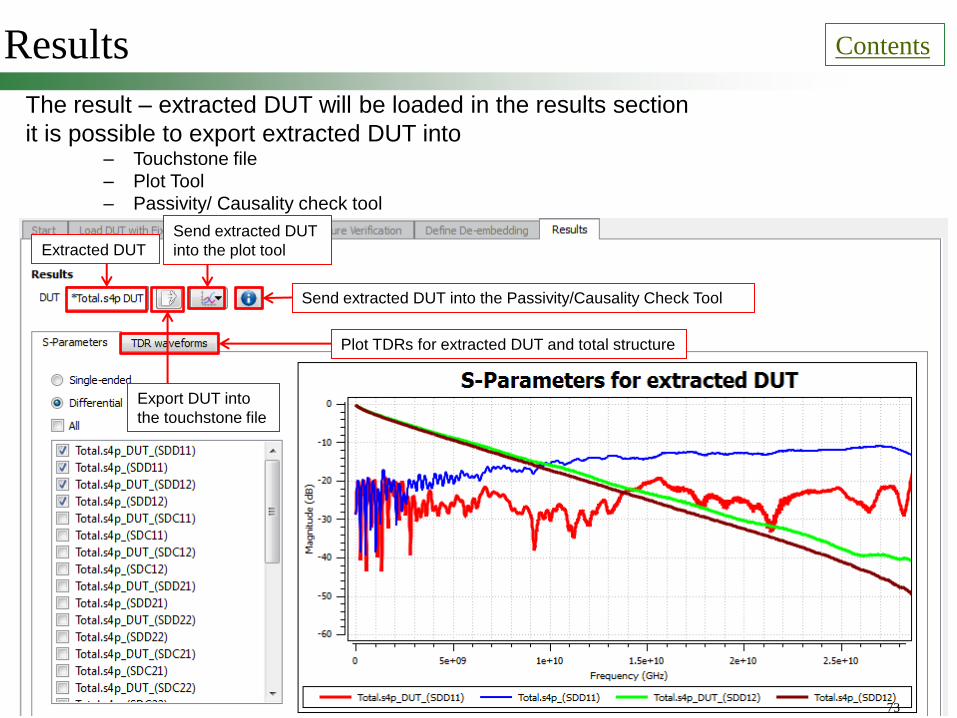
Results Contents
The result – extracted DUT will be loaded in the results section
it is possible to export extracted DUT into – Touchstone file
– Plot Tool
– Passivity/ Causality check tool
73
Extracted DUT
Plot TDRs for extracted DUT and total structure
Export DUT into
the touchstone file
Send extracted DUT
into the plot tool
Send extracted DUT into the Passivity/Causality Check Tool


![[PPT]CHAPTER 16 EXPLORATION AND EXPANSION - …s3.amazonaws.com/scschoolfiles/237/chapter_16_powerpoint... · Web viewCHAPTER 16EXPLORATION AND EXPANSIONLecture ?’sSection 1 (pages](https://img.pdfslide.us/doc/110x75/5b18d03b7f8b9a19258c28a0/pptchapter-16-exploration-and-expansion-s3-web-viewchapter-16exploration.jpg)