Embed Size (px)
Citation preview
PERFORMANCE BASED BUDGETING
for small cities
Leita Hart-Fanta, CPA Training & Professional Development
voice: 512-996-8588 www.leitahart.com
email: [email protected]
2011
These materials are copyrighted and may
not be reproduced without the express permission of Leita
Hart-Fanta.
Types of metrics Outcome Output
Efficiency Explanatory/Input
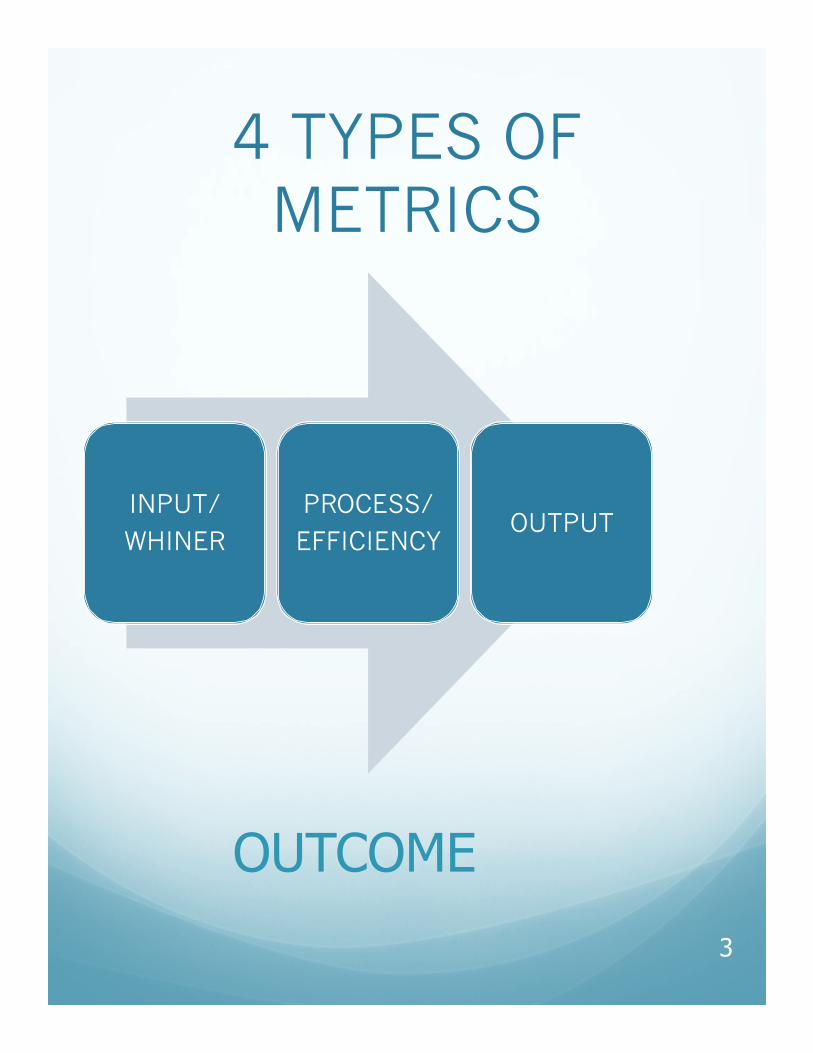
4 TYPES OF METRICS
INPUT/
WHINER
PROCESS/
EFFICIENCY OUTPUT
3
OUTCOME
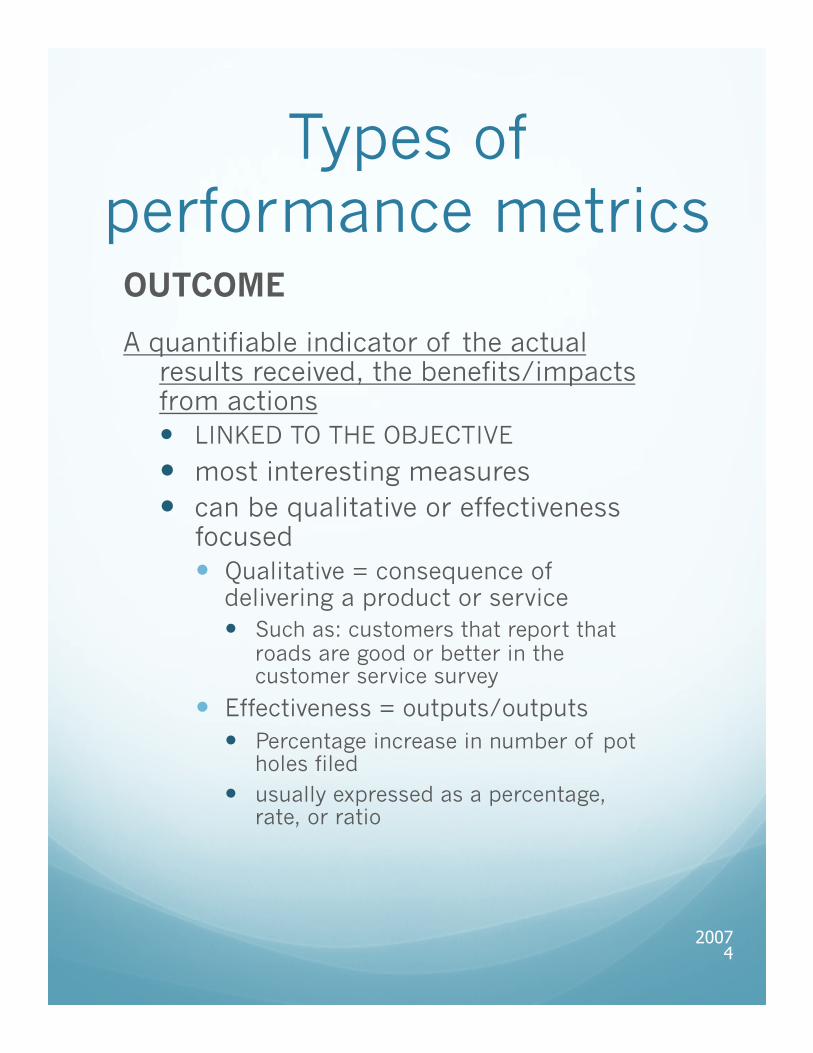
Types of performance metrics
OUTCOME
A quantifiable indicator of the actual results received, the benefits/impacts from actions � LINKED TO THE OBJECTIVE
� most interesting measures � can be qualitative or effectiveness
focused � Qualitative = consequence of
delivering a product or service � Such as: customers that report that
roads are good or better in the customer service survey
� Effectiveness = outputs/outputs � Percentage increase in number of pot
holes filed � usually expressed as a percentage,
rate, or ratio
2007 4
Types of performance metrics
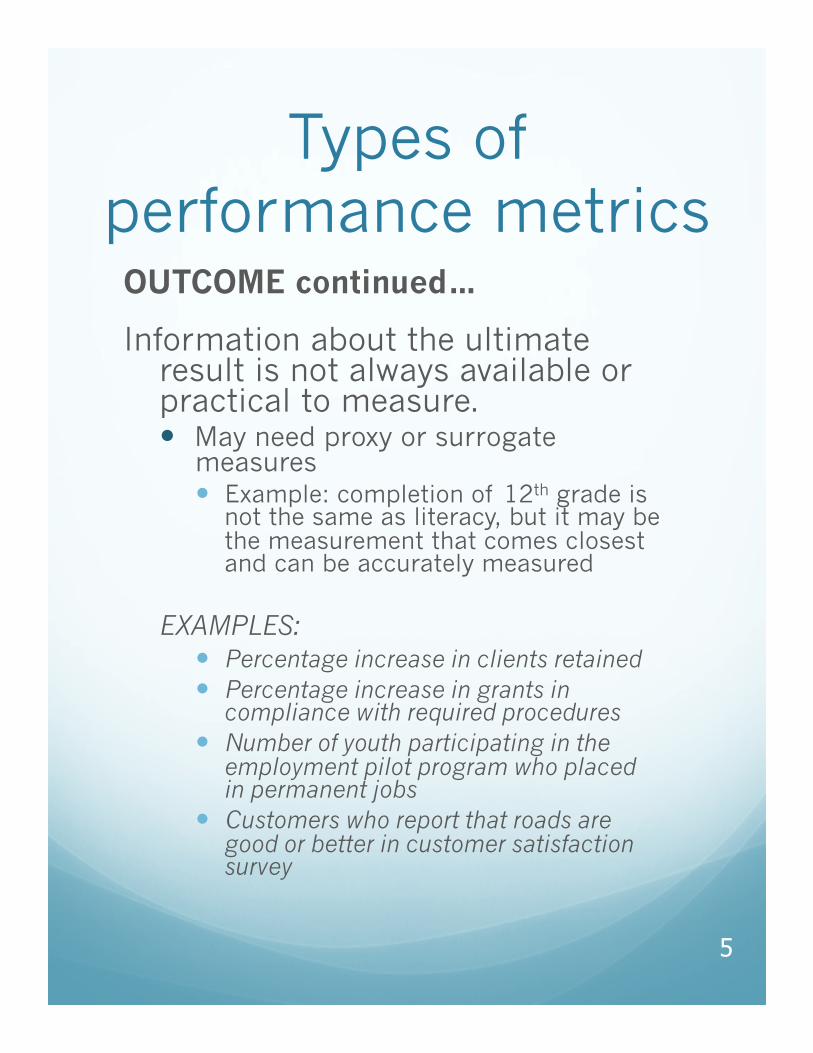
OUTCOME continued…
Information about the ultimate result is not always available or practical to measure. � May need proxy or surrogate
measures � Example: completion of 12th grade is
not the same as literacy, but it may be the measurement that comes closest and can be accurately measured
EXAMPLES: � Percentage increase in clients retained � Percentage increase in grants in
compliance with required procedures � Number of youth participating in the
employment pilot program who placed in permanent jobs
� Customers who report that roads are good or better in customer satisfaction survey
5
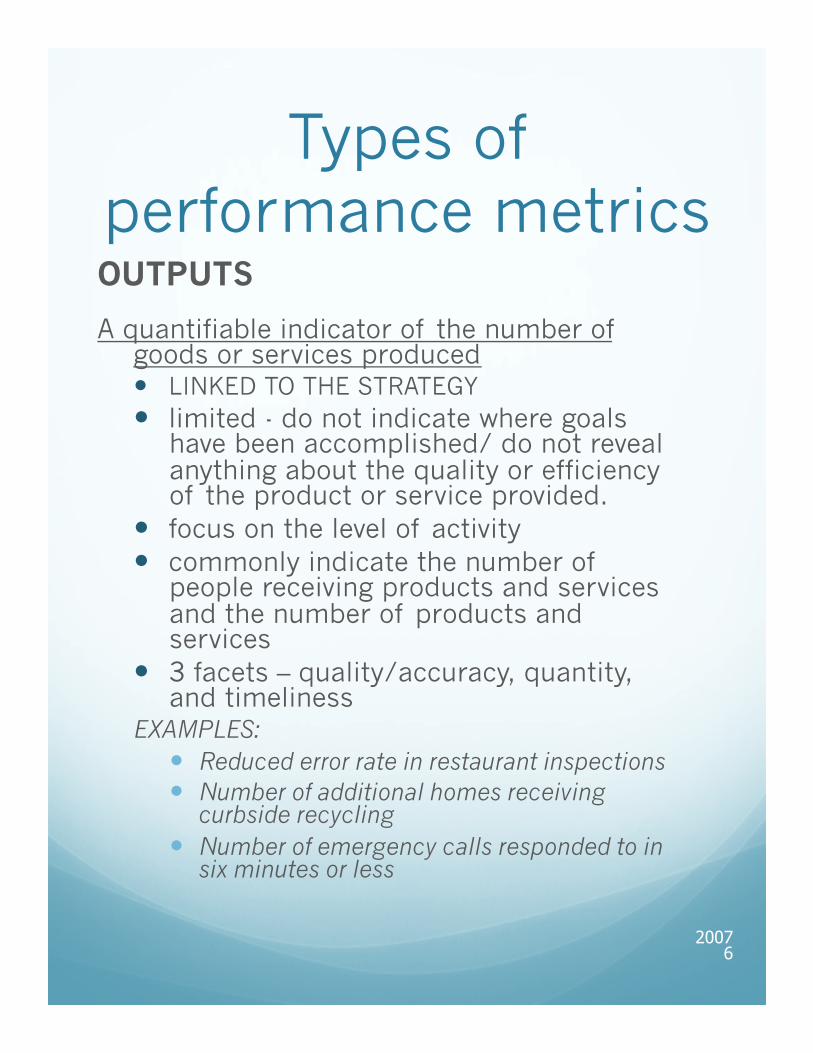
Types of performance metrics OUTPUTS
A quantifiable indicator of the number of goods or services produced � LINKED TO THE STRATEGY � limited - do not indicate where goals
have been accomplished/ do not reveal anything about the quality or efficiency of the product or service provided.
� focus on the level of activity � commonly indicate the number of
people receiving products and services and the number of products and services
� 3 facets – quality/accuracy, quantity, and timeliness
EXAMPLES: � Reduced error rate in restaurant inspections � Number of additional homes receiving
curbside recycling � Number of emergency calls responded to in
six minutes or less
2007 6
More meaningful metrics
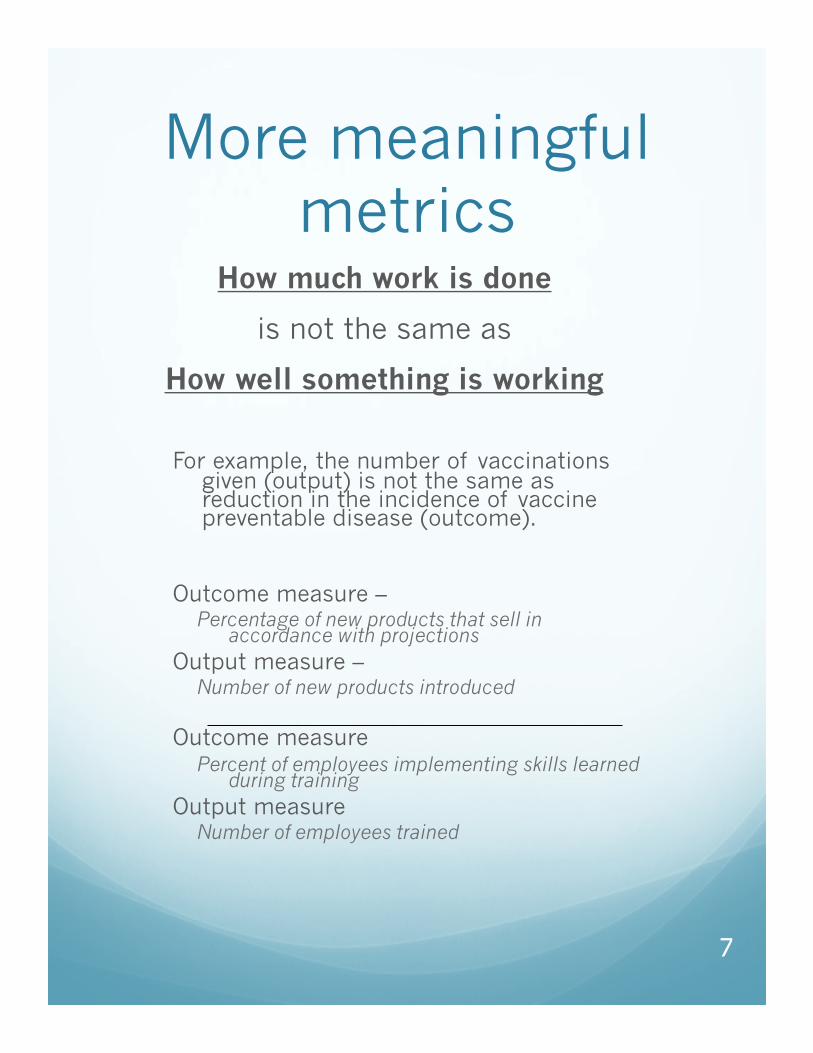
How much work is done
is not the same as
How well something is working
For example, the number of vaccinations
given (output) is not the same as reduction in the incidence of vaccine preventable disease (outcome).
Outcome measure –
Percentage of new products that sell in accordance with projections
Output measure – Number of new products introduced
Outcome measure Percent of employees implementing skills learned
during training Output measure
Number of employees trained
7
Types of performance metrics
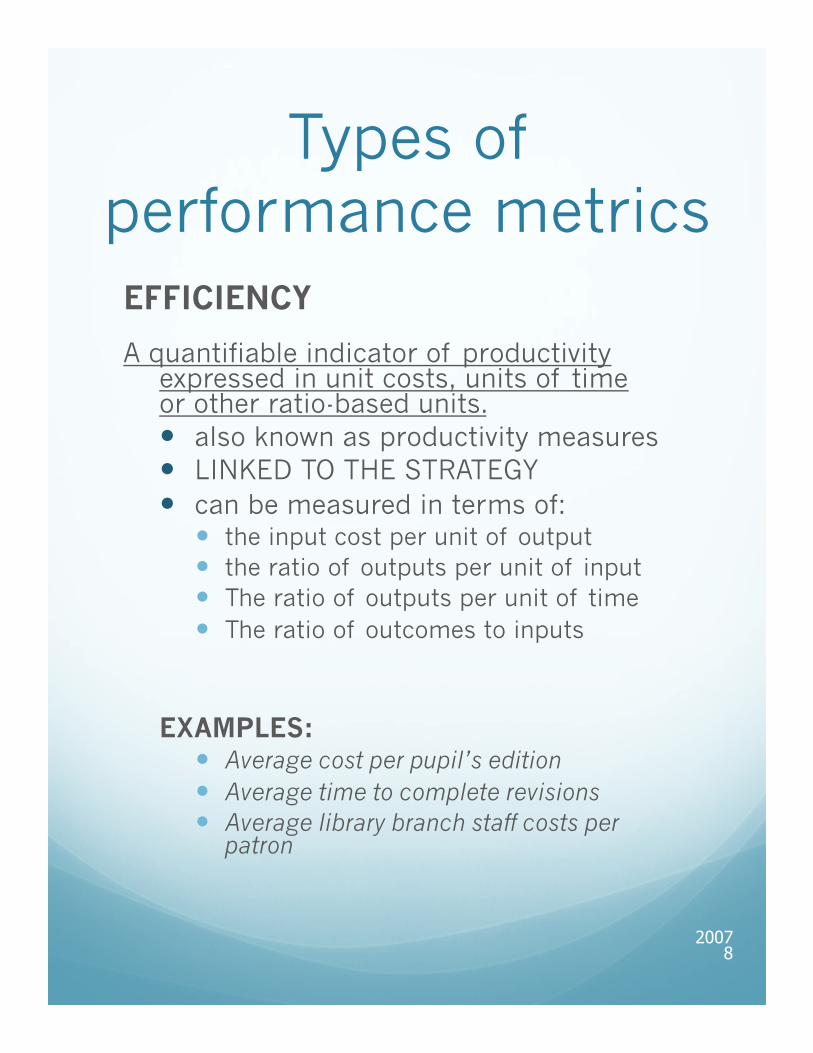
EFFICIENCY
A quantifiable indicator of productivity expressed in unit costs, units of time or other ratio-based units. � also known as productivity measures � LINKED TO THE STRATEGY � can be measured in terms of:
� the input cost per unit of output � the ratio of outputs per unit of input � The ratio of outputs per unit of time � The ratio of outcomes to inputs
EXAMPLES: � Average cost per pupil’s edition � Average time to complete revisions � Average library branch staff costs per
patron
2007 8
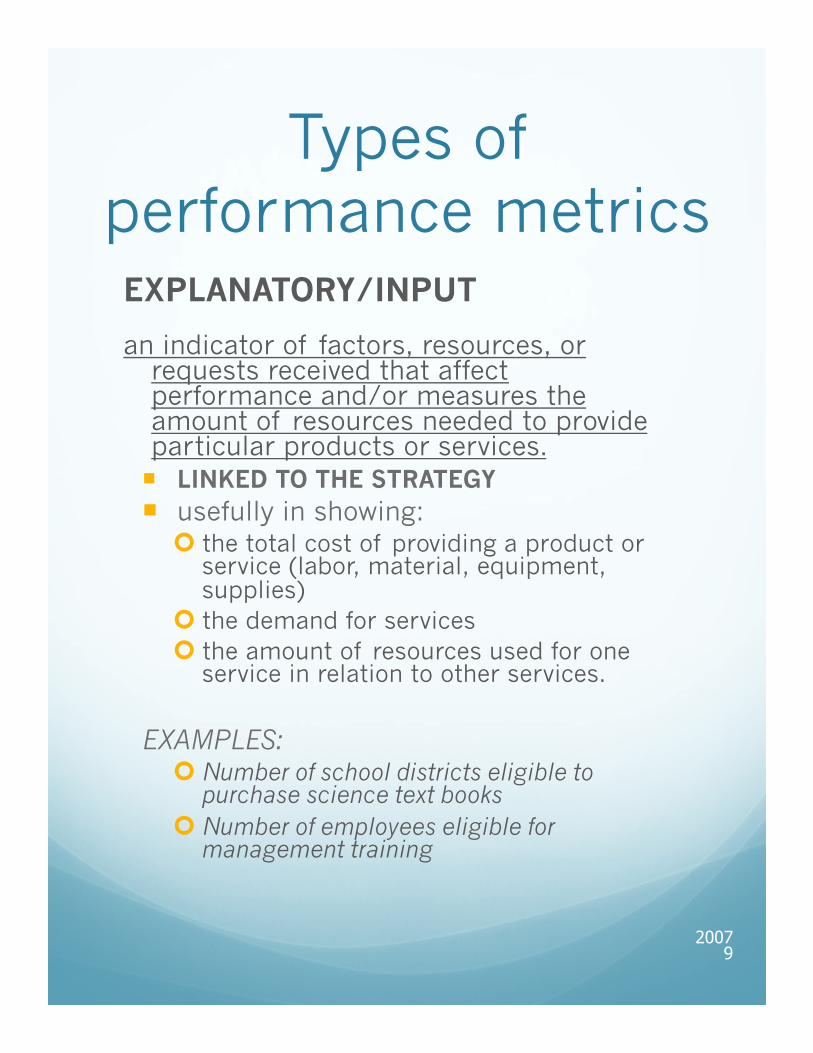
Types of performance metrics
EXPLANATORY/INPUT
an indicator of factors, resources, or requests received that affect performance and/or measures the amount of resources needed to provide particular products or services. ¡ LINKED TO THE STRATEGY ¡ usefully in showing:
¢ the total cost of providing a product or service (labor, material, equipment, supplies)
¢ the demand for services ¢ the amount of resources used for one
service in relation to other services.
EXAMPLES: ¢ Number of school districts eligible to
purchase science text books ¢ Number of employees eligible for
management training
2007 9
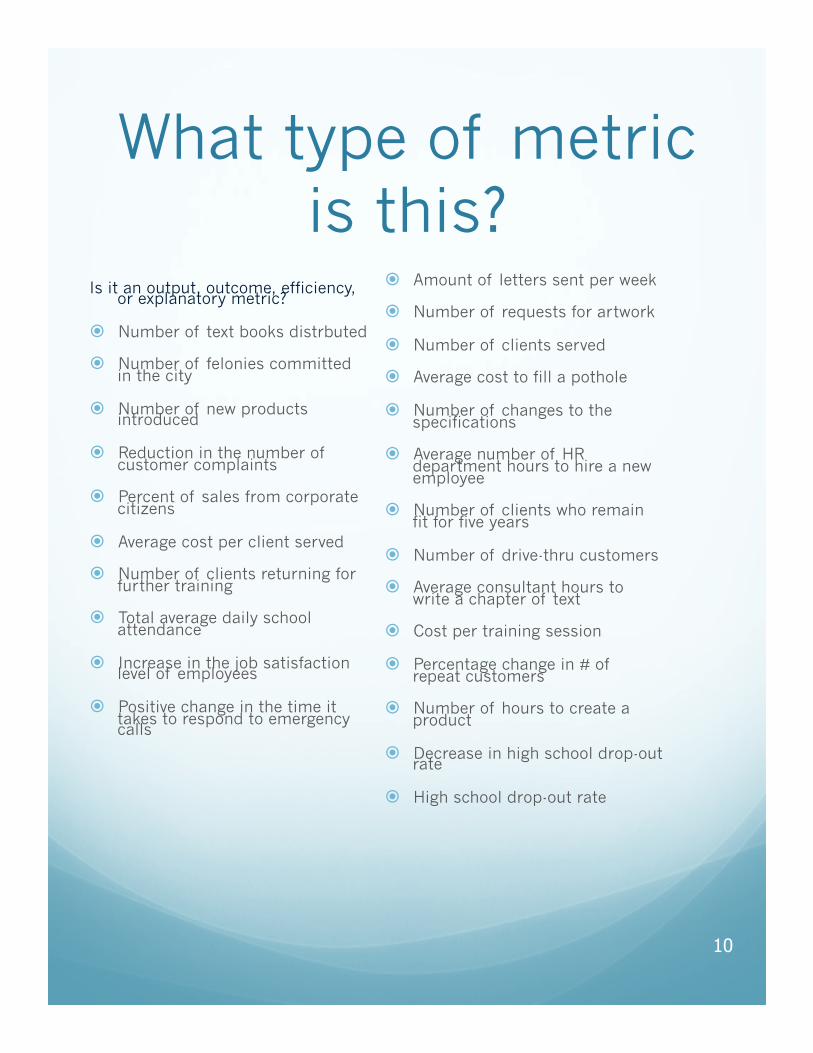
What type of metric is this?
Is it an output, outcome, efficiency, or explanatory metric?
� Number of text books distrbuted
� Number of felonies committed in the city
� Number of new products introduced
� Reduction in the number of customer complaints
� Percent of sales from corporate citizens
� Average cost per client served
� Number of clients returning for further training
� Total average daily school attendance
� Increase in the job satisfaction level of employees
� Positive change in the time it takes to respond to emergency calls
� Amount of letters sent per week
� Number of requests for artwork
� Number of clients served
� Average cost to fill a pothole
� Number of changes to the specifications
� Average number of HR department hours to hire a new employee
� Number of clients who remain fit for five years
� Number of drive-thru customers
� Average consultant hours to write a chapter of text
� Cost per training session
� Percentage change in # of repeat customers
� Number of hours to create a product
� Decrease in high school drop-out rate
� High school drop-out rate
10

Scenarios � Collect stray/
dangerous animals
� Keep water in public pool clean
� Teach grammar school children about bike safety
� Please develop the following metrics: � Input
� Process/efficiency
� Output
� Do not develop the outcome metric
� In other words, don’t worry about WHY you are doing it – JUST DO IT!
11

Where are you?

Capability Maturity Model
Non-existent
Initial Repeat-able
Defined Managed Optimized
0 : : :
1 : : :
2 : : :
3 : : :
4 : : :
5 : : :
13
0 – management process are not applied at all
1 – processes are ad hoc and disorganized
2 – processes follow a regular pattern
3 – processes are documented and communicated
4 – processes are monitored and measured
5 – good practices are followed and automated
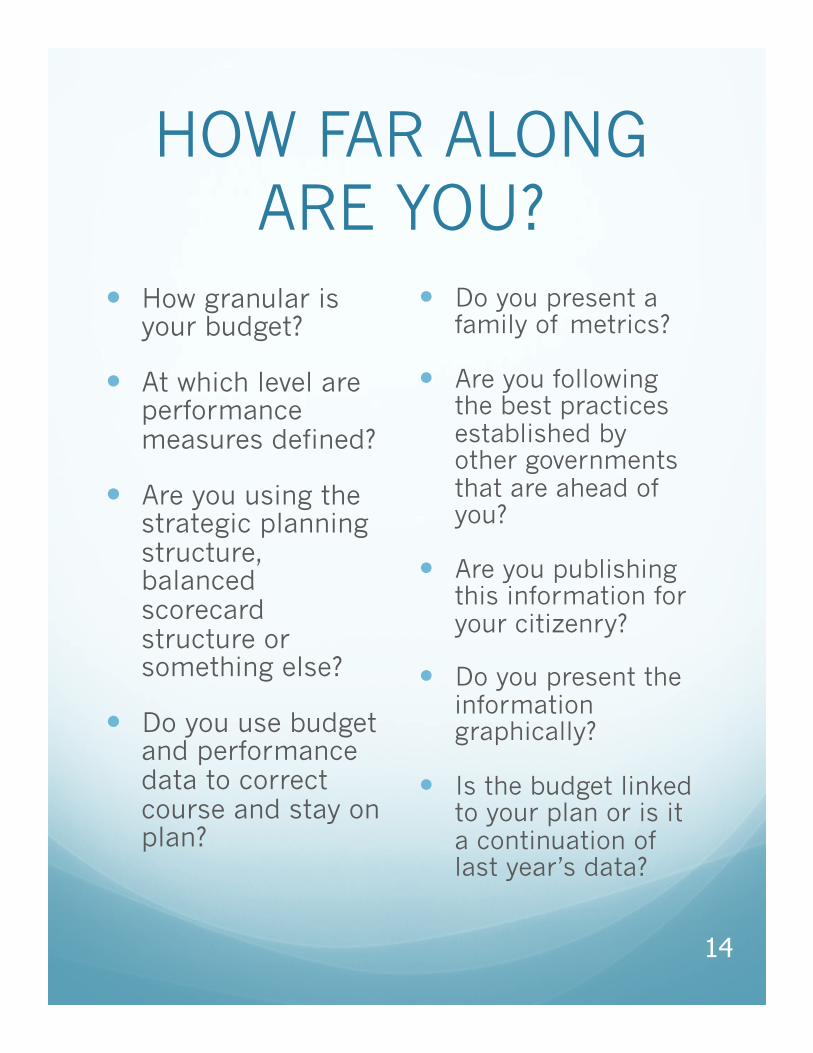
HOW FAR ALONG ARE YOU?
� How granular is your budget?
� At which level are performance measures defined?
� Are you using the strategic planning structure, balanced scorecard structure or something else?
� Do you use budget and performance data to correct course and stay on plan?
� Do you present a family of metrics?
� Are you following the best practices established by other governments that are ahead of you?
� Are you publishing this information for your citizenry?
� Do you present the information graphically?
� Is the budget linked to your plan or is it a continuation of last year’s data?
14
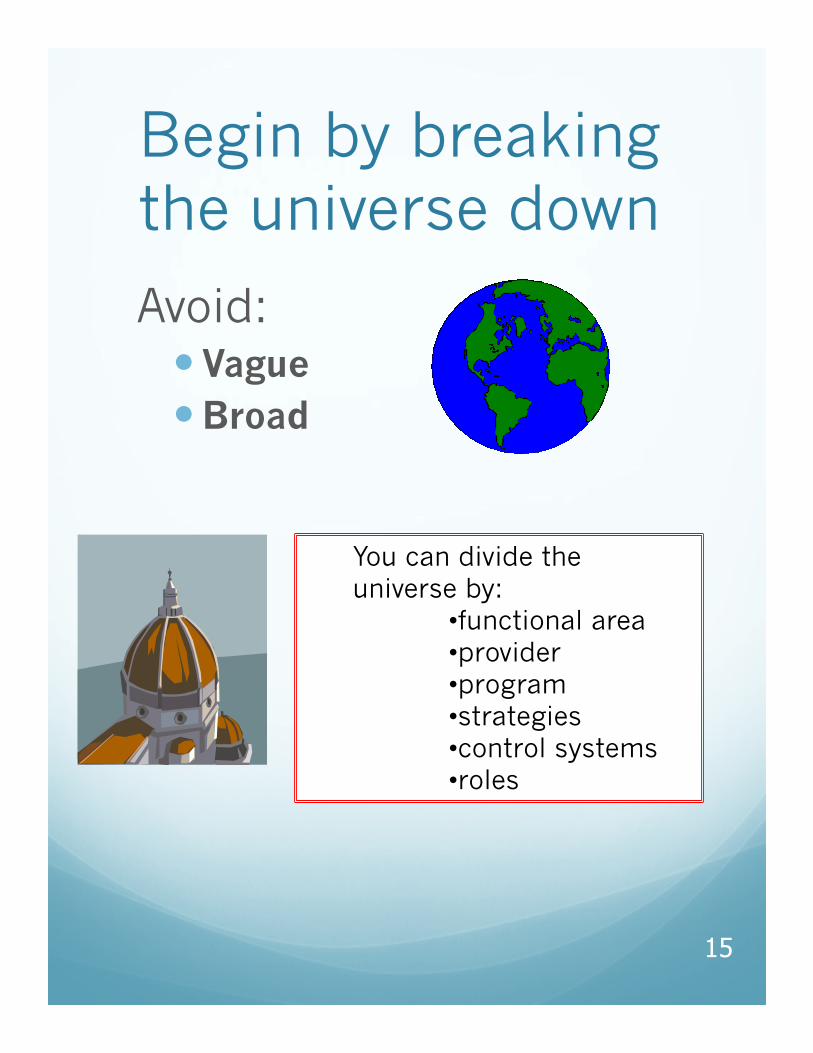
Begin by breaking the universe down
Avoid: � Vague � Broad
15
You can divide the universe by:
• functional area • provider • program • strategies • control systems • roles

Line Item Budgets vs. Performance Budgets
Line Item
Salaries $371,917
Fringes $118.069
Supplies $76,745
Equipment $23,614
TOTAL $590,345
Performance Budgeting
Help Desk $130,600
Upgrades $240,789
New Systems $175,203
Data Security $ 43,753
TOTAL $590,345
Your budget can reflect what you DO instead of what general ledger accounts you use.
16

3 buzzwords of any measurement
system
Accountability Transparency
Focus
Results = describe the strategy + measure the strategy + manage the strategy
You can’t manage what you can’t measure. You can’t measure what you can’t describe.
17
What is the information worth?
Frequency & Accuracy
cost
Time & Money
2007 18

A Budget is...
A budget is the translation of the future plans of the organization into financial terms.
Vision without action is a daydream. Action without vision is a nightmare.
-Japanese Proverb
19
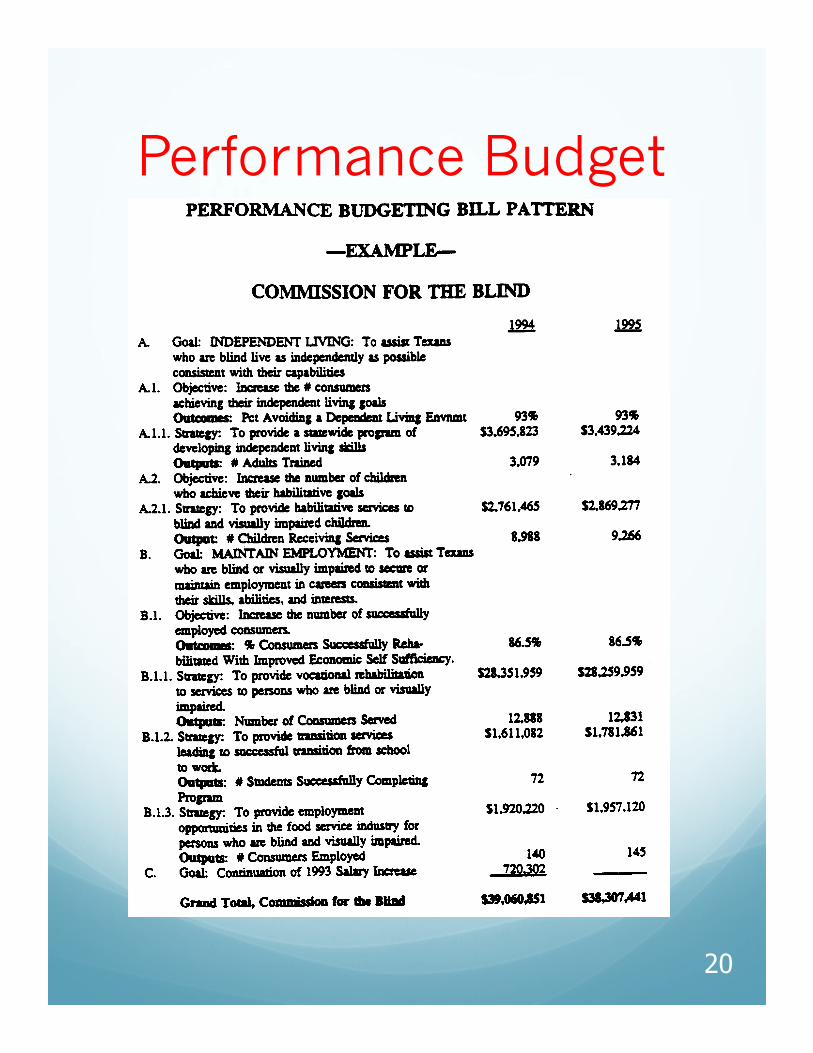
Performance Budget
20
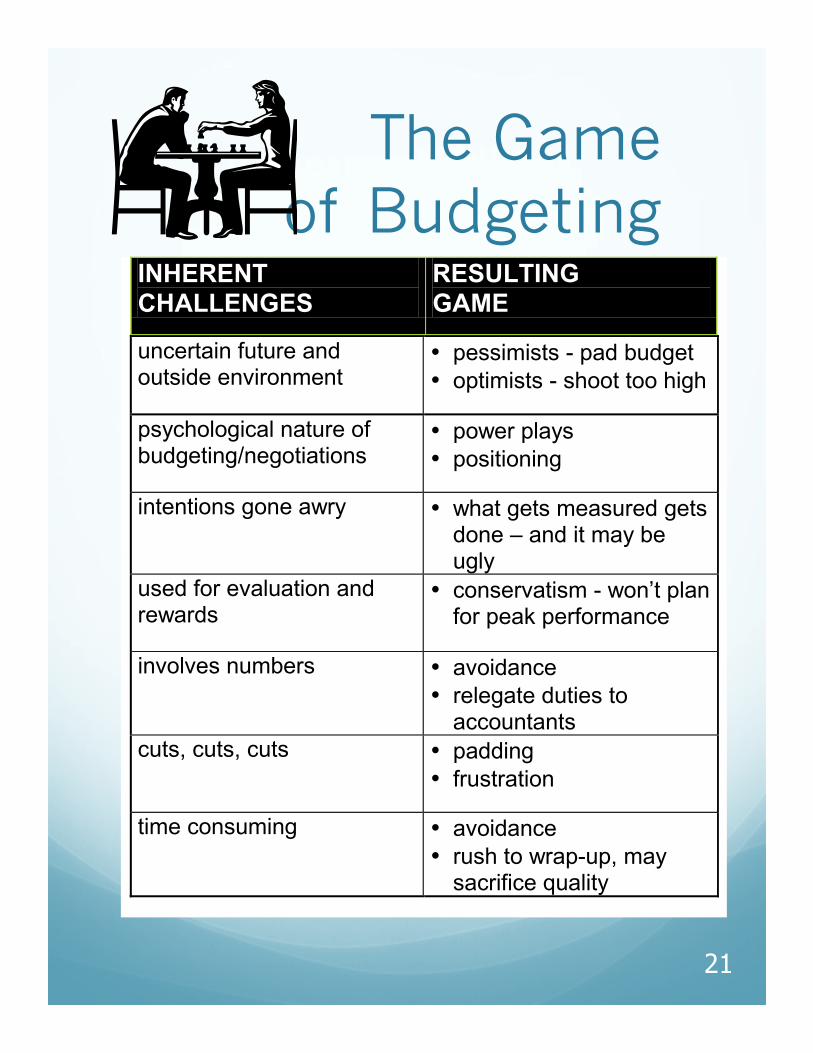
The Game of Budgeting
INHERENT CHALLENGES
RESULTING GAME
uncertain future and outside environment
• pessimists - pad budget • optimists - shoot too high
psychological nature of budgeting/negotiations
• power plays • positioning
intentions gone awry • what gets measured gets done – and it may be ugly
used for evaluation and rewards
• conservatism - won’t plan for peak performance
involves numbers • avoidance • relegate duties to
accountants cuts, cuts, cuts • padding
• frustration
time consuming • avoidance • rush to wrap-up, may
sacrifice quality
21

Getting Organized
Getting granular � List the core functions of your whole
government
� Take one core function and list what their purposes
� Consider the environment the function operates under
� Rank the purposes as � Luxury � Nicety
� Necessity
23
SWOT Analysis
STRENGTHS WEAKNESSES
OPPORTUNITES THREATS
24
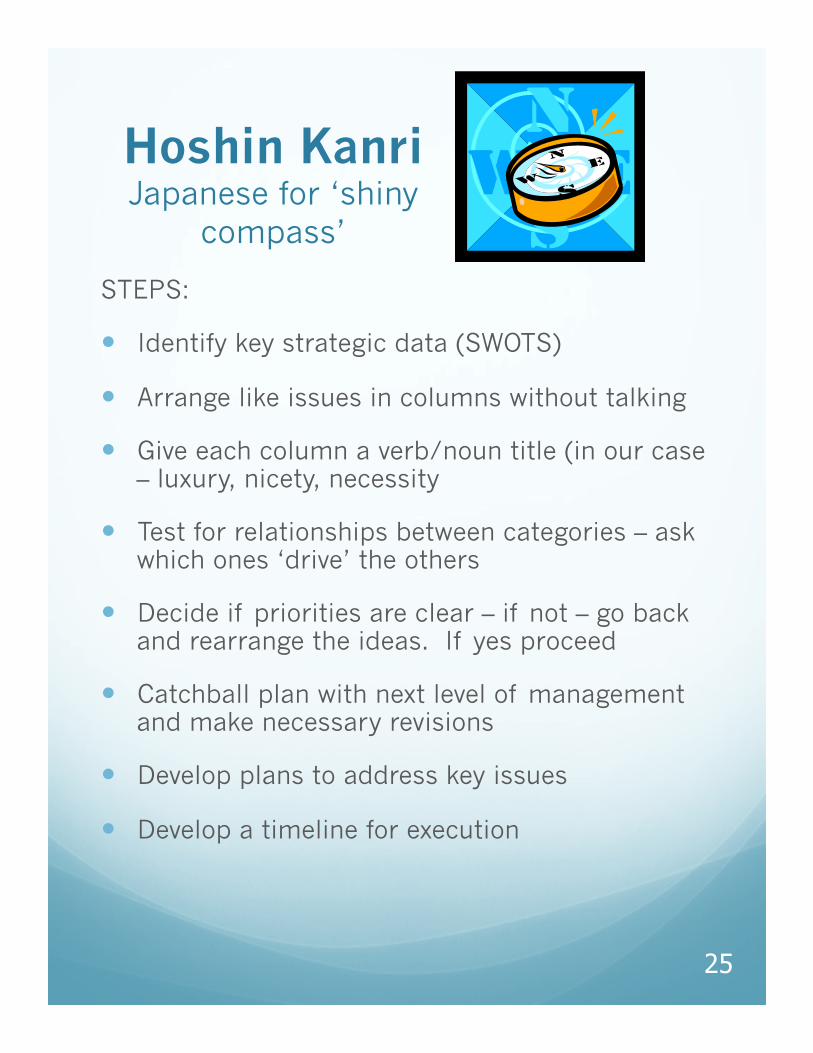
Hoshin Kanri Japanese for ‘shiny
compass’
STEPS:
� Identify key strategic data (SWOTS)
� Arrange like issues in columns without talking
� Give each column a verb/noun title (in our case – luxury, nicety, necessity
� Test for relationships between categories – ask which ones ‘drive’ the others
� Decide if priorities are clear – if not – go back and rearrange the ideas. If yes proceed
� Catchball plan with next level of management and make necessary revisions
� Develop plans to address key issues
� Develop a timeline for execution
25
Arrange like issues in columns without
talking � Talking is not
allowed
� If you disagree on where the note goes MOVE IT without verbal debate. The other person can move it back, without verbal debate, too.
� Do not sort into strengths, weaknesses, opportunities, or threats or ‘good and bad’ 200
7 26

Diagnostic questions
PRODUCT OR SERVICE QUESTIONS � What is the service your group will
provide?
� To whom would you provide your services?
� Will they have a lasting effect, or require renewal, and how often?
� Are there any regional, national, legal, or specific limiting factors that I need to know about regarding the product or service I am providing?
27

Diagnostic questions
RESOURCE & FINANCING QUESTIONS � How will you finance your group?
Taxes, fees, debt? � How will you staff your group,
particularly its key positions? � Do you have a history with the
financial behavior service? In other words, have you been providing it for a while?
� What are the trends with resource inflows and outflows?
2007
28
Diagnostic questions
� LONG-TERM PLANNING QUESTIONS � When will I need to expand to keep up
with demand? How will I know? � What happens if I make a mistake?
� How to I keep up with and ensure flexibility with changing customer, environmental, regional, and regulatory conditions?
29

Drilling down using structure
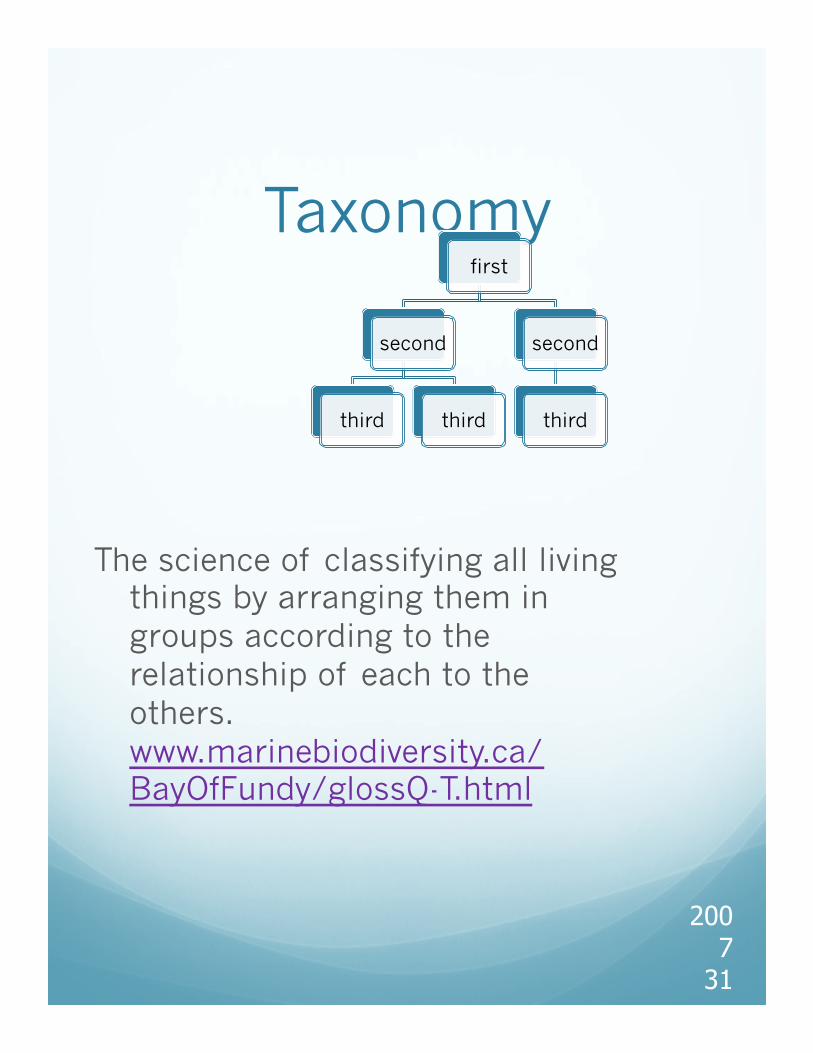
Taxonomy
The science of classifying all living things by arranging them in groups according to the relationship of each to the others. www.marinebiodiversity.ca/BayOfFundy/glossQ-T.html
2007
31
first
second
third third
second
third
Questions to answer � Who are your customers?
� What does your main customer want and not want?
� How are your going to give that customer what they want or prevent them from getting what they don’t want?
32
2007 33
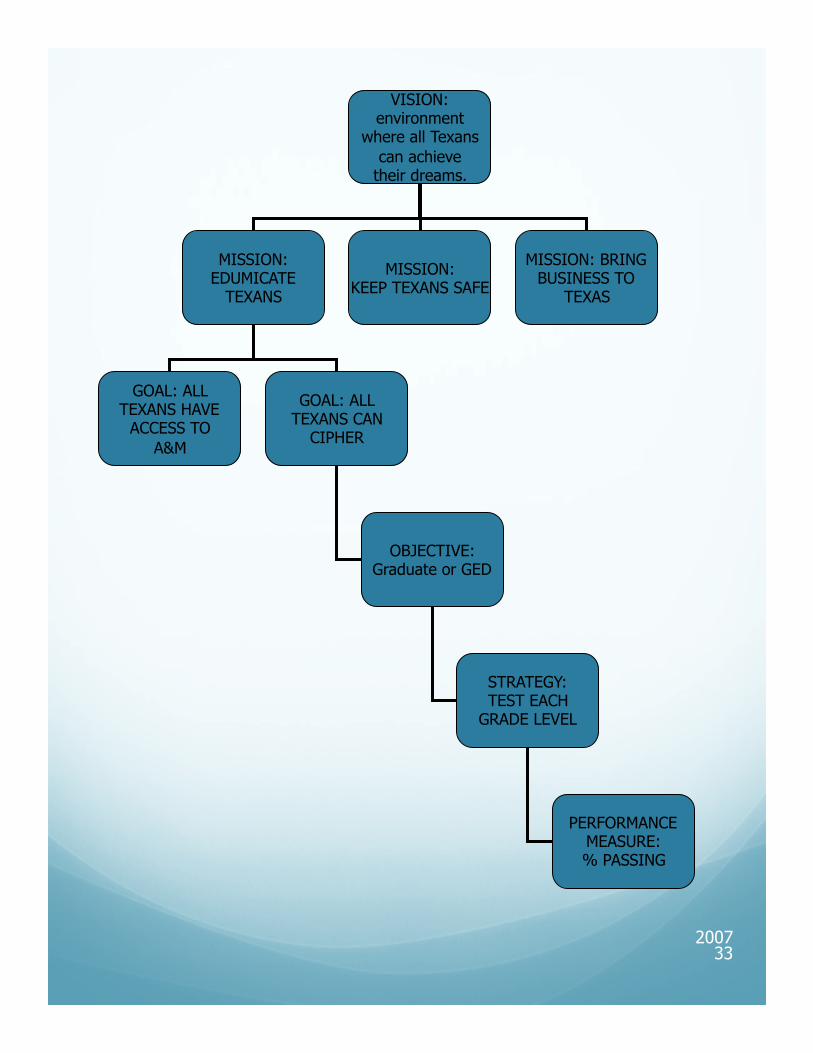
VISION: environment
where all Texans can achieve
their dreams.
MISSION: EDUMICATE
TEXANS
MISSION: KEEP TEXANS SAFE
MISSION: BRING BUSINESS TO
TEXAS
GOAL: ALL TEXANS HAVE
ACCESS TO A&M
GOAL: ALL TEXANS CAN
CIPHER
OBJECTIVE: Graduate or GED
STRATEGY: TEST EACH
GRADE LEVEL
PERFORMANCE MEASURE: % PASSING
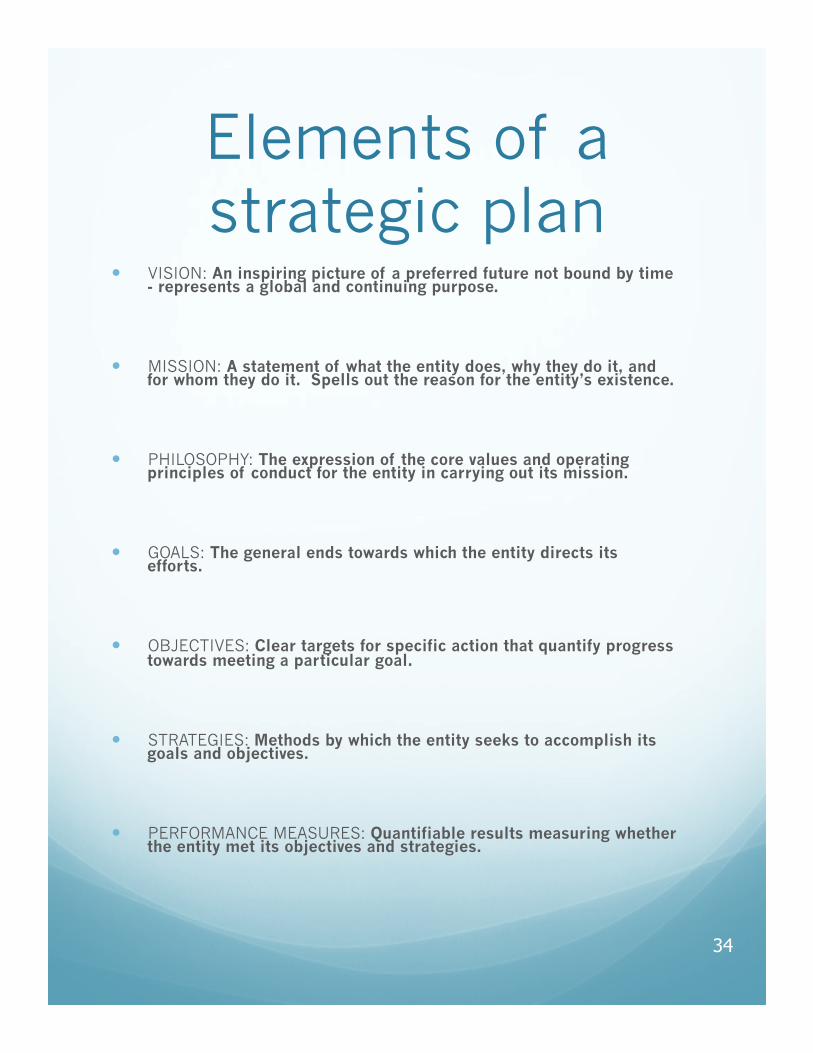
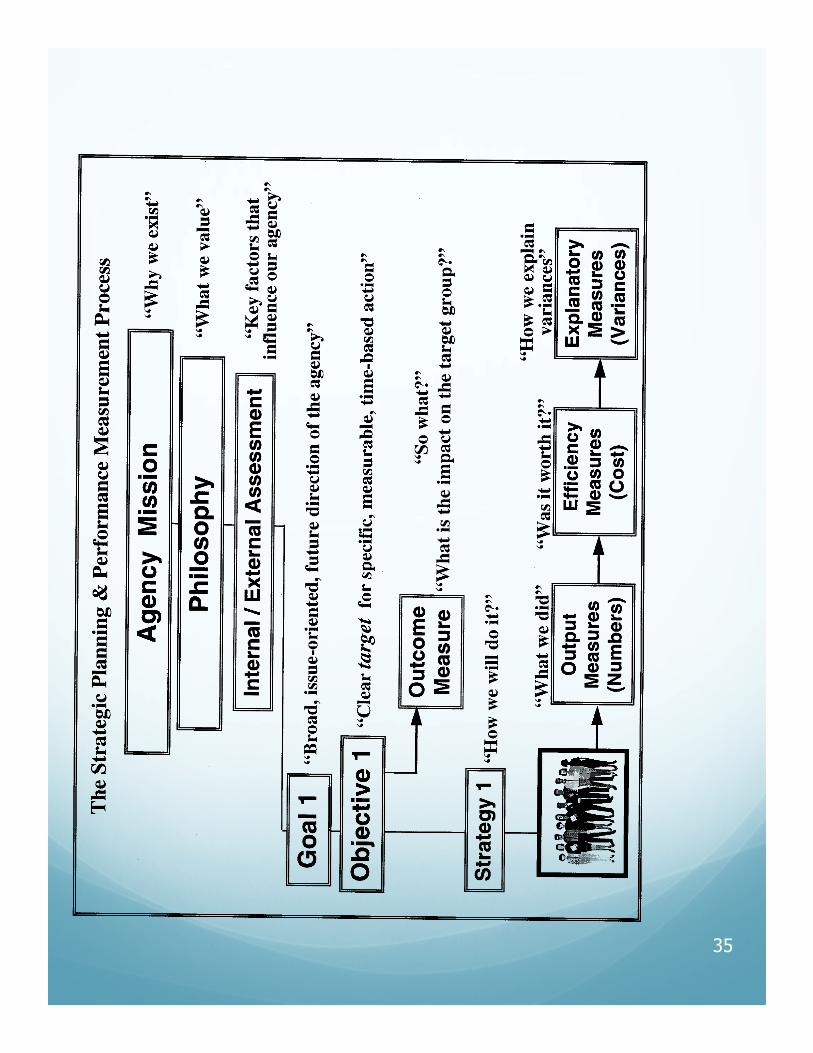
Elements of a strategic plan
� VISION: An inspiring picture of a preferred future not bound by time - represents a global and continuing purpose.
� MISSION: A statement of what the entity does, why they do it, and for whom they do it. Spells out the reason for the entity’s existence.
� PHILOSOPHY: The expression of the core values and operating principles of conduct for the entity in carrying out its mission.
� GOALS: The general ends towards which the entity directs its efforts.
� OBJECTIVES: Clear targets for specific action that quantify progress towards meeting a particular goal.
� STRATEGIES: Methods by which the entity seeks to accomplish its goals and objectives.
� PERFORMANCE MEASURES: Quantifiable results measuring whether the entity met its objectives and strategies.
34
35
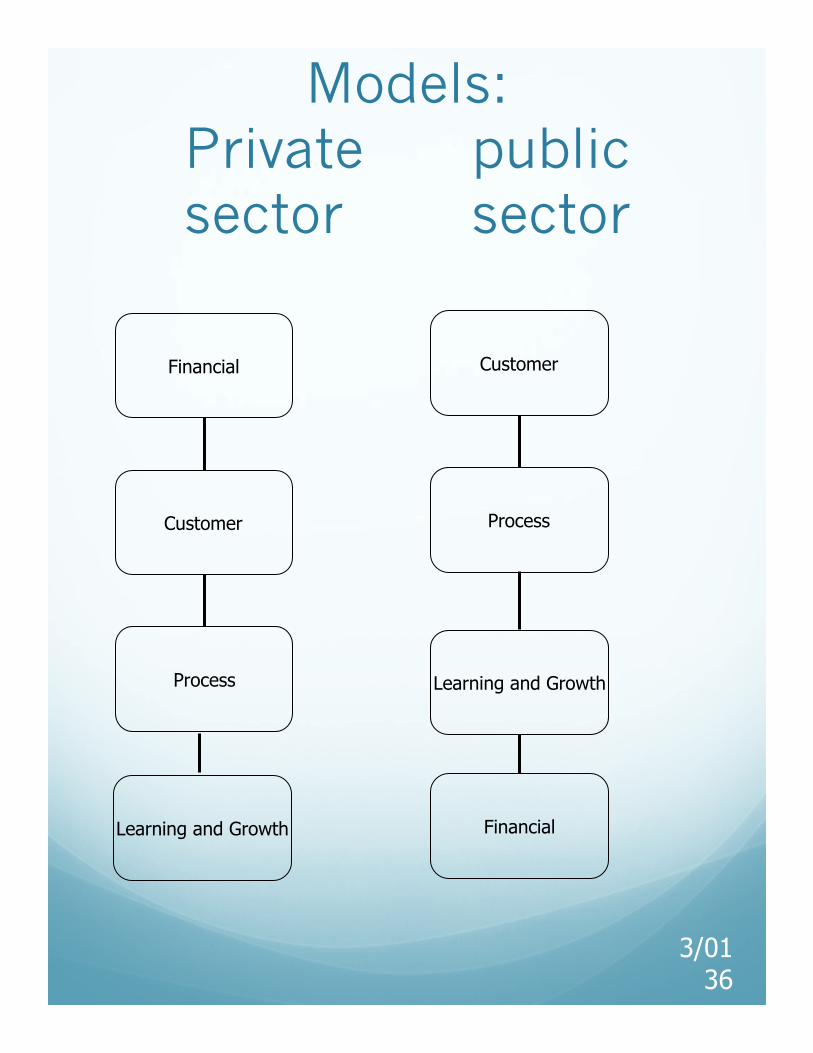
Models: Private public sector sector
3/01
36
Financial
Customer
Process
Learning and Growth
Customer
Process
Learning and Growth
Financial
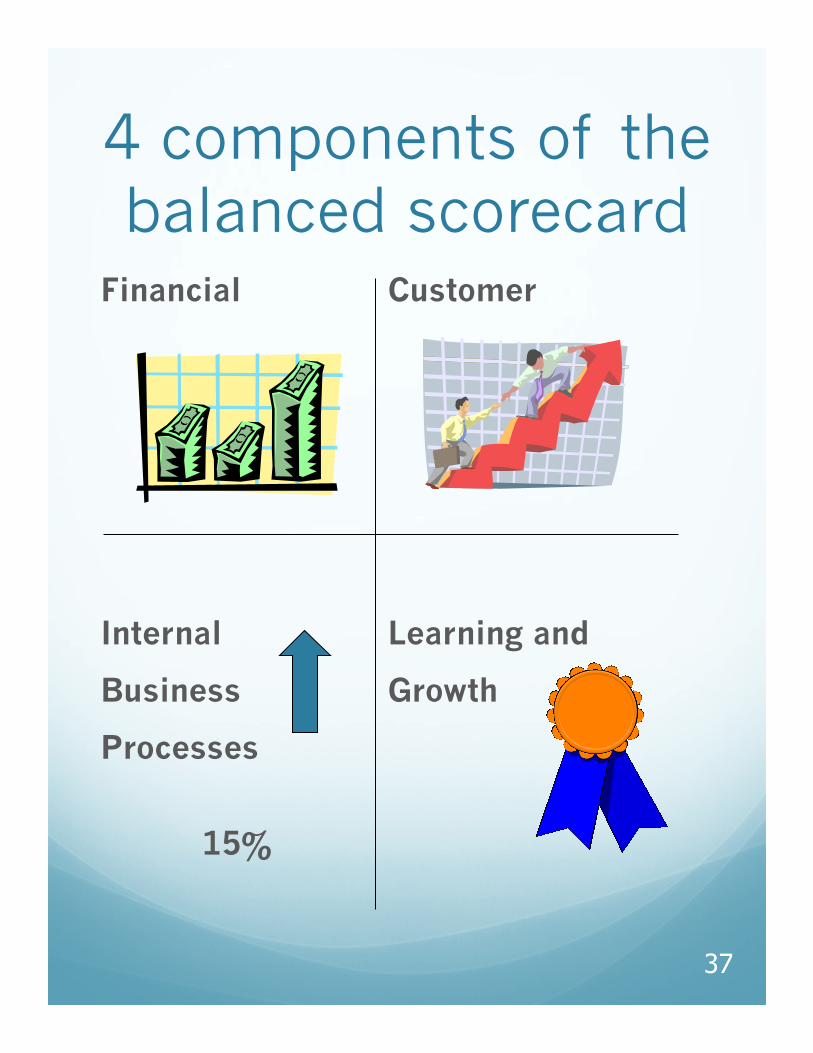
4 components of the balanced scorecard
Financial Customer
Internal Learning and
Business Growth
Processes
15%
37
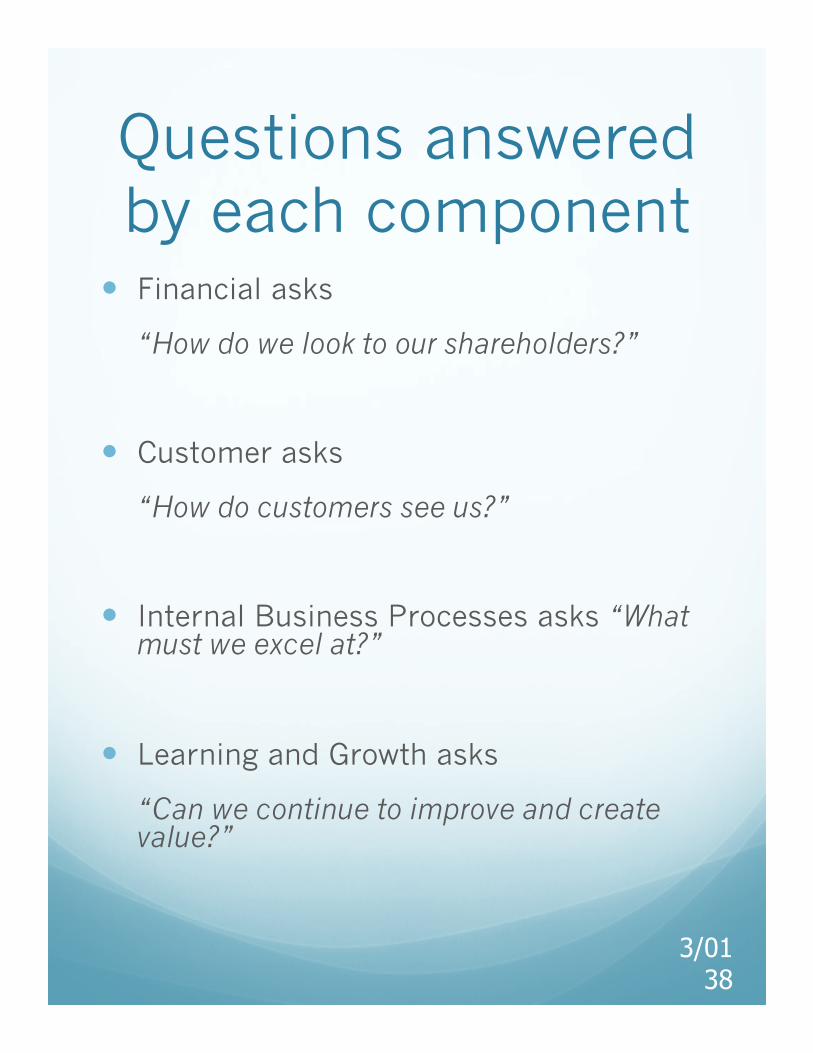
Questions answered by each component
� Financial asks
“How do we look to our shareholders?”
� Customer asks
“How do customers see us?”
� Internal Business Processes asks “What must we excel at?”
� Learning and Growth asks
“Can we continue to improve and create value?”
3/01
38

Kaplan and Norton’s Strategy Map

Simple strategy map
FINANCIAL Long term shareholder value
Productivity strategy Growth strategy
Improve cost
structure
Increase asset
utilization
Expand revenue
opportunities
Enhance customer
value
CUSTOMER Product or Service Attributes
Relationship Image
INTERNAL Operations mgt
processes
Customer mgt
processes
Innovation processes
Regulatory and social processes
LEARNING AND GROWTH
Human capital
Information capital
Organization capital
40
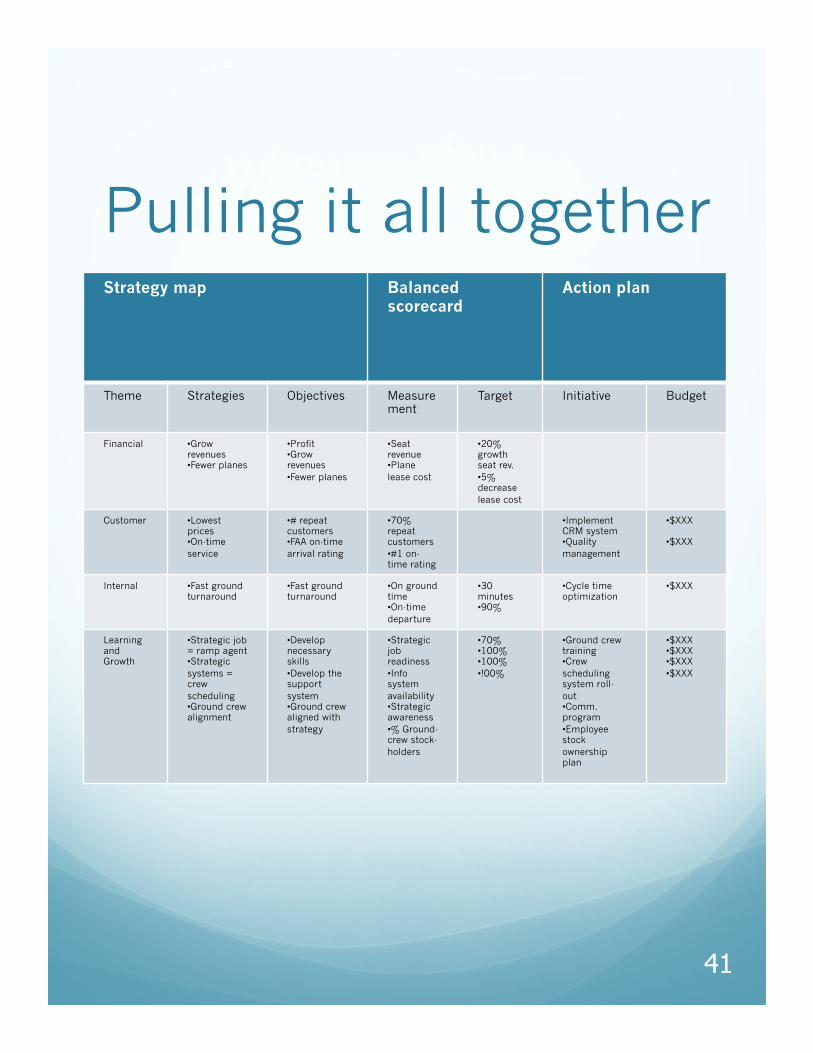
Pulling it all together Strategy map Balanced
scorecard
Action plan
Theme Strategies Objectives Measurement
Target Initiative Budget
Financial • Grow revenues • Fewer planes
• Profit • Grow revenues • Fewer planes
• Seat revenue • Plane lease cost
• 20% growth seat rev. • 5% decrease lease cost
Customer • Lowest prices • On-time service
• # repeat customers • FAA on-time arrival rating
• 70% repeat customers • #1 on-time rating
• Implement CRM system • Quality management
• $XXX
• $XXX
Internal • Fast ground turnaround
• Fast ground turnaround
• On ground time • On-time departure
• 30 minutes • 90%
• Cycle time optimization
• $XXX
Learning and Growth
• Strategic job = ramp agent • Strategic systems = crew scheduling • Ground crew alignment
• Develop necessary skills • Develop the support system • Ground crew aligned with strategy
• Strategic job readiness • Info system availability • Strategic awareness • % Ground-crew stock-holders
• 70% • 100% • 100% • !00%
• Ground crew training • Crew scheduling system roll-out • Comm. program • Employee stock ownership plan
• $XXX • $XXX • $XXX • $XXX
41
What the balanced scorecard is and isn’t
Creating the balanced scorecard is a critical step in the strategic process. So many organizations create a strategic plan and then dutifully ignore it because of day-to-day issues/firefighting tends to take precedence. The scorecard periodically reminds the organization what the critical strategic issues are and gives the necessary feedback on the progress toward achieving them.
It is important to remember the balanced scorecard is like a scale. The role of the scale when you are on a diet is not to make you lose weight. The scale merely provides you with feedback on how you are doing. In the same way, building a balanced scorecard will not improve organizational performance. It will simply give you feedback on how well you are achieving your strategic direction. ORION DEVELOPMENT GROUP www.odgroup.com
42
Defining value � Mission – why we exist
� Values – what is important to us
� Vision – what we want to be
� Strategy – our game plan
� Strategy map – translate the strategy
� Balanced Scorecard – measure and focus
� Targets and initiatives – what we need to do
� Personal objectives – what I need to do
43
Complete the tool � Set timelines
� Quantify targets
� Select initiatives
� Link resources
� Identify accountable groups/people
44
Defining the metrics
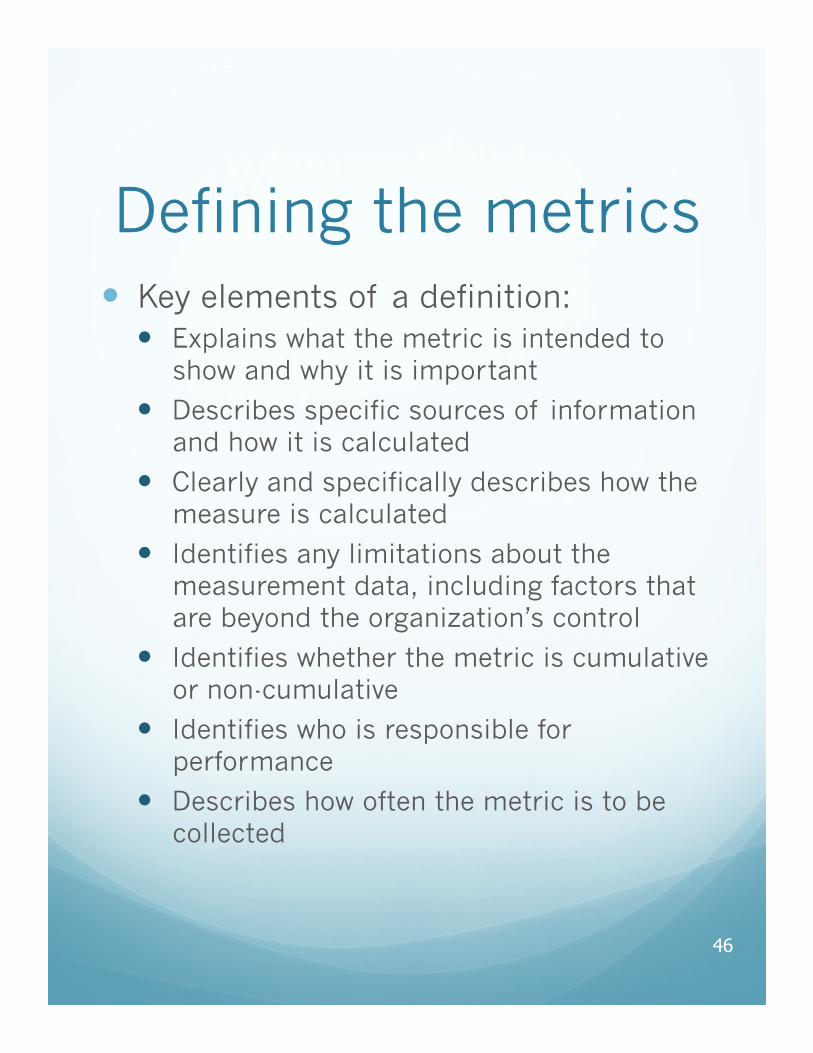
Defining the metrics � Key elements of a definition:
� Explains what the metric is intended to show and why it is important
� Describes specific sources of information and how it is calculated
� Clearly and specifically describes how the measure is calculated
� Identifies any limitations about the measurement data, including factors that are beyond the organization’s control
� Identifies whether the metric is cumulative or non-cumulative
� Identifies who is responsible for performance
� Describes how often the metric is to be collected
46

How to project the metrics
Set the target using:
� Trend analysis or other statistical techniques to establish a baseline projection if past data exists
� Industry averages/benchmarking
� Sampling or piloting performance
47
A good metric is…

Good metrics are… � Responsive – reflects changes in
level of performance
� Valid – captures the intended information, represents what is being measured
� Responsibility linked – matched to an organization unit responsible for achieving the measure
� Customer focused – reflects the point of view of customers and stakeholders
� Comprehensive – when taken together, the set includes all key aspects of performance
� Cost-effective – justifies the cost of collecting and retaining data
� Challenging - aggressive and challenging, yet realistic and attainable within the planning period and available resources
� Collectable – possible to collect accurate and reliable data
� Meaningful – significant and directly related to the mission and goal
� Compatible – integrated with existing financial and operational systems
� Comparable – useful for making comparisons with other data over time
� Simple – easy to calculate and determine
� Credible – based on accurate and reliable data
� Relevant – logically and directly relate to areas of the scorecard, goals, or functions
� Balanced - the set includes several types of measures including outcome, efficiency, etc. measures
� Timed – there is a specific time frame for completion
� Understandable - someone unfamiliar with the organization will understand what the metric means
� Results oriented - specifies a result rather than an activity
49

A bit on “how” “You can’t get what you want, till you
know what you want.” Mama

Options for getting started
Options
� Consultant to help create
� Consultant to help guide
� Pilot for one function
� Whole hog but half-baked
� Whole hog fully baked
Pros and cons
51
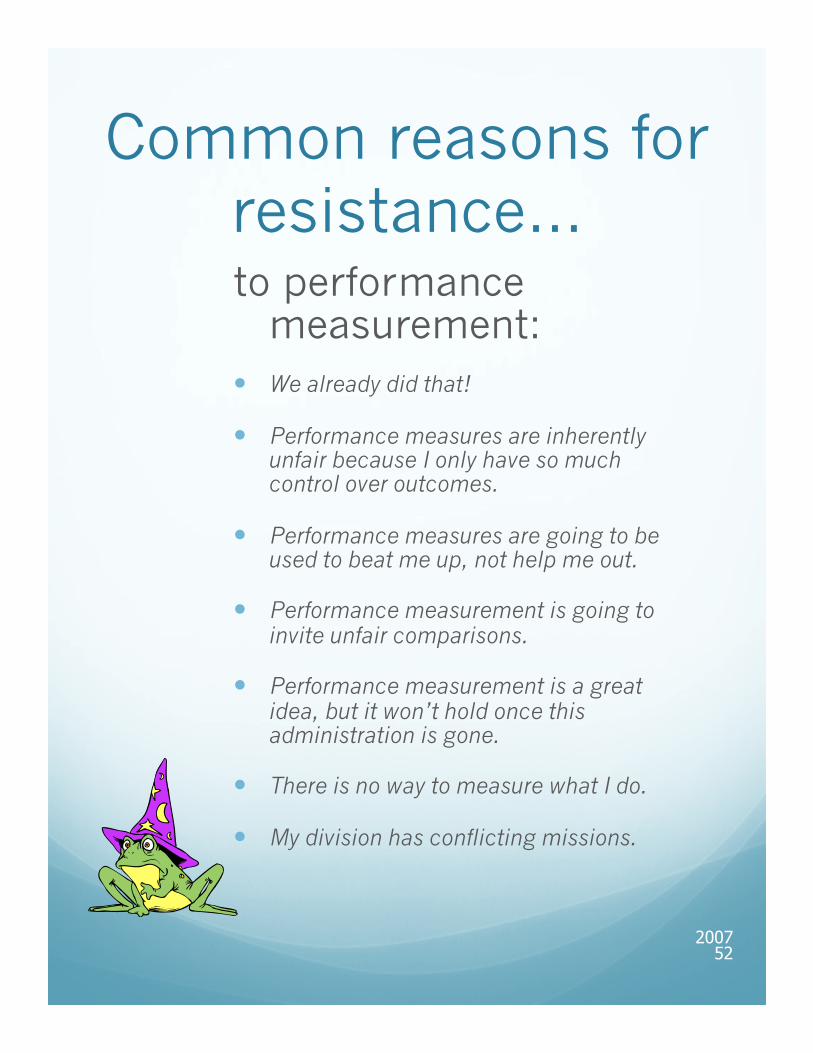
Common reasons for resistance… to performance
measurement: � We already did that!
� Performance measures are inherently unfair because I only have so much control over outcomes.
� Performance measures are going to be used to beat me up, not help me out.
� Performance measurement is going to invite unfair comparisons.
� Performance measurement is a great idea, but it won’t hold once this administration is gone.
� There is no way to measure what I do.
� My division has conflicting missions.
2007 52

Why change fails: John P. Kotter/Harvard Business Review
� Not establishing a great enough sense of urgency
� Not creating a powerful guiding coalition
� Lacking a vision
� Under-communicating the vision
� Not removing obstacles to the new vision
� Not planning for and celebrating short-term wins
� Declaring victory too soon
� Not anchoring changes in the corporate culture
53
How to Sell Your Budget
• Maintain credibility
• Know your numbers
• Be willing to sacrifice
• Benchmark
• Demonstrate necessity for compliance
• Quantify short-term and long-term results
• Depict in pictures
• Present compellingly
• Take burden off decision maker… allow them to say yes
• Keep in close communication with the boss throughout the whole process
• Take notice of the political situation
• Clearly link your budget to the goals and objectives of your superiors
54
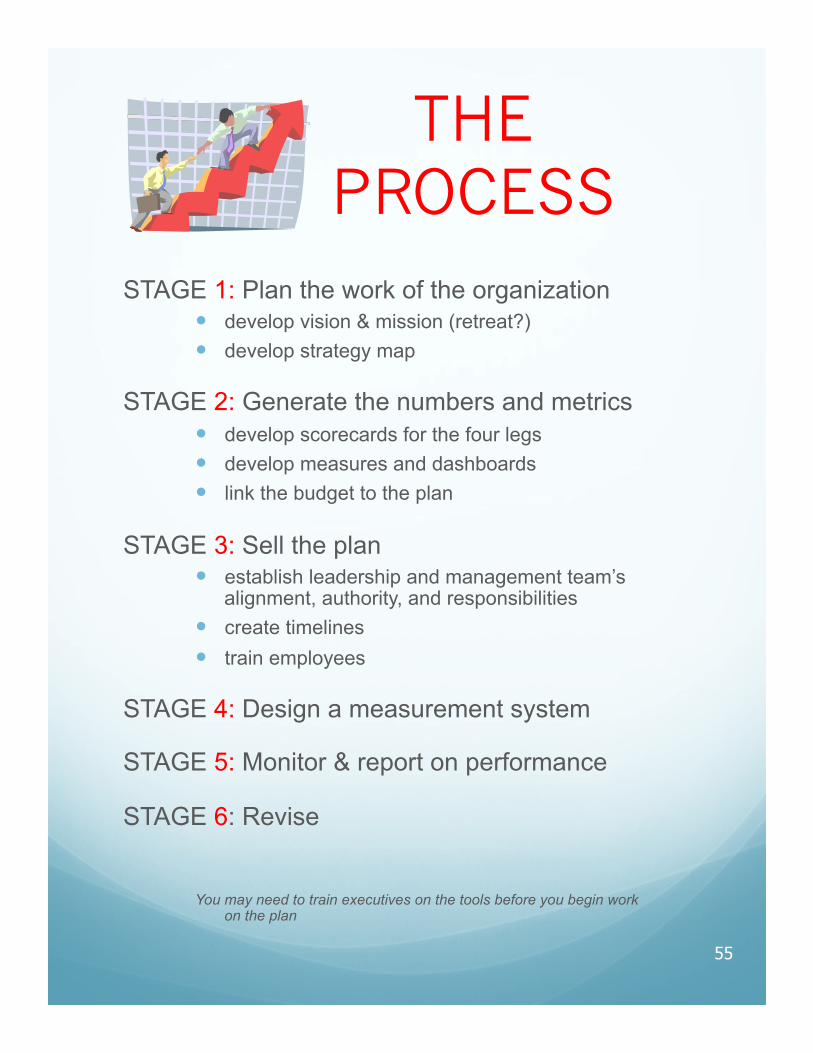
THE PROCESS
STAGE 1: Plan the work of the organization � develop vision & mission (retreat?) � develop strategy map
STAGE 2: Generate the numbers and metrics � develop scorecards for the four legs � develop measures and dashboards � link the budget to the plan
STAGE 3: Sell the plan � establish leadership and management team’s
alignment, authority, and responsibilities � create timelines � train employees
STAGE 4: Design a measurement system
STAGE 5: Monitor & report on performance
STAGE 6: Revise
You may need to train executives on the tools before you begin work
on the plan
55

Responsibilities of project managers
Project managers are also responsible for balancing and integrating competing demands to implement all aspects of the project successfully, as follows:
� Project scope Identifying the specific work to be done for the project.
� Project time Setting the finish date of the project as well as any interim deadlines for phases, milestones, and deliverables.
� Project cost Calculating and tracking the project costs and budget.
� Project human resources Signing on the team members who will carry out the tasks of the project.
� Project procurement Acquiring the material and equipment resources with which to carry out project tasks.
� Project communication Conveying assignments, updates, reports, and other information with team members and other stakeholders.
� Project quality Identifying the acceptable level of quality for the project goals and objectives.
� Project risk Analyzing potential project risks and response planning.
2007 56
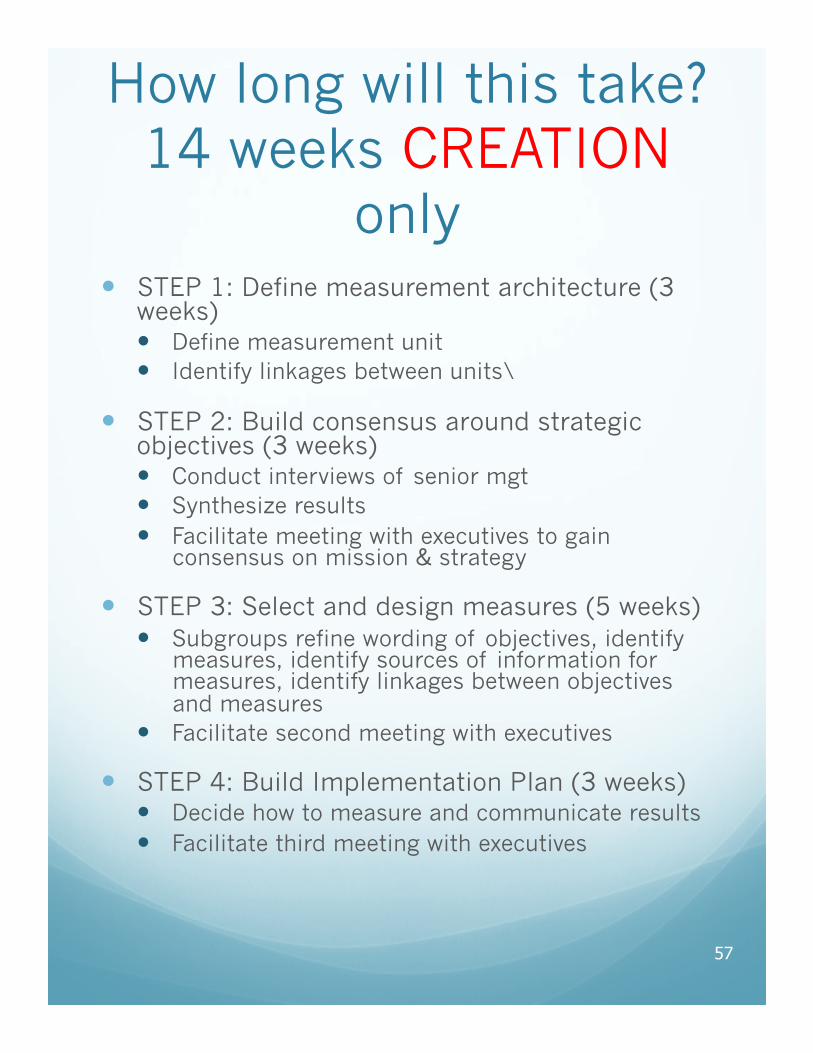
How long will this take? 14 weeks CREATION
only � STEP 1: Define measurement architecture (3
weeks) � Define measurement unit � Identify linkages between units\
� STEP 2: Build consensus around strategic objectives (3 weeks) � Conduct interviews of senior mgt � Synthesize results � Facilitate meeting with executives to gain
consensus on mission & strategy
� STEP 3: Select and design measures (5 weeks) � Subgroups refine wording of objectives, identify
measures, identify sources of information for measures, identify linkages between objectives and measures
� Facilitate second meeting with executives
� STEP 4: Build Implementation Plan (3 weeks) � Decide how to measure and communicate results � Facilitate third meeting with executives
57
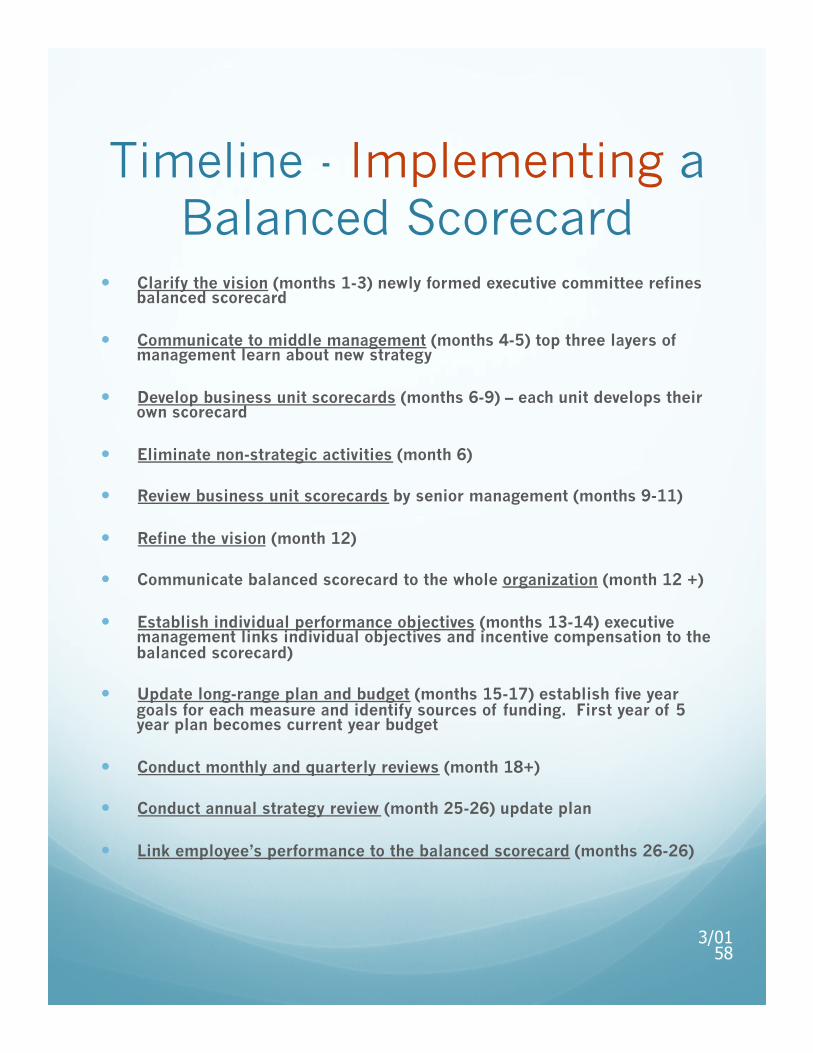
Timeline - Implementing a Balanced Scorecard
� Clarify the vision (months 1-3) newly formed executive committee refines balanced scorecard
� Communicate to middle management (months 4-5) top three layers of management learn about new strategy
� Develop business unit scorecards (months 6-9) – each unit develops their own scorecard
� Eliminate non-strategic activities (month 6)
� Review business unit scorecards by senior management (months 9-11)
� Refine the vision (month 12)
� Communicate balanced scorecard to the whole organization (month 12 +)
� Establish individual performance objectives (months 13-14) executive management links individual objectives and incentive compensation to the balanced scorecard)
� Update long-range plan and budget (months 15-17) establish five year goals for each measure and identify sources of funding. First year of 5 year plan becomes current year budget
� Conduct monthly and quarterly reviews (month 18+)
� Conduct annual strategy review (month 25-26) update plan
� Link employee’s performance to the balanced scorecard (months 26-26)
3/01 58
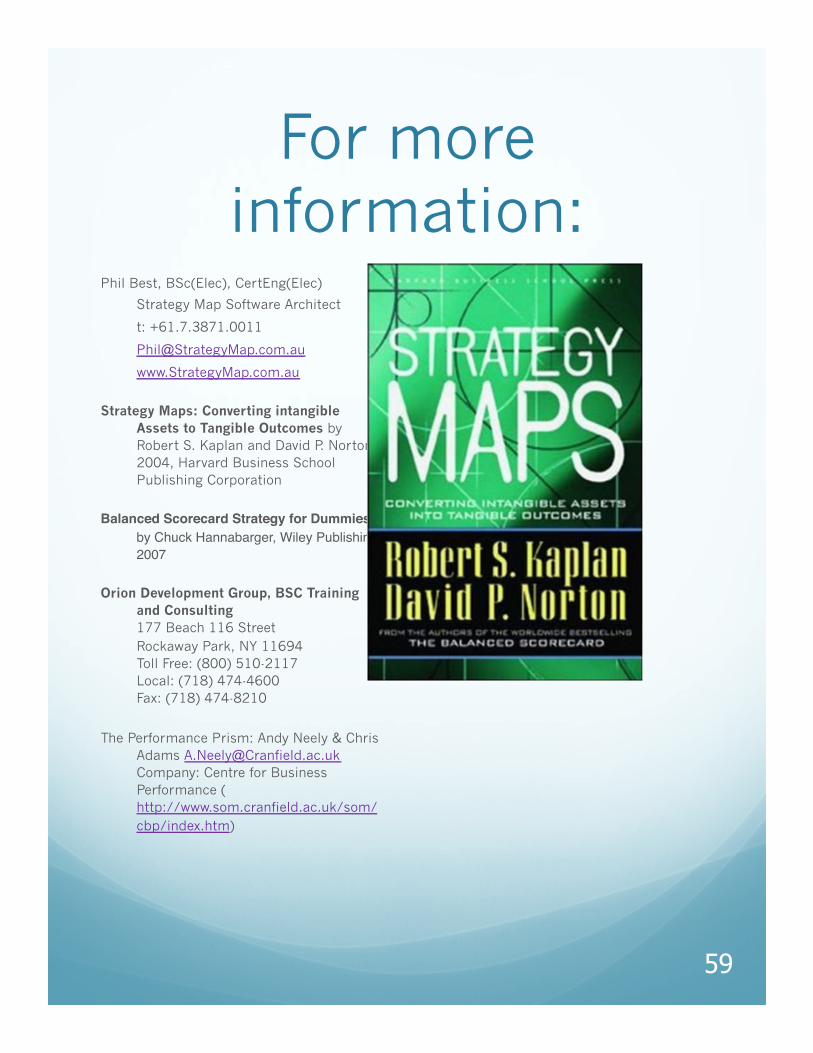
For more information:
Phil Best, BSc(Elec), CertEng(Elec)
Strategy Map Software Architect
t: +61.7.3871.0011
www.StrategyMap.com.au
Strategy Maps: Converting intangible Assets to Tangible Outcomes by Robert S. Kaplan and David P. Norton, 2004, Harvard Business School Publishing Corporation
Balanced Scorecard Strategy for Dummies by Chuck Hannabarger, Wiley Publishing 2007
Orion Development Group, BSC Training and Consulting 177 Beach 116 Street Rockaway Park, NY 11694 Toll Free: (800) 510-2117 Local: (718) 474-4600 Fax: (718) 474-8210
The Performance Prism: Andy Neely & Chris Adams [email protected] Company: Centre for Business Performance (http://www.som.cranfield.ac.uk/som/cbp/index.htm)
"
"
59


![[Architecture Ebook] Future Forms and Design for Sustainable Cities.pdf](https://img.pdfslide.us/doc/110x75/55cf98c9550346d03399a8b5/architecture-ebook-future-forms-and-design-for-sustainable-citiespdf.jpg)


![[Arthur Symons] Cities.pdf](https://img.pdfslide.us/doc/110x75/55cf9497550346f57ba30bce/arthur-symons-citiespdf.jpg)
