Embed Size (px)
Citation preview
dTptf
Slope distribution of a rough surfacemeasured by transmission scattering and polarization
Soe-Mie F. Nee, Randle V. Dewees, Tsu-Wei Nee, Linda F. Johnson, andMark B. Moran
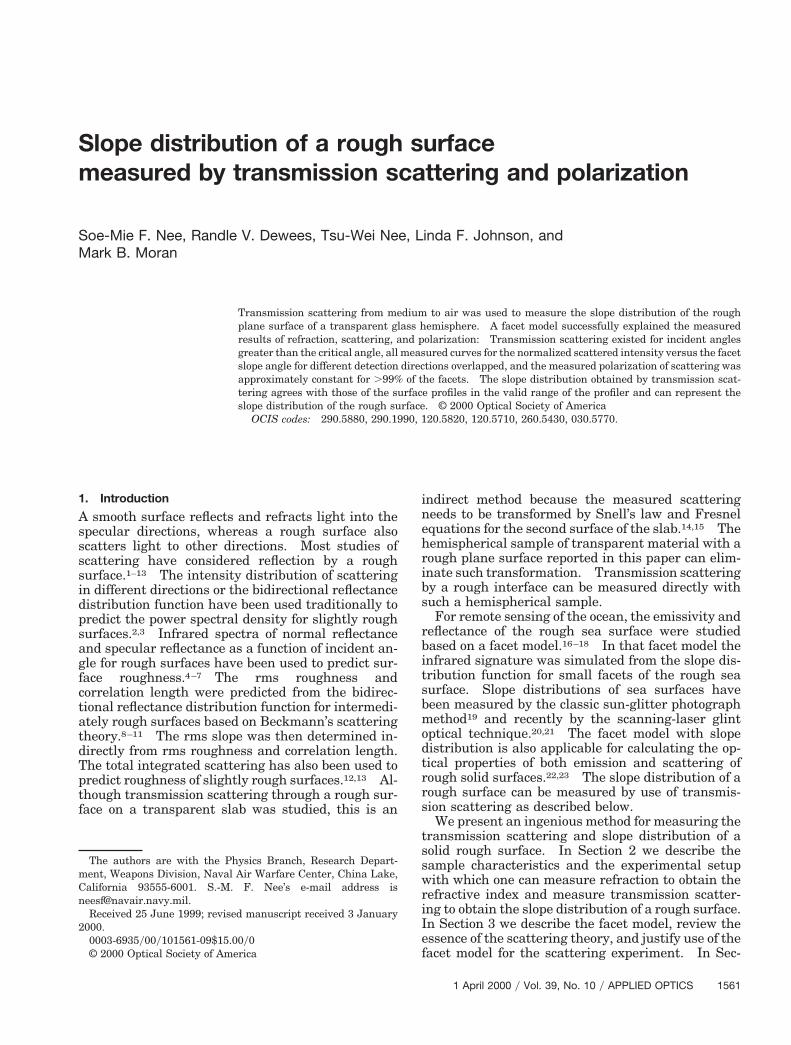
Transmission scattering from medium to air was used to measure the slope distribution of the roughplane surface of a transparent glass hemisphere. A facet model successfully explained the measuredresults of refraction, scattering, and polarization: Transmission scattering existed for incident anglesgreater than the critical angle, all measured curves for the normalized scattered intensity versus the facetslope angle for different detection directions overlapped, and the measured polarization of scattering wasapproximately constant for .99% of the facets. The slope distribution obtained by transmission scat-tering agrees with those of the surface profiles in the valid range of the profiler and can represent theslope distribution of the rough surface. © 2000 Optical Society of America
OCIS codes: 290.5880, 290.1990, 120.5820, 120.5710, 260.5430, 030.5770.
1. Introduction
A smooth surface reflects and refracts light into thespecular directions, whereas a rough surface alsoscatters light to other directions. Most studies ofscattering have considered reflection by a roughsurface.1–13 The intensity distribution of scatteringin different directions or the bidirectional reflectancedistribution function have been used traditionally topredict the power spectral density for slightly roughsurfaces.2,3 Infrared spectra of normal reflectanceand specular reflectance as a function of incident an-gle for rough surfaces have been used to predict sur-face roughness.4–7 The rms roughness andcorrelation length were predicted from the bidirec-tional reflectance distribution function for intermedi-ately rough surfaces based on Beckmann’s scatteringtheory.8–11 The rms slope was then determined in-
irectly from rms roughness and correlation length.he total integrated scattering has also been used toredict roughness of slightly rough surfaces.12,13 Al-hough transmission scattering through a rough sur-ace on a transparent slab was studied, this is an
The authors are with the Physics Branch, Research Depart-ment, Weapons Division, Naval Air Warfare Center, China Lake,California 93555-6001. S.-M. F. Nee’s e-mail address [email protected].
Received 25 June 1999; revised manuscript received 3 January2000.
0003-6935y00y101561-09$15.00y0© 2000 Optical Society of America
indirect method because the measured scatteringneeds to be transformed by Snell’s law and Fresnelequations for the second surface of the slab.14,15 Thehemispherical sample of transparent material with arough plane surface reported in this paper can elim-inate such transformation. Transmission scatteringby a rough interface can be measured directly withsuch a hemispherical sample.
For remote sensing of the ocean, the emissivity andreflectance of the rough sea surface were studiedbased on a facet model.16–18 In that facet model theinfrared signature was simulated from the slope dis-tribution function for small facets of the rough seasurface. Slope distributions of sea surfaces havebeen measured by the classic sun-glitter photographmethod19 and recently by the scanning-laser glintoptical technique.20,21 The facet model with slopedistribution is also applicable for calculating the op-tical properties of both emission and scattering ofrough solid surfaces.22,23 The slope distribution of arough surface can be measured by use of transmis-sion scattering as described below.
We present an ingenious method for measuring thetransmission scattering and slope distribution of asolid rough surface. In Section 2 we describe thesample characteristics and the experimental setupwith which one can measure refraction to obtain therefractive index and measure transmission scatter-ing to obtain the slope distribution of a rough surface.In Section 3 we describe the facet model, review theessence of the scattering theory, and justify use of thefacet model for the scattering experiment. In Sec-
1 April 2000 y Vol. 39, No. 10 y APPLIED OPTICS 1561
Htutslfi
1
tion 4 we provide another proof for the facet model,using the measured polarization characteristics. InSection 5 we compare the slope distributions obtainedfrom the surface profiles and the transmission scat-tering. Section 6 concludes the investigations.
2. Experiments
A. Sample
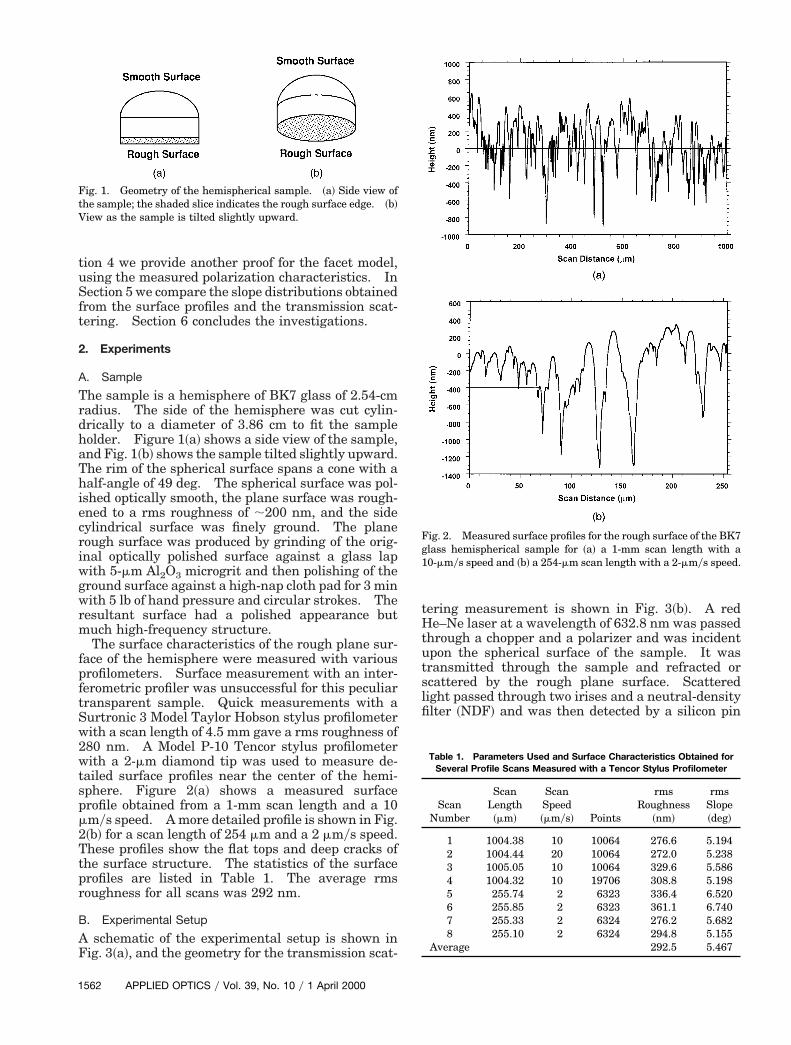
The sample is a hemisphere of BK7 glass of 2.54-cmradius. The side of the hemisphere was cut cylin-drically to a diameter of 3.86 cm to fit the sampleholder. Figure 1~a! shows a side view of the sample,and Fig. 1~b! shows the sample tilted slightly upward.The rim of the spherical surface spans a cone with ahalf-angle of 49 deg. The spherical surface was pol-ished optically smooth, the plane surface was rough-ened to a rms roughness of ;200 nm, and the sidecylindrical surface was finely ground. The planerough surface was produced by grinding of the orig-inal optically polished surface against a glass lapwith 5-mm Al2O3 microgrit and then polishing of theground surface against a high-nap cloth pad for 3 minwith 5 lb of hand pressure and circular strokes. Theresultant surface had a polished appearance butmuch high-frequency structure.
The surface characteristics of the rough plane sur-face of the hemisphere were measured with variousprofilometers. Surface measurement with an inter-ferometric profiler was unsuccessful for this peculiartransparent sample. Quick measurements with aSurtronic 3 Model Taylor Hobson stylus profilometerwith a scan length of 4.5 mm gave a rms roughness of280 nm. A Model P-10 Tencor stylus profilometerwith a 2-mm diamond tip was used to measure de-tailed surface profiles near the center of the hemi-sphere. Figure 2~a! shows a measured surfaceprofile obtained from a 1-mm scan length and a 10mmys speed. A more detailed profile is shown in Fig.2~b! for a scan length of 254 mm and a 2 mmys speed.These profiles show the flat tops and deep cracks ofthe surface structure. The statistics of the surfaceprofiles are listed in Table 1. The average rmsroughness for all scans was 292 nm.
B. Experimental Setup
A schematic of the experimental setup is shown inFig. 3~a!, and the geometry for the transmission scat-
Fig. 1. Geometry of the hemispherical sample. ~a! Side view ofthe sample; the shaded slice indicates the rough surface edge. ~b!View as the sample is tilted slightly upward.
562 APPLIED OPTICS y Vol. 39, No. 10 y 1 April 2000
tering measurement is shown in Fig. 3~b!. A rede–Ne laser at a wavelength of 632.8 nm was passed
hrough a chopper and a polarizer and was incidentpon the spherical surface of the sample. It wasransmitted through the sample and refracted orcattered by the rough plane surface. Scatteredight passed through two irises and a neutral-densitylter ~NDF! and was then detected by a silicon pin
Fig. 2. Measured surface profiles for the rough surface of the BK7glass hemispherical sample for ~a! a 1-mm scan length with a10-mmys speed and ~b! a 254-mm scan length with a 2-mmys speed.
Table 1. Parameters Used and Surface Characteristics Obtained forSeveral Profile Scans Measured with a Tencor Stylus Profilometer
ScanNumber
ScanLength~mm!
ScanSpeed~mmys! Points
rmsRoughness
~nm!
rmsSlope~deg!
1 1004.38 10 10064 276.6 5.1942 1004.44 20 10064 272.0 5.2383 1005.05 10 10064 329.6 5.5864 1004.32 10 19706 308.8 5.1985 255.74 2 6323 336.4 6.5206 255.85 2 6323 361.1 6.7407 255.33 2 6324 276.2 5.6828 255.10 2 6324 294.8 5.155
Average 292.5 5.467
dtita
opinhmipihffsttpfpem
A
Tf3dt.agt
fi
diode. The chopper was used with a lock-in ampli-fier to suppress ambient noise. The polarizer wasset at 45 deg to horizontal. The opening of an irisspanned an angle of 0.0121 rad from the sample.The solid angle was 1.15 3 1024 sr. The neutral-
ensity filter was used to control the intensity level ofhe detector. The sample holder was rotatable hor-zontally to change the angle of incidence. The de-ection arm was coaxial with the sample holder axisnd was also rotatable horizontally.The sample was aligned such that the rotation axis
f the holder was on the plane rough surface andassed through the center of the hemisphere. Thencident laser was aligned to be horizontal, incidentormally upon the spherical surface, and always toit the same spot, the center of the hemisphere, noatter how the sample was rotated. The plane of
ncidence was thus horizontal. Rotation of the sam-le did not change the intensity, direction, or polar-zation of the beam reaching the center of theemisphere. Preservation of direction allows the re-raction measurement to determine the index of re-raction. Preservation of intensity permitscattering measurement of the transmission throughhe rough plane surface. Preservation of polariza-ion permits the use of ellipsometry to investigate theolarization of transmission through the rough sur-ace. Incident linear polarization of 45 deg to thelane of incidence can also eliminate the polarizationffect by the rough plane surface in the intensityeasurement.24
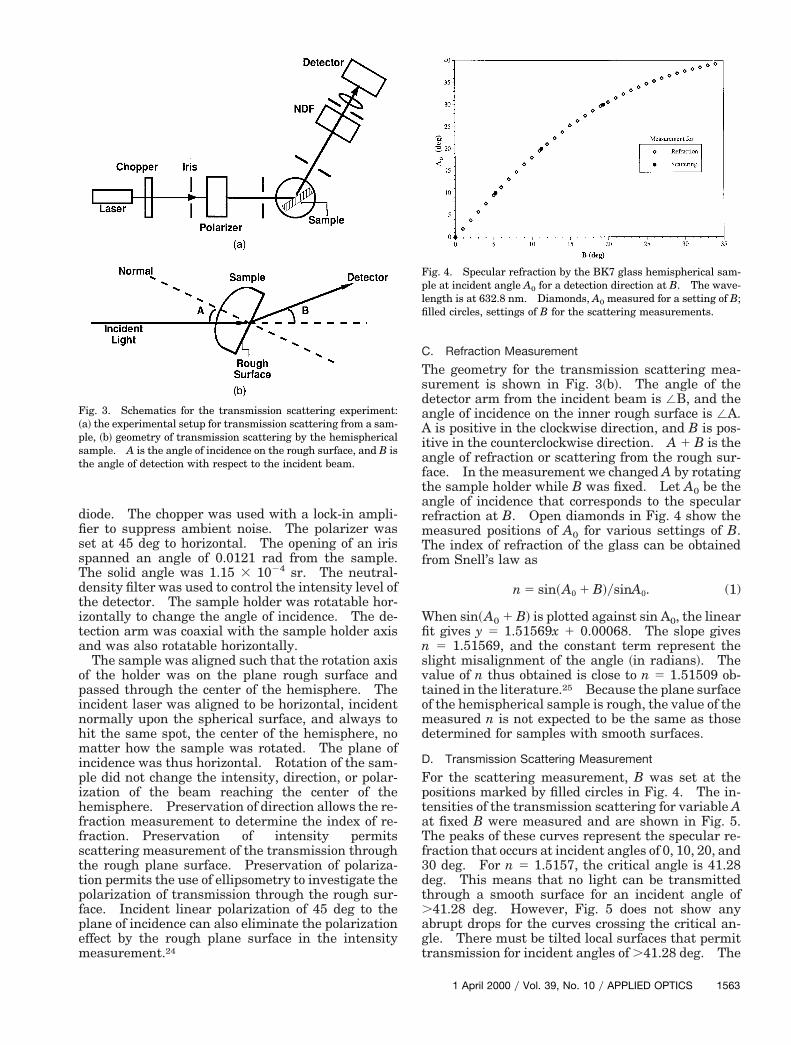
Fig. 3. Schematics for the transmission scattering experiment:~a! the experimental setup for transmission scattering from a sam-ple, ~b! geometry of transmission scattering by the hemisphericalsample. A is the angle of incidence on the rough surface, and B isthe angle of detection with respect to the incident beam.
C. Refraction Measurement
The geometry for the transmission scattering mea-surement is shown in Fig. 3~b!. The angle of thedetector arm from the incident beam is /B, and theangle of incidence on the inner rough surface is /A.
is positive in the clockwise direction, and B is pos-itive in the counterclockwise direction. A 1 B is theangle of refraction or scattering from the rough sur-face. In the measurement we changed A by rotatingthe sample holder while B was fixed. Let A0 be theangle of incidence that corresponds to the specularrefraction at B. Open diamonds in Fig. 4 show themeasured positions of A0 for various settings of B.The index of refraction of the glass can be obtainedfrom Snell’s law as
n 5 sin~A0 1 B!ysinA0. (1)
When sin~A0 1 B! is plotted against sin A0, the linearfit gives y 5 1.51569x 1 0.00068. The slope givesn 5 1.51569, and the constant term represent theslight misalignment of the angle ~in radians!. Thevalue of n thus obtained is close to n 5 1.51509 ob-tained in the literature.25 Because the plane surfaceof the hemispherical sample is rough, the value of themeasured n is not expected to be the same as thosedetermined for samples with smooth surfaces.
D. Transmission Scattering Measurement
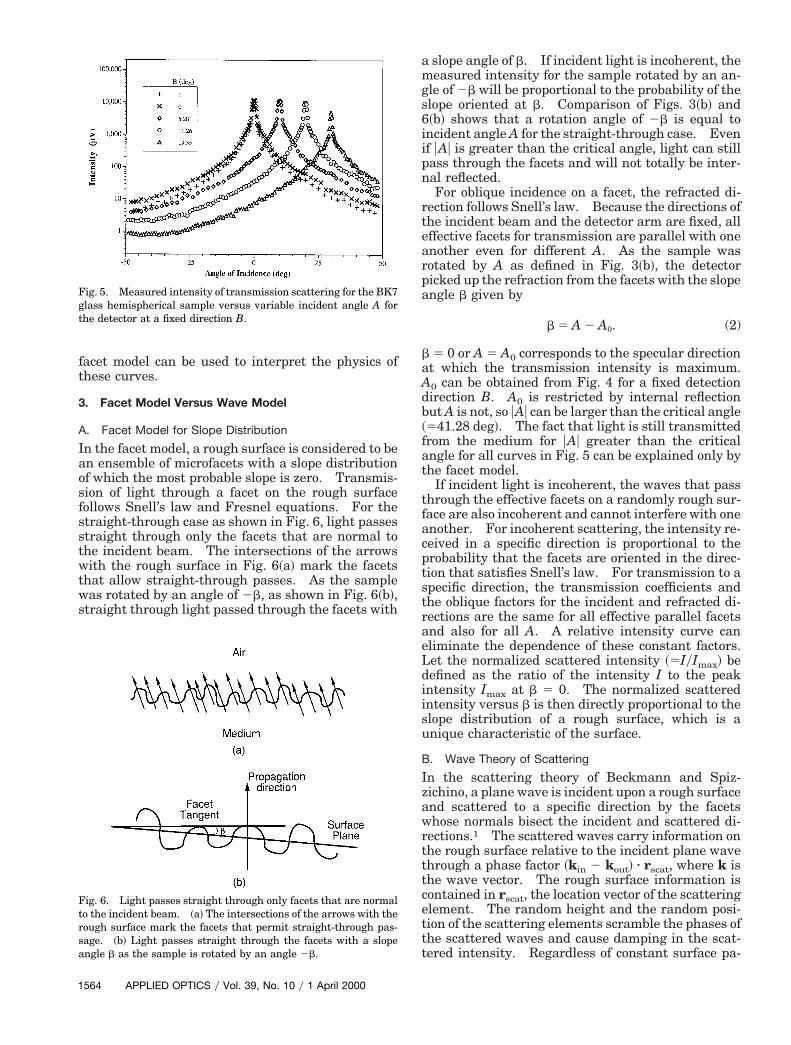
For the scattering measurement, B was set at thepositions marked by filled circles in Fig. 4. The in-tensities of the transmission scattering for variable Aat fixed B were measured and are shown in Fig. 5.
he peaks of these curves represent the specular re-raction that occurs at incident angles of 0, 10, 20, and0 deg. For n 5 1.5157, the critical angle is 41.28eg. This means that no light can be transmittedhrough a smooth surface for an incident angle of41.28 deg. However, Fig. 5 does not show anybrupt drops for the curves crossing the critical an-le. There must be tilted local surfaces that permitransmission for incident angles of .41.28 deg. The
Fig. 4. Specular refraction by the BK7 glass hemispherical sam-ple at incident angle A0 for a detection direction at B. The wave-length is at 632.8 nm. Diamonds, A0 measured for a setting of B;
lled circles, settings of B for the scattering measurements.
1 April 2000 y Vol. 39, No. 10 y APPLIED OPTICS 1563
s
amgs6iipn
rtearpa
di
tc
1
facet model can be used to interpret the physics ofthese curves.
3. Facet Model Versus Wave Model
A. Facet Model for Slope Distribution
In the facet model, a rough surface is considered to bean ensemble of microfacets with a slope distributionof which the most probable slope is zero. Transmis-sion of light through a facet on the rough surfacefollows Snell’s law and Fresnel equations. For thestraight-through case as shown in Fig. 6, light passesstraight through only the facets that are normal tothe incident beam. The intersections of the arrowswith the rough surface in Fig. 6~a! mark the facetsthat allow straight-through passes. As the samplewas rotated by an angle of 2b, as shown in Fig. 6~b!,traight through light passed through the facets with
Fig. 5. Measured intensity of transmission scattering for the BK7glass hemispherical sample versus variable incident angle A forthe detector at a fixed direction B.
Fig. 6. Light passes straight through only facets that are normalto the incident beam. ~a! The intersections of the arrows with therough surface mark the facets that permit straight-through pas-sage. ~b! Light passes straight through the facets with a slopeangle b as the sample is rotated by an angle 2b.
564 APPLIED OPTICS y Vol. 39, No. 10 y 1 April 2000
slope angle of b. If incident light is incoherent, theeasured intensity for the sample rotated by an an-
le of 2b will be proportional to the probability of thelope oriented at b. Comparison of Figs. 3~b! and~b! shows that a rotation angle of 2b is equal toncident angle A for the straight-through case. Evenf uAu is greater than the critical angle, light can stillass through the facets and will not totally be inter-al reflected.For oblique incidence on a facet, the refracted di-
ection follows Snell’s law. Because the directions ofhe incident beam and the detector arm are fixed, allffective facets for transmission are parallel with onenother even for different A. As the sample wasotated by A as defined in Fig. 3~b!, the detectoricked up the refraction from the facets with the slopengle b given by
b 5 A 2 A0. (2)
b 5 0 or A 5 A0 corresponds to the specular directionat which the transmission intensity is maximum.A0 can be obtained from Fig. 4 for a fixed detectiondirection B. A0 is restricted by internal reflectionbut A is not, so uAu can be larger than the critical angle~541.28 deg!. The fact that light is still transmittedfrom the medium for uAu greater than the criticalangle for all curves in Fig. 5 can be explained only bythe facet model.
If incident light is incoherent, the waves that passthrough the effective facets on a randomly rough sur-face are also incoherent and cannot interfere with oneanother. For incoherent scattering, the intensity re-ceived in a specific direction is proportional to theprobability that the facets are oriented in the direc-tion that satisfies Snell’s law. For transmission to aspecific direction, the transmission coefficients andthe oblique factors for the incident and refracted di-rections are the same for all effective parallel facetsand also for all A. A relative intensity curve caneliminate the dependence of these constant factors.Let the normalized scattered intensity ~5IyImax! be
efined as the ratio of the intensity I to the peakntensity Imax at b 5 0. The normalized scattered
intensity versus b is then directly proportional to theslope distribution of a rough surface, which is aunique characteristic of the surface.
B. Wave Theory of Scattering
In the scattering theory of Beckmann and Spiz-zichino, a plane wave is incident upon a rough surfaceand scattered to a specific direction by the facetswhose normals bisect the incident and scattered di-rections.1 The scattered waves carry information onthe rough surface relative to the incident plane wavethrough a phase factor ~kin 2 kout! z rscat, where k ishe wave vector. The rough surface information isontained in rscat, the location vector of the scattering
element. The random height and the random posi-tion of the scattering elements scramble the phases ofthe scattered waves and cause damping in the scat-tered intensity. Regardless of constant surface pa-
Lsp
t
i
ctt
b
rameters such as roughness and correlation length,the scattered intensity is a function of ~kin 2 kout!.
et z be the unit vector normal to the plane roughurface and x be the orthogonal unit vector on thelane of incidence. Harvey and Vernold26 and Har-
vey27 plotted the bidirectional reflectance distribu-tion function curves versus the direction cosinedefined by h [ ~ly2p! x z ~kout 2 kin! and found thatall normalized scattered curves for different incidentangles coincide.
For this transmission experiment, the bidirectionaltransmission distribution function ~BTDF! and thenormalized BTDF are
BTDF ~A! 5 power scattered in DVy
@incident power cos~B 1 A!#.
Normalized BTDF [ BTDF~A!yBTDF~A0!. (3)
~kin 2 kout! and h defined above can be expressed inerms of b as
kin 2 kout 5 ~2pyl!$ x@n sinA 2 sin~B 1 A!#
1 z@n cosA 2 cos~B 1 A!#%
5 ~2pyl!(x sinb 1 z cosb!
3 @n cosA0 2 cos~B 1 A0!#,
h 5 2 sinb~n2 1 1 2 2n cosB!1y2. (4)
Refer to Fig. 3~b!; z has the same direction as thencident beam for normal incidence. ~kin 2 kout! in
Eqs. ~4! relates directly to the sinusoidal functions ofb and is different for different values of B. ApplyingHarvey’s results to transmission scattering shouldreduce all curves for the normalized BTDF versus hto one curve.26,27
C. Analysis of Scattering Curves
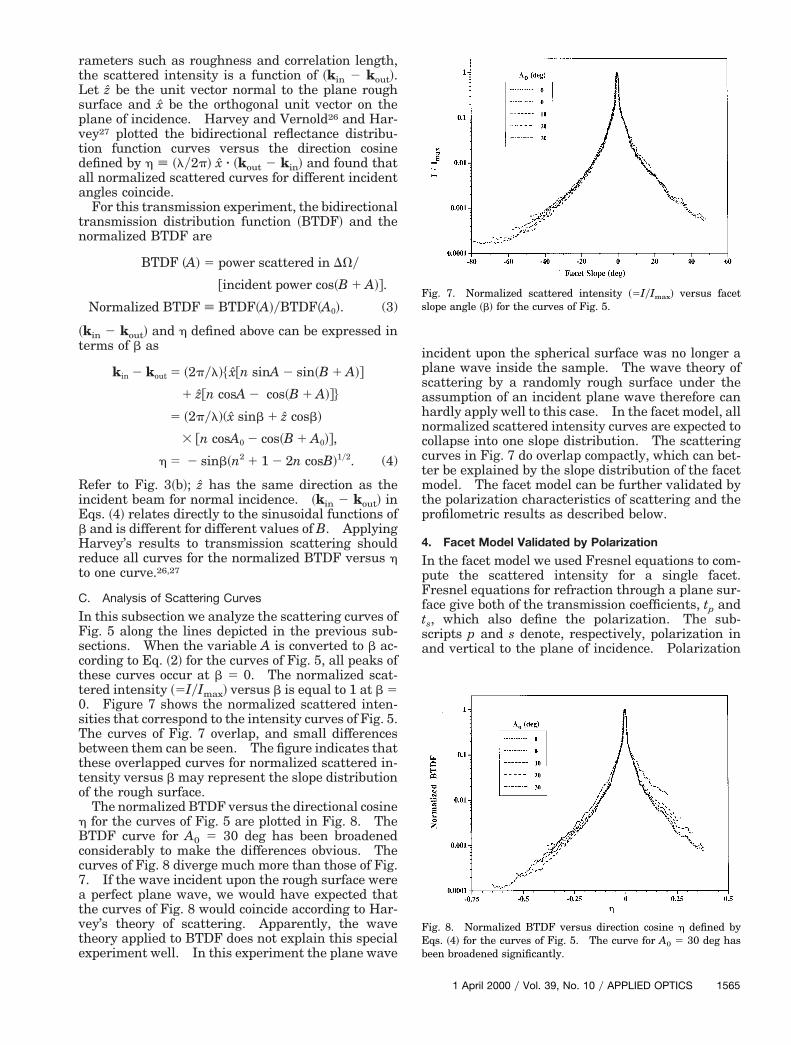
In this subsection we analyze the scattering curves ofFig. 5 along the lines depicted in the previous sub-sections. When the variable A is converted to b ac-ording to Eq. ~2! for the curves of Fig. 5, all peaks ofhese curves occur at b 5 0. The normalized scat-ered intensity ~5IyImax! versus b is equal to 1 at b 5
0. Figure 7 shows the normalized scattered inten-sities that correspond to the intensity curves of Fig. 5.The curves of Fig. 7 overlap, and small differencesbetween them can be seen. The figure indicates thatthese overlapped curves for normalized scattered in-tensity versus b may represent the slope distributionof the rough surface.
The normalized BTDF versus the directional cosineh for the curves of Fig. 5 are plotted in Fig. 8. TheBTDF curve for A0 5 30 deg has been broadenedconsiderably to make the differences obvious. Thecurves of Fig. 8 diverge much more than those of Fig.7. If the wave incident upon the rough surface werea perfect plane wave, we would have expected thatthe curves of Fig. 8 would coincide according to Har-vey’s theory of scattering. Apparently, the wavetheory applied to BTDF does not explain this specialexperiment well. In this experiment the plane wave
incident upon the spherical surface was no longer aplane wave inside the sample. The wave theory ofscattering by a randomly rough surface under theassumption of an incident plane wave therefore canhardly apply well to this case. In the facet model, allnormalized scattered intensity curves are expected tocollapse into one slope distribution. The scatteringcurves in Fig. 7 do overlap compactly, which can bet-ter be explained by the slope distribution of the facetmodel. The facet model can be further validated bythe polarization characteristics of scattering and theprofilometric results as described below.
4. Facet Model Validated by Polarization
In the facet model we used Fresnel equations to com-pute the scattered intensity for a single facet.Fresnel equations for refraction through a plane sur-face give both of the transmission coefficients, tp andts, which also define the polarization. The sub-scripts p and s denote, respectively, polarization inand vertical to the plane of incidence. Polarization
Fig. 7. Normalized scattered intensity ~5IyImax! versus facetslope angle ~b! for the curves of Fig. 5.
Fig. 8. Normalized BTDF versus direction cosine h defined byEqs. ~4! for the curves of Fig. 5. The curve for A0 5 30 deg haseen broadened significantly.
1 April 2000 y Vol. 39, No. 10 y APPLIED OPTICS 1565
usm
p
flA
f
c
1
by a sample can be represented by the ellipsometricparameters c and D, which are defined by24,28
tpyts 5 tan c exp~iD!. (5)
For no sample, c 5 45 deg and D 5 0, there is nochange of polarization at all. A deviation of c from45 deg indicates the change in the polarization direc-tion as light passes through the sample. D is thechange in retardation, which is defined as the relativephase of the two orthogonal polarizations of light.For normal incidence upon an interface, no change inpolarization is expected for the transmitted radia-tion.
In the scattering measurement it is difficult to sep-arate the magnitude of t from the measured intensitybecause the intensity contains many factors, includ-ing slope probability. However, polarization is inde-pendent of intensity, whereas it can be used tocharacterize the optical properties of a medium. Po-larization of scattering has been measured for a me-tallic one-dimensional rough surface.24 In thepresent experiment, no change in polarization wasexpected for light passing normally through thespherical surface. As light was transmitted throughthe plane rough surface, polarization could change forB Þ 0. For fixed incident and exiting directions, alleffective facets for variable A were parallel if only asingle refraction occurred. c and D should be con-stant for variable A at fixed B. If they deviate fromthe constant value, some other mechanisms than sin-gle surface refraction may be responsible. Multiplescattering may come from the environment of thesample as well as from the sample itself.
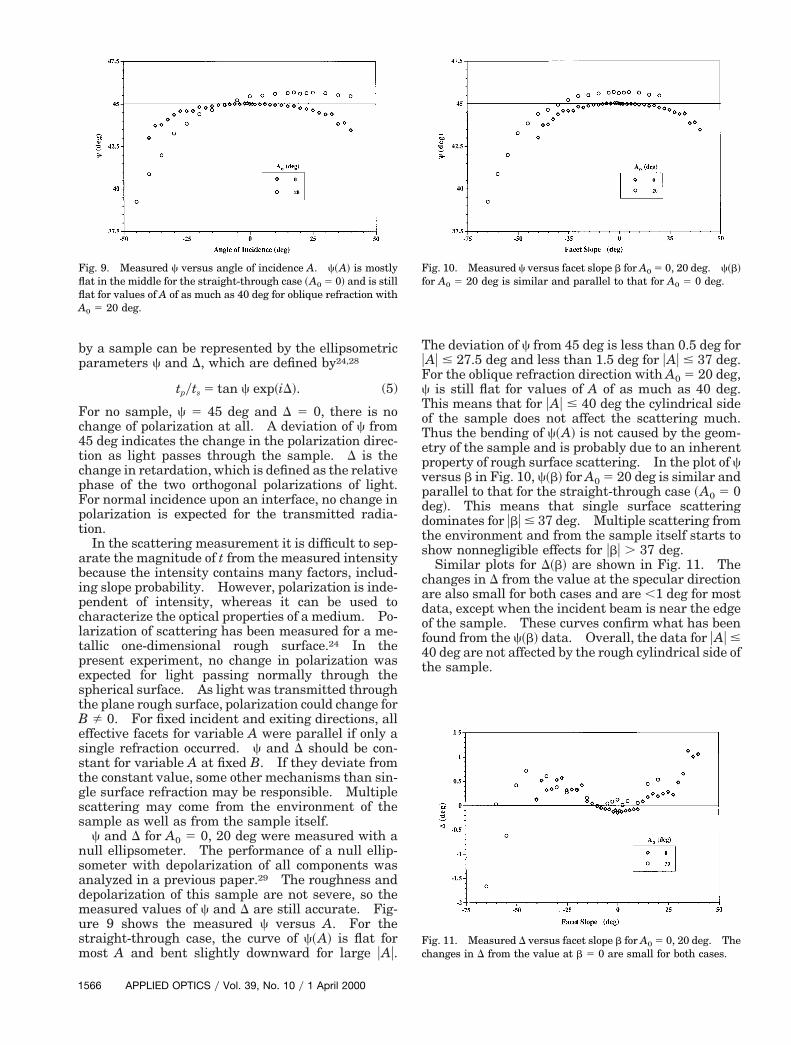
c and D for A0 5 0, 20 deg were measured with anull ellipsometer. The performance of a null ellip-someter with depolarization of all components wasanalyzed in a previous paper.29 The roughness anddepolarization of this sample are not severe, so themeasured values of c and D are still accurate. Fig-
re 9 shows the measured c versus A. For thetraight-through case, the curve of c~A! is flat forost A and bent slightly downward for large uAu.
Fig. 9. Measured c versus angle of incidence A. c~A! is mostlyflat in the middle for the straight-through case ~A0 5 0! and is still
at for values of A of as much as 40 deg for oblique refraction with0 5 20 deg.
566 APPLIED OPTICS y Vol. 39, No. 10 y 1 April 2000
The deviation of c from 45 deg is less than 0.5 deg foruAu # 27.5 deg and less than 1.5 deg for uAu # 37 deg.For the oblique refraction direction with A0 5 20 deg,c is still flat for values of A of as much as 40 deg.This means that for uAu # 40 deg the cylindrical sideof the sample does not affect the scattering much.Thus the bending of c~A! is not caused by the geom-etry of the sample and is probably due to an inherentproperty of rough surface scattering. In the plot of cversus b in Fig. 10, c~b! for A0 5 20 deg is similar and
arallel to that for the straight-through case ~A0 5 0deg!. This means that single surface scatteringdominates for ubu # 37 deg. Multiple scattering fromthe environment and from the sample itself starts toshow nonnegligible effects for ubu . 37 deg.
Similar plots for D~b! are shown in Fig. 11. Thechanges in D from the value at the specular directionare also small for both cases and are ,1 deg for mostdata, except when the incident beam is near the edgeof the sample. These curves confirm what has beenfound from the c~b! data. Overall, the data for uAu #40 deg are not affected by the rough cylindrical side ofthe sample.
Fig. 10. Measured c versus facet slope b for A0 5 0, 20 deg. c~b!or A0 5 20 deg is similar and parallel to that for A0 5 0 deg.
Fig. 11. Measured D versus facet slope b for A0 5 0, 20 deg. Thehanges in D from the value at b 5 0 are small for both cases.
l
ss
naatestoaoltodts,vfmbttfr
i0
5. Slope Distribution
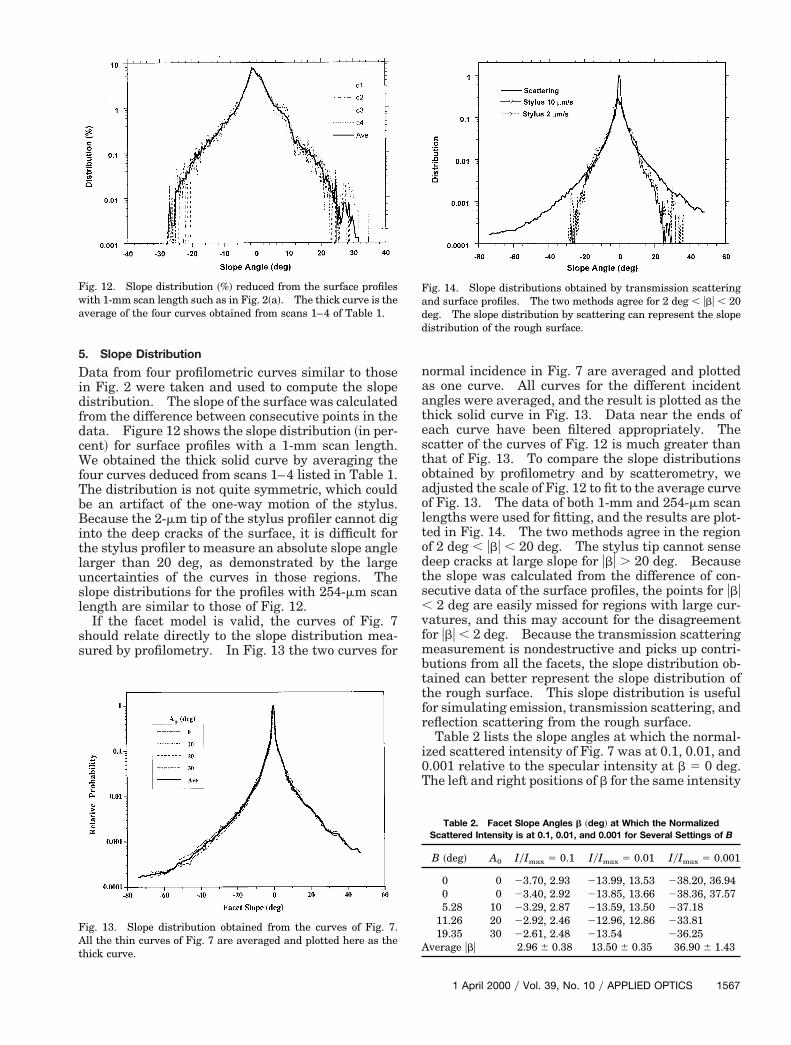
Data from four profilometric curves similar to thosein Fig. 2 were taken and used to compute the slopedistribution. The slope of the surface was calculatedfrom the difference between consecutive points in thedata. Figure 12 shows the slope distribution ~in per-cent! for surface profiles with a 1-mm scan length.We obtained the thick solid curve by averaging thefour curves deduced from scans 1–4 listed in Table 1.The distribution is not quite symmetric, which couldbe an artifact of the one-way motion of the stylus.Because the 2-mm tip of the stylus profiler cannot diginto the deep cracks of the surface, it is difficult forthe stylus profiler to measure an absolute slope anglelarger than 20 deg, as demonstrated by the largeuncertainties of the curves in those regions. Theslope distributions for the profiles with 254-mm scanength are similar to those of Fig. 12.
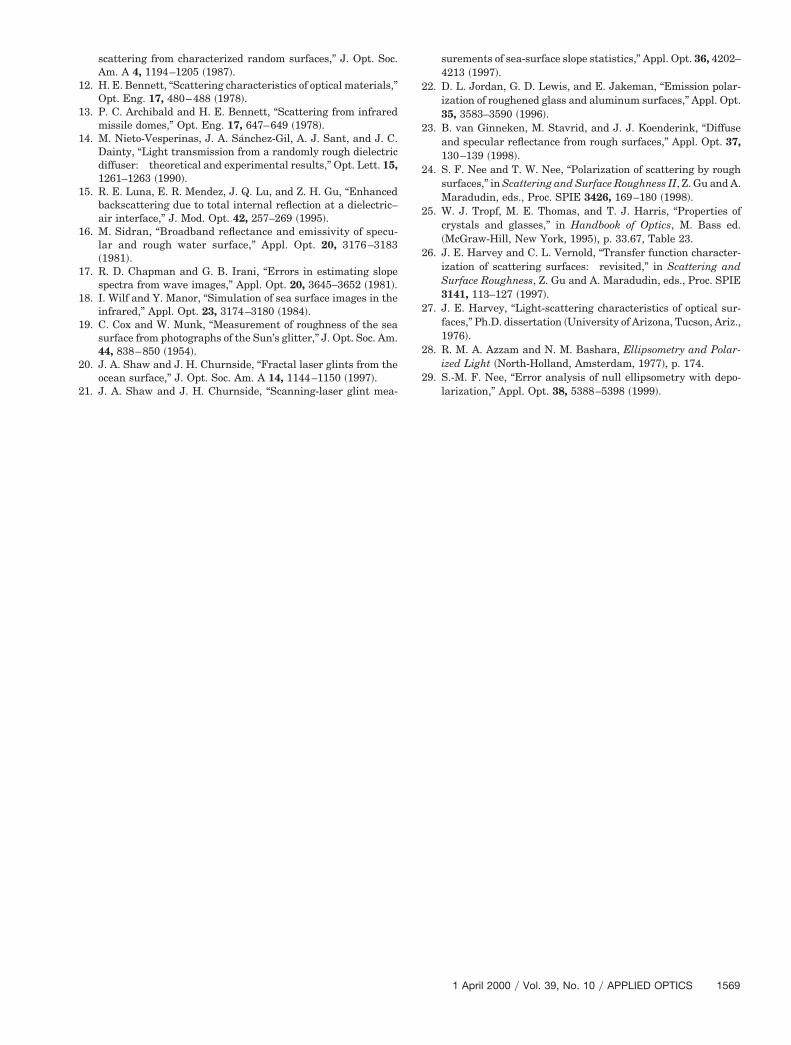
If the facet model is valid, the curves of Fig. 7hould relate directly to the slope distribution mea-ured by profilometry. In Fig. 13 the two curves for
Fig. 12. Slope distribution ~%! reduced from the surface profileswith 1-mm scan length such as in Fig. 2~a!. The thick curve is theaverage of the four curves obtained from scans 1–4 of Table 1.
Fig. 13. Slope distribution obtained from the curves of Fig. 7.All the thin curves of Fig. 7 are averaged and plotted here as thethick curve.
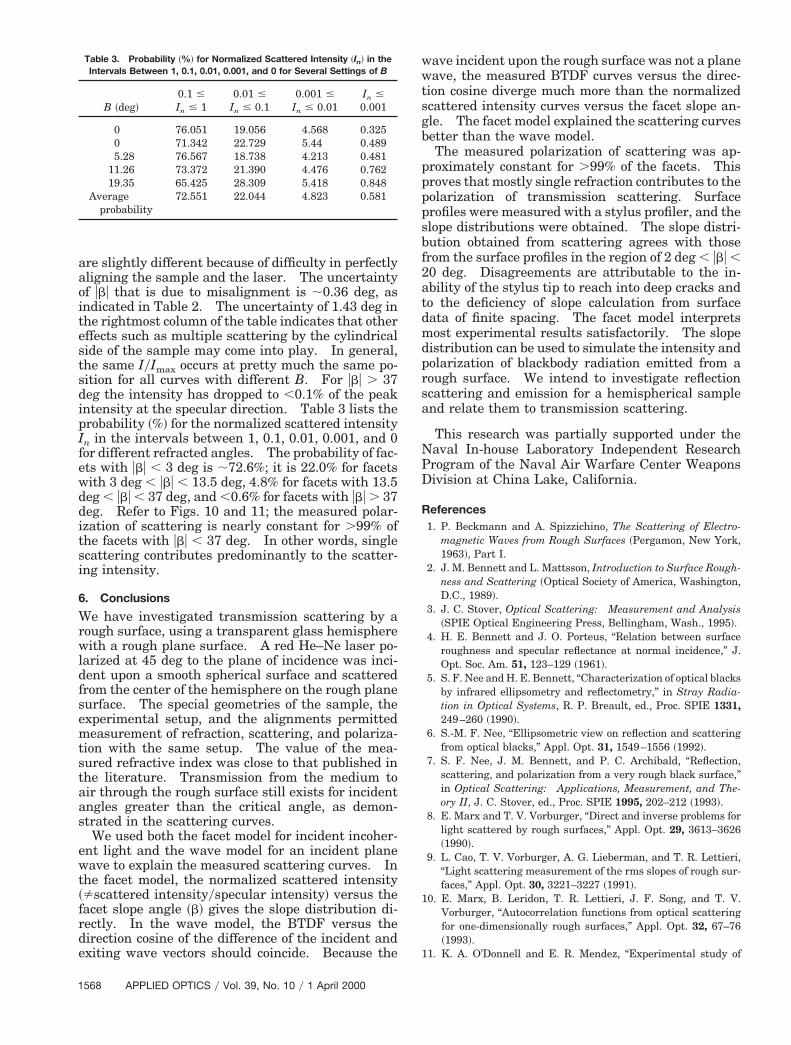
ormal incidence in Fig. 7 are averaged and plotteds one curve. All curves for the different incidentngles were averaged, and the result is plotted as thehick solid curve in Fig. 13. Data near the ends ofach curve have been filtered appropriately. Thecatter of the curves of Fig. 12 is much greater thanhat of Fig. 13. To compare the slope distributionsbtained by profilometry and by scatterometry, wedjusted the scale of Fig. 12 to fit to the average curvef Fig. 13. The data of both 1-mm and 254-mm scanengths were used for fitting, and the results are plot-ed in Fig. 14. The two methods agree in the regionf 2 deg , ubu , 20 deg. The stylus tip cannot senseeep cracks at large slope for ubu . 20 deg. Becausehe slope was calculated from the difference of con-ecutive data of the surface profiles, the points for ubu
2 deg are easily missed for regions with large cur-atures, and this may account for the disagreementor ubu , 2 deg. Because the transmission scatteringeasurement is nondestructive and picks up contri-
utions from all the facets, the slope distribution ob-ained can better represent the slope distribution ofhe rough surface. This slope distribution is usefulor simulating emission, transmission scattering, andeflection scattering from the rough surface.
Table 2 lists the slope angles at which the normal-zed scattered intensity of Fig. 7 was at 0.1, 0.01, and.001 relative to the specular intensity at b 5 0 deg.
The left and right positions of b for the same intensity
Fig. 14. Slope distributions obtained by transmission scatteringand surface profiles. The two methods agree for 2 deg , ubu , 20deg. The slope distribution by scattering can represent the slopedistribution of the rough surface.
Table 2. Facet Slope Angles b ~deg! at Which the NormalizedScattered Intensity is at 0.1, 0.01, and 0.001 for Several Settings of B
B ~deg! A0 IyImax 5 0.1 IyImax 5 0.01 IyImax 5 0.001
0 0 23.70, 2.93 213.99, 13.53 238.20, 36.940 0 23.40, 2.92 213.85, 13.66 238.36, 37.575.28 10 23.29, 2.87 213.59, 13.50 237.18
11.26 20 22.92, 2.46 212.96, 12.86 233.8119.35 30 22.61, 2.48 213.54 236.25
Average ubu 2.96 6 0.38 13.50 6 0.35 36.90 6 1.43
1 April 2000 y Vol. 39, No. 10 y APPLIED OPTICS 1567
itest
2atdmdprsa
NPD
Table 3. Probability ~%! for Normalized Scattered Intensity ~I ! in the
1
are slightly different because of difficulty in perfectlyaligning the sample and the laser. The uncertaintyof ubu that is due to misalignment is ;0.36 deg, asndicated in Table 2. The uncertainty of 1.43 deg inhe rightmost column of the table indicates that otherffects such as multiple scattering by the cylindricalide of the sample may come into play. In general,he same IyImax occurs at pretty much the same po-
sition for all curves with different B. For ubu . 37deg the intensity has dropped to ,0.1% of the peakintensity at the specular direction. Table 3 lists theprobability ~%! for the normalized scattered intensityIn in the intervals between 1, 0.1, 0.01, 0.001, and 0for different refracted angles. The probability of fac-ets with ubu , 3 deg is ;72.6%; it is 22.0% for facetswith 3 deg , ubu , 13.5 deg, 4.8% for facets with 13.5deg , ubu , 37 deg, and ,0.6% for facets with ubu . 37deg. Refer to Figs. 10 and 11; the measured polar-ization of scattering is nearly constant for .99% ofthe facets with ubu , 37 deg. In other words, singlescattering contributes predominantly to the scatter-ing intensity.
6. Conclusions
We have investigated transmission scattering by arough surface, using a transparent glass hemispherewith a rough plane surface. A red He–Ne laser po-larized at 45 deg to the plane of incidence was inci-dent upon a smooth spherical surface and scatteredfrom the center of the hemisphere on the rough planesurface. The special geometries of the sample, theexperimental setup, and the alignments permittedmeasurement of refraction, scattering, and polariza-tion with the same setup. The value of the mea-sured refractive index was close to that published inthe literature. Transmission from the medium toair through the rough surface still exists for incidentangles greater than the critical angle, as demon-strated in the scattering curves.
We used both the facet model for incident incoher-ent light and the wave model for an incident planewave to explain the measured scattering curves. Inthe facet model, the normalized scattered intensity~Þscattered intensityyspecular intensity! versus thefacet slope angle ~b! gives the slope distribution di-rectly. In the wave model, the BTDF versus thedirection cosine of the difference of the incident andexiting wave vectors should coincide. Because the
n
Intervals Between 1, 0.1, 0.01, 0.001, and 0 for Several Settings of B
B ~deg!0.1 #
In # 10.01 #
In # 0.10.001 #
In # 0.01In #
0.001
0 76.051 19.056 4.568 0.3250 71.342 22.729 5.44 0.4895.28 76.567 18.738 4.213 0.481
11.26 73.372 21.390 4.476 0.76219.35 65.425 28.309 5.418 0.848
Averageprobability
72.551 22.044 4.823 0.581
568 APPLIED OPTICS y Vol. 39, No. 10 y 1 April 2000
wave incident upon the rough surface was not a planewave, the measured BTDF curves versus the direc-tion cosine diverge much more than the normalizedscattered intensity curves versus the facet slope an-gle. The facet model explained the scattering curvesbetter than the wave model.
The measured polarization of scattering was ap-proximately constant for .99% of the facets. Thisproves that mostly single refraction contributes to thepolarization of transmission scattering. Surfaceprofiles were measured with a stylus profiler, and theslope distributions were obtained. The slope distri-bution obtained from scattering agrees with thosefrom the surface profiles in the region of 2 deg , ubu ,0 deg. Disagreements are attributable to the in-bility of the stylus tip to reach into deep cracks ando the deficiency of slope calculation from surfaceata of finite spacing. The facet model interpretsost experimental results satisfactorily. The slope
istribution can be used to simulate the intensity andolarization of blackbody radiation emitted from aough surface. We intend to investigate reflectioncattering and emission for a hemispherical samplend relate them to transmission scattering.
This research was partially supported under theaval In-house Laboratory Independent Researchrogram of the Naval Air Warfare Center Weaponsivision at China Lake, California.
References1. P. Beckmann and A. Spizzichino, The Scattering of Electro-
magnetic Waves from Rough Surfaces ~Pergamon, New York,1963!, Part I.
2. J. M. Bennett and L. Mattsson, Introduction to Surface Rough-ness and Scattering ~Optical Society of America, Washington,D.C., 1989!.
3. J. C. Stover, Optical Scattering: Measurement and Analysis~SPIE Optical Engineering Press, Bellingham, Wash., 1995!.
4. H. E. Bennett and J. O. Porteus, “Relation between surfaceroughness and specular reflectance at normal incidence,” J.Opt. Soc. Am. 51, 123–129 ~1961!.
5. S. F. Nee and H. E. Bennett, “Characterization of optical blacksby infrared ellipsometry and reflectometry,” in Stray Radia-tion in Optical Systems, R. P. Breault, ed., Proc. SPIE 1331,249–260 ~1990!.
6. S.-M. F. Nee, “Ellipsometric view on reflection and scatteringfrom optical blacks,” Appl. Opt. 31, 1549–1556 ~1992!.
7. S. F. Nee, J. M. Bennett, and P. C. Archibald, “Reflection,scattering, and polarization from a very rough black surface,”in Optical Scattering: Applications, Measurement, and The-ory II, J. C. Stover, ed., Proc. SPIE 1995, 202–212 ~1993!.
8. E. Marx and T. V. Vorburger, “Direct and inverse problems forlight scattered by rough surfaces,” Appl. Opt. 29, 3613–3626~1990!.
9. L. Cao, T. V. Vorburger, A. G. Lieberman, and T. R. Lettieri,“Light scattering measurement of the rms slopes of rough sur-faces,” Appl. Opt. 30, 3221–3227 ~1991!.
10. E. Marx, B. Leridon, T. R. Lettieri, J. F. Song, and T. V.Vorburger, “Autocorrelation functions from optical scatteringfor one-dimensionally rough surfaces,” Appl. Opt. 32, 67–76~1993!.
11. K. A. O’Donnell and E. R. Mendez, “Experimental study of
scattering from characterized random surfaces,” J. Opt. Soc. surements of sea-surface slope statistics,” Appl. Opt. 36, 4202–
Am. A 4, 1194–1205 ~1987!.12. H. E. Bennett, “Scattering characteristics of optical materials,”Opt. Eng. 17, 480–488 ~1978!.
13. P. C. Archibald and H. E. Bennett, “Scattering from infraredmissile domes,” Opt. Eng. 17, 647–649 ~1978!.
14. M. Nieto-Vesperinas, J. A. Sanchez-Gil, A. J. Sant, and J. C.Dainty, “Light transmission from a randomly rough dielectricdiffuser: theoretical and experimental results,” Opt. Lett. 15,1261–1263 ~1990!.
15. R. E. Luna, E. R. Mendez, J. Q. Lu, and Z. H. Gu, “Enhancedbackscattering due to total internal reflection at a dielectric–air interface,” J. Mod. Opt. 42, 257–269 ~1995!.
16. M. Sidran, “Broadband reflectance and emissivity of specu-lar and rough water surface,” Appl. Opt. 20, 3176–3183~1981!.
17. R. D. Chapman and G. B. Irani, “Errors in estimating slopespectra from wave images,” Appl. Opt. 20, 3645–3652 ~1981!.
18. I. Wilf and Y. Manor, “Simulation of sea surface images in theinfrared,” Appl. Opt. 23, 3174–3180 ~1984!.
19. C. Cox and W. Munk, “Measurement of roughness of the seasurface from photographs of the Sun’s glitter,” J. Opt. Soc. Am.44, 838–850 ~1954!.
20. J. A. Shaw and J. H. Churnside, “Fractal laser glints from theocean surface,” J. Opt. Soc. Am. A 14, 1144–1150 ~1997!.
21. J. A. Shaw and J. H. Churnside, “Scanning-laser glint mea-
4213 ~1997!.22. D. L. Jordan, G. D. Lewis, and E. Jakeman, “Emission polar-
ization of roughened glass and aluminum surfaces,” Appl. Opt.35, 3583–3590 ~1996!.
23. B. van Ginneken, M. Stavrid, and J. J. Koenderink, “Diffuseand specular reflectance from rough surfaces,” Appl. Opt. 37,130–139 ~1998!.
24. S. F. Nee and T. W. Nee, “Polarization of scattering by roughsurfaces,” in Scattering and Surface Roughness II, Z. Gu and A.Maradudin, eds., Proc. SPIE 3426, 169–180 ~1998!.
25. W. J. Tropf, M. E. Thomas, and T. J. Harris, “Properties ofcrystals and glasses,” in Handbook of Optics, M. Bass ed.~McGraw-Hill, New York, 1995!, p. 33.67, Table 23.
26. J. E. Harvey and C. L. Vernold, “Transfer function character-ization of scattering surfaces: revisited,” in Scattering andSurface Roughness, Z. Gu and A. Maradudin, eds., Proc. SPIE3141, 113–127 ~1997!.
27. J. E. Harvey, “Light-scattering characteristics of optical sur-faces,” Ph.D. dissertation ~University of Arizona, Tucson, Ariz.,1976!.
28. R. M. A. Azzam and N. M. Bashara, Ellipsometry and Polar-ized Light ~North-Holland, Amsterdam, 1977!, p. 174.
29. S.-M. F. Nee, “Error analysis of null ellipsometry with depo-larization,” Appl. Opt. 38, 5388–5398 ~1999!.
1 April 2000 y Vol. 39, No. 10 y APPLIED OPTICS 1569