Embed Size (px)
Citation preview

Slide Title
(2nd Line)
TRIYARDS HOLDINGS LIMITED
Investor Presentation
15 January 2014

Slide Title
(2nd Line)
DISCLAIMER
This presentation contains forward-looking statements concerning the financial condition, results of operations and businesses of Triyards Holdings Limited (“Triyards” or the “Company”). All statements other than statements of historical fact are, or may be deemed to be, forward-looking statements. Forward-looking statements are statements of future expectations that are based on management’s current expectations and assumptions and involve known and unknown risks and uncertainties that could cause actual results, performance or events to differ materially from those expressed or implied in these statements. Forward-looking statements include, among other things, statements concerning the potential exposure of Triyards to market risks and statements expressing management’s expectations, beliefs, estimates, forecasts, projections and assumptions. Although the Company believes that the expectations reflected in such forward-looking statements are reasonable, it can give no assurance that such expectations will prove to have been correct. All forward looking-statements contained in this presentation are expressly qualified in their entirety by the cautionary statements contained or referred to in this section. Readers should not place undue reliance on forward-looking statements. Each forward looking statement speaks only as of the date of this presentation. Neither the Company nor any of its subsidiaries and associates undertake any obligation to publicly update or revise any forward-looking statement as a result of new information, future events or other information. In light of these risks, results could differ materially from those stated, implied or inferred from the forward-looking statements contained in this presentation.

Slide Title
(2nd Line) Introducing TRIYARDS
1 • On Vision and Mission
2 • Our Yards
3 • Scope of Services
4 • Our Competitive Strengths
5 • Our Track Record
6 • Strategies for Growth
7 • Outlook and Prospects
8 • Financial Highlights

Slide Title
(2nd Line) Our Vision and Mission
Our VISION is to be the preferred engineering, ship construction and fabrication solutions provider to the offshore oil and gas, and marine industries globally.
Our MISSION is to consistently create value for our clients by providing quality, cost-effective products on time and on budget.
Slide Title
(2nd Line)
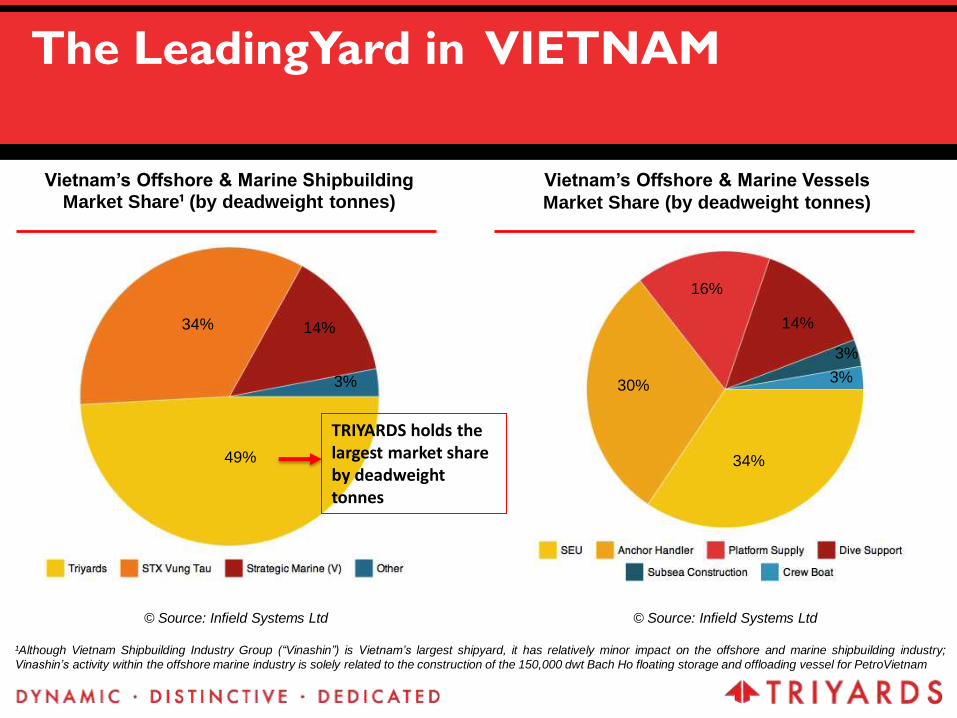
The LeadingYard in VIETNAM
Vietnam’s Offshore & Marine Shipbuilding Market Share¹ (by deadweight tonnes)
Vietnam’s Offshore & Marine Vessels
Market Share (by deadweight tonnes)
© Source: Infield Systems Ltd © Source: Infield Systems Ltd
¹Although Vietnam Shipbuilding Industry Group (“Vinashin”) is Vietnam’s largest shipyard, it has relatively minor impact on the offshore and marine shipbuilding industry;
Vinashin’s activity within the offshore marine industry is solely related to the construction of the 150,000 dwt Bach Ho floating storage and offloading vessel for PetroVietnam
14% 34%
49%
3%
TRIYARDS holds the largest market share by deadweight tonnes
3%
30%
34%
3%
16%
14%

Slide Title
(2nd Line)
OUR YARDS
TRIYARDS SSY (Ho Chi Minh, Vietnam)
• Size of facility: 100,000sqm
• Water Frontage: 340m
• Undercover workshop: 50,000sqm
- Includes block shops, erection shops,
outfitting shops, piping shops, machine
shop, electrical shop, blasting & painting
shops
• Industrial activities yard: 80,000sqm
- with 100T hydraulic transporter, 10 – 50T
gantry cranes & 250T crawler cranes, etc.
• Launching way: 61m x 141m
• Marine outfitting quay: max 10m draft

Slide Title
(2nd Line) OUR YARDS
TRIYARDS SOFEL (Vung Tau, Vietnam)
• Size of facility: 134,000sqm
• Water Frontage: 347m
• Undercover workshop: 20,858sqm
- Includes block shops, outfitting shops, piping
shops, machine shop, electrical shop, blasting &
painting shops
• Industrial activities yard: 96,000sqm
- with 100T hydraulic transporter, 120T A crane &
250T crawler crane
• Skid-way: 26m x 130m
• Launching way: 52m x 175m
• Marine outfitting quay: Max 10m draft

Slide Title
(2nd Line)
• Size of facility: More than 650,000 square feet of
fabrication facilities, including two steel burning machines,
fabrication area with overhead cranes, machine shop, and
hydraulics bay
• Undercover workshop: Fabrication facility exceeding
200,000 square feet
• Industrial activities Yard: Cranes, winches, A-frames
and other hydraulic and electric marine deck handling
equipment
OUR YARDS
TRIYARDS Houston

Slide Title
(2nd Line)
Our Scope of Products and Services
Offshore fabrication (FPSO Turret, CALM Buoy)
Offshore Heavy Lift Equipment (Knuckle Boom Crane, Leg Encircling Crane)
Ship repair & conversion
Industrial Fabrication (Diverters for refineries and power plants)
Offshore Support &
Construction Vessels
Offshore Service
Platform (SEU) &
Drilling Rig (TDU)
We perform work for turn-key projects

Slide Title
(2nd Line)
Slide Title
(2nd Line)
Our Competitive Strengths
Leading market position in
South East Asia for SEUs
Strong track record capability
for sophisticated vessels
Experienced
management team and
integrated project
management capability
Strategic locations in
Vietnam
Competitive position
Design and fabrication for
offshore equipment

Slide Title
(2nd Line)
Underpenetrated SEU market in Asia
Region No. of SEUs No. of platforms Ratio of platforms per SEUs
North America 240 3,257 14
Southeast Asia, Middle East and West Africa
54 3,266 60
Source: Macquarie Research, July 2013
Only 1 SEU per 60 platforms in Southeast Asia, Middle East and West Africa, as compared to 1
SEU per 14 platforms in North America
No. of SEUs

Slide Title
(2nd Line)
Why SEU? (replacing the tender barge)
Operationally superior to tender barge: Self-propelled, facilitating intra-field movement without AHTS Significant reduction in downtime, due to harsh weather condition Offer safer operating condition Competitive day-rate\

Slide Title
(2nd Line)
Value Proposition of SEUs
SEUs
Mobility Safety Cost-Efficiency Accommodation
• Self-propelled
• eliminates
need for third
party tugs
• adjustable
height provides
stable platform
• safer than a
barge
• reduce downtime of
production wells and
reliance on barges
• can accommodate as
many as 150-200
personnel on board
Source: Macquarie Research, July 2013
• Self-propelled, self elevating offshore working platforms, with large open deck space
• Performs range of services – repair & maintenance of platforms, well servicing, accommodation
• Ability to reposition at offshore site or move to new location without assistance

Slide Title
(2nd Line) End Users of SEUs – Global outreach
Brunei Offshore
Bintulu Offshore
Indonesia Nigeria
Slide Title
(2nd Line)
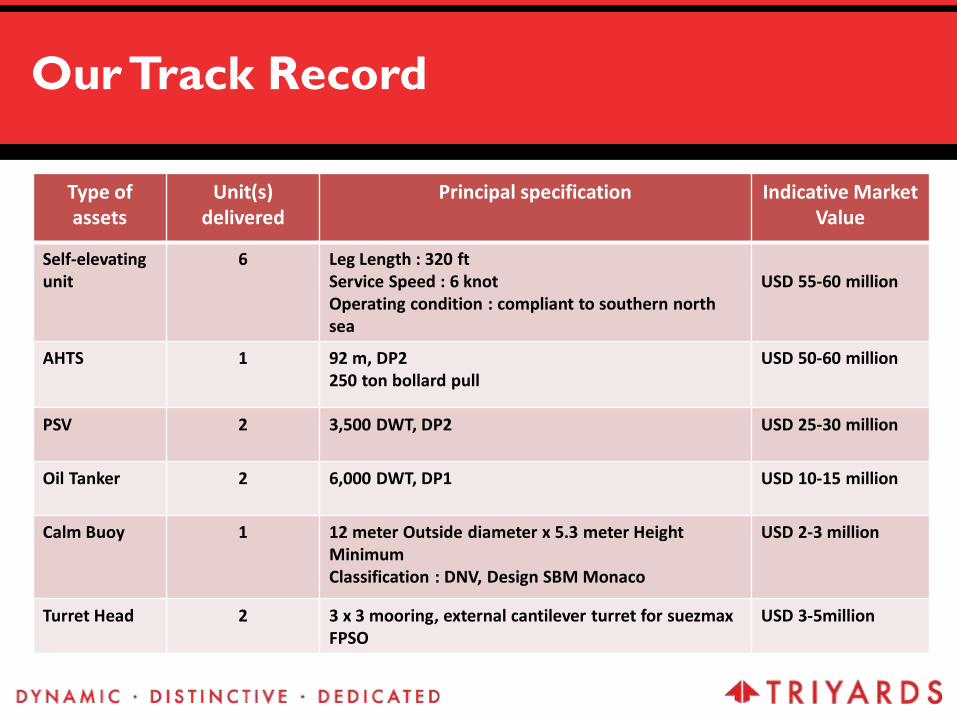
Type of assets
Unit(s) delivered
Principal specification Indicative Market Value
Self-elevating unit
6 Leg Length : 320 ft Service Speed : 6 knot Operating condition : compliant to southern north sea
USD 55-60 million
AHTS 1 92 m, DP2 250 ton bollard pull
USD 50-60 million
PSV 2 3,500 DWT, DP2 USD 25-30 million
Oil Tanker 2 6,000 DWT, DP1 USD 10-15 million
Calm Buoy 1 12 meter Outside diameter x 5.3 meter Height Minimum Classification : DNV, Design SBM Monaco
USD 2-3 million
Turret Head 2 3 x 3 mooring, external cantilever turret for suezmax FPSO
USD 3-5million
Our Track Record

Slide Title
(2nd Line) Our Track Record- other oil & gas
applications
TURRET HEAD
FPSO PERISAI KAMELIA CALM BUOY – SBM MONACO

Slide Title
(2nd Line) Constellation Facts
8.5 million man hours with zero fatal incident
Hull and structural outfitting - 26,900T of steel, from
grade A to EH69. - Capability of handling
exotic materials Electrical - 860km of cables
(from fiber optic to 6.6kV cables)
Piping - 180km of piping (PVC-GRE-SS-C/S-Copper)

Slide Title
(2nd Line) Integrated Capabilities
• Reels & Cradles fabricated by SOFEL
• 80 Ton Crane fabricated by Houston
Slide Title
(2nd Line) Our Strategies for Growth

Slide Title
(2nd Line)
PROGRESSION
OF PRODUCTS
2007: 1st Generation SEU
Leg Length: 320 feet
Water Depth: 70m
Accommodation: 160 personnel
2012: 2nd Generation SEU
Leg Length: 450 feet
Water Depth: 80m
Accommodation: 300 personnel
2013: 3rd Generation SEU
Leg Length: 530 Feet
Water Depth: 121m
Accommodation: 220 personnel
Premium Class, HPHT.

Slide Title
(2nd Line)
Introducing TDU-400
Lighter in overall weight, compared to other rigs of its
own class
Increased deck strength; enhancing storage for today’s
most advanced drilling tools
Exceed Class rules for 100 knots wind and wave criteria
Global operation in 400ft of working water depth
32,500ft drilling depth
1,500,000 hook load
80 ft cantilever reach
Maximize fluid volumes, dry bulk storage capacity
Innovative modular electrical outfitting approach to
maximize construction efficiency and minimize
commissioning time

Slide Title
(2nd Line)
Capabilities Comparisons of
TDU-400 Drilling Rig
Designer
Britain Singapore USA Europe
Triyards
(TDU 400)
Working Water Depth (ft)
400 400 400 350 400
Wave Criteria @ 100 kt wind (ft)
60 (info not available)
(info not available)
60 54
Wind Speed (kt)
100 (info not available)
(info not available)
100 100
Cantilever reach to well enter (ft)
75 70 80 70 80
Max hook load @ max Cantilever
reach (kips)
2000 1500 2000 1485 1500
Accommodations
140 150 150 120 220
Drill Depth (ft)
35000 30000 35000 30000 35000

Slide Title
(2nd Line)
We remain focused on our strategies
Focused on the design and construction of SEUs and sophisticated OSVs
Develop own offshore equipment product line and branding for offshore equipment (i.e. cranes, A-frames, winches)
Expand ship repair business
Expand into new product categories such as fabrication of aluminium-based vessels
Establish presence in new markets (i.e. Brazil, Australia)

Slide Title
(2nd Line) Milestones
Mainboard Listing:
Debut on SGX-ST
Contract Win: US$90m
contract for BH 450 SEU
Proprietary SEU Design:
Launched TDU-400
(400ft drilling jack-up)
15 Nov 2012
28 Oct 2013
01 Jul 2013
07 May 2013
17 Aug 2013
18 Oct 2012
New Revenue Stream:
Commissioned 10,000 tonne
floating dock and secured 1st third
party ship repair deal
Contract Win: US$60m
for BH 335 SEU
9 Jan 2013 Strong Financial Support:
Established US$250m
Multicurrency Debt
Issuance Programme
Contract Win: US$59m
contract for BH 335 SEU
and turret construction

Slide Title
(2nd Line) Outlook and Prospects

Slide Title
(2nd Line)
Outlook and Prospects
0
2,000
4,000
6,000
8,000
10,000
12,000
2007 2008 2009 2010 2011 2012 2013e 2014e 2015e 2016e
Africa Asia Australasia Europe Latin America Middle East North America
Capex for offshore oilfield infrastructure expected to grow from US$341 billion during 2007/2011
to more than US$589 billion during 2012/16. Largest share of this growth in capex is in shallow
waters in South East Asia and Middle East
Asia in growing trend of Offshore CAPEX
Source: Infield Systems Ltd

Slide Title
(2nd Line) Financial Highlights
Slide Title
(2nd Line)
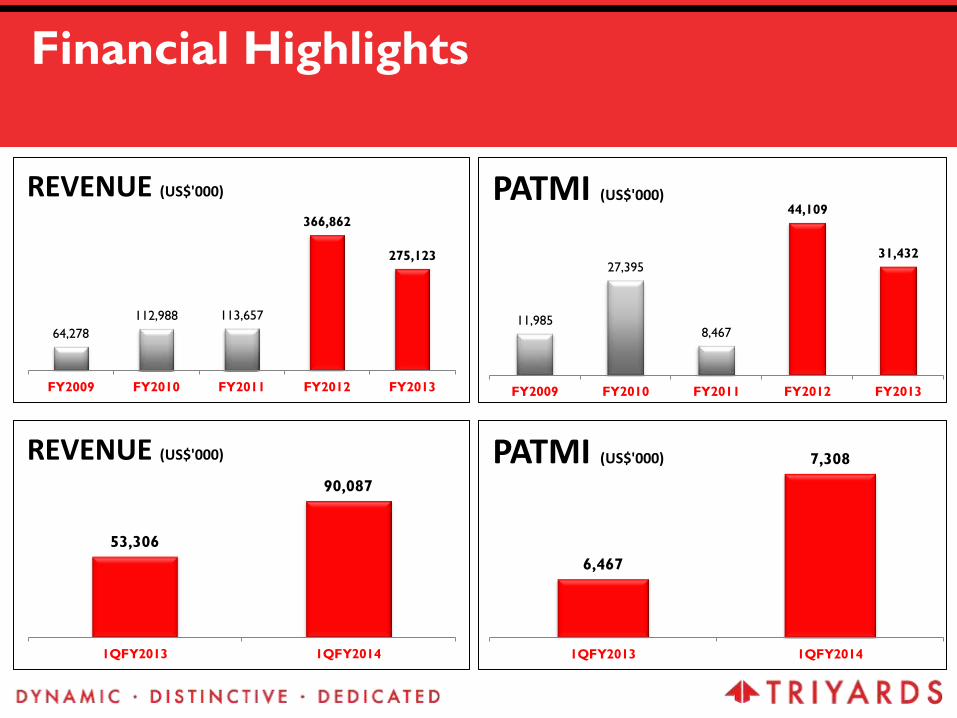
Financial Highlights
64,278
112,988 113,657
366,862
275,123
FY2009 FY2010 FY2011 FY2012 FY2013
REVENUE (US$'000)
11,985
27,395
8,467
44,109
31,432
FY2009 FY2010 FY2011 FY2012 FY2013
PATMI (US$'000)
53,306
90,087
1QFY2013 1QFY2014
REVENUE (US$'000)
6,467
7,308
1QFY2013 1QFY2014
PATMI (US$'000)

Slide Title
(2nd Line)
Financial Highlights
Generated a positive operating cashflow of US$15.8 million for FY13 compared to operating net outflow of
US$11.1 million in the previous corresponding year.
Largely boosted by the positive results as well as diligent working capital management.
FY2009 FY2010 FY2011 FY2012 FY2013
Operating 23,109 37,347 (16,881) (11,087) 15,752
Investing (33,249) (12,162) (30,188) (14,650) (33,019)
Financing 4,237 9,916 13,583 28,187 25,267
-40000
-30000
-20000
-10000
0
10000
20000
30000
40000
50000
FY09 FY10 FY11 FY12 FY13
US$ 000
Operating Cashflow Investing Cashflow Financing Cashflow

Slide Title
(2nd Line)
Financial Highlights
Development of SSY
Development of SOFEL Acquisition of Houston yard
Floating Dock TDU 400 Design
NTA increased mainly derived from increase in retained earning
25,026
52,541 60,889
104,998
147,210 154,518
FY2009 FY2010 FY2011 FY2012 FY2013 1QFY14
SHAREHOLDERS’ FUND(US$'000)
45,661
54,211
79,906
89,181
102,189 101,676
FY2009 FY2010 FY2011 FY2012 FY2013 1QFY14
FIXED ASSETS (US$'000)

Slide Title
(2nd Line)
Financial Highlights
US$’000 As at 31
Aug 2013
As at 30
Nov 2013
Current assets 210,091 242,461
Non-current assets 109,831 109,343
Current liabilities 172,645 197,219
Non-current
liabilities 67 67
Total Equity 147,210 154,518
Interest cover
(times) (2) 16.90 11.91
Current ratio 1.22 1.23
Return on equity 21% -
(*) Net cash position
(1) – Net Debt / Equity (2) - EBITDA/Interest Expense
0.44
0.55 0.56
0.52 0.54
0.25
0.36
0.19
0.09 0.09
FY2009 FY2010* FY2011 FY2012 FY2013 1QFY14
GEARING RATIO (1)
Overall CAPEX

Slide Title
(2nd Line) ORDERBOOK
Current Orderbook as at 31 August 2013
Net contract value amount to approximately US$217m
Vessel Type Specifications Type of
Customer
Year of
Contract
Year of
Expected
Delivery
Self-elevating unit 425 ft leg length Sale to third party 2012 2014
Self-elevating unit 425 ft leg length Sale to third party 2012 2014
Self-elevating unit 335 ft leg length Sale to third party 2013 2014
SCV (Lewek
Constellation)
DP3, 3,000 MT crane,
deepwater multi-lay
pipelay vessel
Sale to Ezra Group 2011 2014
US$59m contract wins announced in October 2013 comprising 10th SEU and
turret for an FSO unit

Slide Title
(2nd Line)
Q&A