Embed Size (px)
Citation preview

Interim Results
Six Months to
30 September 2017

2
Introduction
Nick Kelsall
Group Chief
Executive

3
➢ Revenue increased by 7.2% on a constant
currency basis
➢ Underlying operating profit increased by
6.4% to £11.7m
➢ Underlying profit before tax increased by
9.5% to £11.5m
➢ Strong underlying operating cash
generation, net debt reduced by £2.4m to
£20.8m
➢ Interim dividend increased by 8.3% to 2.6p
➢ Announcement of acquisition of Merlyn –
compelling strategic and financial rationale
Highlights
1 On a constant currency basis
Revenue1
£145.0m
Underlying operating profit
£11.7m
Underlying Profit before tax
£11.5m
Underlying Operating Cash
£16.2m
Underlying Diluted EPS
14.0p
Dividend per share
2.6p
+7.2%
+6.4%
+1.3%
+8.5%
+9.5%
+8.3%

4
Financial Review
Shaun Smith
Group Finance
Director

5
Income Statement
1 Underlying means before exceptional operating items, IAS19R admin costs, acquisition related costs and where relevant, non-cash finance costs
2 Business unit restructuring
3 See page 36 for details
4 Includes £1.8m increase in charges relating to “mark to market” on FX forward contracts
H1
Sept 2017
£m
H1
Sept 2016
£m
+/-
Reported
+/-
Constant
Currency
FY
Mar 2017
£m
Revenue 145.0 128.8 +12.6% +7.2% 271.2
Underlying1 operating profit 11.7 11.0 +6.4% 23.8
Return on Sales 8.1% 8.5% 8.8%
Finance charges – cash (0.2) (0.5) (0.9)
Underlying1 PBT 11.5 10.5 +9.5% 22.9
Exceptional operating items2 - - (2.3)
IAS19R admin expenses (0.7) (0.9) (2.0)
Acquisition related costs3 (1.2) (1.3) (2.7)
Finance charges – non cash4 (2.2) (0.6) (4.4)
PBT as reported 7.4 7.7 -3.9% 11.5

6
Income Statement – Key Bridges
21.3
1 Constant currency basis
8.0
3.0
11.0
7.4
4.3
11.7
UK SA GroupSept '16 Sept '17
£m
9.2%
7.2%
8.5%
8.1%8.5%
7.8%
6.5
7.4
2.3
128.8
145.0
Sept '16 Currency UK SA Sept '17
£m
86.9
48.4
135.3
94.3
50.7
145.0
UK SA Group
Sept '16 Sept '17
£m
0.5 0.6 0.8
11.0
- -
11.7
Sept '16 Currency UK SA Sept '17
Revenue1Underlying operating profit / ROS%
Revenue Underlying operating profit
£m

7
1 Underlying means before exceptional operating items, IAS19R admin costs, acquisition related costs and where relevant, non-cash finance costs, and where relevant after attributable tax
Underlying1 Reported
2.60 2.40
7.20
Sep-17 Sep-16 Mar-17 FY
Dividend per share (pence)
14.0 12.9
27.8
Sep-17 Sep-16 Mar-17 FY
Diluted underlying EPS
➢ Effective underlying tax rate of 22.6% (2016:22.9%)
➢ Diluted underlying1 EPS up 8.5% at 14.0p (2016: 12.9p)
➢ Interim dividend up 8.3% to 2.6p (2016: 2.4p)
H1
Sept
2017
£m
H1
Sept
2016
£m
FY
Mar
2017
£m
H1
Sept
2017
£m
H1
Sept
2016
£m
FY
Mar
2017
£m
Profit before Tax 11.5 10.5 22.9 7.4 7.7 11.5
Tax charge (2.6) (2.4) (5.3) (1.9) (1.6) (3.0)
Earnings 8.9 8.1 17.6 5.5 6.1 8.5
Effective Tax rate 22.6% 22.9% 23.1% 25.7% 20.8% 26.1%
Tax, Earnings and Dividends

8
Cash Flow
109%113%
99%
Sep-17 Sep-16 Mar-17 FY
Cash conversion1
1.3 1.3 1.3
Sep-17 Sep-16 Mar-17 FY
Capex / Depreciation (times)
H1
Sept 2017
£m
H1
Sept 2016
£m
FY
Mar 2017
£m
Underlying EBITDA 14.8 14.1 30.2
Working capital 0.7 1.2 (1.8)
Share based payments 0.7 0.7 1.4
Underlying operating cash 16.2 16.0 29.8
Capital expenditure (4.1) (4.0) (8.0)
Pension deficit recovery (1.3) (1.2) (2.5)
Tax (2.5) 0.4 (1.9)
Underlying free cash flow pre
financing and dividends
8.3 11.2 17.4
Exceptional & acquisition related costs (2.0) (1.0) (1.8)
Interest (0.2) (0.8) (0.9)
Dividends (3.0) (2.7) (4.2)
Acquisition of subsidiaries - (2.7) (2.7)
New shares issued 0.4 - -
Net Cash Flow 3.5 4.0 7.8
1 Underlying Operating Cash Flow / Underlying EBITDA

9
20.8
27.5
23.2
Sep-17 Sep-16 Mar-17
£m Net debt (IFRS)
0.7
1.0
0.8
Sep-17 Sep-16 Mar-17
times Leverage - Net debt (IFRS) to pro-forma EBITDA
52.1
97.8
62.7
Sep-17 Sep-16 Mar-17
£m IAS 19 Gross UK Pension Deficit
➢ IAS19R deficit reduced to £52.1m (March 17: £62.7m,
September 16: £97.8m)
➢ Strong cash generation reduced net debt to £20.8m (March 17:
£23.2m, September 16: £27.5m)
➢ Leverage 0.7 times underlying EBITDA
Balance Sheet

10
Financial Highlights
➢ Revenue £30.7m,EBIT £6.4m,EBITDA £6.8m (Y/E 31 March 2017)
➢ Expected to be earnings accretive in first full year to 31 March 2019
➢ Targeted to deliver pre-tax ROCE in excess of 13% in Y/E 31 March 2019
Funding structure
➢ Consideration £60m debt free, cash free basis (subject to certain adjustments)
➢ Funding structure
▪ Equity £31.4m, 18,254,161 new shares issued, eligible for interim dividend
▪ Bank debt facility increased to £120m plus £30m accordion.
▪ Maturity extended to November 2021 (with option to extend to November 2022)
➢ Pro forma Net Debt to EBITDA 1.3x at March 2018
➢ Provides capital flexibility to execute on growth opportunities
Merlyn Financial highlights & Funding structure
11
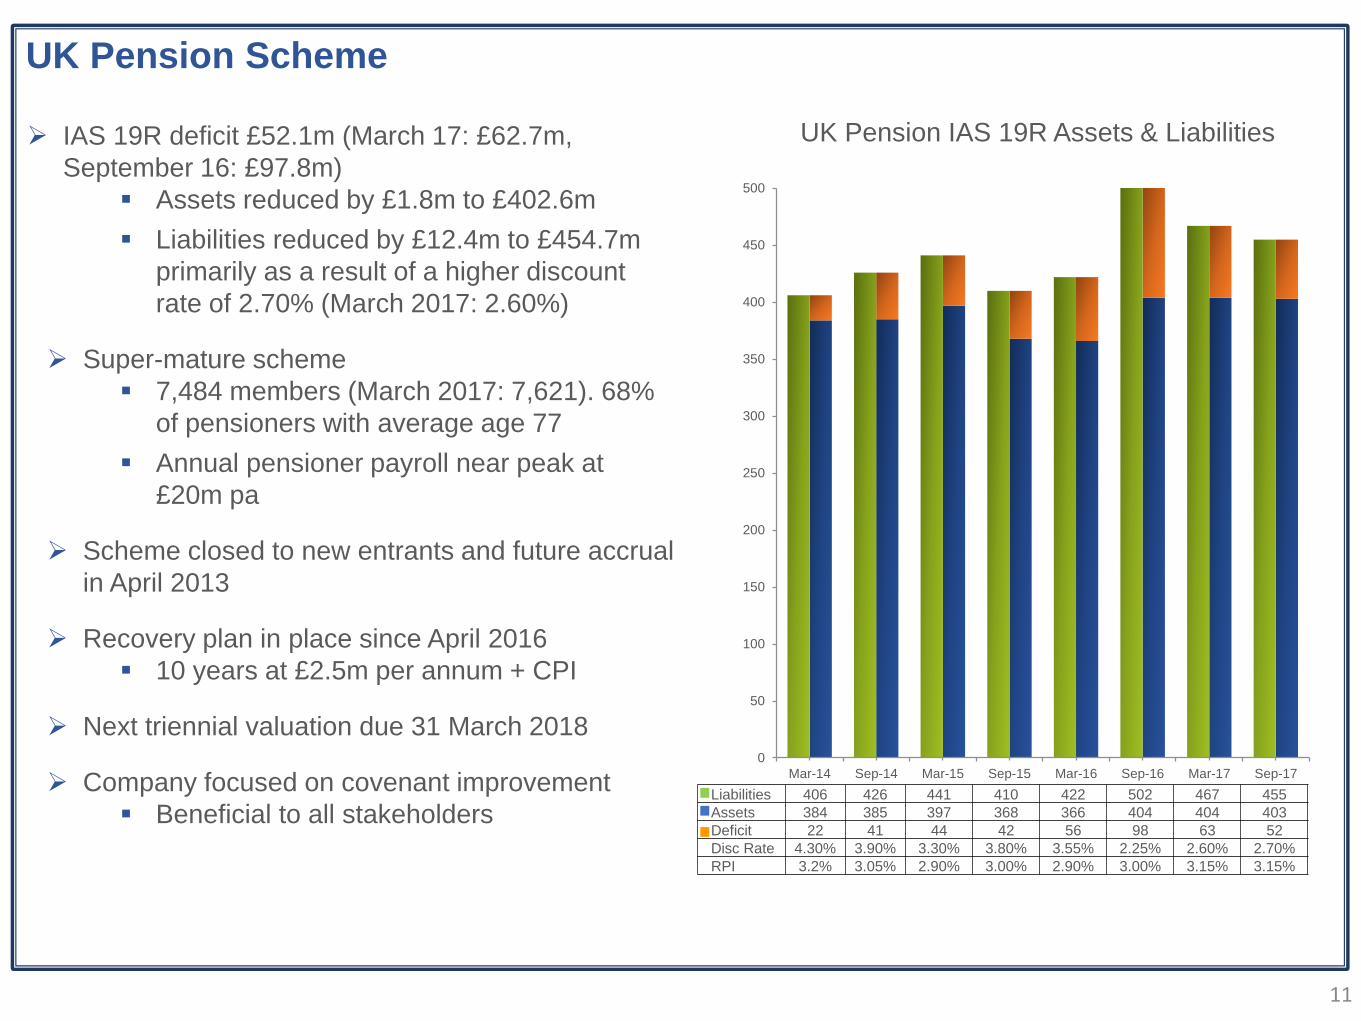
Liabilities 406 426 441 410 422 502 467 455
Assets 384 385 397 368 366 404 404 403
Deficit 22 41 44 42 56 98 63 52
Disc Rate 4.30% 3.90% 3.30% 3.80% 3.55% 2.25% 2.60% 2.70%
RPI 3.2% 3.05% 2.90% 3.00% 2.90% 3.00% 3.15% 3.15%
➢ IAS 19R deficit £52.1m (March 17: £62.7m,
September 16: £97.8m)
▪ Assets reduced by £1.8m to £402.6m
▪ Liabilities reduced by £12.4m to £454.7m
primarily as a result of a higher discount
rate of 2.70% (March 2017: 2.60%)
➢ Super-mature scheme
▪ 7,484 members (March 2017: 7,621). 68%
of pensioners with average age 77
▪ Annual pensioner payroll near peak at
£20m pa
➢ Scheme closed to new entrants and future accrual
in April 2013
➢ Recovery plan in place since April 2016
▪ 10 years at £2.5m per annum + CPI
➢ Next triennial valuation due 31 March 2018
➢ Company focused on covenant improvement
▪ Beneficial to all stakeholders
UK Pension IAS 19R Assets & Liabilities
UK Pension Scheme
Mar-14 Sep-14 Mar-15 Sep-15 Mar-16 Sep-16 Mar-17 Sep-17
0
50
100
150
200
250
300
350
400
450
500
Mar-14Sep-14Mar-15Sep-15Mar-16Sep-16Mar-17Sep-17

12
Operating Review
Nick Kelsall
Group Chief
Executive

13
Triton
Group Revenue (6 months to 30 September 2017)
Johnson Tiles
TAL
Tile Africa
Group Revenue (constant currency)
Vado
Croydex
Abode
Adhesives
Johnson Tiles
Johnson Tiles
TAL
Tile Africa
SA
£50.7m
£ 5.9m
£ 12.3m
£ 32.5m
+4.8%
Group
££145.0m
+7.2%
£94.3m
UK
£ 24.5m
£ 20.8m
£ 12.3m
£ 25.8m
+8.5%
£ 6.5m
£ 4.4m
Business Overview

14
UK Operations
Nick Kelsall
Group Chief
Executive
15
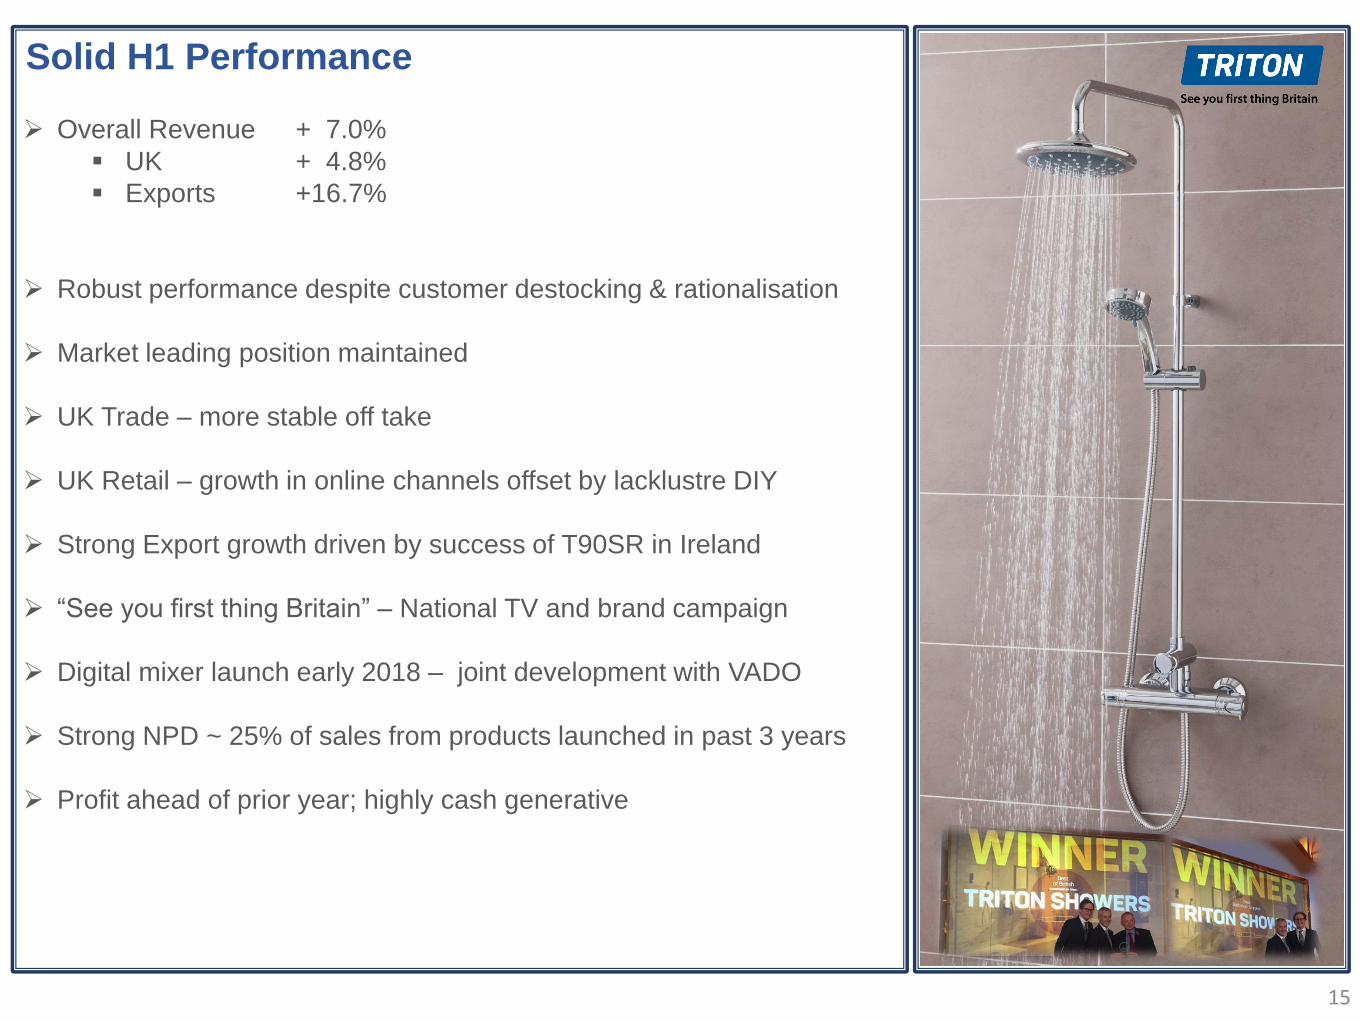
➢ Overall Revenue + 7.0%
▪ UK + 4.8%
▪ Exports +16.7%
➢ Robust performance despite customer destocking & rationalisation
➢ Market leading position maintained
➢ UK Trade – more stable off take
➢ UK Retail – growth in online channels offset by lacklustre DIY
➢ Strong Export growth driven by success of T90SR in Ireland
➢ “See you first thing Britain” – National TV and brand campaign
➢ Digital mixer launch early 2018 – joint development with VADO
➢ Strong NPD ~ 25% of sales from products launched in past 3 years
➢ Profit ahead of prior year; highly cash generative
Solid H1 Performance
16
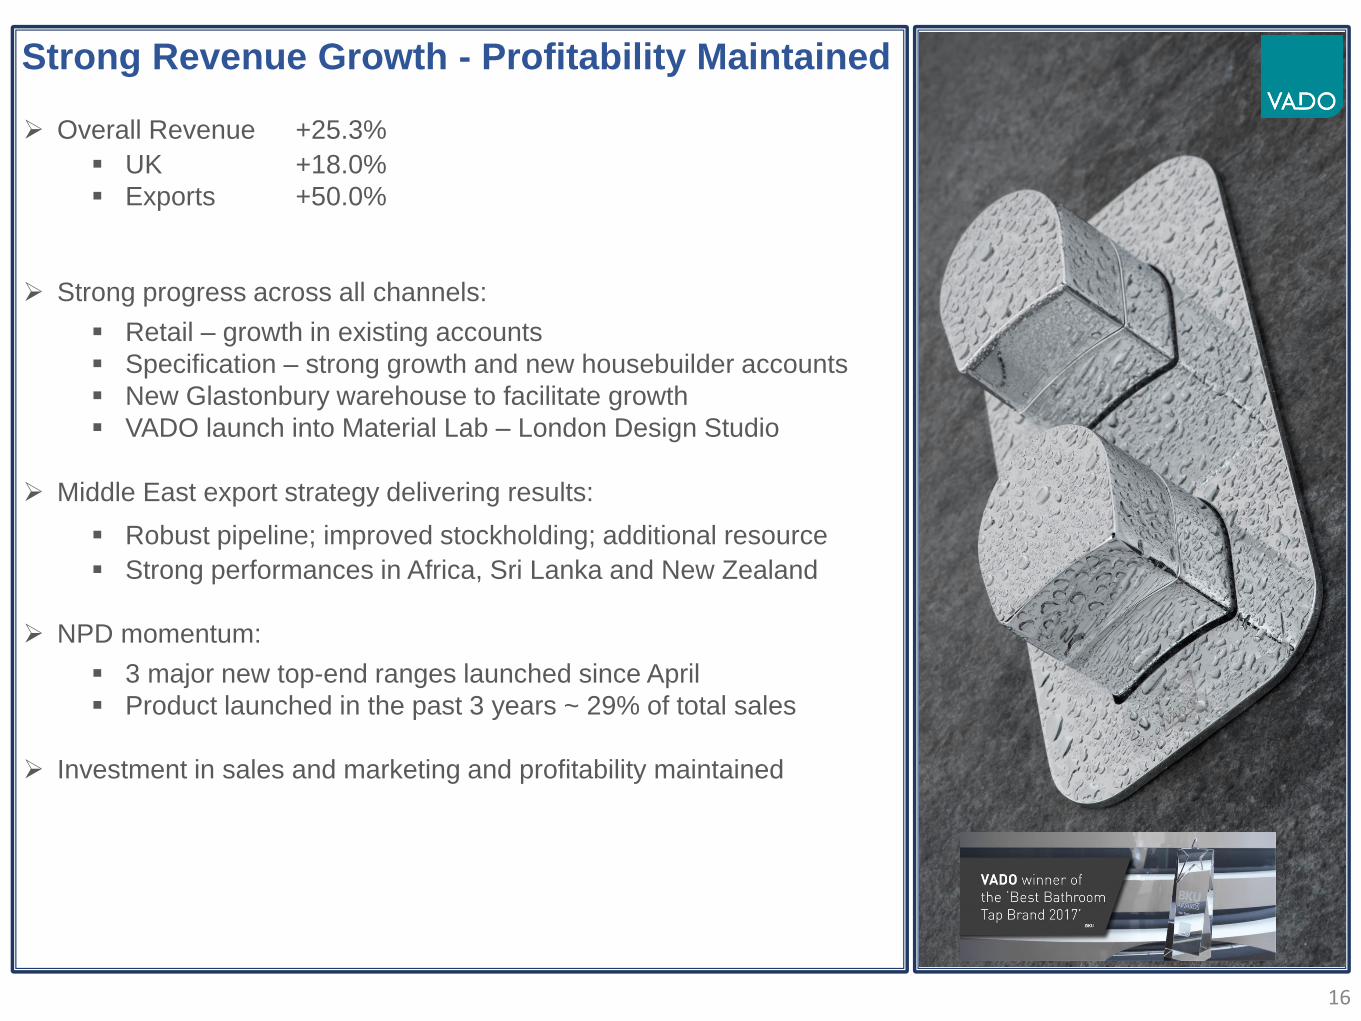
➢ Overall Revenue +25.3%
▪ UK +18.0%
▪ Exports +50.0%
➢ Strong progress across all channels:
▪ Retail – growth in existing accounts
▪ Specification – strong growth and new housebuilder accounts
▪ New Glastonbury warehouse to facilitate growth
▪ VADO launch into Material Lab – London Design Studio
➢ Middle East export strategy delivering results:
▪ Robust pipeline; improved stockholding; additional resource
▪ Strong performances in Africa, Sri Lanka and New Zealand
➢ NPD momentum:
▪ 3 major new top-end ranges launched since April
▪ Product launched in the past 3 years ~ 29% of total sales
➢ Investment in sales and marketing and profitability maintained
Strong Revenue Growth - Profitability Maintained
17
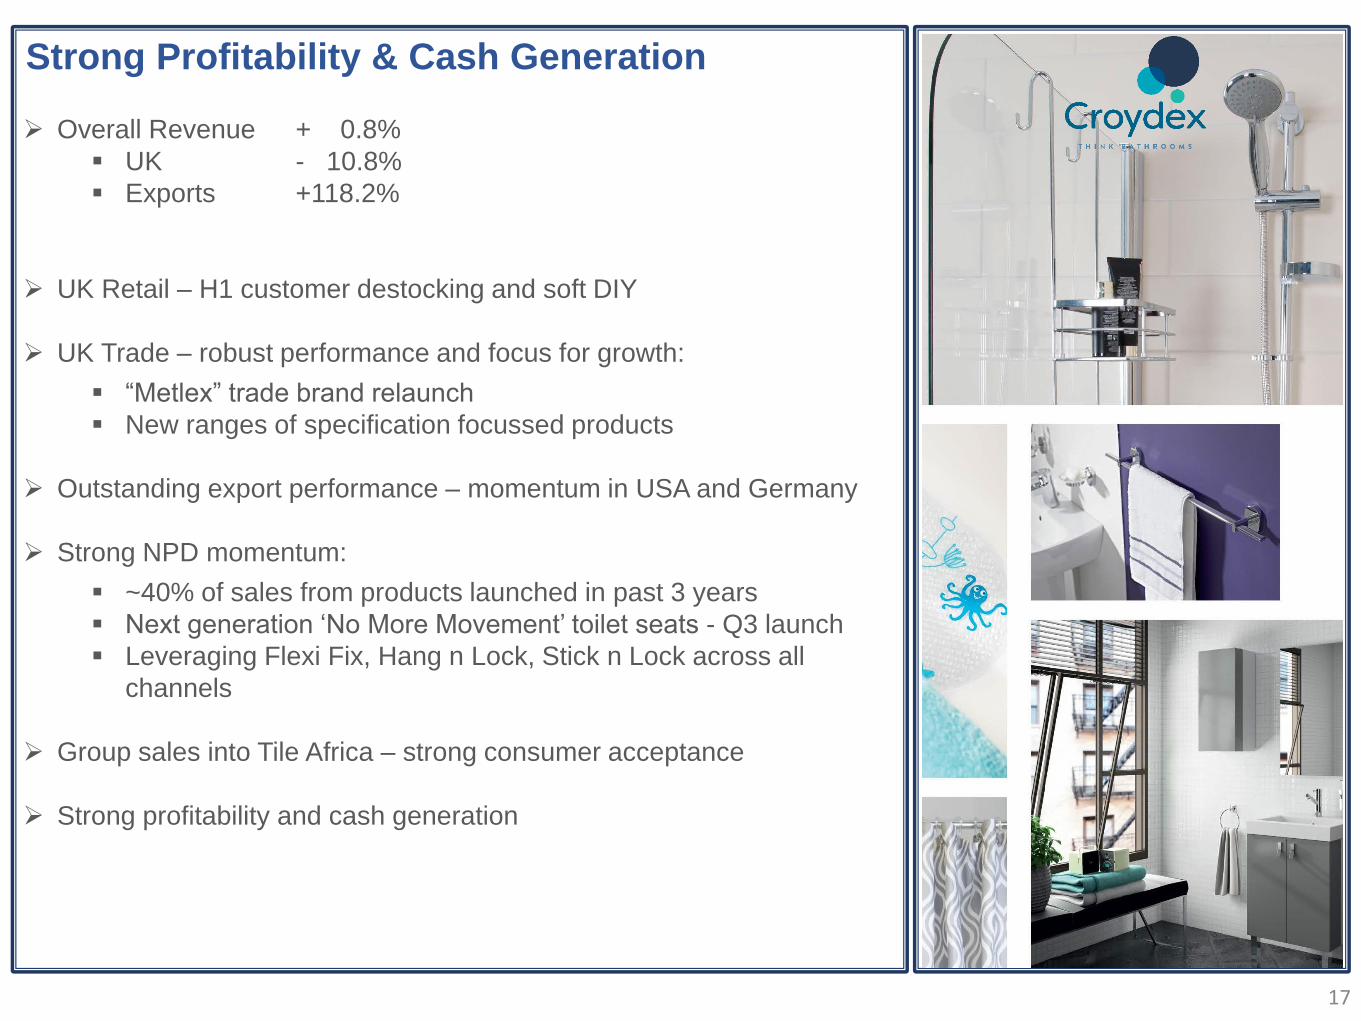
➢ Overall Revenue + 0.8%
▪ UK - 10.8%
▪ Exports +118.2%
➢ UK Retail – H1 customer destocking and soft DIY
➢ UK Trade – robust performance and focus for growth:
▪ “Metlex” trade brand relaunch
▪ New ranges of specification focussed products
➢ Outstanding export performance – momentum in USA and Germany
➢ Strong NPD momentum:
▪ ~40% of sales from products launched in past 3 years
▪ Next generation ‘No More Movement’ toilet seats - Q3 launch
▪ Leveraging Flexi Fix, Hang n Lock, Stick n Lock across all
channels
➢ Group sales into Tile Africa – strong consumer acceptance
➢ Strong profitability and cash generation
Strong Profitability & Cash Generation

18
➢ Overall Revenue + 16.1%
➢ Excellent H1 revenue performance – increasing momentum
➢ Major new account wins: Travis Perkins, Benchmarx and Wickes
➢ Branded revenue growth across all product categories
➢ NPD momentum maintained:
▪ Strong sales of PRONTEAU “3-in-1” hot water tap
▪ New tap and new sink designs to launch 2018
➢ Designer Kitchen & Bathroom Awards - Gold Design Award
➢ Supply chain opportunities progressing – leveraging Group expertise
➢ Good profits and cash generation
Strong H1 Performance

19
➢ Overall Revenue + 1.6%
▪ UK + 4.0%
▪ Exports - 16.7%
➢ Improved UK Retail & robust Trade offset challenging Export
➢ UK Retail + 9.8% – improved performance despite challenging market
➢ UK Trade - 0.8% – robust specification and housebuilder channel
offset by soft social housing sector
➢ Export – tough market environment:
▪ Exit from low margin Middle East business
▪ Lacklustre French market
▪ Adverse political situation impacting Oman & Qatar
➢ CristalGrip – rolled out in France & trials in Spain
➢ Operations restructure to improve performance and manufacturing
flexibility – progressing to plan
➢ CristalGrip start up costs and timing of restructuring benefits resulted in
a H1 operating loss
Revenue Growth and Restructuring On Plan

20
➢ Overall Revenue + 4.8%
▪ UK 0.0%
▪ Exports +66.7%
➢ UK performance impacted by exit of low margin retail account in H2
FY17
➢ Robust trade revenues in a subdued market
➢ Middle East – revenue momentum:
▪ Warehouse established; shared office facility with VADO
▪ Increased sales of specialist products
▪ Solid project pipeline
➢ Investment sustained in NPD:
▪ “Pro Gyp-base” – fast track anhydrite screed system
▪ 4 in 1 Grouts – efflorescent resistant
➢ Further infrastructure investment – capacity upgrade and warehouse
management system
➢ Profits marginally below prior year but strong revenue momentum
Strong Export Momentum

21
➢ Leading position in growing shower enclosure market
➢ Premium branded proposition
➢ Culture of innovation and product development
➢ Successful multi-channel sales strategy
➢ Track record of organic growth; highly profitable and
cash generative
➢ Further growth opportunities
DELOITTE BEST MANAGED COMPANY
2016INNOVATION 4 GROWTH PROGRAMME
MOST INNOVATIVE COMPANY
2016CCMA CONTACT CENTRE OF THE YEAR
2015EY ENTREPRENEUR OF THE
YEAR FINALIST
2017
Product(1)
Geography(1)
End market(1)
Doors & Enclosures 81%
Trays 10%
Bath screens 9%
UK 86%
Ireland 13%
Export 1%
RMI 75%
New build 25%
21.4
26.7
30.7
2015 2016 2017
Revenue (£m)
2.7
4.4
6.4
2015 2016 2017
Operating profit (£m)
Compelling Strategic Fit

22
Compelling strategic fit - Multi Channel Strategy
Independent
Retail /
Regional
Merchants
Distribution
Largest and most established of
Merlyn's sales channels, with the
Business serving this market
since inception in 2000.
Merlyn has served the
Distribution market since 2005.
Customers in this channel are
primarily specialist bathroom
product distributors who typically
buy in bulk and sell on to
independent merchants and
specifiers using their own
catalogues.
62%
4%
(1) Percentages relate to gross revenue pre-rebates and are unaudited
National
Merchants
Following Merlyn's success in the
Independent channel, the
Business began directly targeting
the national merchants in 2011,
with the 4 major players in the
space.
12%
Specification
Recognising the opportunity to
develop in the new build market,
Merlyn began specifically
targeting the Specification
channel in 2013.
22%
% revenue (1)

23
➢ Market leader in the UK and Ireland:
▪ Multi-brand/channel sales strategy
▪ Culture of innovation and design led product development
▪ Operational excellence – 99% OTIF and Stock Availability
▪ Award winning customer service
➢ Attractive channel mix:
▪ Independent retailers and regional merchants
▪ Specification
▪ National Merchants
▪ Distribution
➢ Operations (Kilkenny, Ireland & West Bromwich, UK):
▪ Strong management team
▪ Low capital intensity and scalability
▪ Components sourced from the Far East
▪ 84 employees
➢ Stand alone business unit – focus and business as usual
➢ Significant growth opportunities – enhanced by Norcros ownership
➢ Meaningful revenue synergies - customers/channels/specification
➢ Potential new export markets - SA, ME, France
Compelling Strategic Fit

24
22.9 24.5
48.716.6
20.8
37.2
12.212.3
24.7
5.66.5
10.6
25.425.8
53.2
4.2
4.4
7.9
H1 Sept 16 H1 Sept 17 FY Mar 17
Revenue
Triton Vado Croydex
Abode Johnson Tiles Adhesives
£86.9m
£182.3m
£94.3m
£8.0m£7.4m
£17.4m
9.2%7.8%
9.5%
H1 Sept 16 H1 Sept 17 FY Mar 17
Underlying Operating Profit
Underlying Operating Profit Return on Sales %
UK – Revenue Growth in Challenging Markets

25
SA Operations
Nick Kelsall
Group Chief
Executive

26
➢ Overall revenue - 3.3% at constant currency1
➢ Growth constrained by current plant capacity:
▪ Plan to deliver 10% increase
➢ Focus on servicing demand from Tile Africa
➢ Market remains soft; subdued housebuilding activity
➢ Export revenues – impact of Zimbabwe financial & import restrictions
➢ NPD momentum maintained:
▪ ~50% revenues from products launched in prior three years
▪ “Johnsons White” & new & updated ranges successfully launched
➢ Sustained strong manufacturing performance
➢ Profits ahead of prior year
1 Excludes inter-company sales to Tile Africa
RStrong Performance Constrained by Capacity

27
➢ Overall revenue + 5.1% at constant currency1
➢ Market leadership maintained
➢ Tile adhesive – growth driven by long standing key customers
➢ Construction products – progress in large commercial projects
➢ Export revenues – impact of Zimbabwe financial & import restrictions
➢ Sustained production performance in all three plants:
▪ Further investment to enhance capacity & efficiency
➢ Extensive NPD continues:
▪ Tile-to-Tile and water based epoxy grout launched; positive
feedback
▪ Robust pipeline of further initiatives
➢ Continued strong profit and cash generation; ahead of prior year
1 Excludes inter-company sales to Tile Africa
Strong Revenue and Profit Growth

28
➢ Overall revenue + 6.2% at constant currency
➢ Retail revenue growth despite challenging macro environment
➢ CX format “store-within-a-store” continues to drive performance
➢ Contract division – project delays impacting growth
➢ Growth across all categories - taps, showers, sanitary ware, bathroom
fittings, tiles & adhesives
➢ Group synergies – continued progress:
▪ Croydex accessories – strong momentum
▪ VADO & Evox ranges – 74% of H1 tap sales
➢ 32 stores & 2 franchises – new store and refurbishment pipeline:
▪ New Clearwater store opened October
▪ 2 stores to refurbish to CX format FY18
▪ 2 new stores FY19
➢ Good profit and cash generation
Retail Growth Driven by CX Format
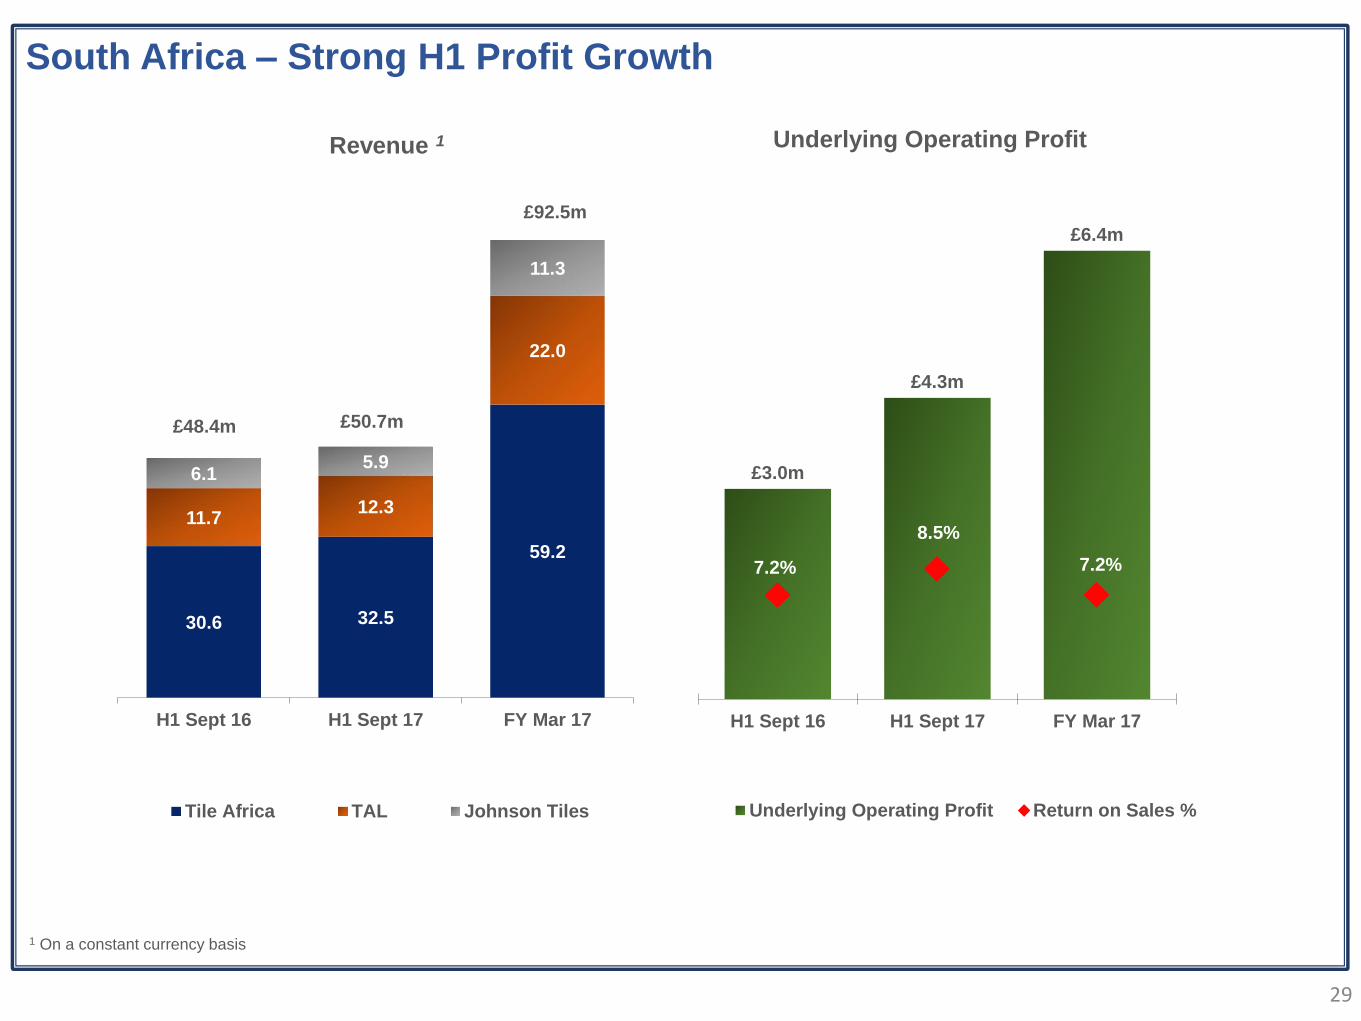
29
Underlying Operating Profit
30.6 32.5
59.2
11.712.3
22.0
6.15.9
11.3
H1 Sept 16 H1 Sept 17 FY Mar 17
Tile Africa TAL Johnson Tiles
£48.4m £50.7m
£92.5m
Revenue 1
£3.0m
£4.3m
£6.4m
7.2%
8.5%
7.2%
H1 Sept 16 H1 Sept 17 FY Mar 17
Underlying Operating Profit Return on Sales %
1 On a constant currency basis
South Africa – Strong H1 Profit Growth

30
Group Outlook &
Strategy
Nick Kelsall
Group Chief
Executive

31
Remains challenging
Subdued growth in key indicator for RMI
Subdued economic environment
Gradual recovery in transaction levels
GfK Consumer Confidence
-30
-25
-20
-15
-10
-5
0
5
10
Jan-13 Jan-14 Jan-15 Jan-16 Jan-17
Volatile post Brexit
Source: GfK – October 2017
0
40,000
80,000
120,000
160,000
200,000
Housing TransactionsSource: HMRC - October 2017
Hardware/Paint/Glass Retail Sales (% change)
0.0%
1.0%
2.0%
3.0%
4.0%
5.0%
6.0%
2014 2015 2016 2017
GDP (% change)
0.0%
0.5%
1.0%
1.5%
2.0%
2.5%
2014 2015 2016 2017 2018 2019 2020 2021 2022
Modest but improving outlook
Source: Investec Q2 2017
Source: Stats SA – August 2017
UK South Africa

32
Growth Target
• Double revenues to £420m by 2018
- Organic and acquisition
- Timeline to be reassessed in light of current year progress
• Maintain 50% revenue derived from overseas
• Focus on sectors with highest returns
• Market leading positions
• Strong trade and consumer brands
• Breadth of distribution
• 5 - 10% pa potential
• Complementary industry segments/ geographical
• Bathroom controls and associated products
• Building/construction adhesives
• UK, SA, sub-Saharan Africa and Middle East
• Sustainable pre-tax ROCE 12-15%
• Improve returns from under-performing segments
• Invest in sectors with highest shareholder value return
Organic
Acquisition
Returns Target
Group Strategy – Key Targets
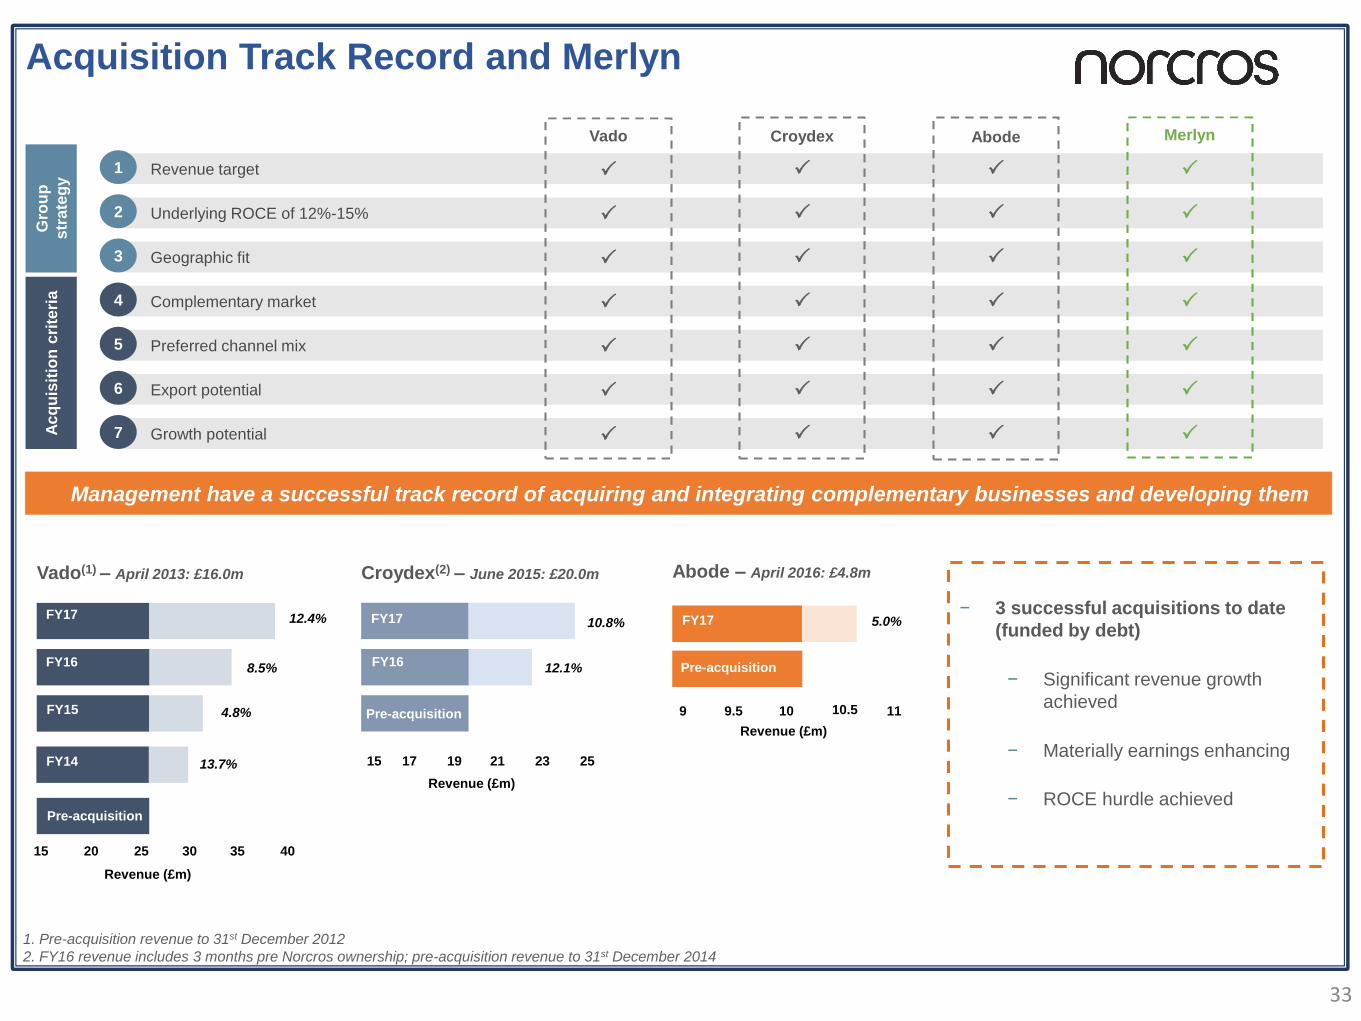
33
Geographic fit3
Complementary market4
Preferred channel mix5
Growth potential7
Revenue target1
Management have a successful track record of acquiring and integrating complementary businesses and developing them
Underlying ROCE of 12%-15%2
Gro
up
str
ate
gy
Ac
qu
isit
ion
cri
teri
a
Export potential6
Merlyn
Abode
Croydex
Vado
1. Pre-acquisition revenue to 31st December 2012
2. FY16 revenue includes 3 months pre Norcros ownership; pre-acquisition revenue to 31st December 2014
Vado(1) – April 2013: £16.0m
FY17
FY16:FY16
12.4%
8.5%
Pre-acquisition
15 20 25 30 35 40
FY15 4.8%
FY14 13.7%
FY16
FY17
Revenue (£m)
Croydex(2) – June 2015: £20.0m
10.8%
Pre-acquisition
FY17
12.1%
15 17 19 21 23 25
FY16
Revenue (£m)
Abode – April 2016: £4.8m
FY17 5.0%
9 9.5 10 10.5 11
FY16 Pre-acquisition
Revenue (£m)
Pre-acquisition
Pre-acquisition
− 3 successful acquisitions to date
(funded by debt)
− Significant revenue growth
achieved
− Materially earnings enhancing
− ROCE hurdle achieved
Acquisition Track Record and Merlyn

34
➢ Solid interim results in challenging market environments
➢ Clear and focused growth strategy
➢ Merlyn – compelling strategic fit:
▪ Step change in size & scale of the Group
▪ Pro-forma revenue £302m1
▪ Pro-forma underlying operating profit £30.2m1
▪ Meaningful synergies
➢ Capital flexibility to execute growth agenda:
▪ Organic growth opportunities
▪ Well developed acquisition pipeline
➢ Capital discipline/hurdle rates maintained
➢ Strong foundation to progress development of the Group
Strong Platform for Further Growth
1 Source: Prospectus for proposed acquisition of Merlyn Industries Limited

35
Appendix

36
Acquisition related costs H1 Sept
2017
£m
H1 Sept
2016
£m
FY Mar
2017
£m
Acquisition related deferred remuneration (earn out) (0.2) (0.2) (0.4)
Intangible asset amortisation (0.6) (0.6) (1.2)
Staff costs and advisory fees (0.4) (0.5) (1.1)
(1.2) (1.3) (2.7)
Acquisition Related Costs

37
H1 Sept
2017
£m
H1 Sept
2016
£m
FY Mar
2017
£m
Net debt (IFRS) – opening (23.2) (32.5) (32.5)
Net cash flow 3.5 4.0 7.8
Other non cash movements (0.1) (0.1) (0.2)
Foreign exchange (1.0) 1.1 1.7
Net debt (IFRS) - closing (20.8) (27.5) (23.2)
Net Debt Reconciliation

38
UK Pension Scheme cashflows
* Annual pensioner payroll, excludes non-predicted costs such as transfer out and early retirement payments
Source: KPMG Fusion
➢ Cash outflow close to peak
*

PLEASE NOTE: On 2 November 2017, Norcros plc announced the provisional acquisition of Merlyn Industries Limited (“Merlyn”). A circular and prospectus relating to the acquisition and associated equity raising was issued by the Company on 2 November 2017, and a supplementary prospectus incorporating by reference the interim results summarised in this document will be issued on or around 16 November 2017. Shareholders who are considering participation in the Capital Raising (as thatterm is defined in the prospectus) should only do so on the basis of the prospectus and supplementary prospectus.


![ars.els-cdn.com · Web view[89] HDPE 125000 350 3.55 60 0.5%Pt/SO 4 /ZrO 2 2:1 64.7s [89] HDPE 125000 350 3.55 60 0.5%Pt/SO 4 /ZrO 2 5:1 55.1s [89] HDPE 125000 375 8.38 25 2.0%Ni/ZrO](https://img.pdfslide.us/doc/110x75/5f57a2ddb78beb754767c28c/arsels-cdncom-web-view-89-hdpe-125000-350-355-60-05ptso-4-zro-2-21-647s.jpg)