Embed Size (px)
Citation preview
Situation of thewater resources
the Central AmericanIsthmus countries
Global Water PartnershipGWP - Central Amirica
O '9°D
Global Water PartnershipGWP - Central America
C3
1!LIBRARY IRC
PO Box 93190, 2509 AD THE HAGUETel.: +31 70 30 689 80Fax: +31 70 35 899 64
BARCODE:LO:
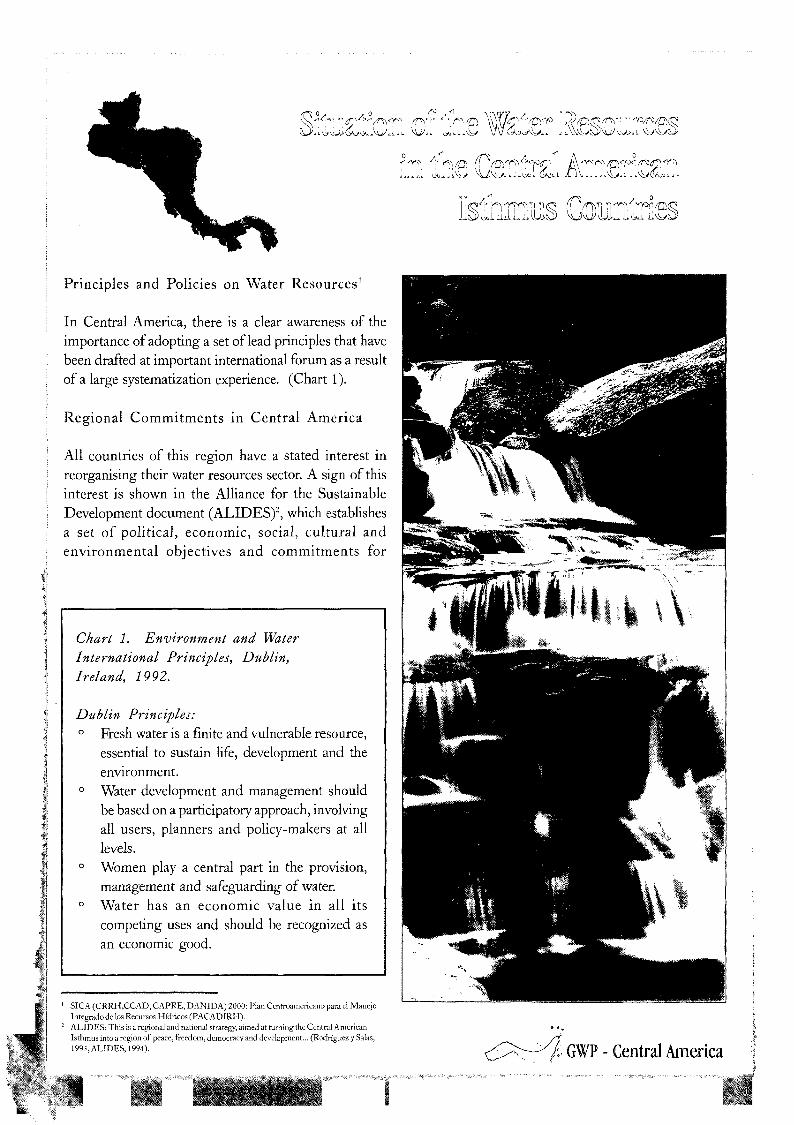
Principles and Policies on Water Resources'
In Central America, there is a clear awareness of theimportance of adopting a set of lead principles that havebeen drafted at important international forum as a resultof a large systematization experience. (Chart 1).
Regional Commitments in Central America
All countries of this region have a stated interest inreorganising their water resources sector. A sign of thisinterest is shown in the Alliance for the SustainableDevelopment document (ALIDES)2, which establishesa set of political, economic, social, cultural andenvironmental objectives and commitments for
Chart 1. Environment and WaterInternational Principles, Dublin,Ireland, 1992.
Dublin Principles:° Fresh water is a finite and vulnerable resource,
essential to sustain life, development and theenvironment.
0 Water development and management shouldbe based on a participatory approach, involvingall users, planners and policy-makers at alllevels.
0 Women play a central part in the provision,management and safeguarding of water.
0 Water has an economic value in all itscompeting uses and should be recognized asan economic good.
1 SICA (CRRH.CCAD, CAFRE, DANIDA) 2000: Plan Centroamericano para el ManejoIntegrado de los Recursos Hídricos (PACADIRH).
2 ALIDES: This is a regional and national strategy, aimed at turning the Central AmericanIsthmus into a region of peace, freedom, democracy and development... (Rodríguez y Salas,199J, ALIDES, 1994). ^¡.- GWP - Central America
flimlhalbflttaimtts woftlh
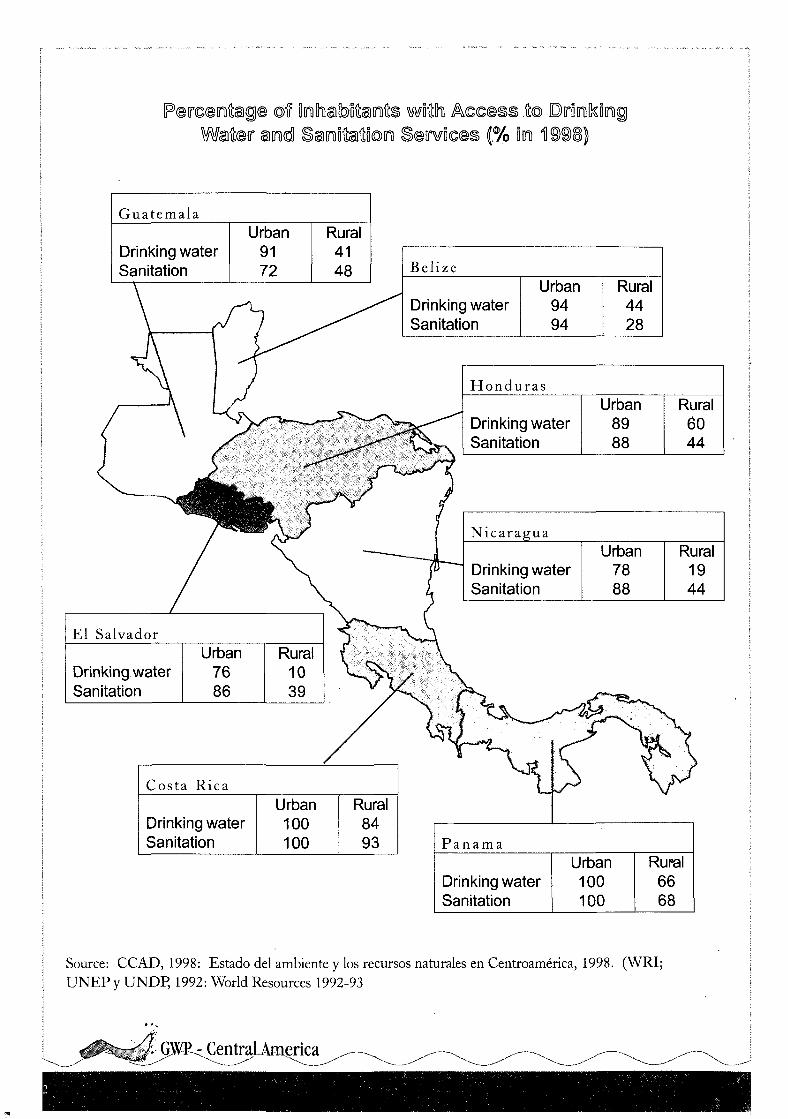
Guatemala
Drinking waterSanitation
Urban9172
Rural4148
El Salvador
Drinking waterSanitation
Urban7686
Rural1039
Belize
Drinking waterSanitation
Urban9494
Rural4428
Costa Rica
Drinking waterSanitation
Urban100100
Rural8493 P a n a m a
Honduras
Drinking waterSanitation
Urban8988
Rural6044
Nicaragua
Drinking waterSanitation
Urban7888
Rural1944
Drinking waterSanitation
Urban100100
Rural6668
Source: CCAD, 1998: Estado del ambiente y los recursos naturales en Centroamérica, 1998. (WRI;UNEP y UNDP, 1992: World Resources 1992-93
«t Gm<_ CentraLAmerica

supporting the common future of the CentralAmerican countries. The "Commitment 39",regarding water, states:
Commitment 39. Water:To give priority to the elaboration of policies and lawsconcerning water resources management and preservationthat include, among other issues, institutional and legalordinance, co-ordination mechanisms among thoseauthorities in charge of the management andadministration of the resource, both for humanconsumption and for irrigation and generation ofelectricity; and, at the same time, training our pertinentauthorities on the implementation of this commitment.
On this same matter, the "Carta Centroamericana delAgua", expressed by the Parlamento Centroamericano(PARLACEN) and drafted as a resolution of theCentral American Isthmus Water ResourcesIntegrated Management Workshop in 1994(PARLACEN et al, 1994)3, recommends, amongother aspects, the following:
• To consider water as a lifeblood, a source of peaceand development and as publicly acknowledged goodcontaining an economic 'value.
° To use water resources in an efficient, logical,multiplex, sequential, just, equitable and coordinated
manner, guaranteeing at the same time a gradual process thatensures conservation, preservation and improvement of itsquality.
• To recognise water as the task of a single sector that takes intoaccount all involved actor interests, and not as one of isolatedsubsectors working for their own interests and without anycoordination.
In May 1996, the objective of the congress about "Assessmentand Management Strategies of Water Resources in LatinAmerica and the Caribbean" was to explore strategies thatallow national institutions involved in the management ofwater resources to play a major role in the national and regionaldevelopment of Latin American and the Caribbean. (BIDand OMM, 1996)4
During the 1997 Panama Presidential Summit, the CentralAmerican presidents declared themselves on water issue asfollows:
"Fulfilling ALIDES Commitment 39, we recognise the workdeveloped by regional Organizations of the water sector intended toachieve a more effective coordination on these aspects; that, withthe support of these Organizations, our national authorities involvedin the management, preservation and treatment of this valuableresource begin with the final assessment and approval of a regionalaction plan; all these actions should be carried out in a period oftime which does not exceed 90 days".
Table 1. Water Resource Availability in the Central American Isthmus
"Country
Belize
Guatemala
El Salvador
Honduras
Nicaragua
Costa Rica
Panama
AveragePrecipitationp/year (mm)
1,300 -4,450
500 - 6,000
1,500 - 2,300
1 ,500 - 3,000
400 - 6,300
1,300 - 7,500
1,500-5,500
Water re-source per
capita 1000m3/year)
80.8
11.9
3.5
11.6
44.3
29.8
57.3
Withdrawal(m3 /»ear/per
capita)
na
139
241
508
370
779
744
HouseholdWithdrawal
{%)
na
9
7
4
25
4
12
AgriculturalWithdrawal
(%)
na
74
89
91
54
89
77
IndustrialWithdrawal
(%)
na
17
4
5
21
7
11
Hydro-energeticresource con-
sumed (%)
na
9.2
18.9
15.8
2.3
4.7
10.7
Source: CCAD, 1998: Estado del ambiente y los recursos naturales en Centroaménca, 1998.
3 Parlamento Centroamericano (PARLACEN), UNICEF, CRRH, CAFRE,CIUDAGUA, Guatemala 1994: Central American Isthmus Water Resources IntegratedManagement Workshop
4 OMM.BID, San José, Costa Rica, 1996: Conference on Assessment and ManagementStrategies of Water Resources in Latin America and the Caribbean.
/• GWP - Central America
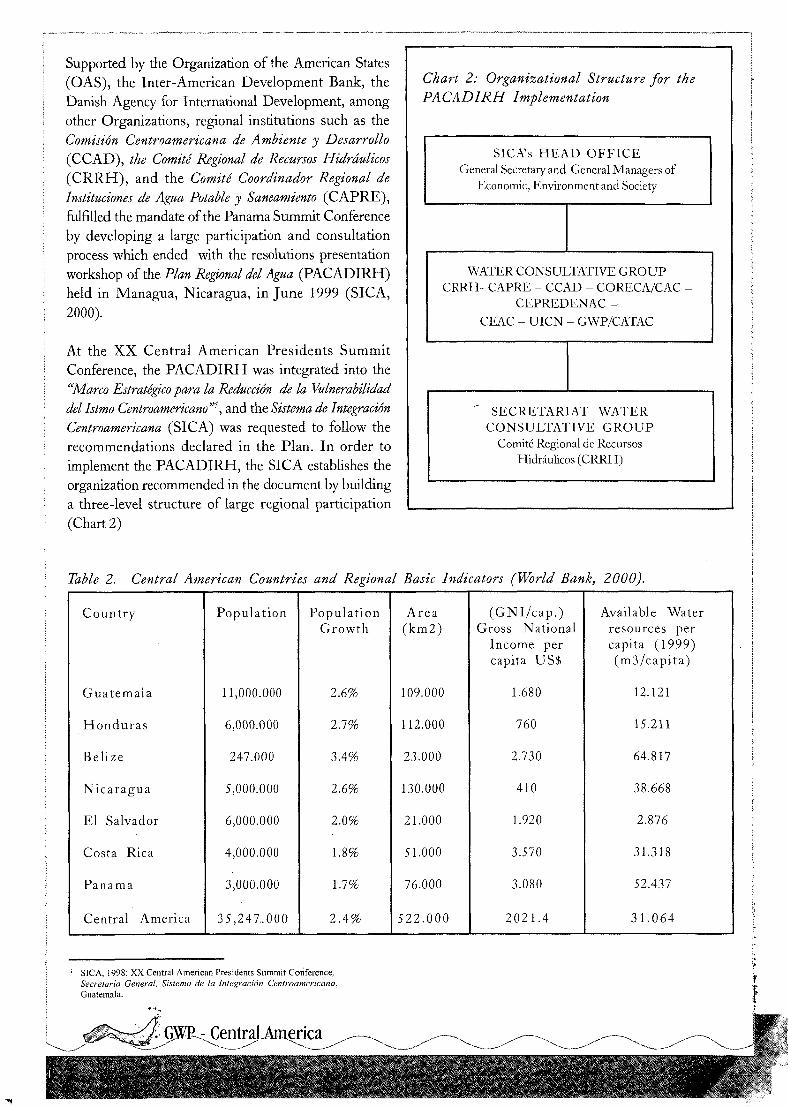
Supported by the Organization of the American States(OAS), the Inter-American Development Bank, theDanish Agency for International Development, amongother Organizations, regional institutions such as theComisión Centroamericana de Ambiente y Desarrollo(CCAD), the Comité Regional de Recursos Hidráulicos(CRRH), and the Comité Coordinador Regional deInstituciones de Agua Potable y Saneamiento (CAPRE),fulfilled the mandate of the Panama Summit Conferenceby developing a large participation and consultationprocess which ended with the resolutions presentationworkshop of the Plan Regional del Agua (PACADIRH)held in Managua, Nicaragua, in June 1999 (SICA,2000).
At the XX Central American Presidents SummitConference, the PACADIRH was integrated into the"Marco Estratégico para la Reducción de la Vulnerabilidaddel Istmo Centroamericano'*, and the Sistema de IntegraciónCentroamericana (SICA) was requested to follow therecommendations declared in the Plan. In order toimplement the PACADIRH, the SICA establishes theorganization recommended in the document by buildinga three-level structure of large regional participation(Chart 2)
Chart 2: Organizational Structure for thePACADIRH Implementation
SICA's HEAD OFFICEGeneral Secretary and General Managers of
Economic, Environment and Society
WATER CONSULTATIVE GROUPCRRH- CAPRE - CCAD - CORECA/CAC -
CEPREDENAC -CEAC - UICN - GWP/CATAC
" SECRETARIAT WATERCONSULTATIVE GROUP
Comité Regional de RecursosHidráulicos (CRRH)
Table 2. Central American Countries and Regional Basic Indicators (World Bank, 2000).
Country
Gua temala
Honduras
Belize
Nicaragua
El Salvador
Costa Rica
Panama
Central America
Population
11,000.000
6,000.000
247.000
5,000.000
6,000.000
4,000.000
3,000.000
35,247..000
PopulationGrowth
2.6%
2.7%
3.4%
2.6%
2.0%
1.8%
1.7%
2.4%
Area(km2)
109.000
112.000
23.000
130.000
21.000
51.000
76.000
522.000
(GNI/cap.)Gross National
Income percapita US$
1.680
760
2.730
410
1.920
3.570
3.080
2021.4
Available Waterresources percapita (1999)(m3/capita)
12.121
15.211
64.817
38.668
2.876
31.318
52.437
31.064
SICA, 1998: XX Central American Presidents Summit Conference,Secretaría General, Sistema de la Integración Centroamericana,Guatemala.
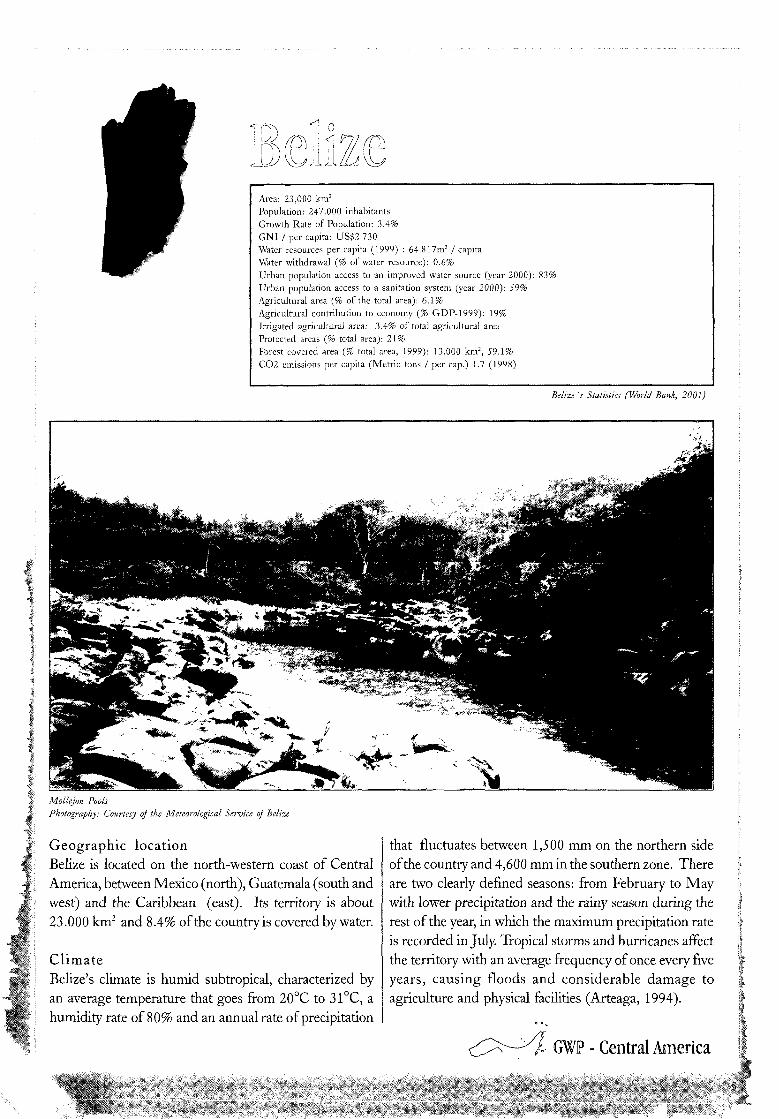
Area: 23,000 km2
Population: 247.000 inhabitantsGrowth Rate of Population: 3.4%GNI / per capita: US$2.730Water resources per capita (1999) : 64.817mJ / capitaWater withdrawal (% of water resource): 0.6%Urban population access to an improved water source (year 2000):Urban population access to a sanitation system (year 2000): 59%Agricultural area (% of the total area): 6.1%Agricultural contribution to economy (% GDP-1999): 19%Irrigated agricultural area: 3.4% of total agricultural areaProtected areas (% total area): 21%Forest covered area (% total area, 1999): 13.000 km2, 59.1%CO2 emissions per capita (Metric tons /per cap.) 1.7 (1998)
Belize 's Statistics (World Bank, 2001)
Mollejón PoolsPhotography: Courtesy of the Meteorological Service of Belize
Geographic locationBelize is located on the north-western coast of CentralAmerica, between Mexico (north), Guatemala (south andwest) and the Caribbean (east). Its territory is about23.000 km2 and 8.4% of the country is covered by water.
ClimateBelize's climate is humid subtropical, characterized byan average temperature that goes from 20°C to 31°C, ahumidity rate of 80% and an annual rate of precipitation
that fluctuates between 1,500 mm on the northern sideof the country and 4,600 mm in the southern zone. Thereare two clearly defined seasons: from February to Maywith lower precipitation and the rainy season during therest of the year, in which the maximum precipitation rateis recorded in July. Tropical storms and hurricanes affectthe territory with an average frequency of once every fiveyears, causing floods and considerable damage toagriculture and physical facilities (Arteaga, 1994).
• GWP - Central America
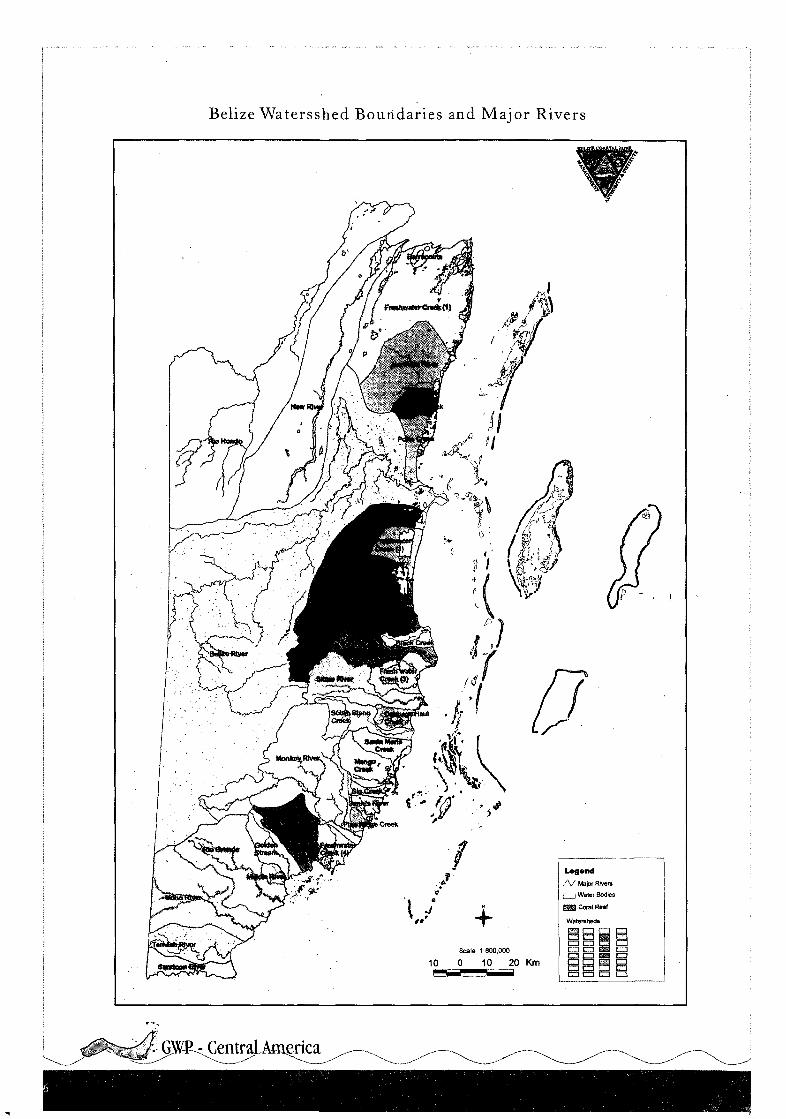
Belize Watersshed Boundaries and Major Rivers
Legend/V Major River»|——j Water Bodkis
Scale 1:800,00010 0 10 20 Km
SBG3 CD
Demography
Belize!s population is about 247,000 inhabitants. Thegrowth rate of population is 3.4% per year, the densityof population is 11 inhabitants per km2 , and thebirth rate was 3.5 children per woman in 1999 (WorldBank, 2001).
Economic and sustainabledevelopment indicators
The Gross National Income (GNI) per capita ofBelize is US$2,730, and its economy increased by4.5% (GDP) in 1999 (World Bank, 2001). Theinflation rate of Belize in 1999 was -1.2% and theunemployment rate was 12.8%.
The agricultural area of Belize corresponds to 6.1%of the whole area, of which 3.4% are irrigated areas.The contribution of this sector to the nationaleconomy was 19% GDP in 1999. The goods andservices exportation have decreased as follows: 63.8%GDP (1990), 50% GDP (1998), and 48.8% GDP(1999). Regarding importation, Belize showed theMowing fluctuations: 61.6% GDP (1990), 57.2%GDP (1998) and 58.4% GDP (1999).
Belize has a total forest coverage of 13.000 km2, about59.1% of the whole territory, of which about 21% isin some way under protection. Belize's deforestationrate was 2.3% in 1999.
Water Resources Situation
Belize and Panama are the Central American countries thathave the greatest water resources capital per capita. Due toBelize's geographical location on Central American'sCaribbean (coast), its climatic conditions reach 46.817 m3
per capita. This rate makes Belize one of the countries withthe greatest water capital in the world, only exceeded by theAfrican countries of Sub Sahara. From its whole water capital,Belize consumes only 0.6% for household, industrial, andagricultural uses.
Regarding Belize's hydroelectric resources, these are subjectto the characteristics of the rivers rising in the Mayanmountains, since the rest of the territory is fairly even.(Arteaga, 1994).
The drinking water consumption has increased 115% in thelast 10 years, from 550,115.000 gallons in 1980 to1,180,644,000 gallons in 1999. The increased average rate ofconsumption is 8.9% per year. The access of population towater improved resources was 83% in 2000. Also, the accessof population to sanitation systems was 59% in 2000 (WorldHealth Organization, quoted by World Bank, 2001.)
Belize has 16 major basins. The drinking water is drawnfrom rivers, wells, water tables and surface waters. Amongsome methods for water treatment (drinking water) arechlorination, filtration and reversed osmosis.
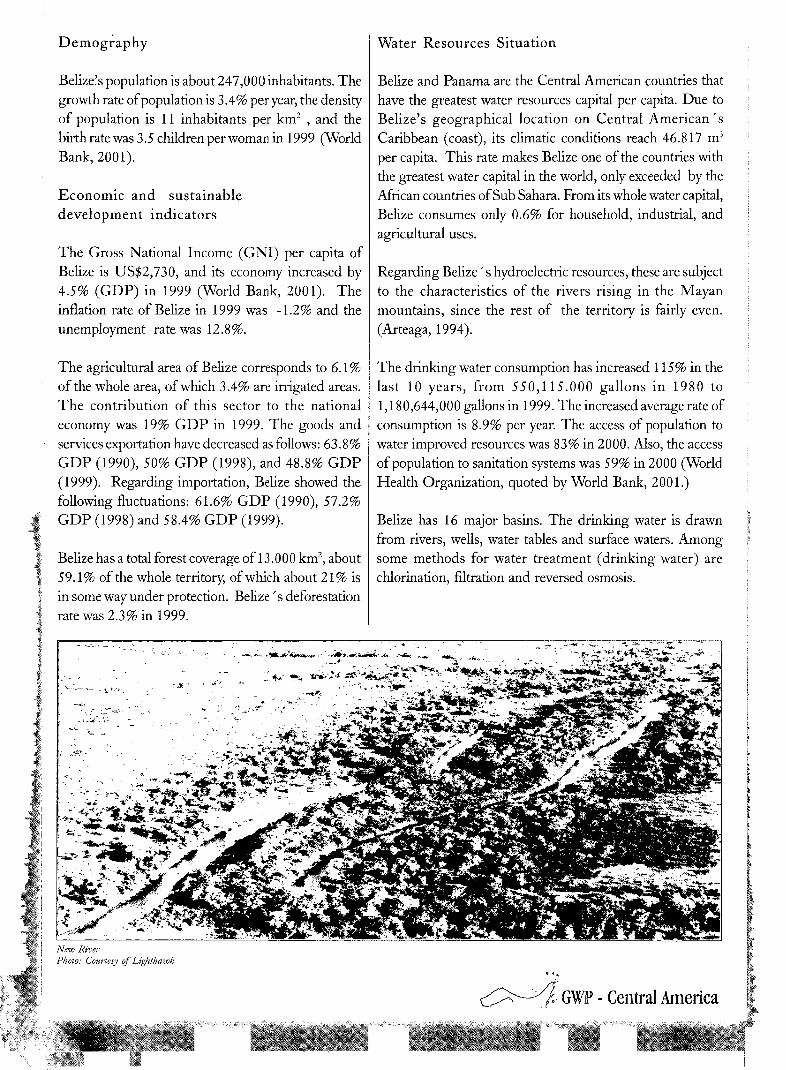
New RiverPhoto: Courtesy of Lighthawk
'^l- GWP - Central America
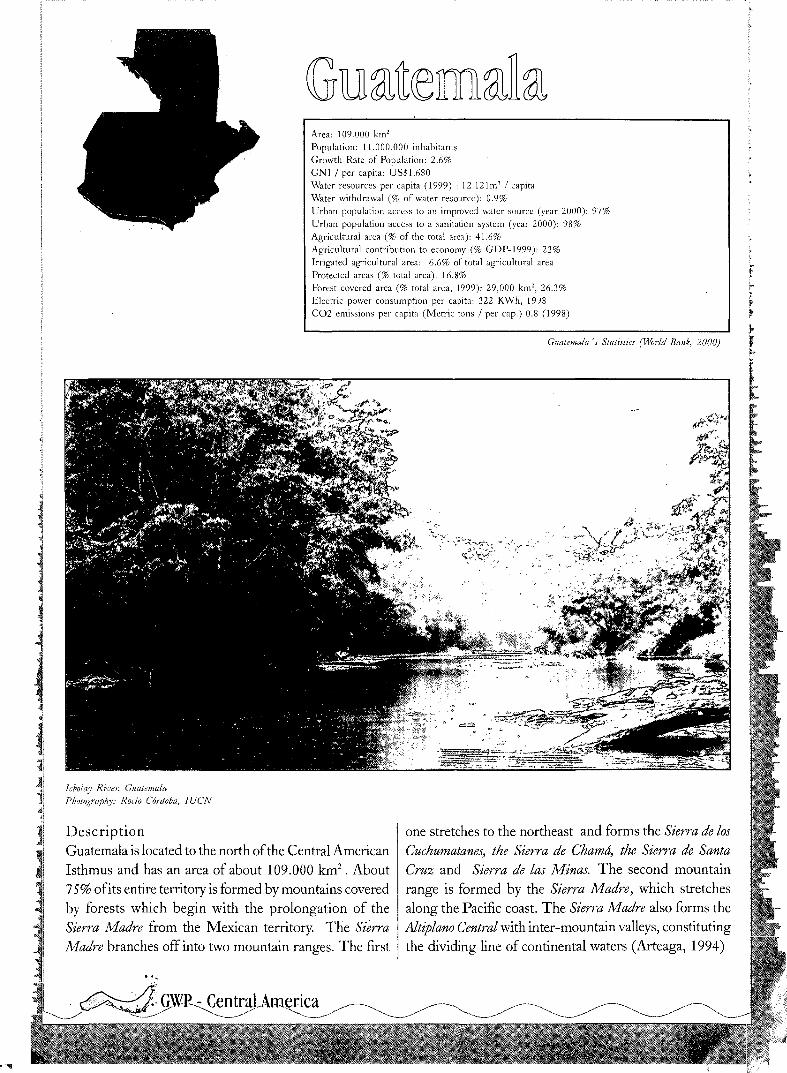
Area: 109.000 km2
Population: 11.000.000 inhabitantsGrowth Rate of Population: 2.6%GNI / per capita: US$1.680Water resources per capita (1999) : 12.121m-1 / capitaWater withdrawal (% of water resource): 0.9%Urban population access to an improved water source (year 2000): 97%Urban population access to a sanitation system (year 2000): 98%Agricultural area (% of the total area): 41.6%Agricultural contribution to economy (% GDP-1999): 23%Irrigated agricultural area: 6.6% of total agricultural areaProtected areas (% total area): 16.8%Forest covered area (% total area, 1999): 29,000 km2, 26.3%Electric power consumption per capita: 322 KWh, 19J8CO2 emissions per capita (Metric tons / per cap.) 0.8 (1998)
Guatemala 's Statistics (World Bank, 2000)
,,-/*>*»
Jcbolay River, GuatemalaPhotography: Rocío Cordoba, IUCN
DescriptionGuatemala is located to the north of the Central AmericanIsthmus and has an area of about 109.000 km2. About75% of its entire territory is formed by mountains coveredby forests which begin with the prolongation of theSierra Madre from the Mexican territory. The SierraMadre branches off into two mountain ranges. The first
one stretches to the northeast and forms the Sierra de losCuchumatanes, the Sierra de Chama, the Sierra de SantaCruz and Sierra de las Minas. The second mountainrange is formed by the Sierra Madre, which stretchesalong the Pacific coast. The Sierra Madre also forms theAltiplano Central with inter-mountain valleys, constitutingthe dividing line of continental waters (Arteaga, 1994)
^ CentraLAmenca
Guatemala is divided into 10 physiographic provinces:Llanura Costera del Pacifico, Pendiente VolcánicaReciente, Cadena Volcánica, Tierras Altas Cristalinas,Tierras Altas Sedimentarias, Depresión de Izabal y delMontagua, Planicie Baja Inferior de Peten, CinturónPlegado del Lacandón, Plataforma de Yucatán y LlanuraCostera del Caribe. In addition, Guatemala has 33volcanoes, some of them active.
ClimateClimatic ranges can be divided from 0-600m for warmclimate and average temperatures from 23°C to 26°C;from 600-1,800 m for temperate climate with averagetemperatures from 18°C to 23°C, and for higherelevations, over 1.800 m, temperatures are between 10°Cand 17°C. The rainy season takes place from May toOctober, and has fluctuations from 500mm for theNorthwest zone of the country to over 5.000 mm in thesouthern zone (Arteaga, 1994).
DemographyThe population of Guatemala is about 11,000,000inhabitants and its annual rate of growth is 2.6%. Thedensity of population is 102 inhabitants per km2.Guatemala's birth rate for 1999 was 4.5 births perwoman. The life expectancy average of Guatemalans hasincreased from 61 years in 1990 to 65 in 1999 (WorldBank, 2001)
Economic and sustainable develop indicatorsThe Gross National Income (GNI) per capita ofGuatemala is US$ 1.680 and its annual economic growthwas 3.6% of GDP in 1999.
The agricultural area of Guatemala represents 41.6% ofits whole territory, and 6.6% of this area is irrigated. Theeconomic contribution of this sector reached 23% of GDPin 1999. Other important sectors are: trade 24.6%,manufacturing industry 13.8%, transportation,warehousing and communications 8.8% and publicadministration 7.4%.
Exportation of goods and services was reduced from 21 %in 1990 to 19% in 1999, while importation of goods andservices increased from 24.8% to 27.4% in 1999. Coffeerepresents the main export product with 28.3% of thetotal, followed by sugar with 15.2%, banana with 9.2%and cardamom with 2.8%.
The ecosystems' wealth and diversity of this country arepresent in its vegetation and landscape, which in only afew kilometers varies from conifers and latifolia oftemperate climates to a tropical latifoliated vegetation inthe low lands. Guatemala forest coverage area is 29.000km2 which represents about 26.3% of its territory, andfrom this percentage, 16.8% is in some way underprotection. Deforestation rate for 1999 was 1.7%.
Water Resources SituationThe orographic configuration divides Guatemala' sterritory into the Pacific and the Atlantic runoffs. At thesame time, the Atlantic runoff is divided into the Gulfof Mexico and the Caribbean runoffs. The Pacificrunoff contains 19% of the total runoff, while for theAtlantic runoff is 34%, and, for the Gulf of Mexico slope,the total annual average is 47%. The most voluminousriver is the Usumacinta, followed by San Pedro, Pasión,Salinas and Chixoy rivers in the Gulf of Mexico runoff;the Montagua and Cahabón rivers in the Atlantic runoff;and the Paz, Nahualate and Coyolate rivrs in the Pacificrunoff. In Guatemala there are more than 300 lakes andlagoons, of which the largest are Izabal lake (590 km2)and the Atitlán lake (126 km2) (Arteaga, 1994).
Guatemala's water capital is 12,121 m3 per capita and itswithdrawal for household, industrial and agriculture usesis 0.9%. The access of the urban population to improvedwater sources is 97% (2000). Also, the access of this samepopulation to sanitation systems is 98% in 2000 (WorldHealth Organization, 2000, quoted by the World Bank,2001).
There are 27 systems of public irrigation built by thegovernment that cover 39,536 acres (20%). Also, 158,144acres (80%) are irrigated by private systems. The total oflands to be irrigated is 6,177,500 acres.
According to information from 1998, the electric powerconsumption per capita is 322 kWh. Presently, the electriccapacity is 1.030 MW that basically cover the capital cityand the urban areas of the country. The biggesthydroelectric power station is Chixoy and the country'shydroelectric resource totals 10.891 MW.
Guatemala lacks a General Law of Water and theownership of this resource is regulated by the PoliticalConstitution (1985), the Civil Code (1966) and the Law
/.• GWP - Central America
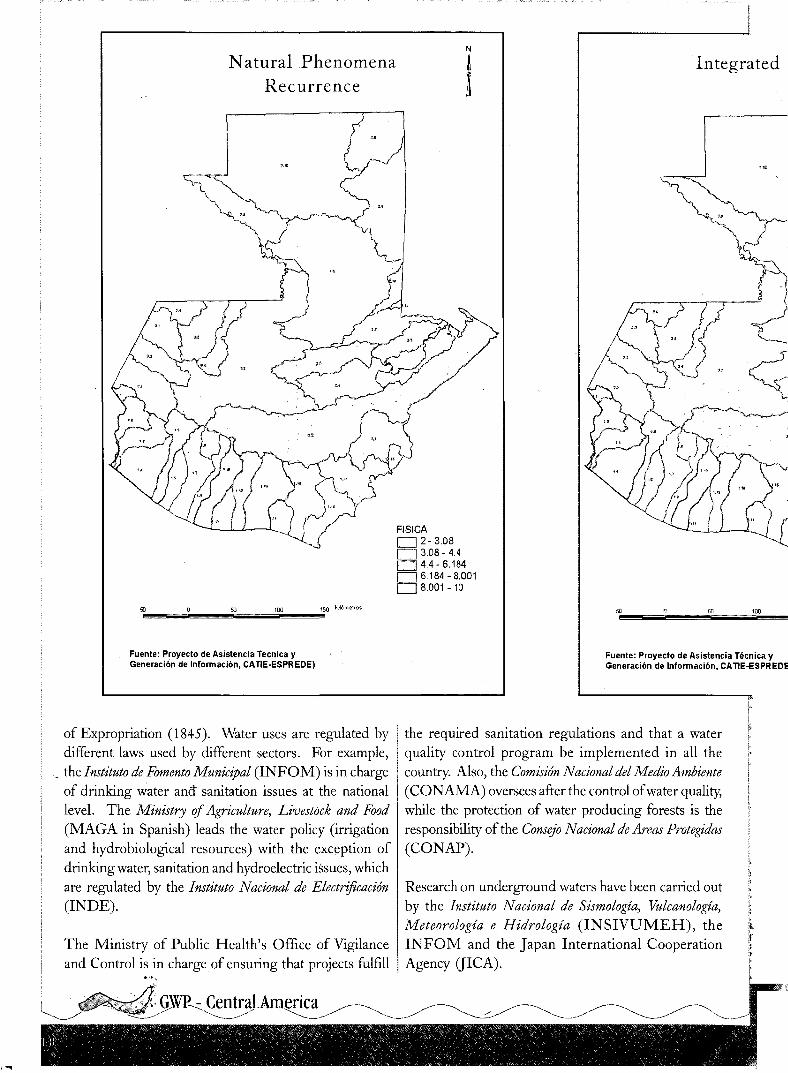
Natural PhenomenaRecurrence
FÍSICA[—|:I——[3.08-4.4¡—14.4-6.184
6.184-8.0018.001 -10
Fuente: Proyecto de Asistencia Técnica yGeneración de Información, CATIE-ESPREDE)
Integrated
Fuente: Proyecto de Asistencia Técnica yGeneración de Información, CATIE-ESPREDE
of Expropriation (1845). Water uses are regulated bydifferent laws used by different sectors. For example,
.. the Instituto de Fomento Municipal (INFOM) is in chargeof drinking water and sanitation issues at the nationallevel. The Ministry of Agriculture, Livestock and Food(MAGA in Spanish) leads the water policy (irrigationand hydrobiological resources) with the exception ofdrinking water, sanitation and hydroelectric issues, whichare regulated by the Instituto Nacional de Electrificación(INDE).
The Ministry of Public Health's Office of Vigilanceand Control is in charge of ensuring that projects fulfill
the required sanitation regulations and that a waterquality control program be implemented in all thecountry. Also, the Comisión Nacional del Medio Ambiente(CONAMA) oversees after the control of water quality,while the protection of water producing forests is theresponsibility of the Consejo Nacional de Areas Protegidas(CONAP).
Research on underground waters have been carried outby the Instituto Nacional de Sismología, Vulcanología,Meteorología e Hidrología (INSIVUMEH), theINFOM and the Japan International CooperationAgency (JICA).
I GWP<- CentraLAmerica
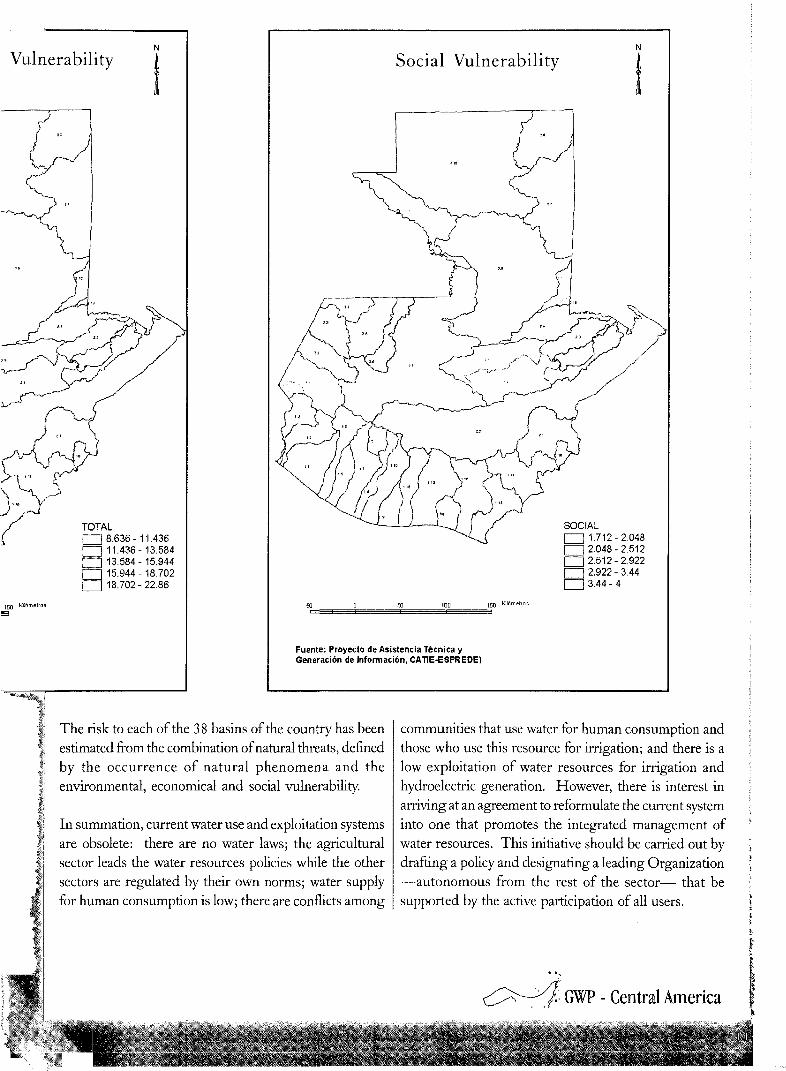
Vulnerability
TOTAL[——18.636-11.436—— 11.436-13.584
13.584-15.94415.944-18.70218.702 - 22.86
Social Vulnerability
SOCIAL|——| 1.712-2.048|——[2.048-2.512|——12.512-2.922
2.922-3.443.44 - 4
Fuente: Proyecto de Asistencia Técnica yGeneración de Información, CAT1E-ESPREDE)
The risk to each of the 38 basins of the country has beenestimated from the combination of natural threats, definedby the occurrence of natural phenomena and theenvironmental, economical and social vulnerability.
In summation, current water use and exploitation systemsare obsolete: there are no water laws; the agriculturalsector leads the water resources policies while the othersectors are regulated by their own norms; water supplyfor human consumption is low; there are conflicts among
communities that use water for human consumption andthose who use this resource for irrigation; and there is alow exploitation of water resources for irrigation andhydroelectric generation. However, there is interest inarriving at an agreement to reformulate the current systeminto one that promotes the integrated management ofwater resources. This initiative should be carried out bydrafting a policy and designating a leading Organization—autonomous from the rest of the sector— that besupported by the active participation of all users.
/• GWP - Central America
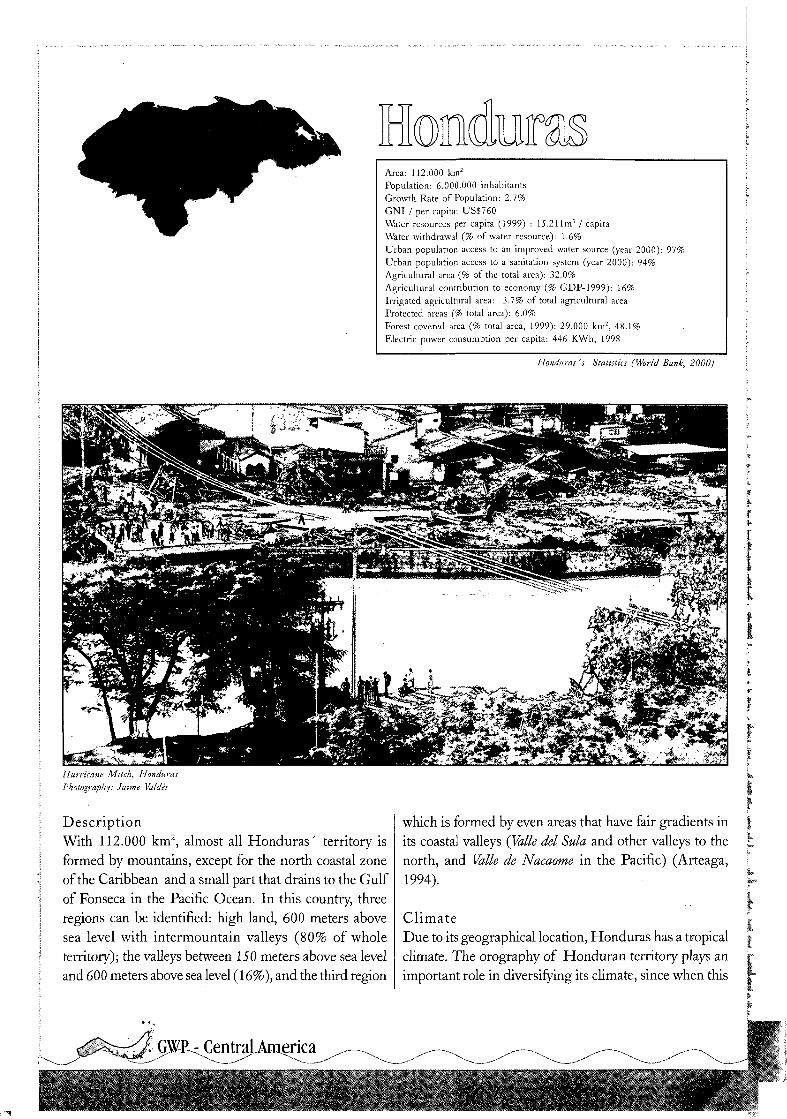
Area: 112.000 km2
Population: 6.000.000 inhabitantsGrowth Rate of Population: 2.7%GNI / per capita: US$760Water resources per capita (1999) : 15.211m3 / capitaWater withdrawal (% of water resource): 1.6%Urban population access to an improved water source (year 2000): 97%Urban population access to a sanitation system (year 2000): 94%Agricultural area (% of the total area): 32.0%Agricultural contribution to economy (% GDP-1999): 16%Irrigated agricultural area: 3.7% of total agricultural areaProtected areas (% total area): 6.0%Forest covered area (% total area, 1999): 29.000 km2, 48.1%Electric power consumption per capita: 446 KWh, 1998
Honduras 's Statistics (World Bank, 2000)
I
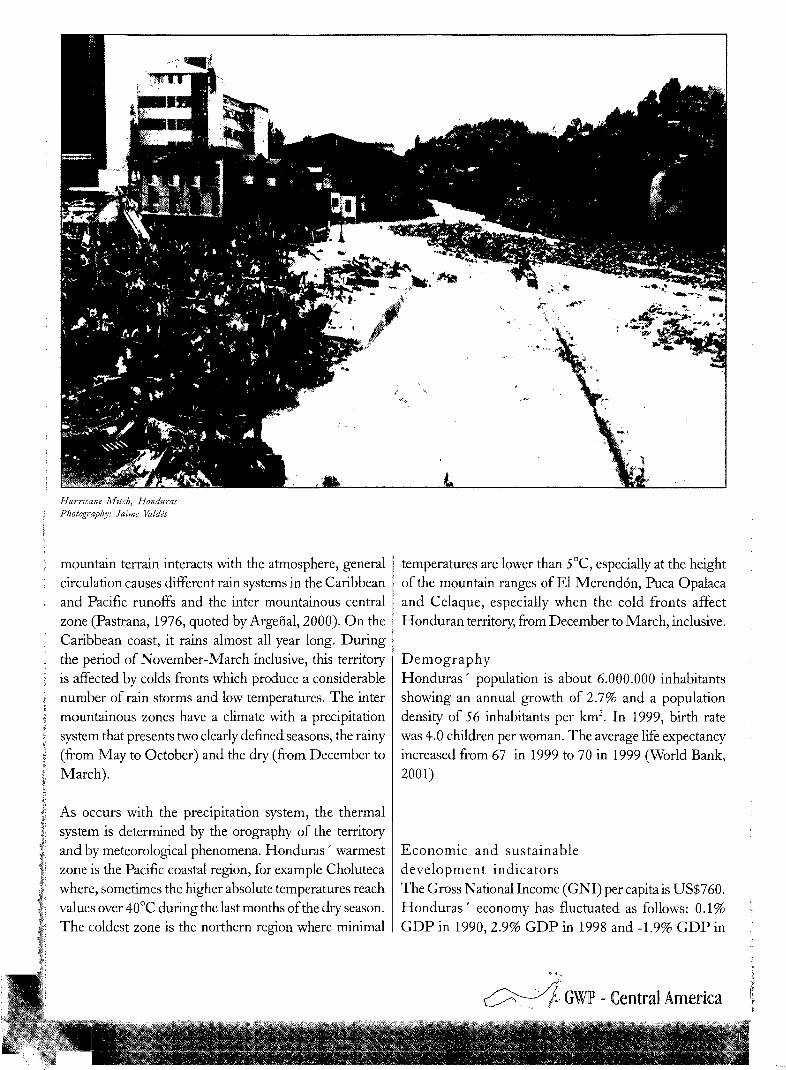
Hurricane Milch, HondurasPhotography: Jaime Valdés
DescriptionWith 112.000 km2, almost all Honduras' territory isformed by mountains, except for the north coastal zoneof the Caribbean and a small part that drains to the Gulfof Fonseca in the Pacific Ocean. In this country, threeregions can be identified: high land, 600 meters abovesea level with intermountain valleys (80% of wholeterritory); the valleys between 150 meters above sea leveland 600 meters above sea level (16%), and the third region
which is formed by even areas that have fair gradients inits coastal valleys (Valle del Sula and other valleys to thenorth, and Valle de Nacaome in the Pacific) (Arteaga,1994).
ClimateDue to its geographical location, Honduras has a tropicalclimate. The orography of Honduran territory plays animportant role in diversifying its climate, since when this
\- GWP-c CentraLAmerica
Hurricane Mitch, HondurasPhotography: Jaime Valdés
mountain terrain interacts with the atmosphere, generalcirculation causes different rain systems in the Caribbeanand Pacific runoffs and the inter mountainous centralzone (Pastrana, 1976, quoted by Argeñal, 2000). On theCaribbean coast, it rains almost all year long. Duringthe period of November-March inclusive, this territoryis affected by colds fronts which produce a considerablenumber of rain storms and low temperatures. The intermountainous zones have a climate with a precipitationsystem that presents two clearly defined seasons, the rainy(from May to October) and the dry (from December toMarch).
As occurs with the precipitation system, the thermalsystem is determined by the orography of the territoryand by meteorological phenomena. Honduras' warmestzone is the Pacific coastal region, for example Cholutecawhere, sometimes the higher absolute temperatures reachvalues over 40°C during the last months of the dry season.The coldest zone is the northern region where minimal
temperatures are lower than 5°C, especially at the heightof the mountain ranges of El Merendón, Puca Opalacaand Celaque, especially when the cold fronts affectHonduran territory, from December to March, inclusive.
DemographyHonduras' population is about 6.000.000 inhabitantsshowing an annual growth of 2.7% and a populationdensity of 56 inhabitants per km2. In 1999, birth ratewas 4.0 children per woman. The average life expectancyincreased from 67 in 1999 to 70 in 1999 (World Bank,2001)
Economic and sustainabledevelopment indicatorsThe Gross National Income (GNI) per capita is US$760.Honduras' economy has fluctuated as follows: 0.1%GDP in 1990, 2.9% GDP in 1998 and -1.9% GDP in
\- GWP - Central America
1999. This last indicator is highly influenced by theeconomic effect provoked by Hurricane Mitch inOctober 1998.
Honduras' agricultural area represents 32% of the wholeterritory, of which 3.7% is irrigated. The economiccontribution of this sector was 16% of the GDP in 1999.Goods and services exports have increased from 35.4%in 1990 to 49.% in 1999. Likewise, goods and servicesimports increased from 39.8% in 1990 to a 56.7% in 1999.Honduras has a total forest coverage of 54.000 km2, about48.1% of its territory. From this area, 6.0% is in someway under some protection. The deforestation rate was1.0% in 1999.
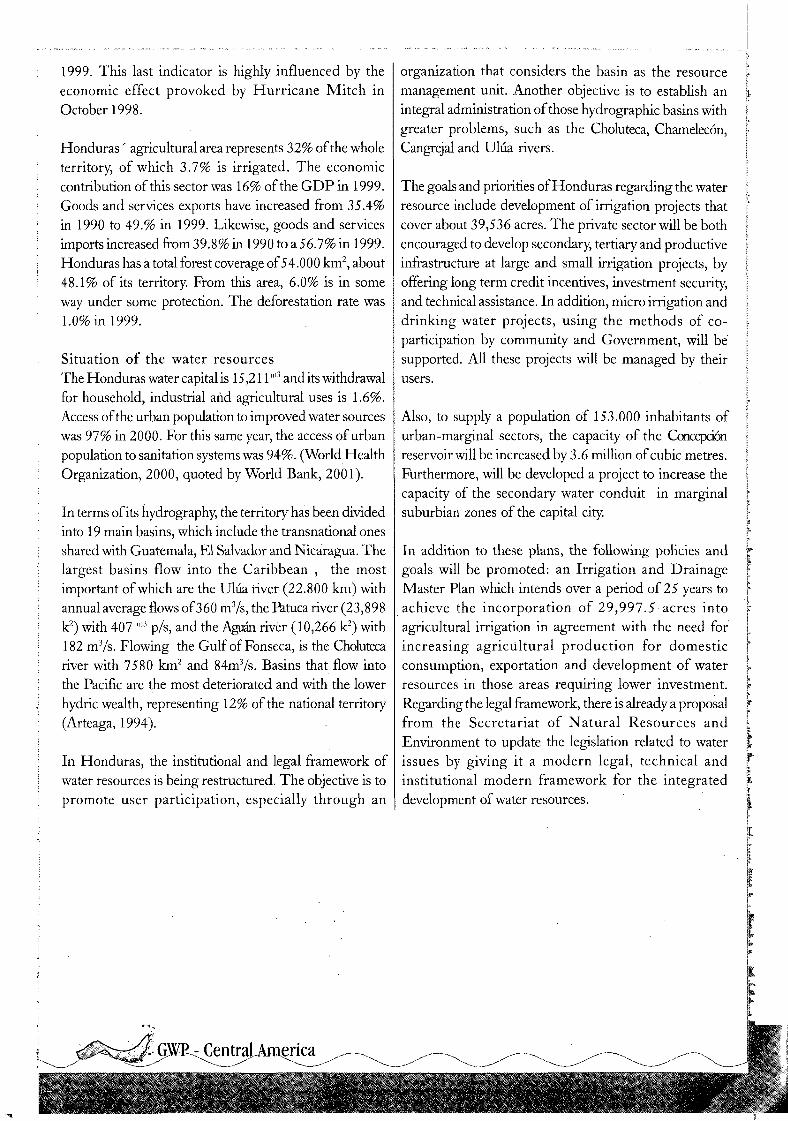
Situation of the water resourcesThe Honduras water capital is 15,211m3 and its withdrawalfor household, industrial and agricultural uses is 1.6%.Access of the urban population to improved water sourceswas 97% in 2000. For this same year, the access of urbanpopulation to sanitation systems was 94%. (World HealthOrganization, 2000, quoted by World Bank, 2001).
In terms of its hydrography, the territory has been dividedinto 19 main basins, which include the transnational onesshared with Guatemala, El Salvador and Nicaragua. Thelargest basins flow into the Caribbean , the mostimportant of which are the Ulua river (22.800 km) withannual average flows of 360 m3/s, the Patuca river (23,898k2) with 407 m3 p/s, and the Aguan river (10,266 k2) with182 ni3/s. Flowing the Gulf of Fonseca, is the Cholutecariver with 7580 km2 and 84m3/s. Basins that flow intothe Pacific are the most deteriorated and with the lowerhydric wealth, representing 12% of the national territory(Arteaga, 1994).
In Honduras, the institutional and legal framework ofwater resources is being restructured. The objective is topromote user participation, especially through an
organization that considers the basin as the resourcemanagement unit. Another objective is to establish anintegral administration of those hydrographic basins withgreater problems, such as the Choluteca, Chamelecón,Cangrejal and Ulua rivers.
The goals and priorities of Honduras regarding the waterresource include development of irrigation projects thatcover about 39,536 acres. The private sector will be bothencouraged to develop secondary, tertiary and productiveinfrastructure at large and small irrigation projects, byoffering long term credit incentives, investment security,and technical assistance. In addition, micro irrigation anddrinking water projects, using the methods of co-participation by community and Government, will besupported. All these projects will be managed by theirusers.
Also, to supply a population of 153.000 inhabitants ofurban-marginal sectors, the capacity of the Concepciónreservoir will be increased by 3.6 million of cubic metres.Furthermore, will be developed a project to increase thecapacity of the secondary water conduit in marginalsuburbian zones of the capital city.
In addition to these plans, the following policies andgoals will be promoted: an Irrigation and DrainageMaster Plan which intends over a period of 25 years toachieve the incorporation of 29,997.5 acres intoagricultural irrigation in agreement with the need forincreasing agricultural production for domesticconsumption, exportation and development of waterresources in those areas requiring lower investment.Regarding the legal framework, there is already a proposalfrom the Secretariat of Natural Resources andEnvironment to update the legislation related to waterissues by giving it a modern legal, technical andinstitutional modern framework for the integrateddevelopment of water resources.
Area: 21.000 km2
Population: 6.000.000 inhabitantsGrowth Rate of Population: 2.0%GNI / per capita: US$1.920Water resources per capita (1999) : 2.876m3 / capitaWater withdrawal (% of water resource): 4.1%Urban population access to an improved water source (year 2000):Urban population access to a sanitation system (year 2000): 88%Agricultural area (% of the total area): 77.4%Agricultural contribution to economy (% GDP-1999): 10%Irrigated agricultural area: 4.4% of total agricultural areaProtected areas (% total area): 0.3%Forest covered area (% total area, 1999): 1.000 km2, 4.6%
El Salvador 's ' Statistics (World Bank, 2001)
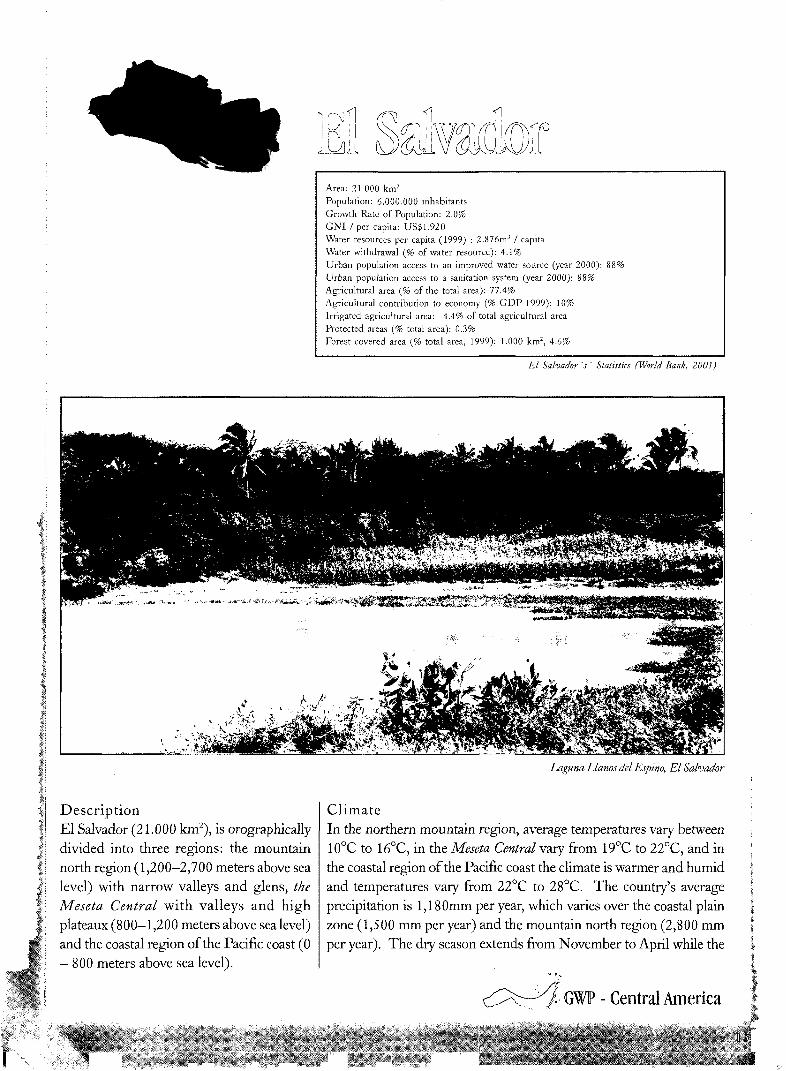
Laguna Llanos del Espino, El Salvador
DescriptionEl Salvador (21.000 km2), is orographicallydivided into three regions: the mountainnorth region (1,200—2,700 meters above sealevel) with narrow valleys and glens, theMeseta Central with valleys and highplateaux (800-1,200 meters above sea level)and the coastal region of the Pacific coast (0- 800 meters above sea level).
ClimateIn the northern mountain region, average temperatures vary between10°C to 16°C, in the Meseta Central vary from 19°C to 22°C, and inthe coastal region of the Pacific coast the climate is warmer and humidand temperatures vary from 22°C to 28°C. The country's averageprecipitation is 1,180mm per year, which varies over the coastal plainzone (1,500 mm per year) and the mountain north region (2,800 mmper year). The dry season extends from November to April while the
A GWP-Central America
rainy season is from May to October. 3% of the rainfalls in to the dry season, and the remaining 97% occursin the rainy season.
DemographyEl Salvador's population is about 6,000,000 with anannual growth of 2% and a population density of 297inhabitants per km2. The birth rate for 1999 was 3.2children per woman and the average rate of lifeexpectancy has increased from 66 in 1990 to 70 in 1999(World Bank, 2001).
Economic and sustainabledevelopment indicatorsThe Gross National Income (GNI) per capita of ElSalvador is US$1,920, and its economy has varied asfollowed: 4.8% GDP in 1990, 3.5% in 1998 and 3.4%GDP in 1999.
The agricultural area of El Salvador corresponds to.4%of its territory, of which 3.4% is under irrigation. Theeconomic contribution of this sector was 10% of the GDPin 1999. Export of goods and services has increased from18.5% in 1990 to 24.8% in 1999. At the same time,imports of goods and services have increased from 31.2%in 1990 to 36.9% in 1999.
El Salvador has a total forest coverage of 1.000 km2,5.8%of its territory, of which 0.3% is protected in some way.The deforestation rate was 2.3% in 1999.
Water Resources SituationThe water capital of El Salvador is 2.876 m3 per capitaand its withdrawal for household, industrial andagricultural use is 4.1%. The access of the urbanpopulation to improved water sources was 88% in 2000.Likewise, for this year, the access of the urban population
to sanitation was 88% (World Health Organization, 2000,quoted by World Bank 2001).
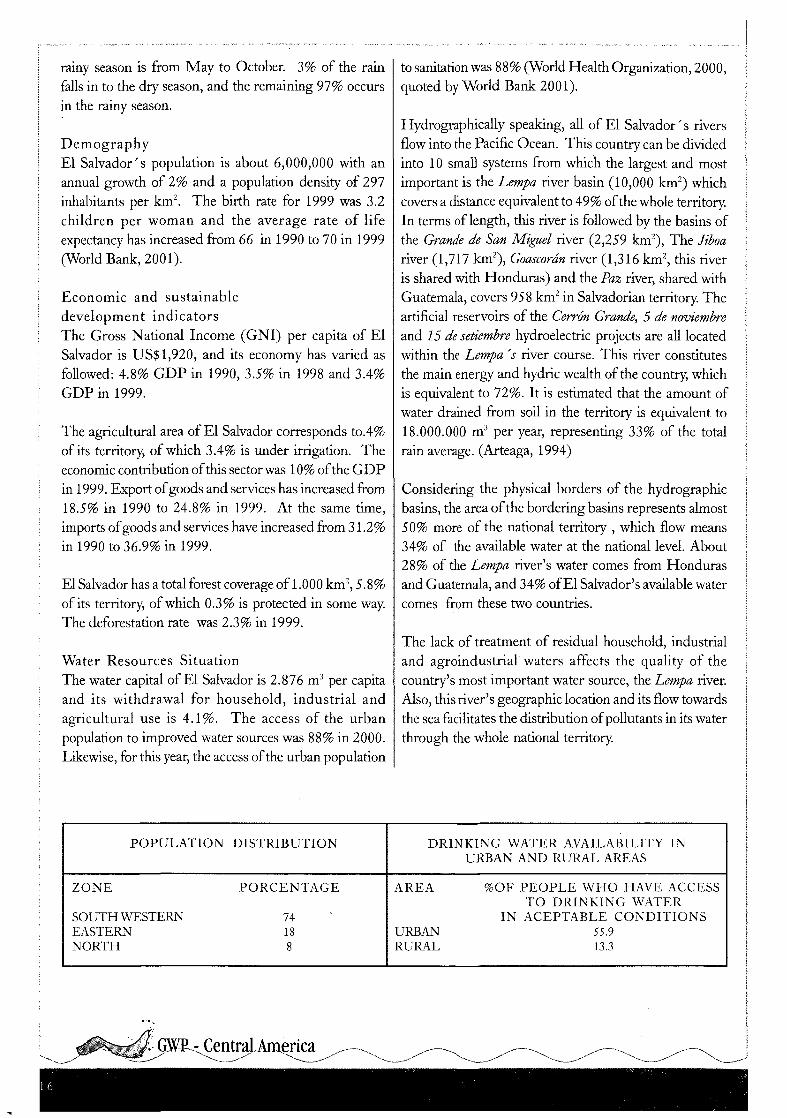
Hydrographically speaking, all of El Salvador's riversflow into the Pacific Ocean. This country can be dividedinto 10 small systems from which the largest and mostimportant is the Lempa river basin (10,000 km2) whichcovers a distance equivalent to 49% of the whole territory.In terms of length, this river is followed by the basins ofthe Grande de San Miguel river (2,259 km2), The Jiboariver (1,717 km2), Goascorán river (1,316 km2, this riveris shared with Honduras) and the Paz river, shared withGuatemala, covers 958 km2 in Salvadorian territory. Theartificial reservoirs of the Cerrón Grande, 5 de noviembreand 15 de setiembre hydroelectric projects are all locatedwithin the Lempa 's river course. This river constitutesthe main energy and hydric wealth of the country, whichis equivalent to 72%. It is estimated that the amount ofwater drained from soil in the territory is equivalent to18.000.000 m3 per year, representing 33% of the totalrain average. (Arteaga, 1994)
Considering the physical borders of the hydrographicbasins, the area of the bordering basins represents almost50% more of the national territory , which flow means34% of the available water at the national level. About28% of the Lempa river's water comes from Hondurasand Guatemala, and 34% of El Salvador's available watercomes from these two countries.
The lack of treatment of residual household, industrialand agroindustrial waters affects the quality of thecountry's most important water source, the Lempa river.Also, this river's geographic location and its flow towardsthe sea facilitates the distribution of pollutants in its waterthrough the whole national territory.
POPULATION DISTRIBUTION DRINKING WATER AVAILABILITY INURBAN AND RURAL AREAS
ZONE
SOUTHWESTERNEASTERNNORTH
PORCENTAGE
7418
AREA %OF PEOPLE WHO HAVE ACCESSTO DRINKING WATER
IN ACEPTABLE CONDITIONSURBAN 55.9RURAL 13.3
m- GWRcCentraLAmerica
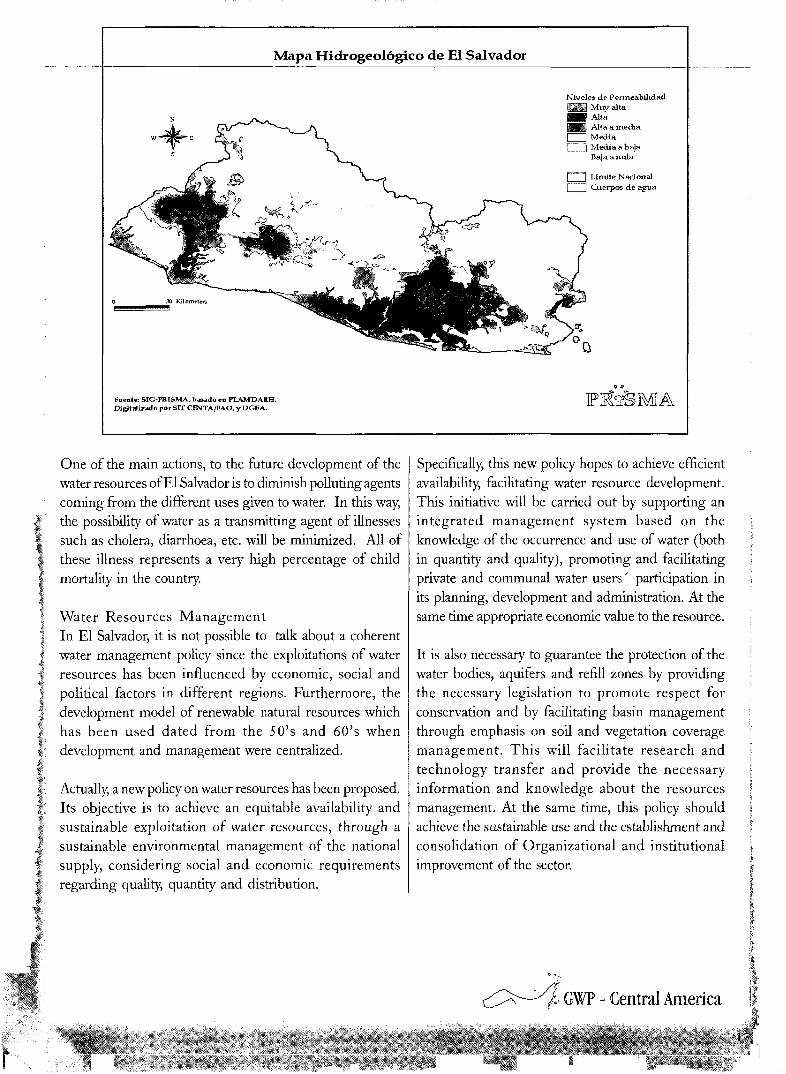
Mapa Hidrogeológico de El Salvador
Niveles de PermeabilidadMuy alta
¡il AltaAlta a inediaMedia
f ] Media a bajaBaja a nula
I"""1""""""! Límite NacionalCuerpos de agua
Fuente SIG-PRISMA, basado en FLAMDARH.Digital i£ado por SIT CENTA/FAQ, y DGEA, Pfc'SMA
One of the main actions, to the future development of thewater resources of El Salvador is to diminish polluting agentscoming from the different uses given to water. In this way,the possibility of water as a transmitting agent of illnessessuch as cholera, diarrhoea, etc. will be minimized. All ofthese illness represents a very high percentage of childmortality in the country.
Water Resources ManagementIn El Salvador, it is not possible to talk about a coherentwater management policy since the exploitations of waterresources has been influenced by economic, social andpolitical factors in different regions. Furthermore, thedevelopment model of renewable natural resources whichhas been used dated from the 50's and 60's whendevelopment and management were centralized.
Actually, a new policy on water resources has been proposed.Its objective is to achieve an equitable availability andsustainable exploitation of water resources, through asustainable environmental management of the nationalsupply, considering social and economic requirementsregarding quality, quantity and distribution.
Specifically, this new policy hopes to achieve efficientavailability, facilitating water resource development.This initiative will be carried out by supporting anintegrated management system based on theknowledge of the occurrence and use of water (bothin quantity and quality), promoting and facilitatingprivate and communal water users' participation inits planning, development and administration. At thesame time appropriate economic value to the resource.
It is also necessary to guarantee the protection of thewater bodies, aquifers and refill zones by providingthe necessary legislation to promote respect forconservation and by facilitating basin managementthrough emphasis on soil and vegetation coveragemanagement. This will facilitate research andtechnology transfer and provide the necessaryinformation and knowledge about the resourcesmanagement. At the same time, this policy shouldachieve the sustainable use and the establishment andconsolidation of Organizational and institutionalimprovement of the sector.
'^L GW - Central America
Area: 130.000 km2
Population: 5.000.000 inhabitantsGrowth Rate of Population: 2.6%GNI / per capita: US$410Water resources per capita (1999) : 38.668m3 /capitaWater withdrawal (% of water resource): 0.7%Urban population access to an improved water source (year 2000): 95%Urban population access to a sanitation system (year 2000): 96%Agricultural area (% of the total area): 62.3%Agricultural contribution to economy (% GDP-1999): 32%Irrigated agricultural area: 3.2% of total agricultural areaProtected areas (% total area): 7.5%Forest covered area (% total area, 2000): 33.000 km2, 27%Electric power consumption per capita: 281 KWh, 1998CO2 emissions per capita (Metric tons / per cap.) 0.8 (1990)
Nicaragua 's Statistics (World Bank, 2000)
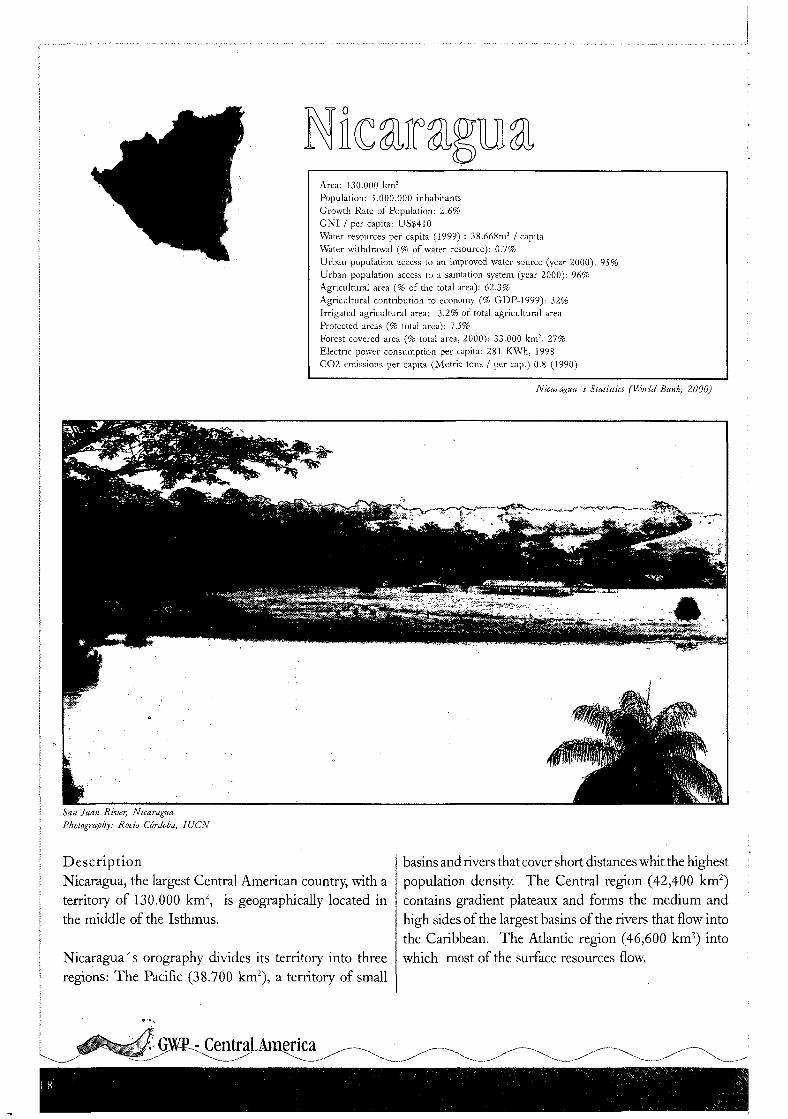
San Juan River, NicaraguaPhotography: Rocío Cordoba, IUCN
DescriptionNicaragua, the largest Central American country, with aterritory of 130.000 km2, is geographically located inthe middle of the Isthmus.
Nicaragua' s orography divides its territory into threeregions: The Pacific (38.700 km2), a territory of small
basins and rivers that cover short distances whit the highestpopulation density. The Central region (42,400 km2)contains gradient plateaux and forms the medium andhigh sides of the largest basins of the rivers that flow intothe Caribbean. The Atlantic region (46,600 km2) intowhich most of the surface resources flow.
^CentraLAm^rica
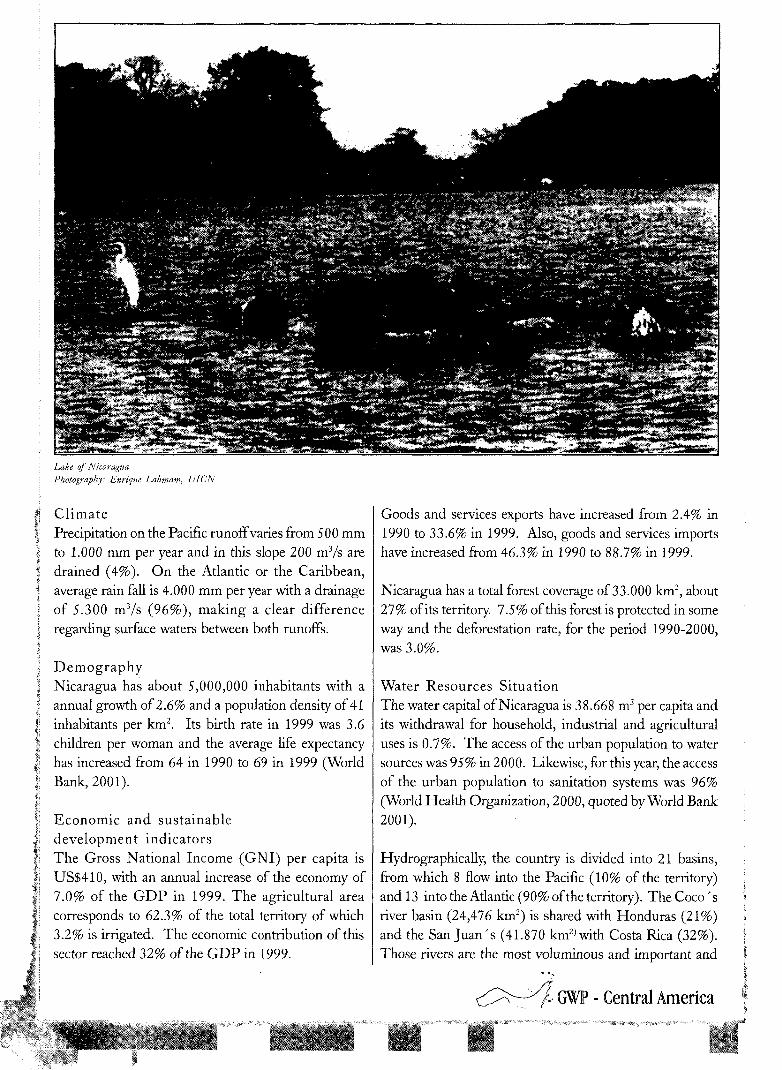
Lake of NicaraguaPhotography: Enrique Lahmam, U1CN
ClimatePrecipitation on the Pacific runoff varies from 500 mmto 1.000 mm per year and in this slope 200 m3/s aredrained (4%). On the Atlantic or the Caribbean,average rain fall is 4.000 mm per year with a drainageof 5.300 m3/s (96%), making a clear differenceregarding surface waters between both runoffs.
DemographyNicaragua has about 5,000,000 inhabitants with aannual growth of 2.6% and a population density of 41inhabitants per km2. Its birth rate in 1999 was 3.6children per woman and the average life expectancyhas increased from 64 in 1990 to 69 in 1999 (WorldBank, 2001).
Economic and sustainabledevelopment indicatorsThe Gross National Income (GNI) per capita isUS$410, with an annual increase of the economy of7.0% of the GDP in 1999. The agricultural areacorresponds to 62.3% of the total territory of which3.2% is irrigated. The economic contribution of thissector reached 32% of the GDP in 1999.
Goods and services exports have increased from 2.4% in1990 to 33.6% in 1999. Also, goods and services importshave increased from 46.3% in 1990 to 88.7% in 1999.
Nicaragua has a total forest coverage of 33.000 km2, about27% of its territory. 7.5% of this forest is protected in someway and the deforestation rate, for the period 1990-2000,was 3.0%.
Water Resources SituationThe water capital of Nicaragua is 38.668 m3 per capita andits withdrawal for household, industrial and agriculturaluses is 0.7%. The access of the urban population to watersources was 95% in 2000. Likewise, for this year, the accessof the urban population to sanitation systems was 96%(World Health Organization, 2000, quoted by World Bank2001).
Hydrographically, the country is divided into 21 basins,from which 8 flow into the Pacific (10% of the territory)and 13 into the Atlantic (90% of the territory). The Coco'sriver basin (24,476 km2) is shared with Honduras (21 %)and the San Juan's (41.870 km2)with Costa Rica (32%).Those rivers are the most voluminous and important and
¿GW-Central America
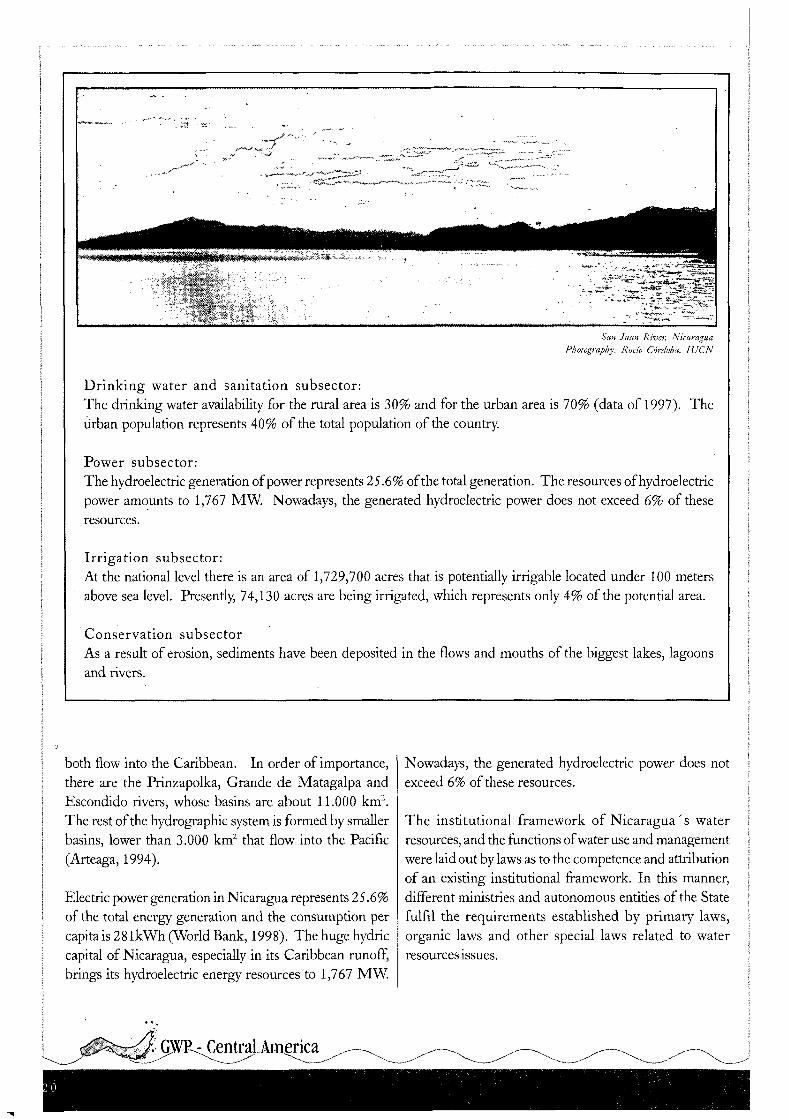
« River, NicaraguaPhotography: Rodo Córdoba, IUCN
Drinking water and sanitation subsector:The drinking water availability for the rural area is 30% and for the urban area is 70% (data of 1997). Theurban population represents 40% of the total population of the country.
Power subsector:The hydroelectric generation of power represents 25.6% of the total generation. The resources of hydroelectricpower amounts to 1,767 MW. Nowadays, the generated hydroelectric power does not exceed 6% of theseresources.
Irrigation subsector:At the national level there is an area of 1,729,700 acres that is potentially irrigable located under 100 metersabove sea level. Presently, 74,130 acres are being irrigated, which represents only 4% of the potential area.
Conservation subsectorAs a result of erosion, sediments have been deposited in the flows and mouths of the biggest lakes, lagoonsand rivers.
both now into the Caribbean. In order of importance,there are the Prinzapolka, Grande de Matagalpa andEscondido rivers, whose basins are about 11.000 km2.The rest of the hydrographic system is formed by smallerbasins, lower than 3.000 km2 that flow into the Pacific(Arteaga, 1994).
Electric power generation in Nicaragua represents 25.6%of the total energy generation and the consumption percapita is 28 IkWh (World Bank, 1998). The huge hydriccapital of Nicaragua, especially in its Caribbean runoff,brings its hydroelectric energy resources to 1,767 MW.
Nowadays, the generated hydroelectric power does notexceed 6% of these resources.
The institutional framework of Nicaragua 's waterresources, and the functions of water use and managementwere laid out by laws as to the competence and attributionof an existing institutional framework. In this manner,different ministries and autonomous entities of the Statefulfil the requirements established by primary laws,organic laws and other special laws related to waterresources issues.
CentraAm^nca
Nicaragua already has an Action Plan for Integral WaterManagement (PARH), the Government has notimplemented. As a result, the country lacks an approvedGeneral Water Law and a Water Authority in charge ofexecuting that law; so, in the short and medium terms,all the actions proposed at the PARH could beimplemented pending political will. Inevitably, thisimplementation will bring about, in the long term, arational and sustainable resource management. Basedon the above, it is clear that Nicaragua is still strugglingwith a divided and un-coordinated management.
With respect to the legislative framework, Nicaragua'sPolitical Constitution establishes that natural resourcesbelong to the State patrimony and that the State has theduty to preserve and conserve them. The Constitutionalso indicates that the State can sign contracts for rationalexploitation of natural resources when the national interestso requires. This concept confirms the State role as thekeeper or manager of the national water resources.
In another context, the present Civil Code, enacted beforemodern concepts of integral water management, containsnorms that recognize water as public property but subjectto specific rules related to private ownership of land. TheCivil Code establishes the right to use water resources bypeople who need them, prohibits the change of riversflow, guarantees the right of way and recognizes the rightof conveying water through third party properties.
In 1996, the General Law of Environment and NaturalResources was passed. This Law confirms that water isa public good and establishes the basis for water resource
administration under the principle of requesting previousauthorization for using these resources. This Law refersto all those issues related to its implementation and thedefinition of the competitive authority to a special law,the General Water Law.
In Nicaragua, the lack of a national water policy, thathighlights the way for integrated management, hasprovoked the present degradation of the most importantwater bodies of the country, both surface andunderground. Also, many conflicts among small andlarge users remain unsolved. In the face of this problemand as a way of seeking its solution, the Comisión Nacionalde Recursos Hídricos (CNRH) managed and monitoredthe elaboration of the PARH, which also included aproposal for a national water resources policy. Thisproposal defines the main objectives that would result insustainable management and use of water. Likewise,this proposal establishes strategic guidelines to be appliedto accomplish those objectives.
Recently, the Law of Organization, Competence andProcedures of Nicaragua' s Executive has been approved.It is expected that the proposals of this Law would carryout a substantial transformation in the governmentalstructure (State apparatus). Regarding water issues, itestablishes a set of regulatory mechanisms that giveeconomic value to a resource for its use, as if this resourcewere another row material of the production processes inwhich water is present. In respect to the initial project ofthe General Water Law drafted by the PARH, it is beenrevised by the CNRH to be later considered by theNational Assembly for its approval.
IGWP - Central America
Area: J 1.000 km2
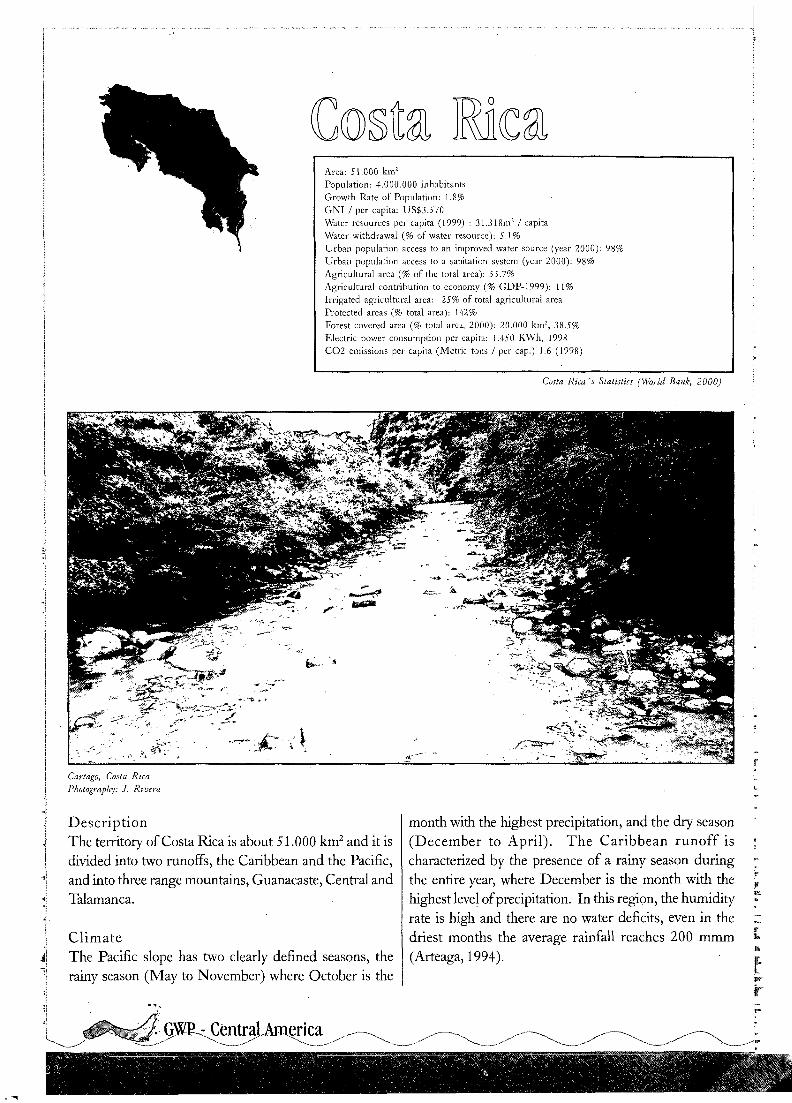
Population: 4.000.000 inhabitantsGrowth Rate of Population: 1.8%GNI / per capita: US$3.570Water resources per capita (1999) : 31.318m3 / capitaWater withdrawal (% of water resource): 5,1%Urban population access to an improved water source (year 2000):Urban population access to a sanitation system (year 2000): 98%Agricultural area (% of the total area): 55.7%Agricultural contribution to economy (% GDP-1999): 11%Irrigated agricultural area: 25% of total agricultural areaProtected areas (% total area): 142%Forest covered area (% total area, 2000): 20.000 km2, 38.5%Electric power consumption per capita: 1.450 KWh, 1998CO2 emissions per capita (Metric tons / per cap.) 1.6 (1998)
Costa Rica 's Statistics (World Bank, 2000)
Cartago, Costa RicaPhotography: J. Rivera
DescriptionThe territory of Costa Rica is about 51.000 km2 and it isdivided into two runoffs, the Caribbean and the Pacific,and into three range mountains, Guanacaste, Central andTalamanca.
ClimateThe Pacific slope has two clearly defined seasons, therainy season (May to November) where October is the
month with the highest precipitation, and the dry season(December to April). The Caribbean runoff ischaracterized by the presence of a rainy season duringthe entire year, where December is the month with thehighest level of precipitation. In this region, the humidityrate is high and there are no water deficits, even in thedriest months the average rainfall reaches 200 mmm(Arteaga, 1994).
DemographyCosta Rica' population is about 4.000.000 with a annualgrowth rate of 1.8% and a population density of 70inhabitants per km2. Its birth rate in 1999 was 2.5children per woman and the average life expectancy was77 in 1999. (World Bank, 2001).
Economic and sustainabledevelopment indicatorsThe Gross National Income (GNI) per capita is ofUS$3.570, the highest of the region. Economy hasgrown from 3.6% of the GDP in 1990 to 8.0% of theGDPin 1999.
The agricultural area corresponds to the 55.7% of thetotal territory from which 25% is irrigated. This area islocated along the regions with the highest hydricshortage, and this situation contributes to reduce lossesduring severe dry seasons. The contribution of this sectorto the economy of the country reached 11% of the GDPin 1999.
Goods and services exports have increased from 34.6%in 1990 to 53.7% in 1999. Goods and services importshave fluctuated as follows: 41.4% in 1990, 88.7% in 1999and 47.2% in 1999.
Costa Rica has a total forest coverage area of 20.000 km2,about 38.5% of its territory. The 14.2% of this forest isprotected in some way and the deforestation rate was 0.8%in 1999.
Water Resources SitationThe water capital of Costa Rica is 31.318 m3 per capitaand its withdrawal for household, industrial andagricultural uses is 5.1%. The access of the urbanpopulation to improved water sources was 98% in 2000.Likewise, for this year, the access of the urban populationto sanitation systems was 98% (World HealthOrganization, 2000, quoted by World Bank, 2001).
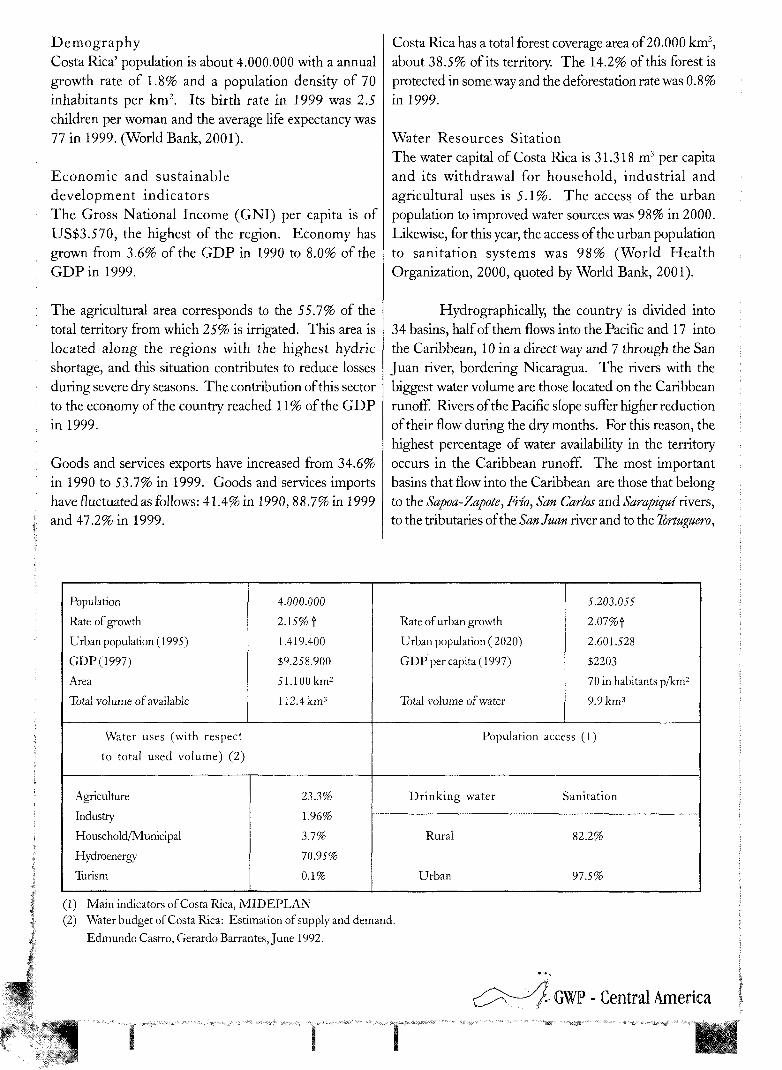
Hydrographically, the country is divided into34 basins, half of them flows into the Pacific and 17 intothe Caribbean, 10 in a direct way and 7 through the SanJuan river, bordering Nicaragua. The rivers with thebiggest water volume are those located on the Caribbeanrunoff. Rivers of the Pacific slope suffer higher reductionof their flow during the dry months. For this reason, thehighest percentage of water availability in the territoryoccurs in the Caribbean runoff. The most importantbasins that flow into the Caribbean are those that belongto the Sapoa-Zapote, Frío, San Carlos and Sarapiqui rivers,to the tributaries of the San Juan river and to the Tortuguero,
Population
Rate of growth
Urban population (1995)
GDP (1997)Area
Total volume of available
4.000.0002.15% f1.419.400$9.258.90051.100km2
112.4km3
Water uses (with respect
to total used volume) (2)
Agriculture
Industry
Household/MunicipalHydroenergyliirism
23.3%1.96%3.7%70.95%0.1%
Rate of urban growth
Urban population ( 2020)GDP per capita (1997)
Total volume of water
5.203.0552.07%t2.601.528$220370 in habitants p/km2
9.9km3
Population access (1)
Drinking water Sanitation
Rural 82.2%
Urban 97.5%
(1) Main indicators of Costa Rica, MIDEPLAN(2) Water budget of Costa Rica: Estimation of supply and demand.
Edmundo Castro, Gerardo Barrantes, June 1992.
<^>^)'- GWP - Central AmericaV»-x- • . . _ if
Reventazón, Pacuare, Chirripó and Sixaola rivers(this last one bordering Panama). At the Pacificslope, the Tempisque, Bebedero, Grande de Térrabaand Grande de Tárcoles river basins are the mostimportant (Arteaga, 1994).
In general, the main problems of the national watersector are:
An un-integrated vision of resourcemanagement, since each institution worksindividually.A divided and obsolete legal framework.Use of the resource without applying anyconcept of solidarity among users.A lack of knowledge about the country' watersituation. There is an absence of realknowledge about national water availability(quantity and quality).The water resources have not been properlyvalued.Excessive demand of water resources fromproductive activities which endangers wateravailability.Increasing water demand.There are no policies aimed at regulating achange in the use of land.
Regarding the water resources policies establishedat the National Development Plan 1998-2002, itconsideres the following strategic objective: "Toguarantee the protection of water resources intendedto supply the different national developmentactivities with water in a sufficient quantity andquality". In order to achieve this objective, thePlan proposes three specific policies containing aset of general programs and actions as follows:
1. Ordinance and planning of water use fornational development.
• To strengthen the Ministry ofEnvironment and Energy's NationalWater Office as the leading institution forplanning and supervising national waterresources.
• To establish the Water ResourcesOrdinance National Plan.
• To draft the national strategy for waterresource management and use.
San Carlos, Cosía RicaFoto: J. Rivera
• To develop and accomplish studies aboutenvironmental impact at public and private projectsthat use water resources.
• To strengthen inter institutional and civil societyinitiatives intended for the integral management andplanning of hydrographic basins.
• To develop a national plan to collect, dispose andtreat wastewater or sewage water.
2. Include costs related to water protection into the costs ofgoods and services
• To look deeply into environmental and economicstudies that may determine the real value of waterresources.
• To include the actual value of water into the fees ofgoods and services produced and supplied by publicinstitutions.
• To be aware of the environmental damage cost causedby the production of goods and services in whichwater is used.
t GWIL- Central-America
3. Promote the ordinance and use of sea water.• To draft the Ordinance Plan for using sea water and protecting ecosystems.• Ordinance and rehabilitation plan for the Golfo de Nicoya.• Management and ordinance plan for the Golfo Dulce.
It is intended, also, to continue controlling and diminishing rivers water pollution by controlling the branches thatflows into them. This task would be under the charge of the Ministry of Health in coordination with the ICAA,and, at the same time, this process would involve local governments and private sector.
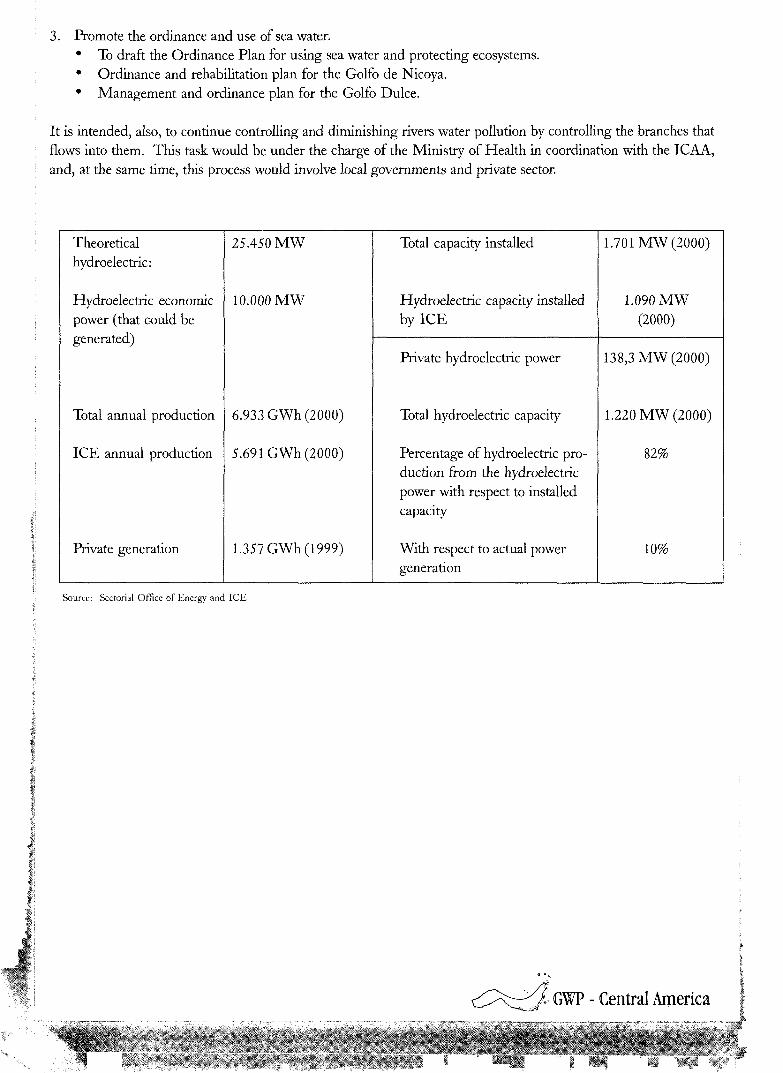
Theoreticalhydroelectric:
Hydroelectric economicpower (that could begenerated)
Total annual production
ICE annual production
Private generation
25.450 MW
10.000 MW
6.933 GWh (2000)
5.69 iGWh (2000)
1.357 GWh (1999)
Total capacity installed
Hydroelectric capacity installedby ICE
1.701MW(2000)
1.090MW(2000)
Private hydroelectric power
Total hydroelectric capacity
Percentage of hydroelectric pro-duction from the hydroelectricpower with respect to installedcapacity
With respect to actual powergeneration
13 8,3 MW (2000)
1.220 MW (2000)
82%
10%
Source: Sectorial Office of Energy and ICE
GWP - Central America
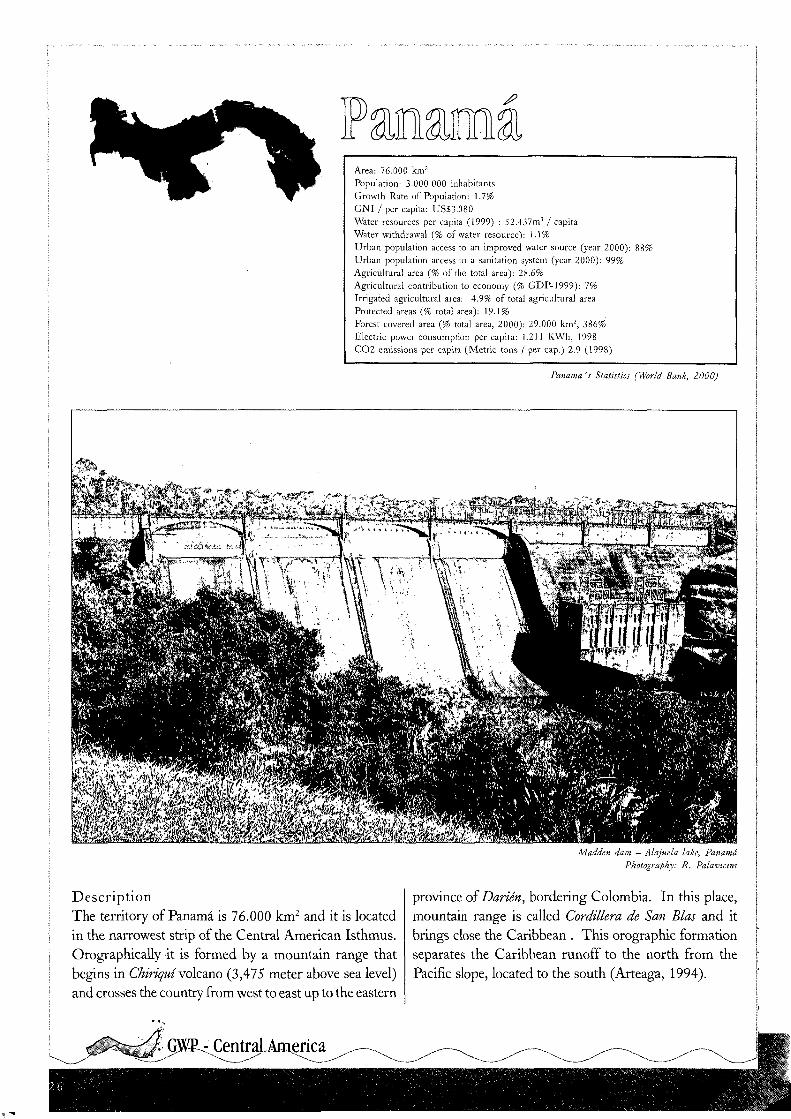
Area: 76.000 km2
Population: 3.000.000 inhabitantsGrowth Rate of Population: 1.7%GNI / per capita: US$3.080Water resources per capita (1999) : 52.437m3 / capitaWater withdrawal (% of water resource): 1.1%Urban population access to an improved water source (year 2000):Urban population access to a sanitation system (year 2000): 99%Agricultural area (% of the total area): 28.6%Agricultural contribution to economy (% GDP-1999): 7%Irrigated agricultural area: 4.9% of total agricultural areaProtected areas (% total area): 19.1%Forest covered area (% total area, 2000): 29.000 km2, 386%Electric power consumption per capita: 1.211 KWh, 1998CO2 emissions per capita (Metric tons / per cap.) 2.9 (1998)
Panama 's Statistics (World Bank, 2000)
DescriptionThe territory of Panamá is 76.000 km2 and it is locatedin the narrowest strip of the Central American Isthmus.Orographically it is formed by a mountain range thatbegins in Chiriqui volcano (3,475 meter above sea level)and crosses the country from west to east up to the eastern
Madden dam — Alajuela lake, PanamáPhotography: R. Pa/avicini
province of Dañen, bordering Colombia. In this place,mountain range is called Cordillera de San Bias and itbrings close the Caribbean . This orographic formationseparates the Caribbean runoff to the north from thePacific slope, located to the south (Arteaga, 1994).
r CentraLAmerica
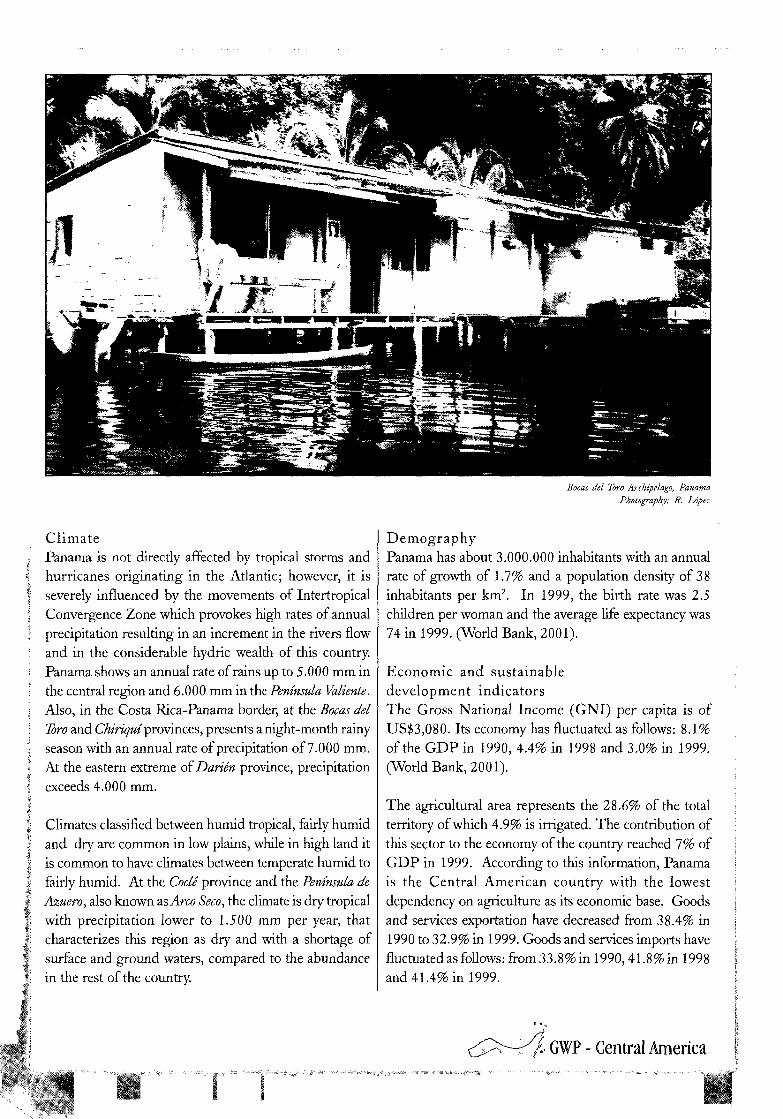
'ocas del Toro Archipelago, PanamaPhotography: R. López
ClimatePanama is not directly affected by tropical storms andhurricanes originating in the Atlantic; however, it isseverely influenced by the movements of IntertropicalConvergence Zone which provokes high rates of annualprecipitation resulting in an increment in the rivers flowand in the considerable hydric wealth of this country.Panama shows an annual rate of rains up to 5.000 mm inthe central region and 6.000 mm in the Península Valiente.Also, in the Costa Rica-Panama border, at the Bocas delToro and Chiriqui provinces, presents a night-month rainyseason with an annual rate of precipitation of 7.000 mm.At the eastern extreme ofDarien province, precipitationexceeds 4.000 mm.
Climates classified between humid tropical, fairly humidand dry are common in low plains, while in high land itis common to have climates between temperate humid tofairly humid. At the Code province and the Península deAzuero, also known as Arco Seco, the climate is dry tropicalwith precipitation lower to 1.500 mm per year, thatcharacterizes this region as dry and with a shortage ofsurface and ground waters, compared to the abundancein the rest of the country.
DemographyPanama has about 3.000.000 inhabitants with an annualrate of growth of 1.7% and a population density of 38inhabitants per km2. In 1999, the birth rate was 2.5children per woman and the average life expectancy was74 in 1999. (World Bank, 2001).
Economic and sustainabledevelopment indicatorsThe Gross National Income (GNI) per capita is ofUS$3,080. Its economy has fluctuated as follows: 8.1%of the GDP in 1990, 4.4% in 1998 and 3.0% in 1999.(World Bank, 2001).
The agricultural area represents the 28.6% of the totalterritory of which 4.9% is irrigated. The contribution ofthis sector to the economy of the country reached 7% ofGDP in 1999. According to this information, Panamais the Central American country with the lowestdependency on agriculture as its economic base. Goodsand services exportation have decreased from 38.4% in1990 to 32.9% in 1999. Goods and services imports havefluctuated as follows: from 33.8% in 1990,41.8%in 1998and 41.4% in 1999.
GWP - Central America
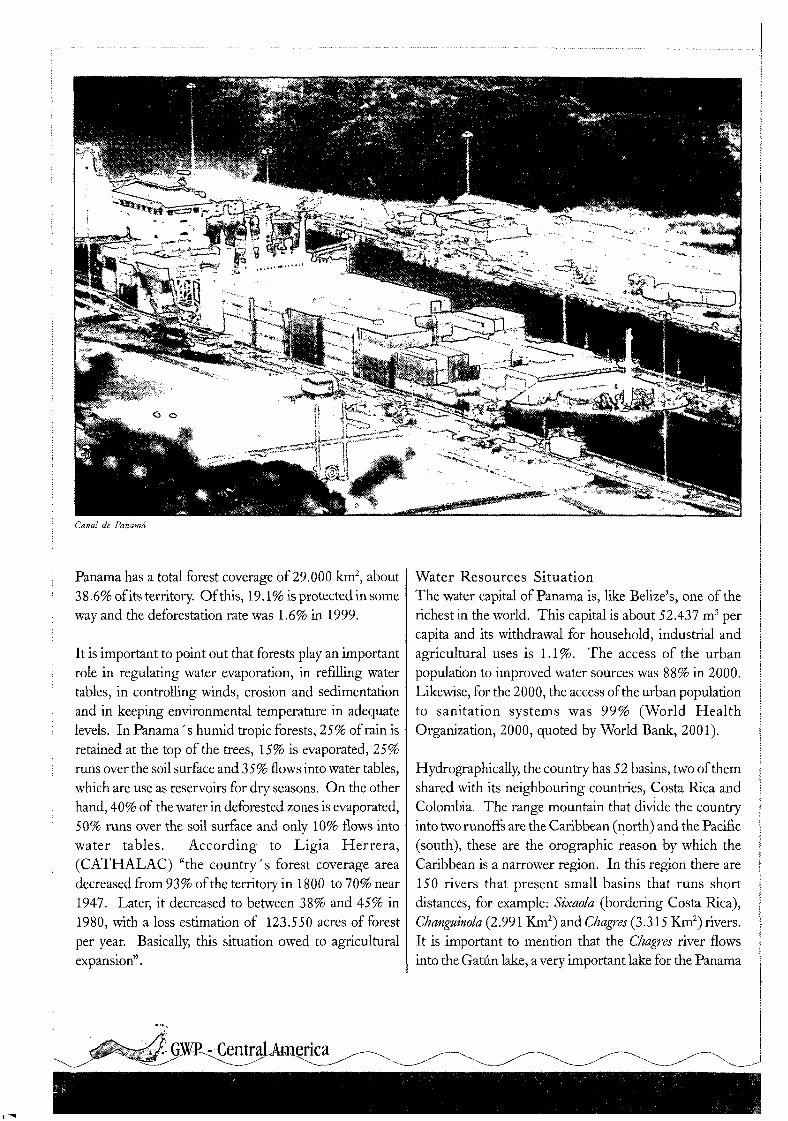
Canal de Panamá
Panama has a total forest coverage of 29.000 km2, about3 8.6% of its territory. Of this, 19.1% is protected in someway and the deforestation rate was 1.6% in 1999.
It is important to point out that forests play an importantrole in regulating water evaporation, in refilling watertables, in controlling winds, erosion and sedimentationand in keeping environmental temperature in adequatelevels. In Panama's humid tropic forests, 25% of rain isretained at the top of the trees, 15% is evaporated, 25%runs over the soil surface and 35% flows into water tables,which are use as reservoirs for dry seasons. On the otherhand, 40% of the water in deforested zones is evaporated,50% runs over the soil surface and only 10% flows intowater tables. According to Ligia Herrera,(CATHALAC) "the country's forest coverage areadecreased from 93% of the territory in 1800 to 70% near1947. Later, it decreased to between 38% and 45% in1980, with a loss estimation of 123.550 acres of forestper year. Basically, this situation owed to agriculturalexpansion".
Water Resources SituationThe water capital of Panama is, like Belize's, one of therichest in the world. This capital is about 52.437 m3 percapita and its withdrawal for household, industrial andagricultural uses is 1.1%. The access of the urbanpopulation to improved water sources was 88% in 2000.Likewise, for the 2000, the access of the urban populationto sanitation systems was 99% (World HealthOrganization, 2000, quoted by World Bank, 2001).
Hydrographically, the country has 52 basins, two of themshared with its neighbouring countries, Costa Rica andColombia. The range mountain that divide the countryinto two runoffs are the Caribbean (north) and the Pacific(south), these are the orographic reason by which theCaribbean is a narrower region. In this region there are150 rivers that present small basins that runs shortdistances, for example: Sixaola (bordering Costa Rica),Changuinola (2.991 Km2) and Chagres (3.315 Km2) rivers.It is important to mention that the Chagres river flowsinto the Gatún lake, a very important lake for the Panama
t-GWRcCentraLAmerica
Canal operation. The Pacific runoff comprises a territorywider than the Caribbean. It is formed by more than330 rivers that flows into the Gulf of Chiriqui and theGulf of Panama. In these rivers, there are 8 basins thatexceed 2.000 km2 and the basin of the Tmra river (10.664km2), the longest of the country.
To refer to the hydric situation in Panama, it is necessaryto begin pointing out the relationship between water,environment and country's development. Through itshistory, Panamanian society has been subjected to thepluvioagriculture system. According to archaeologistRichard Cooke, there is important proof that demonstratesthe use of practices of specialized agriculture (i.e. fewspecies planted in considerable quantities) in somecommunities located in river holm and shore lakes andin intermountain valleys, such as Cerro Punta, Chitra,El Valle de Antón and Cerro Azul. Obviously, thisagricultural economy of natural irrigation was facilitatedby the climatic conditions resulting from the geographiclocation of the country —in the IntertropicalConvergence Zone— and from its orographicarrangement. The mountain ranges never experiencedan absence of precipitation, and the dense forests, rich inbiodiversity and with a wide coverage over hills in thehigh basins, were extraordinary natural managers of waterresources given the significant sloping configuration ofthe continental territory.
From the last decades of the colonial period, the waterresource agriculture experienced, changes rapidly towardsa critical disorder. This situation was caused by theextensive land exploitation that provoked, on one hand,the deterioration of the soil's high productivity levels and,on the other hand, confusion in the natural managementof water; all of these without replacing it with a newartificial management system for rationing water. Currentfigures are very clear on this aspect: from the total of thecountry's potentially irrigable land, only 14.8% is undercontrolled irrigation. These lands are formed, almost asa whole, by lands used by banana companies, sugarfactories and, about 14.826 acres, in rice plantations.
In the energy field, Panama counts with a hydroenergeticresource of 12,000 GWH, and only 10.7% is used. Thethermoelectric production has been increased with the
corresponding implications of consuming fossil fuels thatprovoke greater environmental impacts. The electricpower rate of consumption per capita is 1.211 KWh, 1998(World Bank 2001).
Regarding the availability of hydrometeorologicalinformation, Panama has monthly information aboutprecipitation, temperature and flows which is collectedby the main institutions in charge of these records suchas the current Empresa de Transmisión Eléctrica S.A.(ETESA), the Autoridad del Canal de Panamá (ACP)and the Autoridad Nacional del Ambiente (ANAM).
The Centro de Investigaciones Hidráulicas eHidrotécnicas of the Universidad Tecnológica dePanamá, with the support of UNESCO, carried outduring 1988 and 1989 the Balance Hidrico del Istmo dePanamá. With this initiative, also contributed theDepartamento de Hidrometeorología of the Instituto deRecursos Hidráulicos y Electrificación (IRHE), knownin the present as ETESA. The Balance Hidrico usedthe methodology of the guideline published byUNESCO/ROSTLAC in 1982 focusing on the periodbetween 1965 and 1982. National maps were drawn in1:250,000 scale and the regional map used 1:2,000,000scale. However, updating the assessment of Panama' swater resources is an urgent task, since its currenthydrometeorological network does not properly coverthose regions where water resources related conflicts arebeginning to arise (zone known as Arco Seco).
Inside the institutional framework, the Autoridad'Nacionaldel Ambiente (ANAM) is the national institutionresponsible of assigning permits for using water in thecountry. At the same time, the Ministry of Health andthe Ministry of Agriculture play a similar role for wellsdrilling intended to withdraw underground waters. TheInstituto de Acueductos y Alcantarillados Nacionales(IDAAN) is the responsible entity for supplyingdrinking water and collecting sewage waters in the maincities of the country. The generation of hydroelectricpower is in the charge of the current Empresa deTransmisión Eléctrica S.A. (ETESA). Also, themanagement of waters from the basin of the PanamaCanal is under the control of the Autoridad del Canal dePanama (ACP).
GWP - Central America
BIBLIOGRAPHIC REFERENCES
ALIDES 1994: Alianza para el Desarrollo Sostenible.
Arteaga, O., 1994: Infraestructura Administrativa y de Datos Básicos para la Planificación de Recursos Hídricos enel Istmo Centroamericano. Organización Meteorológica Mundial (OMM), Comité Regional Recursos Hidráulicos(CRRH).
Banco Mundial 2001: "The Little Green Data Book", Washington, D.C.
Banco Mundial 2001: "The Little Data Book", Washington, D.C.
OMM, BID, 1996: Conferencia sobre evaluación y estrategias de gestión de recursos hídricos en América Latinay el Caribe. San José, Costa Rica.
Parlamento Centroamericano (PARLACEN), UNICEF, CRRH, CAFRE, CIUDAGUA, 1994: Taller sobrela Gestión Integrada del Recurso Hídrico del Istmo Centroamericano, Guatemala.
Primera Reunión Plenaria (Rodríguez y Salas, 1995, ALIDES, 1994).Rodríguez, J., Salas, A., 1995: Primera Reunión Plenaria, Alianza para el Desarrollo Sostenible, los recursosnaturales, biodiversidad y legislación ambiental. Panamá, 1995.
SICA, 1998: XX Cumbre de Presidentes Centroamericanos, Secretaría General, Sistema de la IntegraciónCentroamericana, Guatemala.
•*
SICA (CRRH, CCAD, CAFRE, DANIDA) 2000: Plan Centroamericano para el Manejo Integrado de losRecursos Hídricos (PACADIRH).
CentraLAmerica
Global Water PartnershipGWP - Central America
Tel:+(506) 666-1596Tel/Fax: +(506) 666-2967
P.O.Box 14-5000Liberia, Guanacaste, Costa RicaE-mail: [email protected]
F
Global NA^ter PartnershipGWP - Central America