Embed Size (px)
Citation preview
All data are provisional and may be subject to revision. The views expressed in this document are not necessarily those of the Environment Agency. Its officers, servants or agents accept no liability for any loss or damage arising from the interpretation or
use of the information, or reliance upon views contained herein. © Environment Agency 2014
Monthly Water Situation Report
Summary – July 2018 Table 1. North West England summary of the current water situation.
Parameter Current status Rainfall North West England rainfall was 69% of July’s Long Term Average
(LTA). Classed as ‘Below normal’ this month.
Soil Moisture Deficit (SMD) The SMD has increased in most areas and remains high across all of North West England.
River Flows Classed between Exceptionally low’ and ‘Normal’.
Groundwater Levels Classed between ‘Below normal’ and ‘Exceptionally high’
Reservoir Storage Total North West England reservoir storage decreased from 71% at the end of June to 56% at the end of July.
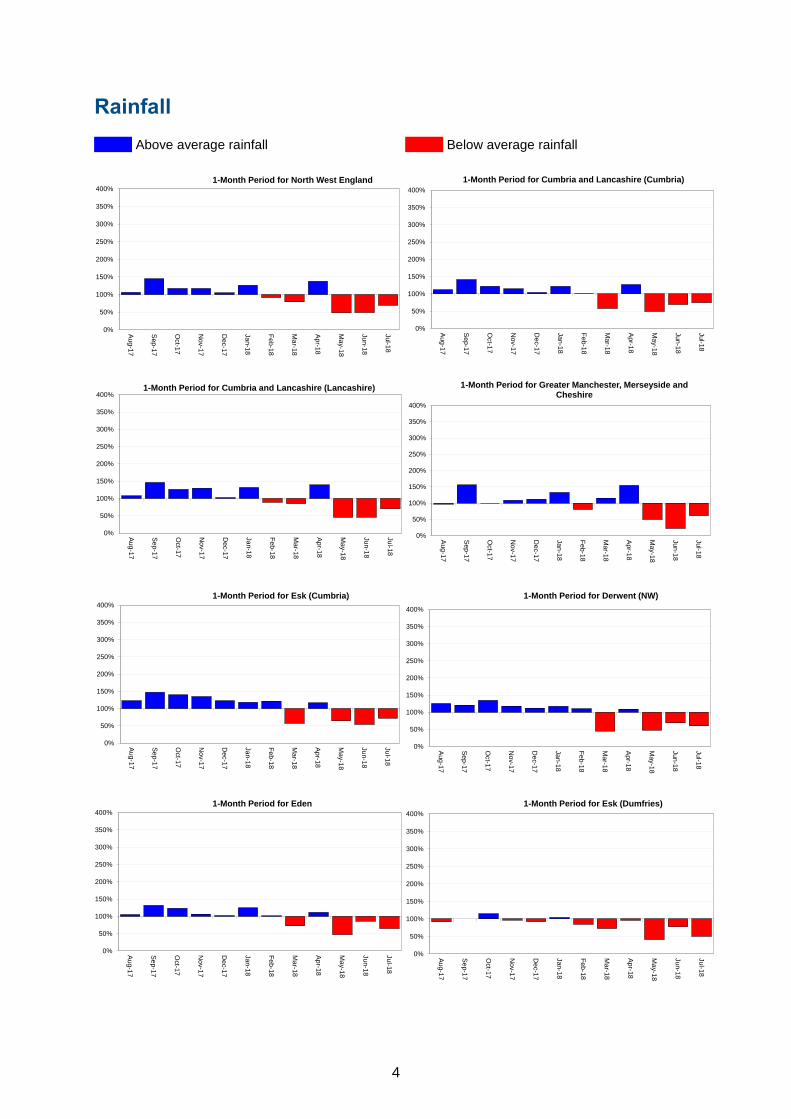
Rainfall Rainfall for North West England was classed at ‘Below normal’ (69% of the LTA) for July. Rainfall was classed as either ‘Below normal’ or ‘Notably low’ across all of the ten hydrological areas (Figure 2). The first three weeks of the month were exceptionally dry but substantial rain at the end of the month increased the monthly rainfall totals. The highest rainfall in July was in the Esk (Cumbria) hydrological area (73% of the LTA for July) and the lowest was in the Esk (Dumfries) (51% of the LTA for July) (Figure 3). The cumulative rainfall totals over the last three months (May, June, July) were classed as ‘Exceptionally low’ in all hydrological areas except the Eden catchment, which was classed as ‘Notably low’. Area wide, the 3 month cumulative rainfall total for Greater Manchester, Merseyside and Cheshire was ranked as the driest on record since 1910. For Cumbria and Lancashire, for the same period, the cumulative rainfall total was classed as the fourth driest since 1910.
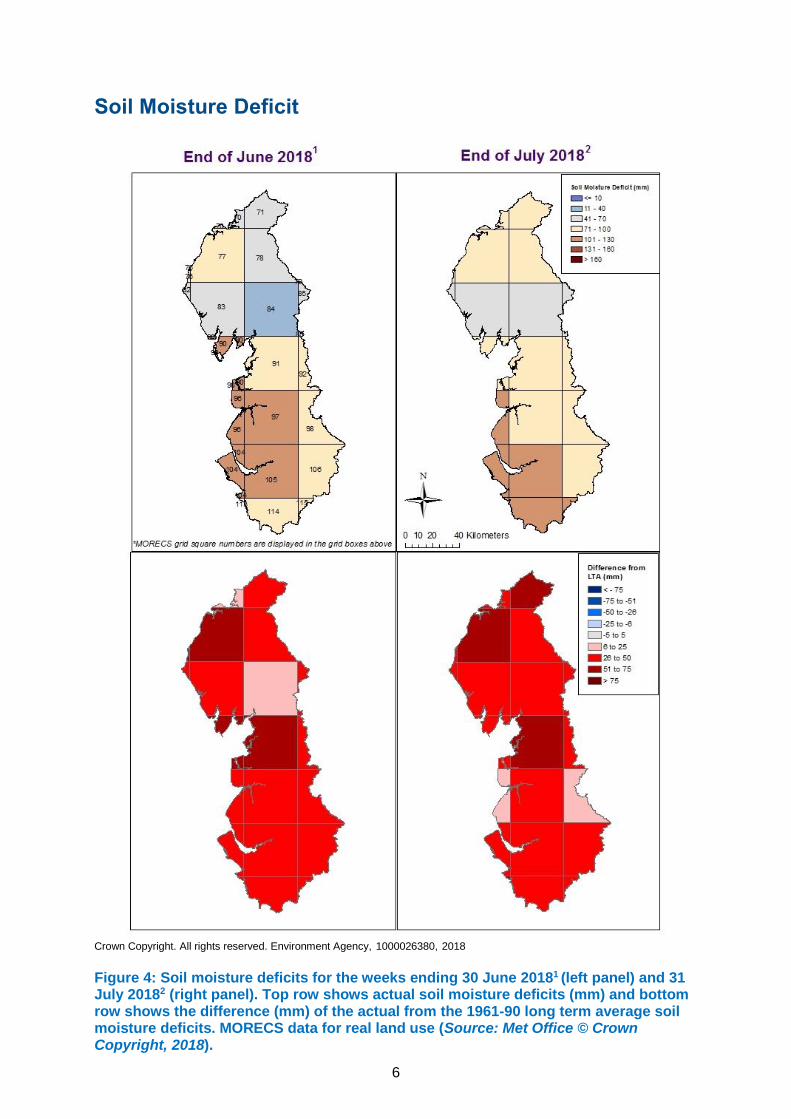
Soil Moisture Deficit/Recharge SMD levels were high across the whole of North West England throughout July with values ranging from 44mm to 127mm (Figure 4).
River Flows River flows were classed between ‘Exceptionally low’ and ‘Normal’ in comparison to the LTA for July (Figure 5). The very high soil moisture deficit and high temperature reduced the catchment response to the rainfall. River flows were highest in the Mersey catchment (63% of the July LTA) and lowest in the Leven (14% of the July LTA) (Figure 6). The Mersey catchment was the only catchment classed as ‘Normal’ this month, however flows were very close to the ‘Below normal’ band. The flows in the Rivers; Lune, Leven, Derwent and Eden were all classed as ‘Exceptionally low’.
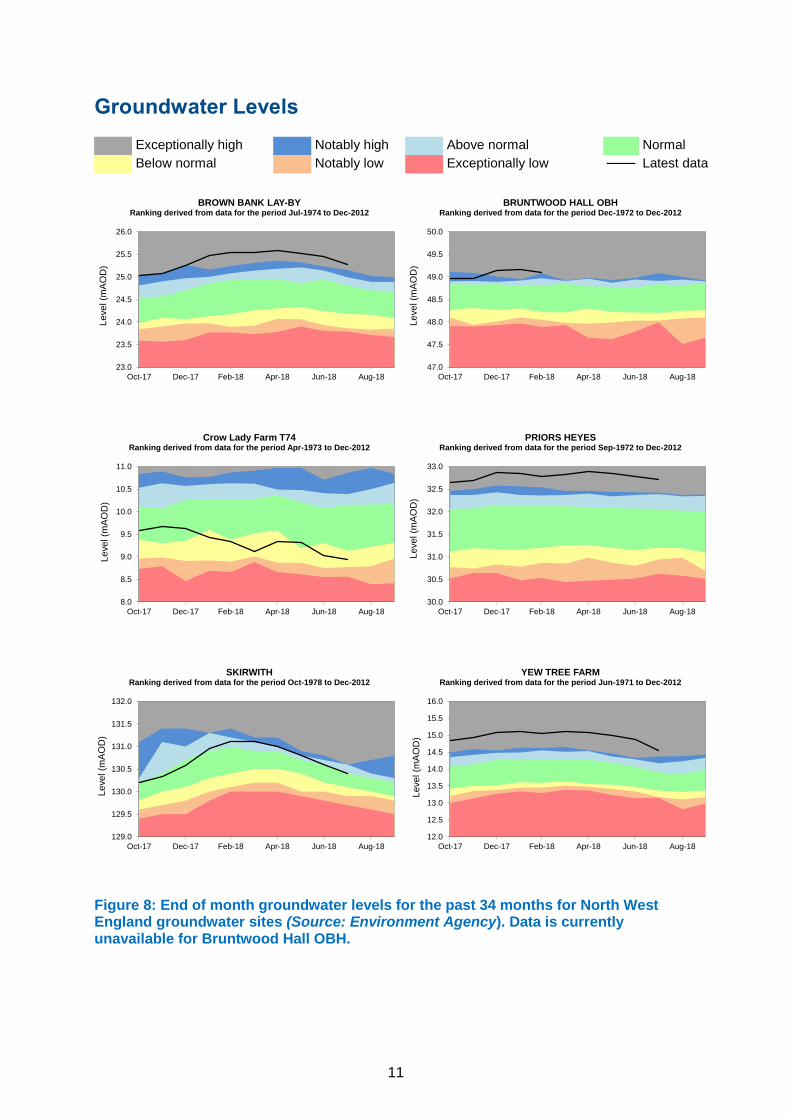
Groundwater Levels Groundwater levels for July were between ‘Below normal’ and ‘Exceptionally high’ (Figure 7). Levels were lowest in the Fylde aquifer (Crow Lay Farm: Below Normal). The levels at Priors Heyes and Yew Tree Farm remain “Exceptionally high” (Figure 8) compared to historic levels because the aquifer is recovering from the effects of historically high abstractions. Levels at Brown Bank Lay-By also remain ‘Exceptionally high’. No data was available for Bruntwood Hall this month.
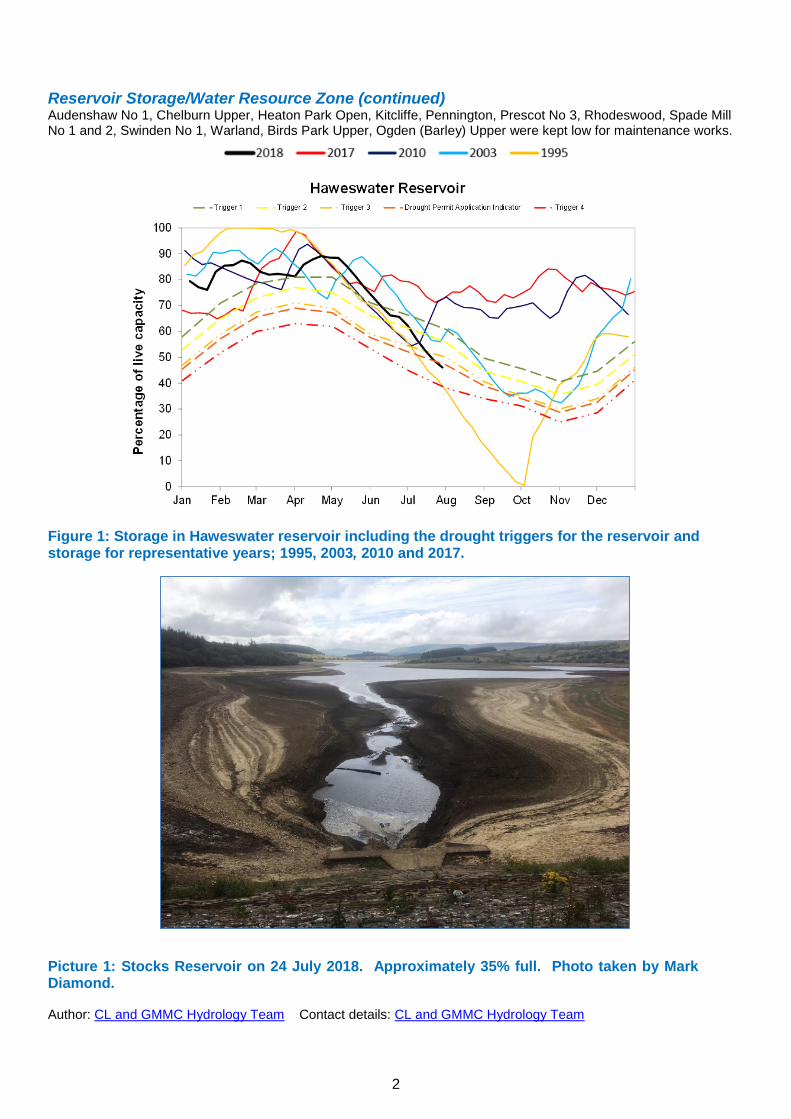
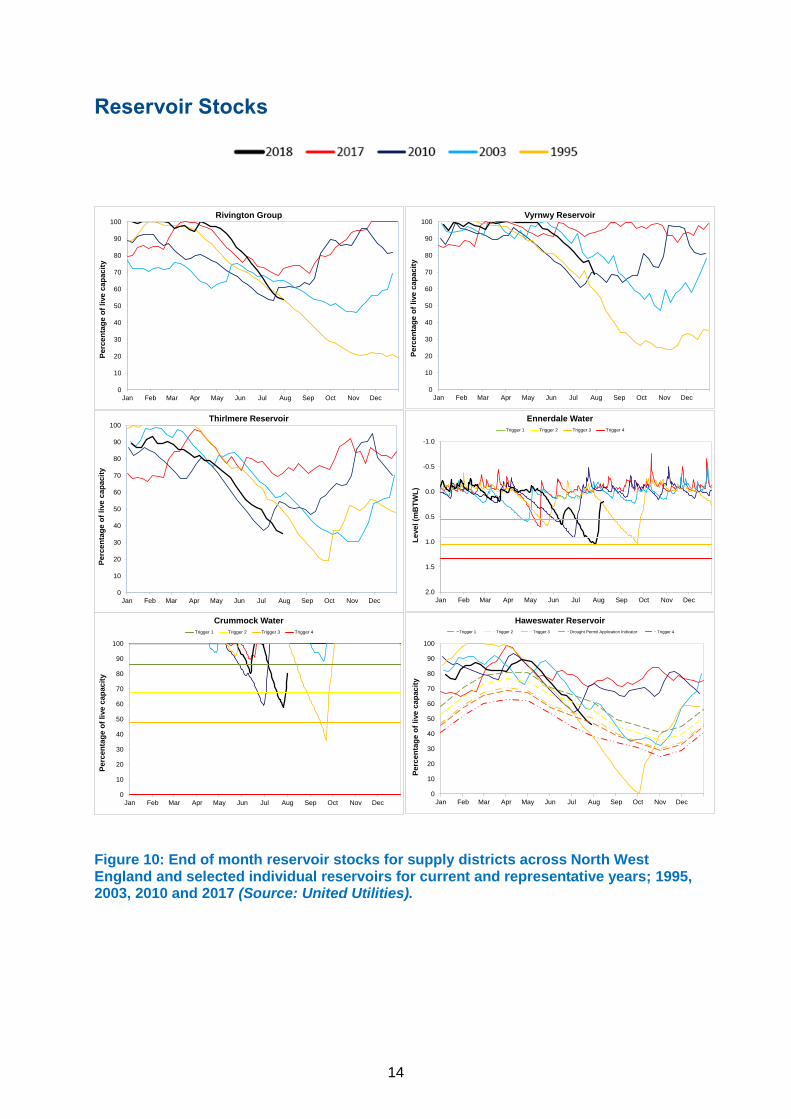
Reservoir Storage/Water Resource Zone Stocks Total North West England reservoir storage decreased from 71% at the end of June to 56% at the end of July (Figure 10), with storage at all reservoirs decreasing throughout the month. At the end of July, reservoir stocks were highest at Crummock (80%) and lowest at Thirlmere (35%). Storage at Ennerdale dropped to 37% during the month but proceeded to recover rapidly following rainfall over the last weekend in July. Haweswater storage fell from 62% at the start of the month to 46% in the final week (Figure 1), crossing the trigger for a Drought Permit application. (continued on next page)
Go to the Glossary
North West England
All data are provisional and may be subject to revision. The views expressed in this document are not necessarily those of the Environment Agency. Its officers, servants or agents accept no liability for any loss or damage arising from the interpretation or
use of the information, or reliance upon views contained herein.
© Environment Agency 2018
2
Reservoir Storage/Water Resource Zone (continued) Audenshaw No 1, Chelburn Upper, Heaton Park Open, Kitcliffe, Pennington, Prescot No 3, Rhodeswood, Spade Mill No 1 and 2, Swinden No 1, Warland, Birds Park Upper, Ogden (Barley) Upper were kept low for maintenance works.
Figure 1: Storage in Haweswater reservoir including the drought triggers for the reservoir and storage for representative years; 1995, 2003, 2010 and 2017.
Picture 1: Stocks Reservoir on 24 July 2018. Approximately 35% full. Photo taken by Mark Diamond. Author: CL and GMMC Hydrology Team Contact details: CL and GMMC Hydrology Team

3
Rainfall
Crown Copyright. All rights reserved. Environment Agency, 1000026380, 2018
Figure 2. Total rainfall (as a percentage) for hydrological areas across North West England for the current month, the last three months, the last six months, and the last 12 months, classed relative to an analysis of respective historic totals. NCIC (National Climate Information Centre) data based on the Met Office 5km gridded rainfall dataset derived from rain gauges (Source: Met Office © Crown Copyright 2018). Provisional data based on Environment Agency 1km gridded rainfall dataset derived from Environment Agency intensity rain gauges.
4
Rainfall Above average rainfall Below average rainfall
0%
50%
100%
150%
200%
250%
300%
350%
400%
Au
g-1
7
Se
p-1
7
Oct-1
7
No
v-1
7
De
c-1
7
Ja
n-1
8
Fe
b-1
8
Ma
r-18
Ap
r-18
Ma
y-1
8
Ju
n-1
8
Ju
l-18
1-Month Period for North West England
0%
50%
100%
150%
200%
250%
300%
350%
400%
Au
g-1
7
Se
p-1
7
Oct-1
7
No
v-1
7
De
c-1
7
Ja
n-1
8
Fe
b-1
8
Ma
r-18
Ap
r-18
Ma
y-1
8
Ju
n-1
8
Ju
l-18
1-Month Period for Cumbria and Lancashire (Cumbria)
0%
50%
100%
150%
200%
250%
300%
350%
400%
Au
g-1
7
Se
p-1
7
Oct-1
7
No
v-1
7
De
c-1
7
Ja
n-1
8
Fe
b-1
8
Ma
r-18
Ap
r-18
Ma
y-1
8
Ju
n-1
8
Ju
l-18
1-Month Period for Cumbria and Lancashire (Lancashire)
0%
50%
100%
150%
200%
250%
300%
350%
400%
Au
g-1
7
Se
p-1
7
Oct-1
7
No
v-1
7
De
c-1
7
Ja
n-1
8
Fe
b-1
8
Ma
r-18
Ap
r-18
Ma
y-1
8
Ju
n-1
8
Ju
l-18
1-Month Period for Greater Manchester, Merseyside and Cheshire
0%
50%
100%
150%
200%
250%
300%
350%
400%
Au
g-1
7
Se
p-1
7
Oct-1
7
No
v-1
7
De
c-1
7
Ja
n-1
8
Fe
b-1
8
Ma
r-18
Ap
r-18
Ma
y-1
8
Ju
n-1
8
Ju
l-18
1-Month Period for Esk (Cumbria)
0%
50%
100%
150%
200%
250%
300%
350%
400%
Au
g-1
7
Se
p-1
7
Oct-1
7
No
v-1
7
De
c-1
7
Ja
n-1
8
Fe
b-1
8
Ma
r-18
Ap
r-18
Ma
y-1
8
Ju
n-1
8
Ju
l-18
1-Month Period for Derwent (NW)
0%
50%
100%
150%
200%
250%
300%
350%
400%
Au
g-1
7
Se
p-1
7
Oct-1
7
No
v-1
7
De
c-1
7
Ja
n-1
8
Fe
b-1
8
Ma
r-18
Ap
r-18
Ma
y-1
8
Ju
n-1
8
Ju
l-18
1-Month Period for Eden
0%
50%
100%
150%
200%
250%
300%
350%
400%
Au
g-1
7
Se
p-1
7
Oct-1
7
No
v-1
7
De
c-1
7
Ja
n-1
8
Fe
b-1
8
Ma
r-18
Ap
r-18
Ma
y-1
8
Ju
n-1
8
Ju
l-18
1-Month Period for Esk (Dumfries)
5
Rainfall Above average rainfall Below average rainfall
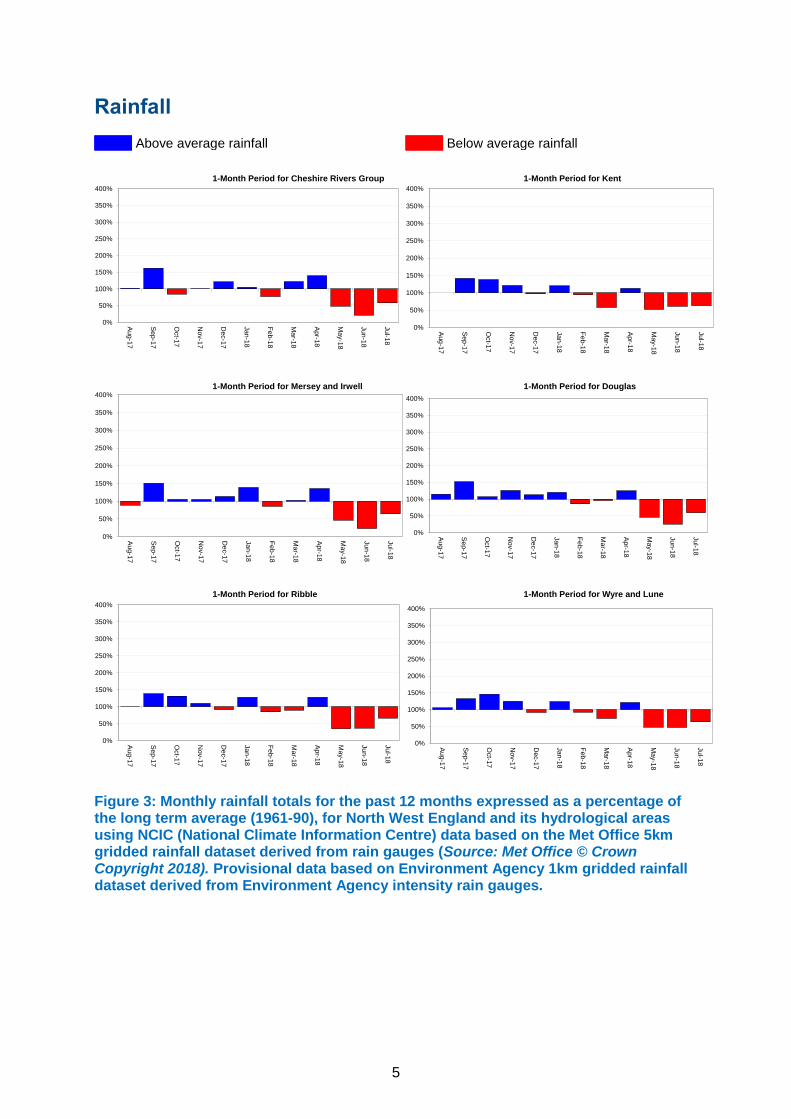
Figure 3: Monthly rainfall totals for the past 12 months expressed as a percentage of the long term average (1961-90), for North West England and its hydrological areas using NCIC (National Climate Information Centre) data based on the Met Office 5km gridded rainfall dataset derived from rain gauges (Source: Met Office © Crown Copyright 2018). Provisional data based on Environment Agency 1km gridded rainfall dataset derived from Environment Agency intensity rain gauges.
0%
50%
100%
150%
200%
250%
300%
350%
400%
Au
g-1
7
Se
p-1
7
Oct-1
7
No
v-1
7
De
c-1
7
Ja
n-1
8
Fe
b-1
8
Ma
r-18
Ap
r-18
Ma
y-1
8
Ju
n-1
8
Ju
l-18
1-Month Period for Cheshire Rivers Group
0%
50%
100%
150%
200%
250%
300%
350%
400%
Au
g-1
7
Se
p-1
7
Oct-1
7
No
v-1
7
De
c-1
7
Ja
n-1
8
Fe
b-1
8
Ma
r-18
Ap
r-18
Ma
y-1
8
Ju
n-1
8
Ju
l-18
1-Month Period for Kent
0%
50%
100%
150%
200%
250%
300%
350%
400%
Au
g-1
7
Se
p-1
7
Oct-1
7
No
v-1
7
De
c-1
7
Ja
n-1
8
Fe
b-1
8
Ma
r-18
Ap
r-18
Ma
y-1
8
Ju
n-1
8
Ju
l-18
1-Month Period for Mersey and Irwell
0%
50%
100%
150%
200%
250%
300%
350%
400%
Au
g-1
7
Se
p-1
7
Oct-1
7
No
v-1
7
De
c-1
7
Ja
n-1
8
Fe
b-1
8
Ma
r-18
Ap
r-18
Ma
y-1
8
Ju
n-1
8
Ju
l-18
1-Month Period for Douglas
0%
50%
100%
150%
200%
250%
300%
350%
400%
Au
g-1
7
Se
p-1
7
Oct-1
7
No
v-1
7
De
c-1
7
Ja
n-1
8
Fe
b-1
8
Ma
r-18
Ap
r-18
Ma
y-1
8
Ju
n-1
8
Ju
l-18
1-Month Period for Ribble
0%
50%
100%
150%
200%
250%
300%
350%
400%
Au
g-1
7
Se
p-1
7
Oct-1
7
No
v-1
7
De
c-1
7
Ja
n-1
8
Fe
b-1
8
Ma
r-18
Ap
r-18
Ma
y-1
8
Ju
n-1
8
Ju
l-18
1-Month Period for Wyre and Lune
6
Soil Moisture Deficit
Crown Copyright. All rights reserved. Environment Agency, 1000026380, 2018 Figure 4: Soil moisture deficits for the weeks ending 30 June 20181
(left panel) and 31
July 20182 (right panel). Top row shows actual soil moisture deficits (mm) and bottom row shows the difference (mm) of the actual from the 1961-90 long term average soil moisture deficits. MORECS data for real land use (Source: Met Office © Crown Copyright, 2018).
7
River Flow
Crown Copyright. All rights reserved. Environment Agency, 1000026380, 2018
Figure 5: Monthly mean river flow for this month, expressed as a percentage of the month’s long term average and classed relative to analysis of historic monthly means (Source: Environment Agency).
8
River Flow Exceptionally high Notably high Above normal Normal Below normal Notably low Exceptionally low ─── Latest data
0
3
6
9
12
15
18
Oct-17 Dec-17 Feb-18 Apr-18 Jun-18 Aug-18
Flo
w (
m3/s
)
Ashbrook, WEAVER (NW)Ranking derived from data for the period Oct-1937 to Dec-2012
0
5
10
15
20
25
30
35
Oct-17 Dec-17 Feb-18 Apr-18 Jun-18 Aug-18
Flo
w (
m3/s
)
Ashton Weir, MERSEYRanking derived from data for the period Jun-1976 to Dec-2012
0
25
50
75
100
Oct-17 Dec-17 Feb-18 Apr-18 Jun-18 Aug-18
Flo
w (
m3/s
)
Caton, LUNERanking derived from data for the period Jan-1959 to Dec-2012
0
5
10
15
20
25
30
35
Oct-17 Dec-17 Feb-18 Apr-18 Jun-18 Aug-18
Flo
w (
m3/s
)
Newby Bridge Fms, LEVEN (NW)Ranking derived from data for the period Jan-1939 to Dec-2012
0
10
20
30
40
50
60
70
Oct-17 Dec-17 Feb-18 Apr-18 Jun-18 Aug-18
Flo
w (
m3/s
)
Seaton Mill, DERWENT (NW)Ranking derived from data for the period Sep-1960 to Dec-2012
0
5
10
15
20
25
Oct-17 Dec-17 Feb-18 Apr-18 Jun-18 Aug-18
Flo
w (
m3/s
)
Pooley Bridge Upstream, EAMONTRanking derived from data for the period Jul-1970 to Dec-2012
9
River Flow Exceptionally high Notably high Above normal Normal Below normal Notably low Exceptionally low ─── Latest data
Figure 6: Monthly mean river flows for the past 10 months for sites across North West England (Source: Environment Agency). There is no flow record from Camerton following damage caused by the floods in November 2009. The Gauging Station at Ouse Bridge replaces this for the Derwent catchment. Flow for Sheepmount has been estimated due to uncertainty in the current rating following the December 2015 floods.
0
20
40
60
80
100
Oct-17 Dec-17 Feb-18 Apr-18 Jun-18 Aug-18
Flo
w (
m3/s
)
Samlesbury Pgs, RIBBLE (NW)Ranking derived from data for the period May-1960 to Dec-2012
0
25
50
75
100
125
150
175
Oct-17 Dec-17 Feb-18 Apr-18 Jun-18 Aug-18
Flo
w (
m3/s
)
Sheepmount, EDEN (NW)Ranking derived from data for the period Oct-1967 to Dec-2012
0
5
10
15
20
Oct-17 Dec-17 Feb-18 Apr-18 Jun-18 Aug-18
Flo
w (
m3/s
)
St Michaels Fms, WYRERanking derived from data for the period Oct-1963 to Dec-2012
10
Groundwater Levels
Crown Copyright. All rights reserved. Environment Agency, 1000026380, 2018
Figure 7: Groundwater levels at the end of the month classed relative to an analysis of historic groundwater levels for the same month (Source: Environment Agency). Geological map reproduced with kind permission from the UK Groundwater Forum, British Geological Survey (BGS) © Natural Environment Research Council (NERC).
11
Groundwater Levels Exceptionally high Notably high Above normal Normal
Below normal Notably low Exceptionally low ─── Latest data
Figure 8: End of month groundwater levels for the past 34 months for North West England groundwater sites (Source: Environment Agency). Data is currently unavailable for Bruntwood Hall OBH.
23.0
23.5
24.0
24.5
25.0
25.5
26.0
Oct-17 Dec-17 Feb-18 Apr-18 Jun-18 Aug-18
Level (m
AO
D)
BROWN BANK LAY-BYRanking derived from data for the period Jul-1974 to Dec-2012
47.0
47.5
48.0
48.5
49.0
49.5
50.0
Oct-17 Dec-17 Feb-18 Apr-18 Jun-18 Aug-18
Level (m
AO
D)
BRUNTWOOD HALL OBHRanking derived from data for the period Dec-1972 to Dec-2012
8.0
8.5
9.0
9.5
10.0
10.5
11.0
Oct-17 Dec-17 Feb-18 Apr-18 Jun-18 Aug-18
Level (m
AO
D)
Crow Lady Farm T74Ranking derived from data for the period Apr-1973 to Dec-2012
30.0
30.5
31.0
31.5
32.0
32.5
33.0
Oct-17 Dec-17 Feb-18 Apr-18 Jun-18 Aug-18
Level (m
AO
D)
PRIORS HEYESRanking derived from data for the period Sep-1972 to Dec-2012
129.0
129.5
130.0
130.5
131.0
131.5
132.0
Oct-17 Dec-17 Feb-18 Apr-18 Jun-18 Aug-18
Level (m
AO
D)
SKIRWITHRanking derived from data for the period Oct-1978 to Dec-2012
12.0
12.5
13.0
13.5
14.0
14.5
15.0
15.5
16.0
Oct-17 Dec-17 Feb-18 Apr-18 Jun-18 Aug-18
Level (m
AO
D)
YEW TREE FARMRanking derived from data for the period Jun-1971 to Dec-2012
12
Reservoir Stocks
Crown Copyright. All rights reserved. Environment Agency, 1000026380, 2018
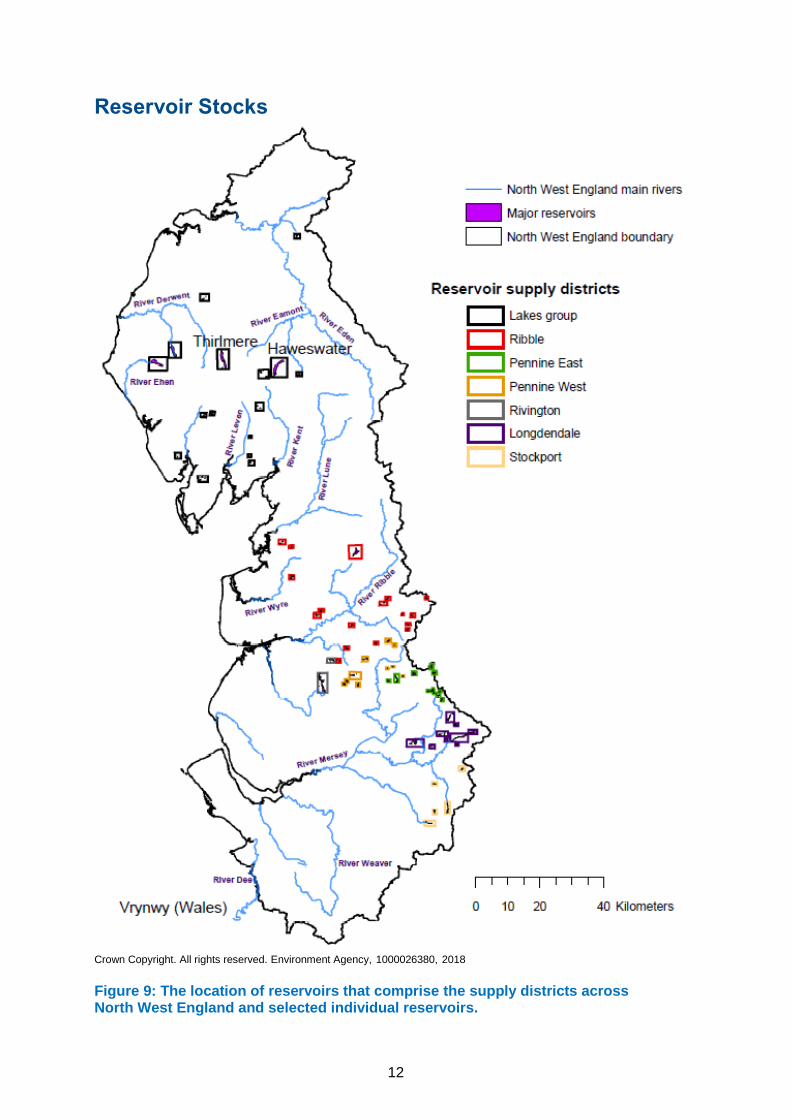
Figure 9: The location of reservoirs that comprise the supply districts across North West England and selected individual reservoirs.

13
Reservoir Stocks
0
10
20
30
40
50
60
70
80
90
100
Jan Feb Mar Apr May Jun Jul Aug Sep Oct Nov Dec
Perc
en
tag
e o
f li
ve c
ap
acit
y
Total North West England Reservoir Stocks
0
10
20
30
40
50
60
70
80
90
100
Jan Feb Mar Apr May Jun Jul Aug Sep Oct Nov Dec
Perc
en
tag
e o
f li
ve c
ap
acit
y
North area supply district: Ribble
0
10
20
30
40
50
60
70
80
90
100
Jan Feb Mar Apr May Jun Jul Aug Sep Oct Nov Dec
Perc
en
tag
e o
f li
ve c
ap
acit
y
North area supply district: Lakes
0
10
20
30
40
50
60
70
80
90
100
Jan Feb Mar Apr May Jun Jul Aug Sep Oct Nov Dec
Perc
en
tag
e o
f li
ve c
ap
acit
y
Pennine supply district (East)
0
10
20
30
40
50
60
70
80
90
100
Jan Feb Mar Apr May Jun Jul Aug Sep Oct Nov Dec
Perc
en
tag
e o
f li
ve c
ap
acit
y
Pennine supply district (West)
0
10
20
30
40
50
60
70
80
90
100
Jan Feb Mar Apr May Jun Jul Aug Sep Oct Nov Dec
Perc
en
tag
e o
f li
ve c
ap
acit
y
Pennine NCZ (East and West)
0
10
20
30
40
50
60
70
80
90
100
Jan Feb Mar Apr May Jun Jul Aug Sep Oct Nov Dec
Perc
en
tag
e o
f li
ve c
ap
acit
y
Peak supply district: Longdendale
0
10
20
30
40
50
60
70
80
90
100
Jan Feb Mar Apr May Jun Jul Aug Sep Oct Nov Dec
Perc
en
tag
e o
f li
ve c
ap
acit
y
Peak supply district: Stockport
14
Reservoir Stocks
Figure 10: End of month reservoir stocks for supply districts across North West England and selected individual reservoirs for current and representative years; 1995, 2003, 2010 and 2017 (Source: United Utilities).
0
10
20
30
40
50
60
70
80
90
100
Jan Feb Mar Apr May Jun Jul Aug Sep Oct Nov Dec
Perc
en
tag
e o
f li
ve c
ap
acit
y
Rivington Group
0
10
20
30
40
50
60
70
80
90
100
Jan Feb Mar Apr May Jun Jul Aug Sep Oct Nov Dec
Pe
rcen
tag
e o
f li
ve
cap
acit
y
Vyrnwy Reservoir
0
10
20
30
40
50
60
70
80
90
100
Jan Feb Mar Apr May Jun Jul Aug Sep Oct Nov Dec
Perc
en
tag
e o
f li
ve
cap
acit
y
Thirlmere Reservoir
-1.0
-0.5
0.0
0.5
1.0
1.5
2.0
Jan Feb Mar Apr May Jun Jul Aug Sep Oct Nov Dec
Level
(mB
TW
L)
Ennerdale Water
Trigger 1 Trigger 2 Trigger 3 Trigger 4
0
10
20
30
40
50
60
70
80
90
100
Jan Feb Mar Apr May Jun Jul Aug Sep Oct Nov Dec
Perc
en
tag
e o
f li
ve
cap
acit
y
Crummock Water
Trigger 1 Trigger 2 Trigger 3 Trigger 4
0
10
20
30
40
50
60
70
80
90
100
Jan Feb Mar Apr May Jun Jul Aug Sep Oct Nov Dec
Perc
en
tag
e o
f li
ve c
ap
acit
y
Haweswater ReservoirTrigger 1 Trigger 2 Trigger 3 Drought Permit Application Indicator Trigger 4

15
Glossary Term Definition Aquifer A geological formation able to store and transmit water. Areal average rainfall Artesian Artesian Borehole
The estimated average depth of rainfall over a defined area. Expressed in depth of water (mm). The condition where the groundwater level is above ground surface but is prevented from rising to this level by an overlying continuous low permeability layer, such as clay. Borehole where the level of groundwater is above the top of the borehole and groundwater flows out of the borehole when unsealed.
Effective rainfall The rainfall available to percolate into the soil or produce river flow. Expressed in depth of water (mm).
Flood Alert/Flood warning Groundwater Long Term Average (LTA) MORECS Naturalised Flow NCIC
Three levels of warnings may be issued by the Environment Agency. Flood Alerts indicate flooding is possible. Flood Warnings indicate flooding is expected. Severe Flood Warnings indicate severe flooding. The water found in an aquifer The arithmetic mean calculated from the historic record, usually based on the period 1961-1990. However, the period used may vary by parameter being reported on (see figure captions for details). Met Office Rainfall and Evaporation Calculation System. This is a generic name for Met. Office services involving the routine calculation of soil moisture and evaporation for Great Britain and uses a grid of 40 x 40 km squares. River flow with the impacts of artificial influences removed. Artificial influences may include abstractions, discharges, transfers, augmentation and impoundments. National Climate Information Centre. NCIC area monthly rainfall totals are derived using the Met Office 5 km gridded dataset, which uses rain gauge observations.
Recharge The process of increasing the water stored in the saturated zone of an aquifer. Expressed in depth of water (mm).
Reservoir gross capacity Reservoir live capacity
The total capacity of a reservoir. The reservoir capacity normally usable for storage to meet established reservoir operating requirements.
Soil moisture deficit (SMD) The difference between the amount of water actually in the soil and the amount of water that the soil can hold. Expressed in depth of water (mm).
Categories for rainfall, river flows, groundwater levels
Exceptionally high Value likely to fall within this band 5% of the time Notably high Value likely to fall within this band 8% of the time Above normal Value likely to fall within this band 15% of the time Normal Value likely to fall within this band 44% of the time Below normal Value likely to fall within this band 15% of the time Notably low Value likely to fall within this band 8% of the time Exceptionally low Value likely to fall within this band 5% of the time
Units
mAOD mBTWL
Metres Above Ordnance Datum (mean sea level at Newlyn Cornwall). meters Below Top Water Level
Return to Summary