Embed Size (px)
Citation preview

Brazil&
The Water Situation
1

Brazil Water Basins
Source: ANA (Agência Na de Águas).
2
Source: IBGE.
3
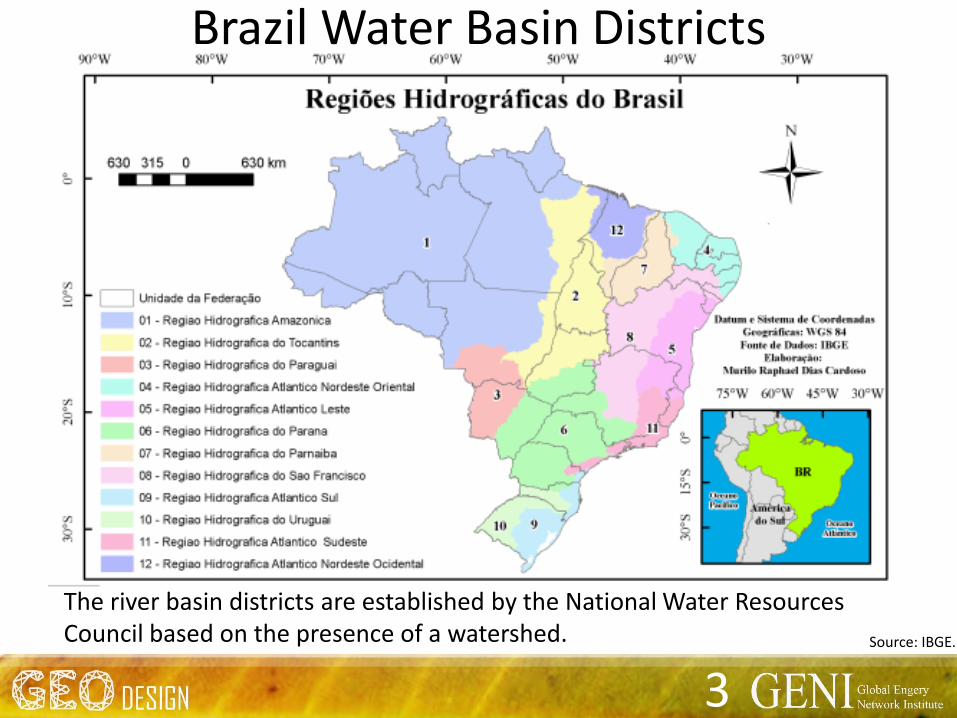
Brazil Water Basin Districts
The river basin districts are established by the National Water Resources Council based on the presence of a watershed.
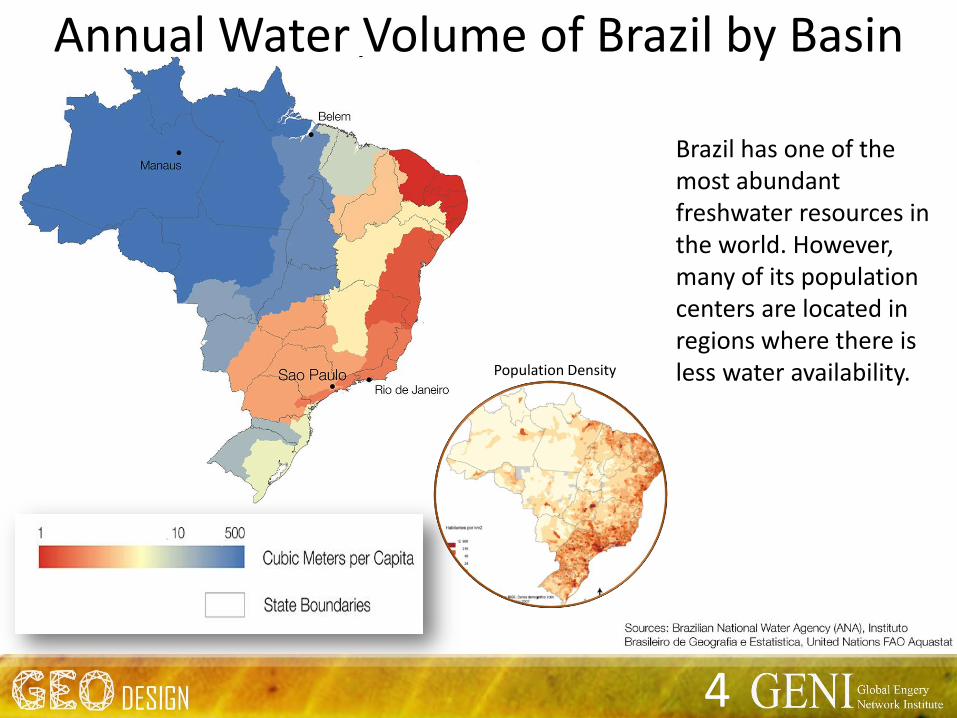
Brazil has one of the most abundant freshwater resources in the world. However, many of its population centers are located in regions where there is less water availability.
4
Annual Water Volume of Brazil by Basin
Population Density
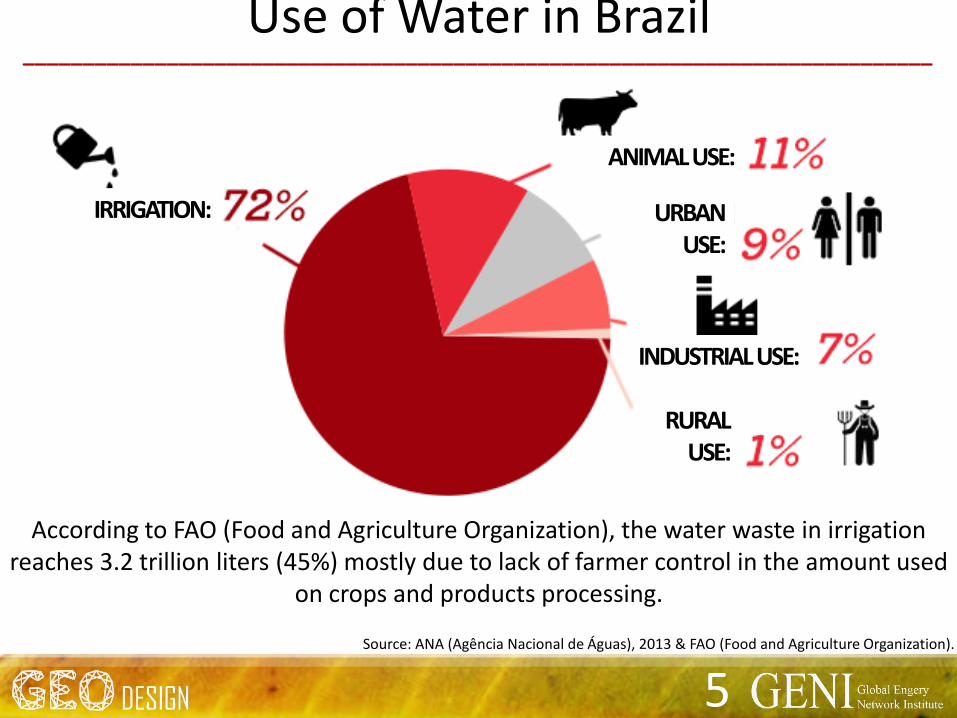
According to FAO (Food and Agriculture Organization), the water waste in irrigation reaches 3.2 trillion liters (45%) mostly due to lack of farmer control in the amount used
on crops and products processing.
Source: ANA (Agência Nacional de Águas), 2013 & FAO (Food and Agriculture Organization).
Use of Water in Brazil____________________________________________________________________________
IRRIGATION:
ANIMAL USE:
URBAN USE:
RURAL USE:
INDUSTRIAL USE:
5
BrazilDrought & Impacts
6

Brazil’s drought brings water supply to near zero capacity at many hydroelectric facilities most located in Southeast region.
BRAZIL DROUGHTPOWER PRICE UP 60%
7

Source: World Resources Institute, 2013
Brazilian Population Density and Baseline Water Stress
8
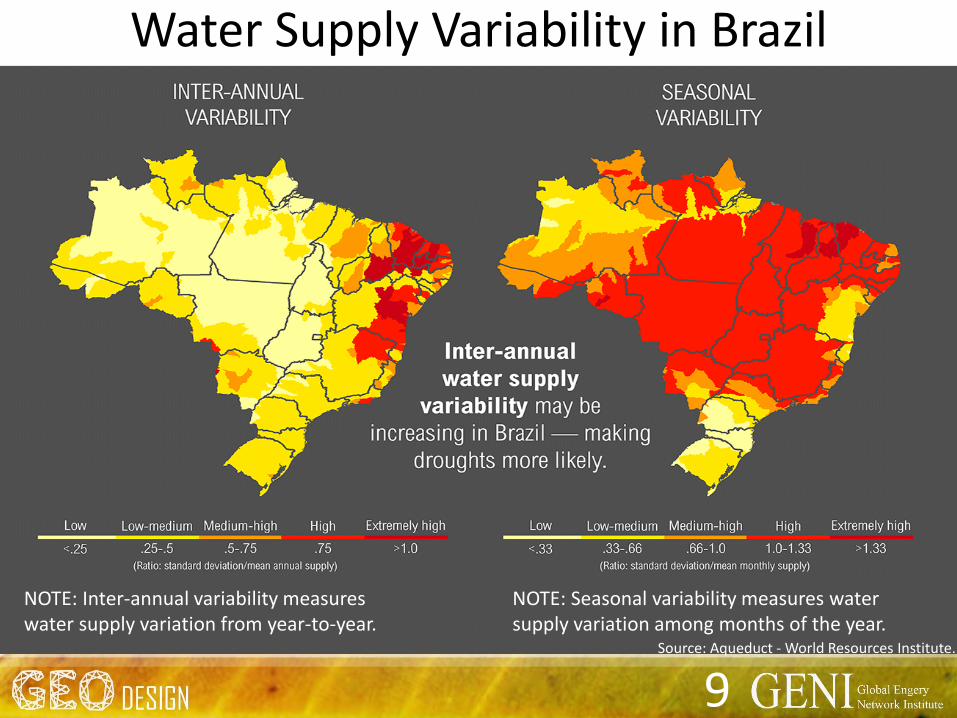
Source: Aqueduct - World Resources Institute.
Water Supply Variability in Brazil
NOTE: Inter-annual variability measures water supply variation from year-to-year.
NOTE: Seasonal variability measures water supply variation among months of the year.
9

Southeast & São Paulo
Water Crisis
10

= Water Treatment Facility
Pumping Station =
11
Source: Folha de São Paulo.
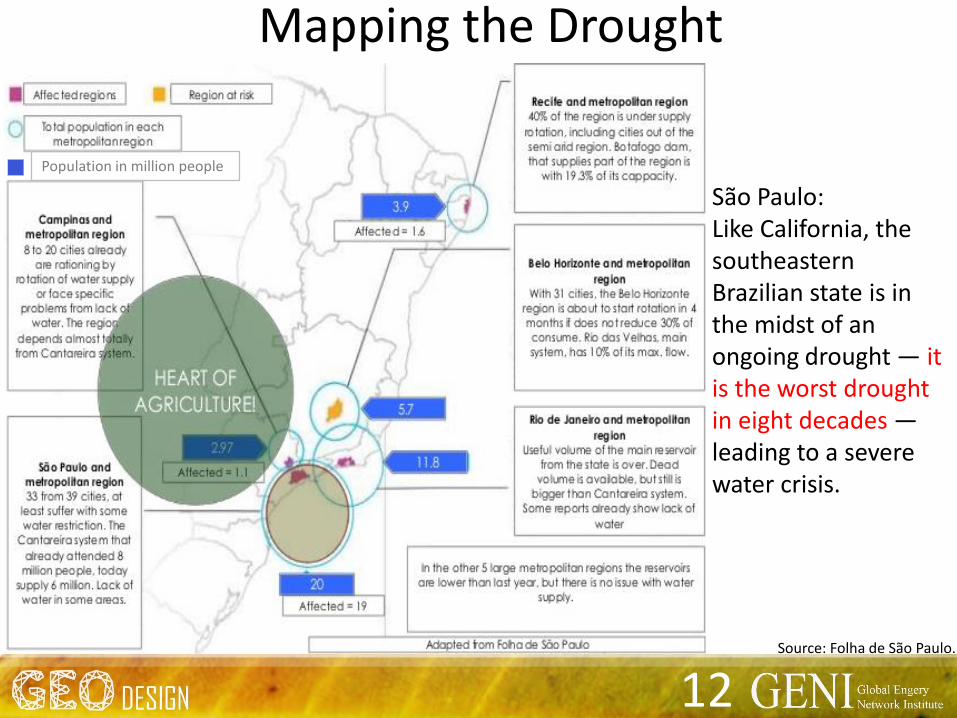
São Paulo:Like California, the southeastern Brazilian state is in the midst of an ongoing drought — it is the worst drought in eight decades —leading to a severe water crisis.
Mapping the Drought
Population in million people
12

Situation of the Cantareira System Graphic shows variation of water volume in the reservoir along the year, since 2009
(in %)
*In May 16, the water volume of the reservoir jumped from 8.2% to 26.7% with the inclusion of the dead volume
Infographic actualized in 07/15/2014
Source: G1, 2014
13
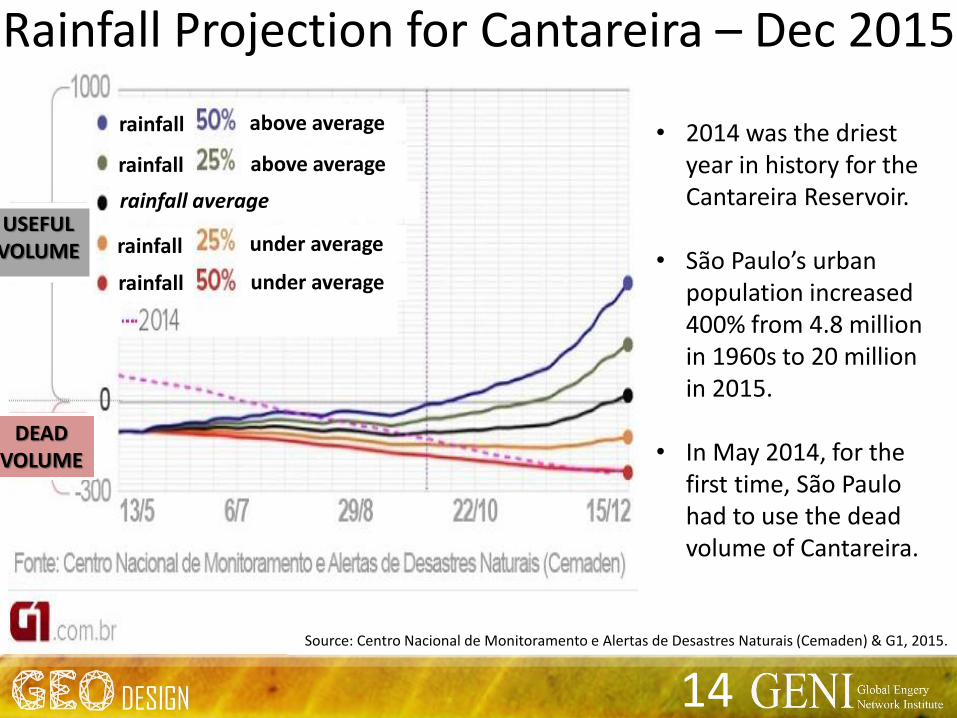
Rainfall Projection for Cantareira – Dec 2015
• 2014 was the driest year in history for the Cantareira Reservoir.
• São Paulo’s urban population increased 400% from 4.8 million in 1960s to 20 million in 2015.
• In May 2014, for the first time, São Paulo had to use the dead volume of Cantareira.
Source: Centro Nacional de Monitoramento e Alertas de Desastres Naturais (Cemaden) & G1, 2015.
rainfall
rainfall average
above average
above average
under average
under average
rainfall
rainfall
rainfall
DEAD VOLUME
USEFUL VOLUME
14

Drought Shrinking Jaguari ReservoirJaguari is one of five reservoirs in the Cantareira System, which supplies water to roughly half of the people in the São Paulo metropolitan area.
• Southeastern Brazil is suffering through one of the worst droughts in decades.
• Rainfall totals for the year are at 12 to 16 inches below normal.
• Reservoirs have dwindled to 3 to 5 percent of storage capacity.
August 16, 2013 August 3, 2014
Source: Earth Observatory
15

Floods &Impacts
16
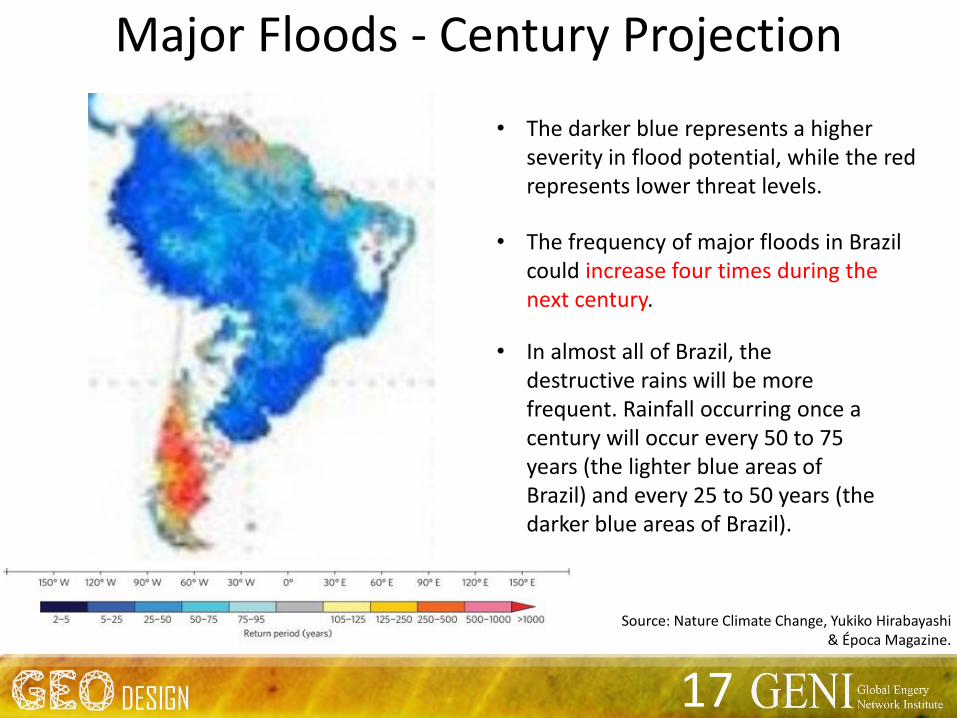
Major Floods - Century Projection
• The darker blue represents a higher severity in flood potential, while the red represents lower threat levels.
• In almost all of Brazil, the destructive rains will be more frequent. Rainfall occurring once a century will occur every 50 to 75 years (the lighter blue areas of Brazil) and every 25 to 50 years (the darker blue areas of Brazil).
• The frequency of major floods in Brazil could increase four times during the next century.
Source: Nature Climate Change, Yukiko Hirabayashi& Época Magazine.
17
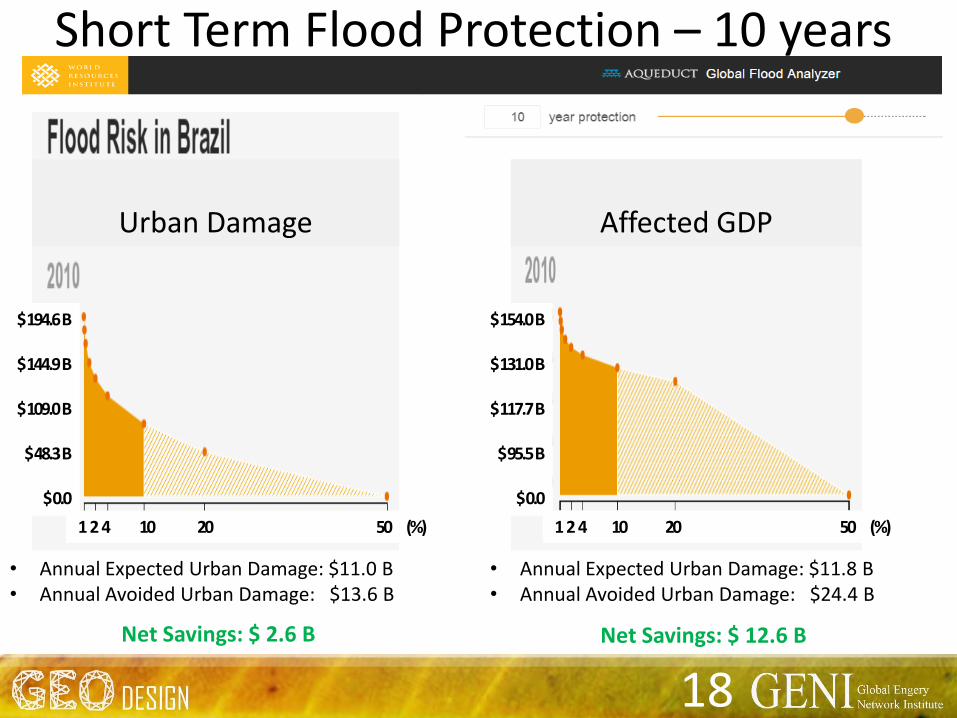
Short Term Flood Protection – 10 years
Urban Damage
$ 194.6 B
$ 144.9 B
$ 109.0 B
$ 48.3 B
$ 0.0
1 2 4 10 20 50 (%) 1 2 4 10 20 50 (%)
$ 154.0 B
$ 131.0 B
$ 117.7 B
$ 95.5 B
$ 0.0
• Annual Expected Urban Damage: $11.0 B• Annual Avoided Urban Damage: $13.6 B
• Annual Expected Urban Damage: $11.8 B• Annual Avoided Urban Damage: $24.4 B
Affected GDP
18Net Savings: $ 2.6 B Net Savings: $ 12.6 B

Long Term Flood Protection – 50 years
• Annual Expected Urban Damage: $2.7 B• Annual Avoided Urban Damage: $ 33.6 B
$ 194.6 B
$ 144.9 B
$ 109.0 B
$ 48.3 B
$ 0.0
$ 154.0 B
$ 131.0 B
$ 117.7 B
$ 95.5 B
$ 0.0
1 2 4 10 20 50 (%) 1 2 4 10 20 50 (%)
Urban Damage Affected GDP
19
Net Savings: $ 18.6 B Net Savings: $ 30.9 B
• Annual Expected Urban Damage: $3.0 B• Annual Avoided Urban Damage: $21.6 B

Brazil &Deforestation
20

Global Warming 1880 to 2011:
Source: NASA. Retrieved from “The Daily Conversation”.
21

Time-lapse: Devastating Deforestation of the Amazonian Rainforest
22

Forest Cover
Between 2000 and 2012, researchers created a year-by-year map of forest loss. Brazil decreased forest loss more than any other country. Conversely,
Indonesia maintained the highest rate of forest loss in that time period.
Source: NASA.
23

Upstream Protected Land
Source: WRI Aqueduct, 2014.
Despite the fact that Amazon has been protected under
government mandates, many people are still
taking advantage of the natural resources.
24
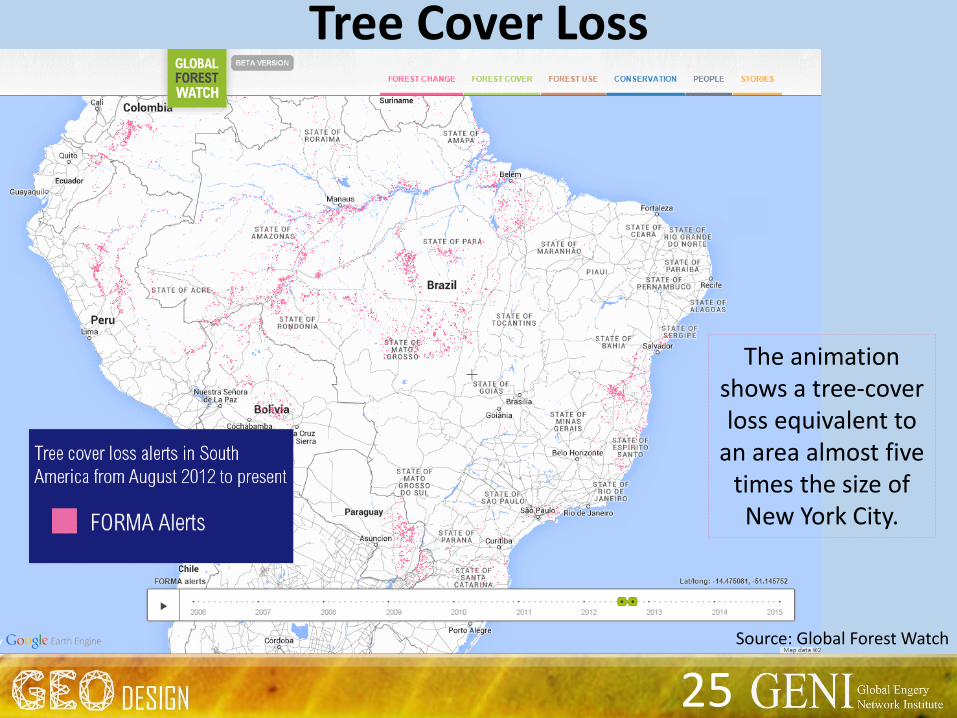
Source: Global Forest Watch
Tree Cover Loss
The animation shows a tree-cover loss equivalent to
an area almost five times the size of New York City.
25
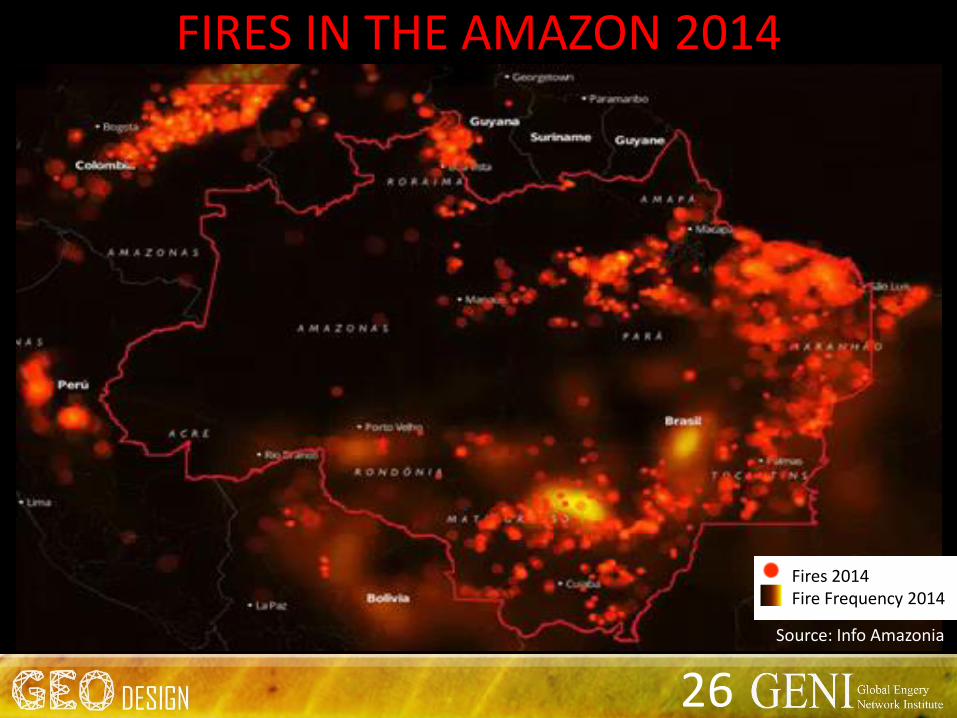
FIRES IN THE AMAZON 2014
Source: Info Amazonia
Fires 2014Fire Frequency 2014
26
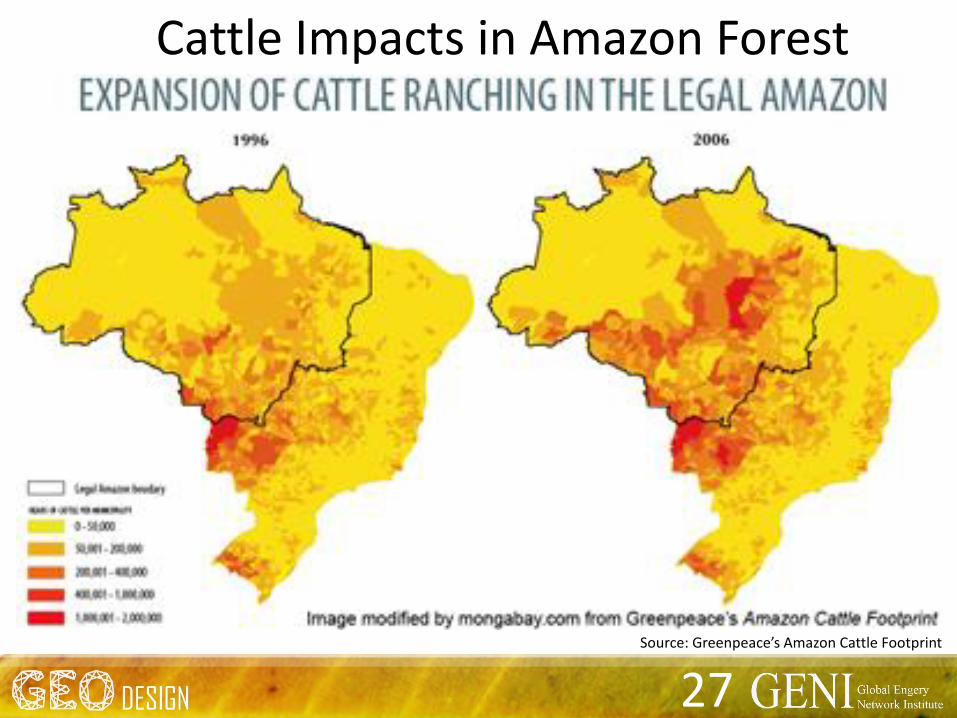
Cattle Impacts in Amazon Forest
Source: Greenpeace’s Amazon Cattle Footprint
27

Cattle Impacts in Amazon Forest
Source: Imazon
28
Raising cattle requires grazing land – trees are
cut down to make room.
Curious?
• Next presentation in 2 weeks
• Thursday, August 6 - 6pm to 8pm
• “Energy and Water Solutions do Exist. Best Practices from around the World”
________________________________________________________________
29

30

31
Presenters
Ana Flavia [email protected]
Leticia [email protected]
________________________________________________________________
31
32
Research Team
Ana BrandãoArnaud VedyGabriela SimõesGuilherme Barbosa
Leticia CarvalhoPedro MatosRenan Micha
________________________________________________________________
32

33
Production
Gabriela Simões
Guilherme Barbosa
Michael Russell
Paul Michael
Pedro Matos
Renan Micha
________________________________________________________________
33