Embed Size (px)
Citation preview

Single-avalanche response mesurement methodfor MPGD detectors
András László
[email protected] RCP, Budapest, Hungary
joint work with Gergo Hamar, Gábor Kiss, Dezso Varga
ISSP2015, Erice, Italy
Single-avalanche response mesurement method for MPGD detectors – p. 1
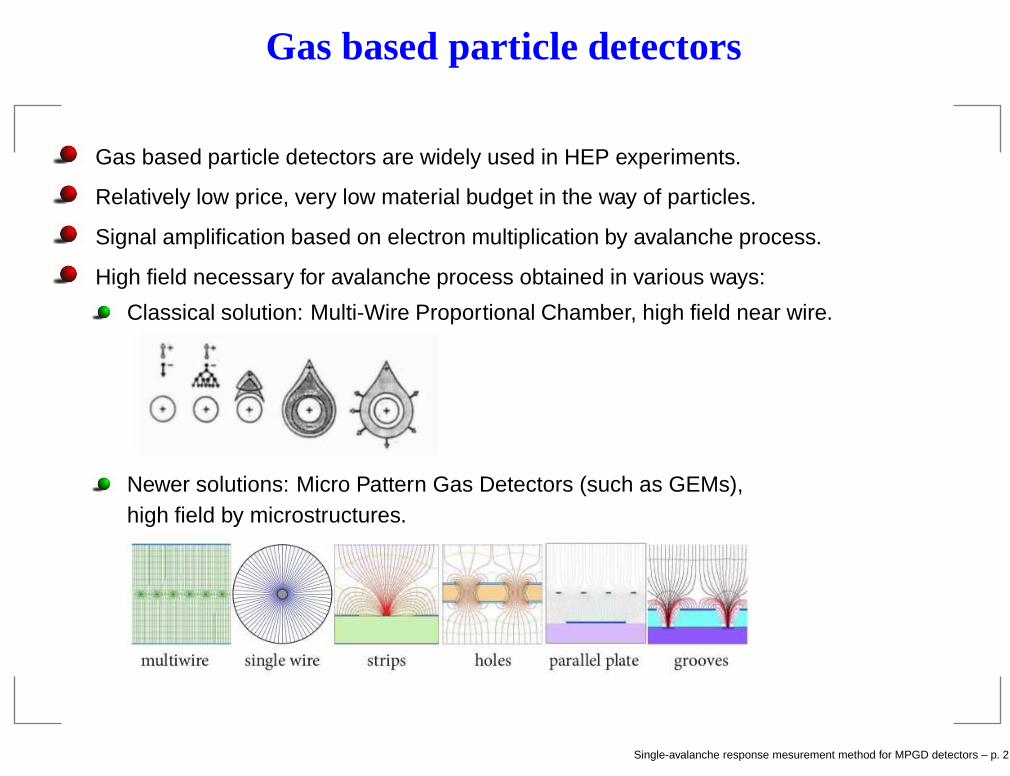
Gas based particle detectors
Gas based particle detectors are widely used in HEP experiments.
Relatively low price, very low material budget in the way of particles.
Signal amplification based on electron multiplication by avalanche process.
High field necessary for avalanche process obtained in various ways:
Classical solution: Multi-Wire Proportional Chamber, high field near wire.
Newer solutions: Micro Pattern Gas Detectors (such as GEMs),high field by microstructures.
Single-avalanche response mesurement method for MPGD detectors – p. 2
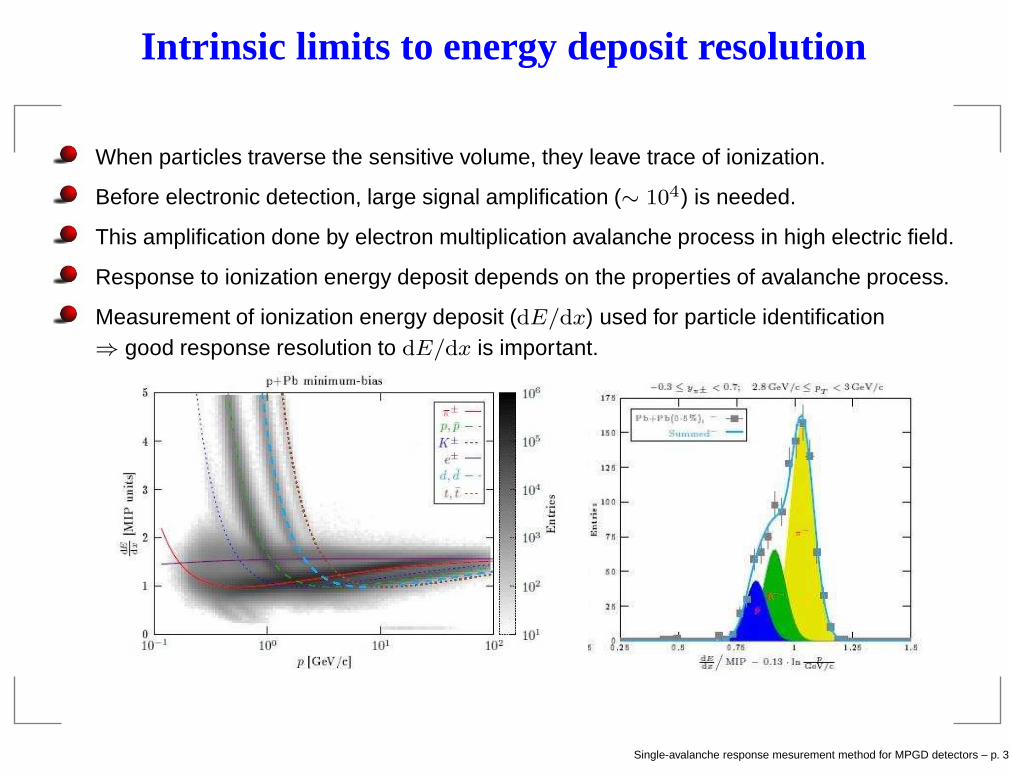
Intrinsic limits to energy deposit resolution
When particles traverse the sensitive volume, they leave trace of ionization.
Before electronic detection, large signal amplification (∼ 104) is needed.
This amplification done by electron multiplication avalanche process in high electric field.
Response to ionization energy deposit depends on the properties of avalanche process.
Measurement of ionization energy deposit (dE/dx) used for particle identification⇒ good response resolution to dE/dx is important.
Single-avalanche response mesurement method for MPGD detectors – p. 3

Idealized large avalanches: system does not have memory, any intermediate electron inthe avalanche generates the same response.⇒ Final population has exponential (geometric) distribution.⇒ σ/mean = 1 for the response distribution.⇒ Intrinsic limit to dE/dx resolution after amplification process.
Lot is known on the behavior on classic MWPC avalanches (NIM 75 161, NIM 89 155):available space and time for avalanche development is large.⇒ Large, close-to-idelized avalanches with large number of generations.⇒ Approximately exponential single-avalanche response.⇒ σ/mean ≈ 1.
For MPGD detectors? Micromegas: T.Zerguerras et al. NIM A608 397. Deviation fromexponential due to limited space and time for avalanche development, σ/mean < 1.
What about GEMs? This talk is about that. Motivated also by ALICE TPC upgrade.
Single-avalanche response mesurement method for MPGD detectors – p. 4

Exp. setup for multiplication response measurement
working gasvolume
quartz window
drift region
gas envelope
1.5mm
5.0mm
8.0mm
8.5mm
4.0m
m
4.0m
m
1.0m
m
drift cathode wires (30um)
field wires (100um) / sense wires (20um)
drifting photoelectrons
pulsed UV LED (defocused)
(gold plated GEM, no multiplication)photoelectron source
amplifier GEM under study(effective gain=1−100)
readout MWPC (high gain stage)MWPC cathode pad
Single-avalanche response mesurement method for MPGD detectors – p. 5

Defocused pulsed UV LED used to extract photoelectrons (PEs)from surface of gold plated classic GEM.
These PEs were transferred to the reverse side,providing a source of laminarly drifting PEs.
Electron multiplication takes place in a subsequent classic GEM (effective gain 1-100).
Multiplied electrons enter into an MWPC amplifier region to enhance their signal.
Electronic FEE amplifier detects the MWPC-amplified signal from sense wires.
Single-avalanche response mesurement method for MPGD detectors – p. 6
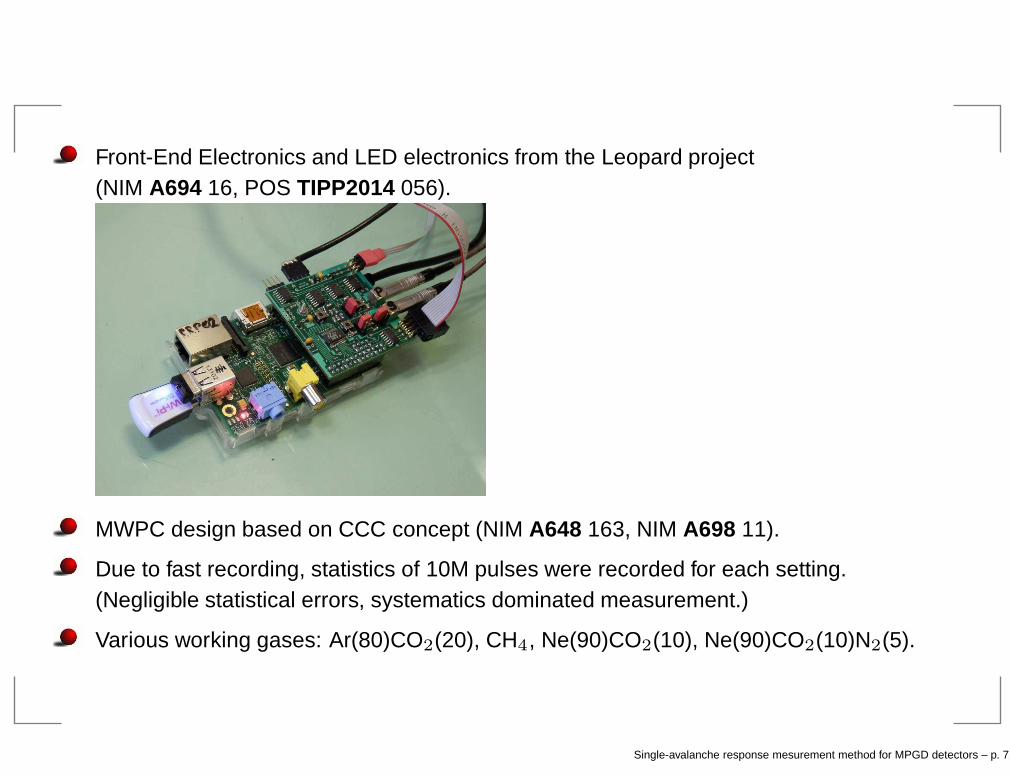
Front-End Electronics and LED electronics from the Leopard project(NIM A694 16, POS TIPP2014 056).
MWPC design based on CCC concept (NIM A648 163, NIM A698 11).
Due to fast recording, statistics of 10M pulses were recorded for each setting.(Negligible statistical errors, systematics dominated measurement.)
Various working gases: Ar(80)CO2(20), CH4, Ne(90)CO2(10), Ne(90)CO2(10)N2(5).
Single-avalanche response mesurement method for MPGD detectors – p. 7
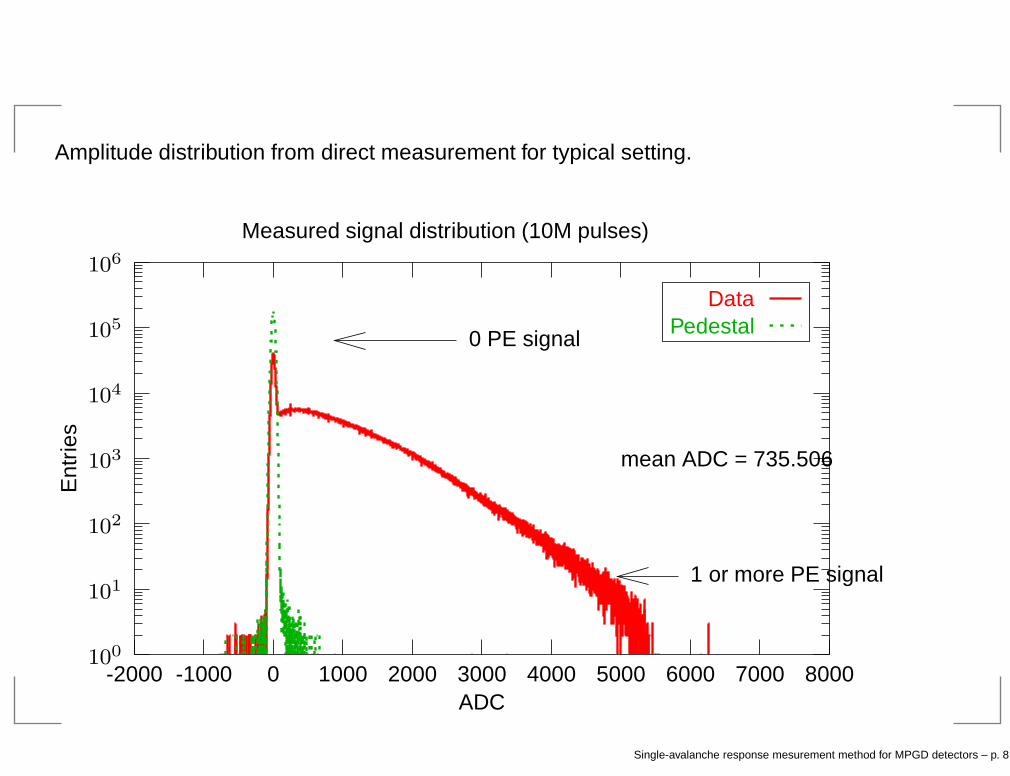
Amplitude distribution from direct measurement for typical setting.
Measured signal distribution (10M pulses)
ADC-2000 -1000 0 1000 2000 3000 4000 5000 6000 7000 8000
Ent
ries
100
101
102
103
104
105
106
0 PE signal
1 or more PE signal
mean ADC = 735.506
DataPedestal
Single-avalanche response mesurement method for MPGD detectors – p. 8

Single-avalanche response reconstruction
Signal formation:
Photoelectron generation with Poisson distribution Pν , here ν is the per pulse PE yield.
Multiplication of each PE by GEM avalanche process, with distribution p each.
Multiplication of each GEM-multiplied PE by MWPC avalanche process, with distributioneγ each (γ: MWPC gain). Note: eγ is approximately exponential with slope γ.
An additive noise is mixed to the signal at the FEE amplifier input, with distribution g.Note: g is approximately Gaussian, and can be measured with zero-signal events.
GEM response distribution to an incoming single-photoelectron:
p.
GEM+MWPC response distribution to an incoming single-photoelectron:
f =∞∑
k=0
e(k-fold convolution)γ p(k).
GEM+MWPC+FEE response distribution to an incoming LED pulse:
h = g (convolution)∞∑
n=0
f(n-fold convolution) Pν(n).
Single-avalanche response mesurement method for MPGD detectors – p. 9

Using convolution theorem, one has in Fourier space:
H = G exp (−ν (1− F ))
where F , G and H is the Fourier transform of f , g and h.Here, F decays to zero because of Riemann-Lebesgue lemma.
⇒ H/G∣
∣
∣
high freq.limit= e−ν , i.e. the PE yield ν can be determined.
⇒ the single-PE GEM+MWPC response f can be reconstructed in mathematical way.
Using an unfolding method (A.László JPCS 368 012043, arXiv:1404.2787):
f =∞∑
k=0
e(k-fold convolution)γ p(k)
can be solved for p.⇒ the single-PE GEM response p can be reconstructed in mathematical way.
Single-avalanche response mesurement method for MPGD detectors – p. 10

Due to the additivity of mean µ and variance σ2 of independent distributions:
µp =µh − µg
ν γ( = GEM gain),
σp
µp
=
√
√
√
√νσ2h− σ2
g
(µh − µg)2−
(
σeγ
µeγ
)21
µp
− 1 ( = GEM intrinsic resolution)
is valid for the moments.⇒ the GEM gain µp and the GEM intrinsic resolution σp/µp can be recovered.
Note: it is seen that systematic errors caused by possible small non-exponentiality ofMWPC response is suppressed by 1 / GEM gain.
Single-avalanche response mesurement method for MPGD detectors – p. 11

Measurements can be performed in two extremes:
small PE yield (ν ≈ 0.01− 0.1) — direct measurement possible without reconstruction,but low amplitude region not directly visible on raw spectra,
large PE yield (ν ≈ 1− 3) — the discussed Fourier method is needed, and can alsorecover the small amplitude region.
Consistency check of single-PE reconstruction
Response [ADC]-2000 -1000 0 1000 2000 3000 4000 5000 6000 7000
Den
sity
func
tion
[1/A
DC
]
10−6
10−5
10−4
10−3
10−2
10−1
Reconstructed single-PE distribution (ν ≈ 1.52383)
Raw distribution (ν ≈ 0.205659)
Good consistency seen.Single-avalanche response mesurement method for MPGD detectors – p. 12

Shape bias by MWPC response is small, especially for not too small GEM gain settings.
Simulation example:GEM and GEM + MWPC response simulation (GEMGain=50, MWPCGain=1000)
Response [number of electrons in MWPC scale]0 50000 100000 150000 200000 250000
Ent
ries
0
50000
100000
150000
200000
250000
300000
350000
400000
GEM extractedGEM extracted + MWPC
Can be corrected in an exact way by the discussed unfolding method, and shape correctionis very small for GEM gain ≥ 10.
Single-avalanche response mesurement method for MPGD detectors – p. 13

Preliminary results
Compilation of scaled GEM multiplicity distributions
Multiplicity / gain0 1 2 3 4
Pro
babi
lity·
gain
0
0.1
0.2
0.3
0.4
0.5
0.6
0.7
0.8
Ar(80)CO2(20), GEMgain=93.1859
Ar(80)CO2(20), GEMgain=47.4713
Ar(80)CO2(20), GEMgain=16.8815
CH4 , GEMgain=12.2961
CH4 , GEMgain=39.5121
CH4 , GEMgain=71.2847
Ne(90)CO2(10), GEMgain=12.0316
Ne(90)CO2(10), GEMgain=35.2746
Ne(90)CO2(10), GEMgain=53.3248
Ne(90)CO2(10)N2(5), GEMgain=8.68682
Ne(90)CO2(10)N2(5), GEMgain=17.0717
Ne(90)CO2(10)N2(5), GEMgain=26.2785
Preliminary results show that shape of GEM avalanche response distribution isapproximately independent of the effective gain, and slightly depends on the working gas(better for Neon based).
Single-avalanche response mesurement method for MPGD detectors – p. 14

The same effect is seen on the σ/mean values: independent of the effective gain, andslightly depends on the working gas (better for Neon based).
Compilation of GEM response σ/mean values
GEM gain0 25 50 75 100 125
σ/m
ean
0
0.25
0.5
0.75
1
Ar(80)CO2(20): σ/mean ≈ 0.840478
CH4 : σ/mean ≈ 0.911974
Ne(90)CO2(10): σ/mean ≈ 0.743731
Ne(90)CO2(10)N2(5): σ/mean ≈ 0.784677
Ar(80)CO2(20) (νeff ≈ 1.66423)
Ar(80)CO2(20) (νeff ≈ 0.0218017)
CH4 (νeff ≈ 3.20924)
CH4 (νeff ≈ 0.013401)
Ne(90)CO2(10) (νeff ≈ 1.5916)
Ne(90)CO2(10) (νeff ≈ 0.0155221)
Ne(90)CO2(10)N2(5) (νeff ≈ 2.3037)
Ne(90)CO2(10)N2(5) (νeff ≈ 0.0236394)
(Systematic errors of large PE yield measurements are better – about 5%.)Single-avalanche response mesurement method for MPGD detectors – p. 15
Summary
An experimental setup and methodology was developedfor determination of the multiplication distribution of GEMelectron avalanches.
Apparatus and methodology was designed specially forthe coverage of wide ranges of effective gain (1-100) aswell as for measurement of the low multiplication regionof the avalanche response.
Experimentally measured avalanche multiplicationdistributions show deviation from exponential for GEMs:σ/mean down to 0.8 were seen.
Preliminary results reveal universal properties of theshape of the single avalanche multiplication distribution.
Best intrinsic resolution (σ/mean) seen for Neon basedworking gases around 0.8 ⇒ improved dE/dx resolution.
Single-avalanche response mesurement method for MPGD detectors – p. 16