Embed Size (px)
Citation preview
SIMPOSIUM NASIONAL AKUNTANSI 9 PADANG
Padang, 23-26 Agustus 2006 1
EFFECT OF EMPLOYEE STOCK OPTION PLANS (ESOPS) TO
PEFORMANCE AND FIRM VALUE : EMPIRICAL STUDY AT JSX
Azwar Anwar
Zaki Baridwan
1. INTRODUCTION
1.1 Background Conflict of interests may be happen between owners or shareholders and mana-
gement, between majority and minority shareholders, either between majority share-
holders and bondholders. Conflict of interests may influence performance and firm
value. One of many way to mitigate conflict of interests between owner and man-
agement is applied Employee Stock Ownership Plans.
In 1950s’, a lawyer and investment banker, Louis Kelso said that capitalism
system will be stronger if the employee joins the firms’ stock ownership. In United
States, Employee Stock Ownership Plans (ESOPs) is a kind of pension program
which was designed for achieve firms’ contribution by fund managing. It will do an
investment to firm stock for employee. This was an employee stock ownership plans
which was formulated by Kelso. In the great line, there are three models or tools
from employee stock ownership participation in the firm, they are employee owner-
ship by direct purchase plan, giving option to employee for purchasing firm stock
(stock option plans) and fund management programs (trust) was designed for in-
vestment. Otherwise, growing of stock ownership plans application in Indonesia fol-
lowing by research of ESOPs Application Study Team for emitting in Indonesia
(2002) which formed by BAPEPAM are:
a) Before 1998, ESOP which is applied by companies in Indonesia, in the early
growing, was forming a stock allocation when companies “go public”. In this
case, we may call a “stock allocation scheme.” At the initial public offering, the
employee get subside or lending which is guaranteed by company.
b) In 1998 – now, the stock ownership growing about was advanced by employee,
other side fixing allocation public offering 10%. Then, likely an option program,
which nor before or other after company do public offering (go public), employee
K-INT 04
SIMPOSIUM NASIONAL AKUNTANSI 9 PADANG
Padang, 23-26 Agustus 2006 2
is given warrant which can do to purchase stock with certain price and certain pe-
riod at the next time.
Implementation employee stock option plans (ESOP) has a few strategic object,
they are defense employee who has ability to grow up firm, increasing cash flow,
increasing motivation and performance, mitigate conflict of interests between owner
(principal) and management (agent), anticipation hostile take-over, also improving
firm value by increasing stock return..
There are many key issues which must be looked at an employee stock owner-
ship plans in Indonesia. All of them, option agreement and announcement, vesting
period, option period, option date applied or option giving date, and price exercise.
Other thing, cost of compensation destination on option fairly value, is key instru-
ment in implementation the plans, too.
2. THEORY AND HYPOTHESIS
2.1 Agency Theory
Agency costs reflect different interests between management (agent) and share-
holder (principal) (Watts and Zimmerman, 1986: 184). Assuming this theory is
management wage is fixed and low of monitoring activity, also less desired by agent
to limit their activities due to contract (bonding). Risk averse agent with tends to
priority their self-interest (self-serving behavior) will allocate resources by investing
to thing which is not increase firm value. Contrary, risk taker agent will tend to in-
vests in high risk investment because cost of investing does not fully be charged by
owner. The other side, agent also can do ‘shirking & perk’ (non pecuniary benefit)
for their self-interest (opportunistic behavior). Unfavorable action by company may
happen because there is an information asymmetry in order to organizational rela-
tionship between principal and agent. Impact from the information asymmetry,
owner is hard to know what agent has done based on standard or not (Eisenhardt,
1985 in Kusumawati, 2005). The exist of inherent agency problems in modern or-
ganization management indicate that firm value will increase if the owner can con-
trol management behavior to do not over consuming firm resources, within unfavor-
able investment or shirking (on-the-job leisure).
K-INT 04
SIMPOSIUM NASIONAL AKUNTANSI 9 PADANG
Padang, 23-26 Agustus 2006 3
2.2 Prior Research Prior research finds that company income increase 3%-6%, when productivity is ob-
served before and after adoption ESOPs. It indicates that annual productivity in-
crease up to 6% higher than companies’ non-ESOP (Estrin et. al., 1987; Kaufman,
1992; Kruse, 1993 in Trébucq, 2004). That research proves positive effect of ESOP
to profitability and employee behavior. But the other research (Conte et. al., 1996)
has analyzed stock return before and after ESOPs adoption, was found that with
ESOP adoption decrease return actually because regard to exist of manager negative
effect higher relatively. That finding is suggested that most of public company adopt
ESOPs for defensive purpose (defend ownership). According to Gordon and
Pounds’ research (1990) say that ESOPs is adopted for nondefensive purpose take
announcement positive effect, and the other ESOPs adoption for defensive purpose
take decrease 3% to 4% point within announcement window period.
Research by Ya-Ting (2003) use data panel prove that ESOPs introduction can
increase productivity 4-5 percent on electronics companies in Taiwan. The improv-
ing productivity can go about 3-4 years. The productivity improved also independent
from production technology. Prior research by Wadhwani and Wall (1996) in United
Kingdom says that relationship between ESOPs and performance is not clear. Rela-
tionship between better performance and ESOPs do not have significant relationship.
Trébucqs’ research (2004) in France also state that relationship between ESOPs per-
formance still give not clear even thought result of cross-sectional regression on his
research, many positive relationship between ESOP by financial performance meas-
urement such as ROE and ROI.
Event study regard to market performance or firm value by Chang (1990)
finds that positive abnormal return when ESOPs announcement, however, ESOPs
announcement to be less unfavorable for company that has centralized ownership or
has higher takeover risk. By the cause, ESOPs is correlated with performance posi-
tively when company under controlled by outside shareholder.
Research in Indonesia about ESOPs is research by Asyik (2005). Asyik (2005)
investigated about effect ESOPs, impact of timing and option fair value, to income
management and following effect to option intrinsic value. She got evidence that a
manager behavior who wish stock price decrease near by option grant date and price
K-INT 04
SIMPOSIUM NASIONAL AKUNTANSI 9 PADANG
Padang, 23-26 Agustus 2006 4
increase after exercise option date or converse stock option to stock by meaning to
get gain if the stock be sold.
2.3 Hypothesis
The exist of ESOPs can be a motivation for employees to improve their performance.
All employees’ performance will be reflected in firm performance. Otherwise,
ESOPs will influence income positively, according to research by Estrin et. al., 1987;
Kaufman, 1992; Kruse,1993 and Trébucq, 2004. That research proves effect of
ESOPs positively to profitability and company employee's behavior. Results of the
researches are supported by Klein (1987) in Kumar (2004) who says that there sig-
nificant relationship between giving incentive and employee’s positive behavior.
Accordingly, hypothesis is:
H1a: Adoption of employee stock option plans positively effects to firm financial
performance.
Company which has institutional investor or/and individual ownership dis-
persed and centralized are different in controlling and strategic decision making
process (Chang, 1990). Company performance will be affected by implementation
of the process. Company with less monitored and uncontrollable publicly will give a
big chance for opportunistic actions which will decrease company profitability. By
the caused, company with institutional ownership more than 50 percent has better
performance than other, so hypothesis is:
H1b: Performance is better, ceteris paribus, after ESOPs adoption than before,
mainly to company which has institutional ownership more than 50 percent.
ESOPs companies has a good value by investor. Investor may assume that
under many reasons, one is shareholders’ interest hypothesis say that defensive
strategic likelihood company target will extract higher premium. Basically, ESOP
can be favorable to recent shareholder is supported by research of Borstadt et. al.
1985. Firm value is hoped increase significantly following ESOPs adoption. Ac-
cordingly, hypothesis can be break down into:
H2a: Firm value increase significantly on announcement date of option grant.
H2b: Firm value increase significantly on announcement date of exercise option to
stock.
K-INT 04
SIMPOSIUM NASIONAL AKUNTANSI 9 PADANG
Padang, 23-26 Agustus 2006 5
A Research by Chang (1990) showed positive abnormal return when ESOPs
announcement, however, ESOPs announcement felt less favorable to company with
shareholder ownership is dispersed. In that case, company with institutional owner-
ship more than 50 percent has better controlling, then it was difficult to manager to
decide thing just under the desired. Management will be careful because institutional
ownership more than 50 percent significant for making decision in General Meeting
of Shareholder, accordingly, I can hypothesize that:
H2c: Firm value significantly increases after ESOPs adoption, mainly to company
with institutional ownership more than 50 percent.
2.4 Variables and Operational Definition
Variable consists of:
Independent variable: ESOPs is measured with looking for ESOPs exist depend on
annual financial statement audited.
Variable dependent: Performance can be measured through profitability. Profitabil-
ity measured concern to return on investment. We can divide return on investment
become two, Return on Asset (ROA) and Return on Equity (ROE). Firm value can
be looked at return of share. Return of share is as higher as firm value increase.
Control variable: Variable which are known independently most affect financial
performance depend on prior research. The variables are economic and financial fac-
tors (Trébucq, 2004). They are leverage, growth, and capital intensity.
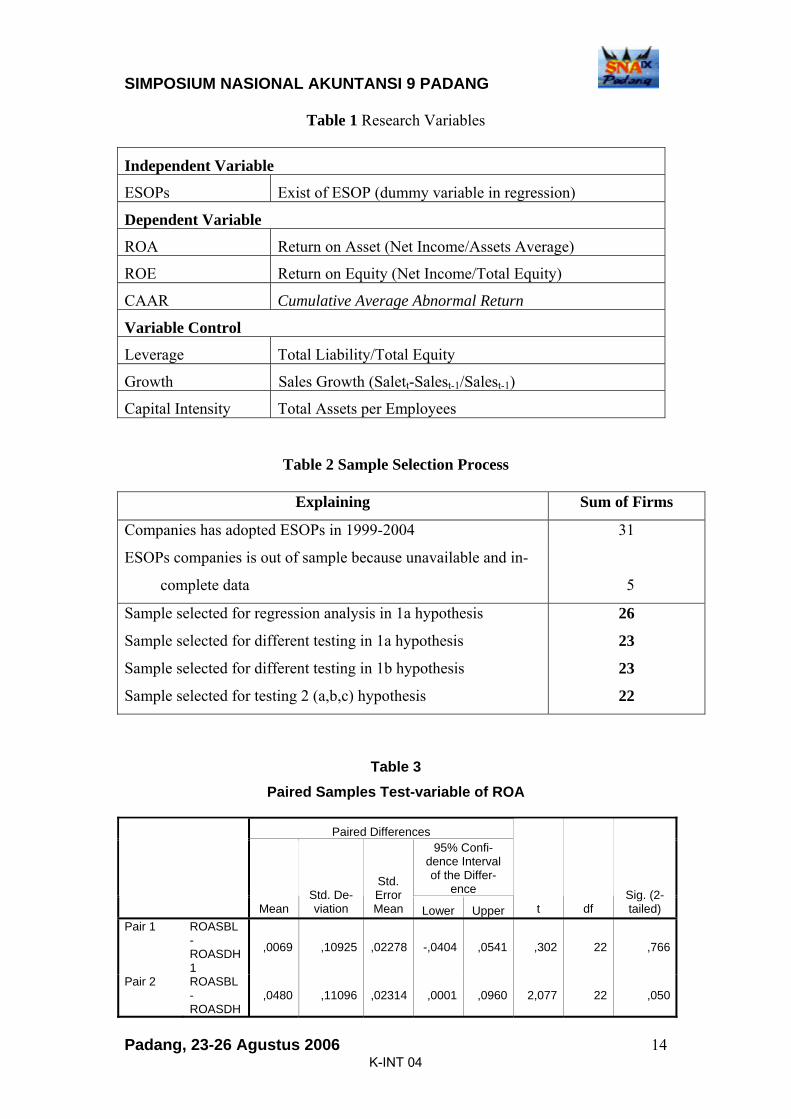
We can see at table 1 as summary of research variables.
Insert Table 1
3. RESEARCH DESIGN
3.1 Research Population and Sample
Population as research sample frame is all publicly company which adopted ESOPs
and reported financial statement periodically and included in annual report. Sample
is taken by using pooling data method which is selected through purposive sampling
method (Cooper & Schindler,2004). Companies’ qualification is:
1. Company issues financial statement audited (annual report).
K-INT 04
SIMPOSIUM NASIONAL AKUNTANSI 9 PADANG
Padang, 23-26 Agustus 2006 6
2. Company issues statement for four years, two years before and two years af-
ter ESOPs adoption.
According to that criteria and Asyik research (2005), qualified sample for testing are
26 (twenty six) companies.
3.2 Research Data Type and Sources Data is secondary in accounting data form from company annual report. Annual fi-
nancial report consist of balance sheet, income statement and notes on financial
statement. Data type for regression testing use pooled data. Source data for each
variable come from Jakarta Stock Exchange through Gadjah Mada Capital Market
Database and Indonesian Capital Market Directory (ICMD).
4. DATA ANALYSIS
4.1 Results
I will explain results of data analysis by using Paired Sample t- test for testing first
(a) hypothesis and Mann-Whitney and Kolmogorov-Smirnov for first (b) hypothesis.
Testing of effect ESOP to performance in first (a) hypothesis uses regression techni-
cal by General Least Squared. Testing of second hypothesis uses statistic testing to
cumulative abnormal return (CAR). Research sample consists of some industry
from1999 to 2004 period, by using pooled data result 148 observed.
Table 2 shows research sample selection procedure. Amount of companies has
adopted employee stock option plans since 1999 to 2004 are 31 companies, however,
I reduce 5 companies’ data because data are unavailable and incomplete, finally, re-
search sample for regression analysis are 26 companies. Sample list of research
available in appendix-1.
Insert Table 2
4.2 Hypothesis Test Results
Result of testing hypotesis1a at table 3 by using paired sample t-test , the finding
shows that ESOPs has no influence to ROA; it proves when ESOPs adopted one
year before and two years after that. If we say that ROA after ESOPs adoption is
better than before, result of test at left side of asymptotic curve must be negative (-)
signed significant, but it is positive signed according to t test in second row table.
K-INT 04
SIMPOSIUM NASIONAL AKUNTANSI 9 PADANG
Padang, 23-26 Agustus 2006 7
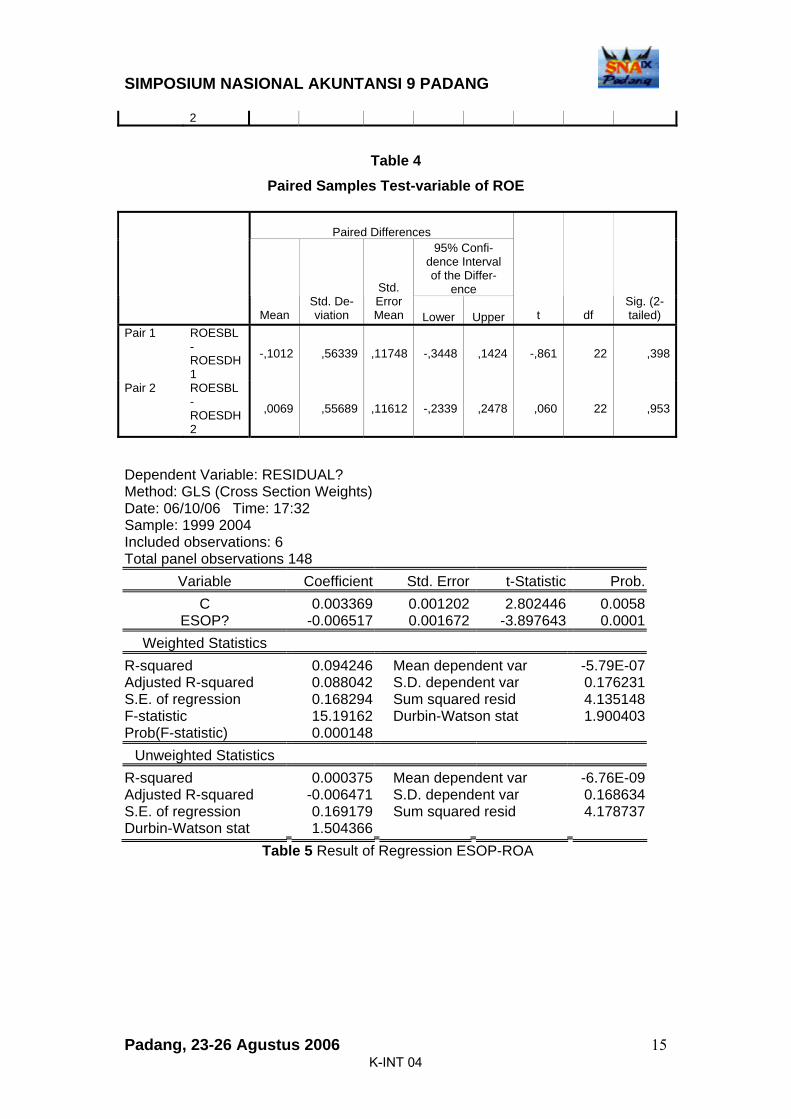
Furthermore, test of variable ROE at table 4 is also looked not significant different
statistically between ROE before and after ESOPs adoption, neither one year nor
two years.
Insert Table 3
Insert Table 4
According to test result of statistic to variable ROA and ROE, we get evidence
that performance from usefulness of asset not better between one year before and
one year or two years after ESOPs adoption, neither to usefulness of company equity.
By the case, we can conclude that 1a hypothesis which implicates performance is
better after ESOPs adoption, can not be supported or failed to reject Ho.
Insert Table 5
Then, I test effect ESOPs to financial performance by General Least Square
(GLS) regression. Using GLS regression for solving autocorrelation and heterosce-
dastisity problem (Gujarati, 2003: 400). Appendix-2 and 3 shows coefficient of re-
gression each independent variable leverage (LEV) and sales growth (SALESGR)
unless capital intensity (APE) significantly effect to ROA. According to result of
test from residual value in table 5, variable ESOPs has negative significant coeffi-
cient at level α=0.01. Result must be positive significant for supporting 1a. Such is
the case, test of ESOPs variable with residual (dependent variable ROE) at appen-
dix-4 figure out negative. Thus, 1a hypothesis says that effect ESOPs adoption posi-
tive to performance, can not be proved statistically.
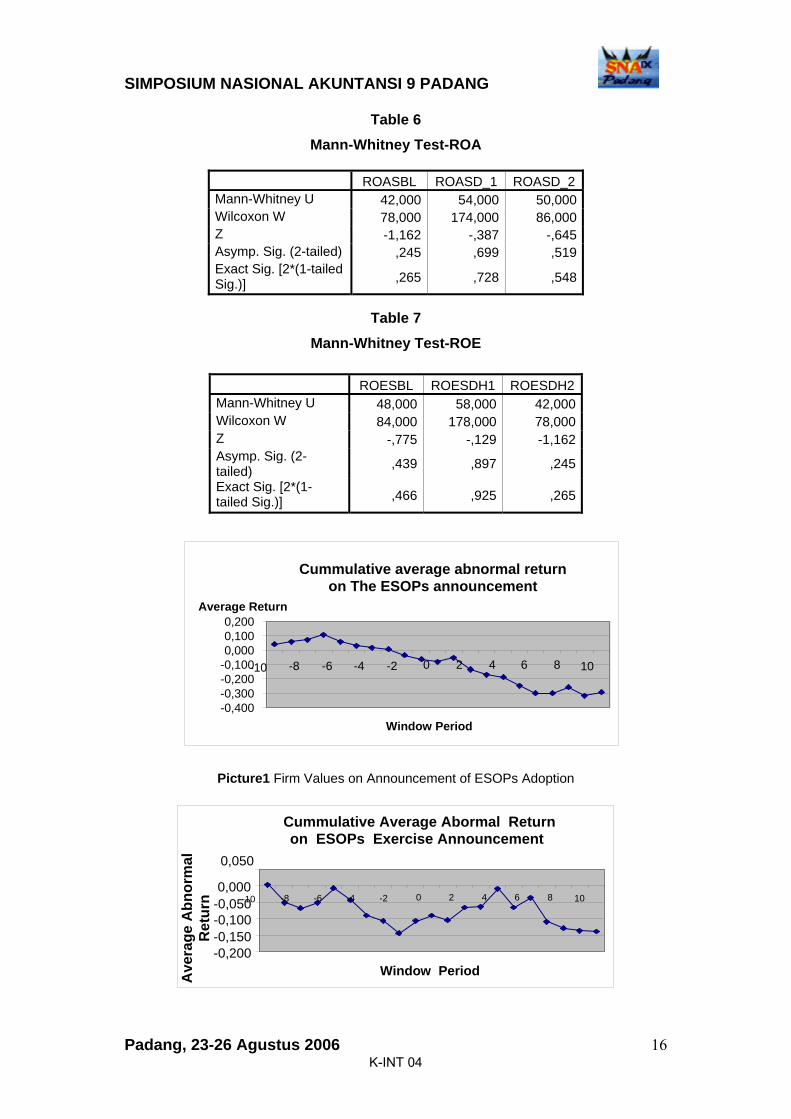
Test result of 1b hypothesis proves no difference statistically significant on
ROA and ROE between company with institutional ownership more than 50% than
others, neither before nor after ESOPs adoption. Test of variable ROA by non para-
metric statistic Mann-Whitney Test at table 6 shows exact significant one year be-
fore, one year after and two years after ESOPs adoption each respectively 0.265,
0.728 and 0.548. Otherwise, for testing with Kolmogorov-Smirnov shows asymp-
totic significant two tailed 0.303, 0.766 and 0.825 (see appendix-5).
Insert Table 6
Test result of ROE variable by Mann-Whitney Test at table 7 shows exact sig-
nificant before adoption 0.466, one year after adoption 0,925 and two years after
K-INT 04
SIMPOSIUM NASIONAL AKUNTANSI 9 PADANG
Padang, 23-26 Agustus 2006 8
adoption 0,265, and then we reconfirm by Kolmogorov-Smirnov test, figure out as-
ymptotic significant each 0,325, 0,967 and 0,349 (see appendix-6).
Insert Table 7
Thus, we can conclude that 1b hypothesis which states company performance, ce-
teris paribus, after ESOPs adoption mainly on companies with institutional owner-
ship more than 50 percent, can not be supported or failed to reject Ho.
4.3 Second Hypothesis Test Results
Test results for second hypothesis uses t-test around on ESOPs adoption announce-
ment date and around on exercise date. T-tes is meant to see significant abnormal
return at one event. Significant is meant the abnormal return significant statistically
not equal zero or other word, positive for good news and negative for bad news
(Jogiyanto, 2003:453). T-test usually is done for portfolio return (return average for
all k securities).
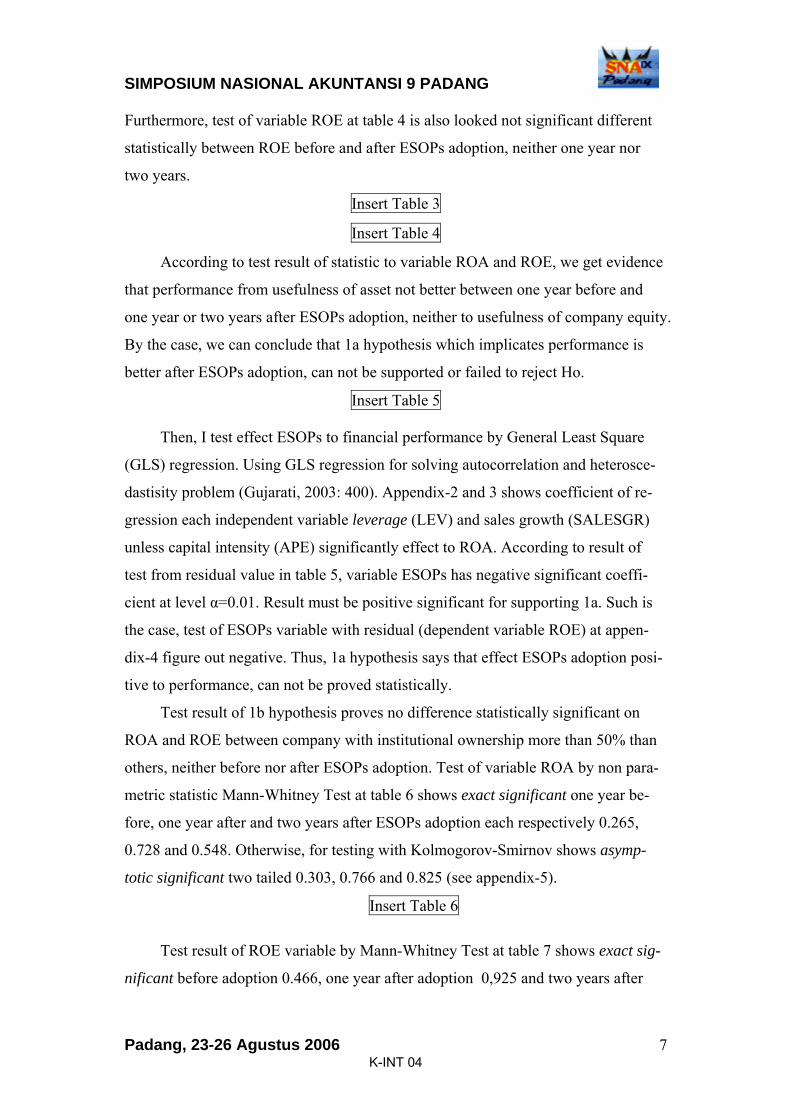
Average abnormal return is looked significant since t-10. It indicates that in-
formation about ESOPs has known by market 10 days announcement of ESOPs
adoption. Average abnormal return was corrected until +10. Change of average ab-
normal return will be accumulated as long as event period, thus, firm value will be
showed by cumulative average abnormal return (CAAR) on picture 1.
Insert Picture 1
Picture1 Firm Values on Announcement of ESOPs Adoption
Insert Table 8
CAAR on picture 1 in the window period, indicates that announcement of
ESOPs adoption is negative respond. In that case, I conclude that ESOPs announce-
ment does not have positive value to firm depend on 2a hypothesis or we can say
failed to reject Ho.
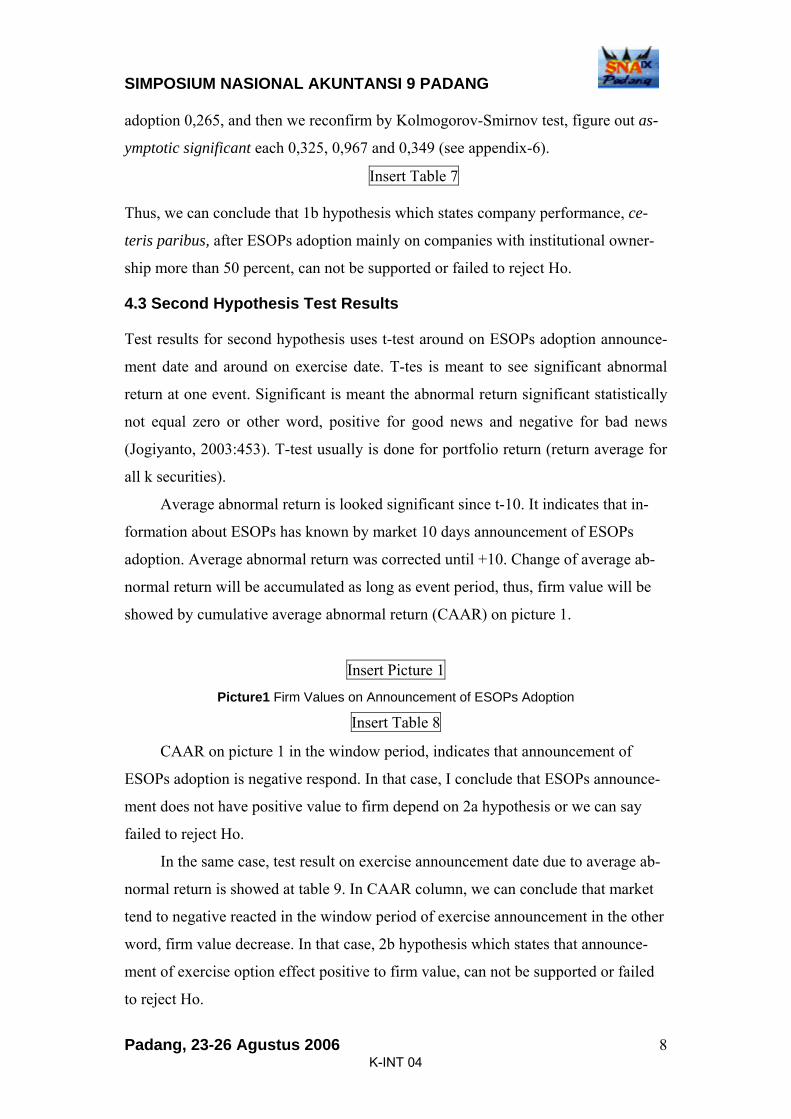
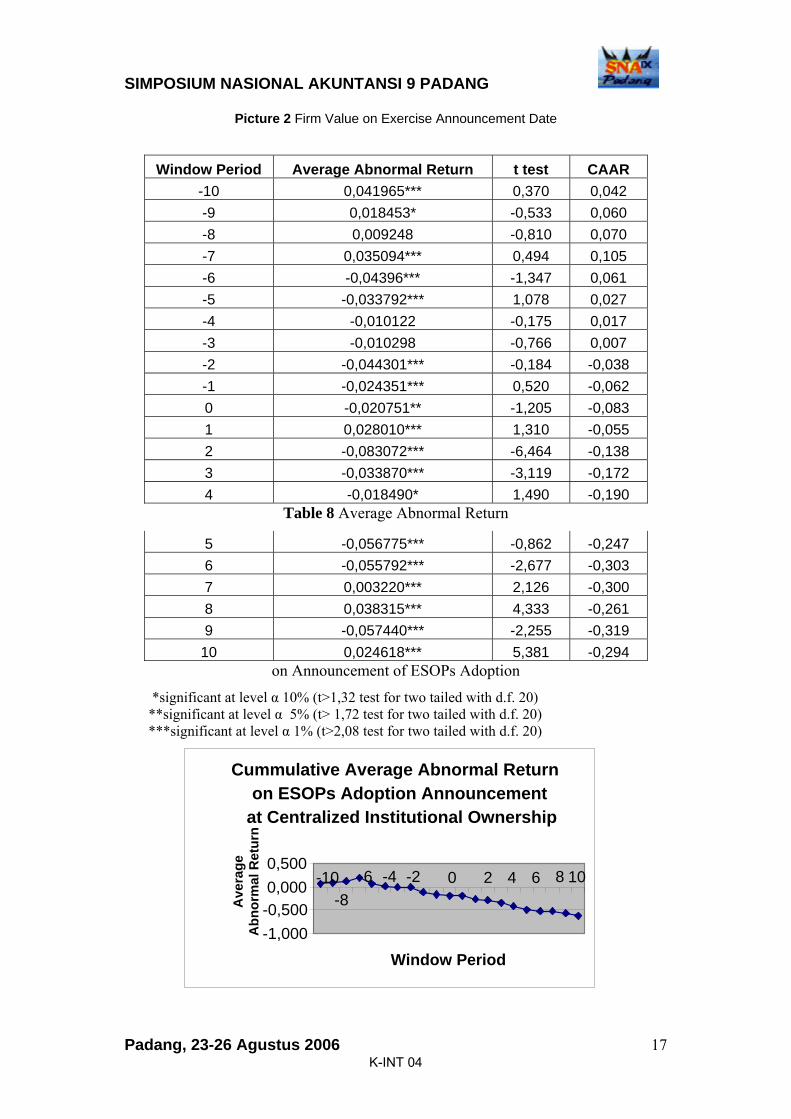
In the same case, test result on exercise announcement date due to average ab-
normal return is showed at table 9. In CAAR column, we can conclude that market
tend to negative reacted in the window period of exercise announcement in the other
word, firm value decrease. In that case, 2b hypothesis which states that announce-
ment of exercise option effect positive to firm value, can not be supported or failed
to reject Ho.
K-INT 04
SIMPOSIUM NASIONAL AKUNTANSI 9 PADANG
Padang, 23-26 Agustus 2006 9
Insert Table 9
Insert Picture 2
Picture 2 Firm Value on Exercise Announcement Date
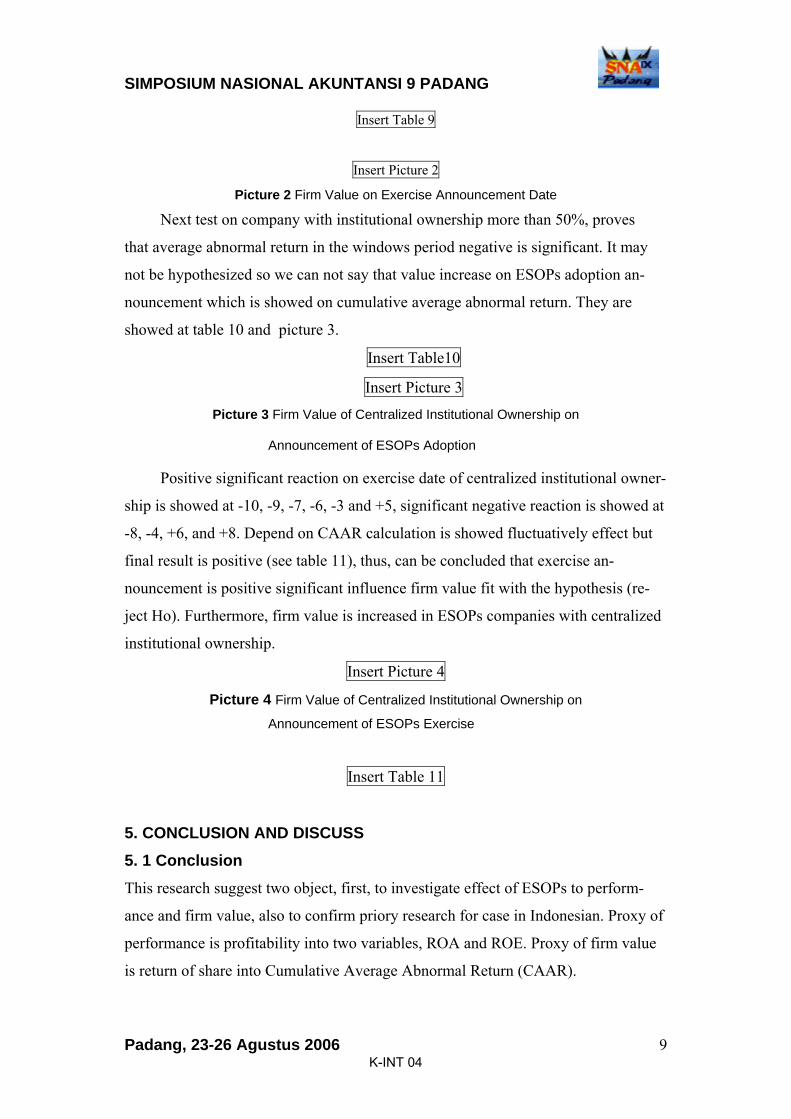
Next test on company with institutional ownership more than 50%, proves
that average abnormal return in the windows period negative is significant. It may
not be hypothesized so we can not say that value increase on ESOPs adoption an-
nouncement which is showed on cumulative average abnormal return. They are
showed at table 10 and picture 3.
Insert Table10
Insert Picture 3
Picture 3 Firm Value of Centralized Institutional Ownership on
Announcement of ESOPs Adoption
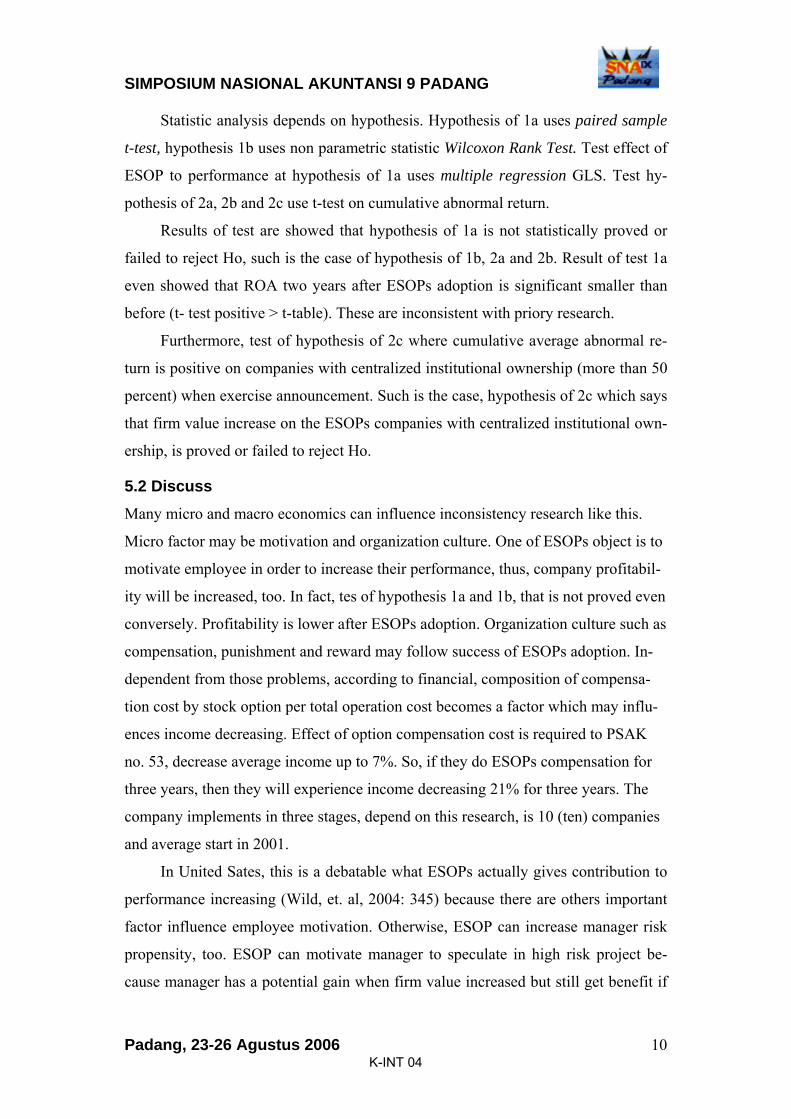
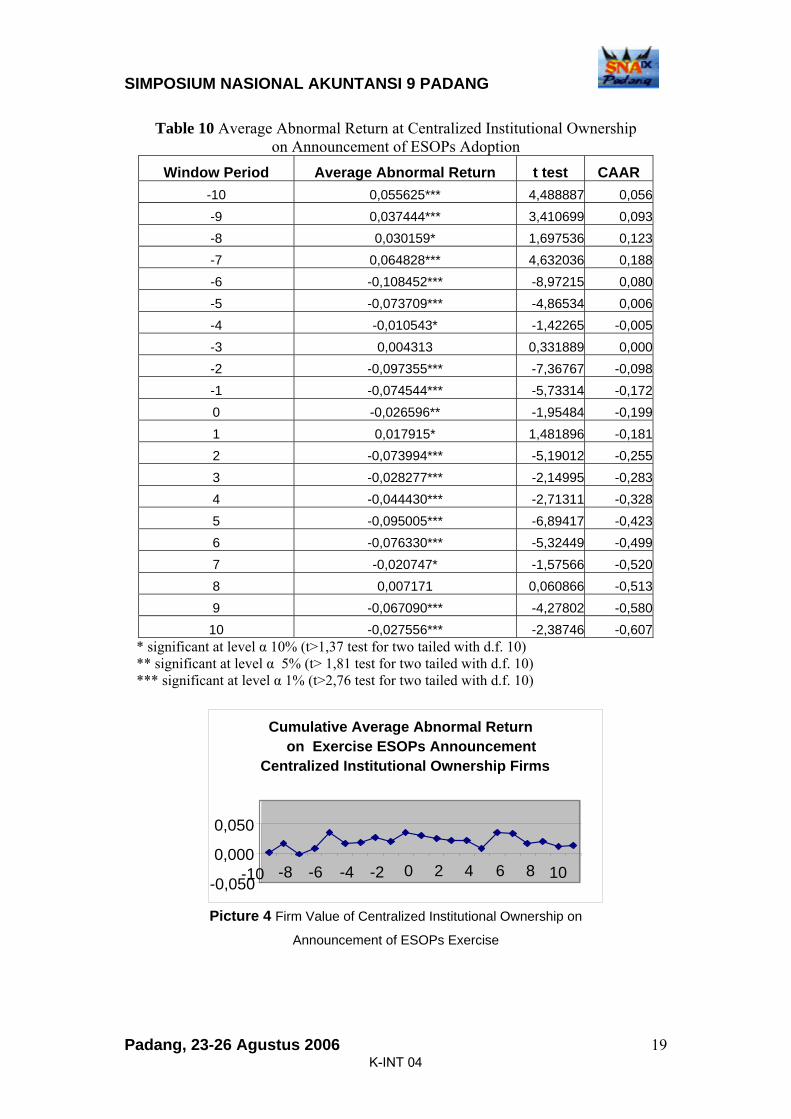
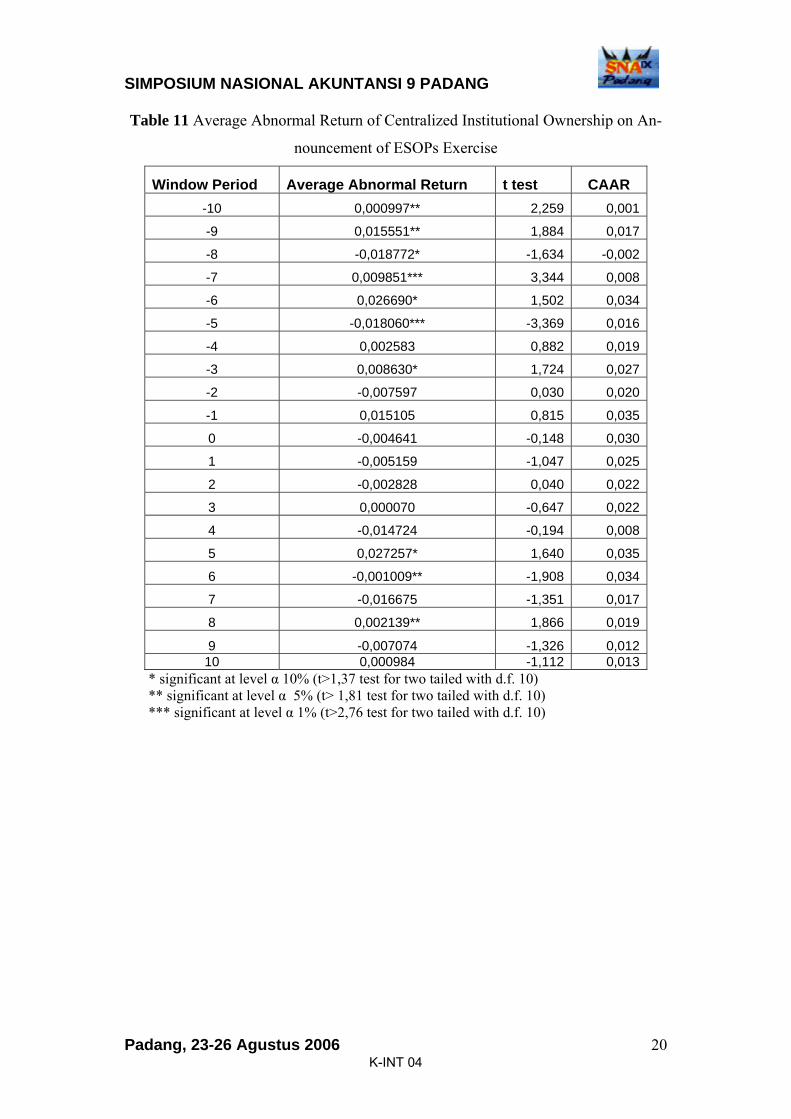
Positive significant reaction on exercise date of centralized institutional owner-
ship is showed at -10, -9, -7, -6, -3 and +5, significant negative reaction is showed at
-8, -4, +6, and +8. Depend on CAAR calculation is showed fluctuatively effect but
final result is positive (see table 11), thus, can be concluded that exercise an-
nouncement is positive significant influence firm value fit with the hypothesis (re-
ject Ho). Furthermore, firm value is increased in ESOPs companies with centralized
institutional ownership.
Insert Picture 4
Picture 4 Firm Value of Centralized Institutional Ownership on
Announcement of ESOPs Exercise
Insert Table 11
5. CONCLUSION AND DISCUSS
5. 1 Conclusion This research suggest two object, first, to investigate effect of ESOPs to perform-
ance and firm value, also to confirm priory research for case in Indonesian. Proxy of
performance is profitability into two variables, ROA and ROE. Proxy of firm value
is return of share into Cumulative Average Abnormal Return (CAAR).
K-INT 04
SIMPOSIUM NASIONAL AKUNTANSI 9 PADANG
Padang, 23-26 Agustus 2006 10
Statistic analysis depends on hypothesis. Hypothesis of 1a uses paired sample
t-test, hypothesis 1b uses non parametric statistic Wilcoxon Rank Test. Test effect of
ESOP to performance at hypothesis of 1a uses multiple regression GLS. Test hy-
pothesis of 2a, 2b and 2c use t-test on cumulative abnormal return.
Results of test are showed that hypothesis of 1a is not statistically proved or
failed to reject Ho, such is the case of hypothesis of 1b, 2a and 2b. Result of test 1a
even showed that ROA two years after ESOPs adoption is significant smaller than
before (t- test positive > t-table). These are inconsistent with priory research.
Furthermore, test of hypothesis of 2c where cumulative average abnormal re-
turn is positive on companies with centralized institutional ownership (more than 50
percent) when exercise announcement. Such is the case, hypothesis of 2c which says
that firm value increase on the ESOPs companies with centralized institutional own-
ership, is proved or failed to reject Ho.
5.2 Discuss Many micro and macro economics can influence inconsistency research like this.
Micro factor may be motivation and organization culture. One of ESOPs object is to
motivate employee in order to increase their performance, thus, company profitabil-
ity will be increased, too. In fact, tes of hypothesis 1a and 1b, that is not proved even
conversely. Profitability is lower after ESOPs adoption. Organization culture such as
compensation, punishment and reward may follow success of ESOPs adoption. In-
dependent from those problems, according to financial, composition of compensa-
tion cost by stock option per total operation cost becomes a factor which may influ-
ences income decreasing. Effect of option compensation cost is required to PSAK
no. 53, decrease average income up to 7%. So, if they do ESOPs compensation for
three years, then they will experience income decreasing 21% for three years. The
company implements in three stages, depend on this research, is 10 (ten) companies
and average start in 2001.
In United Sates, this is a debatable what ESOPs actually gives contribution to
performance increasing (Wild, et. al, 2004: 345) because there are others important
factor influence employee motivation. Otherwise, ESOP can increase manager risk
propensity, too. ESOP can motivate manager to speculate in high risk project be-
cause manager has a potential gain when firm value increased but still get benefit if
K-INT 04
SIMPOSIUM NASIONAL AKUNTANSI 9 PADANG
Padang, 23-26 Agustus 2006 11
firm value decreased. It can lose recent shareholder because they do not have down-
side protection such as stock option.
The other factor, ESOPs adoption can not be affected positive to firm value if
there a suggest ‘cost’ on stock option plans. The cost is potential dilution effect from
option when option is exercised. ESOPs transfer shareholders’ wealth to employee
decreasing exists of stake (Wild, et. al., 2004:345). This is happen because interest
cost (capital) and time value of money can cause option intrinsic value at exercise
price different with price at grant date.
ESOPs announcement does not affect positive significant either when the
ESOPs adoption is suggested by investor for defensive aim such as be explained in
Gordon and Pound (1990). Gordon and Pound found that ESOPs adoption nonde-
fensive aim got announcement positive effected, then, for defensive got decreasing
up to 3-4% point on shareholders’ wealth in announcement window. Conte et. al.
(1996) found most of publicly companies adopt ESOPs for defensive.
K-INT 04
SIMPOSIUM NASIONAL AKUNTANSI 9 PADANG
Padang, 23-26 Agustus 2006 12
References Asyik, Nur Fadjrih. 2005. Dampak Penyaatan dan Nilai Wajar Opsi Pada Pengaruh
Magnituda Kompensasi Program Opsi Saham Karyawan (POSK) terhadap Pengelolaan Laba serta Pengaruh Ikutannya pada Nilai Intrinsik Opsi. Pro-mosi Doktoral. Pascasarjana UGM.
Bapepam, Tim Studi Penerapan ESOP. Studi Penerapan ESOP Emiten atau Perusa-haan Publik di Pasar Modal Indonesia. 2002. Bapepam. www.jsx.co.id.
Bhagat, S, et. al. Incentive Effects of Stock Purchase Plans, Journal of Financial Economics, Vol. 14 No. 2, pp 195-215. 1985.
Borstadt, L, T Zweirlein, and J Brickley. Defending Against Hostile Takeover: Im-pact on shareholder Wealth. Managerial Finance, Vol. 17 No. 1, pp. 25-33. 1985.
Chang S. Employee stock ownership plan and shareholder Wealth: An Empirical Investigation, Financial Manajement, Vol. 19, pp. 48-58. 1990.
Conte, Michael A. Financial Return of Public ESOP Companies: Investor Effects vs. Manager Effects, Financial Analysts Journal, July/Augus. pp. 51-61. 1996.
Defusco, Johnson and Zorn. The of Excecutive Stock Option Plan on Stockholders and Bondholders, Journal of Finance, Vol. 45 No. 2. 1990.
Gay, L.R. and P.L. Diehl. 1992. Research Methods for Business and Management. New York: Macmillan Publishing Company.
Gaver, Jenifer, and Kenneth M. Gaver. Additional Evidence on The Association Be-tween The Investment Opportunity Set and Corporate Financing, Dividend, and Compensation Policies, Journal of Accounting and Economics, 125-160. 1993.
Gordon, L.A. and J. Pound. ESOPs and Corporate Control. Journal of Financial Economics. Vol. 27 No. 2. 525-55. 1990.
Gujarati, Damodar N. 2003. Basic Econometrics. International Edition. New York: McGraw-Hill.
Indriantoro, Nur dan B. Supomo. 2002. Metodologi Penelitian Bisnis untuk Akun-tansi dan Manajemen. Edisi Pertama. Yogyakarta: BPFE.
Jogiyanto. 2003. Teori Portofolio dan Analisis Investasi. Edisi 3. Yogyakarta: BPFE.
Kusuma, Indra Wijaya. Comparing The Earnings Response Coefficients of U.S. Multinational and Domestics Firms: The Use of Geographic Segmen Report-ing Information, Jurnal Riset Akuntansi Indonesia, Vol. 6, No. 3, September. 2003.
K-INT 04
SIMPOSIUM NASIONAL AKUNTANSI 9 PADANG
Padang, 23-26 Agustus 2006 13
Kusumawati, Dwi Novi & B. Riyanto, Corporate Governance & Kinerja: Analisis Pe-ngaruh Compliance Reporting dan Struktur Dewan terhadap Kinerja. Sim-posium Nasional Akuntansi VIII, Solo, 2005.
PPA UGM. 2001.ISMD 2.0 Indonesian Securities Market Database. Yogyakarta.
Shulman, Charles C. Employee Stock Ownership Plans: Part I. Journal of Pension, Planning & Compliance, 63-118. Ebscho Publisher. 2002.
Smith, C.W. & J.L. Zimmerman. Valuing Employee Stock Option Plans Using Op-tion Pricing Models. Journal of Accounting Research. Autumn: 357-364. 1976.
Trébucq, Stephane. The Effects of ESOPs on performance and risk: evidence from France, Corporate Ownership & Control Vol. 1, Summer, pp. 81-93. 2004.
Verbeek, Marno. 2000.A Guide to Modern Economics. Chichester: John Wiley & Sons.
Wadhwani, Sushil and Wall, Martin. The effects of employee ownership on em-ployement, wages, stock returns and productivity: evidence from UK micro-data. Economic Journal 100, pp. 1-17. 1996.
Watts & Zimmerman. 1986. Positive Accounting Theory. New Jersey: Prentice/Hall International
Ya-Ting Lee. The Productivity effects of Employee Stock-Ownership Plans: Evi-dence from panel data of Taiwan Electronic Companies. International Journal of Management. Vol. 20. No. 4. 2003.
Zmijewski, M., & R. Hagerman. An Income Strategy Approach to the Positive The-ory of Accounting Standard Setting/Choice, Journal of Accounting and Eco-nomics 3 (August), pp. 129-149. 1981.
www.jsx.co.id.
K-INT 04
SIMPOSIUM NASIONAL AKUNTANSI 9 PADANG
Padang, 23-26 Agustus 2006 14
Table 1 Research Variables
Independent Variable
ESOPs Exist of ESOP (dummy variable in regression)
Dependent Variable
ROA Return on Asset (Net Income/Assets Average)
ROE Return on Equity (Net Income/Total Equity)
CAAR Cumulative Average Abnormal Return
Variable Control
Leverage Total Liability/Total Equity
Growth Sales Growth (Salett-Salest-1/Salest-1)
Capital Intensity Total Assets per Employees
Table 2 Sample Selection Process
Explaining Sum of Firms
Companies has adopted ESOPs in 1999-2004 31
ESOPs companies is out of sample because unavailable and in-
complete data
5
Sample selected for regression analysis in 1a hypothesis
Sample selected for different testing in 1a hypothesis
Sample selected for different testing in 1b hypothesis
Sample selected for testing 2 (a,b,c) hypothesis
26
23
23
22
Table 3 Paired Samples Test-variable of ROA
Paired Differences 95% Confi-
dence Interval of the Differ-
ence Mean
Std. De-viation
Std. Error Mean Lower Upper t df
Sig. (2-tailed)
Pair 1 ROASBL - ROASDH1
,0069 ,10925 ,02278 -,0404 ,0541 ,302 22 ,766
Pair 2 ROASBL - ROASDH
,0480 ,11096 ,02314 ,0001 ,0960 2,077 22 ,050
K-INT 04
SIMPOSIUM NASIONAL AKUNTANSI 9 PADANG
Padang, 23-26 Agustus 2006 15
2
Table 4 Paired Samples Test-variable of ROE
Paired Differences 95% Confi-
dence Interval of the Differ-
ence
Mean Std. De-viation
Std. Error Mean Lower Upper t df
Sig. (2-tailed)
Pair 1 ROESBL - ROESDH1
-,1012 ,56339 ,11748 -,3448 ,1424 -,861 22 ,398
Pair 2 ROESBL - ROESDH2
,0069 ,55689 ,11612 -,2339 ,2478 ,060 22 ,953
Table 5 Result of Regression ESOP-ROA
Dependent Variable: RESIDUAL? Method: GLS (Cross Section Weights) Date: 06/10/06 Time: 17:32 Sample: 1999 2004 Included observations: 6 Total panel observations 148
Variable Coefficient Std. Error t-Statistic Prob. C 0.003369 0.001202 2.802446 0.0058
ESOP? -0.006517 0.001672 -3.897643 0.0001 Weighted Statistics
R-squared 0.094246 Mean dependent var -5.79E-07 Adjusted R-squared 0.088042 S.D. dependent var 0.176231 S.E. of regression 0.168294 Sum squared resid 4.135148 F-statistic 15.19162 Durbin-Watson stat 1.900403 Prob(F-statistic) 0.000148
Unweighted Statistics R-squared 0.000375 Mean dependent var -6.76E-09 Adjusted R-squared -0.006471 S.D. dependent var 0.168634 S.E. of regression 0.169179 Sum squared resid 4.178737 Durbin-Watson stat 1.504366
K-INT 04
SIMPOSIUM NASIONAL AKUNTANSI 9 PADANG
Padang, 23-26 Agustus 2006 16
Table 6 Mann-Whitney Test-ROA
ROASBL ROASD_1 ROASD_2 Mann-Whitney U 42,000 54,000 50,000 Wilcoxon W 78,000 174,000 86,000 Z -1,162 -,387 -,645 Asymp. Sig. (2-tailed) ,245 ,699 ,519 Exact Sig. [2*(1-tailed Sig.)] ,265 ,728 ,548
Table 7
Mann-Whitney Test-ROE
ROESBL ROESDH1 ROESDH2 Mann-Whitney U 48,000 58,000 42,000 Wilcoxon W 84,000 178,000 78,000 Z -,775 -,129 -1,162 Asymp. Sig. (2-tailed) ,439 ,897 ,245
Exact Sig. [2*(1-tailed Sig.)] ,466 ,925 ,265
Cummulative average abnormal return on The ESOPs announcement
-0,400 -0,300 -0,200 -0,100 0,000 0,100 0,200
-10 -8 -6 -4 -2 0 2 4 6 8 10
Window Period
Average Return
Picture1 Firm Values on Announcement of ESOPs Adoption
Cummulative Average Abormal Returnon ESOPs Exercise Announcement
-0,200-0,150-0,100-0,0500,000
0,050
-10 -8 -6 -4 -2 0 2 4 6 8 10
Window PeriodAve
rage
Abn
orm
alR
etur
n
K-INT 04
SIMPOSIUM NASIONAL AKUNTANSI 9 PADANG
Padang, 23-26 Agustus 2006 17
Picture 2 Firm Value on Exercise Announcement Date
Window Period Average Abnormal Return t test CAAR -10 0,041965*** 0,370 0,042 -9 0,018453* -0,533 0,060 -8 0,009248 -0,810 0,070 -7 0,035094*** 0,494 0,105 -6 -0,04396*** -1,347 0,061 -5 -0,033792*** 1,078 0,027 -4 -0,010122 -0,175 0,017 -3 -0,010298 -0,766 0,007 -2 -0,044301*** -0,184 -0,038 -1 -0,024351*** 0,520 -0,062 0 -0,020751** -1,205 -0,083 1 0,028010*** 1,310 -0,055 2 -0,083072*** -6,464 -0,138 3 -0,033870*** -3,119 -0,172
Cummulative Average Abnormal Returnon ESOPs Adoption Announcement
at Centralized Institutional Ownership
-1,000 -0,500 0,000 0,500
-10-8
-6 -4 -2 0 2 4 6 8 10
Window Period
Ave
rage
A
bnor
mal
Ret
urn
Table 8 Average Abnormal Return 4 -0,018490* 1,490 -0,190
5 -0,056775*** -0,862 -0,247 6 -0,055792*** -2,677 -0,303 7 0,003220*** 2,126 -0,300 8 0,038315*** 4,333 -0,261 9 -0,057440*** -2,255 -0,319
on Announcement of ESOPs Adoption 10 0,024618*** 5,381 -0,294
*significant at level α 10% (t>1,32 test for two tailed with d.f. 20) **significant at level α 5% (t> 1,72 test for two tailed with d.f. 20) ***significant at level α 1% (t>2,08 test for two tailed with d.f. 20)
K-INT 04

SIMPOSIUM NASIONAL AKUNTANSI 9 PADANG
Padang, 23-26 Agustus 2006 18
Picture 3 Firm Value of Centralized Institutional Ownership on
Announcement of ESOPs Adoption
K-INT 04
SIMPOSIUM NASIONAL AKUNTANSI 9 PADANG
Padang, 23-26 Agustus 2006 19
Table 10 Average Abnormal Return at Centralized Institutional Ownership on Announcement of ESOPs Adoption
Window Period Average Abnormal Return t test CAAR -10 0,055625*** 4,488887 0,056-9 0,037444*** 3,410699 0,093-8 0,030159* 1,697536 0,123-7 0,064828*** 4,632036 0,188-6 -0,108452*** -8,97215 0,080-5 -0,073709*** -4,86534 0,006-4 -0,010543* -1,42265 -0,005-3 0,004313 0,331889 0,000-2 -0,097355*** -7,36767 -0,098-1 -0,074544*** -5,73314 -0,1720 -0,026596** -1,95484 -0,1991 0,017915* 1,481896 -0,1812 -0,073994*** -5,19012 -0,2553 -0,028277*** -2,14995 -0,2834 -0,044430*** -2,71311 -0,3285 -0,095005*** -6,89417 -0,4236 -0,076330*** -5,32449 -0,4997 -0,020747* -1,57566 -0,5208 0,007171 0,060866 -0,5139 -0,067090*** -4,27802 -0,58010 -0,027556*** -2,38746 -0,607
* significant at level α 10% (t>1,37 test for two tailed with d.f. 10) ** significant at level α 5% (t> 1,81 test for two tailed with d.f. 10) *** significant at level α 1% (t>2,76 test for two tailed with d.f. 10)
Cumulative Average Abnormal Return on Exercise ESOPs Announcement
Centralized Institutional Ownership Firms
-0,050
0,000
0,050
-10 -8 -6 -4 -2 0 2 4 6 8 10
Picture 4 Firm Value of Centralized Institutional Ownership on
Announcement of ESOPs Exercise
K-INT 04
SIMPOSIUM NASIONAL AKUNTANSI 9 PADANG
Padang, 23-26 Agustus 2006 20
Table 11 Average Abnormal Return of Centralized Institutional Ownership on An-
nouncement of ESOPs Exercise
Window Period Average Abnormal Return t test CAAR -10 0,000997** 2,259 0,001
-9 0,015551** 1,884 0,017
-8 -0,018772* -1,634 -0,002
-7 0,009851*** 3,344 0,008
-6 0,026690* 1,502 0,034
-5 -0,018060*** -3,369 0,016
-4 0,002583 0,882 0,019
-3 0,008630* 1,724 0,027
-2 -0,007597 0,030 0,020
-1 0,015105 0,815 0,035
0 -0,004641 -0,148 0,030
1 -0,005159 -1,047 0,025
2 -0,002828 0,040 0,022
3 0,000070 -0,647 0,022
4 -0,014724 -0,194 0,008
5 0,027257* 1,640 0,035
6 -0,001009** -1,908 0,034
7 -0,016675 -1,351 0,017
8 0,002139** 1,866 0,019
9 -0,007074 -1,326 0,012 10 0,000984 -1,112 0,013
* significant at level α 10% (t>1,37 test for two tailed with d.f. 10) ** significant at level α 5% (t> 1,81 test for two tailed with d.f. 10) *** significant at level α 1% (t>2,76 test for two tailed with d.f. 10)
K-INT 04