Embed Size (px)
Citation preview
HAL Id: hal-00311181https://hal.archives-ouvertes.fr/hal-00311181
Submitted on 21 Feb 2017
HAL is a multi-disciplinary open accessarchive for the deposit and dissemination of sci-entific research documents, whether they are pub-lished or not. The documents may come fromteaching and research institutions in France orabroad, or from public or private research centers.
L’archive ouverte pluridisciplinaire HAL, estdestinée au dépôt et à la diffusion de documentsscientifiques de niveau recherche, publiés ou non,émanant des établissements d’enseignement et derecherche français ou étrangers, des laboratoirespublics ou privés.
Signalling Pathways Involved in Adult Heart FormationRevealed by Gene Expression Profiling in DrosophilaBruno Zeitouni, Sébastien Sénatore, Dany Severac, Cindy Aknin, Michel
Sémériva, Laurent Perrin
To cite this version:Bruno Zeitouni, Sébastien Sénatore, Dany Severac, Cindy Aknin, Michel Sémériva, et al.. SignallingPathways Involved in Adult Heart Formation Revealed by Gene Expression Profiling in Drosophila.PLoS Genetics, Public Library of Science, 2007, 3 (10), pp.e174. �10.1371/journal.pgen.0030174�.�hal-00311181�
Signalling Pathways Involvedin Adult Heart Formation Revealedby Gene Expression Profiling in DrosophilaBruno Zeitouni
1,2, Sebastien Senatore
1,2, Dany Severac
3,4,5,6, Cindy Aknin
3,4,5,6, Michel Semeriva
1,2, Laurent Perrin
1,2*
1 Institut de Biologie du Developpement de Marseille-Luminy, Universite de la Mediterranee, Marseille, France, 2 CNRS, UMR 6216, Marseille, France, 3 Institut de Genomique
Fonctionnelle, Montpellier, France, 4 CNRS, UMR 5203, Montpellier, France, 5 Universites Montpellier 1 et 2, Montpellier, France, 6 INSERM, U661, Montpellier, France
Drosophila provides a powerful system for defining the complex genetic programs that drive organogenesis. Undercontrol of the steroid hormone ecdysone, the adult heart in Drosophila forms during metamorphosis by a remodellingof the larval cardiac organ. Here, we evaluated the extent to which transcriptional signatures revealed by genomicapproaches can provide new insights into the molecular pathways that underlie heart organogenesis. Whole-genomeexpression profiling at eight successive time-points covering adult heart formation revealed a highly dynamictemporal map of gene expression through 13 transcript clusters with distinct expression kinetics. A functional atlas ofthe transcriptome profile strikingly points to the genomic transcriptional response of the ecdysone cascade, and asharp regulation of key components belonging to a few evolutionarily conserved signalling pathways. A reversegenetic analysis provided evidence that these specific signalling pathways are involved in discrete steps of adult heartformation. In particular, the Wnt signalling pathway is shown to participate in inflow tract and cardiomyocytedifferentiation, while activation of the PDGF-VEGF pathway is required for cardiac valve formation. Thus, a detailedtemporal map of gene expression can reveal signalling pathways responsible for specific developmental programs andprovides here substantial grasp into heart formation.
Citation: Zeitouni B, Senatore S, Severac D, Aknin C, Semeriva M, et al. (2007) Signalling pathways involved in adult heart formation revealed by gene expression profiling inDrosophila. PLoS Genet 3(10): e174. doi:10.1371/journal.pgen.0030174
Introduction
A traditional way of approaching organogenesis consists offocusing the analysis on discrete genes or simple genenetworks, to evaluate their function in the development ofparticular cells within the organ. One would like, however, todraw a more global view of organogenesis in which thetemporal and spatial cues are integrated in a unique picture.
With the era of genomics, high-throughput expressionanalysis approaches supply complementary information tothe single-gene approaches currently under way. Microarraysare currently the strongest technology platform for large-scale analysis of gene expression profiles. They provide anopportunity to simultaneously monitor the expression ofthousands of genes in a single assay, thus providing genome-wide snapshots of transcriptional networks that are active in aparticular tissue in a particular developmental context [1–3].
Here, we evaluated the relevance and the efficiency of aglobal genomic approach in one example of organogenesis:the formation of the adult heart in Drosophila melanogaster. Thefruit fly is the simplest multicellular model organism with aheart, which is constituted of a linear tube that is certainlyless complex than its vertebrate counterpart, but which formsand functions on a similar molecular and functional basis byacting as a myogenic muscular pump with automaticcontractility. Formation of primitive cardiac tubes of fruitflies and vertebrates are well conserved, as are the molecularpathways responsible for their morphogenesis [4].
Choosing this system was dictated by its relative simplicity(the cardiac tube is formed by only 104 myocytes, which canbe readily identified in vivo) and by the extensive knowledge
that we have acquired of its developmental control [5]. Theadult heart forms during metamorphosis by a remodelling ofthe larval cardiomyocytes without cell proliferation or cellmigration. We have a detailed knowledge of the profoundmorphological and functional transformations that accom-pany the formation of the adult organ [5,6] (Figure 1A). Theseinclude, in particular, the destruction of a portion of thelarval organ by programmed cell death (PCD), an importantgrowth of the remaining myocytes, the formation of newinflow tracts and cardiac valves, and the acquisition of newphysiological properties by most of the myocytes. In addition,the remodelling timetable is perfectly well defined [5,7].Heart remodelling starts 30 h after puparation in response tothe third rise of the steroid hormone ecdysone. Ecdysone actsas a temporal necessary cue to switch on heart remodelling,and blocking the Drosophila Ecdysone receptor (EcR) prevents allknown cellular and molecular aspects of the remodelling
Editor: Stuart K. Kim, Stanford University Medical Center, United States of America
Received May 14, 2007; Accepted August 28, 2007; Published October 12, 2007
A previous version of this article appeared as an Early Online Release on August 28,2007 (doi:10.1371/journal.pgen.0030174.eor).
Copyright: � 2007 Zeitouni et al. This is an open-access article distributed underthe terms of the Creative Commons Attribution License, which permits unrestricteduse, distribution, and reproduction in any medium, provided the original authorand source are credited.
Abbreviations: APF, after puparium formation; BP, biological process; dsRNA,double-stranded RNA; FGF, fibroblast growth factor; GO, gene ontology; PCD,programmed cell death; PDGF-VEGF, platelet-derived growth factor-vascularendothelial growth factor; RQ-PCR, quantitative real-time reverse-transcriptasePCR; SAM, significance analysis of microarrays; SOM, Self-organizing map;
* To whom correspondence should be addressed. E-mail: [email protected]
PLoS Genetics | www.plosgenetics.org October 2007 | Volume 3 | Issue 10 | e1741907
process [5]. Even though we know that one important EcRoutput during heart remodelling consists of a modification ofthe expression and activity of Hox genes Ultrabithorax (Ubx)and abdominal-A (abd-A) [5], we still have a very poor knowl-edge of the genetic programs and the molecular pathwaysthat are elicited to direct cardiac myocytes to adopt theirfinal fates.
We have undertaken a global systematic approach to thisquestion. We show that transcriptional signatures identifiedfrom cardiac tubes dissected at carefully chosen time-pointsduring the process provide an accurate and precise descrip-tion of the main cellular events that occur, which fits very wellwith what we know of the process. From this observation, theexpression modulation of genes encoding components of afew signalling pathways was taken as an indication of theirpotential implication in the process. We demonstrated, by areverse genetic approach, that the fibroblast growth factor(FGF), Wnt, and the platelet-derived growth factor-vascularendothelial growth factor (PDGF-VEGF) signalling pathwaysinduce specific developmental programs and that each ofthese are implicated in discrete events required for adultheart formation. Our study thus illustrates that integratinggenomic and reverse-genetic approaches is an efficient way toprovide comprehensive knowledge of an organogenesisprocess, and furnishes significant new insights into thesignalling pathways involved in heart organogenesis.
Results
Gene Expression Profiling during Cardiac TubeRemodelling
Cardiac tube remodelling coincides with the last ecdysonepeak at 30 h after puparium formation (APF) [5]. Up to 27 hAPF, the cardiac tube retains larval morphology and functionand is morphologically and functionally divided into ananterior ‘‘aorta’’ and a posterior ‘‘heart’’ [5,8,9] (Figure 1A).Heart beating stops between 27 h and 30 h APF. Then, mostof the larval heart is eliminated by PCD and the adult heart
progressively differentiates from the larval aorta. The larvalaorta myocytes increase their size and the number of theirmyofibrils, and differentiate into working cardiomyocytesthat also acquire a contractile automatic cardiac activity.Four pairs of inflow tracts (also referred to as ‘‘ostia’’)differentiate from 16 cells of the larval aorta and three pairsof valves are newly formed. In addition, segment A5, which ispart of the heart in the larva, transdifferentiates into a newstructure, called the terminal chamber, that becomes in-nervated but loses its automatic contractile activity [5].Finally, a ventral sheet of syncytial imaginal muscles developsbeneath the cardiac tube. At 48 h APF, the first signs of adultcardiac activity are detectable. Based on this knowledge, we
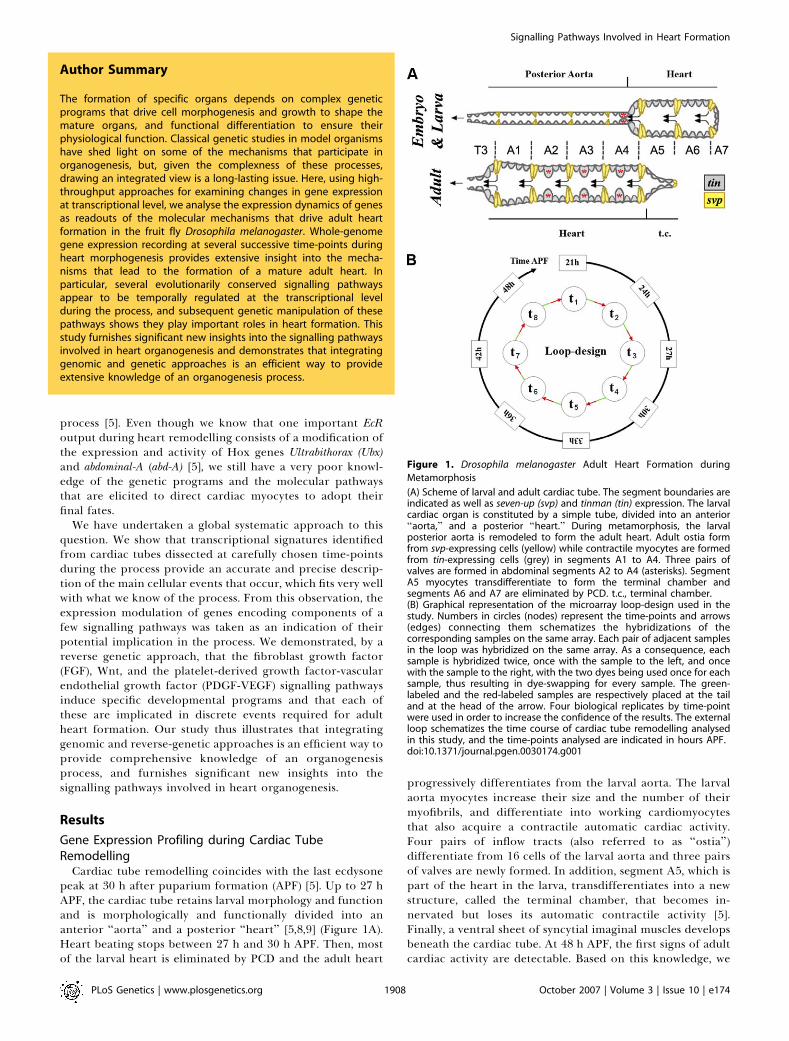
Figure 1. Drosophila melanogaster Adult Heart Formation during
Metamorphosis
(A) Scheme of larval and adult cardiac tube. The segment boundaries areindicated as well as seven-up (svp) and tinman (tin) expression. The larvalcardiac organ is constituted by a simple tube, divided into an anterior‘‘aorta,’’ and a posterior ‘‘heart.’’ During metamorphosis, the larvalposterior aorta is remodeled to form the adult heart. Adult ostia formfrom svp-expressing cells (yellow) while contractile myocytes are formedfrom tin-expressing cells (grey) in segments A1 to A4. Three pairs ofvalves are formed in abdominal segments A2 to A4 (asterisks). SegmentA5 myocytes transdifferentiate to form the terminal chamber andsegments A6 and A7 are eliminated by PCD. t.c., terminal chamber.(B) Graphical representation of the microarray loop-design used in thestudy. Numbers in circles (nodes) represent the time-points and arrows(edges) connecting them schematizes the hybridizations of thecorresponding samples on the same array. Each pair of adjacent samplesin the loop was hybridized on the same array. As a consequence, eachsample is hybridized twice, once with the sample to the left, and oncewith the sample to the right, with the two dyes being used once for eachsample, thus resulting in dye-swapping for every sample. The green-labeled and the red-labeled samples are respectively placed at the tailand at the head of the arrow. Four biological replicates by time-pointwere used in order to increase the confidence of the results. The externalloop schematizes the time course of cardiac tube remodelling analysedin this study, and the time-points analysed are indicated in hours APF.doi:10.1371/journal.pgen.0030174.g001
PLoS Genetics | www.plosgenetics.org October 2007 | Volume 3 | Issue 10 | e1741908
Signalling Pathways Involved in Heart Formation
Author Summary
The formation of specific organs depends on complex geneticprograms that drive cell morphogenesis and growth to shape themature organs, and functional differentiation to ensure theirphysiological function. Classical genetic studies in model organismshave shed light on some of the mechanisms that participate inorganogenesis, but, given the complexness of these processes,drawing an integrated view is a long-lasting issue. Here, using high-throughput approaches for examining changes in gene expressionat transcriptional level, we analyse the expression dynamics of genesas readouts of the molecular mechanisms that drive adult heartformation in the fruit fly Drosophila melanogaster. Whole-genomegene expression recording at several successive time-points duringheart morphogenesis provides extensive insight into the mecha-nisms that lead to the formation of a mature adult heart. Inparticular, several evolutionarily conserved signalling pathwaysappear to be temporally regulated at the transcriptional levelduring the process, and subsequent genetic manipulation of thesepathways shows they play important roles in heart formation. Thisstudy furnishes significant new insights into the signalling pathwaysinvolved in heart organogenesis and demonstrates that integratinggenomic and genetic approaches is an efficient way to provideextensive knowledge of an organogenesis process.
conducted a time-course analysis of the genome-wideexpression dynamics of dissected cardiac tubes, with in-creased temporal precision around 30 h APF, correspondingto the maximum ecdysone rise [10].
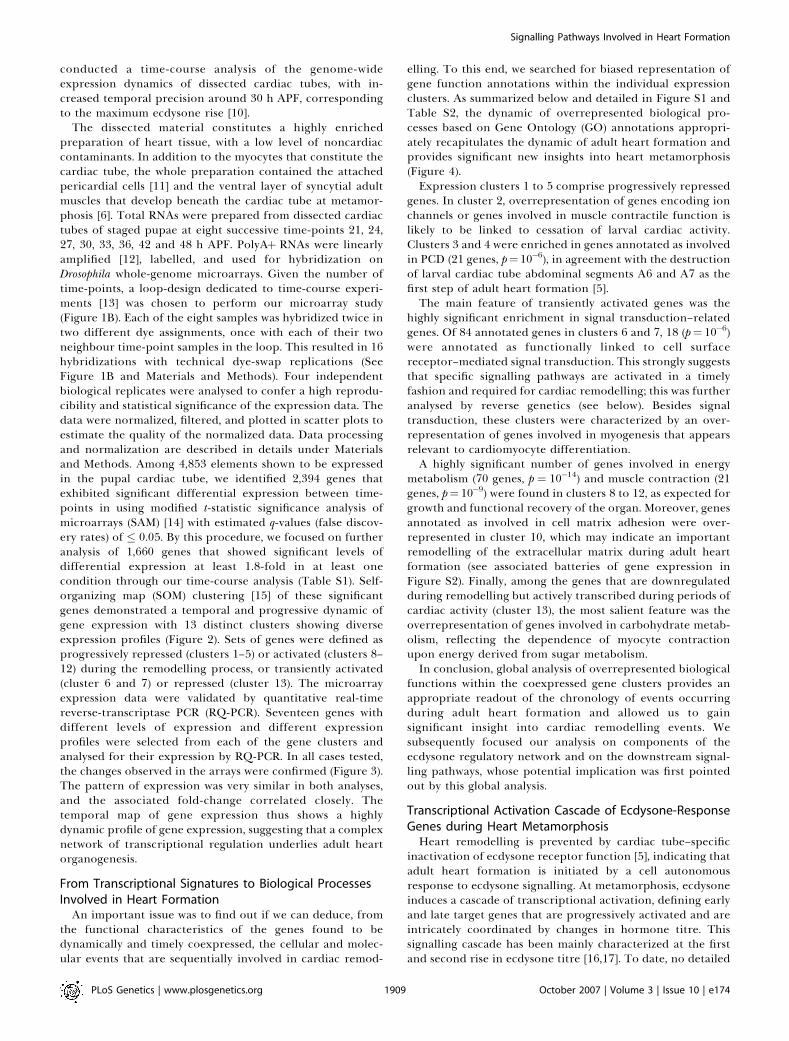
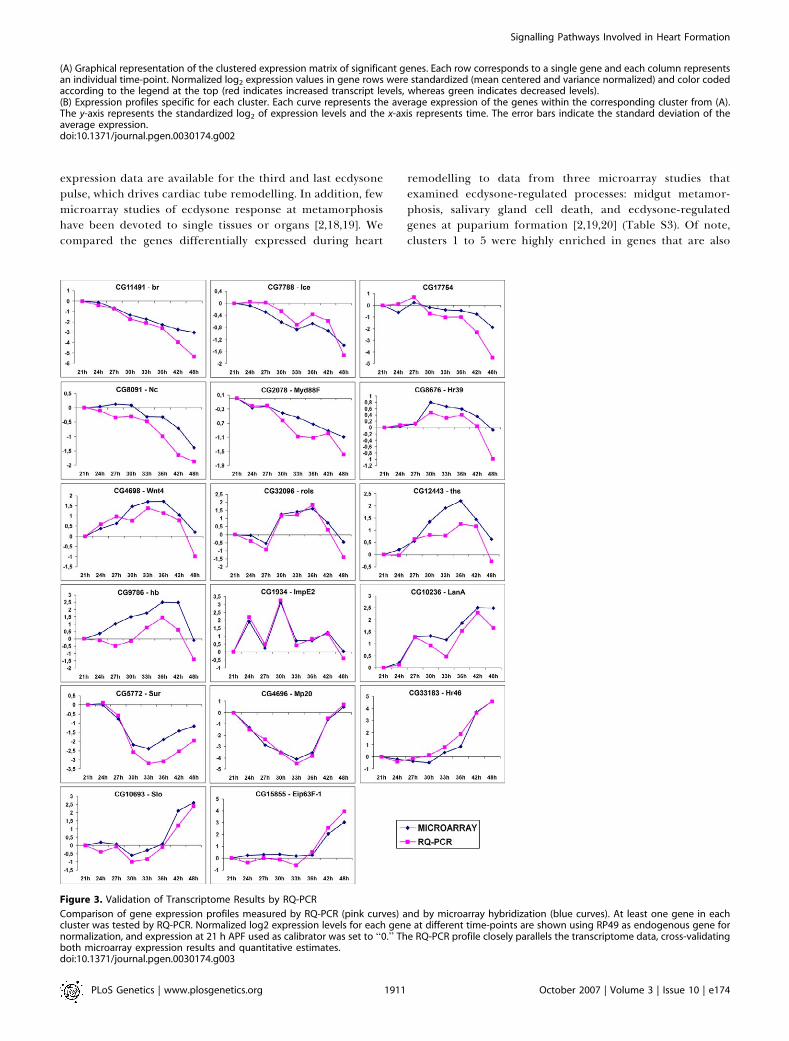
The dissected material constitutes a highly enrichedpreparation of heart tissue, with a low level of noncardiaccontaminants. In addition to the myocytes that constitute thecardiac tube, the whole preparation contained the attachedpericardial cells [11] and the ventral layer of syncytial adultmuscles that develop beneath the cardiac tube at metamor-phosis [6]. Total RNAs were prepared from dissected cardiactubes of staged pupae at eight successive time-points 21, 24,27, 30, 33, 36, 42 and 48 h APF. PolyAþ RNAs were linearlyamplified [12], labelled, and used for hybridization onDrosophila whole-genome microarrays. Given the number oftime-points, a loop-design dedicated to time-course experi-ments [13] was chosen to perform our microarray study(Figure 1B). Each of the eight samples was hybridized twice intwo different dye assignments, once with each of their twoneighbour time-point samples in the loop. This resulted in 16hybridizations with technical dye-swap replications (SeeFigure 1B and Materials and Methods). Four independentbiological replicates were analysed to confer a high reprodu-cibility and statistical significance of the expression data. Thedata were normalized, filtered, and plotted in scatter plots toestimate the quality of the normalized data. Data processingand normalization are described in details under Materialsand Methods. Among 4,853 elements shown to be expressedin the pupal cardiac tube, we identified 2,394 genes thatexhibited significant differential expression between time-points in using modified t-statistic significance analysis ofmicroarrays (SAM) [14] with estimated q-values (false discov-ery rates) of � 0.05. By this procedure, we focused on furtheranalysis of 1,660 genes that showed significant levels ofdifferential expression at least 1.8-fold in at least onecondition through our time-course analysis (Table S1). Self-organizing map (SOM) clustering [15] of these significantgenes demonstrated a temporal and progressive dynamic ofgene expression with 13 distinct clusters showing diverseexpression profiles (Figure 2). Sets of genes were defined asprogressively repressed (clusters 1–5) or activated (clusters 8–12) during the remodelling process, or transiently activated(cluster 6 and 7) or repressed (cluster 13). The microarrayexpression data were validated by quantitative real-timereverse-transcriptase PCR (RQ-PCR). Seventeen genes withdifferent levels of expression and different expressionprofiles were selected from each of the gene clusters andanalysed for their expression by RQ-PCR. In all cases tested,the changes observed in the arrays were confirmed (Figure 3).The pattern of expression was very similar in both analyses,and the associated fold-change correlated closely. Thetemporal map of gene expression thus shows a highlydynamic profile of gene expression, suggesting that a complexnetwork of transcriptional regulation underlies adult heartorganogenesis.
From Transcriptional Signatures to Biological ProcessesInvolved in Heart Formation
An important issue was to find out if we can deduce, fromthe functional characteristics of the genes found to bedynamically and timely coexpressed, the cellular and molec-ular events that are sequentially involved in cardiac remod-
elling. To this end, we searched for biased representation ofgene function annotations within the individual expressionclusters. As summarized below and detailed in Figure S1 andTable S2, the dynamic of overrepresented biological pro-cesses based on Gene Ontology (GO) annotations appropri-ately recapitulates the dynamic of adult heart formation andprovides significant new insights into heart metamorphosis(Figure 4).Expression clusters 1 to 5 comprise progressively repressed
genes. In cluster 2, overrepresentation of genes encoding ionchannels or genes involved in muscle contractile function islikely to be linked to cessation of larval cardiac activity.Clusters 3 and 4 were enriched in genes annotated as involvedin PCD (21 genes, p¼10�6), in agreement with the destructionof larval cardiac tube abdominal segments A6 and A7 as thefirst step of adult heart formation [5].The main feature of transiently activated genes was the
highly significant enrichment in signal transduction–relatedgenes. Of 84 annotated genes in clusters 6 and 7, 18 (p¼ 10�6)were annotated as functionally linked to cell surfacereceptor–mediated signal transduction. This strongly suggeststhat specific signalling pathways are activated in a timelyfashion and required for cardiac remodelling; this was furtheranalysed by reverse genetics (see below). Besides signaltransduction, these clusters were characterized by an over-representation of genes involved in myogenesis that appearsrelevant to cardiomyocyte differentiation.A highly significant number of genes involved in energy
metabolism (70 genes, p ¼ 10�14) and muscle contraction (21genes, p¼ 10�9) were found in clusters 8 to 12, as expected forgrowth and functional recovery of the organ. Moreover, genesannotated as involved in cell matrix adhesion were over-represented in cluster 10, which may indicate an importantremodelling of the extracellular matrix during adult heartformation (see associated batteries of gene expression inFigure S2). Finally, among the genes that are downregulatedduring remodelling but actively transcribed during periods ofcardiac activity (cluster 13), the most salient feature was theoverrepresentation of genes involved in carbohydrate metab-olism, reflecting the dependence of myocyte contractionupon energy derived from sugar metabolism.In conclusion, global analysis of overrepresented biological
functions within the coexpressed gene clusters provides anappropriate readout of the chronology of events occurringduring adult heart formation and allowed us to gainsignificant insight into cardiac remodelling events. Wesubsequently focused our analysis on components of theecdysone regulatory network and on the downstream signal-ling pathways, whose potential implication was first pointedout by this global analysis.
Transcriptional Activation Cascade of Ecdysone-ResponseGenes during Heart MetamorphosisHeart remodelling is prevented by cardiac tube–specific
inactivation of ecdysone receptor function [5], indicating thatadult heart formation is initiated by a cell autonomousresponse to ecdysone signalling. At metamorphosis, ecdysoneinduces a cascade of transcriptional activation, defining earlyand late target genes that are progressively activated and areintricately coordinated by changes in hormone titre. Thissignalling cascade has been mainly characterized at the firstand second rise in ecdysone titre [16,17]. To date, no detailed
PLoS Genetics | www.plosgenetics.org October 2007 | Volume 3 | Issue 10 | e1741909
Signalling Pathways Involved in Heart Formation
Figure 2. Expression Profiling of Adult Heart Organogenesis
Expression profiles of genes whose transcript levels changed significantly during adult heart formation. Time-points are indicated as hours APF. Of14,444 genes in the array, 1,660 genes, which showed a significant level of differential expression at least one time-point, were clustered into 13 groupsof the basis of the similarity of their expression profile, following SOM clustering method (see Materials and Methods).
PLoS Genetics | www.plosgenetics.org October 2007 | Volume 3 | Issue 10 | e1741910
Signalling Pathways Involved in Heart Formation
expression data are available for the third and last ecdysonepulse, which drives cardiac tube remodelling. In addition, fewmicroarray studies of ecdysone response at metamorphosishave been devoted to single tissues or organs [2,18,19]. Wecompared the genes differentially expressed during heart
remodelling to data from three microarray studies thatexamined ecdysone-regulated processes: midgut metamor-phosis, salivary gland cell death, and ecdysone-regulatedgenes at puparium formation [2,19,20] (Table S3). Of note,clusters 1 to 5 were highly enriched in genes that are also
Figure 3. Validation of Transcriptome Results by RQ-PCR
Comparison of gene expression profiles measured by RQ-PCR (pink curves) and by microarray hybridization (blue curves). At least one gene in eachcluster was tested by RQ-PCR. Normalized log2 expression levels for each gene at different time-points are shown using RP49 as endogenous gene fornormalization, and expression at 21 h APF used as calibrator was set to ‘‘0.’’ The RQ-PCR profile closely parallels the transcriptome data, cross-validatingboth microarray expression results and quantitative estimates.doi:10.1371/journal.pgen.0030174.g003
(A) Graphical representation of the clustered expression matrix of significant genes. Each row corresponds to a single gene and each column representsan individual time-point. Normalized log2 expression values in gene rows were standardized (mean centered and variance normalized) and color codedaccording to the legend at the top (red indicates increased transcript levels, whereas green indicates decreased levels).(B) Expression profiles specific for each cluster. Each curve represents the average expression of the genes within the corresponding cluster from (A).The y-axis represents the standardized log2 of expression levels and the x-axis represents time. The error bars indicate the standard deviation of theaverage expression.doi:10.1371/journal.pgen.0030174.g002
PLoS Genetics | www.plosgenetics.org October 2007 | Volume 3 | Issue 10 | e1741911
Signalling Pathways Involved in Heart Formation
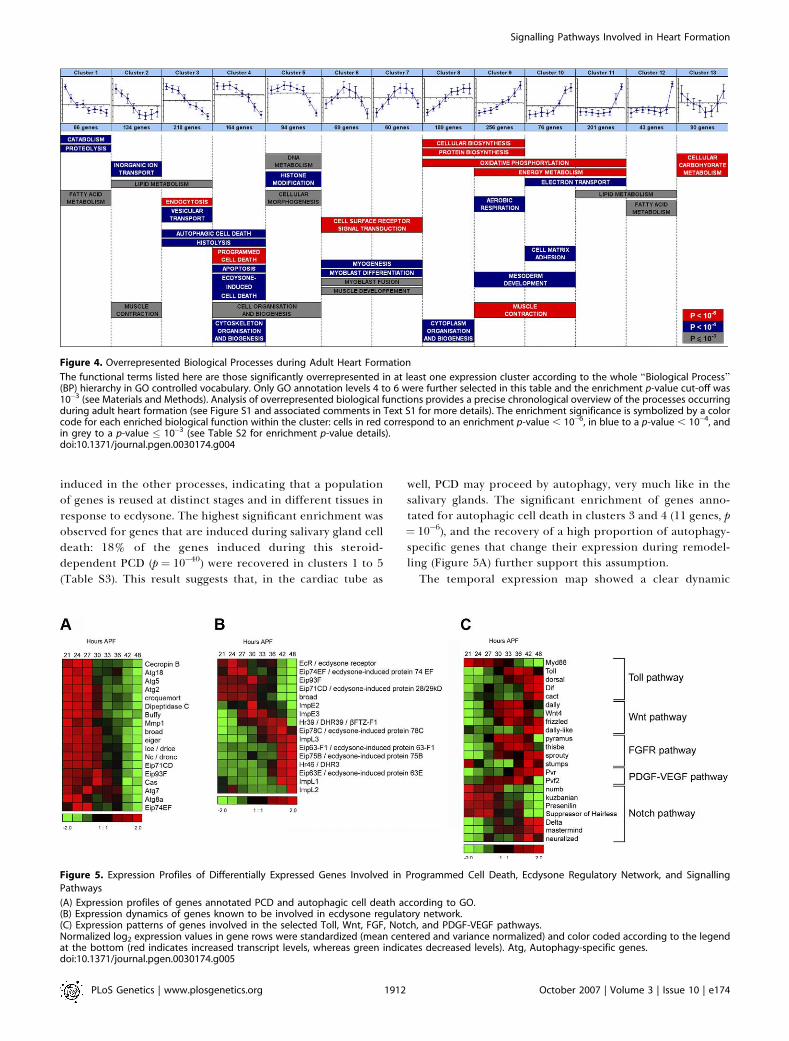
induced in the other processes, indicating that a populationof genes is reused at distinct stages and in different tissues inresponse to ecdysone. The highest significant enrichment wasobserved for genes that are induced during salivary gland celldeath: 18% of the genes induced during this steroid-dependent PCD (p ¼ 10�40) were recovered in clusters 1 to 5(Table S3). This result suggests that, in the cardiac tube as
well, PCD may proceed by autophagy, very much like in thesalivary glands. The significant enrichment of genes anno-tated for autophagic cell death in clusters 3 and 4 (11 genes, p¼ 10�6), and the recovery of a high proportion of autophagy-specific genes that change their expression during remodel-ling (Figure 5A) further support this assumption.The temporal expression map showed a clear dynamic
Figure 4. Overrepresented Biological Processes during Adult Heart Formation
The functional terms listed here are those significantly overrepresented in at least one expression cluster according to the whole ‘‘Biological Process’’(BP) hierarchy in GO controlled vocabulary. Only GO annotation levels 4 to 6 were further selected in this table and the enrichment p-value cut-off was10�3 (see Materials and Methods). Analysis of overrepresented biological functions provides a precise chronological overview of the processes occurringduring adult heart formation (see Figure S1 and associated comments in Text S1 for more details). The enrichment significance is symbolized by a colorcode for each enriched biological function within the cluster: cells in red correspond to an enrichment p-value , 10�6, in blue to a p-value , 10�4, andin grey to a p-value � 10�3 (see Table S2 for enrichment p-value details).doi:10.1371/journal.pgen.0030174.g004
Figure 5. Expression Profiles of Differentially Expressed Genes Involved in Programmed Cell Death, Ecdysone Regulatory Network, and Signalling
Pathways
(A) Expression profiles of genes annotated PCD and autophagic cell death according to GO.(B) Expression dynamics of genes known to be involved in ecdysone regulatory network.(C) Expression patterns of genes involved in the selected Toll, Wnt, FGF, Notch, and PDGF-VEGF pathways.Normalized log2 expression values in gene rows were standardized (mean centered and variance normalized) and color coded according to the legendat the bottom (red indicates increased transcript levels, whereas green indicates decreased levels). Atg, Autophagy-specific genes.doi:10.1371/journal.pgen.0030174.g005
PLoS Genetics | www.plosgenetics.org October 2007 | Volume 3 | Issue 10 | e1741912
Signalling Pathways Involved in Heart Formation
expression profile of the annotated ecdysone-response genesrecovered in our analysis (Figure 5B). Similarly to what occursduring the former ecdysone pulses in both salivary glands andmidgut [21], the first activated genes encode EcR, Eip93F,broad (br), and Ecdysone-induced protein 74EF (Eip74EF), thecharacterized early response genes. Just downstream of thisgroup of genes, Hormone receptor-like in 39 (Hr39) and Ecdysone-induced protein 78C (Eip78C) appeared to be transientlyinduced, suggesting that their function may be required foractivation of a set of late response genes, including thenuclear receptors Hormone receptor-like in 46 (Hr46) andEcdysone-induced protein 75B (Eip75B), and other ecdysone-related genes. Notably, the late upregulation of this set ofgenes, after occurrence of cell death and the onset ofecdysone titre decline, strongly suggests these late genesparticipate in differentiation of the adult heart rather than inPCD.
As a whole, the ecdysone-induced transcriptional cascadein the cardiac tube appears to be similar to the ones observedin other ecdysone-dependent processes characterized so far[22]. Temporal and tissue specificity of the ecdysone-inducedprogram is thus likely to be conferred by tissue-specificfactors, the best candidates being transcription factors.Supporting this hypothesis, the Fork head transcriptionfactor was recently shown to control the timing of ecdy-sone-induced cell death in the salivary glands [23]. A numberof transcription factors have been identified in our tran-scriptome profiling (Figure S3) and future analysis of thefunction of these transcription factors in cardiac tuberemodelling is expected to shed light on the mechanisms ofecdysone response specificity.
Functional Analysis of Signalling Pathways Involved inAdult Heart Formation
The considerable overrepresentation of cell surface recep-tor–linked signal transduction annotated genes in clusters oftransiently overexpressed genes (Figure 4) suggested thatsignal transduction processes play a central role in the adultorgan formation. A list of genes encoding the corecomponents of all known receptor-linked signalling pathwayswas generated from several gene annotation resources, andtheir temporal expression profiles in the transcriptomesurvey were further examined (see Table S4). From thisdataset, we searched for pathways whose key components areoverrepresented and display a timely ordered expression (seedetails in Materials and Methods). This selection proceduredesignated the FGF, Wnt, PDGF-VEGF, Notch, and Tollpathways as being potentially implicated (Figure 5C). Heart-specific targeted inhibition and/or activation of these path-ways was used to evaluate their specific function. As detailedbelow, all except the Toll pathway are involved in cardiactube remodelling, confirming the central role played bysignalling pathways in this process and validating theprocedure used for the selection of signalling pathways.
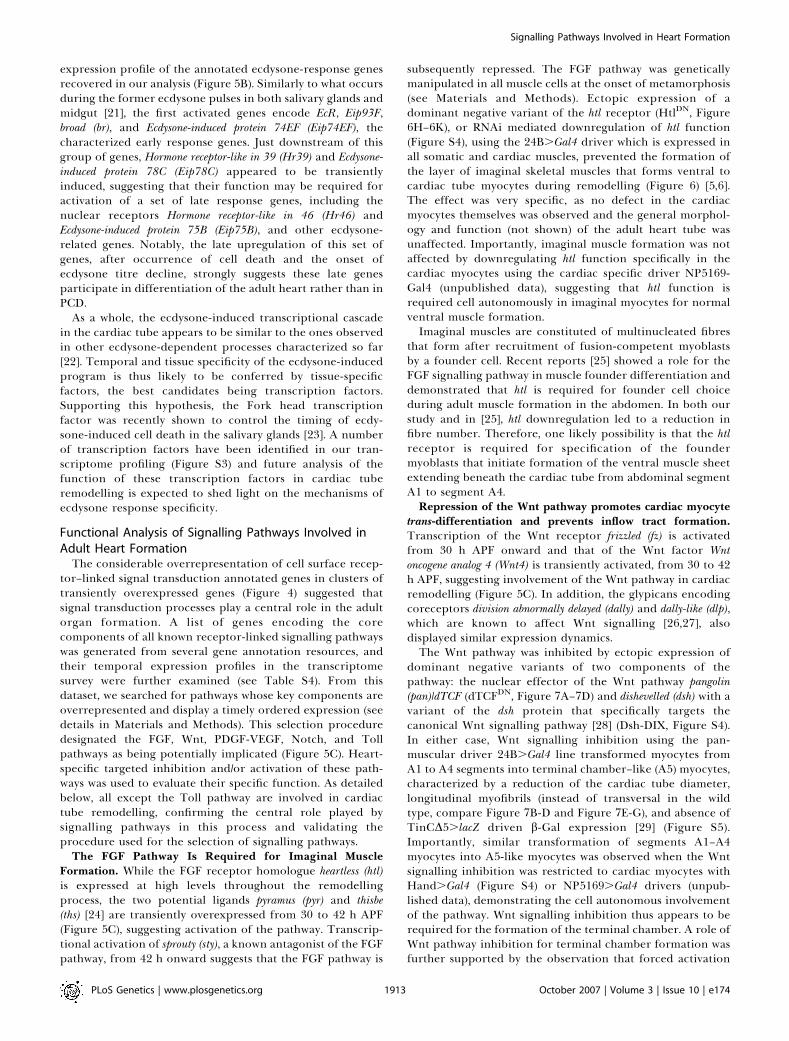
The FGF Pathway Is Required for Imaginal MuscleFormation. While the FGF receptor homologue heartless (htl)is expressed at high levels throughout the remodellingprocess, the two potential ligands pyramus (pyr) and thisbe(ths) [24] are transiently overexpressed from 30 to 42 h APF(Figure 5C), suggesting activation of the pathway. Transcrip-tional activation of sprouty (sty), a known antagonist of the FGFpathway, from 42 h onward suggests that the FGF pathway is
subsequently repressed. The FGF pathway was geneticallymanipulated in all muscle cells at the onset of metamorphosis(see Materials and Methods). Ectopic expression of adominant negative variant of the htl receptor (HtlDN, Figure6H–6K), or RNAi mediated downregulation of htl function(Figure S4), using the 24B.Gal4 driver which is expressed inall somatic and cardiac muscles, prevented the formation ofthe layer of imaginal skeletal muscles that forms ventral tocardiac tube myocytes during remodelling (Figure 6) [5,6].The effect was very specific, as no defect in the cardiacmyocytes themselves was observed and the general morphol-ogy and function (not shown) of the adult heart tube wasunaffected. Importantly, imaginal muscle formation was notaffected by downregulating htl function specifically in thecardiac myocytes using the cardiac specific driver NP5169-Gal4 (unpublished data), suggesting that htl function isrequired cell autonomously in imaginal myocytes for normalventral muscle formation.Imaginal muscles are constituted of multinucleated fibres
that form after recruitment of fusion-competent myoblastsby a founder cell. Recent reports [25] showed a role for theFGF signalling pathway in muscle founder differentiation anddemonstrated that htl is required for founder cell choiceduring adult muscle formation in the abdomen. In both ourstudy and in [25], htl downregulation led to a reduction infibre number. Therefore, one likely possibility is that the htlreceptor is required for specification of the foundermyoblasts that initiate formation of the ventral muscle sheetextending beneath the cardiac tube from abdominal segmentA1 to segment A4.Repression of the Wnt pathway promotes cardiac myocyte
trans-differentiation and prevents inflow tract formation.Transcription of the Wnt receptor frizzled (fz) is activatedfrom 30 h APF onward and that of the Wnt factor Wntoncogene analog 4 (Wnt4) is transiently activated, from 30 to 42h APF, suggesting involvement of the Wnt pathway in cardiacremodelling (Figure 5C). In addition, the glypicans encodingcoreceptors division abnormally delayed (dally) and dally-like (dlp),which are known to affect Wnt signalling [26,27], alsodisplayed similar expression dynamics.The Wnt pathway was inhibited by ectopic expression of
dominant negative variants of two components of thepathway: the nuclear effector of the Wnt pathway pangolin(pan)/dTCF (dTCFDN, Figure 7A–7D) and dishevelled (dsh) with avariant of the dsh protein that specifically targets thecanonical Wnt signalling pathway [28] (Dsh-DIX, Figure S4).In either case, Wnt signalling inhibition using the pan-muscular driver 24B.Gal4 line transformed myocytes fromA1 to A4 segments into terminal chamber–like (A5) myocytes,characterized by a reduction of the cardiac tube diameter,longitudinal myofibrils (instead of transversal in the wildtype, compare Figure 7B-D and Figure 7E-G), and absence ofTinCD5.lacZ driven b-Gal expression [29] (Figure S5).Importantly, similar transformation of segments A1–A4myocytes into A5-like myocytes was observed when the Wntsignalling inhibition was restricted to cardiac myocytes withHand.Gal4 (Figure S4) or NP5169.Gal4 drivers (unpub-lished data), demonstrating the cell autonomous involvementof the pathway. Wnt signalling inhibition thus appears to berequired for the formation of the terminal chamber. A role ofWnt pathway inhibition for terminal chamber formation wasfurther supported by the observation that forced activation
PLoS Genetics | www.plosgenetics.org October 2007 | Volume 3 | Issue 10 | e1741913
Signalling Pathways Involved in Heart Formation
of the Wnt pathway by cardiomyocyte-restricted ectopicexpression of constitutively active b-catenin (armadillo, arm)homologue (armS10, Figure S5), specifically inhibited A5myocyte trans-differentiation.
We previously demonstrated that terminal chamber for-mation depends on the function of the Hox gene abd-A [5].Loss of abd-A function impairs A5 myocyte trans-differ-entiation, while its ectopic expression induces A1 to A4myocytes to adopt a terminal chamber–like phenotype,similar to the phenotype observed here after dTCFDN
expression. Wnt pathway inhibition and abd-A function thusappear to be part of the same genetic cascade. That the Wntpathway acts downstream of abd-A was suggested by the factthat abd-A protein expression was not affected when trans-differentiation was inhibited by overexpression of theconstitutively active b-catenin homologue (Figure S5), orwhen anterior myocytes were forced to transdifferentiateafter dTCFDN ectopic expression (unpublished data).
In addition, the characteristic shape of the inflow tract cellswas not observed after dTCFDN or Dsh-DIX expression,indicating that Wnt signalling is also required for theirdifferentiation (Figure 7B-D and Figure S5). Interestingly the
wingless (wg) protein was shown to be transiently expressed ininflow tract–forming cells during adult heart organogenesisat 30 h APF [5], and may well participate in this Wnt-mediated inflow tract differentiation. Collectively, theseresults reveal a dual function for the canonical Wnt signallingpathway during adult cardiogenesis and suggest that repres-sion of the pathway is required for terminal chamberformation whereas its activation is necessary for inflow tractdifferentiation.Activation of the PDGF-VEGF Pathway Is Required for
Valve Formation. The transcriptional activation of PDGF- andVEGF-receptor related (Pvr), a receptor tyrosine kinase relatedto mammalian PDGF and VEGF receptors [30], from 33 h APFonward, and the transient expression of one of its ligands,PDGF- and VEGF-related factor 2 (Pvf2) (from 27 to 42 h APF),suggested that the PDGF-VEGF pathway is activated duringcardiac remodelling (Figure 5C). During heart metamorpho-sis, three pairs of valves form from one pair of cells in eachabdominal segment from A2 to A4 [5]. At 42 h APF, Pvr wasfound specifically expressed in the precursors of adult valves,in one pair of cells in each segment from A2 to A4 (Figure8A), and was not expressed in A1 and A5 segments, which are
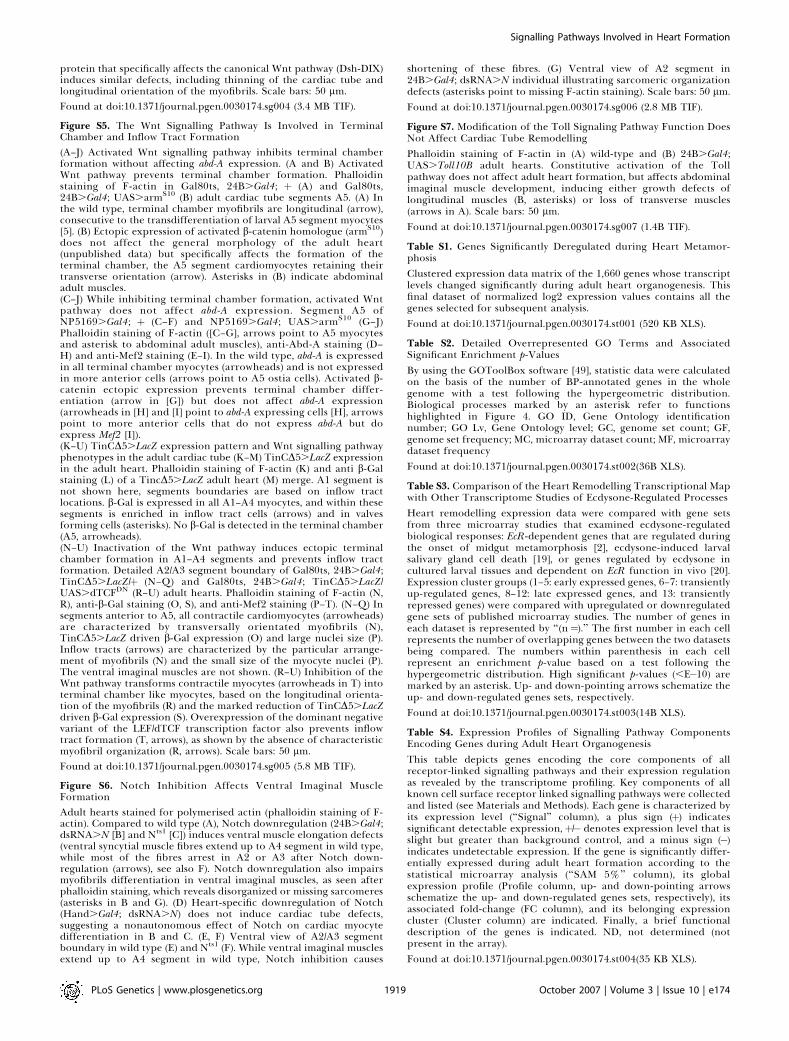
Figure 6. The FGF Pathway Is Required for Ventral Imaginal Muscle Formation
(A–G) Ventral view of wild-type adult heart stained for F-actin (phalloidin, A, B, and E) and dMef2 (C, F). (A) Morphology of the whole cardiac tube.Segments are indicated, based on the localization of the inflow tract and of the abdominal longitudinal muscles (asterisks). (B–D) Detail of a A2/A3segment boundary. Inflow tract (arrowheads), contractile cardiac myocytes (arrows), and imaginal ventral muscles (asterisks) are identified both by theshape of their myofibrils (longitudinal for imaginal ventral muscles, transversal for inflow tract and contractile cardiomyocytes), and the size of theirnuclei (nuclei of svp-expressing inflow tract forming cells are smaller than those of tin-expressing contractile myocytes) [5,6]. (E–G) Detail of A5 segment(terminal chamber). The terminal chamber is characterized by a thinner diameter, the absence of ventral imaginal muscles, and by the longitudinalorientation of cardiomyocyte myofibrils [5].(H–K) The FGF pathway is required for imaginal ventral muscles formation. Gal80ts, 24B.Gal4; UAS.HtlDN adult cardiac tube stained for F-actin(phalloidin; H, I) and dMef2 (J). The general morphology of the adult heart is not affected (H), nor is the shape of inflow tracts (arrowheads) and cardiacmyocytes (arrows). (I–K) Detail of A2/A3 segment boundary. Downregulation of htl function specifically affects the formation of adult muscles, includingthe imaginal ventral muscles, which are almost absent. Note the absence of abdominal longitudinal muscles in (H) and the considerable reduction ofimaginal ventral muscle fibres (I–K). Scale bars: 50 lm.doi:10.1371/journal.pgen.0030174.g006
PLoS Genetics | www.plosgenetics.org October 2007 | Volume 3 | Issue 10 | e1741914
Signalling Pathways Involved in Heart Formation
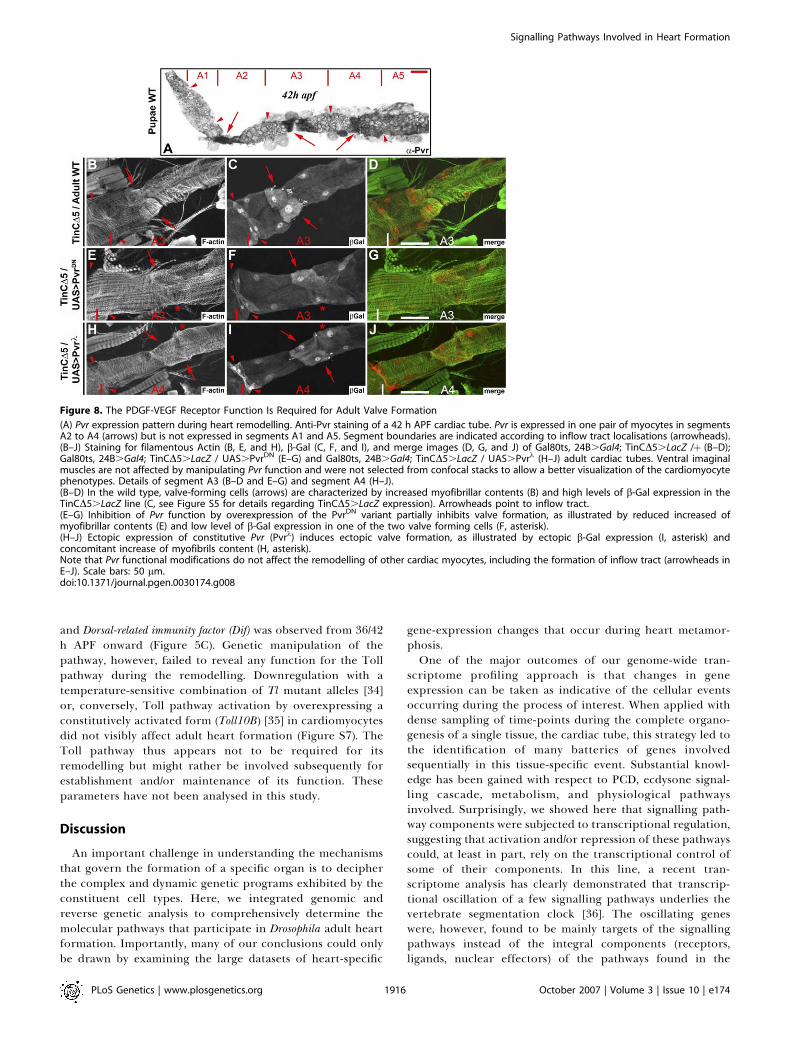
devoid of valves. The PDGF-VEGF pathway function wasexamined by driving either a dominant negative form of Pvr(PvrDN) or a constitutively active form (Pvrk) [30] in cardiacmyocytes during metamorphosis (Figure 8). Valves arecharacterized by a dense actomyosin network that can bevisualised by F-actin staining [5] and by a specific enrichmentof b-Gal expression in the TinCD5.LacZ reporter line(Figures 8C and S5). Downregulation of Pvr function withPvrDN repressed valve formation in 20% of the cardiac tubeanalysed (n ¼ 30, Figure 8E–8G), while ectopic expression ofthe activated Pvr protein induced ectopic valve formation in45% of the cases (n¼ 20, Figure 8H–8J). This result supportsthat transient activation of the PDGF-VEGF pathway isnecessary and sufficient for adult cardiac valve formation.Of note, Pvr modulation did not affect other cell typesexamined, such as inflow tracts (Figure 8F), terminalchamber, and ventral muscles (unpublished data).
Importantly, among the number of signalling pathwaysrequired for heart valve formation in mammals [31], theVEGF pathway appears to play a central role, being involvedin both endocardial to mesenchymal transition and termi-nation of valve differentiation [32]. In Drosophila, the cardiactube is formed by only one cell layer that behaves as bothmyocardium and endocardium. Valves are formed from thesebifunctional precursors that change their shape to lead tocushions within the tube lumen concomitantly increasingtheir myofibrillar content. It is therefore suggested that, whileinducing very different cellular processes, the VEGF pathwayplays an evolutionary conserved function in valve specifica-tion.
The Notch pathway is involved in ventral muscle differ-entiation. The expression profile of genes encoding compo-nents of the Notch pathway is complex. The Notch (N)
receptor itself is expressed throughout the remodellingprocess (Table S4), but some genes (Suppressor of Hairless(Su(H)) and kuzbanian (kuz)) are activated early during theprocess, while others, such as the ligand Delta (Dl) and thecoactivator mastermind (mam) are activated only late (Figure5C; Table S4). The Notch pathway activity was down-regulated either by using a temperature-sensitive allele ofN (Nts1) or by 24B.Gal4 driven expression of a double-stranded RNA (dsRNA) construct. In both cases, Notchdownregulation affected ventral muscle formation (FigureS6). The ventral myofibrils are formed, but are shorter thanin the wild type, and failed to extend in posterior segments.Dutta et al [33] reported that the Notch pathway is notinvolved in adult myoblast specification and does not affectfounder cell selection. Our results might thus be interpretedas a requirement of the Notch pathway in latter somaticmuscle differentiation events. In addition, both Nts1 and24B.Gal4; dsRNA.N individuals displayed thinner cardiactube compared to wild type (Figure S6). However, thisphenotype was not observed after cardiomyocyte-specificdownregulation of Notch function using either theNP5169.Gal4 or the Hand.Gal4 drivers (Figure S6),suggesting a nonautonomous effect of the pathway oncardiac tube growth.The Toll pathway is not required for adult heart morpho-
genesis. Transcription of the Toll (Tl) receptor gene isactivated at 33 h APF (Figure 5C). The genes tube (tub) andpelle (pll), which are both required for Toll signal trans-duction, are expressed in the cardiac tube during theremodelling but their expression remains unchanged in thetime-course analysed (Table S4). A correlated increasedexpression of the I-kappaB homolog protein cactus (cact) andof the two NF-kappaB homolog nuclear effectors dorsal (dl)
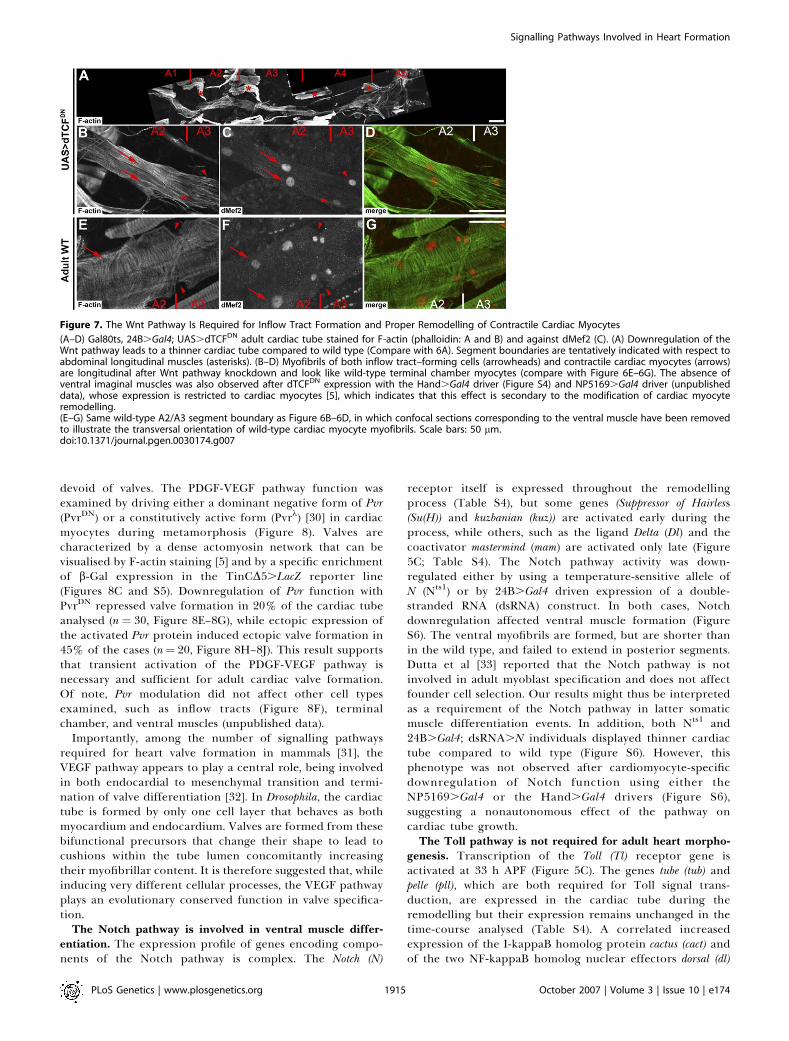
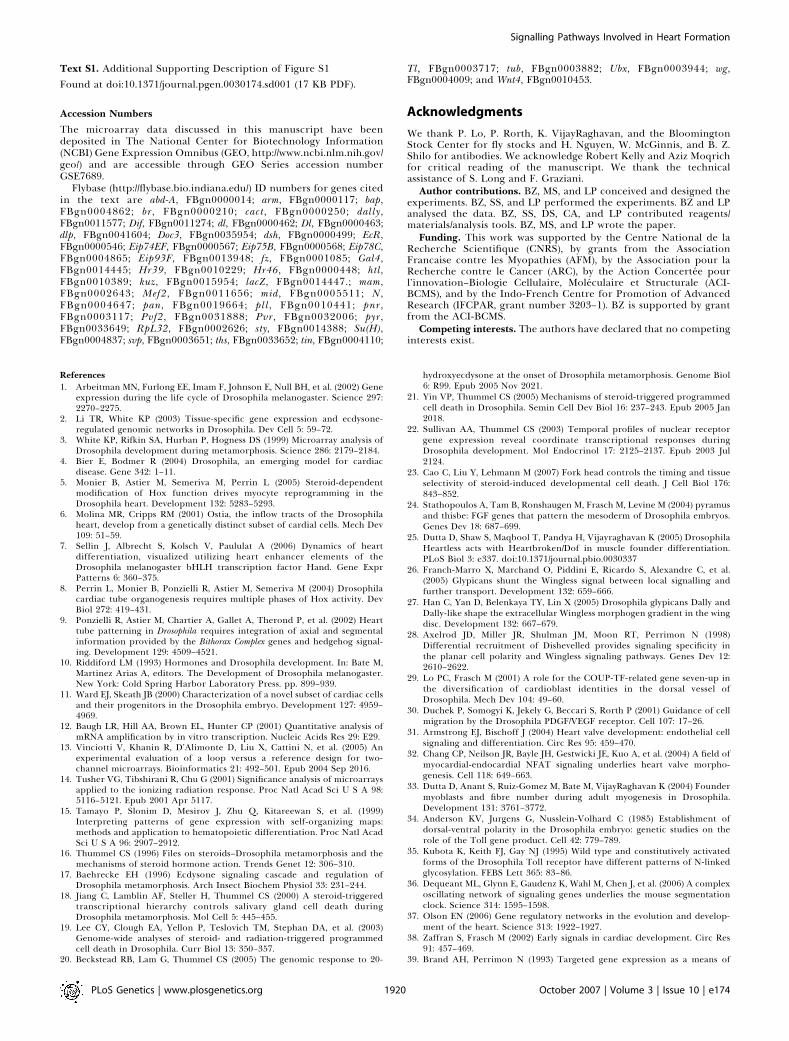
Figure 7. The Wnt Pathway Is Required for Inflow Tract Formation and Proper Remodelling of Contractile Cardiac Myocytes
(A–D) Gal80ts, 24B.Gal4; UAS.dTCFDN adult cardiac tube stained for F-actin (phalloidin: A and B) and against dMef2 (C). (A) Downregulation of theWnt pathway leads to a thinner cardiac tube compared to wild type (Compare with 6A). Segment boundaries are tentatively indicated with respect toabdominal longitudinal muscles (asterisks). (B–D) Myofibrils of both inflow tract–forming cells (arrowheads) and contractile cardiac myocytes (arrows)are longitudinal after Wnt pathway knockdown and look like wild-type terminal chamber myocytes (compare with Figure 6E–6G). The absence ofventral imaginal muscles was also observed after dTCFDN expression with the Hand.Gal4 driver (Figure S4) and NP5169.Gal4 driver (unpublisheddata), whose expression is restricted to cardiac myocytes [5], which indicates that this effect is secondary to the modification of cardiac myocyteremodelling.(E–G) Same wild-type A2/A3 segment boundary as Figure 6B–6D, in which confocal sections corresponding to the ventral muscle have been removedto illustrate the transversal orientation of wild-type cardiac myocyte myofibrils. Scale bars: 50 lm.doi:10.1371/journal.pgen.0030174.g007
PLoS Genetics | www.plosgenetics.org October 2007 | Volume 3 | Issue 10 | e1741915
Signalling Pathways Involved in Heart Formation
and Dorsal-related immunity factor (Dif) was observed from 36/42h APF onward (Figure 5C). Genetic manipulation of thepathway, however, failed to reveal any function for the Tollpathway during the remodelling. Downregulation with atemperature-sensitive combination of Tl mutant alleles [34]or, conversely, Toll pathway activation by overexpressing aconstitutively activated form (Toll10B) [35] in cardiomyocytesdid not visibly affect adult heart formation (Figure S7). TheToll pathway thus appears not to be required for itsremodelling but might rather be involved subsequently forestablishment and/or maintenance of its function. Theseparameters have not been analysed in this study.
Discussion
An important challenge in understanding the mechanismsthat govern the formation of a specific organ is to decipherthe complex and dynamic genetic programs exhibited by theconstituent cell types. Here, we integrated genomic andreverse genetic analysis to comprehensively determine themolecular pathways that participate in Drosophila adult heartformation. Importantly, many of our conclusions could onlybe drawn by examining the large datasets of heart-specific
gene-expression changes that occur during heart metamor-phosis.One of the major outcomes of our genome-wide tran-
scriptome profiling approach is that changes in geneexpression can be taken as indicative of the cellular eventsoccurring during the process of interest. When applied withdense sampling of time-points during the complete organo-genesis of a single tissue, the cardiac tube, this strategy led tothe identification of many batteries of genes involvedsequentially in this tissue-specific event. Substantial knowl-edge has been gained with respect to PCD, ecdysone signal-ling cascade, metabolism, and physiological pathwaysinvolved. Surprisingly, we showed here that signalling path-way components were subjected to transcriptional regulation,suggesting that activation and/or repression of these pathwayscould, at least in part, rely on the transcriptional control ofsome of their components. In this line, a recent tran-scriptome analysis has clearly demonstrated that transcrip-tional oscillation of a few signalling pathways underlies thevertebrate segmentation clock [36]. The oscillating geneswere, however, found to be mainly targets of the signallingpathways instead of the integral components (receptors,ligands, nuclear effectors) of the pathways found in the
Figure 8. The PDGF-VEGF Receptor Function Is Required for Adult Valve Formation
(A) Pvr expression pattern during heart remodelling. Anti-Pvr staining of a 42 h APF cardiac tube. Pvr is expressed in one pair of myocytes in segmentsA2 to A4 (arrows) but is not expressed in segments A1 and A5. Segment boundaries are indicated according to inflow tract localisations (arrowheads).(B–J) Staining for filamentous Actin (B, E, and H), b-Gal (C, F, and I), and merge images (D, G, and J) of Gal80ts, 24B.Gal4; TinCD5.LacZ /þ (B–D);Gal80ts, 24B.Gal4; TinCD5.LacZ / UAS.PvrDN (E–G) and Gal80ts, 24B.Gal4; TinCD5.LacZ / UAS.Pvrk (H–J) adult cardiac tubes. Ventral imaginalmuscles are not affected by manipulating Pvr function and were not selected from confocal stacks to allow a better visualization of the cardiomyocytephenotypes. Details of segment A3 (B–D and E–G) and segment A4 (H–J).(B–D) In the wild type, valve-forming cells (arrows) are characterized by increased myofibrillar contents (B) and high levels of b-Gal expression in theTinCD5.LacZ line (C, see Figure S5 for details regarding TinCD5.LacZ expression). Arrowheads point to inflow tract.(E–G) Inhibition of Pvr function by overexpression of the PvrDN variant partially inhibits valve formation, as illustrated by reduced increased ofmyofibrillar contents (E) and low level of b-Gal expression in one of the two valve forming cells (F, asterisk).(H–J) Ectopic expression of constitutive Pvr (Pvrk) induces ectopic valve formation, as illustrated by ectopic b-Gal expression (I, asterisk) andconcomitant increase of myofibrils content (H, asterisk).Note that Pvr functional modifications do not affect the remodelling of other cardiac myocytes, including the formation of inflow tract (arrowheads inE–J). Scale bars: 50 lm.doi:10.1371/journal.pgen.0030174.g008
PLoS Genetics | www.plosgenetics.org October 2007 | Volume 3 | Issue 10 | e1741916
Signalling Pathways Involved in Heart Formation
present study. Candidate signalling pathways were thereforeselected here on the basis of the timely ordered expression ofkey factors components. This strategy proved to be highlyeffective and pointed to specific signalling pathways whoseimplication during heart remodelling was subsequentlygenetically evaluated.
Of note, the main features of adult heart organogenesisinclude segment A6 and A7 myocyte PCD, segment A5myocyte trans-differentiation to form the adult terminalchamber, inflow tract and valve differentiation in segmentsA1 to A4, and development of a syncytial muscle sheet on theventral side of the organ. Importantly, significant insightshave been gained for each of these processes, emphasizingthat our combination of positional (tissue specific) andtemporal genome-wide expression survey allows for asubstantial molecular understanding of heart organogenesis.Subsequent experiments will analyse the consequences ofperturbations of the implicated signalling pathways upon thedynamics of gene expression profiling in order to identifypotential targets of these pathways.
Evolutionarily conserved transcription factors drive car-diac development in both Drosophila and vertebrates [37,38],suggesting that downstream genetic networks responsible forheart organogenesis might, at least partially, be conserved.Our results may as well designate conserved signallingpathways as playing similar functions in mammals. In supportof this, the VEGF pathway is required for valve formation inmammals [32], and we demonstrated that the PDGF-VEGFfly’s pathway has analogous function. Valves are, however,formed by different cellular processes in flies and mammals,and it will be important to evaluate whether the immediatedownstream events directed by this particular pathway areconserved in both phyla.
Materials and Methods
Drosophila strains. UAS.PvrDN and UAS.Pvrk were obtainedfrom P. Rorth, dsRNA.Htl from K. VijayRaghavan, UAS.Dsh-Dixfrom J. Axelrod, UAS.Toll10B [35], Tll mutants (Tl r144, Tl 9QURE,Tl 1rxa, Tl r632) [34], TinCD5.LacZ [29]. The following lines wereobtained from the Bloomington Drosophila Stock Centre: Nts,dsRNA.N , UAS.abd-A , UAS.armS10 , UAS.HtlDN, andUAS.dTCFDN. GAL4 drivers were: 24B.Gal4 [39], NP5169.Gal4(obtained from the Gal4 Enhancer Trap Insertion Database (http://flymap.lab.nig.ac.jp/;dclust/getdb.html) and Hand.Gal4 (generousgift from A. Paululat). The P(tub-GAL80[ts]), was obtained from theBloomington Drosophila Stock Center.
Timing of pupal development and cardiac tube dissections. Onsetof pupal development corresponds to white pupae that were selectedon the basis of spiracle eversion, absence of reaction followingforceps contact, and absence of tanning. Individuals were kept forfurther development in an air incubator at 25 8C.
Cardiac tubes were hand dissected from staged individuals. Foreach time-point sample, five cardiac tubes were dissected and storedat �80 8C in 300 ll of TRIzol solution prior to total RNA isolation.Four samples of five cardiac tubes each were generated for each time-point in order to generate the four biological replicates.
RNA amplification and hybridization. Dissected cardiac tubes werecollected in 300 ll of TRIzol and extracted according to Baugh et al[12]. Isolated total RNA (;100 ng) was amplified with the Amino AllylMessageAmp II aRNA Amplification Kit (Ambion) based on the RNAamplification protocol developed by Van Gelder et al [40]. The aRNAprocedure begins with total RNA that is reverse transcribed using anoligo(dT) primer containing a T7 RNA polymerase promotersequence. The reaction is treated with RNase H to cleave the mRNAinto small fragments. These small RNA fragments serve as primersduring the second-strand synthesis reaction, producing a double-stranded cDNA template for T7 in vitro transcription. This RNA wassubjected to a second round of amplification with a second in vitro
transcription reaction configured to incorporate the modifiednucleotide (amino allyl UTP) into the aRNA during transcriptionfor subsequent indirect labelling with fluorescent dyes Cy3 and Cy5.Dye-swap replications, in which each hybridization is done twice, withdye assignments reversed in the second hybridization, are usedaccording to the experimental loop-design [41] shown in Figure 1B.In the case of eight sampling points in a time-series experiment [42], asimple loop-design is more efficient because it implies a smallvariance for log ratios and balancing varieties with dye-swapping.One of the main advantages of this design is to allow technicalreplicates, thereby eliminating variations that might result fromdifferences in fluorescence dye intensities. In addition, this methodallows direct comparisons of successive time-points via a chain ofconditions, thereby removing the need for a reference sample of nointrinsic interest in our time-course analysis. To guarantee thesignificance of the expression variations, this loop-design microarrayexperiment was done four times with four independent biologicalreplicates.
Cy3- and Cy5-labelled aRNA samples were mixed in equalproportions and fragmented with the RNA Fragmentation Reagents(Ambion) to enhance aRNA hybridization, and hybridized on INDAChigh-density oligonucleotide microarrays that contained 18,240 spotswith long oligomers designed by the International Drosophila ArrayConsortium (http://www.flychip.org.uk/services/core/FL002/) repre-senting 14,444 different genes. After these competitive hybridizations(using Lucidea SlidePro Hybridizer), the slides are imaged using thescanner Axon Instruments 4200AL and fluorescence measurementsare made separately for each dye at each spot on the arrays usingArray Vision quantification software (Imaging Research Inc). 32 slides(eight for each biological replicate) were used in this study.
Statistical analysis of microarray data. Normalization of primaryexpression data was performed through two successive steps usingboth R software packages [43] SMA [44,45] and LIMMA [46]: Lowessnormalization to normalize the M-values for each array separately(within-array normalization) without prior background correction,and quantile normalization to the A-values, making the densitydistributions the same across arrays to compare expression inten-sities between them (between-array normalization). Normalizedexpression values were averaged through Cy3 and Cy5 signalintensities according to dye-swap replications (see loop-design inFigure 1B) to assign only one expression value for each biologicalreplicate.
Microarray data were filtered for detectable expression level.Elements whose level of expression is lower or equal to thebackground control cut-off, defined as twice the average of theexpression levels of negative controls spotted on the array, wereexcluded from further analysis. A total of 4,853 displayed expressionabove this cut-off. A modified t-statistic method SAM [14] in amulticlass response format was used to identify genes with statisticallysignificant changes in gene expression, relative to the standarddeviation of repeated measurements across the time-course stages.Predicted false discovery rate of 5% was used as the threshold fordifferential expression, leading to 2,394 genes that exhibitedsignificant differential expression between time-points. The finaldataset comprises 1,660 genes and was generated by using the medianexpression value for each time-point on biological replicates and byselecting only genes with at least 1.8 fold-change in expression level inat least one condition through the expression kinetic analysis.
Clustering analyses were performed by the SOM method [15] withan initial 83 8 geometry of nodes using EXPANDER 2.0 software [47]from http://acgt.cs.tau.ac.il/expander/ after gene standardizationprocessing (mean ¼ 0, variance ¼ 1). By this procedure, we obtained64 expression classes. These were further clustered by hierarchicalclustering of predictor genes specific of each SOM class to get 13significant distinct clusters. By this procedure, 99.4% of the 1660genes dataset were assigned to one cluster. The extracted datasetswere visualized either by their expression profiles with EXCELsoftware or by their expression matrices with TreeView software [48](Figure 2).
The identification of statistically relevant over-represented GOterms in our gene clustering datasets was performed by usingGOToolBox software [49] from http://crfb.univ-mrs.fr/GOToolBox.All significant enriched GO terms in the whole BP hierarchy wereanalysed and their description was further restricted to BPannotation levels 4 to 6 to avoid the excessively detailed terms ofthe lower hierarchy levels as well as the poorly defined terms presentin higher levels. In Figure 4, only cluster-enriched GO functions witha stringent p-value cut-off of 10�3 were considered. In the detailedFigure S1, the enrichment p-value cut-off was set to 5.10�2 and theannotation levels considered extended to level 8 but only the GO
PLoS Genetics | www.plosgenetics.org October 2007 | Volume 3 | Issue 10 | e1741917
Signalling Pathways Involved in Heart Formation
terms hierarchically connected to the ones selected in Figure 4 wereretained.
Gene expression data comparisons were made between ourmicroarray dataset and previously published microarray datasetsusing statistic package of R software. Each published gene list wassplit into genes that are either upregulated or downregulated,represented by up or down arrows in Table S3, and compared toexpression clusters of genes with a 1.8-fold cut-off from ourmicroarray data analysis. Enrichment p-values were based on a testfollowing the hypergeometric distribution.
Selection of the signalling pathways analysed by reverse genetics. Alist of genes encoding the most important components (receptor/ligand/nuclear effector) of all known receptor linked signallingpathways was established. A first gene list was generated from GOannotations of each particular signalling pathway. This gene list wasthen mainly pruned by the biochemical pathways described in TheInteractive Fly (http://flybase.bio.indiana.edu/) resource, and eachgene was further analysed for its signalling function in using theFlybase website. KEGG (http://www.genome.jp/kegg/) database was alsoused to check and complete the data. The final gene set was thenimplemented with the transcriptome data from the temporal map ofgene expression and exposed in Table S4. For each signallingpathway, expression of the receptor was considered as an absoluteprerequisite (EGF, Insulin, and Torso receptor signalling pathwayswere directly eliminated by this filtering step). However, if diffusible,the detection of ligand expression was not considered as absolutenecessity. Then, in the remaining list, only signalling pathways thatdisplayed dynamic and timely ordered expression of their regulatedkey genes, with at least two of the following components such as thereceptor, the ligand or nuclear effectors, were selected. Decapenta-plegic, Hedgehog, JNK and JAK/STAT pathways were eliminated atthis last selection step.
The final regulated components dataset of selected pathways,including FGF, Notch, Toll, PDGF-VEGF and Wnt pathways, werefurther analysed for their expression regulation during heartremodelling (an associated expression matrix was constructed andis presented in Figure 5C), and their potential involvement duringcardiac tube metamorphosis was then analysed by reverse genetics.
RQ-PCR. Microarray results were confirmed with RQ-PCR toverify the expression data results. For all the expression clusters, atleast one differentially expressed gene has been tested in RQ-PCRanalysis. cDNA was synthesized from 500 ng of amplified RNA fromthe first round of T7 linear RNA amplification from microarrayexperiments, using random hexamers and Superscript II reverse-transcriptase (Invitrogen).
The design of primers for each gene was done using PrimerExpress software (ABI), and validated for their gene specificity by anagarose gel electrophoresis and by the associated derivative meltingcurve profile. RQ-PCR analyses for selected genes were performedusing the qPCR Core kit for SYBR Green I (Eurogentech) and startingwith 1 ng of cDNA in a 25-ll PCR on an ABI PRISM 7000 SDS(Applied Biosystems) according to the manufacturer’s instructions.For each gene-specific RQ-PCR experiment, serially diluted cDNApreparations (made by reverse-transcription of pooled aRNA samplesrepresenting all chosen stages of the expression kinetic) were used toconstruct a standard curve to quantify the eight test samples as well asthe PCR efficiency according to the Relative Standard Curve Methodfor relative quantification. Ribosomal protein L32 (RP49) amplifica-tions were used as endogenous control for normalization, and thefirst time-point (21 h APF) was chosen as calibrator for comparingresults. The relative quantification for any given gene with respect ofthe calibrator was determined and compared with the normalizedexpression values resulting from microarray experiments.
Control of Gal4 induction. In order to prevent UAS activationbefore the pupal stage, we used the TARGET system to control GAL4activity [50]. UAS and P(tub-GAL80[ts]) transgenes were combined inthe same lines and then crossed with the 24B.Gal4 which isexpressed in all myocytes [39] or with NP5169.Gal4 or Hand.Gal4lines whose expression is restricted to cardiac myocytes [5]. Develop-ment was allowed to proceed at 22 8C until late third instar larvalstage and individuals were then shifted to restrictive temperature (298C), thus inactivating GAL80 and consequently allowing Gal4 activity.
Antibody and phalloidin staining. Dissections and stainingprocedures were done as described in Monier et al, 2005 [5]. Thefollowing primary antibodies were used: mouse anti-b-galactosidase(Promega), 1:50; rabbit anti-D-Mef2 [51], 1:1000; mouse anti-Abd-A[52] (6A8.12), 1:500; anti-Pvr [53], 1:500. Observations and photo-graphs were done under either an Axiophot Zeiss microscope or aBioRad confocal microscope.
Supporting Information
Figure S1. Dynamics of Enriched GO Terms during Adult HeartFormation Expression Kinetic
Enrichment of GO terms for annotated genes in each expressioncluster. The functional terms listed here are those significantlyoverrepresented in at least one expression cluster according to thewhole BP hierarchy in GO controlled vocabulary. Only GOannotation levels 4 to 8 were further selected and the enrichmentp-value cut-off was 5.10�2. The enrichment significance is symbolizedby a color code with the associated number of annotated genes withinthe cluster: cells in red correspond to an enrichment p-value , 10�6,in blue to a p-value , 10�4, and in grey to a p-value , 5.10�2 (seeTable S2 for enrichment p-value details). See Text S1 for additionalsupporting description of overrepresented biological functions. GOID, Gene Ontology identification number; GO Lv, Gene Ontologylevel.
Found at doi:10.1371/journal.pgen.0030174.sg001 (638 KB TIF).
Figure S2. Gene Expression Batteries
From the array data, the expression profile of selected function-specific genes was clustered. Most of the genes involved in the samebiological process display similar expression patterns.(A) Expression patterns of genes annotated ‘‘Muscle development’’ or‘‘Muscle contraction.’’(B) Genes involved in tricarboxylic acid cycle metabolism.(C) Genes of the proteasome complex.(D) Coordinated expression of mitochondrial ribosomal protein–encoding genes (mRP).(E) Genes annotated ‘‘Oxidative phosphorylation.’’(F) Differential expression of extracellular matrix components.(G) Expression patterns of genes involved in fatty acid metabolism.Expression values in gene rows in each panel were mean centred andvariance normalized.According to the color scale, red indicated increase transcript levels,whereas green indicate decreased levels in a stage compared with theothers.
Found at doi:10.1371/journal.pgen.0030174.sg002 (1.1 MB TIF).
Figure S3. Expression Dynamics of Transcription Factors andRegulators
Transcription factors dynamically expressed during the heartremodelling process. The first column corresponds to the expressionmatrix specifically constructed from transcription factors signifi-cantly regulated during heart metamorphosis. Associated expressionfold changes and functional annotations (GO biological processes,Human orthologous genes, proteins domains, and gene comments)are indicated, when applicable. Selected overrepresented biologicalfunctions among these transcription factors are indicated (under-lined). These include nuclear receptor superfamily members closelylinked to the ecdysone response (Eip74EF, Eip75B, Hr39, Hr46, etc.),chromatin remodelling encoding factors, and those already known tobe involved in embryonic heart development. This latter classcomprise homeotic genes abd-A and Abd-B, whose transcript levelsmainly decrease in accordance with the histolysis of the most caudalcells of larval heart, cardiogenic genes midline (mid), pannier (pnr), andbagpipe (bap), which display transient overexpression changes around30 h APF, and also Myocyte enhancing factor 2 (Mef2) and Dorscross3(Doc3), both upregulated late and possibly involved in late aspects ofadult heart differentiation. HS, Homo sapiens, FC, fold-change.Found at doi:10.1371/journal.pgen.0030174.sg003 (1.4 MB TIF).
Figure S4. RNAi-Mediated Downregulation of htl Function and Cell-Autonomous Effects of Wnt Pathway Manipulation
Adult hearts stained for polymerised actin (phalloidin staining of F-actin).(A) Ventral view of wild-type adult heart. Segments are indicated,based on the localization of the inflow tract and of the abdominallongitudinal muscles (asterisks).(B, C) Downregulation of htl function by dsRNA.Htl, driven in thesomatic muscles and cardiac muscles by the 24B.Gal4 driver,prevents abdominal imaginal muscle formation, including the cardiacventral muscle. (C) Detail of A3/A4 segment boundary.(D, E) Cardiac myocyte specific downregulation of the Wnt pathwayby driving dTCFDN with the Hand.Gal4 driver leads to a thinnercardiac tube compared to wild type (arrows in D) and longitudinalorientation of the myofibrils (E).(F) Ectopic expression of a dominant negative variant of the dsh
PLoS Genetics | www.plosgenetics.org October 2007 | Volume 3 | Issue 10 | e1741918
Signalling Pathways Involved in Heart Formation
protein that specifically affects the canonical Wnt pathway (Dsh-DIX)induces similar defects, including thinning of the cardiac tube andlongitudinal orientation of the myofibrils. Scale bars: 50 lm.
Found at doi:10.1371/journal.pgen.0030174.sg004 (3.4 MB TIF).
Figure S5. The Wnt Signalling Pathway Is Involved in TerminalChamber and Inflow Tract Formation
(A–J) Activated Wnt signalling pathway inhibits terminal chamberformation without affecting abd-A expression. (A and B) ActivatedWnt pathway prevents terminal chamber formation. Phalloidinstaining of F-actin in Gal80ts, 24B.Gal4; þ (A) and Gal80ts,24B.Gal4; UAS.armS10 (B) adult cardiac tube segments A5. (A) Inthe wild type, terminal chamber myofibrils are longitudinal (arrow),consecutive to the transdifferentiation of larval A5 segment myocytes[5]. (B) Ectopic expression of activated b-catenin homologue (armS10)does not affect the general morphology of the adult heart(unpublished data) but specifically affects the formation of theterminal chamber, the A5 segment cardiomyocytes retaining theirtransverse orientation (arrow). Asterisks in (B) indicate abdominaladult muscles.(C–J) While inhibiting terminal chamber formation, activated Wntpathway does not affect abd-A expression. Segment A5 ofNP5169.Gal4; þ (C–F) and NP5169.Gal4; UAS.armS10 (G–J)Phalloidin staining of F-actin ([C–G], arrows point to A5 myocytesand asterisk to abdominal adult muscles), anti-Abd-A staining (D–H) and anti-Mef2 staining (E–I). In the wild type, abd-A is expressedin all terminal chamber myocytes (arrowheads) and is not expressedin more anterior cells (arrows point to A5 ostia cells). Activated b-catenin ectopic expression prevents terminal chamber differ-entiation (arrow in [G]) but does not affect abd-A expression(arrowheads in [H] and [I] point to abd-A expressing cells [H], arrowspoint to more anterior cells that do not express abd-A but doexpress Mef2 [I]).(K–U) TinCD5.LacZ expression pattern and Wnt signalling pathwayphenotypes in the adult cardiac tube (K–M) TinCD5.LacZ expressionin the adult heart. Phalloidin staining of F-actin (K) and anti b-Galstaining (L) of a TincD5.LacZ adult heart (M) merge. A1 segment isnot shown here, segments boundaries are based on inflow tractlocations. b-Gal is expressed in all A1–A4 myocytes, and within thesesegments is enriched in inflow tract cells (arrows) and in valvesforming cells (asterisks). No b-Gal is detected in the terminal chamber(A5, arrowheads).(N–U) Inactivation of the Wnt pathway induces ectopic terminalchamber formation in A1–A4 segments and prevents inflow tractformation. Detailed A2/A3 segment boundary of Gal80ts, 24B.Gal4;TinCD5.LacZ/þ (N–Q) and Gal80ts, 24B.Gal4; TinCD5.LacZ/UAS.dTCFDN (R–U) adult hearts. Phalloidin staining of F-actin (N,R), anti-b-Gal staining (O, S), and anti-Mef2 staining (P–T). (N–Q) Insegments anterior to A5, all contractile cardiomyocytes (arrowheads)are characterized by transversally orientated myofibrils (N),TinCD5.LacZ driven b-Gal expression (O) and large nuclei size (P).Inflow tracts (arrows) are characterized by the particular arrange-ment of myofibrils (N) and the small size of the myocyte nuclei (P).The ventral imaginal muscles are not shown. (R–U) Inhibition of theWnt pathway transforms contractile myocytes (arrowheads in T) intoterminal chamber like myocytes, based on the longitudinal orienta-tion of the myofibrils (R) and the marked reduction of TinCD5.LacZdriven b-Gal expression (S). Overexpression of the dominant negativevariant of the LEF/dTCF transcription factor also prevents inflowtract formation (T, arrows), as shown by the absence of characteristicmyofibril organization (R, arrows). Scale bars: 50 lm.
Found at doi:10.1371/journal.pgen.0030174.sg005 (5.8 MB TIF).
Figure S6. Notch Inhibition Affects Ventral Imaginal MuscleFormation
Adult hearts stained for polymerised actin (phalloidin staining of F-actin). Compared to wild type (A), Notch downregulation (24B.Gal4;dsRNA.N [B] and Nts1 [C]) induces ventral muscle elongation defects(ventral syncytial muscle fibres extend up to A4 segment in wild type,while most of the fibres arrest in A2 or A3 after Notch down-regulation (arrows), see also F). Notch downregulation also impairsmyofibrils differentiation in ventral imaginal muscles, as seen afterphalloidin staining, which reveals disorganized or missing sarcomeres(asterisks in B and G). (D) Heart-specific downregulation of Notch(Hand.Gal4; dsRNA.N) does not induce cardiac tube defects,suggesting a nonautonomous effect of Notch on cardiac myocytedifferentiation in B and C. (E, F) Ventral view of A2/A3 segmentboundary in wild type (E) and Nts1 (F). While ventral imaginal musclesextend up to A4 segment in wild type, Notch inhibition causes
shortening of these fibres. (G) Ventral view of A2 segment in24B.Gal4; dsRNA.N individual illustrating sarcomeric organizationdefects (asterisks point to missing F-actin staining). Scale bars: 50 lm.
Found at doi:10.1371/journal.pgen.0030174.sg006 (2.8 MB TIF).
Figure S7. Modification of the Toll Signaling Pathway Function DoesNot Affect Cardiac Tube Remodelling
Phalloidin staining of F-actin in (A) wild-type and (B) 24B.Gal4;UAS.Toll10B adult hearts. Constitutive activation of the Tollpathway does not affect adult heart formation, but affects abdominalimaginal muscle development, inducing either growth defects oflongitudinal muscles (B, asterisks) or loss of transverse muscles(arrows in A). Scale bars: 50 lm.
Found at doi:10.1371/journal.pgen.0030174.sg007 (1.4B TIF).
Table S1. Genes Significantly Deregulated during Heart Metamor-phosis
Clustered expression data matrix of the 1,660 genes whose transcriptlevels changed significantly during adult heart organogenesis. Thisfinal dataset of normalized log2 expression values contains all thegenes selected for subsequent analysis.
Found at doi:10.1371/journal.pgen.0030174.st001 (520 KB XLS).
Table S2. Detailed Overrepresented GO Terms and AssociatedSignificant Enrichment p-Values
By using the GOToolBox software [49], statistic data were calculatedon the basis of the number of BP-annotated genes in the wholegenome with a test following the hypergeometric distribution.Biological processes marked by an asterisk refer to functionshighlighted in Figure 4. GO ID, Gene Ontology identificationnumber; GO Lv, Gene Ontology level; GC, genome set count; GF,genome set frequency; MC, microarray dataset count; MF, microarraydataset frequency
Found at doi:10.1371/journal.pgen.0030174.st002(36B XLS).
Table S3. Comparison of the Heart Remodelling Transcriptional Mapwith Other Transcriptome Studies of Ecdysone-Regulated Processes
Heart remodelling expression data were compared with gene setsfrom three microarray studies that examined ecdysone-regulatedbiological responses: EcR-dependent genes that are regulated duringthe onset of midgut metamorphosis [2], ecdysone-induced larvalsalivary gland cell death [19], or genes regulated by ecdysone incultured larval tissues and dependent on EcR function in vivo [20].Expression cluster groups (1–5: early expressed genes, 6–7: transientlyup-regulated genes, 8–12: late expressed genes, and 13: transientlyrepressed genes) were compared with upregulated or downregulatedgene sets of published microarray studies. The number of genes ineach dataset is represented by ‘‘(n¼).’’ The first number in each cellrepresents the number of overlapping genes between the two datasetsbeing compared. The numbers within parenthesis in each cellrepresent an enrichment p-value based on a test following thehypergeometric distribution. High significant p-values (,E�10) aremarked by an asterisk. Up- and down-pointing arrows schematize theup- and down-regulated genes sets, respectively.
Found at doi:10.1371/journal.pgen.0030174.st003(14B XLS).
Table S4. Expression Profiles of Signalling Pathway ComponentsEncoding Genes during Adult Heart Organogenesis
This table depicts genes encoding the core components of allreceptor-linked signalling pathways and their expression regulationas revealed by the transcriptome profiling. Key components of allknown cell surface receptor linked signalling pathways were collectedand listed (see Materials and Methods). Each gene is characterized byits expression level (‘‘Signal’’ column), a plus sign (þ) indicatessignificant detectable expression,þ/� denotes expression level that isslight but greater than background control, and a minus sign (�)indicates undetectable expression. If the gene is significantly differ-entially expressed during adult heart formation according to thestatistical microarray analysis (‘‘SAM 5%’’ column), its globalexpression profile (Profile column, up- and down-pointing arrowsschematize the up- and down-regulated genes sets, respectively), itsassociated fold-change (FC column), and its belonging expressioncluster (Cluster column) are indicated. Finally, a brief functionaldescription of the genes is indicated. ND, not determined (notpresent in the array).
Found at doi:10.1371/journal.pgen.0030174.st004(35 KB XLS).
PLoS Genetics | www.plosgenetics.org October 2007 | Volume 3 | Issue 10 | e1741919
Signalling Pathways Involved in Heart Formation
Text S1. Additional Supporting Description of Figure S1
Found at doi:10.1371/journal.pgen.0030174.sd001 (17 KB PDF).
Accession Numbers
The microarray data discussed in this manuscript have beendeposited in The National Center for Biotechnology Information(NCBI) Gene Expression Omnibus (GEO, http://www.ncbi.nlm.nih.gov/geo/) and are accessible through GEO Series accession numberGSE7689.
Flybase (http://flybase.bio.indiana.edu/) ID numbers for genes citedin the text are abd-A, FBgn0000014; arm, FBgn0000117; bap,FBgn0004862; br , FBgn0000210; cact, FBgn0000250; dally ,FBgn0011577; Dif, FBgn0011274; dl, FBgn0000462; Dl, FBgn0000463;dlp, FBgn0041604; Doc3, FBgn0035954; dsh, FBgn0000499; EcR,FBgn0000546; Eip74EF, FBgn0000567; Eip75B, FBgn0000568; Eip78C,FBgn0004865; Eip93F, FBgn0013948; fz, FBgn0001085; Gal4,FBgn0014445; Hr39, FBgn0010229; Hr46, FBgn0000448; htl,FBgn0010389; kuz, FBgn0015954; lacZ, FBgn0014447.; mam,FBgn0002643; Mef2 , FBgn0011656; mid , FBgn0005511; N ,FBgn0004647; pan , FBgn0019664; pll , FBgn0010441; pnr ,FBgn0003117; Pvf2, FBgn0031888; Pvr, FBgn0032006; pyr,FBgn0033649; RpL32, FBgn0002626; sty, FBgn0014388; Su(H),FBgn0004837; svp, FBgn0003651; ths, FBgn0033652; tin, FBgn0004110;
Tl, FBgn0003717; tub, FBgn0003882; Ubx, FBgn0003944; wg,FBgn0004009; and Wnt4, FBgn0010453.
Acknowledgments
We thank P. Lo, P. Rorth, K. VijayRaghavan, and the BloomingtonStock Center for fly stocks and H. Nguyen, W. McGinnis, and B. Z.Shilo for antibodies. We acknowledge Robert Kelly and Aziz Moqrichfor critical reading of the manuscript. We thank the technicalassistance of S. Long and F. Graziani.
Author contributions. BZ, MS, and LP conceived and designed theexperiments. BZ, SS, and LP performed the experiments. BZ and LPanalysed the data. BZ, SS, DS, CA, and LP contributed reagents/materials/analysis tools. BZ, MS, and LP wrote the paper.
Funding. This work was supported by the Centre National de laRecherche Scientifique (CNRS), by grants from the AssociationFrancaise contre les Myopathies (AFM), by the Association pour laRecherche contre le Cancer (ARC), by the Action Concertee pourl’innovation–Biologie Cellulaire, Moleculaire et Structurale (ACI-BCMS), and by the Indo-French Centre for Promotion of AdvancedResearch (IFCPAR, grant number 3203–1). BZ is supported by grantfrom the ACI-BCMS.
Competing interests. The authors have declared that no competinginterests exist.
References1. Arbeitman MN, Furlong EE, Imam F, Johnson E, Null BH, et al. (2002) Gene
expression during the life cycle of Drosophila melanogaster. Science 297:2270–2275.
2. Li TR, White KP (2003) Tissue-specific gene expression and ecdysone-regulated genomic networks in Drosophila. Dev Cell 5: 59–72.
3. White KP, Rifkin SA, Hurban P, Hogness DS (1999) Microarray analysis ofDrosophila development during metamorphosis. Science 286: 2179–2184.
4. Bier E, Bodmer R (2004) Drosophila, an emerging model for cardiacdisease. Gene 342: 1–11.
5. Monier B, Astier M, Semeriva M, Perrin L (2005) Steroid-dependentmodification of Hox function drives myocyte reprogramming in theDrosophila heart. Development 132: 5283–5293.
6. Molina MR, Cripps RM (2001) Ostia, the inflow tracts of the Drosophilaheart, develop from a genetically distinct subset of cardial cells. Mech Dev109: 51–59.
7. Sellin J, Albrecht S, Kolsch V, Paululat A (2006) Dynamics of heartdifferentiation, visualized utilizing heart enhancer elements of theDrosophila melanogaster bHLH transcription factor Hand. Gene ExprPatterns 6: 360–375.
8. Perrin L, Monier B, Ponzielli R, Astier M, Semeriva M (2004) Drosophilacardiac tube organogenesis requires multiple phases of Hox activity. DevBiol 272: 419–431.
9. Ponzielli R, Astier M, Chartier A, Gallet A, Therond P, et al. (2002) Hearttube patterning in Drosophila requires integration of axial and segmentalinformation provided by the Bithorax Complex genes and hedgehog signal-ing. Development 129: 4509–4521.
10. Riddiford LM (1993) Hormones and Drosophila development. In: Bate M,Martinez Arias A, editors. The Development of Drosophila melanogaster.New York: Cold Spring Harbor Laboratory Press. pp. 899–939.
11. Ward EJ, Skeath JB (2000) Characterization of a novel subset of cardiac cellsand their progenitors in the Drosophila embryo. Development 127: 4959–4969.
12. Baugh LR, Hill AA, Brown EL, Hunter CP (2001) Quantitative analysis ofmRNA amplification by in vitro transcription. Nucleic Acids Res 29: E29.
13. Vinciotti V, Khanin R, D’Alimonte D, Liu X, Cattini N, et al. (2005) Anexperimental evaluation of a loop versus a reference design for two-channel microarrays. Bioinformatics 21: 492–501. Epub 2004 Sep 2016.
14. Tusher VG, Tibshirani R, Chu G (2001) Significance analysis of microarraysapplied to the ionizing radiation response. Proc Natl Acad Sci U S A 98:5116–5121. Epub 2001 Apr 5117.
15. Tamayo P, Slonim D, Mesirov J, Zhu Q, Kitareewan S, et al. (1999)Interpreting patterns of gene expression with self-organizing maps:methods and application to hematopoietic differentiation. Proc Natl AcadSci U S A 96: 2907–2912.
16. Thummel CS (1996) Files on steroids–Drosophila metamorphosis and themechanisms of steroid hormone action. Trends Genet 12: 306–310.
17. Baehrecke EH (1996) Ecdysone signaling cascade and regulation ofDrosophila metamorphosis. Arch Insect Biochem Physiol 33: 231–244.
18. Jiang C, Lamblin AF, Steller H, Thummel CS (2000) A steroid-triggeredtranscriptional hierarchy controls salivary gland cell death duringDrosophila metamorphosis. Mol Cell 5: 445–455.
19. Lee CY, Clough EA, Yellon P, Teslovich TM, Stephan DA, et al. (2003)Genome-wide analyses of steroid- and radiation-triggered programmedcell death in Drosophila. Curr Biol 13: 350–357.
20. Beckstead RB, Lam G, Thummel CS (2005) The genomic response to 20-
hydroxyecdysone at the onset of Drosophila metamorphosis. Genome Biol6: R99. Epub 2005 Nov 2021.
21. Yin VP, Thummel CS (2005) Mechanisms of steroid-triggered programmedcell death in Drosophila. Semin Cell Dev Biol 16: 237–243. Epub 2005 Jan2018.
22. Sullivan AA, Thummel CS (2003) Temporal profiles of nuclear receptorgene expression reveal coordinate transcriptional responses duringDrosophila development. Mol Endocrinol 17: 2125–2137. Epub 2003 Jul2124.
23. Cao C, Liu Y, Lehmann M (2007) Fork head controls the timing and tissueselectivity of steroid-induced developmental cell death. J Cell Biol 176:843–852.
24. Stathopoulos A, Tam B, Ronshaugen M, Frasch M, Levine M (2004) pyramusand thisbe: FGF genes that pattern the mesoderm of Drosophila embryos.Genes Dev 18: 687–699.
25. Dutta D, Shaw S, Maqbool T, Pandya H, Vijayraghavan K (2005) DrosophilaHeartless acts with Heartbroken/Dof in muscle founder differentiation.PLoS Biol 3: e337. doi:10.1371/journal.pbio.0030337
26. Franch-Marro X, Marchand O, Piddini E, Ricardo S, Alexandre C, et al.(2005) Glypicans shunt the Wingless signal between local signalling andfurther transport. Development 132: 659–666.
27. Han C, Yan D, Belenkaya TY, Lin X (2005) Drosophila glypicans Dally andDally-like shape the extracellular Wingless morphogen gradient in the wingdisc. Development 132: 667–679.
28. Axelrod JD, Miller JR, Shulman JM, Moon RT, Perrimon N (1998)Differential recruitment of Dishevelled provides signaling specificity inthe planar cell polarity and Wingless signaling pathways. Genes Dev 12:2610–2622.
29. Lo PC, Frasch M (2001) A role for the COUP-TF-related gene seven-up inthe diversification of cardioblast identities in the dorsal vessel ofDrosophila. Mech Dev 104: 49–60.
30. Duchek P, Somogyi K, Jekely G, Beccari S, Rorth P (2001) Guidance of cellmigration by the Drosophila PDGF/VEGF receptor. Cell 107: 17–26.
31. Armstrong EJ, Bischoff J (2004) Heart valve development: endothelial cellsignaling and differentiation. Circ Res 95: 459–470.
32. Chang CP, Neilson JR, Bayle JH, Gestwicki JE, Kuo A, et al. (2004) A field ofmyocardial-endocardial NFAT signaling underlies heart valve morpho-genesis. Cell 118: 649–663.
33. Dutta D, Anant S, Ruiz-Gomez M, Bate M, VijayRaghavan K (2004) Foundermyoblasts and fibre number during adult myogenesis in Drosophila.Development 131: 3761–3772.
34. Anderson KV, Jurgens G, Nusslein-Volhard C (1985) Establishment ofdorsal-ventral polarity in the Drosophila embryo: genetic studies on therole of the Toll gene product. Cell 42: 779–789.
35. Kubota K, Keith FJ, Gay NJ (1995) Wild type and constitutively activatedforms of the Drosophila Toll receptor have different patterns of N-linkedglycosylation. FEBS Lett 365: 83–86.
36. Dequeant ML, Glynn E, Gaudenz K, Wahl M, Chen J, et al. (2006) A complexoscillating network of signaling genes underlies the mouse segmentationclock. Science 314: 1595–1598.
37. Olson EN (2006) Gene regulatory networks in the evolution and develop-ment of the heart. Science 313: 1922–1927.
38. Zaffran S, Frasch M (2002) Early signals in cardiac development. Circ Res91: 457–469.
39. Brand AH, Perrimon N (1993) Targeted gene expression as a means of
PLoS Genetics | www.plosgenetics.org October 2007 | Volume 3 | Issue 10 | e1741920
Signalling Pathways Involved in Heart Formation
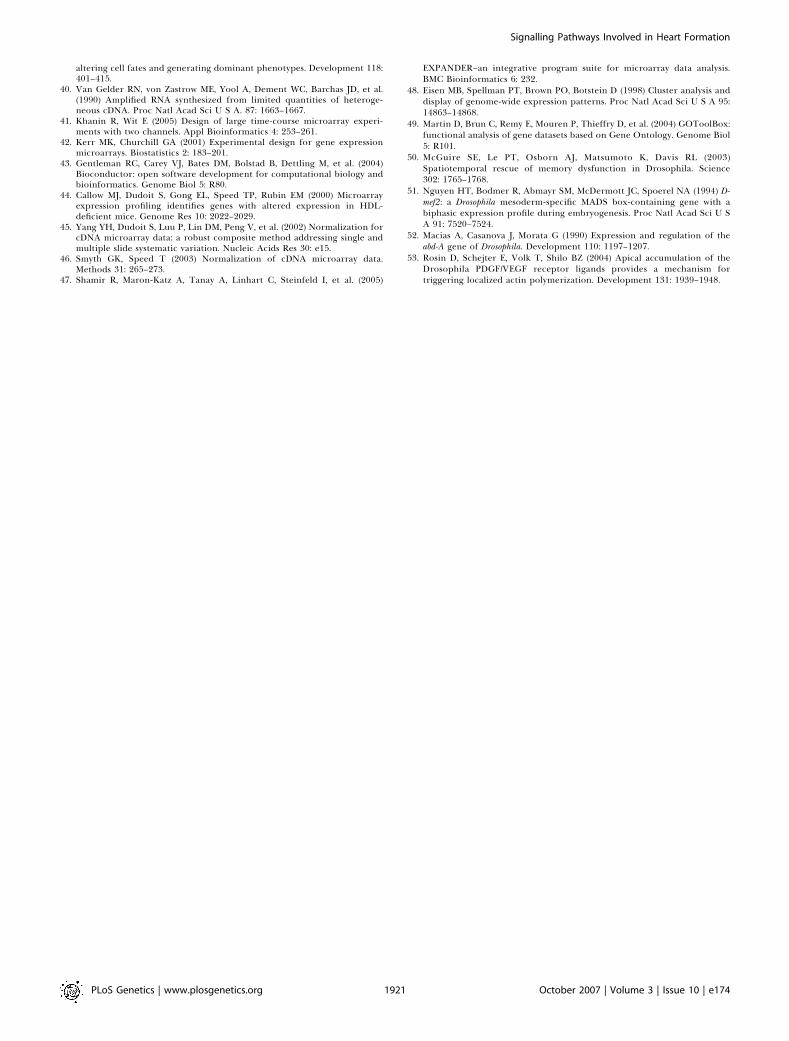
altering cell fates and generating dominant phenotypes. Development 118:401–415.
40. Van Gelder RN, von Zastrow ME, Yool A, Dement WC, Barchas JD, et al.(1990) Amplified RNA synthesized from limited quantities of heteroge-neous cDNA. Proc Natl Acad Sci U S A. 87: 1663–1667.
41. Khanin R, Wit E (2005) Design of large time-course microarray experi-ments with two channels. Appl Bioinformatics 4: 253–261.
42. Kerr MK, Churchill GA (2001) Experimental design for gene expressionmicroarrays. Biostatistics 2: 183–201.
43. Gentleman RC, Carey VJ, Bates DM, Bolstad B, Dettling M, et al. (2004)Bioconductor: open software development for computational biology andbioinformatics. Genome Biol 5: R80.
44. Callow MJ, Dudoit S, Gong EL, Speed TP, Rubin EM (2000) Microarrayexpression profiling identifies genes with altered expression in HDL-deficient mice. Genome Res 10: 2022–2029.
45. Yang YH, Dudoit S, Luu P, Lin DM, Peng V, et al. (2002) Normalization forcDNA microarray data: a robust composite method addressing single andmultiple slide systematic variation. Nucleic Acids Res 30: e15.
46. Smyth GK, Speed T (2003) Normalization of cDNA microarray data.Methods 31: 265–273.
47. Shamir R, Maron-Katz A, Tanay A, Linhart C, Steinfeld I, et al. (2005)
EXPANDER–an integrative program suite for microarray data analysis.BMC Bioinformatics 6: 232.
48. Eisen MB, Spellman PT, Brown PO, Botstein D (1998) Cluster analysis anddisplay of genome-wide expression patterns. Proc Natl Acad Sci U S A 95:14863–14868.
49. Martin D, Brun C, Remy E, Mouren P, Thieffry D, et al. (2004) GOToolBox:functional analysis of gene datasets based on Gene Ontology. Genome Biol5: R101.
50. McGuire SE, Le PT, Osborn AJ, Matsumoto K, Davis RL (2003)Spatiotemporal rescue of memory dysfunction in Drosophila. Science302: 1765–1768.
51. Nguyen HT, Bodmer R, Abmayr SM, McDermott JC, Spoerel NA (1994) D-mef2: a Drosophila mesoderm-specific MADS box-containing gene with abiphasic expression profile during embryogenesis. Proc Natl Acad Sci U SA 91: 7520–7524.
52. Macias A, Casanova J, Morata G (1990) Expression and regulation of theabd-A gene of Drosophila. Development 110: 1197–1207.
53. Rosin D, Schejter E, Volk T, Shilo BZ (2004) Apical accumulation of theDrosophila PDGF/VEGF receptor ligands provides a mechanism fortriggering localized actin polymerization. Development 131: 1939–1948.
PLoS Genetics | www.plosgenetics.org October 2007 | Volume 3 | Issue 10 | e1741921
Signalling Pathways Involved in Heart Formation