Embed Size (px)
Citation preview
Side Chain Conformational Distributions of a Small Protein Derivedfrom Model-Free Analysis of a Large Set of Residual DipolarCouplingsFang Li,†,‡ Alexander Grishaev,§ Jinfa Ying,† and Ad Bax*,†
†Laboratory of Chemical Physics, National Institute of Diabetes and Digestive and Kidney Diseases, National Institutes of Health,Bethesda, Maryland 20892, United States§National Institute of Standards and Technology, Institute for Bioscience and Biotechnology Research, 9600 Gudelsky Drive,Rockville, Maryland 20850, United States
*S Supporting Information
ABSTRACT: Accurate quantitative measurement of struc-tural dispersion in proteins remains a prime challenge to bothX-ray crystallography and NMR spectroscopy. Here we use amodel-free approach based on measurement of many residualdipolar couplings (RDCs) in differentially orienting aqueousliquid crystalline solutions to obtain the side chain χ1distribution sampled by each residue in solution. Applied tothe small well-ordered model protein GB3, our approachreveals that the RDC data are compatible with a single narrowdistribution of side chain χ1 angles for only about 40% of theresidues. For more than half of the residues, populationsgreater than 10% for a second rotamer are observed, and fourresidues require sampling of three rotameric states to fit theRDC data. In virtually all cases, sampled χ1 values are found to center closely around ideal g−, g+ and t rotameric angles, eventhough no rotamer restraint is used when deriving the sampled angles. The root-mean-square difference between experimental3JHαHβ couplings and those predicted by the Haasnoot-parametrized, motion-adjusted Karplus equation reduces from 2.05 to 0.75Hz when using the new rotamer analysis instead of the 1.1-Å X-ray structure as input for the dihedral angles. A comparisonbetween observed and predicted 3JHαHβ values suggests that the root-mean-square amplitude of χ1 angle fluctuations within agiven rotamer well is ca. 20°. The quantitatively defined side chain rotamer equilibria obtained from our study set newbenchmarks for evaluating improved molecular dynamics force fields, and also will enable further development of quantitativerelations between side chain chemical shift and structure.
■ INTRODUCTION
It is well recognized that proteins are subject to extensiveconformational fluctuations, and much research over the pasttwo decades has focused on linking this structural and dynamicheterogeneity to function.1−4 Recent advances in the analysis ofX-ray crystallographic data now make it possible to reliably fitprotein X-ray electron density maps, acquired at highresolution, to ensembles of structures that correlate with theorder parameters derived from NMR relaxation data.5 Suchanalyses frequently reveal the presence of multiple different sidechain conformations in any given crystal, permitting identi-fication of distinct allosteric networks.6 Unfortunately,collection of high quality X-ray data often requires the use ofcryogenic temperatures, which results in extensive remodelingof many of the side chains, even when samples are flash frozen,7
possibly providing a distorted view of the functionally relevantensemble that exists at room temperature.Historically, NMR spectroscopy has played a dominant role
in studying internal dynamics of proteins. In particular, 15N
relaxation measurements are used ubiquitously for defining theamplitudes and time scales of rapid backbone motions.8−11 Sidechain dynamics, in particular methyl-bearing side chains, havebeen extensively studied by 13C relaxation measurements,12−14
and 2H relaxation rates of deuterated methyl groups also haveproven to be particularly robust parameters for quantifying suchdynamics.14,15 In addition, dipole−dipole cross-correlatedrelaxation rates were shown to be excellent reporters onmethylene group motions,16 with the restriction on all of theserelaxation methods being that only motions faster than theoverall tumbling time of the protein can be accuratelydetected.17 Motions on the ms−μs time scale can be studiedby NMR relaxation dispersion methods, providing access toconformational rearrangements that often are of keyimportance to biological function.18−20 However, unless thechemical shift changes underlying relaxation dispersion can be
Received: September 25, 2015Published: November 2, 2015
Article
pubs.acs.org/JACS
© 2015 American Chemical Society 14798 DOI: 10.1021/jacs.5b10072J. Am. Chem. Soc. 2015, 137, 14798−14811
This is an open access article published under an ACS AuthorChoice License, which permitscopying and redistribution of the article or any adaptations for non-commercial purposes.
interpreted in structural terms, relaxation dispersion is oftenlimited to providing time scales and populations of the dynamicprocess. As a complement to these measurements, theconformational range sampled by proteins across the entireNMR time scale from ps to ms can be defined by RDCsmeasured under at least three linearly independent alignmentconditions.3,21−23 However, when the motional amplitudesinvolved are modest, as often is the case for backbone dynamicsin well-ordered proteins, quantitative interpretation of theRDCs in terms of motions demands very high measurementprecision, a goal that can be difficult to reach under therequired three or more alignment conditions.24,25
In the past, side chain dynamics have been studied mostly interms of the distributions of their rotameric states, mostcommonly analyzed by measurement of extensive sets of 3Jcouplings, possibly in conjunction with 1H−1H nuclearOverhauser enhancements (NOEs).26−28 Interpretation ofthese data in terms of dynamics was shown to be rathersensitive to the distributional model underlying such analyses,29
and clearly is also highly sensitive to the parametrizations of theKarplus equations used. Because energetically favorable sidechain conformations typically fall close to staggered rotamericstates, their dynamics in terms of changes in bond vectororientation often is of much larger amplitude than for theprotein backbone, making them highly suitable for study byRDCs.30 Analysis of the 13Cβ−1Hβ RDCs measured for the B1domain of protein L using two quite different liquid crystallinealignments yielded up to four very accurate parameters todefine the χ1 angle for side chains with Cβ methylene groups,and two parameters for residues such as Val, Ile, and Thr, withonly a single 13Cβ−1Hβ RDC.30 For residues with methylenegroups, this permitted definition of both the populations and χ1values of up to two side chain rotamers that are in rapidexchange with one another or, for both residues with methyleneor methine Cβ carbons this could be interpreted in terms ofpopulations of three rotamers (two independent parameters),assuming these are ideally staggered.Here, we expand on the approach introduced by Mittermaier
and Kay, and measure side chain RDCs for six differentlyoriented samples of the third Igg-binding domain of protein G(GB3 for short), and in addition to the 13Cβ−1Hβ RDCs wealso measure 13Cβ−13Cγ RDCs for residues with nonprotonatedCγ (Asn, Asp, and aromatic residues) and for residues with13CγH3 groups (Ile, Val, Thr), thereby yielding up to 18observed parameters. Effectively, the number of independentexperimental parameters is somewhat lower, however, as onlyfive of the six protein alignments can be linearly independent ofone another. Nevertheless, the now much larger set ofexperimental parameters allows definition of both thepopulations and χ1 values of all three side chain rotamers forthe vast majority of residues. In fact, for residues with acomplete or nearly complete set of couplings, we show it ispossible to determine a continuous distribution of χ1 values,albeit that the latter analysis requires a “maximum entropy”term to smooth the distributions. Thus, our analysis provides amodel-free evaluation of the χ1 values sampled by each sidechain, without the restriction that these cluster in two or threedistinct rotameric states.Protein alignment conditions were varied by using different
liquid crystalline suspensions30,31 as well as by introducingconservative charge mutations that alter the protein’s alignmentin a medium containing a liquid crystalline suspension of thefilamentous bacteriophage Pf1.32 The large amount of back-
bone RDC data obtained for these samples also permittedgeneration of an average backbone structure that predicts Cα−Cβ bond vector orientations at an accuracy that is considerablyincreased over that of the X-ray structure, as judged byagreement between observed and predicted 13Cα−13Cβ RDCs.High accuracy of these vector orientations is a prerequisite forquantitative RDC analysis of the χ1 values sampled by thedifferent side chains.30
For nearly all solvent-exposed residues we find population oftwo and sometimes even three sets of χ1 angles that typicallycluster close to ideally staggered rotameric states. By contrast,the relatively small number of buried side chains in GB3 for themost part can be well fit by single, narrow clusters of χ1 values.For the vast majority of residues, population of these clusters,as well as their centers, can be defined at high accuracy.Although the width of the clusters, i.e., the amplitude of thedynamics within a given rotameric well, is poorly defined by theRDC data, comparison between observed and predicted 3JHαHβvalues indicates that the root-mean-square amplitude of χ1angle fluctuations within a given rotamer well is ca. 20°.
■ MATERIALS AND METHODSProtein Preparation. The sequence of wild-type GB3 used in our
study is MQYKLVINGK TLKGETTTKA VDAETAEKAFKQYANDNGVD GVWTYDDATK TFTVTE. Samples of thefollowing three mutants also were generated: (1) K4A/K19E/V42E/CHis6; (2) K19A/V42E/D47K; and (3) K4A/K19E/V42E. Formutant (1), CHis6 refers to a set of six His residues, immediatelyfollowing C-terminal residue E56. Proteins were expressed andpurified as described previously,33 and selection of the three mutantswas based on those previously studied by Yao et al. in Pf1, which hadshown backbone perturbations caused by the mutations to beminimal.32 Samples of uniformly 99%-enriched 13C/15N proteinwere generated by growing BL21-DE3 Escherichia coli cells in M9medium containing 1.0 g/L 15NH4Cl and 2.0 g/L 13C6-glucose,supplemented by 0.5 g/L U−13C/15N Isogro rich medium (Sigma-Aldrich). Measurements were also carried out for randomly fraction-ally (ca. 75%) deuterated protein, obtained by growing the cells in M9medium, including 1 g/L 15NH4Cl and 3.0 g/L 13C6/
2H7-glucose in75% D2O/25% H2O, and for samples with full perdeuteration of thenonexchangeable hydrogens by growing the cells in a mediumcontaining M9 medium, including 1 g/L 15NH4Cl and 3.0 g/L13C6/
2H7-glucose in 99% D2O, followed by back exchange of the labilehydrogens in H2O for at least 24 h at 37 °C.
NMR Measurements. An extensive set of two-dimensional (2D)and three-dimensional (3D) heteronuclear NMR spectra was recordedto collect 15N−1H, 13C−1H, and 13Cα−13Cβ and 13Cβ−13Cγ one-bond Jcouplings and RDCs on isotropic and six differently aligned proteinsamples. A nearly complete set of 3JHαHβ couplings was also obtainedfrom a 3D HA[HB,HN](CACO)NH spectrum.34 The different typesof spectra recorded are summarized in Supporting Information (SI)Table S1, and the compositions of the different samples aresummarized in Table S2. Spectra were recorded on Bruker Avance-III spectrometers operating at 1H frequencies of 600 and 900 MHz,both equipped with triple resonance cryogenic probeheads and z-axispulsed field gradient accessories. Details regarding the NMRmeasurements are presented in the SI Text Section.
All spectra were processed using the NMRPipe software system35
and analyzed with the Sparky program.36
Backbone Refinement of GB3. The structure of GB3 was refinedstarting from the coordinates of the PDB deposition 2OED,33 againstan extensive set of N−HN, Cα−Hα, C′−Cα, C′−N, HN−Hα, and Cα−Cβ RDCs using a variable alignment tensor treatment as describedpreviously, to reach working Q factors ranging between 0.05 and0.11.37 In addition, 3JHNHα and
3JC′C′ couplings reported by Li et al.37
were fitted with force constants that yielded rmsd values of 0.29 and0.1 Hz, respectively. For the PDB-deposited ensemble obtained from
Journal of the American Chemical Society Article
DOI: 10.1021/jacs.5b10072J. Am. Chem. Soc. 2015, 137, 14798−14811
14799
our study (PDB entry 2N7J), the protein structure was refined as if itsbackbone and Cβ atomic positions are fully static, i.e., as previouslydone for ubiquitin,25 thereby aiming to give the best representation ofthe time-averaged backbone structure.
■ RESULTS AND DISCUSSION
Analogous to prior studies of protein backbone dynam-ics,21,22,24,38 we measured RDCs for a wide range of differentprotein orientations. The GB3 domain, used in our study, has aquite prolate shape, making it challenging to find trulyorthogonal alignment conditions.33 Here, we rely on acombination of the two approaches previously used for thispurpose. First, we collected RDC data in three liquid crystallinemedia that differentially align the protein relative to themagnetic field: a positively charged phospholipid bicellesuspension,39,40 a polyethylene glycol (PEG) based liquidcrystal,41 and a suspension of the negatively chargedfilamentous phage Pf1.42 Second, we used conservativemutagenesis of charged surface residues, which can be usedto alter the alignment of the protein relative to the negativelycharged Pf1 liquid crystal, without significantly impacting thebackbone structure of the protein.32 Three such mutants wereprepared and studied in Pf1. As the current study focuses onside chain conformations rather than backbone, it is importantto ensure that the use of mutants does not significantly perturbthe side chain conformations either. Here, we simply excludedata for residues in the mutants that have significant chemicalshift differences for 13Cβ (≥0.2 ppm) or 1Hβ (≥0.1 ppm)relative to the wild type protein. This only concerns a smallnumber of residues (SI Tables S3 and S4; SI Figure S3), mostsignificantly residue E15 which exhibits a >0.6 ppm 13Cβ
chemical shift change in the K4A mutants, presumably becausea side chain salt bridge interaction between K4 and E15, seen inthe X-ray structure of the wild type protein,43 is abolished inthe mutant. Although RDC data were collected under sixdifferent alignment conditions (three different media, plus threemutants in Pf1), analysis of the corresponding alignmenttensors using singular value decomposition and SECONDAanalysis44 indicates that one of the five possible orthogonalalignments is only weakly sampled (SI Figure S4). However, incontrast to the study of backbone motions by RDCs, whereoften only a single 15N−1H RDC is used to define theorientation of the peptide plane relative to the liquid crystaldirector, for our study of side chain conformations two verydifferent orientations, 13Cβ−1Hβ2 and 13Cβ−1Hβ3 are sampled iftheir separate RDCs can be measured. For residues withmethine Cβ carbons, i.e., Thr, Val and Ile, 13Cβ−13Cγ RDCswere measured through the 13Cγ methyl resonance, and foraromatic and Asp/Asn residues 13Cβ−13Cγ RDCs could alsoreadily be measured (see Materials and Methods and SI).Therefore, for each alignment condition, two or three RDCsare available for defining the χ1 angle of most residues.Measurement of Side Chain 1H−13C RDCs. The accuracy
of the experimental RDCs is paramount when using these todefine a dynamic structural ensemble. Indeed, it is primarily theinconsistency between the RDCs and a single, unique χ1 anglethat necessitates their analysis in terms of an ensemble.However, random or systematic measurement errors will alsoresult in inconsistencies, and it is therefore critical to minimizesuch errors.A 1H−13C RDC can be derived from the change in 1JCH
splitting observed in either the 1H or 13C dimension of amultidimensional NMR spectrum. Measurement in the 1H
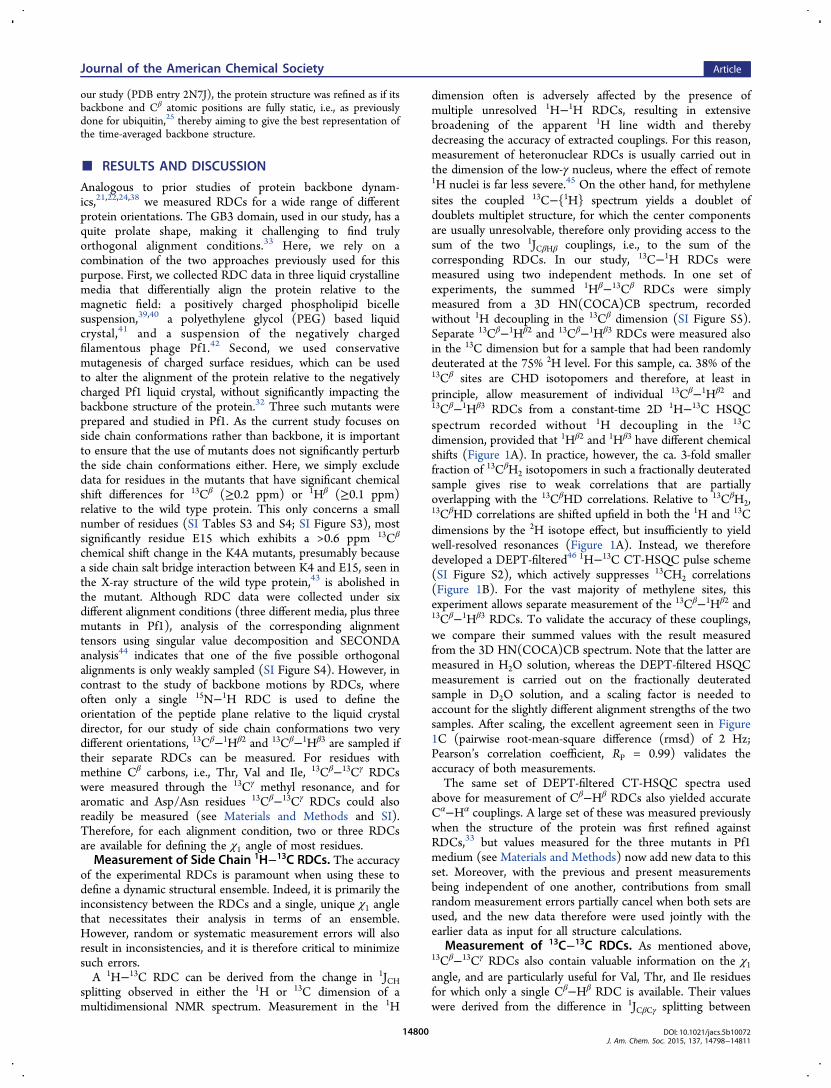
dimension often is adversely affected by the presence ofmultiple unresolved 1H−1H RDCs, resulting in extensivebroadening of the apparent 1H line width and therebydecreasing the accuracy of extracted couplings. For this reason,measurement of heteronuclear RDCs is usually carried out inthe dimension of the low-γ nucleus, where the effect of remote1H nuclei is far less severe.45 On the other hand, for methylenesites the coupled 13C−{1H} spectrum yields a doublet ofdoublets multiplet structure, for which the center componentsare usually unresolvable, therefore only providing access to thesum of the two 1JCβHβ couplings, i.e., to the sum of thecorresponding RDCs. In our study, 13C−1H RDCs weremeasured using two independent methods. In one set ofexperiments, the summed 1Hβ−13Cβ RDCs were simplymeasured from a 3D HN(COCA)CB spectrum, recordedwithout 1H decoupling in the 13Cβ dimension (SI Figure S5).Separate 13Cβ−1Hβ2 and 13Cβ−1Hβ3 RDCs were measured alsoin the 13C dimension but for a sample that had been randomlydeuterated at the 75% 2H level. For this sample, ca. 38% of the13Cβ sites are CHD isotopomers and therefore, at least inprinciple, allow measurement of individual 13Cβ−1Hβ2 and13Cβ−1Hβ3 RDCs from a constant-time 2D 1H−13C HSQCspectrum recorded without 1H decoupling in the 13Cdimension, provided that 1Hβ2 and 1Hβ3 have different chemicalshifts (Figure 1A). In practice, however, the ca. 3-fold smallerfraction of 13CβH2 isotopomers in such a fractionally deuteratedsample gives rise to weak correlations that are partiallyoverlapping with the 13CβHD correlations. Relative to 13CβH2,13CβHD correlations are shifted upfield in both the 1H and 13Cdimensions by the 2H isotope effect, but insufficiently to yieldwell-resolved resonances (Figure 1A). Instead, we thereforedeveloped a DEPT-filtered46 1H−13C CT-HSQC pulse scheme(SI Figure S2), which actively suppresses 13CH2 correlations(Figure 1B). For the vast majority of methylene sites, thisexperiment allows separate measurement of the 13Cβ−1Hβ2 and13Cβ−1Hβ3 RDCs. To validate the accuracy of these couplings,we compare their summed values with the result measuredfrom the 3D HN(COCA)CB spectrum. Note that the latter aremeasured in H2O solution, whereas the DEPT-filtered HSQCmeasurement is carried out on the fractionally deuteratedsample in D2O solution, and a scaling factor is needed toaccount for the slightly different alignment strengths of the twosamples. After scaling, the excellent agreement seen in Figure1C (pairwise root-mean-square difference (rmsd) of 2 Hz;Pearson’s correlation coefficient, RP = 0.99) validates theaccuracy of both measurements.The same set of DEPT-filtered CT-HSQC spectra used
above for measurement of Cβ−Hβ RDCs also yielded accurateCα−Hα couplings. A large set of these was measured previouslywhen the structure of the protein was first refined againstRDCs,33 but values measured for the three mutants in Pf1medium (see Materials and Methods) now add new data to thisset. Moreover, with the previous and present measurementsbeing independent of one another, contributions from smallrandom measurement errors partially cancel when both sets areused, and the new data therefore were used jointly with theearlier data as input for all structure calculations.
Measurement of 13C−13C RDCs. As mentioned above,13Cβ−13Cγ RDCs also contain valuable information on the χ1angle, and are particularly useful for Val, Thr, and Ile residuesfor which only a single Cβ−Hβ RDC is available. Their valueswere derived from the difference in 1JCβCγ splitting between
Journal of the American Chemical Society Article
DOI: 10.1021/jacs.5b10072J. Am. Chem. Soc. 2015, 137, 14798−14811
14800
aligned and isotropic samples, observed in regular (non-CT)1H-decoupled 1H−13C HSQC spectra (Figure 2A). Foraromatic and Asp/Asn residues, 13Cβ−13Cγ RDCs wereobtained from 1H−13C CT-HSQC spectra47 in which nodecoupling of the downfield 13Cγ nuclei was employed, and the
13C 180° pulse applied during the 56 ms CT-evolution periodwas REBURP-shaped48 to invert only aliphatic carbon spins,thereby removing the 1JCαCβ splitting and leaving clean 1JCβCγdoublets (Figure 2B).In addition to the one-bond Cβ−Cγ RDCs (1DCβCγ) that
contain information on χ1, complete sets of 1DCαCβ couplings(with the exception of C-terminal residue E56) were obtainedfrom 3D HNCOCA spectra recorded on fully deuteratedsamples of the wild-type GB3 sample in Pf1, bicelle and PEGmedia. These data were used to further refine the backbonestructure of the protein, and also served as a measure toevaluate the accuracy of Cα−Cβ bond vector orientations instructures derived without including this data, i.e., to establish ameasure for the “structural noise”.49 Scaling factors for thesevalues to account for the small changes in liquid crystalconcentrations used in the different samples were establishedindependently by comparing 1DNH values. After normalizingthe alignment strengths of the different samples used formeasurement of 1DCαCβ,
1DCβCγ,1DCβHβ2, and
1DCβHβ3 values,and further accounting for the intrinsic difference between1DCC and
1DCH couplings due to differences in bond length andgyromagnetic ratio,45 in the absence of measurement error thesum of these four couplings must be zero under theapproximation of ideal tetrahedral geometry at Cβ. Indeed,for residues for which all four one-bond RDCs to Cβ weremeasured, a very good correlation between 1DCαCβ and the sumof the three other, normalized couplings is observed (Figure2C). For several residues, the residual nonzero values of thesesums (SI Table S5) are somewhat larger than expected basedon propagation of the estimated uncertainties in the RDCmeasurements, which may reflect small deviations fromidealized tetrahedral geometry at Cβ. Indeed, quantumcalculations suggest, for example, that the Hβ2−Cβ−Hβ3 anglecan deviate by up to ∼5° from the tetrahedral 109.4° value in aχ1-dependent manner. Deviations from ideal 109.4° values,outside of the statistical uncertainty, for the Cα−Cβ−Cγ angleare also commonly seen in atomic resolution X-ray data.50
Generation of Side Chain Ensembles. The earlierstructure refinement (PDB entry 2OED) was based on anextensive set of backbone RDCs, measured in different liquidcrystalline and stretched acrylamide gel media.33 In addition tothe RDC restraints used previously, the newly recorded RDCdata add orientations enabled by the use of surface chargemutations while using Pf1 as the alignment medium.32 The dataalso include 13Cα−13Cβ RDCs measured in three media for fullydeuterated protein, which results in very high resolution in the13C dimension, thereby increasing the accuracy of theirmeasurements (SI Table S6). Use of perdeuterated proteinalso allows the use of rather strong alignment,51 which isparticularly beneficial for measuring the intrinsically small 1DCCvalues. These 13Cα−13Cβ RDCs directly impact the orientationsof the corresponding bond vectors, whose accuracy is key whendefining the distributions of χ1 rotations around these vectorson the basis of 13Cβ−1Hβ and 13Cβ−13Cγ RDCs.The 13Cα−13Cβ RDCs also are very useful for validation
purposes, establishing the accuracy of the Cα−Cβ vectors instructures calculated without using any 1DCαCβ restraints. Theaveraged Qfree
Cα‑Cβ factors for data measured in Pf1, bicelle andPEG media were ∼10%, corresponding to an uncertainty of 3.1± 0.6° (structural noise) in their time-averaged orientations.49
The actual structures used for all χ1 analyses and side chainensemble generation included the 1DCαCβ restraints, and
Figure 1. Enhanced accuracy of 1DCβHβ couplings through spectralediting of the 1H−13C CT-HSQC spectrum of randomly fractionally(75%) deuterated GB3. (A) Small region of the regular 1H−13CHSQC spectrum, 1H-coupled in the 13C dimension, showing thesignals of both 13CH2 and 13CHD isotopomers, the latter upfieldshifted due to the deuterium isotope effect. (B) Same spectral region,recorded with the DEPT-filtered 1H−13C CT-HSQC experiment (SIFigure S2), which selects 13CH signals and effectively suppresses13CH2 isotopomers. (C) Comparison of the sum of 13Cβ−1Hβ2(Dβ3)and 13Cβ−Hβ3(Dβ2) couplings derived from the DEPT-filtered HSQCspectra of wild-type GB3 in Pf1 and isotropic solutions, with thecorresponding summed couplings derived from CT-HN(COCA)CBspectra. Blue: K4A/K19E/V42E-CHis6 in Pf1; red: K19A/V42E/D47K in Pf1; green: K4A/K19E/V42E in Pf1; pink: wild-type GB3 inbicelle; gray: wild-type GB3 in PEG; black: wild-type GB3 in Pf1.Spectra were recorded at 900 MHz 1H frequency in 99.8% D2O(1H−13C HSQC) and at 600 MHz in 95% H2O for the CT-HN(COCA)CB experiment.
Journal of the American Chemical Society Article
DOI: 10.1021/jacs.5b10072J. Am. Chem. Soc. 2015, 137, 14798−14811
14801
therefore should be of slightly higher accuracy than structuresused for 1DCαCβ validation. Populations of the side chainconformers in the 20 structures deposited in the PDB (PDBentry 2N7J; Figure 3) then were randomly selected by sampling
the distributions observed in our study (Table 1), followed by aMonte Carlo minimization of the clash score using the χ2, χ3,and χ4 distributions from the backbone-independent rotamericlibrary.52 During this process the backbone and the atomsdefining the χ1 torsion angles remained fixed, thus allowingrearrangement of the atoms beyond Cγ, but withoutconsideration of side chain H-bonding or other potentiallyrelevant physical interactions. Structural statistics are reportedin SI Table S7.Although it seemed likely that side chain angles of residues
with fluctuating χ1 rotamer populations will not change fullyindependently of one another, as some combinations of χ1would result in a steric clash of side chains, relatively few clear-cut examples of such concerted motions were evident in ouranalysis. In the deposited ensemble, structures with such
clashes are simply absent due to the high energy associated withdistances between atoms that are separated less than the sum oftheir scaled van der Waals radii during the Monte Carlo clashminimization protocol.
Evaluation of χ1 as Continuous Distributions. Theamount of RDC data available to define the χ1 angledistribution varied strongly from residue to residue. For 33out of 46 non-Gly/Ala residues, ten or more experimentalRDCs were available to define χ1 (Table 1). On the other hand,six or fewer couplings could be measured reliably for sevenresidues: For T25, which exhibits strong 13Cα−13Cβ couplingdue to a very small 13Cα−13Cβ chemical shift difference, noreliable side chain RDCs were obtained. For K19, which hastwo equivalent 1Hβ chemical shifts and is the site of mutation inthree of the samples studied, only three RDCs were available.Both K19 and T25 therefore were excluded, as was L12 becauseits high amplitude backbone dynamics24,53 was incompatiblewith our analysis method. Other residues with very smallnumbers of RDCs included K10, K28, Q32 and T55 and T51.For K10, K28 and Q32 the equivalent chemical shifts of theirHβ protons only permitted measurement of the sum of their1DCβHβ. Several of the other missing RDCs result fromstructural perturbations caused by the mutations of K4, K19and V42, used to alter GB3′s alignment, as judged by 13Cβ or1Hβ chemical shift changes >0.2 or >0.1 ppm, respectively.Moreover, the difficulty in measuring 13Cβ−13Cγ RDCs atsufficient precision for several residues further decreased thenumber of observable parameters. Nevertheless, with thebackbone and thereby Cα−Cβ orientations tightly defined, atleast in principle only two RDCs are needed to define χ1 underthe assumption that the side chain conformation is static.Therefore, even for residues with only very few RDCs, the lackof consistency between the RDCs and a single, static χ1 valuecan reveal χ1 dynamics.The actual search for the ensemble of χ1 conformers that best
agrees with the experimental data is performed by means of thepreviously introduced variable weight fit (VW-Fit) program.25
VW-Fit uses a simulated annealing protocol to select from anensemble of conformers the population that best matches theexperimental data. For the present case, a 36-member ensemblewas simply generated as that of the (static) backbone structure,
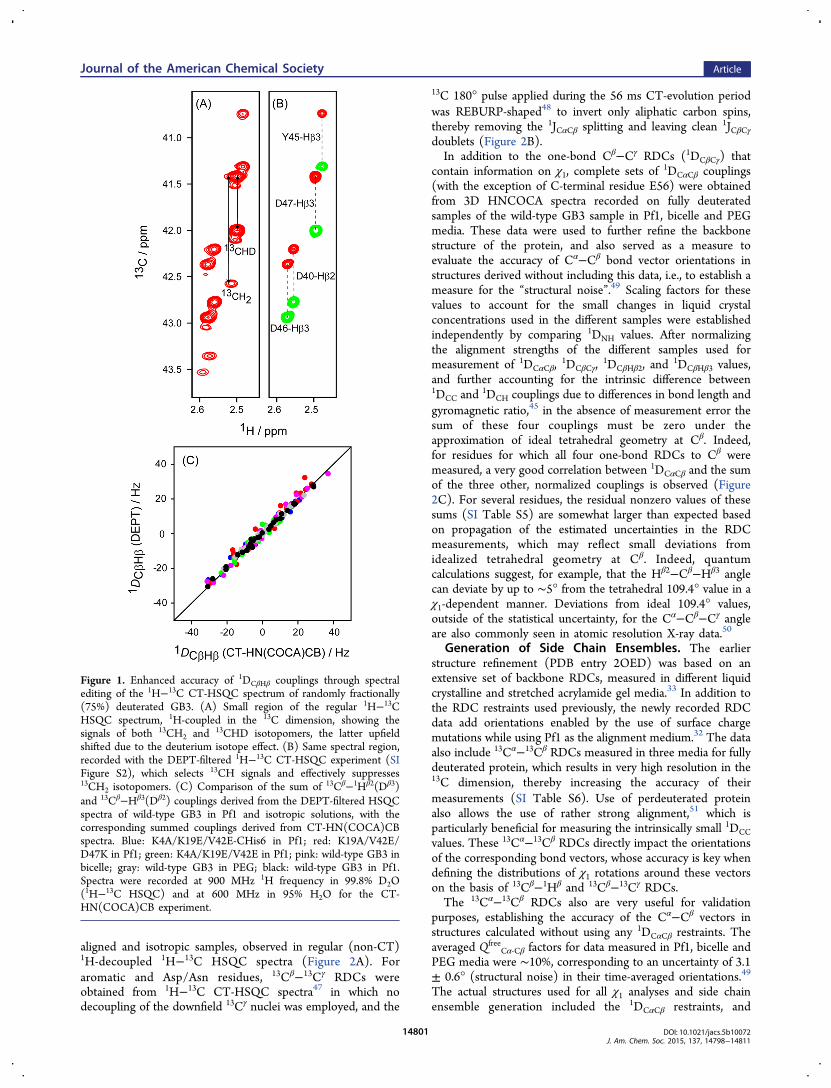
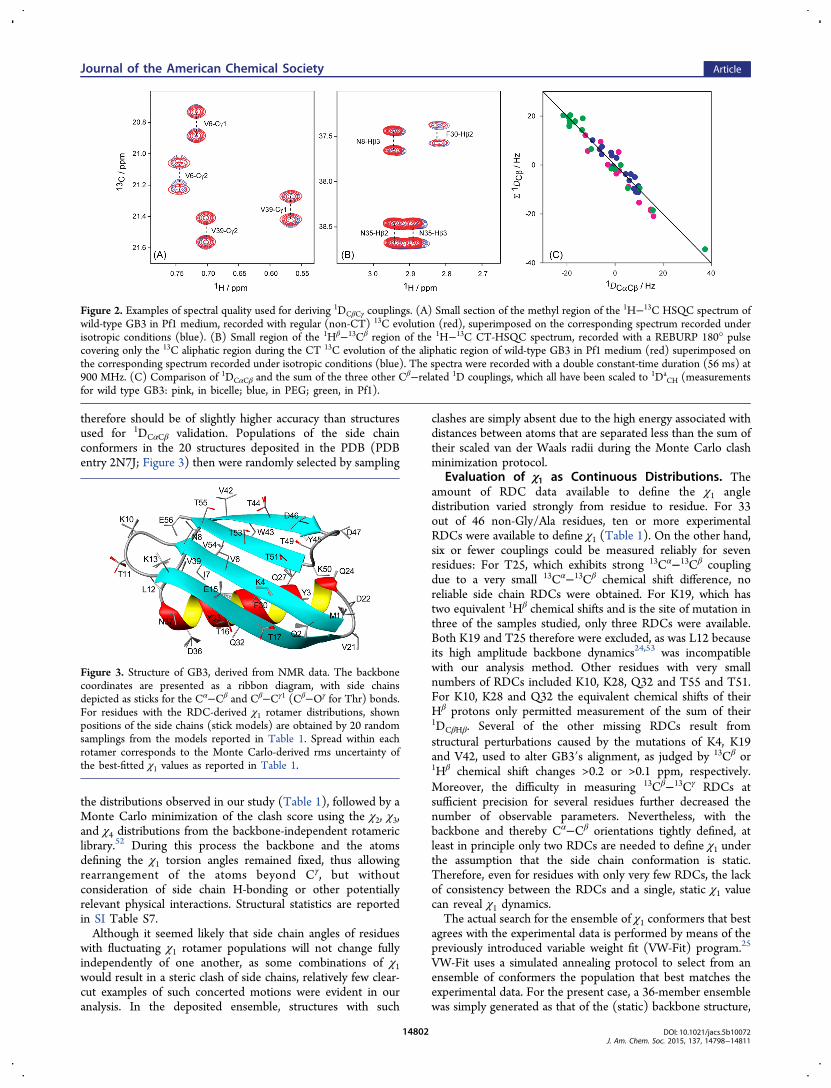
Figure 2. Examples of spectral quality used for deriving 1DCβCγ couplings. (A) Small section of the methyl region of the 1H−13C HSQC spectrum ofwild-type GB3 in Pf1 medium, recorded with regular (non-CT) 13C evolution (red), superimposed on the corresponding spectrum recorded underisotropic conditions (blue). (B) Small region of the 1Hβ−13Cβ region of the 1H−13C CT-HSQC spectrum, recorded with a REBURP 180° pulsecovering only the 13C aliphatic region during the CT 13C evolution of the aliphatic region of wild-type GB3 in Pf1 medium (red) superimposed onthe corresponding spectrum recorded under isotropic conditions (blue). The spectra were recorded with a double constant-time duration (56 ms) at900 MHz. (C) Comparison of 1DCαCβ and the sum of the three other Cβ−related 1D couplings, which all have been scaled to 1Da
CH (measurementsfor wild type GB3: pink, in bicelle; blue, in PEG; green, in Pf1).
Figure 3. Structure of GB3, derived from NMR data. The backbonecoordinates are presented as a ribbon diagram, with side chainsdepicted as sticks for the Cα−Cβ and Cβ−Cγ1 (Cβ−Oγ for Thr) bonds.For residues with the RDC-derived χ1 rotamer distributions, shownpositions of the side chains (stick models) are obtained by 20 randomsamplings from the models reported in Table 1. Spread within eachrotamer corresponds to the Monte Carlo-derived rms uncertainty ofthe best-fitted χ1 values as reported in Table 1.
Journal of the American Chemical Society Article
DOI: 10.1021/jacs.5b10072J. Am. Chem. Soc. 2015, 137, 14798−14811
14802
with the 36 ensemble members corresponding to χ1 valuesranging from 0 to 350°, regardless of steric clashing or otherenergetic considerations. Populations of the 36 different sidechain conformers (P0, P10, ..., P350;∑n Pn = 1) correspond to 35independent variables, which in all cases exceeds the number ofmeasured RDCs, making the solution under-determined. This
problem becomes even more pronounced when dividing the
conformers into narrower bins of, say, 2° each. For this case, it
is readily seen that, for example, equal 33.3% populations of
P298, P300, and P302 give essentially indistinguishable RDCs
relative to the case where only P300 is populated. We solve this
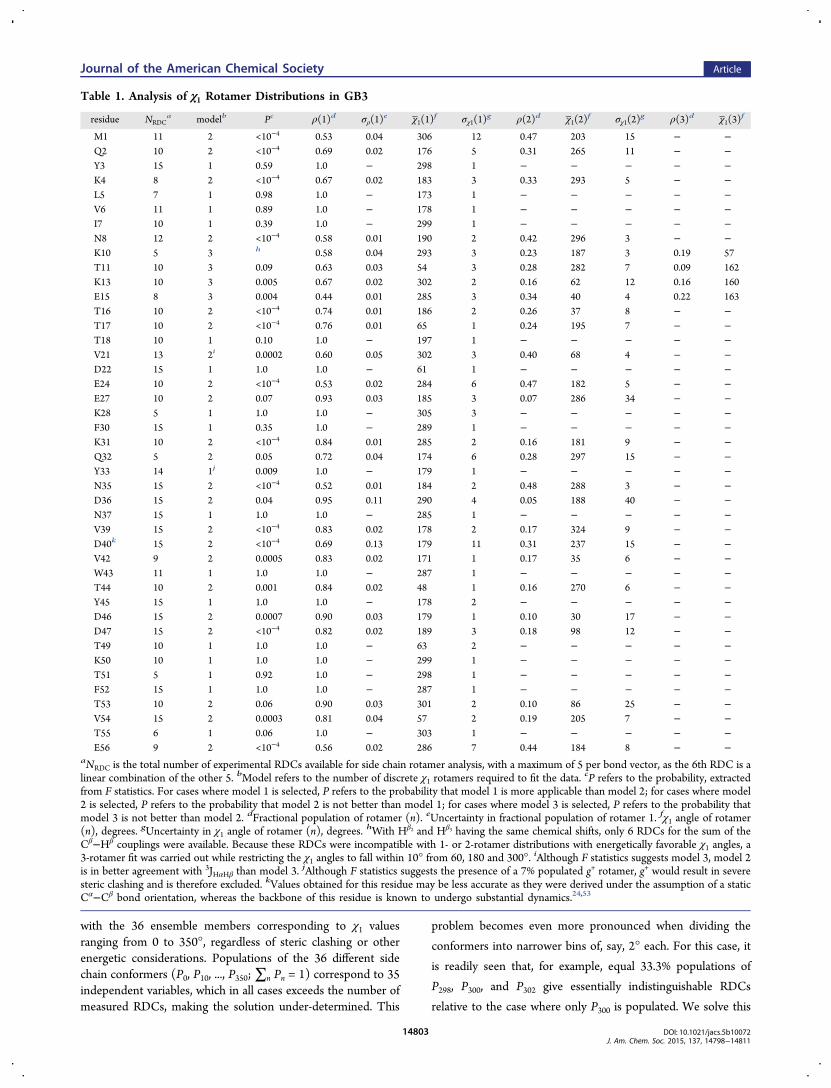
Table 1. Analysis of χ1 Rotamer Distributions in GB3
residue NRDCa modelb Pc ρ(1)d σρ(1)
e χ1̅(1)f σχ1(1)
g ρ(2)d χ1̅(2)f σχ1(2)
g ρ(3)d χ1̅(3)f
M1 11 2 <10−4 0.53 0.04 306 12 0.47 203 15 − −Q2 10 2 <10−4 0.69 0.02 176 5 0.31 265 11 − −Y3 15 1 0.59 1.0 − 298 1 − − − − −K4 8 2 <10−4 0.67 0.02 183 3 0.33 293 5 − −L5 7 1 0.98 1.0 − 173 1 − − − − −V6 11 1 0.89 1.0 − 178 1 − − − − −I7 10 1 0.39 1.0 − 299 1 − − − − −N8 12 2 <10−4 0.58 0.01 190 2 0.42 296 3 − −K10 5 3 h 0.58 0.04 293 3 0.23 187 3 0.19 57T11 10 3 0.09 0.63 0.03 54 3 0.28 282 7 0.09 162K13 10 3 0.005 0.67 0.02 302 2 0.16 62 12 0.16 160E15 8 3 0.004 0.44 0.01 285 3 0.34 40 4 0.22 163T16 10 2 <10−4 0.74 0.01 186 2 0.26 37 8 − −T17 10 2 <10−4 0.76 0.01 65 1 0.24 195 7 − −T18 10 1 0.10 1.0 − 197 1 − − − − −V21 13 2i 0.0002 0.60 0.05 302 3 0.40 68 4 − −D22 15 1 1.0 1.0 − 61 1 − − − − −E24 10 2 <10−4 0.53 0.02 284 6 0.47 182 5 − −E27 10 2 0.07 0.93 0.03 185 3 0.07 286 34 − −K28 5 1 1.0 1.0 − 305 3 − − − − −F30 15 1 0.35 1.0 − 289 1 − − − − −K31 10 2 <10−4 0.84 0.01 285 2 0.16 181 9 − −Q32 5 2 0.05 0.72 0.04 174 6 0.28 297 15 − −Y33 14 1j 0.009 1.0 − 179 1 − − − − −N35 15 2 <10−4 0.52 0.01 184 2 0.48 288 3 − −D36 15 2 0.04 0.95 0.11 290 4 0.05 188 40 − −N37 15 1 1.0 1.0 − 285 1 − − − − −V39 15 2 <10−4 0.83 0.02 178 2 0.17 324 9 − −D40k 15 2 <10−4 0.69 0.13 179 11 0.31 237 15 − −V42 9 2 0.0005 0.83 0.02 171 1 0.17 35 6 − −W43 11 1 1.0 1.0 − 287 1 − − − − −T44 10 2 0.001 0.84 0.02 48 1 0.16 270 6 − −Y45 15 1 1.0 1.0 − 178 2 − − − − −D46 15 2 0.0007 0.90 0.03 179 1 0.10 30 17 − −D47 15 2 <10−4 0.82 0.02 189 3 0.18 98 12 − −T49 10 1 1.0 1.0 − 63 2 − − − − −K50 10 1 1.0 1.0 − 299 1 − − − − −T51 5 1 0.92 1.0 − 298 1 − − − − −F52 15 1 1.0 1.0 − 287 1 − − − − −T53 10 2 0.06 0.90 0.03 301 2 0.10 86 25 − −V54 15 2 0.0003 0.81 0.04 57 2 0.19 205 7 − −T55 6 1 0.06 1.0 − 303 1 − − − − −E56 9 2 <10−4 0.56 0.02 286 7 0.44 184 8 − −
aNRDC is the total number of experimental RDCs available for side chain rotamer analysis, with a maximum of 5 per bond vector, as the 6th RDC is alinear combination of the other 5. bModel refers to the number of discrete χ1 rotamers required to fit the data. cP refers to the probability, extractedfrom F statistics. For cases where model 1 is selected, P refers to the probability that model 1 is more applicable than model 2; for cases where model2 is selected, P refers to the probability that model 2 is not better than model 1; for cases where model 3 is selected, P refers to the probability thatmodel 3 is not better than model 2. dFractional population of rotamer (n). eUncertainty in fractional population of rotamer 1. fχ1 angle of rotamer(n), degrees. gUncertainty in χ1 angle of rotamer (n), degrees.
hWith Hβ2 and Hβ3 having the same chemical shifts, only 6 RDCs for the sum of theCβ−Hβ couplings were available. Because these RDCs were incompatible with 1- or 2-rotamer distributions with energetically favorable χ1 angles, a3-rotamer fit was carried out while restricting the χ1 angles to fall within 10° from 60, 180 and 300°. iAlthough F statistics suggests model 3, model 2is in better agreement with 3JHαHβ than model 3. jAlthough F statistics suggests the presence of a 7% populated g+ rotamer, g+ would result in severesteric clashing and is therefore excluded. kValues obtained for this residue may be less accurate as they were derived under the assumption of a staticCα−Cβ bond orientation, whereas the backbone of this residue is known to undergo substantial dynamics.24,53
Journal of the American Chemical Society Article
DOI: 10.1021/jacs.5b10072J. Am. Chem. Soc. 2015, 137, 14798−14811
14803
problem by adding a very weak “entropy” term, −θ ∑n[Pnlog(Pn)], to the X2 penalty score that is minimized by VW-Fit:
∑ ∑
∑
θ
χ σ
= − +
−
=X P P
P
[ log( )] {RDC
[ RDC ( )]} /
nn n
j Mj
nn j
nj
2
1,...,
exp
calc1
2 2
(1)
Here, RDCjexp corresponds to one of the M experimental RDCs
available to define any given χ1 angle, σj is its estimatedmeasurement uncertainty, and RDCj
calc(χ1n) is the correspond-
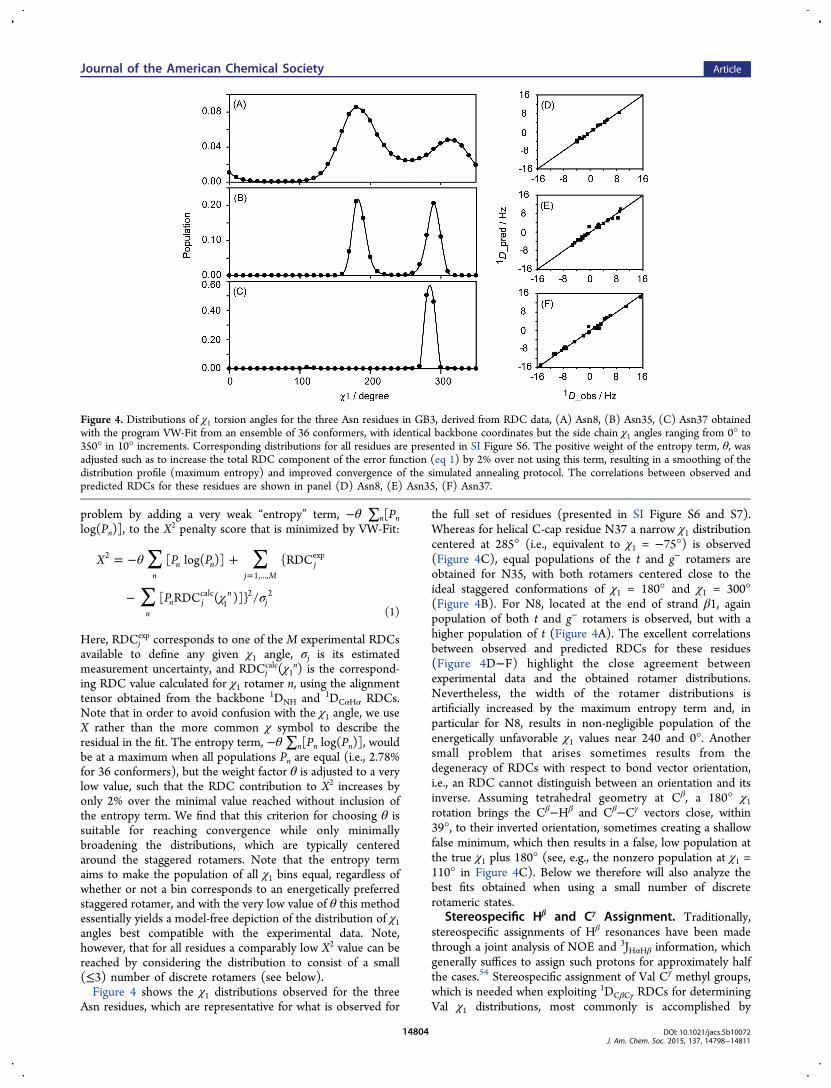
ing RDC value calculated for χ1 rotamer n, using the alignmenttensor obtained from the backbone 1DNH and 1DCαHα RDCs.Note that in order to avoid confusion with the χ1 angle, we useX rather than the more common χ symbol to describe theresidual in the fit. The entropy term, −θ∑n[Pn log(Pn)], wouldbe at a maximum when all populations Pn are equal (i.e., 2.78%for 36 conformers), but the weight factor θ is adjusted to a verylow value, such that the RDC contribution to X2 increases byonly 2% over the minimal value reached without inclusion ofthe entropy term. We find that this criterion for choosing θ issuitable for reaching convergence while only minimallybroadening the distributions, which are typically centeredaround the staggered rotamers. Note that the entropy termaims to make the population of all χ1 bins equal, regardless ofwhether or not a bin corresponds to an energetically preferredstaggered rotamer, and with the very low value of θ this methodessentially yields a model-free depiction of the distribution of χ1angles best compatible with the experimental data. Note,however, that for all residues a comparably low X2 value can bereached by considering the distribution to consist of a small(≤3) number of discrete rotamers (see below).Figure 4 shows the χ1 distributions observed for the three
Asn residues, which are representative for what is observed for
the full set of residues (presented in SI Figure S6 and S7).Whereas for helical C-cap residue N37 a narrow χ1 distributioncentered at 285° (i.e., equivalent to χ1 = −75°) is observed(Figure 4C), equal populations of the t and g− rotamers areobtained for N35, with both rotamers centered close to theideal staggered conformations of χ1 = 180° and χ1 = 300°(Figure 4B). For N8, located at the end of strand β1, againpopulation of both t and g− rotamers is observed, but with ahigher population of t (Figure 4A). The excellent correlationsbetween observed and predicted RDCs for these residues(Figure 4D−F) highlight the close agreement betweenexperimental data and the obtained rotamer distributions.Nevertheless, the width of the rotamer distributions isartificially increased by the maximum entropy term and, inparticular for N8, results in non-negligible population of theenergetically unfavorable χ1 values near 240 and 0°. Anothersmall problem that arises sometimes results from thedegeneracy of RDCs with respect to bond vector orientation,i.e., an RDC cannot distinguish between an orientation and itsinverse. Assuming tetrahedral geometry at Cβ, a 180° χ1rotation brings the Cβ−Hβ and Cβ−Cγ vectors close, within39°, to their inverted orientation, sometimes creating a shallowfalse minimum, which then results in a false, low population atthe true χ1 plus 180° (see, e.g., the nonzero population at χ1 =110° in Figure 4C). Below we therefore will also analyze thebest fits obtained when using a small number of discreterotameric states.
Stereospecific Hβ and Cγ Assignment. Traditionally,stereospecific assignments of Hβ resonances have been madethrough a joint analysis of NOE and 3JHαHβ information, whichgenerally suffices to assign such protons for approximately halfthe cases.54 Stereospecific assignment of Val Cγ methyl groups,which is needed when exploiting 1DCβCγ RDCs for determiningVal χ1 distributions, most commonly is accomplished by
Figure 4. Distributions of χ1 torsion angles for the three Asn residues in GB3, derived from RDC data, (A) Asn8, (B) Asn35, (C) Asn37 obtainedwith the program VW-Fit from an ensemble of 36 conformers, with identical backbone coordinates but the side chain χ1 angles ranging from 0° to350° in 10° increments. Corresponding distributions for all residues are presented in SI Figure S6. The positive weight of the entropy term, θ, wasadjusted such as to increase the total RDC component of the error function (eq 1) by 2% over not using this term, resulting in a smoothing of thedistribution profile (maximum entropy) and improved convergence of the simulated annealing protocol. The correlations between observed andpredicted RDCs for these residues are shown in panel (D) Asn8, (E) Asn35, (F) Asn37.
Journal of the American Chemical Society Article
DOI: 10.1021/jacs.5b10072J. Am. Chem. Soc. 2015, 137, 14798−14811
14804
fractional 13C incorporation.55 Alternatively, complete stereo-specific Hβ and Cγ assignments can also be obtained by usingselectively deuterated amino acids in a cell-free growth medium(SAIL labeling),56 but this approach can be technicallychallenging and expensive in terms of the required selectivelydeuterated amino acid precursors.In our above χ1 analysis, we followed the procedure used by
Mittermaier and Kay,30 and simply tried both sets of Hβ (or Cγ
for Val) assignments. For four residues (K10, K19, K28 andQ32) the near-identical chemical shifts of Hβ2 and Hβ3 obviatedtheir stereospecific assignments. For the vast majority of theremaining residues one of the two assignments yielded a muchbetter fit to the RDC data than the other. Moreover, we foundthat when using the wrong stereospecific assignment, the χ1populations generally no longer clustered around those of theideally staggered rotameric states, g−, g+, and t (SI Figure S8).For M1, E15, E24 and E56, the above considerations alonewere insufficient for making confident stereospecific assign-ments. These residues showed clear indications of extensiveside chain dynamics, as reflected in small ranges for theobserved RDCs, small chemical shift differences (≤0.2 ppm)between Hβ2 and Hβ3, and broad distributions of χ1 anglesobtained with the VW-Fit program when fitting the RDC datato the ensemble of 36 χ1 conformers (SI Figure S6). However,
as described below, for all but E15 the stereospecific assignmentcould be completed when fitting the RDCs to a small numberof discrete rotamers. Parenthetically, we note that a smallchemical shift difference between Hβ2 and Hβ3 alone is not asufficient indication of rotamer averaging as there are alsoresidues in GB3 with very small |δHβ2 − δHβ3| differences (<0.1ppm) that are well fit by single, narrow χ1 distributions (e.g.,K50, F52).
Discrete Rotamer Analysis. From the above model-freeVW-Fit analysis it is clear that for the vast majority of residuesχ1 angle distributions cluster around one or two values (SIFigure S6). We therefore also carried out fits of the RDC datato models where either a single χ1 rotamer is populated (onevariable in the fit, χ1), a fit with two χ1 rotamers (threeindependent variables: two χ1 values and one independentpopulation), and a fit to three χ1 rotamers (five independentvariables: three χ1 values and two independent populations). Inprinciple, the width of the distribution around each χ1maximum could also be used as an adjustable parameter,30
increasing the number of adjustable parameters by 1, 2, or 3 forthe 1-, 2-, and 3-rotamer models. However, in relatively few ofthese cases a statistically meaningful improvement in the fit (P< 0.05, Student t test, see below) was obtained over theassumption of a fixed standard deviation, σ = 10°, of a Gaussian
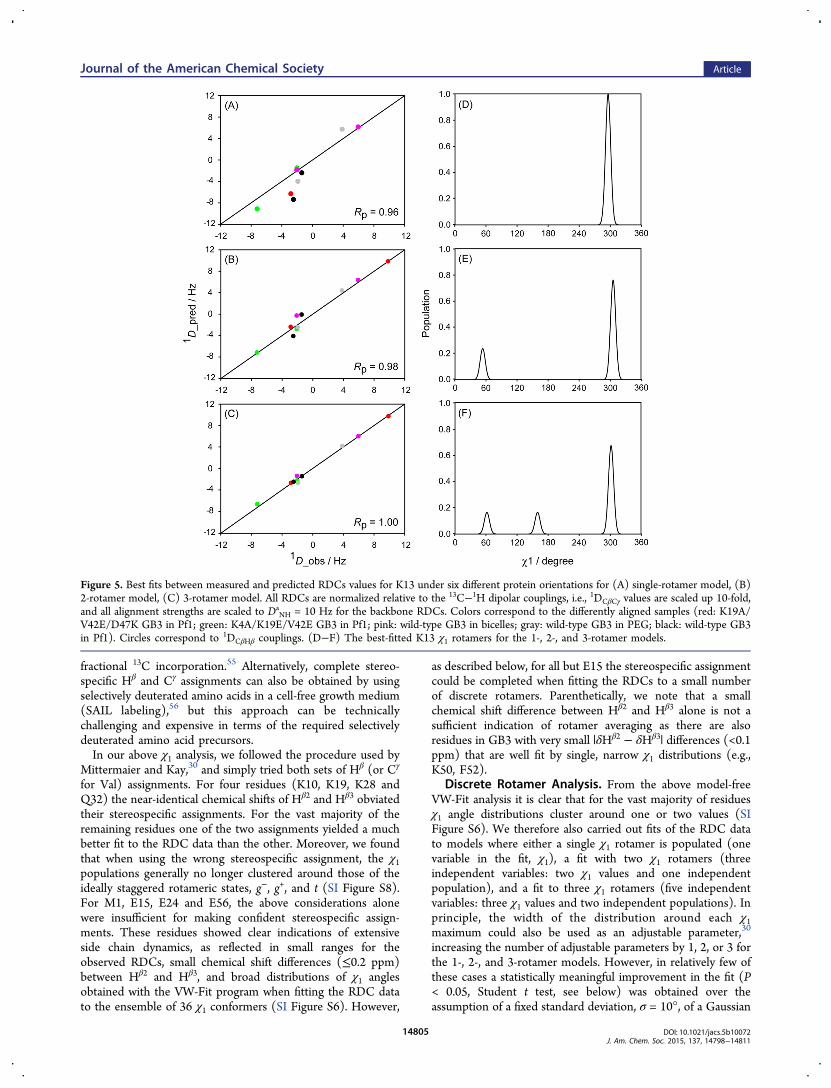
Figure 5. Best fits between measured and predicted RDCs values for K13 under six different protein orientations for (A) single-rotamer model, (B)2-rotamer model, (C) 3-rotamer model. All RDCs are normalized relative to the 13C−1H dipolar couplings, i.e., 1DCβCγ values are scaled up 10-fold,and all alignment strengths are scaled to Da
NH = 10 Hz for the backbone RDCs. Colors correspond to the differently aligned samples (red: K19A/V42E/D47K GB3 in Pf1; green: K4A/K19E/V42E GB3 in Pf1; pink: wild-type GB3 in bicelles; gray: wild-type GB3 in PEG; black: wild-type GB3in Pf1). Circles correspond to 1DCβHβ couplings. (D−F) The best-fitted K13 χ1 rotamers for the 1-, 2-, and 3-rotamer models.
Journal of the American Chemical Society Article
DOI: 10.1021/jacs.5b10072J. Am. Chem. Soc. 2015, 137, 14798−14811
14805
distribution centered around the optimized χ1 value(s). The σ =10° value was obtained from a shallow X minimum whensystematically varying σ (SI Figure S12), and was thereforeused in all 1-, 2-, and 3-rotamer-fit analyses.Evaluating which of the three models is applicable was
carried out by standard F statistics, where the validity ofdecreasing the degrees of freedom (NA) in the fit to model Aover a more complex model B (NB) for a given number ofexperimental observables (NRDC) was calculated from
= − − −F X X N N X N N( )/[( ) /( )]A2
B2
A B B2
RDC B (2)
and the conditional probability that a model with NB degrees offreedom is chosen erroneously over the simpler model isdefined by P(F, NA, NB).
57 In our analysis we have chosen arelatively high cutoff value of P = 0.1, but it is worth noting thateven if, for example, the 2-rotamer is chosen erroneously overthe 1-rotamer model, the population of the second rotamergenerally will be low. We also note that the most populatedrotamer chosen for residues with 0.01 ≤ P ≤ 0.1 invariablymoves closer to an ideally staggered conformation than whenusing the single rotamer model and yields better agreementwith the 3JHαHβ data (see below). Other than the experimentaldata there is no term driving such a selection, suggesting thatthe high P cutoff is physically reasonable. In practice, thepresence of a second rotamer at a population higher than ca.10% is detected quite unambiguously, in particular when 10 ormore RDCs are available for such a residue (Table 1). Onlyfour residues (K10, T11, K13, and E15), all located on the faceof the protein involved in IgG-binding, show population ofthree rotameric states. The improvement in the RDC fit forK13, obtained when using the 1-, 2-, and 3-rotamer models isillustrated in Figure 5. The presence of three rotameric statesfor K10 is not mandated by F statistics, but was selectedbecause the simpler 2-rotamer model yields highly skewed,unrealistic χ1 angles. Because the two Hβ protons aremagnetically equivalent, only six RDCs are available to definethe χ1 angle of this residue, and we therefore restricted the VW-Fit search to 9 conformers, representing the ideally staggeredg−, g+, and t conformers, plus the 6 conformers that deviate by±10° from these perfectly staggered conformations. For residueV21, the improvement in a 3-rotamer RDC fit over the 2-rotamer fit is acceptable based on F-statistics, but agrees lesswell with the experimental 3JHαHβ = 4.1 Hz value. It also resultsin a minor steric clash for one of the three rotamers, and the 2-rotamer solution is therefore selected for this residue. V21shows somewhat elevated backbone dynamics (S2 = 0.74, basedon RDC analysis24) and it is likely that the 2-state χ1 rotameraveraging for this loop residue is correlated with small changesin the backbone torsion angles (so-called “backrub motion”58),which somewhat lowers the quality of the RDC fit in our 2-rotamer analysis.The continuous χ1-population model discussed above did not
allow us to make reliable stereospecific assignment for fourresidues: M1, E15, E24 and E56. When fitting the RDCs ofthese residues with the discrete rotamer model, while takinginto account that significant populations of severely skewedrotamers (deviating >30° relative to the ideally staggeredconformers) are unfavorable and that Cγ atoms should notmake a serious steric clash with any backbone or Cβ atom, thispermitted additional stereospecific assignment of all but E15(SI Table S4).Uncertainty in ⟨χ1⟩ and Populations of Rotamers. As
mentioned above, the width of the χ1 distribution within a
given rotamer well is generally ill-defined by the RDC data. Forexample, assuming a Gaussian χ1 distribution within eachrotamer well of standard deviations σ yielded very similar fitqualities for any σ ≤ 15°, with a very shallow minimum for σ ≈10° (see SI Figure S12). The quality of the fit, however, is quitesensitive to population of the rotameric wells and to theiraverage ⟨χ1⟩ values. To evaluate how tightly these latter twoparameters are defined by the experimental data we resorted toa Monte Carlo analysis.59
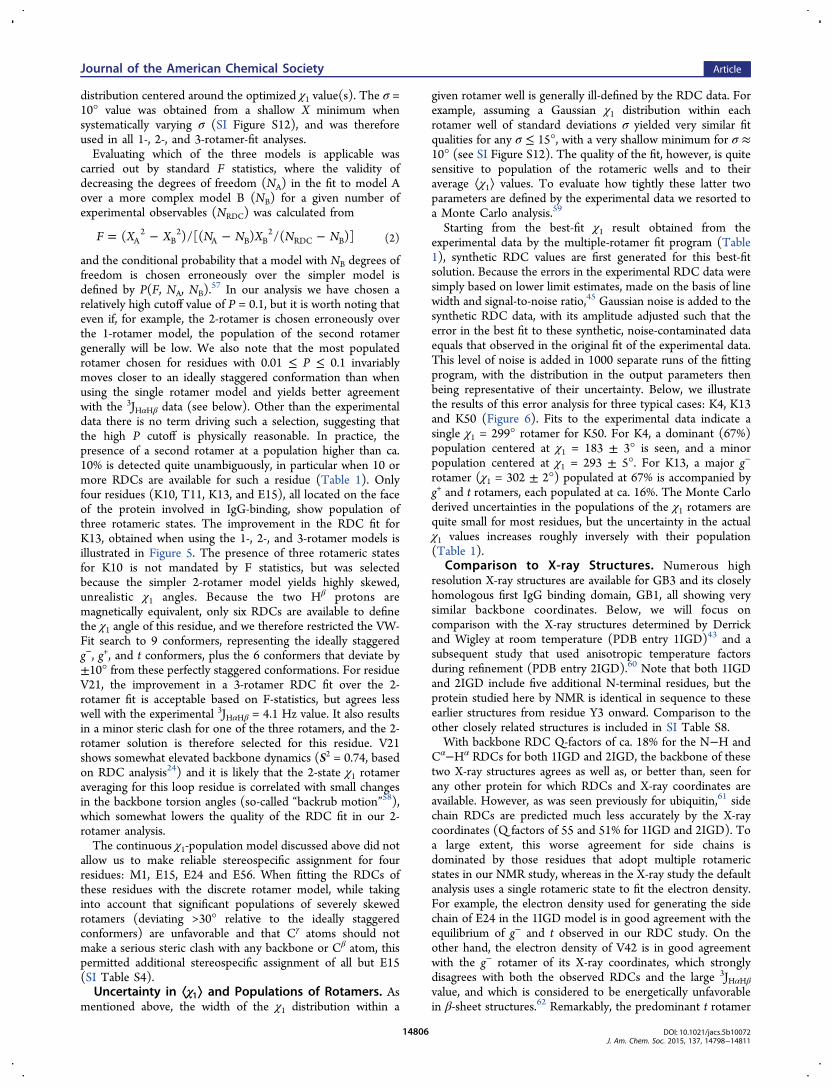
Starting from the best-fit χ1 result obtained from theexperimental data by the multiple-rotamer fit program (Table1), synthetic RDC values are first generated for this best-fitsolution. Because the errors in the experimental RDC data weresimply based on lower limit estimates, made on the basis of linewidth and signal-to-noise ratio,45 Gaussian noise is added to thesynthetic RDC data, with its amplitude adjusted such that theerror in the best fit to these synthetic, noise-contaminated dataequals that observed in the original fit of the experimental data.This level of noise is added in 1000 separate runs of the fittingprogram, with the distribution in the output parameters thenbeing representative of their uncertainty. Below, we illustratethe results of this error analysis for three typical cases: K4, K13and K50 (Figure 6). Fits to the experimental data indicate asingle χ1 = 299° rotamer for K50. For K4, a dominant (67%)population centered at χ1 = 183 ± 3° is seen, and a minorpopulation centered at χ1 = 293 ± 5°. For K13, a major g−
rotamer (χ1 = 302 ± 2°) populated at 67% is accompanied byg+ and t rotamers, each populated at ca. 16%. The Monte Carloderived uncertainties in the populations of the χ1 rotamers arequite small for most residues, but the uncertainty in the actualχ1 values increases roughly inversely with their population(Table 1).
Comparison to X-ray Structures. Numerous highresolution X-ray structures are available for GB3 and its closelyhomologous first IgG binding domain, GB1, all showing verysimilar backbone coordinates. Below, we will focus oncomparison with the X-ray structures determined by Derrickand Wigley at room temperature (PDB entry 1IGD)43 and asubsequent study that used anisotropic temperature factorsduring refinement (PDB entry 2IGD).60 Note that both 1IGDand 2IGD include five additional N-terminal residues, but theprotein studied here by NMR is identical in sequence to theseearlier structures from residue Y3 onward. Comparison to theother closely related structures is included in SI Table S8.With backbone RDC Q-factors of ca. 18% for the N−H and
Cα−Hα RDCs for both 1IGD and 2IGD, the backbone of thesetwo X-ray structures agrees as well as, or better than, seen forany other protein for which RDCs and X-ray coordinates areavailable. However, as was seen previously for ubiquitin,61 sidechain RDCs are predicted much less accurately by the X-raycoordinates (Q factors of 55 and 51% for 1IGD and 2IGD). Toa large extent, this worse agreement for side chains isdominated by those residues that adopt multiple rotamericstates in our NMR study, whereas in the X-ray study the defaultanalysis uses a single rotameric state to fit the electron density.For example, the electron density used for generating the sidechain of E24 in the 1IGD model is in good agreement with theequilibrium of g− and t observed in our RDC study. On theother hand, the electron density of V42 is in good agreementwith the g− rotamer of its X-ray coordinates, which stronglydisagrees with both the observed RDCs and the large 3JHαHβvalue, and which is considered to be energetically unfavorablein β-sheet structures.62 Remarkably, the predominant t rotamer
Journal of the American Chemical Society Article
DOI: 10.1021/jacs.5b10072J. Am. Chem. Soc. 2015, 137, 14798−14811
14806
seen in our NMR analysis can be accommodated in the crystallattice without causing steric clashing. It therefore appears likelythat less favorable hydration of the t rotamer within theconfines of the crystalline lattice is responsible for the differencebetween crystal and solution states for this residue. This resulthighlights that even in the absence of direct crystal contacts sidechain orientations may well differ between the solution andcrystalline states.Multiconformer refinement is possible for very high
resolution X-ray data, and four residues in the 2IGD X-raystructure of GB3 show significantly different pairs of χ1 values.
60
All but one of these (I7) correspond to residues for which ourRDC analysis also finds multiple conformers, mostly with verysimilar χ1 values and populations as the X-ray structure. Forexample, for V21 2IGD reports χ1 = 295/75°, with populations
of 62/38%, versus χ1 = 302/68° and populations of 60/40% inour RDC analysis (Table 1). Similarly, for N35 2IGD shows χ1= 189/291°, with populations of 50/50%, versus χ1 = 184/288°, with populations of 52/48% in our RDC analysis.For 20 of the GB3 residues, our above RDC analysis shows a
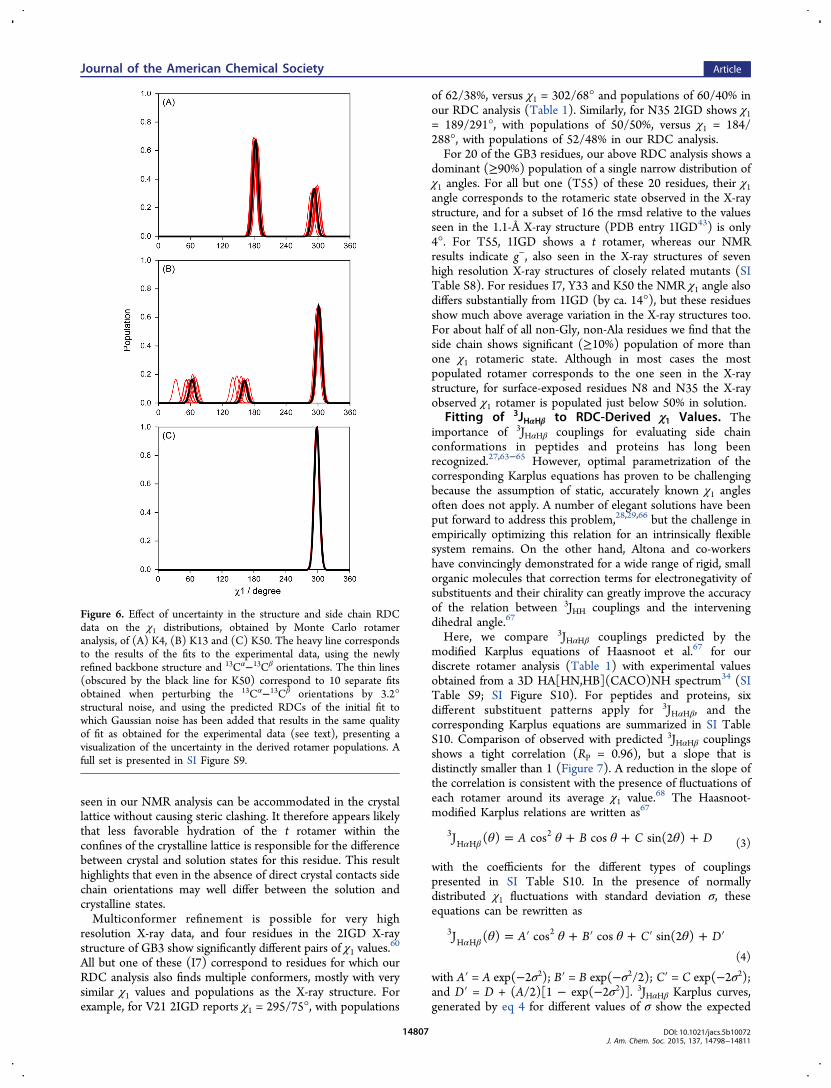
dominant (≥90%) population of a single narrow distribution ofχ1 angles. For all but one (T55) of these 20 residues, their χ1angle corresponds to the rotameric state observed in the X-raystructure, and for a subset of 16 the rmsd relative to the valuesseen in the 1.1-Å X-ray structure (PDB entry 1IGD43) is only4°. For T55, 1IGD shows a t rotamer, whereas our NMRresults indicate g−, also seen in the X-ray structures of sevenhigh resolution X-ray structures of closely related mutants (SITable S8). For residues I7, Y33 and K50 the NMR χ1 angle alsodiffers substantially from 1IGD (by ca. 14°), but these residuesshow much above average variation in the X-ray structures too.For about half of all non-Gly, non-Ala residues we find that theside chain shows significant (≥10%) population of more thanone χ1 rotameric state. Although in most cases the mostpopulated rotamer corresponds to the one seen in the X-raystructure, for surface-exposed residues N8 and N35 the X-rayobserved χ1 rotamer is populated just below 50% in solution.
Fitting of 3JHαHβ to RDC-Derived χ1 Values. Theimportance of 3JHαHβ couplings for evaluating side chainconformations in peptides and proteins has long beenrecognized.27,63−65 However, optimal parametrization of thecorresponding Karplus equations has proven to be challengingbecause the assumption of static, accurately known χ1 anglesoften does not apply. A number of elegant solutions have beenput forward to address this problem,28,29,66 but the challenge inempirically optimizing this relation for an intrinsically flexiblesystem remains. On the other hand, Altona and co-workershave convincingly demonstrated for a wide range of rigid, smallorganic molecules that correction terms for electronegativity ofsubstituents and their chirality can greatly improve the accuracyof the relation between 3JHH couplings and the interveningdihedral angle.67
Here, we compare 3JHαHβ couplings predicted by themodified Karplus equations of Haasnoot et al.67 for ourdiscrete rotamer analysis (Table 1) with experimental valuesobtained from a 3D HA[HN,HB](CACO)NH spectrum34 (SITable S9; SI Figure S10). For peptides and proteins, sixdifferent substituent patterns apply for 3JHαHβ, and thecorresponding Karplus equations are summarized in SI TableS10. Comparison of observed with predicted 3JHαHβ couplingsshows a tight correlation (RP = 0.96), but a slope that isdistinctly smaller than 1 (Figure 7). A reduction in the slope ofthe correlation is consistent with the presence of fluctuations ofeach rotamer around its average χ1 value.68 The Haasnoot-modified Karplus relations are written as67
θ θ θ θ= + + +α β A B C DJ ( ) cos cos sin(2 )3H H
2(3)
with the coefficients for the different types of couplingspresented in SI Table S10. In the presence of normallydistributed χ1 fluctuations with standard deviation σ, theseequations can be rewritten as
θ θ θ θ= ′ + ′ + ′ + ′α β A B C DJ ( ) cos cos sin(2 )3H H
2
(4)
with A′ = A exp(−2σ2); B′ = B exp(−σ2/2); C′ = C exp(−2σ2);and D′ = D + (A/2)[1 − exp(−2σ2)]. 3JHαHβ Karplus curves,generated by eq 4 for different values of σ show the expected
Figure 6. Effect of uncertainty in the structure and side chain RDCdata on the χ1 distributions, obtained by Monte Carlo rotameranalysis, of (A) K4, (B) K13 and (C) K50. The heavy line correspondsto the results of the fits to the experimental data, using the newlyrefined backbone structure and 13Cα−13Cβ orientations. The thin lines(obscured by the black line for K50) correspond to 10 separate fitsobtained when perturbing the 13Cα−13Cβ orientations by 3.2°structural noise, and using the predicted RDCs of the initial fit towhich Gaussian noise has been added that results in the same qualityof fit as obtained for the experimental data (see text), presenting avisualization of the uncertainty in the derived rotamer populations. Afull set is presented in SI Figure S9.
Journal of the American Chemical Society Article
DOI: 10.1021/jacs.5b10072J. Am. Chem. Soc. 2015, 137, 14798−14811
14807
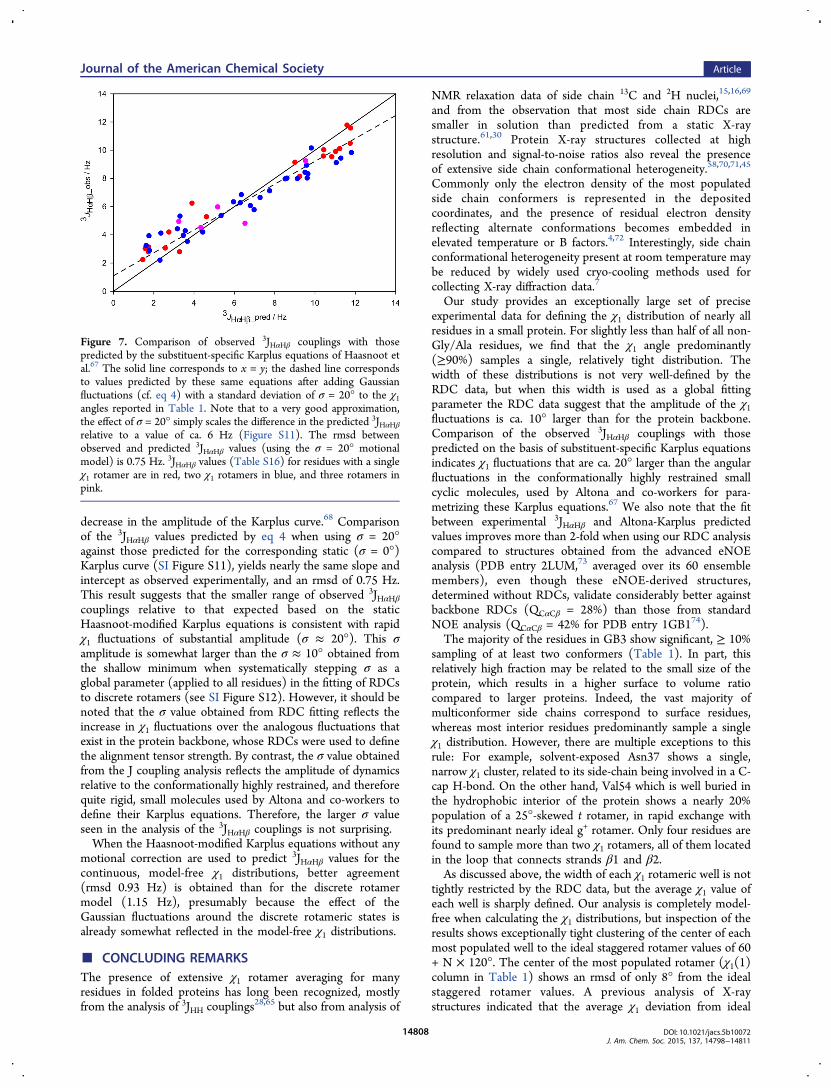
decrease in the amplitude of the Karplus curve.68 Comparisonof the 3JHαHβ values predicted by eq 4 when using σ = 20°against those predicted for the corresponding static (σ = 0°)Karplus curve (SI Figure S11), yields nearly the same slope andintercept as observed experimentally, and an rmsd of 0.75 Hz.This result suggests that the smaller range of observed 3JHαHβcouplings relative to that expected based on the staticHaasnoot-modified Karplus equations is consistent with rapidχ1 fluctuations of substantial amplitude (σ ≈ 20°). This σamplitude is somewhat larger than the σ ≈ 10° obtained fromthe shallow minimum when systematically stepping σ as aglobal parameter (applied to all residues) in the fitting of RDCsto discrete rotamers (see SI Figure S12). However, it should benoted that the σ value obtained from RDC fitting reflects theincrease in χ1 fluctuations over the analogous fluctuations thatexist in the protein backbone, whose RDCs were used to definethe alignment tensor strength. By contrast, the σ value obtainedfrom the J coupling analysis reflects the amplitude of dynamicsrelative to the conformationally highly restrained, and thereforequite rigid, small molecules used by Altona and co-workers todefine their Karplus equations. Therefore, the larger σ valueseen in the analysis of the 3JHαHβ couplings is not surprising.When the Haasnoot-modified Karplus equations without any
motional correction are used to predict 3JHαHβ values for thecontinuous, model-free χ1 distributions, better agreement(rmsd 0.93 Hz) is obtained than for the discrete rotamermodel (1.15 Hz), presumably because the effect of theGaussian fluctuations around the discrete rotameric states isalready somewhat reflected in the model-free χ1 distributions.
■ CONCLUDING REMARKSThe presence of extensive χ1 rotamer averaging for manyresidues in folded proteins has long been recognized, mostlyfrom the analysis of 3JHH couplings28,65 but also from analysis of
NMR relaxation data of side chain 13C and 2H nuclei,15,16,69
and from the observation that most side chain RDCs aresmaller in solution than predicted from a static X-raystructure.61,30 Protein X-ray structures collected at highresolution and signal-to-noise ratios also reveal the presenceof extensive side chain conformational heterogeneity.58,70,71,45
Commonly only the electron density of the most populatedside chain conformers is represented in the depositedcoordinates, and the presence of residual electron densityreflecting alternate conformations becomes embedded inelevated temperature or B factors.4,72 Interestingly, side chainconformational heterogeneity present at room temperature maybe reduced by widely used cryo-cooling methods used forcollecting X-ray diffraction data.7
Our study provides an exceptionally large set of preciseexperimental data for defining the χ1 distribution of nearly allresidues in a small protein. For slightly less than half of all non-Gly/Ala residues, we find that the χ1 angle predominantly(≥90%) samples a single, relatively tight distribution. Thewidth of these distributions is not very well-defined by theRDC data, but when this width is used as a global fittingparameter the RDC data suggest that the amplitude of the χ1fluctuations is ca. 10° larger than for the protein backbone.Comparison of the observed 3JHαHβ couplings with thosepredicted on the basis of substituent-specific Karplus equationsindicates χ1 fluctuations that are ca. 20° larger than the angularfluctuations in the conformationally highly restrained smallcyclic molecules, used by Altona and co-workers for para-metrizing these Karplus equations.67 We also note that the fitbetween experimental 3JHαHβ and Altona-Karplus predictedvalues improves more than 2-fold when using our RDC analysiscompared to structures obtained from the advanced eNOEanalysis (PDB entry 2LUM,73 averaged over its 60 ensemblemembers), even though these eNOE-derived structures,determined without RDCs, validate considerably better againstbackbone RDCs (QCαCβ = 28%) than those from standardNOE analysis (QCαCβ = 42% for PDB entry 1GB174).The majority of the residues in GB3 show significant, ≥ 10%
sampling of at least two conformers (Table 1). In part, thisrelatively high fraction may be related to the small size of theprotein, which results in a higher surface to volume ratiocompared to larger proteins. Indeed, the vast majority ofmulticonformer side chains correspond to surface residues,whereas most interior residues predominantly sample a singleχ1 distribution. However, there are multiple exceptions to thisrule: For example, solvent-exposed Asn37 shows a single,narrow χ1 cluster, related to its side-chain being involved in a C-cap H-bond. On the other hand, Val54 which is well buried inthe hydrophobic interior of the protein shows a nearly 20%population of a 25°-skewed t rotamer, in rapid exchange withits predominant nearly ideal g+ rotamer. Only four residues arefound to sample more than two χ1 rotamers, all of them locatedin the loop that connects strands β1 and β2.As discussed above, the width of each χ1 rotameric well is not
tightly restricted by the RDC data, but the average χ1 value ofeach well is sharply defined. Our analysis is completely model-free when calculating the χ1 distributions, but inspection of theresults shows exceptionally tight clustering of the center of eachmost populated well to the ideal staggered rotamer values of 60+ N × 120°. The center of the most populated rotamer (χ1(1)column in Table 1) shows an rmsd of only 8° from the idealstaggered rotamer values. A previous analysis of X-raystructures indicated that the average χ1 deviation from ideal
Figure 7. Comparison of observed 3JHαHβ couplings with thosepredicted by the substituent-specific Karplus equations of Haasnoot etal.67 The solid line corresponds to x = y; the dashed line correspondsto values predicted by these same equations after adding Gaussianfluctuations (cf. eq 4) with a standard deviation of σ = 20° to the χ1angles reported in Table 1. Note that to a very good approximation,the effect of σ = 20° simply scales the difference in the predicted 3JHαHβrelative to a value of ca. 6 Hz (Figure S11). The rmsd betweenobserved and predicted 3JHαHβ values (using the σ = 20° motionalmodel) is 0.75 Hz. 3JHαHβ values (Table S16) for residues with a singleχ1 rotamer are in red, two χ1 rotamers in blue, and three rotamers inpink.
Journal of the American Chemical Society Article
DOI: 10.1021/jacs.5b10072J. Am. Chem. Soc. 2015, 137, 14798−14811
14808
staggered rotamers for many residue types was a function ofcrystallographic resolution, a finding ascribed to the electrondensity of minor conformers skewing the average attributed tothe major conformer.75 In the analysis of X-ray structures, thestandard deviations of the rotamer distributions also werefound to decrease from >20° for structures determined at aresolution >2.0 Å to ca. 15° for structures solved at higherresolution (≤2.0 Å). Our study shows a substantial furtherreduction in these standard deviations, at least whenconsidering the most populated conformer for each residue(Table 1).Many of the lowly populated side chain χ1 conformers
identified in our study deviate substantially more from idealstaggered conformations (rmsd 22°) than the major χ1conformer. The low values of their populations suggests thatthese conformers are in energetically less favorable environ-ments, and steric clashing may cause their skewing away fromperfectly staggered states. On the other hand, our error analysisalso points to larger experimental uncertainty in the χ1 anglessampled by minor conformers (σχ1 in Table 1). For example,when considering Monte Carlo analysis of K13 (Figure 5B), thevariance in the χ1 angle of the major g− conformer (χ1 = 302°)is only 2° whereas the minor t conformer (16% populated)shows a highly skewed χ1 angle of 160° but with a standarddeviation of 11°.It can be noted that even while the values of the fitted χ1
torsion angles as well as their total rotamer populationssummed for given residue types agree well with the statisticsexhibited by structural databases,62,52 fitted site-specific χ1populations sampled by the individual residues differsignificantly from the database-derived aggregate values. Thisobservation indicates that selection of a given side chainrotamer is significantly influenced by its nonlocal tertiarycontacts. It also is worth noting that essentially all residueslocated in the regions around residues L12 and G41, known tobe the most dynamic based on the backbone 15N relaxationdata, exhibit the sampling of more than one χ1 rotamer,consistent with the rotameric selection being affected bytertiary contacts.It has long been recognized that RDC data collected for a
protein under multiple different alignment conditions carriesvaluable information on the distribution of atomic coordinatessampled.76,77 For ordered regions in well-structured proteins,the amplitudes of angular excursions tend to be rather modestfor the backbone N−H vectors, widely used for such studies,making accurate analysis of such data in terms of dynamicsquite challenging.3,25,78−80 By contrast, the changes in sidechain bond vector orientations associated with χ1 rotamerhopping are large and result in bond vector changes of ca. 110°,a value that maximizes its effect on the corresponding RDCs.Therefore, side chain RDCs are exquisitely well suited foranalyzing the χ1 rotameric averaging process. Our data showthat the most populated staggered conformer χ1 angles fall veryclose to those seen in atomic resolution X-ray structures ofsmall peptides, and those of proteins when extrapolated to aresolution of 0.8 Å.75 By contrast, the RDC data are relativelyinsensitive to small excursions within each rotameric well, aswas highlighted by the difference in well distributions obtainedwhen adding a small entropy term to the data analysis. Thisdifficulty in extracting the amplitude of fluctuations within eachrotameric well is akin to the above-mentioned challenges facedwhen quantifying from 15N−1H RDCs the relatively small
amplitudes of backbone motions typically seen in α-helices andβ-sheet.Although it may seem straightforward to extend our RDC χ1
analysis to any other protein, we need to point out that the verydetailed analysis presented here requires an extraordinaryamount of data, not easily collected for many other proteins.So, most side chain analyses by RDCs likely will remain morelimited in scope, and simply aim to ascertain whether a single χ1rotamer is populated, and which one. Our data provide strongevidence that if a single rotamer is populated, it will be veryclose to the ideally staggered conformation. This propertyallows a χ1 rotamer estimate to be made by simply comparingthe 1DCβHβ or 1DCβCγ to the backbone 1DCαHα and 1DCαC′couplings: For example, for Thr and χ1 = 300°, the Cβ−Hβ
vector is antiparallel to Cα−Hα, and they will have very similarRDCs. Again for Thr, but for χ1 = 180°, the Cβ−Cγ vector isantiparallel to Cα−Hα and its normalized RDC (or the linearlyrelated CγH3 methyl RDC81) will be close to 1DCαHα, whileCβ−Hβ will be antiparallel to the Cα−C′ vector, making theirnormalized RDCs equivalent. Similar analysis can be made forother residues, allowing straightforward evaluation of χ1, evenwithout recourse to a backbone structure. However, if such acursory analysis does not point to a single rotamer, establishingthe rotameric equilibrium and deviations from perfectlystaggered rotameric states rapidly requires far more data.GB3 is sufficiently small to allow generation of very long
molecular dynamics trajectories and the protein has been usedto evaluate the quality of computational methods by validationagainst experimental results.82−85 Our new results complementthese earlier experimental data by introducing detailed sidechain information, greatly extending its use for force fielddevelopment. Moreover, the model-free χ1 distributions derivedin our study will enable improved parametrization of the widerange of different Karplus parametrizations that have been incommon use for 3JNHβ,
3JC′Hβ,3JC′Cγ, and 3JNCγ.
28,29,86,87
Similarly, our data will provide a new benchmark for evaluatingthe impact of side chain conformations on chemical shifts, anarea that remains under-developed but holds strong potentialfor increasing the level of structural detail that can be extractedfrom these readily accessible parameters.88−91
■ ASSOCIATED CONTENT*S Supporting InformationThe Supporting Information is available free of charge on theACS Publications website at DOI: 10.1021/jacs.5b10072.
Experimental procedures and additional data. (PDF)
■ AUTHOR INFORMATIONCorresponding Author*[email protected] Address‡Key Laboratory of Pesticides and Chemical Biology, College ofChemistry, Central China Normal University, Wuhan, Hubei430079, People’s Republic of China.NotesThe authors declare no competing financial interest.
■ ACKNOWLEDGMENTSWe thank Dr. Yang Shen for assistance in data analysis andDennis Torchia for useful discussions. This work was supportedby the Intramural Research Program of the National Institute ofDiabetes and Digestive and Kidney Diseases and by the
Journal of the American Chemical Society Article
DOI: 10.1021/jacs.5b10072J. Am. Chem. Soc. 2015, 137, 14798−14811
14809
Intramural Antiviral Target Program of the Office of theDirector, NIH. F. Li acknowledges financial support from theChina Scholarship Council.
■ REFERENCES(1) Gardner, K. H.; Kay, L. E. Annu. Rev. Biophys. Biomol. Struct.1998, 27, 357−406.(2) Furnham, N.; Blundell, T. L.; DePristo, M. A.; Terwilliger, T. C.Nat. Struct. Mol. Biol. 2006, 13, 184−185.(3) Lange, O. F.; Lakomek, N. A.; Fares, C.; Schroder, G. F.; Walter,K. F. A.; Becker, S.; Meiler, J.; Grubmuller, H.; Griesinger, C.; deGroot, B. L. Science 2008, 320, 1471−1475.(4) Woldeyes, R. A.; Sivak, D. A.; Fraser, J. S. Curr. Opin. Struct. Biol.2014, 28, 56−62.(5) Fenwick, R. B.; van den Bedem, H.; Fraser, J. S.; Wright, P. E.Proc. Natl. Acad. Sci. U. S. A. 2014, 111, E445−E454.(6) Lang, P. T.; Holton, J. M.; Fraser, J. S.; Alber, T. Proc. Natl. Acad.Sci. U. S. A. 2014, 111, 237−242.(7) Fraser, J. S.; van den Bedem, H.; Samelson, A. J.; Lang, P. T.;Holton, J. M.; Echols, N.; Alber, T. Proc. Natl. Acad. Sci. U. S. A. 2011,108, 16247−16252.(8) Kay, L. E.; Torchia, D. A.; Bax, A. Biochemistry 1989, 28, 8972−8979.(9) Dayie, K. T.; Wagner, G.; Lefevre, J. F. Annu. Rev. Phys. Chem.1996, 47, 243−282.(10) Fushman, D.; Tjandra, N.; Cowburn, D. J. Am. Chem. Soc. 1999,121, 8577−8582.(11) d’Auvergne, E. J.; Gooley, P. R. J. Biomol. NMR 2003, 25, 25−39.(12) Richarz, R.; Nagayama, K.; Wuthrich, K. Biochemistry 1980, 19,5189−5196.(13) Nicholson, L. K.; Kay, L. E.; Baldisseri, D. M.; Arango, J.;Young, P. E.; Bax, A.; Torchia, D. A. Biochemistry 1992, 31, 5253−5263.(14) Lee, A. L.; Flynn, P. F.; Wand, A. J. J. Am. Chem. Soc. 1999, 121,2891−2902.(15) Muhandiram, D. R.; Yamazaki, T.; Sykes, B. D.; Kay, L. E. J. Am.Chem. Soc. 1995, 117, 11536−11544.(16) Yang, D. W.; Mittermaier, A.; Mok, Y. K.; Kay, L. E. J. Mol. Biol.1998, 276, 939−954.(17) Lipari, G.; Szabo, A. J. Am. Chem. Soc. 1982, 104, 4546−4559.(18) Mulder, F. A. A.; Mittermaier, A.; Hon, B.; Dahlquist, F. W.;Kay, L. E. Nat. Struct. Biol. 2001, 8, 932−935.(19) Palmer, A. G. Chem. Rev. 2004, 104, 3623−3640.(20) Mittermaier, A. K.; Kay, L. E. Trends Biochem. Sci. 2009, 34,601−611.(21) Peti, W.; Meiler, J.; Bruschweiler, R.; Griesinger, C. J. Am. Chem.Soc. 2002, 124, 5822−5833.(22) Tolman, J. R. J. Am. Chem. Soc. 2002, 124, 12020−12030.(23) Tolman, J. R.; Ruan, K. Chem. Rev. 2006, 106, 1720−1736.(24) Yao, L.; Vogeli, B.; Torchia, D. A.; Bax, A. J. Phys. Chem. B 2008,112, 6045−6056.(25) Maltsev, A. S.; Grishaev, A.; Roche, J.; Zasloff, M.; Bax, A. J. Am.Chem. Soc. 2014, 136, 3752−3755.(26) Dzakula, Z.; Westler, W. M.; Edison, A. S.; Markley, J. L. J. Am.Chem. Soc. 1992, 114, 6195−6199.(27) Dzakula, Z.; Edison, A. S.; Westler, W. M.; Markley, J. L. J. Am.Chem. Soc. 1992, 114, 6200−6207.(28) Perez, C.; Lohr, F.; Ruterjans, H.; Schmidt, J. M. J. Am. Chem.Soc. 2001, 123, 7081−7093.(29) Schmidt, J. M. J. Biomol. NMR 2012, 54, 97−114.(30) Mittermaier, A.; Kay, L. E. J. Am. Chem. Soc. 2001, 123, 6892−6903.(31) Ramirez, B. E.; Bax, A. J. Am. Chem. Soc. 1998, 120, 9106−9107.(32) Yao, L. S.; Bax, A. J. Am. Chem. Soc. 2007, 129, 11326−11327.(33) Ulmer, T. S.; Ramirez, B. E.; Delaglio, F.; Bax, A. J. Am. Chem.Soc. 2003, 125, 9179−9191.
(34) Lohr, F.; Schmidt, J. M.; Ruterjans, H. J. Am. Chem. Soc. 1999,121, 11821−11826.(35) Delaglio, F.; Grzesiek, S.; Vuister, G. W.; Zhu, G.; Pfeifer, J.;Bax, A. J. Biomol. NMR 1995, 6, 277−293.(36) Goddard, T. D.; Kneller, D. G. Sparky 3; University ofCalifornia: San Francisco, 2008.(37) Li, F.; Lee, J. H.; Grishaev, A.; Ying, J.; Bax, A. ChemPhysChem2015, 16, 572−578.(38) Lakomek, N. A.; Walter, K. F. A.; Fares, C.; Lange, O. F.; deGroot, B. L.; Grubmuller, H.; Bruschweiler, R.; Munk, A.; Becker, S.;Meiler, J.; Griesinger, C. J. Biomol. NMR 2008, 41, 139−155.(39) Tjandra, N.; Bax, A. Science 1997, 278, 1111−4.(40) Losonczi, J. A.; Prestegard, J. H. J. Biomol. NMR 1998, 12, 447−451.(41) Ruckert, M.; Otting, G. J. Am. Chem. Soc. 2000, 122, 7793−7797.(42) Hansen, M. R.; Mueller, L.; Pardi, A. Nat. Struct. Biol. 1998, 5,1065−1074.(43) Derrick, J. P.; Wigley, D. B. J. Mol. Biol. 1994, 243, 906−918.(44) Hus, J. C.; Peti, W.; Griesinger, C.; Bruschweiler, R. J. Am.Chem. Soc. 2003, 125, 5596−5597.(45) Bax, A.; Kontaxis, G.; Tjandra, N. Methods Enzymol. 2001, 339,127−174.(46) Doddrell, D. M.; Pegg, D. T.; Bendall, M. R. J. Magn. Reson.1982, 48, 323−327.(47) Vuister, G. W.; Bax, A. J. Magn. Reson. 1992, 98, 428−435.(48) Geen, H.; Freeman, R. J. Magn. Reson. 1991, 93, 93−141.(49) Zweckstetter, M.; Bax, A. J. Biomol. NMR 2002, 23, 127−137.(50) Engh, R. A.; Huber, R. Acta Crystallogr., Sect. A: Found.Crystallogr. 1991, 47, 392−400.(51) Ward, J. M.; Skrynnikov, N. R. J. Biomol. NMR 2012, 54, 53−67.(52) Lovell, S. C.; Word, J. M.; Richardson, J. S.; Richardson, D. C.Proteins: Struct., Funct., Genet. 2000, 40, 389−408.(53) Hall, J. B.; Fushman, D. J. Biomol. NMR 2003, 27, 261−275.(54) Guntert, P.; Braun, W.; Billeter, M.; Wuthrich, K. J. Am. Chem.Soc. 1989, 111, 3997−4004.(55) Neri, D.; Szyperski, T.; Otting, G.; Senn, H.; Wuthrich, K.Biochemistry 1989, 28, 7510−7516.(56) Kainosho, M.; Torizawa, T.; Iwashita, Y.; Terauchi, T.; Ono, A.M.; Guntert, P. Nature 2006, 440, 52−57.(57) Soper, D. S. p-Value Calculator for an F-Test, http://danielsoper.com/statcalc3/calc.aspx?id=7 (accessed November 1, 2015).(58) Davis, I. W.; Arendall, W. B.; Richardson, D. C.; Richardson, J.S. Structure 2006, 14, 265−274.(59) Bevington, P. R.; Robinson, D. K. Data Reduction and ErrorAnalysis for the Physical Sciences; McGraw-Hill: New York, 1992.(60) Butterworth, S.; Lamzin, V. L.; Wigley, D. B.; Derrick, J. P.;Wilson, K. P. Protein Data Bank, entry 2IGD, 1997; http://www.rcsb.org/pdb/files/2IGD.pdb.(61) Bax, A. Protein Sci. 2003, 12, 1−16.(62) Dunbrack, R. L.; Karplus, M. Nat. Struct. Biol. 1994, 1, 334−340.(63) Feeney, J. J. Magn. Reson. 1976, 21, 473−478.(64) Demarco, A.; Llinas, M.; Wuthrich, K. Biopolymers 1978, 17,617−636.(65) Kariminejad, Y.; Schmidt, J. M.; Ruterjans, H.; Schwalbe, H.;Griesinger, C. Biochemistry 1994, 33, 5481−5492.(66) Schmidt, J. M. J. Biomol. NMR 2007, 37, 287−301.(67) Haasnoot, C. A. G.; Deleeuw, F.; Altona, C. Tetrahedron 1980,36, 2783−2792.(68) Bruschweiler, R.; Case, D. A. J. Am. Chem. Soc. 1994, 116,11199−11200.(69) Igumenova, T. I.; Frederick, K. K.; Wand, A. J. Chem. Rev. 2006,106, 1672−1699.(70) Smith, J. L.; Hendrickson, W. A.; Honzatko, R. B.; Sheriff, S.Biochemistry 1986, 25, 5018−5027.(71) Lang, P. T.; Ng, H.-L.; Fraser, J. S.; Corn, J. E.; Echols, N.; Sales,M.; Holton, J. M.; Alber, T. Protein Sci. 2010, 19, 1420−1431.(72) Kuriyan, J.; Petsko, G. A.; Levy, R. M.; Karplus, M. J. Mol. Biol.1986, 190, 227−254.
Journal of the American Chemical Society Article
DOI: 10.1021/jacs.5b10072J. Am. Chem. Soc. 2015, 137, 14798−14811
14810
(73) Vogeli, B.; Kazemi, S.; Guntert, P.; Riek, R. Nat. Struct. Mol. Biol.2012, 19, 1053−1058.(74) Gronenborn, A. M.; Filpula, D. R.; Essig, N. Z.; Achari, A.;Whitlow, M.; Wingfield, P. T.; Clore, G. M. Science 1991, 253, 657−661.(75) MacArthur, M. W.; Thornton, J. M. Acta Crystallogr., Sect. D:Biol. Crystallogr. 1999, 55, 994−1004.(76) Meiler, J.; Prompers, J. J.; Peti, W.; Griesinger, C.; Bruschweiler,R. J. Am. Chem. Soc. 2001, 123, 6098−6107.(77) Tolman, J. R. Curr. Opin. Struct. Biol. 2001, 11, 532−539.(78) Briggman, K. B.; Tolman, J. R. J. Am. Chem. Soc. 2003, 125,10164−10165.(79) Fenwick, R. B.; Esteban-Martin, S.; Richter, B.; Lee, D.; Walter,K. F. A.; Milovanovic, D.; Becker, S.; Lakomek, N. A.; Griesinger, C.;Salvatella, X. J. Am. Chem. Soc. 2011, 133, 10336−10339.(80) Bouvignies, G.; Bernado, P.; Meier, S.; Cho, K.; Grzesiek, S.;Bruschweiler, R.; Blackledge, M. Proc. Natl. Acad. Sci. U. S. A. 2005,102, 13885−13890.(81) Ottiger, M.; Bax, A. J. Am. Chem. Soc. 1999, 121, 4690−4695.(82) Olsson, S.; Voegeli, B. R.; Cavalli, A.; Boomsma, W.;Ferkinghoff-Borg, J.; Lindorff-Larsen, K.; Hamelryck, T. J. Chem.Theory Comput. 2014, 10, 3484−3491.(83) Granata, D.; Camilloni, C.; Vendruscolo, M.; Laio, A. Proc. Natl.Acad. Sci. U. S. A. 2013, 110, 6817−6822.(84) Li, T.; Jing, Q.; Yao, L. J. Phys. Chem. B 2011, 115, 3488−3495.(85) Markwick, P. R. L.; Bouvignies, G.; Blackledge, M. J. Am. Chem.Soc. 2007, 129, 4724−4730.(86) Bystrov, V. F. Prog. Nucl. Magn. Reson. Spectrosc. 1976, 10, 41−81.(87) Salvador, P. Dependencies of J-Couplings upon Dihedral Angleson Proteins. In Annual Reports on NMR Spectroscopy; Elsevier Ltd.:Amsterdam, 2014; Vol. 81, pp 185−227.(88) London, R. E.; Wingad, B. D.; Mueller, G. A. J. Am. Chem. Soc.2008, 130, 11097−11105.(89) Hansen, D. F.; Kay, L. E. J. Am. Chem. Soc. 2011, 133, 8272−8281.(90) Wishart, D. S. Prog. Nucl. Magn. Reson. Spectrosc. 2011, 58, 62−87.(91) Hansen, D. F.; Neudecker, P.; Kay, L. E. J. Am. Chem. Soc. 2010,132, 7589−7591.
Journal of the American Chemical Society Article
DOI: 10.1021/jacs.5b10072J. Am. Chem. Soc. 2015, 137, 14798−14811
14811