Embed Size (px)
Citation preview
1
SupplementaryInformation Comparison of selenophene and thienothiophene incorporation into pentacyclic lactam-based conjugated polymers for organic solar cells
Renee Kroona,c*†, Armantas Melianasb*†, Wenliu Zhuangc, Jonas Bergqvistb, Amaia Diaz de Zerio Mendazac, Timothy T. Stecklerc, Liyang Yud, Siobhan J. Bradleya, Chiara Musumecib, Desta Gedefawc, Thomas Nanna, Aram Amassiand, Christian Müllerc, Olle Inganäsb* and Mats R. Anderssona,c a: Ian Wark Research Institute, University of South Australia, Mawson Lakes Boulevard, Adelaide, SA 5095 (Australia), E-mail: [email protected] b:Department of Physics, Chemistry and Biology, Linköping University, 581 83 Linköping (Sweden) c: Department of Chemical and Biological Engineering, Chalmers University of Technology, 41296, Göteborg (Sweden) d: Material Science and Engineering Program, Division of Physical Science and Engineering, King Abdullah University of Science and Technology, Thuwal 23955-6900, Saudi Arabia
*: [email protected], [email protected], [email protected] and [email protected]
†: These authors contributed equally to this work.
ContentsSupplementary Information .................................................................................................... 1
1 – Material Characterization details and NMR data ...................................................... 2
2 – Square-Wave Voltammetry, TGA and GIWAXS ..................................................... 11
3 – AFM of pristine polymer films .................................................................................... 12
4 – Solar cell characterization details ............................................................................... 14
5 – Reproducibility of photovoltaic devices ..................................................................... 16
6 – Charge carrier mobility from SCLC .......................................................................... 16
7 – Absorption coefficients and scaling to IQE ................................................................ 17
8 – Optical constants and device reflectance ................................................................... 17
Electronic Supplementary Material (ESI) for Polymer Chemistry.This journal is © The Royal Society of Chemistry 2015
2
1–MaterialCharacterizationdetailsandNMRdata Characterization details 1H-NMR and 13C NMR spectra have been measured on an automated Agilent (Varian) MR 400 MHz spectrometer (equipped with "one-probe") with CDCl3 as the solvent. In all cases, the peak values were calibrated relative to tetramethyl silane. Size exclusion chromatography (SEC) was performed on Waters Alliance GPCV2000 with a refractive index detector columns: Waters Styvagel HT GE×1, Waters Styvagel HMW GE×2. The eluent was 1,2,4-trichlorobenzene. The operating temperature was 135 °C, and the dissolution time was 2 h. The concentration of the samples was 0.5 mg mL−1, which were filtered (filter: 0.45 µm) prior to analysis. The molecular weights were calculated according relative calibration with polystyrene standards. UV-Vis/near IR absorption spectra were measured with a Perkin Elmer Lambda 900 UV-Vis-NIR absorption spectrometer. Thermal gravimetric analysis (TGA) measurements were done on a Perkin Elmer TGA7 Thermo Graphic Analyzer, temperature range 30-600 °C, heating rate 10°C/min. Square-wave voltammetry (SWV) measurements were carried out on a CH-Instruments 650A Electrochemical Workstation. A three-electrode setup was used with platinum wires both as working electrode and counter electrode, and Ag/Ag+ used as reference electrode calibrated with Fc/Fc+. A 0.1 M solution of tetrabutylammonium hexafluorophosphate (Bu4NPF6) in anhydrous acetonitrile was used as supporting electrolyte. The polymers were deposited onto the working electrode from chloroform solution. In order to remove oxygen from the electrolyte, the system was bubbled with nitrogen prior to each experiment. The nitrogen inlet was then moved to above the liquid surface and left there during the scans. HOMO and LUMO levels were estimated from peak onset potentials of the third scan by setting the oxidative peak potential of Fc/Fc+ vs. the normal hydrogen electrode (NHE) to
0.630 V, and the NHE vs. the vacuum level to 4.5 V. Grazing-Incident Wide-angle X-ray Scattering (GIWAXS) measurements were performed at D-line, Cornell High Energy Synchrotron Source (CHESS) in Cornell University. The X-ray with a wavelength of 1.155Å was focused on the samples placed on a 5-axis sample goniometer with a grazing incident angle of 0.2°. A Platus 200k detector with a total area of 84×70 mm and pixel size of 172×172 µm was placed at a distance of 190.77 mm away from the sample to collect the 2D image of the diffractions. A 1.5 mm wide tantalum rod was used to block the intense scattering in the vicinity of the direct beam. The exposure time was set to 5 s for P2 and 10 s for P1. Transmission electron microscopy (TEM) Samples were prepared by floating off spin-coated films on PEDOT:PSS coated glass substrates in water, followed by collection with TEM copper mesh grids. TEM images were recorded with a JEOL 2100F instrument operated at an acceleration voltage of 200 kV. Atomic force microscopy (AFM) was performed in a Dimension 3100 atomic force microscope equipped with a NanoScope IVa controller (Veeco). The microscope was operated in tapping mode using commercial silicon cantilevers having a nominal spring constant of 40 N/m. Topography and phase images were acquired on samples deposited on glass or ITO substrates, under similar conditions used for device fabrication. Device characterization. Photovoltaic devices in inverted device geometry were fabricated on glass substrates, which were first washed with a detergent and then TL-1 treated. Ti(2 nm)/Al(80 nm) cathode was thermally evaporated onto the glass substrate through a shadow mask at pressure less than 10−5 mbar. PFPA-1 interlayer was then spin-coated (inside the glovebox) on top of the TiOx surface from a 2 mg/mL toluene solution and then rinsed by o-dichlorobenzene (oDCB) for 30 s. The active layer was then spin-coated on
3
top of the PFPA-1 modified cathode from one of the solutions indicated in section 4 of the SI. Following the deposition of the active layer, the substrate was transferred from the glove box to a laminar flow bench in which a PEDOT:PSS PH1000 solution purchased from H.C. Starck and mixed with 5% dimethyl sulfoxide (DMSO) and 0.5% surfactant (Zonyl FS 300) was spin-coated on top of the active layer at 1000 rpm for 60 s followed by annealing at 60 °C for 20 seconds. The completed solar cell was then transferred back to the glovebox and encapsulated with a photo-sensitive glue and a glass lid. Photovoltaic devices in standard device geometry were fabricated on ITO-patterned glass substrates. Substrates were first washed with a detergent, followed by TL-1 treatment and then oxygen-plasma treated for 1 min prior to the deposition of the PEDOT:PSS electrode (Heraeus, Clevios P VP Al 4083, annealed at 120 °C for 10 min after spin-coating, thickness ~ 40 nm). The active layer was then spin-coated from one of the solutions listed in section 4 of the SI, heated at 50 °C for ~ 3h prior to deposition. A LiF layer (thickness ~ 6 Å) and aluminum (thickness ~ 90 nm) top electrodes were deposited via thermal evaporation under vacuum below 10-5 mbar. The completed solar cell was then encapsulated with a photo-sensitive glue and a glass lid. J-V curves were recorded with a Keithley 2400 Source Meter under AM 1.5G illumination with an intensity of 100 mW cm-2 from a solar simulator (Model SS50A, Photo Emission Tech., Inc.). The light source used was a 180 watt xenon arc lamp solar simulator (Photo Emission Tech.); the intensity of the lamp was calibrated using a standard silicon photodiode calibrated at the Energy Research Centre of the Netherlands (ECN). The active area of the solar cells was carefully calibrated by an optical microscope, all solar cells had an active area of roughly ~ 4.6 mm2. Active layer thickness was measured by a Dektak surface profiler. External quantum efficiency (EQE) spectra were recorded with a home-built setup using a Newport Merlin lock-in amplifier. Devices were illuminated with chopped monochromatic light through the transparent electrode. Measured EQE spectra were scaled so that the estimated short-circuit density from the EQE measurement would match the short-circuit density of the corresponding J-V curve. Fourier-transform photocurrent spectroscopy (FTPS) measurements were carried out using a Vertex 70 from Bruker optics. FTPS spectra were scaled to match the EQE measurement of the corresponding photovoltaic device. Electroluminescence (EL) and Photoluminescence (PL) spectra were recorded by an Andor spectrometer (Shamrock sr-303i-B, coupled to a Newton EMCCD detector). For PL measurements films were excited using a blue PMM-208G-VT laser pump with a wavelength of 405nm. For EL measurements devices were connected to an external current/voltage source. EQE of electroluminescence (EQEEL) was obtained by a home-built system comprising a Hamamatsu silicon photodiode 1010B, a Keithley 2400 for supplying voltages and recording the injected current, and a Keithley 485 for measuring the emitted light intensity. Space-charge limited currents (SCLC) were investigated in the following device structures: Al/TiOx/PEIE/Polymer:PC71BM/LiF/Al for electron-only and ITO/PEDOT:PSS/Polymer:PC71BM/MoO3/Al for hole-only devices. Active layers were spin-coated using identical spin settings as for the solar cell devices. Their current-voltage characteristics in the dark were recorded with a Keithley 2400 Source Meter and are given in section 6 of the SI. Variable Angle Spectroscopic Ellipsometry (VASE) was performed on films cast at solar cell processing conditions on silicon substrates at 45, 55, 65 and 75 degrees incident angles using a RC2 ellipsometer from J.A. Woolam Co., Inc. Optical constants were
4
modelled using the software CompleteEase from J.A. Woolam Co., Inc. A Cauchy model below the bandgap was used to determine the thin film thickness, later verified by a Dektak surface profiler. The full spectrum from 300 to 1690 nm was then modelled using Kramers-Kronig consistent b-splines. For verification of the blend optical constants also pristine materials were measured and modelled. A Bruggeman effective medium model with a depolarization of 0.33 was then used to confirm the blend model. However, it was not possible to model the pristine P2 film with a low enough mean square error, neither using isotropic nor uniaxially anisotropic models. We propose that it is due to the strong crystallinity of the material, as evident by light scattering of the film upon visual inspection. Transfer Matrix Model (TMM) simulations for IQE calculations were performed using a custom written MATLAB code. The thickness of the active layer was set to match the measured thicknesses and then fine-tuned to obtain the best match between the experimentally measured and calculated device reflectance. Synthetic procedures Unless otherwise stated, all reactions were performed under nitrogen. All chemicals except for 2,5-bis(trimethylstannyl)thieno[3,2-b]thiophene (Solarmer) were bought from Sigma-Aldrich and recrystallized from ethanol prior to use. All other chemicals and solvents were used as received. Tert-butyl (2-(trimethylstannyl)thiophen-3-yl)carbamate (1): To a flame-dried flask, diisopropylamine (1.02 g, 10.0 mmol) was dissolved in 10 mL dry THF and cooled down to -78 °C after which n-BuLi (2.5M, 4 mL) was added dropwise. After reacting for 30 minutes, a solution of tert-butyl thiophen-3-ylcarbamate (1 g, 5.02 mmol) in THF (10 mL) was added dropwise. The reaction was continued for 1 hour and subsequently quenched with trimethyltin chloride (1M, 11 mL) and the reaction brought to RT, stirred for 1 hour and quenched with a saturated ammonium chloride solution. After extraction with diethyl ether, drying of the organic phase on Na2SO4, filtration and vacuum evaporation, the target compound was obtained as an off-white crystalline solid (1.79 g) which was used in the next reaction step without purification. 1H NMR (400 MHz, Chloroform-d) δ 7.49 (d, J = 4.8 Hz, 1H), 7.13 (d, J = 4.8 Hz, 1H), 6.38 (s, 1H), 1.50 (s, 9H), 0.37 (s, 9H). 13C NMR (101 MHz, Chloroform-d) δ 157.58, 132.09, 130.26, 124.59, 120.91, 83.73, 28.27, -9.32. Tert-butyl 2-bromothiophen-3-ylcarbamate (2): To a dry flask tert-butyl thiophen-3-ylcarbamate (820 mg, 4.12 mmol), NBS (733 mg, 4.12 mmol) and CCl4 (20 mL) were added and refluxed for 3 hours. The reaction was cooled down to RT, DCM was added and the organic phase washed 3 times with water, dried on MgSO4 and evaporated to dryness to afford an brown oil. Subsequent purification via column chromatography (1:1 PE:CHCl3) afforded 1.05 g (92%) of the title compound as a colorless oil which solidified over time. 1H NMR (400 MHz, Chloroform-d) δ 7.56 (s, 1H), 7.24 (d, J = 6.0 Hz, 1H), 6.57 (s, 1H), 1.53 (s, 9H). δ C (101 MHz, Chloroform-d) 206.67, 152.13, 135.69, 124.78, 121.65, 109.99, 28.34. Diethyl 2,5-bis(4,4,5,5-tetramethyl-1,3,2-dioxaborolan-2-yl)terephthalate (3): To a dry flask diethyl 2,5-dibromoterephthalate (1g, 2.63 mmol), bis(pinnacolato)diboron (3.13 g, 12.36 mmol), 1,1′bis(diphenylphosphino)ferrocene]dichloropalladium(II) (126.2 mg, 5 mol%), potassium acetate
5
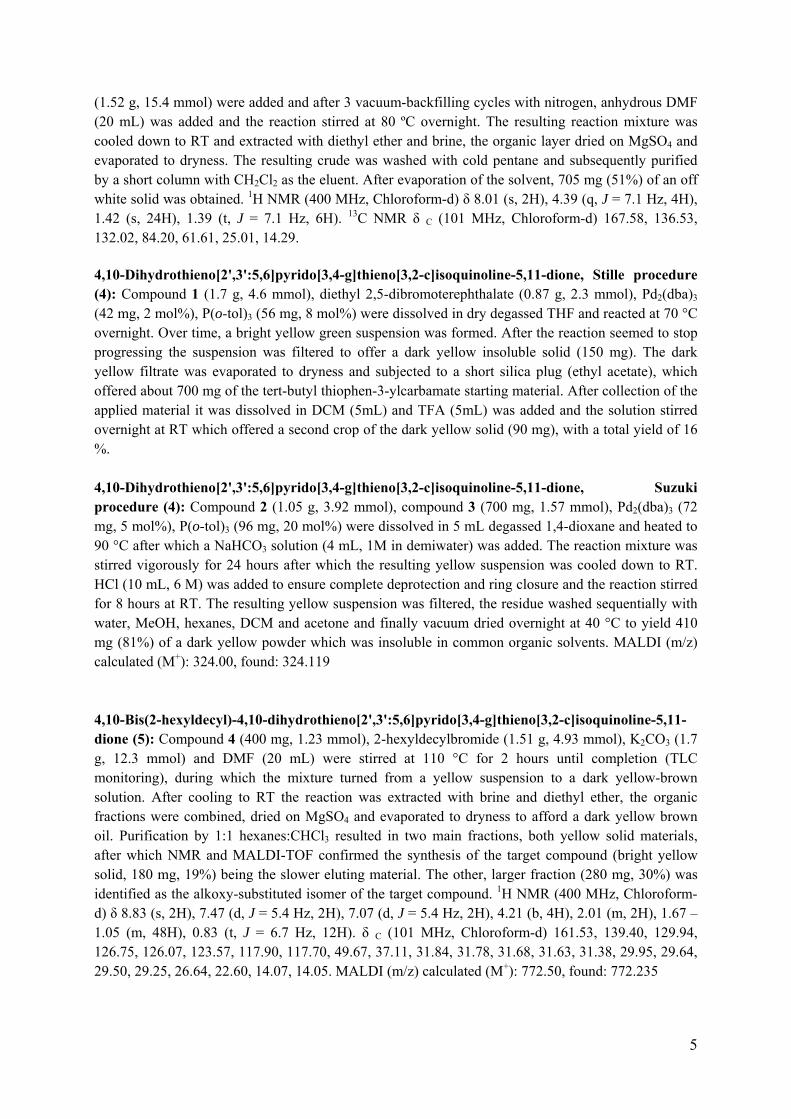
(1.52 g, 15.4 mmol) were added and after 3 vacuum-backfilling cycles with nitrogen, anhydrous DMF (20 mL) was added and the reaction stirred at 80 ºC overnight. The resulting reaction mixture was cooled down to RT and extracted with diethyl ether and brine, the organic layer dried on MgSO4 and evaporated to dryness. The resulting crude was washed with cold pentane and subsequently purified by a short column with CH2Cl2 as the eluent. After evaporation of the solvent, 705 mg (51%) of an off white solid was obtained. 1H NMR (400 MHz, Chloroform-d) δ 8.01 (s, 2H), 4.39 (q, J = 7.1 Hz, 4H), 1.42 (s, 24H), 1.39 (t, J = 7.1 Hz, 6H). 13C NMR δ C (101 MHz, Chloroform-d) 167.58, 136.53, 132.02, 84.20, 61.61, 25.01, 14.29.
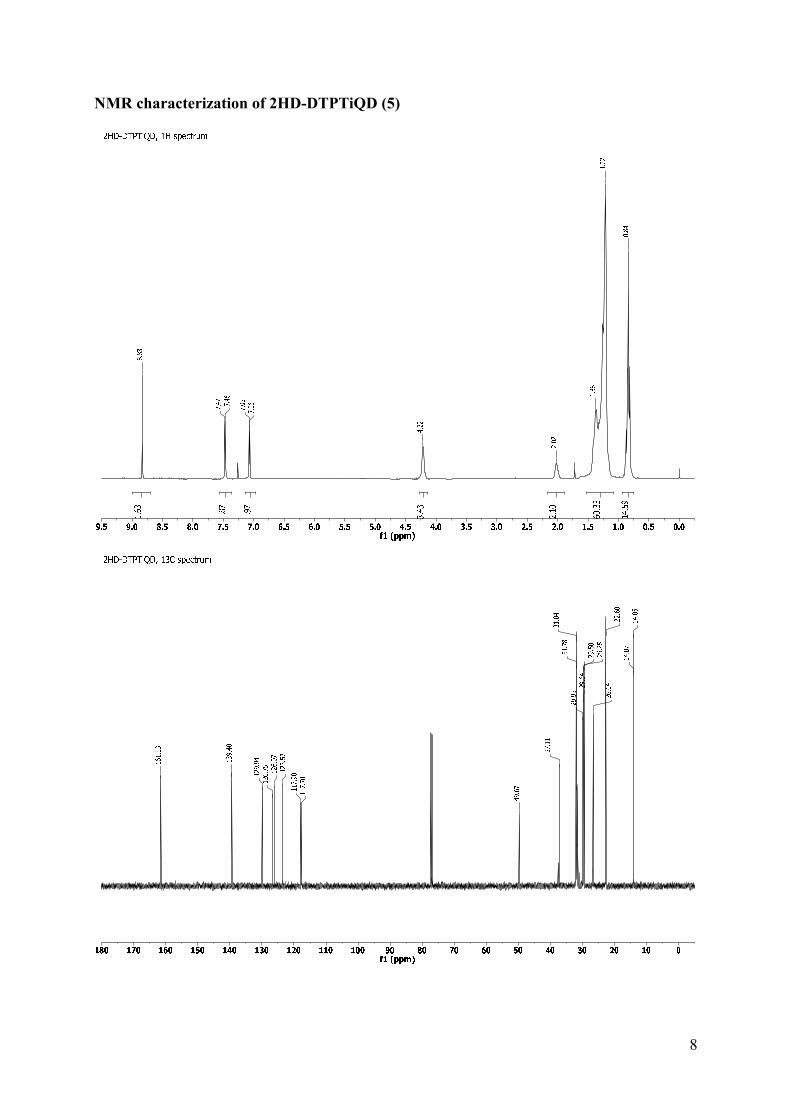
4,10-Dihydrothieno[2',3':5,6]pyrido[3,4-g]thieno[3,2-c]isoquinoline-5,11-dione, Stille procedure (4): Compound 1 (1.7 g, 4.6 mmol), diethyl 2,5-dibromoterephthalate (0.87 g, 2.3 mmol), Pd2(dba)3 (42 mg, 2 mol%), P(o-tol)3 (56 mg, 8 mol%) were dissolved in dry degassed THF and reacted at 70 °C overnight. Over time, a bright yellow green suspension was formed. After the reaction seemed to stop progressing the suspension was filtered to offer a dark yellow insoluble solid (150 mg). The dark yellow filtrate was evaporated to dryness and subjected to a short silica plug (ethyl acetate), which offered about 700 mg of the tert-butyl thiophen-3-ylcarbamate starting material. After collection of the applied material it was dissolved in DCM (5mL) and TFA (5mL) was added and the solution stirred overnight at RT which offered a second crop of the dark yellow solid (90 mg), with a total yield of 16 %. 4,10-Dihydrothieno[2',3':5,6]pyrido[3,4-g]thieno[3,2-c]isoquinoline-5,11-dione, Suzuki procedure (4): Compound 2 (1.05 g, 3.92 mmol), compound 3 (700 mg, 1.57 mmol), Pd2(dba)3 (72 mg, 5 mol%), P(o-tol)3 (96 mg, 20 mol%) were dissolved in 5 mL degassed 1,4-dioxane and heated to 90 °C after which a NaHCO3 solution (4 mL, 1M in demiwater) was added. The reaction mixture was stirred vigorously for 24 hours after which the resulting yellow suspension was cooled down to RT. HCl (10 mL, 6 M) was added to ensure complete deprotection and ring closure and the reaction stirred for 8 hours at RT. The resulting yellow suspension was filtered, the residue washed sequentially with water, MeOH, hexanes, DCM and acetone and finally vacuum dried overnight at 40 °C to yield 410 mg (81%) of a dark yellow powder which was insoluble in common organic solvents. MALDI (m/z) calculated (M+): 324.00, found: 324.119 4,10-Bis(2-hexyldecyl)-4,10-dihydrothieno[2',3':5,6]pyrido[3,4-g]thieno[3,2-c]isoquinoline-5,11-dione (5): Compound 4 (400 mg, 1.23 mmol), 2-hexyldecylbromide (1.51 g, 4.93 mmol), K2CO3 (1.7 g, 12.3 mmol) and DMF (20 mL) were stirred at 110 °C for 2 hours until completion (TLC monitoring), during which the mixture turned from a yellow suspension to a dark yellow-brown solution. After cooling to RT the reaction was extracted with brine and diethyl ether, the organic fractions were combined, dried on MgSO4 and evaporated to dryness to afford a dark yellow brown oil. Purification by 1:1 hexanes:CHCl3 resulted in two main fractions, both yellow solid materials, after which NMR and MALDI-TOF confirmed the synthesis of the target compound (bright yellow solid, 180 mg, 19%) being the slower eluting material. The other, larger fraction (280 mg, 30%) was identified as the alkoxy-substituted isomer of the target compound. 1H NMR (400 MHz, Chloroform-d) δ 8.83 (s, 2H), 7.47 (d, J = 5.4 Hz, 2H), 7.07 (d, J = 5.4 Hz, 2H), 4.21 (b, 4H), 2.01 (m, 2H), 1.67 – 1.05 (m, 48H), 0.83 (t, J = 6.7 Hz, 12H). δ C (101 MHz, Chloroform-d) 161.53, 139.40, 129.94, 126.75, 126.07, 123.57, 117.90, 117.70, 49.67, 37.11, 31.84, 31.78, 31.68, 31.63, 31.38, 29.95, 29.64, 29.50, 29.25, 26.64, 22.60, 14.07, 14.05. MALDI (m/z) calculated (M+): 772.50, found: 772.235
6
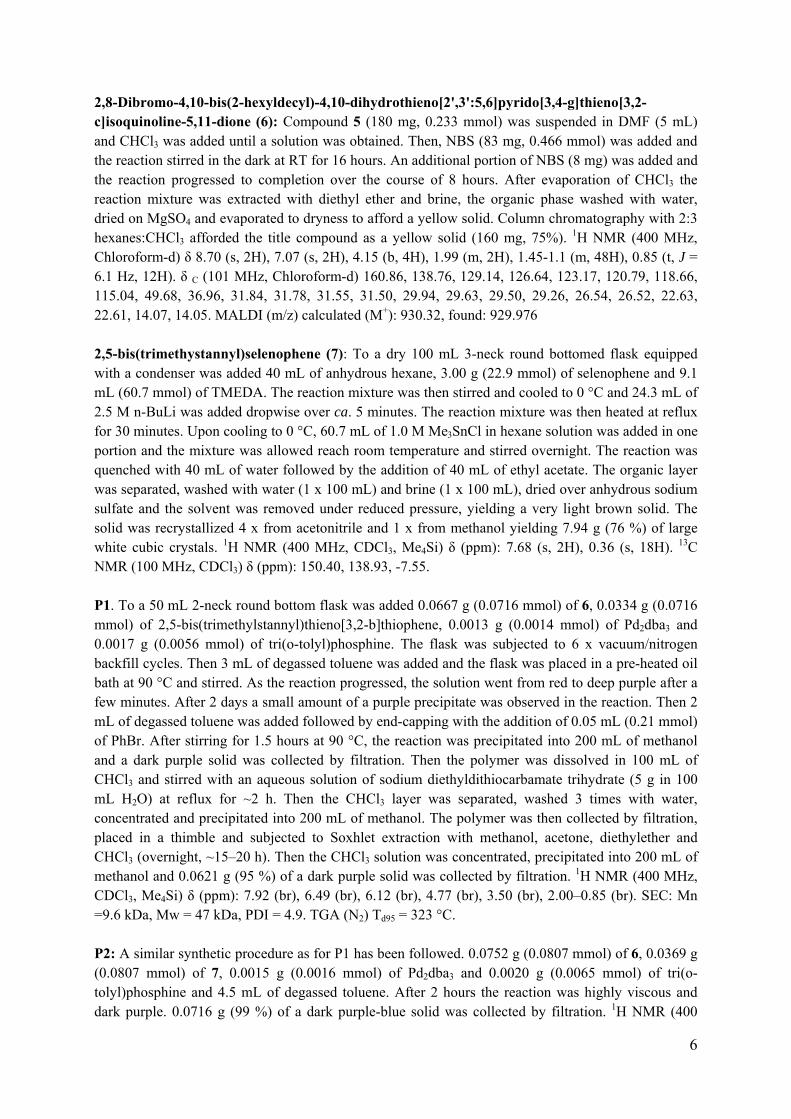
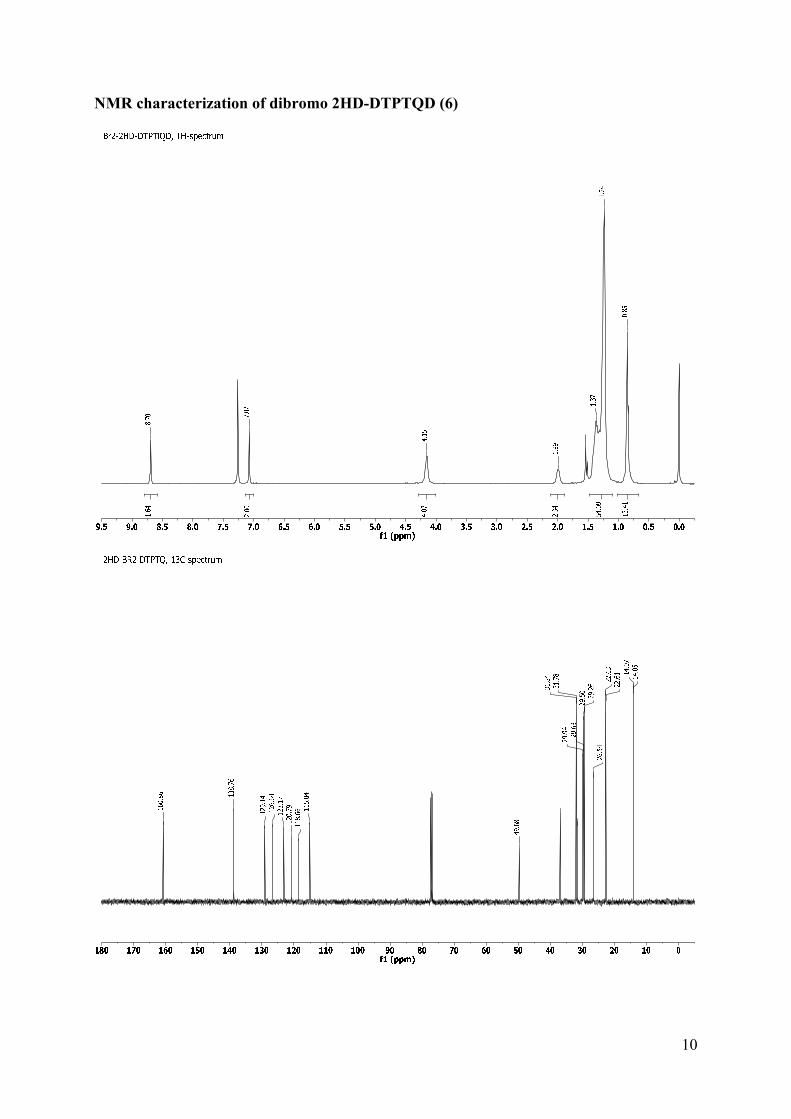
2,8-Dibromo-4,10-bis(2-hexyldecyl)-4,10-dihydrothieno[2',3':5,6]pyrido[3,4-g]thieno[3,2-c]isoquinoline-5,11-dione (6): Compound 5 (180 mg, 0.233 mmol) was suspended in DMF (5 mL) and CHCl3 was added until a solution was obtained. Then, NBS (83 mg, 0.466 mmol) was added and the reaction stirred in the dark at RT for 16 hours. An additional portion of NBS (8 mg) was added and the reaction progressed to completion over the course of 8 hours. After evaporation of CHCl3 the reaction mixture was extracted with diethyl ether and brine, the organic phase washed with water, dried on MgSO4 and evaporated to dryness to afford a yellow solid. Column chromatography with 2:3 hexanes:CHCl3 afforded the title compound as a yellow solid (160 mg, 75%). 1H NMR (400 MHz, Chloroform-d) δ 8.70 (s, 2H), 7.07 (s, 2H), 4.15 (b, 4H), 1.99 (m, 2H), 1.45-1.1 (m, 48H), 0.85 (t, J = 6.1 Hz, 12H). δ C (101 MHz, Chloroform-d) 160.86, 138.76, 129.14, 126.64, 123.17, 120.79, 118.66, 115.04, 49.68, 36.96, 31.84, 31.78, 31.55, 31.50, 29.94, 29.63, 29.50, 29.26, 26.54, 26.52, 22.63, 22.61, 14.07, 14.05. MALDI (m/z) calculated (M+): 930.32, found: 929.976 2,5-bis(trimethystannyl)selenophene (7): To a dry 100 mL 3-neck round bottomed flask equipped with a condenser was added 40 mL of anhydrous hexane, 3.00 g (22.9 mmol) of selenophene and 9.1 mL (60.7 mmol) of TMEDA. The reaction mixture was then stirred and cooled to 0 °C and 24.3 mL of 2.5 M n-BuLi was added dropwise over ca. 5 minutes. The reaction mixture was then heated at reflux for 30 minutes. Upon cooling to 0 °C, 60.7 mL of 1.0 M Me3SnCl in hexane solution was added in one portion and the mixture was allowed reach room temperature and stirred overnight. The reaction was quenched with 40 mL of water followed by the addition of 40 mL of ethyl acetate. The organic layer was separated, washed with water (1 x 100 mL) and brine (1 x 100 mL), dried over anhydrous sodium sulfate and the solvent was removed under reduced pressure, yielding a very light brown solid. The solid was recrystallized 4 x from acetonitrile and 1 x from methanol yielding 7.94 g (76 %) of large white cubic crystals. 1H NMR (400 MHz, CDCl3, Me4Si) δ (ppm): 7.68 (s, 2H), 0.36 (s, 18H). 13C NMR (100 MHz, CDCl3) δ (ppm): 150.40, 138.93, -7.55. P1. To a 50 mL 2-neck round bottom flask was added 0.0667 g (0.0716 mmol) of 6, 0.0334 g (0.0716 mmol) of 2,5-bis(trimethylstannyl)thieno[3,2-b]thiophene, 0.0013 g (0.0014 mmol) of Pd2dba3 and 0.0017 g (0.0056 mmol) of tri(o-tolyl)phosphine. The flask was subjected to 6 x vacuum/nitrogen backfill cycles. Then 3 mL of degassed toluene was added and the flask was placed in a pre-heated oil bath at 90 °C and stirred. As the reaction progressed, the solution went from red to deep purple after a few minutes. After 2 days a small amount of a purple precipitate was observed in the reaction. Then 2 mL of degassed toluene was added followed by end-capping with the addition of 0.05 mL (0.21 mmol) of PhBr. After stirring for 1.5 hours at 90 °C, the reaction was precipitated into 200 mL of methanol and a dark purple solid was collected by filtration. Then the polymer was dissolved in 100 mL of CHCl3 and stirred with an aqueous solution of sodium diethyldithiocarbamate trihydrate (5 g in 100 mL H2O) at reflux for ~2 h. Then the CHCl3 layer was separated, washed 3 times with water, concentrated and precipitated into 200 mL of methanol. The polymer was then collected by filtration, placed in a thimble and subjected to Soxhlet extraction with methanol, acetone, diethylether and CHCl3 (overnight, ~15–20 h). Then the CHCl3 solution was concentrated, precipitated into 200 mL of methanol and 0.0621 g (95 %) of a dark purple solid was collected by filtration. 1H NMR (400 MHz, CDCl3, Me4Si) δ (ppm): 7.92 (br), 6.49 (br), 6.12 (br), 4.77 (br), 3.50 (br), 2.00–0.85 (br). SEC: Mn =9.6 kDa, Mw = 47 kDa, PDI = 4.9. TGA (N2) Td95 = 323 °C. P2: A similar synthetic procedure as for P1 has been followed. 0.0752 g (0.0807 mmol) of 6, 0.0369 g (0.0807 mmol) of 7, 0.0015 g (0.0016 mmol) of Pd2dba3 and 0.0020 g (0.0065 mmol) of tri(o-tolyl)phosphine and 4.5 mL of degassed toluene. After 2 hours the reaction was highly viscous and dark purple. 0.0716 g (99 %) of a dark purple-blue solid was collected by filtration. 1H NMR (400

7
MHz, CDCl3, Me4Si) δ (ppm): 8.29 (br), 6.38 (br), 4.87 (br), 3.45 (br), 2.00–0.86 (br). SEC: Mn =12.5 kDa, Mw = 63.4 kDa, PDI = 5.1. TGA (N2) Td95 = 361 °C.
8
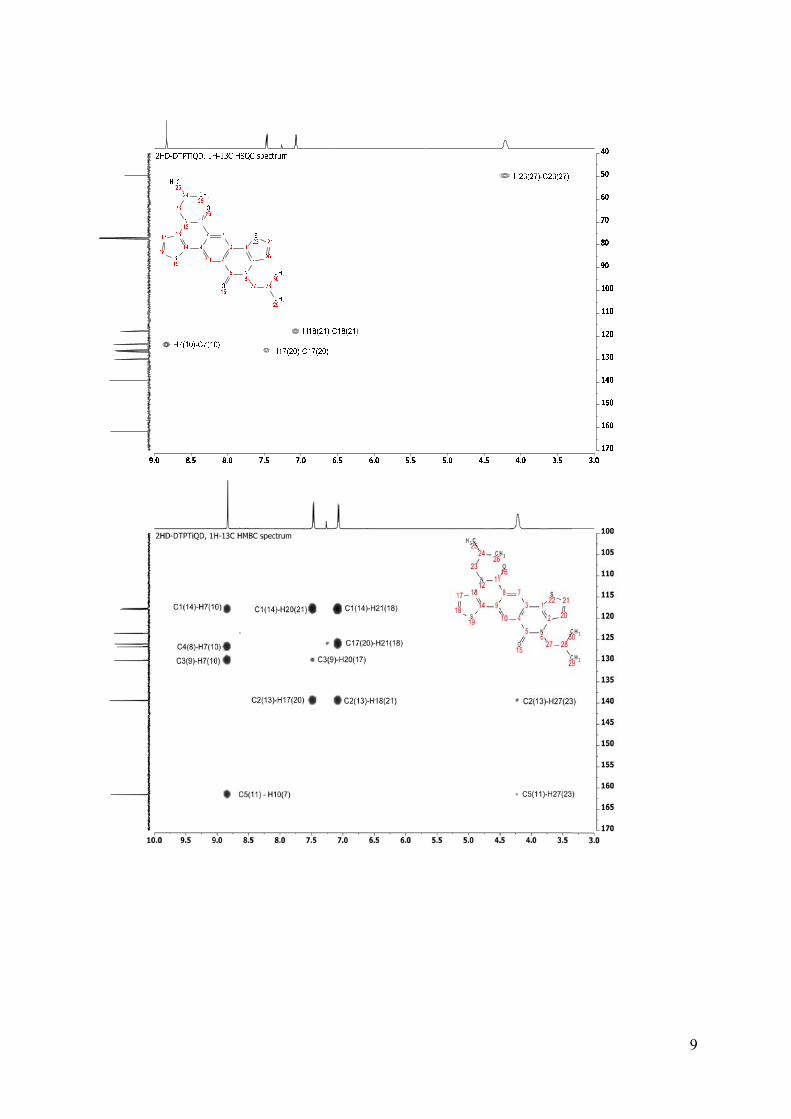
NMR characterization of 2HD-DTPTiQD (5)
9
10
NMR characterization of dibromo 2HD-DTPTQD (6)
11
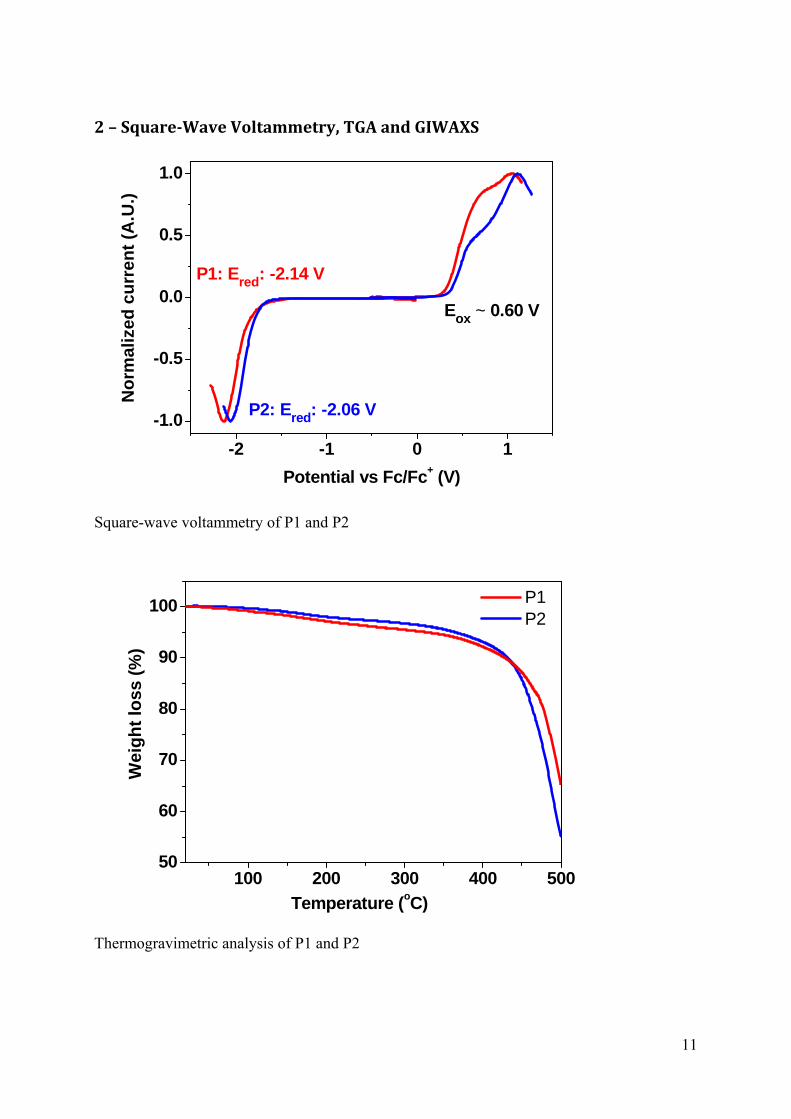
2–Square‐WaveVoltammetry,TGAandGIWAXS
Square-wave voltammetry of P1 and P2
Thermogravimetric analysis of P1 and P2
-2 -1 0 1
-1.0
-0.5
0.0
0.5
1.0
P2: Ered: -2.06 V
P1: Ered: -2.14 V
Eox ~ 0.60 V
No
rma
lize
d c
urr
en
t (A
.U.)
Potential vs Fc/Fc+ (V)
100 200 300 400 50050
60
70
80
90
100
Wei
gh
t lo
ss (
%)
Temperature (oC)
P1 P2
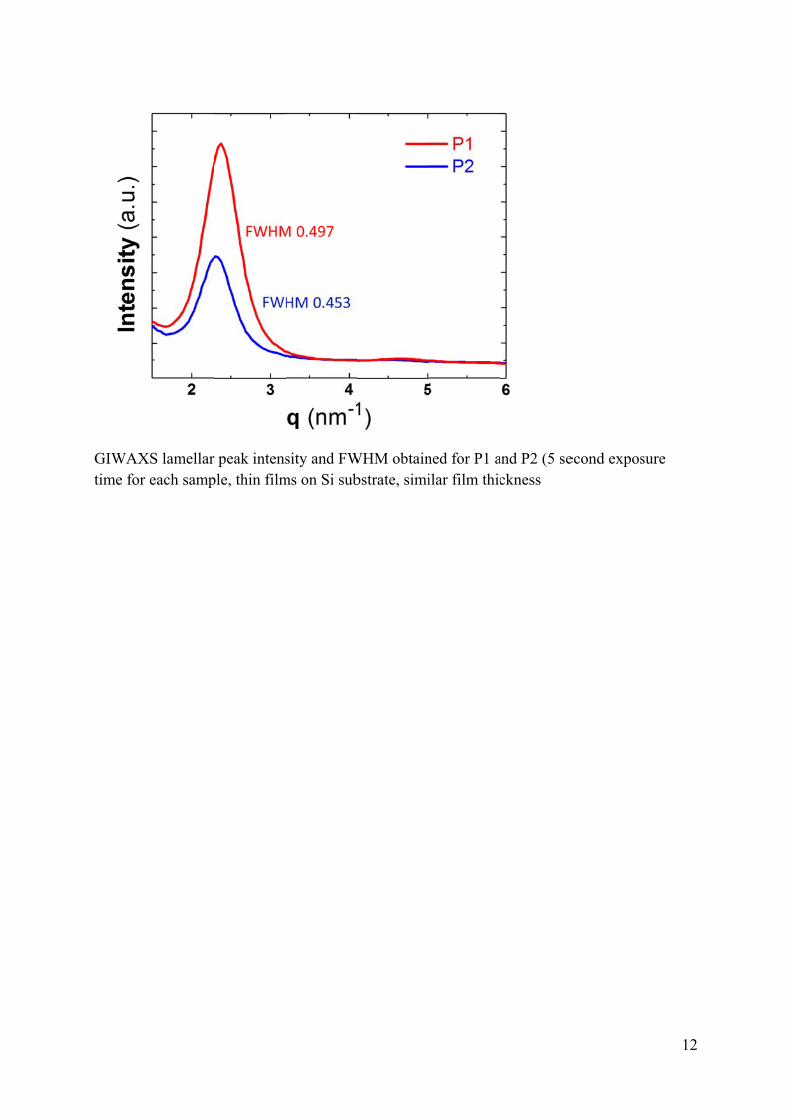
GIWAXtime for
XS lamellar r each samp
peak intensple, thin film
sity and FWms on Si sub
WHM obtainbstrate, simi
ned for P1 ailar film thic
and P2 (5 seckness
econd expos
12
sure
13
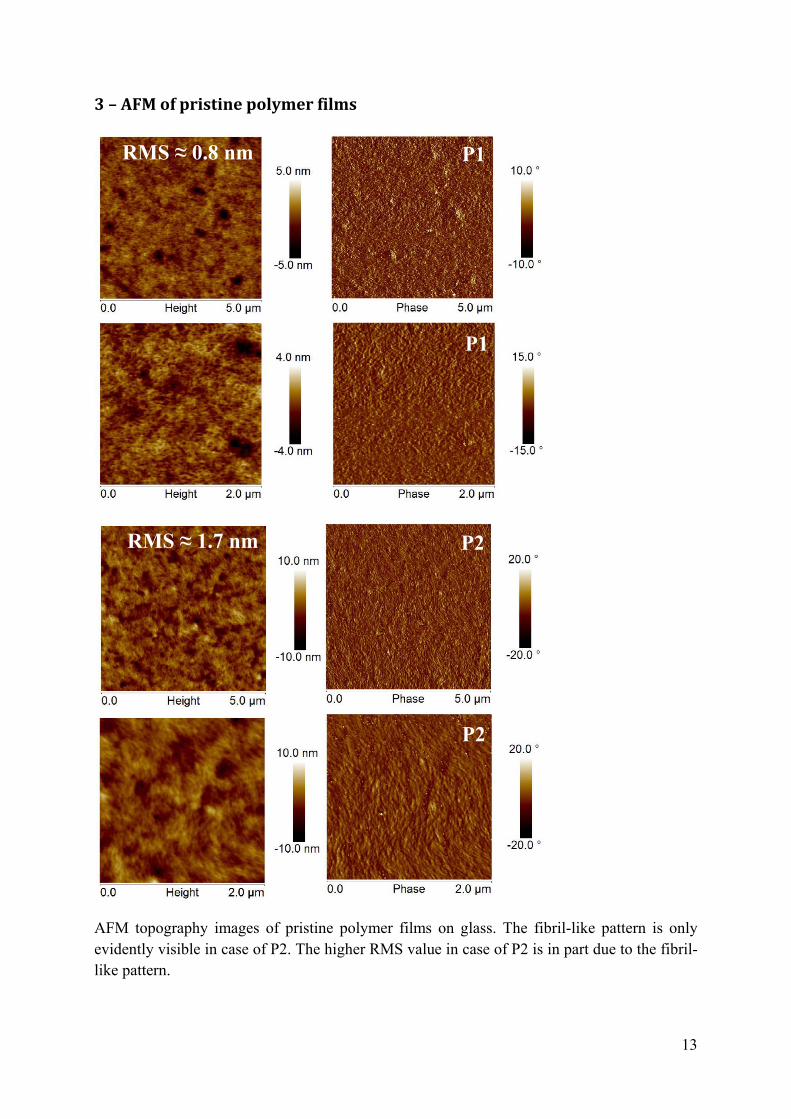
3–AFMofpristinepolymerfilms
AFM topography images of pristine polymer films on glass. The fibril-like pattern is only evidently visible in case of P2. The higher RMS value in case of P2 is in part due to the fibril-like pattern.
P1
P1
P2
P2
RMS ≈ 1.7 nm
RMS ≈ 0.8 nm
14
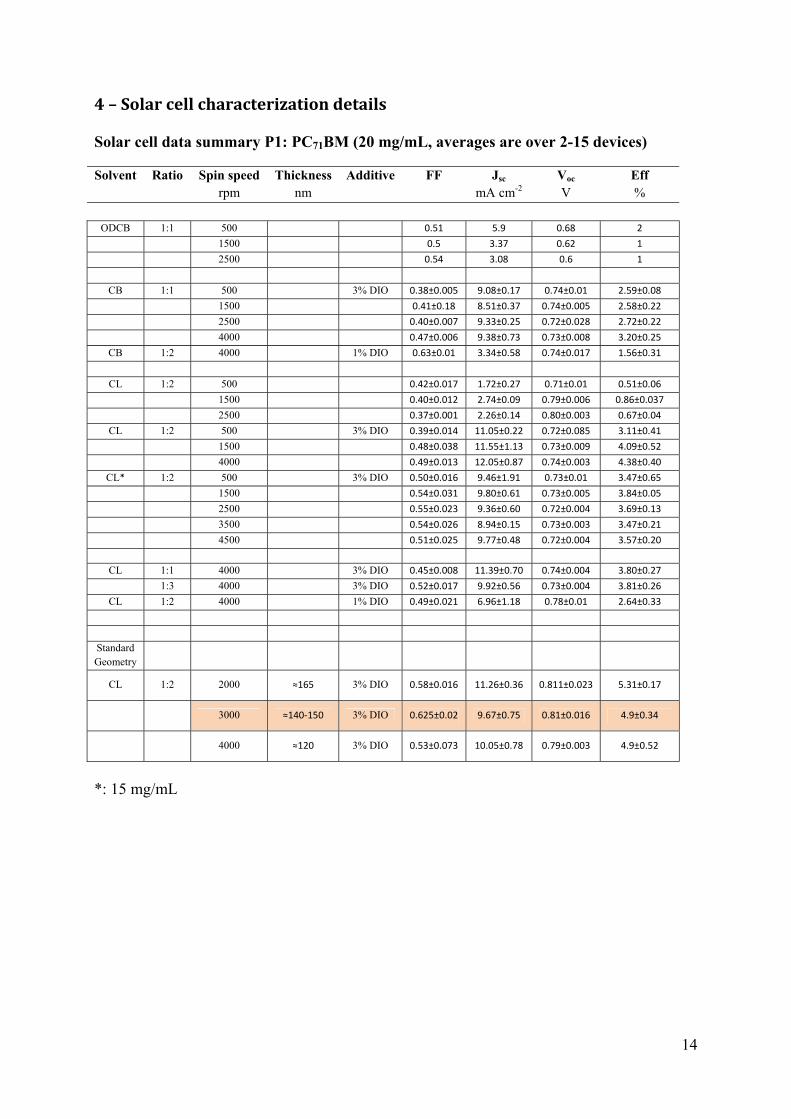
4–Solarcellcharacterizationdetails Solar cell data summary P1: PC71BM (20 mg/mL, averages are over 2-15 devices)
Solvent Ratio Spin speed Thickness Additive FF Jsc Voc Eff rpm nm mA cm-2 V %
ODCB 1:1 500 0.51 5.9 0.68 2
1500 0.5 3.37 0.62 1
2500 0.54 3.08 0.6 1
CB 1:1 500 3% DIO 0.38±0.005 9.08±0.17 0.74±0.01 2.59±0.08
1500 0.41±0.18 8.51±0.37 0.74±0.005 2.58±0.22
2500 0.40±0.007 9.33±0.25 0.72±0.028 2.72±0.22
4000 0.47±0.006 9.38±0.73 0.73±0.008 3.20±0.25
CB 1:2 4000 1% DIO 0.63±0.01 3.34±0.58 0.74±0.017 1.56±0.31
CL 1:2 500 0.42±0.017 1.72±0.27 0.71±0.01 0.51±0.06
1500 0.40±0.012 2.74±0.09 0.79±0.006 0.86±0.037
2500 0.37±0.001 2.26±0.14 0.80±0.003 0.67±0.04
CL 1:2 500 3% DIO 0.39±0.014 11.05±0.22 0.72±0.085 3.11±0.41
1500 0.48±0.038 11.55±1.13 0.73±0.009 4.09±0.52
4000 0.49±0.013 12.05±0.87 0.74±0.003 4.38±0.40
CL* 1:2 500 3% DIO 0.50±0.016 9.46±1.91 0.73±0.01 3.47±0.65
1500 0.54±0.031 9.80±0.61 0.73±0.005 3.84±0.05
2500 0.55±0.023 9.36±0.60 0.72±0.004 3.69±0.13
3500 0.54±0.026 8.94±0.15 0.73±0.003 3.47±0.21
4500 0.51±0.025 9.77±0.48 0.72±0.004 3.57±0.20
CL 1:1 4000 3% DIO 0.45±0.008 11.39±0.70 0.74±0.004 3.80±0.27
1:3 4000 3% DIO 0.52±0.017 9.92±0.56 0.73±0.004 3.81±0.26
CL 1:2 4000 1% DIO 0.49±0.021 6.96±1.18 0.78±0.01 2.64±0.33
Standard Geometry
CL 1:2 2000 ≈165 3% DIO 0.58±0.016 11.26±0.36 0.811±0.023 5.31±0.17
3000 ≈140‐150 3% DIO 0.625±0.02 9.67±0.75 0.81±0.016 4.9±0.34
4000 ≈120 3% DIO 0.53±0.073 10.05±0.78 0.79±0.003 4.9±0.52
*: 15 mg/mL
15
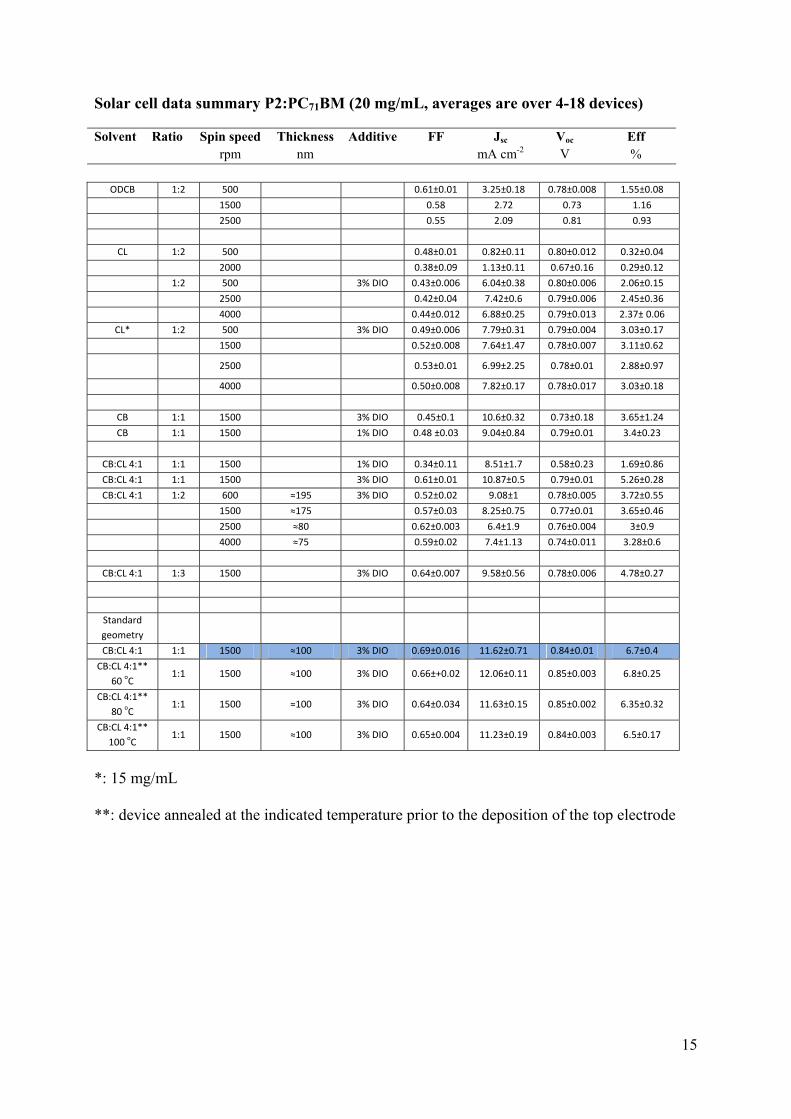
Solar cell data summary P2:PC71BM (20 mg/mL, averages are over 4-18 devices)
Solvent Ratio Spin speed Thickness Additive FF Jsc Voc Eff rpm nm mA cm-2 V % ODCB 1:2 500 0.61±0.01 3.25±0.18 0.78±0.008 1.55±0.08
1500 0.58 2.72 0.73 1.16
2500 0.55 2.09 0.81 0.93
CL 1:2 500 0.48±0.01 0.82±0.11 0.80±0.012 0.32±0.04
2000 0.38±0.09 1.13±0.11 0.67±0.16 0.29±0.12
1:2 500 3% DIO 0.43±0.006 6.04±0.38 0.80±0.006 2.06±0.15
2500 0.42±0.04 7.42±0.6 0.79±0.006 2.45±0.36
4000 0.44±0.012 6.88±0.25 0.79±0.013 2.37± 0.06
CL* 1:2 500 3% DIO 0.49±0.006 7.79±0.31 0.79±0.004 3.03±0.17
1500 0.52±0.008 7.64±1.47 0.78±0.007 3.11±0.62
2500 0.53±0.01 6.99±2.25 0.78±0.01 2.88±0.97
4000 0.50±0.008 7.82±0.17 0.78±0.017 3.03±0.18
CB 1:1 1500 3% DIO 0.45±0.1 10.6±0.32 0.73±0.18 3.65±1.24
CB 1:1 1500 1% DIO 0.48 ±0.03 9.04±0.84 0.79±0.01 3.4±0.23
CB:CL 4:1 1:1 1500 1% DIO 0.34±0.11 8.51±1.7 0.58±0.23 1.69±0.86
CB:CL 4:1 1:1 1500 3% DIO 0.61±0.01 10.87±0.5 0.79±0.01 5.26±0.28
CB:CL 4:1 1:2 600 ≈195 3% DIO 0.52±0.02 9.08±1 0.78±0.005 3.72±0.55
1500 ≈175 0.57±0.03 8.25±0.75 0.77±0.01 3.65±0.46
2500 ≈80 0.62±0.003 6.4±1.9 0.76±0.004 3±0.9
4000 ≈75 0.59±0.02 7.4±1.13 0.74±0.011 3.28±0.6
CB:CL 4:1 1:3 1500 3% DIO 0.64±0.007 9.58±0.56 0.78±0.006 4.78±0.27
Standard
geometry
CB:CL 4:1 1:1 1500 ≈100 3% DIO 0.69±0.016 11.62±0.71 0.84±0.01 6.7±0.4
CB:CL 4:1**
60 oC
1:1 1500 ≈100 3% DIO 0.66±+0.02 12.06±0.11 0.85±0.003 6.8±0.25
CB:CL 4:1**
80 oC
1:1 1500 ≈100 3% DIO 0.64±0.034 11.63±0.15 0.85±0.002 6.35±0.32
CB:CL 4:1**
100 oC
1:1 1500 ≈100 3% DIO 0.65±0.004 11.23±0.19 0.84±0.003 6.5±0.17
*: 15 mg/mL
**: device annealed at the indicated temperature prior to the deposition of the top electrode
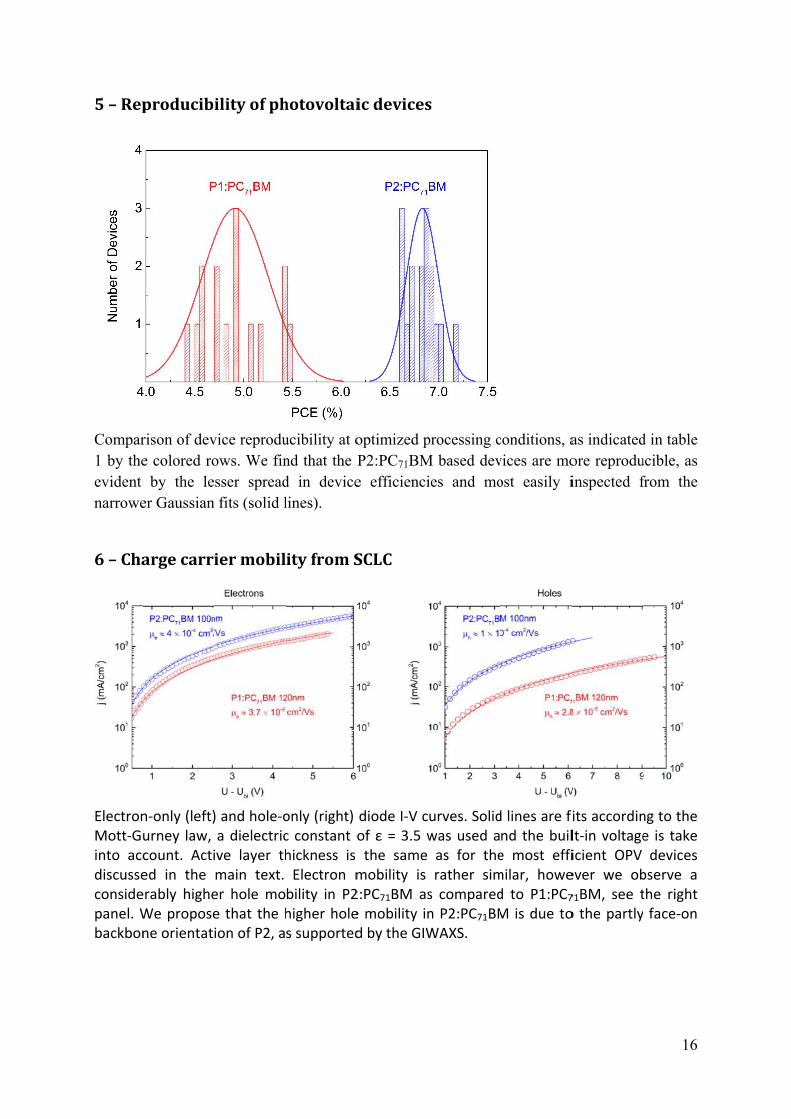
5–Rep
Compar1 by theevident narrowe
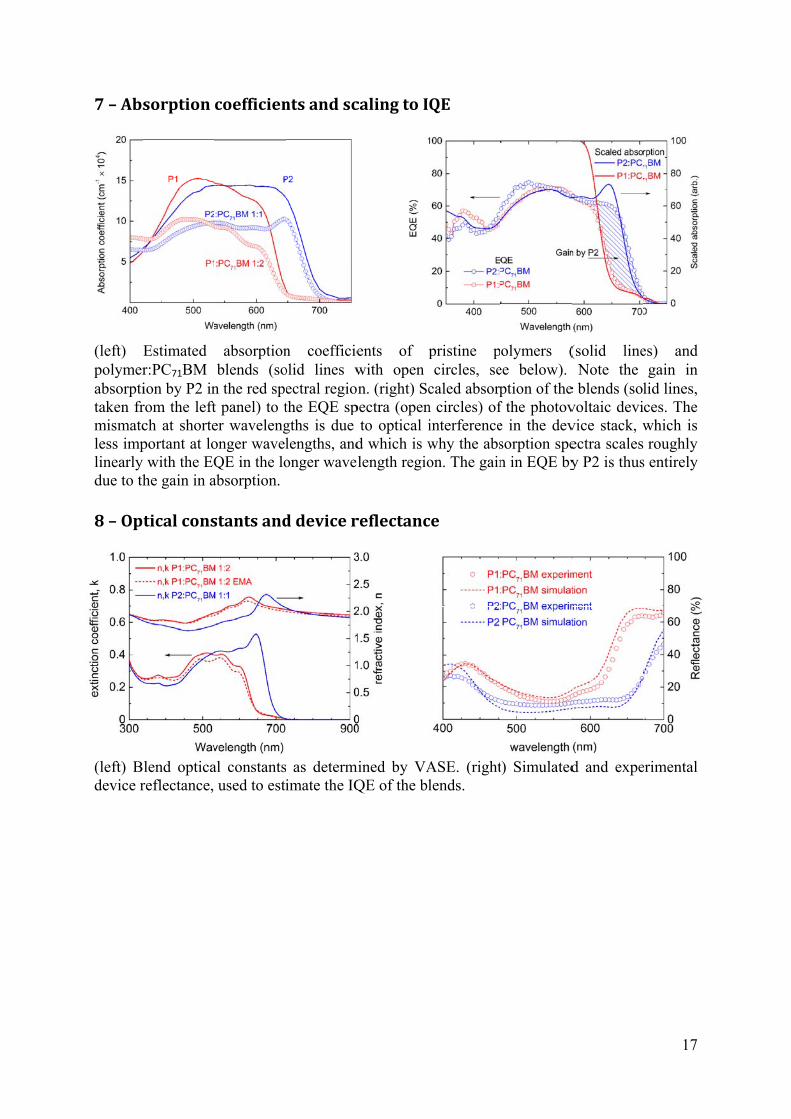
6–Cha
ElectronMott‐Guinto accdiscusseconsidepanel. Wbackbon
producib
rison of deve colored ro
by the leer Gaussian
argecarri
n‐only (left)urney law, count. Actied in the erably higheWe proposene orientati
ilityofph
vice reproduows. We finsser spread fits (solid l
iermobil
) and hole‐oa dielectricive layer thmain text. er hole moe that the hion of P2, a
hotovoltai
ucibility at ond that the Pd in devicelines).
ityfromS
only (right) c constant ohickness is Electron mbility in P2higher holes supported
icdevices
optimized pP2:PC71BMe efficienci
SCLC
diode I‐V cof ε = 3.5 wthe same
mobility is 2:PC71BM ase mobility ind by the GIW
s
processing cM based devies and mo
urves. Solidwas used aas for therather sims comparedn P2:PC71BMWAXS.
conditions, avices are moost easily i
d lines are find the buile most effimilar, howed to P1:PC7M is due to
as indicatedore reproduinspected f
fits accordinlt‐in voltageicient OPV ever we ob
71BM, see to the partly
16
d in table ucible, as from the
ng to the e is take devices
bserve a the right face‐on
7–Abs
(left) polymerabsorptitaken frmismatcless implinearly due to th
8–Op
(left) Bdevice r
sorption
Estimated r:PC71BM ion by P2 inrom the leftch at shorteportant at lo
y with the EQhe gain in a
ticalcons
lend opticareflectance,
coefficien
absorptionblends (so
n the red spet panel) to ter wavelengonger wavelQE in the loabsorption.
stantsand
al constantsused to esti
ntsandsc
n coefficieolid lines wectral regionthe EQE spgths is due lengths, andonger wavel
ddevicer
as determimate the IQ
calingtoI
ents of pwith open n. (right) Sc
pectra (opento optical i
d which is wlength regio
reflectanc
mined by VAQE of the bl
QE
pristine pcircles, se
caled absorpn circles) ofinterferencewhy the abson. The gain
ce
ASE. (rightlends.
olymers (ee below). ption of thef the photove in the devsorption spen in EQE by
t) Simulated
(solid lineNote the
e blends (solvoltaic devivice stack, wectra scalesy P2 is thus
d and expe
17
es) and gain in
lid lines, ces. The which is roughly
s entirely
erimental