Embed Size (px)
Citation preview
SHORT-TEW FACTORS INFLUENCING NEW ZEATlAND IJAMB PRICES IN THE UNITED KINGDOM
Aa the sale of lamb in the United Kingdom is one of New Zealand’s principal exports, it is important to ascertain both the long and short-term effects of factors influencing this market. Short-term factors only are considered here, i.e. those for which changes during one year may bring about price changes within that time. Various market factors which may be important in price determination have been considered from information obtained over the years 1956 to 1958 inclusive, and the results are applied to the 1959 year to date.
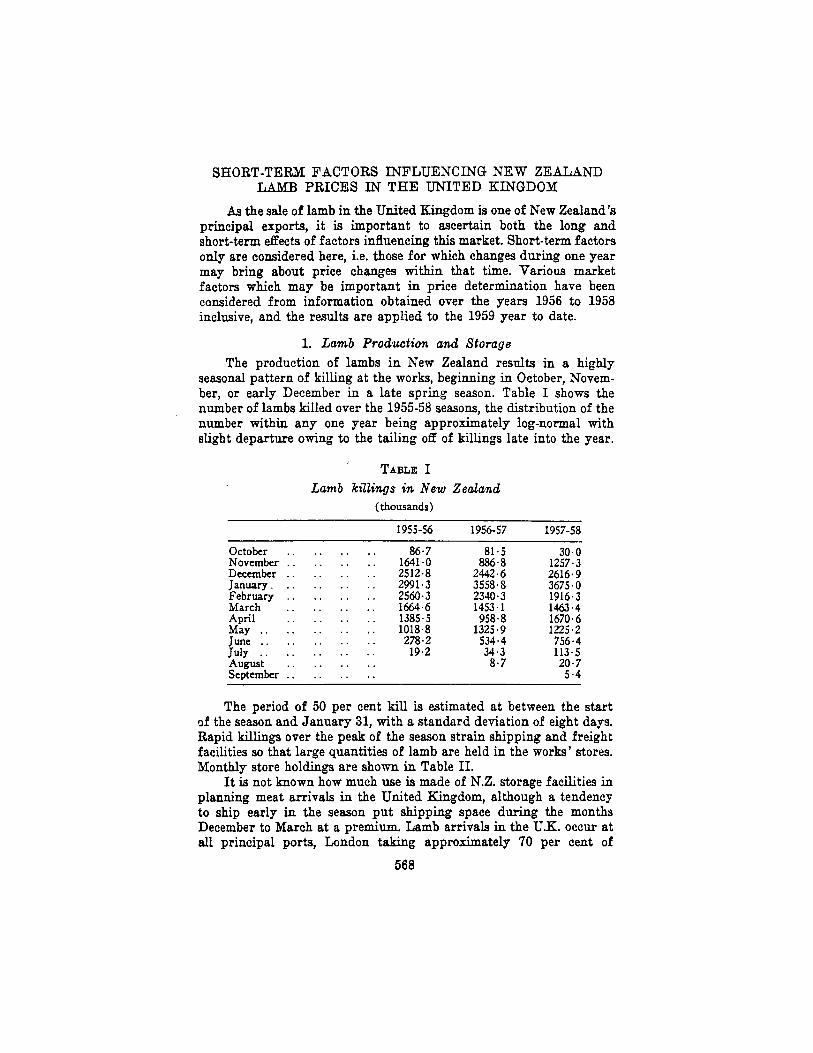
1. Lamb Production and Storage The production of lambs in New Zealand results in a highly
seasonal pattern of killing at the works, beginning in October, Novem- ber, or early December in a late spring season. Table I shows the number of lambs killed over the 1955-58 seasons, the distribution of the number within any one year being approximately log-normal with slight departure owing to the tailing off of killings late into the year.
TABLE I Lamb killings in New Zealand
(thousands)
1955-56 1956-57 1957-58
October November December
February March April May . . June . . July . . August September
January I
. . . . . . . .
. . . . . . . .
. . . . . . . .
. . . . . . . .
. . . . . . . .
. . . . . . . .
. . . . . . . .
. . . . . . . .
. . . . . . . .
. . . . . . . .
. . . . . . . .
. . . . . . . .
86.7 81.5 30.0 1641.0 886.8 1257.3 2512.8 2442.6 2616.9 2991.3 3558.8 3675.0 2560.3 2340.3 1916.3 166.1.6 1453.1 1463.4 1385.5 958.8 1670.6 1018.8 1325.9 1225.2 278.2 534.4 756-4 19.2 34.3
8 .7 113.5 20-7 5.4
The period of 50 per cent kill is estimated at between the start of the season and January 31, with a standard deviation of eight days. Rapid killings over the peak of the season strain shipping and freight facilities so that large quantities of lamb are held in the works’ stores. Monthly store holdings are shown in Table 11.
It is not known how much use is made of N.Z. storage facilities in planning meat arrivals in the United Kingdom, although a tendency to ship early in the season put shipping space during the months December to March at a premium. Lamb arrivals in the U.K. occur at all principal ports, London taking approshately 70 per cent of
568
DEC., 1960 NEW I%EAT,AND U X B PRICES
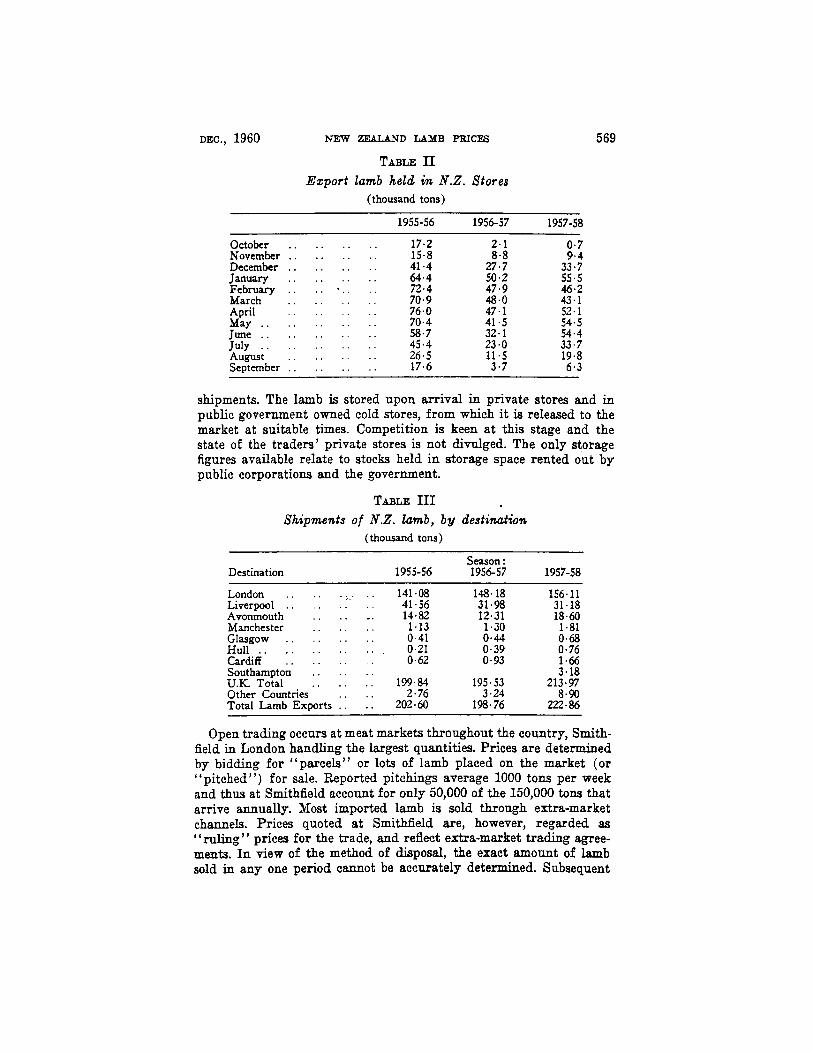
TABLE I1 Export lamb held in N.Z. Stores
(thousand tons)
1955-56 1956-57 1957-58
October . . . . . . . . 17.2 2.1 0.7 Novcm bet . . . . . . . . 15.8 8.8 9.4 December . . . . . . . . 41.4 27.7 33.7 January . . . . . . . . 64.4 50.2 55.5 February . . . . . . . . . 72.4 47.9 46.2 March . . . . . . . . 70.9 48.0 43.1 April . . . . . . . . 76.0 47.1 52.1 May . . . . . . . . . . 70.4 41.5 54.5 June . . . . . . . . . . 58.7 32.1 54.4 July . . . . . . . . . . 45.4 23.0 33.7
. . . . . . . . August 26.5 11.5 19.8 September 17.6 3.7 6.3 . . . . . . . .
569
shipments. The lamb is stored upon arrival in private stores and in public government owned cold stores, from which it is released to the market at suitable times. Competition is keen a t this stage and the state of the traders’ private stores is not divulged. The only storage figures available relate to stocks held in storage space rented out by public corporations and the government.
TABLE I11 Bhipments of N.Z. Iamb, by destination
(thousand tons)
Destination 1955-56 Season : 1956-57 1957-58
~~
London . . . . . :,. . . Liverpool . . . . . . . . Avonmouth . . . . -. Manchester . . . . . . Glasgow . . . . . . . . Hull . . . . . . . . . . Cardiff . . . . . . . . Southampton . . . . . . U.K. Total . . . . . . Other Countries . . . . Total Lamb Exports . . . .
141.08 41.56 14.82 1.13 0.41 0.21 0.62
199.84 2.76
202.60
148.18 156.11 31.98 31.18 12.31 18.60 1.30 1.81 0.44 0.68 0.39 0.76 0.93 1.66
3.18 195‘53 213.97 3.24 8.90
198.76 222.86
Open trading occurs a t meat markets throughout the country, Smith- field in London handling the largest quantities. Prices are determined by bidding for “parcels” or Iota of lamb placed on the market (or “pitched”) for sale. Reported pitchings average 1000 tons per week and thus at Smithfield account for only 50,000 of the 150,000 tons that arrive annually. Most imported lamb is sold through estra-market channels. Prices quoted at Smithfield are, however, regarded as “ruling” prices for the trade, and reflect extra-market trading agree- ments. In view of the method of disposal, the exact amount of lamb sold in any one period cannot be accurately determined. Subsequent
570 THE ECONOMIC RECORD DECEMBER
to the arrival in early January of new season’s New Zealand lamb, old stocks become obsolete, and since new season’s lamb commands a premium, the desirability of quitting old stocks creates anomalous situations during this changeover period.
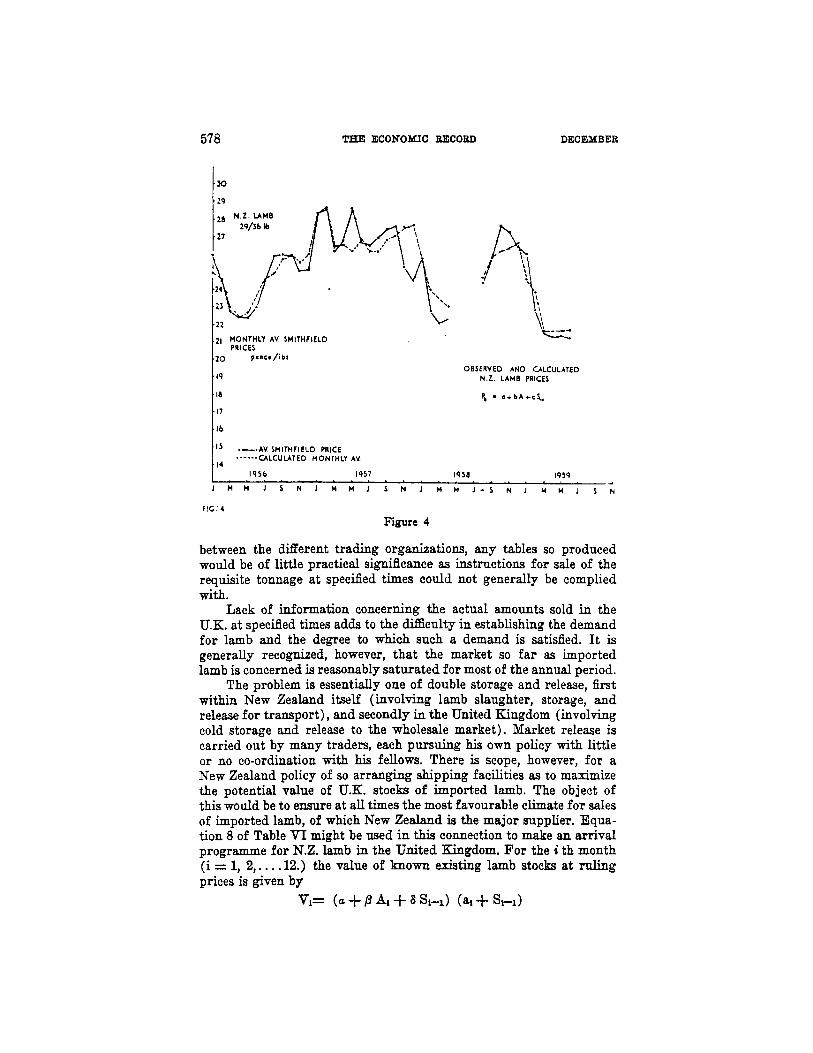
Figure 4 shows the average monthly price of New Zealand lamb at Smithfield during the yeam 1956-59. This paper seeks to explain seasonal price behaviour, and to indicate the principal factors con- cerned. (The absence of data over the months May-July 1958 is occasioned by a strike of meat transport operators.)
2. Factors considered Some short-term factors likely to influence New Zealand lamb
prices are as follows: 1. Pitchings of N.Z. lamb at Smithfield market. 2. Pitchings of U.K. mutton and lamb at SmitMeld. 3. Smithfield fresh beef pitchings. 4. Other beef pitchings (frozen, chilled). 5. U.K. monthly total pork supplies. (000 tons) 6. U.K. total beef supplies. (000) 7. U.K. total mutton and lamb supplies. (000) 8. Average weekly arrivals of N.Z. lamb (per month). 9. amounts of imported lamb held in public and government-
owned cold stores. 10. Monthly U.K. mutton and lamb killings.
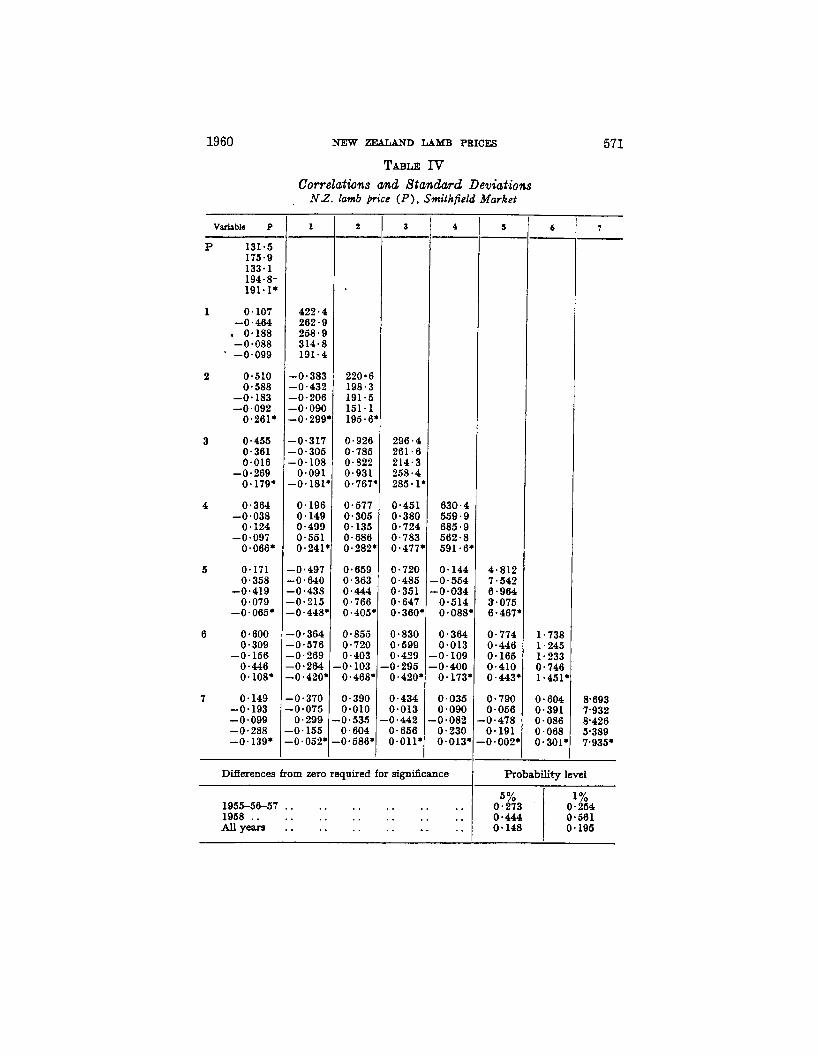
Data for the above variables are taken from the monthly Intelli- gence BuEZetin of the Commonwealth Economic Committee (U.K.) , The Meat Producer and Ezporter issued by the Australian Meat Board, and The New ZealamcE Meat Ezporter, the official organ of the N.Z. Meat Producers’ Board. The correlation of N.Z. lamb price (in pence per lb.) with factors 1-7 is included in Table IV which shows the correlation of all pairs of the above factors.
Within each cell are the correlations for the years 1955 (top), 1956, 1957, and the first six months of 1958. The figures marked by asterisks denote the correlations over the whole period, and the figures occurring in cells corresponding to self-correlations refer to the standard deviations for each year and all years considered. Pitchings are taken weekly and the correlations are those based on 51 observations f o r 1955, 56 and 1957 and 20 obsemations (to the strike period) in 1958. Correlation coefficients required to establish the existence of a correlation significantly m e r e n t from zero in each are given in the table.
No strict pattern is evident from the table although some points are noteworthy. The year to year changes in the sizes of the correla- tions between price and other variables indicate a lack of stability of dependence of price on the factors considered. This suggests that short- term factors may prevail within each season; giving rise to correlation on appropriate variables according to current conditions. More con-
1960
0.855 0.830 0.720 0-599 0.403 0.429 -0.103 -0.295 0.468' 0.420'
0.390 0.434 0.010 0.013 .0.535 -0.442 0.604 0-656
-0.586' 0.011'
NEW ZEAT,AND LAMB PRICES
TABLE IT Correlations and Btanakrd Deviations NZ. lamb p i c e (P), Smithfield Market
220.6 198.3 191.5 151.1 195.6'
0.926
Variable P
296.4
P
1
2
3
4
5
6
7
4.812 7,542 6.964 3.075 6.467'
0.774 0.46
131.5 175.9 133.1 194.8- 191.1'
0.107 -0.484 . 0.188 -0.088 -0.099
0.510 0.588
-0.183 -0.092 0.261'
0.455 0.361 0-018
0.179'
0.364 -0.038 0.124
-0.097 0.066'
0.171 0,358
-0.419 0.079
-0.065*
-0.269
0.600 0.309
0.446 0.1081
0.149
-0.156
-0.193 -0.099 -0.288 -0.139'
1.738 1.245
1
0.785 0.822 0.931 0.767'
422-1 262-1 258.1 314-1 191.6
-0.38: -0.432 -0.20f -0*09( -0*29!
-0.31i -0.305 -0.108 0.091
-0.181
0.19E 0-149 0.499 0-551 0.241
-0.497 -0.840 -0.438 -0.215 -0.448
-0.364 -0.576 -0.269 -0.264 -0.420
-0'370 -0.075 0.299
-0.155 -0.052'
261.6 214.3 258.4 285.1'
2
0.166 0.410 0.443*
0.790 0.056 0.478 0.191 0.002'
3
1.233 0.746 1.451'
0.604 0-391 0-086 0.068 0.301'
0.577 0.305 0.135 0.686 0.282'
0.659 0.363 0.444 0.766 0 405'
0.451 0.380 0.724 0.783 0.477'
0.720 0.485 0-351 0.647 0*360*
4
630.4 559.9 685.9 562.8 591.6'
0.144 -0.554 -0.034 0.514 0.088'
0.364 0.013 .0*109 ,0.400 0.173.
0.035 0.090 0.082 0.230 0.013'
DiiTerences from zero required for significance
1955-5&57 .. .. . . .. .. 1968 .. .. .. .. .. .. AUyeara .. .. .. .. .. ..
5 6 -
571
7
8.693 7.932 8426 5.389 7.935'
Probability level
1% 1 0-254 6% 0.273
572 THE ECONOMIC RECORD DECEMBER
sistent correlations hold for U.K. and N.Z. lamb pitchings, and N.Z. lamb pitchings and U.K. pork supplies. This reflects the fact that N.Z. lamb is sold in the U.K. lamb off-season, and indicates the tendency for pork to replace lamb. The absence of stable correlations suggests the dominance of other short-term factors.
Consideration of factors 8, 9 and 10 reveals strong infiuences upon lamb prices as indicated by the correlations in Table V.
TABLE V Correlations between price, rate of arrival, stocks in store,
and home kiUings
P T A S-1 S
P -0.3410 0.0636 --0.175a 4. iai 1 0.8079 -0-9381 -0.a721 -0.8917
-o+xa 4.7716 4.8975
4.7042 4.5852 -0.8523
0.6825 4 . 5 2 4 3 4.9279 4.8071
T 4 . 6 8 6 3 0.4368 0.0500
0.4469 0.7512 A 4 . 3 7 5 7 0.1629
0.7972 0.8359 0.8199
S-1 0.7961 0.8667
P = average price of N.Z. lamb (29/36 lb.) per month in pence per lb.
T = average weekly U.K. killing rate (OOO tons) of mutton and lamb over the month a year earlier and the year previous to this.
S-1= total imported lamb in public cold stores (OOO tons) at the end of the previous month.
S = total imported lamb in public cold stores (OW tons) during the current month.
A = average weekly arrival rate per month of N.Z. lamb in the U.K.
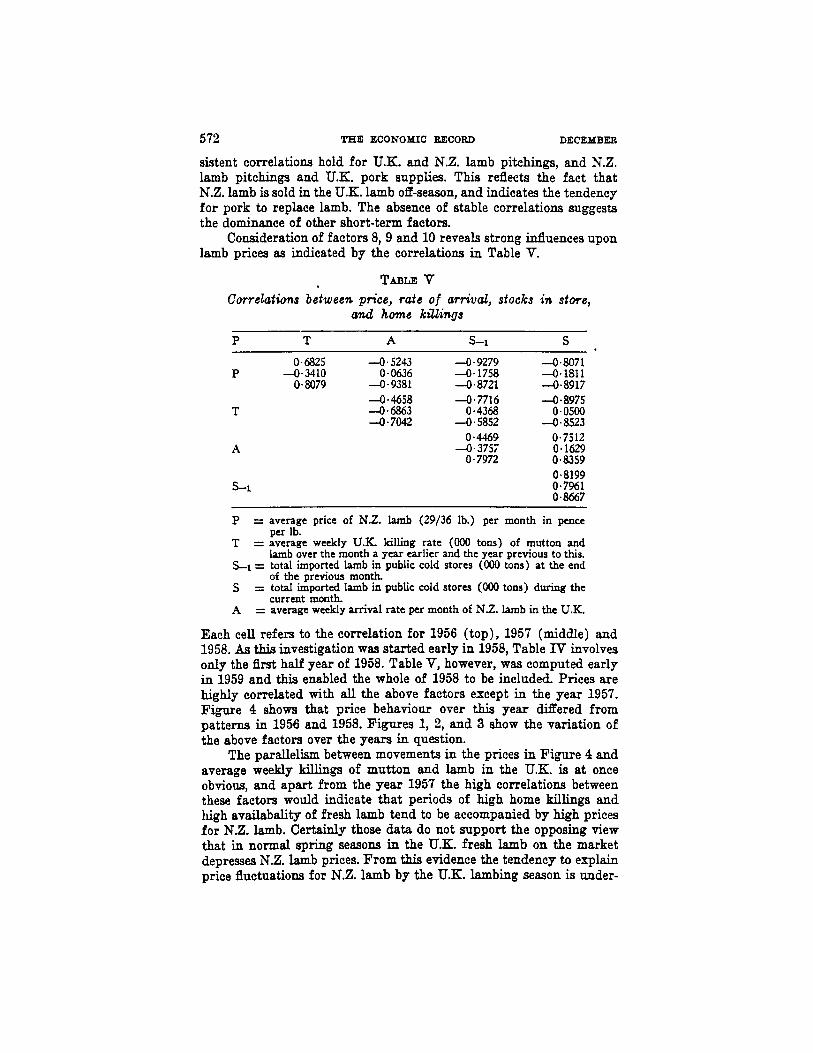
Each cell refers to the correlation for 1956 (top), 1957 (middle) and 1958. As this investigation was started early in 1958, Table IT involves only the h t half year of 1958. Table V, however, was computed early in 1959 and this enabled the whole of 1958 to be included. Prices are highly correlated with all the above factors except in the year 1957. Figare 4 shows that price behaviour over this year Wered from patterns in 1956 and 1958. Figures 1, 2, and 3 show the variation of the above factors over the years in question.
The parallelism between movements in the prices in Figure 4 and average weekly killings of mutton and lamb in the U.K. is at once obvious, and apart from the year 1957 the high correlations between these factors would indicate that periods of high home kilhgs and high availabality of fresh lamb tend to be accompanied by high prices for N.Z. lamb. Certainly those data do not support the opposing view that in normal spring seasons in the U.K. fresh lamb on the market depresses N.Z. lamb prices. From this evidence the tendency to explain price fluctuations for N.Z. lamb by the U.K. lambing season is under-
1960 NEW ZEALAND LAME PRICES 573
I-
0- J F M A H J J A S O N D
u
t
I
0- , . . , . . , . , I f M A H J I A I O N D
Figures 1 and 2
standable. Indeed, but fo r the early months of 1957, explanation of N.Z. prices by only a seasonal effect would prove reasonably effective. But early 1957, showing as it does no inclination to follow the seasonal pattern discounts this theory rather heavily. The years 1956 and 1958 show all factors to be closely related to price levels with the factors operating along generally espected lines.
Prices rise when arrivals decrease and stores become lower, and also with the seasonal increase in home kill. In 1957, however, the pattern was so changed as to reverse this situation, indicating that the
574 THE ECONOMIC BECORD DECEMBER
0- J F H A H J J A S O N D
I FIG. J
Figure 3
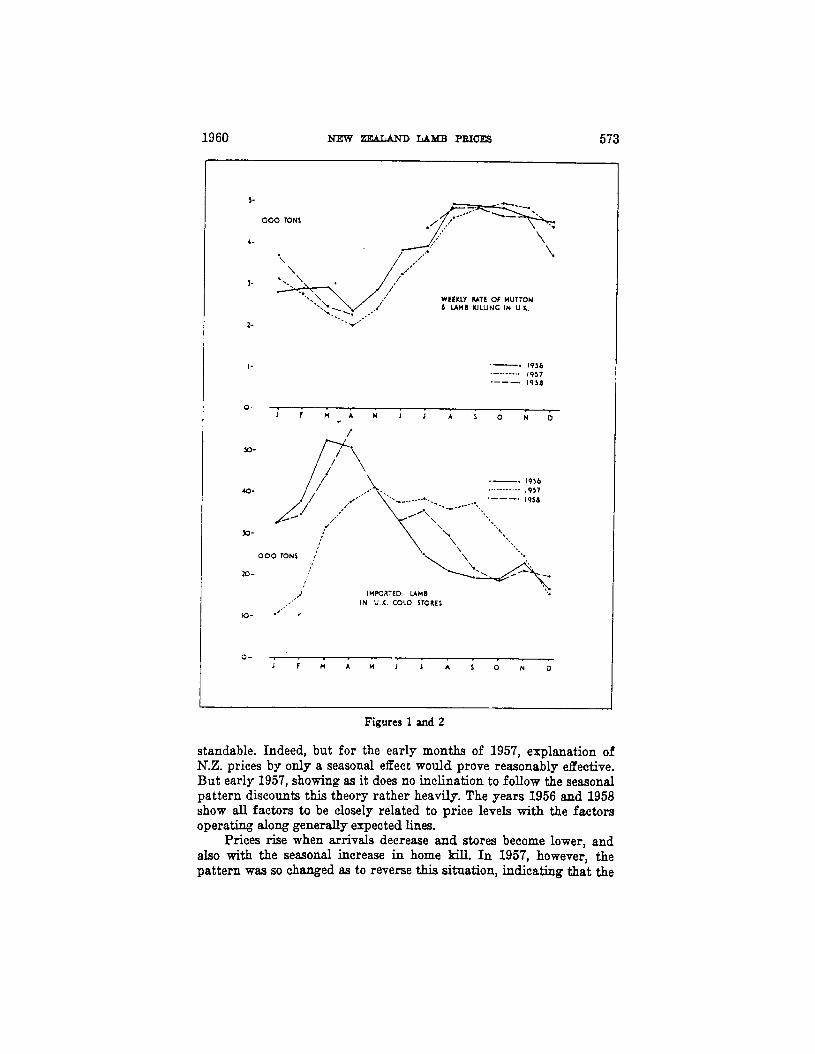
dependence of price levels on the home kill is less than on other factors such as storage. The storage and arrival position in early 1957 is inter- esting when compared with the 1956 and 1958 years. The cold store position of imported lamb is shown in Figure 2 and the average weekly arrival rate of N.Z. lamb into the U.E. is given in Figure 3.
February to May 1957 shows a definite decline in stores compared with other years, the figure being low in December 1956 and declining further over the period of customary increase. Arrivals to the United Kingdom maintained their level over this period but appeared insuf- ficient for both sales and stock replenishment. Until the arrival of 40,000 tons in March and normal arrivals in April and May, stocks were low. The high correlations between cold store stocks, both unlagged and lagged (Table V) is the on ly correlation set that shows stability over the three years in question, the 1957 value being similar to those of 1956 and 1958. This evidence shows a tendency for there to be a general storage programme in the United Kingdom, and, in 1957, for the yearly programme to be maintained as closely as possible. Thus with the fall in stocks early in that year, attempts to restore the stock position and at the same time supply the market could 'well account for the different price trends.
3. Models To obtain some measure of the actual dependence of price on the
factors measured, various mathematical models have been fitted. In view of the diverse nature of lamb disposal, both from slaughter- houses to traders and from the traders to the wholesale market, the
1960 NEW zEuAAND LAMB PRICES 575 prediction of price levels is m c u l t . Each trading concern in co- operation with its New Zealand suppliers endeavours in its o w n way to obtain reasonable market prices. Extra-market sales, planned pro- grammes of meat selling, and the seasonal nature of lamb sales tend to complicate any predictive relations that may be put forward. Dif- ficulties arise from the necessity of having adequate, but only just adequate, stores a t the close of the year to carry over until new season’s lamb arrives. Arrangements for marketing N.Z. Iamb make it impossible to assess how much lamb is traded in any one period, and although this could be estimated, and is possibly important, it has not been considered here.
Better explanations of price fluctuations could perhaps be obtained by using estimates of amounts sold at various times, but predictions would only be as accurate as the estimates on which they are based. and these are subject to individual interpretation and possible bias. A n endeavour has been made purposely to remove such interpretations in this paper as far as is possible by using only data which are recog- nized as being reasonably correct. For these reasons no estimates of unknown factors are attempted, nor are any such estimates used in the price prediction.
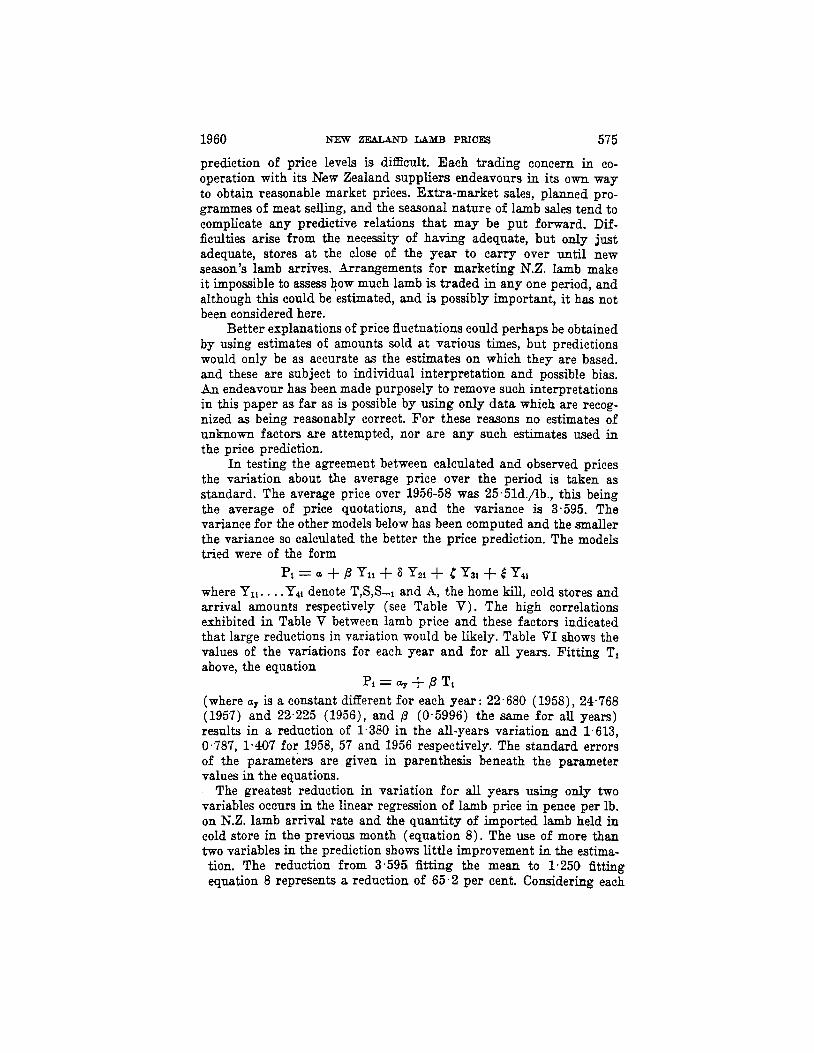
In testing the agreement between calculated and observed prices the variation about the average price over the period is taken as standard. The average price over 1956-58 was 25.51d./lb., this being the average of price quotations, and the variance is 3.595. The variance for the other models below has been computed and the smaller the variance so calculated the better the price prediction. The models tried were of the form
where Yli. . . .Ydi denote T,S,S-1 and A, the home kill, cold stores and arrival amounts respectively (see Table V). The high correlations exhibited in Table V between lamb price and these factors indicated that large reductions in variation would be likely. Table VI shows the values of the variations for each year and for all years. Fitting Ti above, the equation
PI = + P Ti (where aY is a constant diEerent for each year: 22.680 (1958), 24.768 (1957) and 22.225 (1956), and p (0.5996) the same f o r all years) results in a reduction of 1.380 in the all-years variation and 1.613, 0.787, 1.4-07 for 1958, 57 and 1956 respectively. The standard errors of the parameters are given in parenthesis beneath the parameter values in the equations.
The greatest reduction in variation for all years using only two variables occurs in the linear regression of lamb price in pence per lb. on N.Z. lamb arrival rate and the quantity of imported lamb held in cold store in the previous month (equation 8). The use of more than two variables in the prediction shows little improvement in the estima-
pi = Q + p yli f 8 y 2 1 + P y 3 1 + 6 y11
tion. The reduction from 3.595 fitting the mean to 1.250 fitting equation 8 represents a reduction of 65 .2 per cent. Considering each
576 THE ECONOMIC BECORD DECEMBER
TABLE VI Forms of estimation and residual variances
- 1951 -
3.457 - 2.870
- 1958
4.318 - Estimator 1956 Al l Yean
Average price 25*51d./lb. 2-874 - 1.261
- 1.526
- 0.724
3.595
2.215 T 22.680
22.225 (a2631) P -24*768+0*5998T 2.909
2.014 A 28.477
P 28.303-0.3587.4 2.524
- 3.056
1.984 25.947 (e1.223)
27 * 848
27,401 (-0605) P - 29.844-0*0938S 1 * 533 1.428 S
27 * 837
27.616 (*0691) P a 29*915-0.09848-1 0.338 2.249
- 2.404
- 2.187
- 2.171
- 2.317
- 2.171
- 1.950
- 2.055
-
2.320
2.222 1.541 S-1 ~~~ ~
25.319
24.804 (.3333) (e1583) P 27.217+0*2275T-O*2892A 2 * 050 TA 0.985 1.314
27.131 P = 29*218+0*1250T-O~0883S
26.748 (*2573) (a0233) 0.669 1.510 1.452 TS
1.440 TS-,
1.250 AS-,
1.435 AS
1.873
- 1.022
- 1.144
- 1.770
- 1-061
26.131 P = 28*271-0*0888T+0*37493-1
25.886 (*2192) (.0218) 0.324
28.698
28,391 (-0978) (*0200) P = 30.646 -0 9 2844X-0.0886S-1 0.344
-
0.906
-
0-521
- 0.782
- 0.328
- 0.320
27.972
27.500 (*1238) (*0230) P = 29*917-0*1149A-O~0820S
27.267 P = 29*2298-0*0320S-O*0453S-~
28.921 (.0320) (.0353)
28.558 P = 30*475-0~1047T-O~1382A-O*0850S 1.481 TAS
28 * 08 1
28.619 P = 30~576+0*0210T--0*2770A--0*0878S~ 1.008 1.243 . TAS-,
28.317
1.389 TSS-1 27.209
26.885
28.736
28.434
P = 29~285+0~1843T-0*0453~-0*0532S~~
P = 3 0 ~ 6 8 6 - 0 ~ 2 8 ~ A - 0 ~ 0 8 8 5 S ~ , + 0 ~ 0 0 0 5 ~
2.164
- 2-168
1.801
0.355 1 * 020
28.602
28.302 +o * 0020s P =m 30*558+0~0353T-0*2805A-O~089S~ 0.370
- 2.393
- 1.099
- 1.309 TASS-1
1960 NEW ZEALAND LAMB PRICES 577
year separately and comparing the residual variance with the variance about the mean of each year gives reductions of 88-0 per cent, 33.0 per cent, 76.3 per cent for 1956, 57 and 1958 respectively. As initial stocks are related to previous price through previous sales, the exist- ence of high correlation between the residuals of equation 4 could result in the least square estimates being biassed. The calculated serial correlation of the h t three orders resulted in the values 0.292, -0.102, and 4 . 0 6 6 , none being significantly different a t the 10 per cent level of probability. If we examine the closeness of agreement between observed price and price calculated from the equations by means of the variations in Table VI, we h d that in 1957 the depend- ence of monthly average price on stores in hand within the month (S) is high. It is exceeded only by the agreement between price calculated using the cold storage quantities in hand in the month and the month previous (S, EL1). The effect of arrival rate (A) is small ; when coupled with S and S1 it produces a poorer explanation of the variance in lamb price because of the high intercorrelation existing between the dependent variables.
1956 and 1958 exhibit a similar pattern but differing from 1957. In both instances has a large effect in reducing variation whilst r,rrival rate (A) has a marked effect on both years. The general tendency over years 1956-1958 appears to have been a varying one, both 1956 and 1958 being dependent on the amount of lamb arriving per week and the amount in cold stores a t the end of the previous month. This would indicate, what is perhaps generally to be expected, that the N.Z. lamb price a t any one time depends to a large extent on the actual amounts of imported lamb available in the United Kingdom at the time. The 1957 price changes show that prices tended to follow arrival rate and stores in the month the price was quoted (A, S). The extremely low storage position in early 1957 and the desire to build up storage amounts would tend to have the effect on price shown in Table VI. That is, it would tend to accentuate immediate supplies rather than the previous month's storage position.
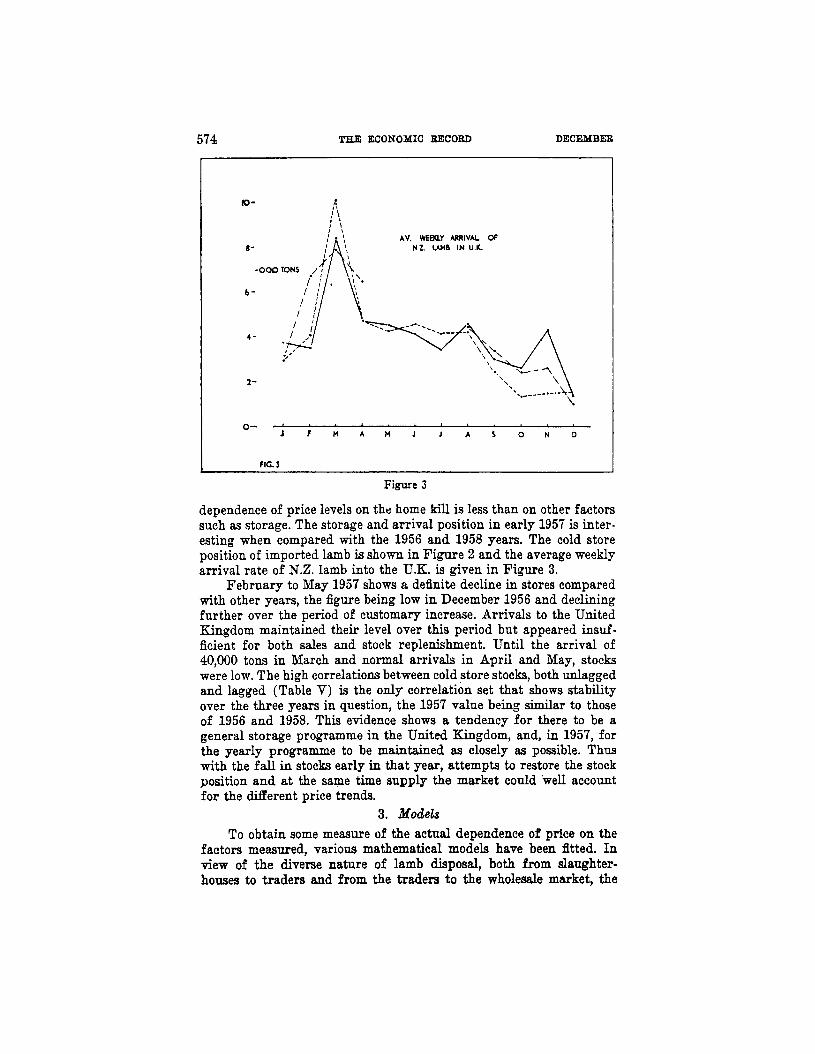
F i n w e 4 shows the agreement between observed average monthly price and the estimated price for the years 1956-1958; the equations are taken from Model 8 (Table VI) . The 1959 price estimates were obtained from equation 8, the constant being calculated as the mean of the January and February constants necessary to give complete agreement with prices in these months.
4. Policy suggestions It is possible to obtain, on certain definite assumptions, various
mathematical models giving rise to selling schedules for N.Z. lamb in the United Kingdom u s k g data from Table VI. Such schedules would indicate what quantities of lamb must be sold in any specified month (taking into account the store position, arrivals, etc.) so that the total value of the annual kill is maximized. As no one agency has control over stores and sales, the marketing being competitive within itself
578
.lo Vl9
THE ECONOMIC aECOBD
.12
MONTHLY AV. SMITHFIELD PRICES
.lo prnc* / ib i
' 19
' 111
-17
' Ib
I' .--.AV SMITHFIELD PRICE CALCULATED MONTHLY AV. .____. . I4
DECNBER
OBSERVED AND CILCULATED N . Z . LAMB PRICES
P, - o + b A * c L
.. 1956 1957 1958 1959
1 H H J S N 1 H M 1 5 N J H H J - S N 1 Y M J 5 N
f I G : 4
Figure 4
between the different trading organizations, any tables so produced would be of little practical si ,dcance aa instructions for sale of the requisite tonnage at specified times could not generally be complied with.
Lack of information concerning the actual amounts sold in the U.H. at specified times adds to the di.Eculty in establishing the demand f o r lamb and the degree to which such a demand is satisfied. It is generally recognized, however, that the market so f a r as imported lamb is concerned is reasonably saturated for most of the annual period.
The problem is essentially one of double storage and release, first within New Zealand itself (involving lamb slaughter, storage, and release for transport), and secondly in the United Kingdom (involving cold storage and release to the wholesale market). Market release is carried out by many traders, each pursuing his own policy with little or no co-ordination with his fellows. There is scope, however, for a New Zealand policy of so arranging shipping facilities as to maximize the potential value of U.K. stocks of imported lamb. The object of this would be to ensure at all times the most favourable climate for sales of imported lamb, of which New Zealand is the major supplier. Equa- tion 8 of Table VI might be used in this connection to make an arrival programme for N.Z. lamb in the United Kingdom. For the i th month ( i = 1, 2,. . . .12.) the value of known existing lamb stocks at ruling prices is given by
v1= (a + B A1 + 8 sl-1) (a1 + sl-1)
1960 ?XEW ZEALAND LAMB PRICES 579
where ai denotes the total N.Z. lamb ariving in the i th month and the total imported lamb in cold stores at the end of the previous
month. The first bracket indicates the price, U, p, and 6 being the constants of equation 8 (Table VI) . If c denotes the cost in pence per pound of storage in New Zealand for a period of one month, the figure also representing any loss in quality directly attributable to such storage, the total costs of all ai in the season of twelve months may be written as
12 . . . . . . . . . . . . . . . . . . . . . . . . . . . . - 2 a l (12-i) (2)
i =1 The total of all potential values of stock over the year is then given by
12 ~
R = 8 [ V i + a l ( 1 2 - i ) c ] . . . . . . . . . . . . . . . i = l
. . . . (3 )
Converting the at to A,, (al = kAI) i.e. total monthly arrivals to average weekly arrivals per month, and maximizing (3) with respect to A, gives
(4) . . . . . . 1 A , = - - [A+ ( p + S k ) Sr-I + k (12- i ) c ] 2Bk
A being a constant. Equation 4 thus gives the weekly arrival rate fo r the month i necessary to maximize the current value of all stock held in the U.K. in this month. For example, suppose 200,000 tons of New Zealand lamb are to be sold in the twelve-month period January to December in the United Kingdom (corresponding to the lambing season in N.Z. lagged by shipping times), suppose average monthly stocks in cold stores in the U.K. over the year are to be 31,000 tons, then summing equation 4 over the twelve months gives X = 22.778 and hence
where k = 4.333, being the average number of weeks in a month, /? = -0.2844, 6 = -0.0866 from Table VI, and c = 0.3d/lb. per month. For Se1 = 31
and the average weekly arrival per month of N.Z. lamb when cold stores are at 31,000 tons varies between 912 and 6,709 tons depending
ing on the total cold store stocks at the close of the previous month and the month of the year, the amount of N.Z. lamb (in thousand tons) that should arrive in the United Kingdom to maintain the potential value of imported stocks can be cdculated.
from Figure 2 for the years 1956, 57, 58, the average cold store monthly stocks of which are 30.9, 31.0, and 32.0 thousand tons respectively, the amounts of lamb that should have arrived each month to maximize U.K. stock values have been calculated and appear in Table VII.
. . . . . . . . . . A1 = 9,241 - 0.2676 + 0.5274 (12 - i) ( 5 )
. . . . . . . . . . . . . . . . . . . . A, = 9.241 - 0.527 (12 - i) (6)
on the month of the year (i = 1,2 ,3 , . .. .12.). For each month, depend-
Using the values of
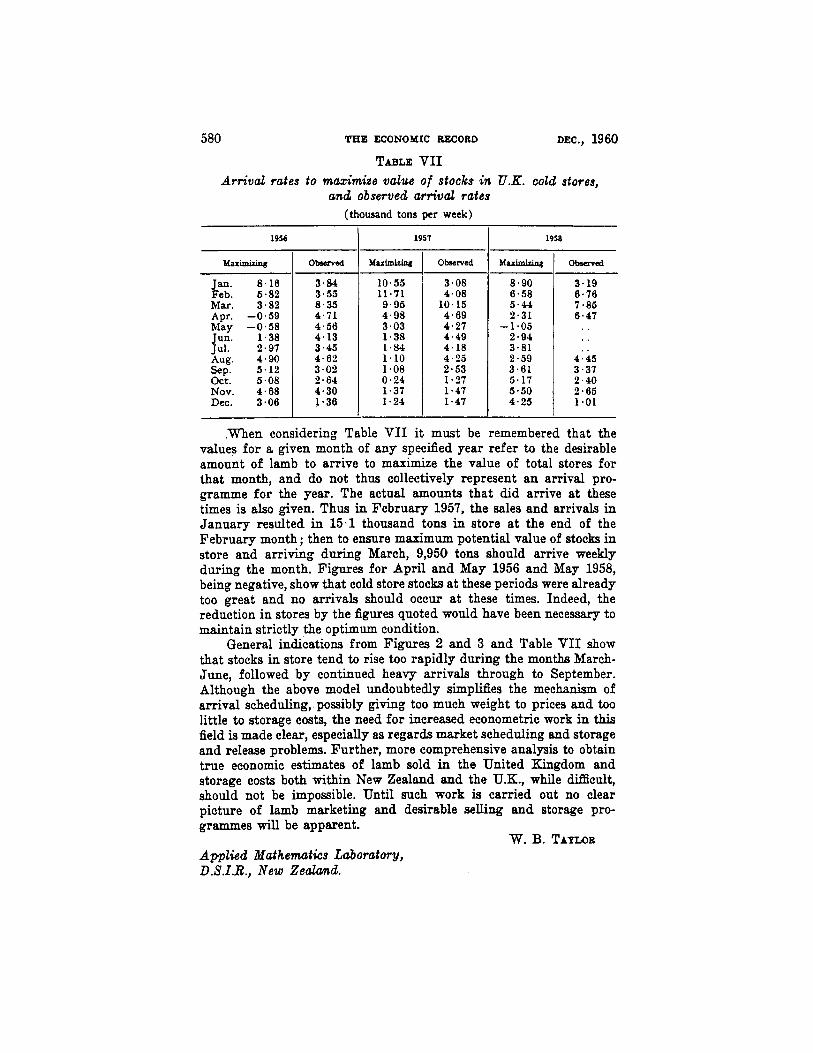
580 THE ECONOMIC RECORD DEC., 1960 TABLE VII
Arrival rates to maximize value of stocks in U.K. cold stores, and observed arrival rates
(thousand tons per week)
obscr~ed
3.08 4.08
10.15 4.69 4.27 4.49 4.18 4.25 2.53 1.27 1.47 1.47
Maximiring m- 8.90 6.58 5 .44 2.31
-1.05 2.94 3.81 2.59 3.61 5.17 5.50 4.25
1956
Obswed
Jan. 8.16 Feb. 6.82 Mar. 3.82 Apr. -0.59 May -0 .58 Jun. 1.38 Jul. 2.97 Aug. 4.90 Sep. 5.12 Oct. 5.08 Nov. 4.68 Dec. 3.06
3.84 3.55 8.35 4.71 4.56 4.13 3.45 4.62 3.02 2.64 4.30 1.36
1958 I 1957
M d U l i Z i i
10.55 11.71 9.95 4.98 3.03 1.38 1.84 1.10 1.08 0 .24 1.37 1.24
O b s w d
3.19 6.76 7.86 6.47 . . . . . .
4.45 3.37 2.40 2.65 1.01
, m e n considering Table VII it must be remembered that the values for a given month of any specified year refer to the desirable amount of lamb to arrive to maximize the value of total stores fo r that month, and do not thus collectively represent an arrival pro- gramme for the year. The actual amounts that did arrive at these times is also given. Thus in Fcbruary 1957, the sales and arrivals in January resulted in 15.1 thousand tons in store a t the end of the February month ; then to ensure maximum potential value of stocks in store and arriving during March, 9,950 tons should arrive weekly during the month. Figures f o r April and May 1956 and May 1958, being negative, show that cold store stocks at these periods were already too great and no arrivals should occur at these times. Indeed, the reduction in stores by the figures quoted would have been necessary to maintain strictly the optimum condition.
General indications from Figures 2 and 3 and Table VII show that stocks in store tend to rise too rapidly during the months March- June, followed by continued heavy arrivals through to September. Although the above model undoubtedly simplifies the mechanism of arrival scheduling, possibly giving too much weight to prices and too little to storage costs, the need for increased econometric work in this field is made clear, especially as regards market scheduling and storage and release problems. Further, more comprehensive analysis to obtain true economic estimates of lamb sold in the United Kingdom and storage costs both within New Zealand and the U.K., while difEcult, should not be impossible. Until such work is carried out no clear picture of lamb marketing and desirable selling and storage pro- grammes will be apparent.
Applied Hathematics Laboratory, D.B.I.R., New Zealand.
W. B. TAYL~B