Embed Size (px)
Citation preview

U.S. Energy Information Administration | Short-Term Energy Outlook February 2015 1
February 2015
Short-Term Energy Outlook (STEO)
Highlights
January was the seventh consecutive month in which monthly average North Sea Brent
crude oil prices decreased, reaching $48/barrel (bbl), the lowest since March 2009. The price
decline reflects continued growth in U.S. tight oil production and strong global supply, amid
weaker global oil demand growth, which contributed to rising global oil inventories. In
January, estimated Organization for Economic Cooperation and Development (OECD) total
commercial oil inventories reached their highest level since August 2010.
EIA forecasts that Brent crude oil prices will average $58/bbl in 2015 and $75/bbl in 2016,
with 2015 and 2016 annual average West Texas Intermediate (WTI) prices expected to be
$3/bbl and $4/bbl, respectively, below Brent. This price outlook is unchanged from last
month’s forecast. The current values of futures and options contracts continue to suggest
very high uncertainty in the price outlook (Market Prices and Uncertainty Report). WTI
futures contracts for May 2015 delivery, traded during the five-day period ending February
5, averaged $52/bbl while implied volatility averaged 52%, establishing the lower and upper
limits of the 95% confidence interval for the market's expectations of monthly average WTI
prices in May 2015 at $33/bbl and $81/bbl, respectively. The 95% confidence interval for
market expectations widens over time, with lower and upper limits of $32/bbl and $108/bbl
for prices in December 2015.
Total U.S. crude oil production averaged an estimated 9.2 million barrels per day (bbl/d) in
January. Forecast total crude oil production averages 9.3 million bbl/d in 2015. Given EIA’s
price forecast, projected crude oil production averages 9.5 million bbl/d in 2016, close to the
highest annual average level of production in U.S. history of 9.6 million bbl/d in 1970.
Driven largely by falling crude oil prices, U.S. weekly regular gasoline retail prices averaged
$2.04/gallon (gal) on January 26, the lowest since April 6, 2009, before increasing to
$2.19/gal on February 9. EIA expects U.S. regular gasoline retail prices, which averaged
$3.36/gal in 2014, to average $2.33/gal in 2015. The average household is now expected to
spend about $750 less for gasoline in 2015 compared with last year because of lower prices.
The projected regular gasoline retail price increases to an average of $2.73/gal in 2016.
Natural gas working inventories on January 30 totaled 2,428 Bcf, 468 Bcf (24%) above the
level at the same time in 2014 and 29 Bcf (1%) below the previous five-year (2010-14)
average. EIA expects the Henry Hub natural gas spot price to average $3.34/million British

U.S. Energy Information Administration | Short-Term Energy Outlook February 2015 2
thermal units (MMBtu) this winter (2014-15) compared with $4.53/MMBtu last winter
(2013-14), reflecting both lower-than-expected space heating demand and higher natural
gas production this winter. EIA expects the Henry Hub natural gas spot price, which
averaged $4.39/MMBtu in 2014, to average $3.05/MMBtu in 2015 and $3.47/MMBtu in
2016, $0.39/MMBtu lower for both years than in last month’s STEO.
Global Petroleum and Other Liquids
Market fundamentals remain largely unchanged since last month’s forecast, as global
production continues to be higher than demand, contributing to inventory builds. Global oil
inventory builds averaging 0.9 million bbl/d are projected through the first half of 2015, with the
builds moderating during the second half of the year, as non-OPEC supply growth, particularly
from the United States, weakens because of lower oil prices. The expected inventory builds in
2015 are on top of an estimated 0.8 million bbl/d increase in 2014.
EIA revised historical global supply and demand levels to reflect improved data estimates for
various countries. These changes to history affected forecast levels of supply and demand, but
did not affect forecast growth rates.
Global Petroleum and Other Liquids Consumption. EIA estimates that global consumption grew
by 0.9 million bbl/d in 2014, averaging 92.1 million bbl/d for the year. EIA expects global
consumption to grow by 1.0 million bbl/d in both 2015 and 2016. Projected global oil-
consumption-weighted real gross domestic product (GDP), which increased by an estimated
2.7% in 2014, is projected to grow by 2.8% in 2015 and by 3.2% in 2016.
Non-OECD consumption growth is the main driver of global consumption growth in the forecast,
with projected growth of 0.8 million bbl/d in 2015 and of 1.1 million bbl/d in 2016, both lower
than the estimated 1.2 million bbl/d of growth in 2014. China’s consumption is projected to
increase by an annual average of 0.3 million bbl/d in both 2015 and 2016, below the 0.4 million
bbl/d of growth in 2014. China’s economic growth slowed in the latter half of 2014, as key
manufacturing indexes decreased. Nonetheless, China remains the main source of non-OECD
consumption growth. Projected declines in Russia’s oil consumption because of its economic
downturn also contribute to lower non-OECD consumption growth over the forecast period
compared with 2014. Russia’s consumption is expected to decline by 0.2 million bbl/d in both
2015 and 2016.
OECD consumption, which fell by 0.3 million bbl/d in 2014, is expected to grow by 0.2 million
bbl/d in 2015 and then decline by 0.1 million bbl/d in 2016. Japan and Europe accounted for
almost the entire decline in 2014 and are expected to continue to decline over the next two
years, albeit at a lesser rate than in 2014. The United States is the leading contributor to
projected OECD consumption growth, with U.S. consumption increasing by 0.3 million bbl/d in
2015 and by 0.1 million bbl/d in 2016.

U.S. Energy Information Administration | Short-Term Energy Outlook February 2015 3
Non‐OPEC Petroleum and Other Liquids Supply. After increasing by 2.1 million bbl/d in 2014,
non-OPEC supply is expected to grow more slowly, by 0.8 million bbl/d annually in both 2015
and 2016, in part because of lower projected oil prices. The slower growth in non-OPEC supply
over the forecast period is largely attributable to slower production growth in the United States,
Canada, and South America. Additionally, oil production in Europe and Eurasia is projected to
decline. The United States remains the leading contributor to non-OPEC supply in the forecast.
Unplanned supply disruptions among non-OPEC producers averaged slightly more than 0.6
million bbl/d in 2014, 0.2 million bbl/d less than in 2013. In January 2015, non-OPEC supply
disruptions were 0.6 million bbl/d, similar to the previous month. South Sudan, Syria, and
Yemen accounted for more than 85% of total non-OPEC supply disruptions.
OPEC Petroleum and Other Liquids Supply. EIA estimates that OPEC crude oil production
averaged 30.1 million bbl/d in 2014, unchanged from the previous year. Crude oil production
declines in Libya, Angola, Algeria, and Kuwait more than offset production growth in Iraq and
Iran. EIA expects OPEC crude oil production to fall by 0.1 million bbl/d in 2015, and to fall by 0.4
million bbl/d in 2016. Iraq is the largest contributor to OPEC production growth over the
forecast period, but its growth is expected to be offset by production declines from other
Persian Gulf producers. However, the threat of the Islamic State of Iraq and the Levant (ISIL) on
northern Iraqi production and exports still looms, and as a result, Iraq is a major wild card in the
world oil production forecast.
EIA estimates that OPEC produced 6.4 million bbl/d of noncrude oil liquids in 2014, slightly less
than its production in 2013. OPEC noncrude liquids production is expected to increase by less
than 0.1 million bbl/d in both 2015 and 2016, led by Iran and Qatar.
In January 2015, unplanned crude oil supply disruptions among OPEC producers averaged 2.6
million bbl/d, an increase of less than 0.1 million bbl/d compared with the previous month. This
increase was attributable to rising outages in Libya, which have been growing since late 2014.
Unplanned OPEC crude supply disruptions averaged 2.4 million bbl/d in 2014, 0.6 million bbl/d
higher than in the previous year. Libya and Iraq accounted for almost all of the growth in OPEC
disruptions. The high level of OPEC disruptions contributed to higher crude oil prices during the
first half of 2014. However, with continuous growth in non-OPEC production and strong
production in Saudi Arabia outpacing world oil demand growth, the current volume of supply
disruptions has become less significant. Unplanned supply disruptions could still affect crude oil
prices, but the threshold that the market can bear has risen in light of robust global production.
EIA expects OPEC surplus crude oil production capacity, which is concentrated in Saudi Arabia,
to increase to an annual average of 2.3 million bbl/d in 2015 and 2.7 million bbl/d in 2016, after
averaging about 2.0 million bbl/d in 2014. Surplus capacity is typically an indication of market
conditions, and surplus capacity below 2.5 million bbl/d is an indicator of a relatively tight
market. However, the current and forecast levels of global inventory builds make the projected
low surplus capacity level in 2015 less significant.
U.S. Energy Information Administration | Short-Term Energy Outlook February 2015 4
OECD Commercial Petroleum Inventories. EIA estimates that OECD commercial oil inventories
totaled 2.74 billion barrels at the end of 2014, the highest end-of-year level on record and
equivalent to roughly 58 days of consumption. Projected OECD oil inventories rise to 2.83 billion
barrels at the end of 2015 and again total 2.83 billion barrels at the end of 2016.
Crude Oil Prices. North Sea Brent crude oil spot prices averaged $48/bbl in January, the lowest
monthly average Brent price since March 2009, down $15/bbl from the December average. The
combination of robust world crude oil supply growth and weak global demand has contributed
to rising global inventories and falling crude oil prices (EIA, This Week in Petroleum, January 28,
2015).
EIA expects global oil inventories to continue to build in 2015, limiting upward pressure on oil
prices because of declining drilling activity. The forecast Brent crude oil price averages $58/bbl
in 2015, unchanged from last month's STEO. Based on current market balances, EIA expects
prices to be relatively flat in the first half of 2015, when global inventory builds are projected to
be significant. EIA projects that Brent prices will average $67/bbl during the fourth quarter.
The monthly average WTI crude oil spot price fell from an average of $59/bbl in December to
$47/bbl in January, its lowest level since February 2009. EIA expects the WTI crude oil price to
average $55/bbl in 2015 and $71/bbl in 2016, both unchanged from last month’s STEO. The
discount of WTI to Brent crude oil averaged less than $1/bbl in January, the narrowest monthly
average price spread since August 2010. In the forecast, the discount of WTI to Brent is
projected to average $3/bbl in 2015 and $4/bbl in 2016.
The current values of futures and options contracts suggest continuing high uncertainty in the
price outlook (Market Prices and Uncertainty Report). WTI futures contracts for May 2015
delivery, traded during the five-day period ending February 5, averaged $52/bbl. Implied
volatility averaged 52%, establishing the lower and upper limits of the 95% confidence interval
for the market's expectations of monthly average WTI prices in May 2015 at $33/bbl and
$81/bbl, respectively. The 95% confidence interval for market expectations widens over time,
with lower and upper limits of $32/bbl and $108/bbl for prices in December 2015. Last year at
this time, WTI for May 2014 delivery averaged $96/bbl, and implied volatility averaged 19%.
The corresponding lower and upper limits of the 95% confidence interval were $81/bbl and
$113/bbl.
The recent declines in oil prices and associated increase in oil price volatility continue to
contribute to a particularly uncertain forecasting environment, and several factors could cause
oil prices to deviate significantly from current projections. Among these factors is the
responsiveness of supply to lower prices. Despite OPEC’s November 2014 decision to leave its
crude oil production target at 30 million bbl/d, key producers could decide to reduce output,
tightening market balances. The level of unplanned production outages could also vary from
forecast levels for a wide range of producers, including OPEC members Libya, Iraq, Iran, Nigeria,

U.S. Energy Information Administration | Short-Term Energy Outlook February 2015 5
and Venezuela. The degree to which non-OPEC supply growth is affected by lower oil prices will
also affect market balances and prices.
Several OPEC and non-OPEC oil producers rely heavily on oil revenues to finance national
budgets. Some producers have already started adjusting their upcoming budgets to reflect the
crude oil price decline. If crude oil prices fall further or are sustained at current levels, then oil-
dependent producers will face tough decisions. These decisions could potentially lead to
austerity programs and fuel subsidy cuts that could spark social unrest, leaving some countries
vulnerable to supply disruptions if protesters target oil infrastructure. Potential new supply
disruptions are a real possibility and present a major uncertainty in the world oil supply forecast.
U.S. Petroleum and Other Liquids
Falling crude oil prices and high inventories of gasoline helped U.S. weekly regular gasoline retail
prices fall to an average of $2.04/gal on January 26, the lowest weekly price since April 6, 2009
(EIA, This Week in Petroleum, January 22, 2015). U.S. average weekly regular gasoline retail
prices have since increased to $2.19/gal as of February 9. In January, monthly average regional
gasoline retail prices ranged from a low of $1.90/gal in Petroleum Administration for Defense
District (PADD) 3 to a high of $2.45/gal in PADD 5. EIA expects retail gasoline prices to average
$2.13/gal during the first quarter of 2015 and $2.33/gal for the full year.
Liquid Fuels Consumption. Total U.S. liquid fuels consumption rose by an estimated 60,000
bbl/d (0.3%) in 2014. Motor gasoline consumption increased by 80,000 bbl/d (0.8%) reflecting
an increase in highway travel that was partially offset by fleetwide increases in fuel efficiency.
Distillate consumption grew by 160,000 bbl/d (4.2%), as a result of colder-than-average weather
in the first quarter as well as increases in industrial production. Jet fuel consumption increased
by 30,000 bbl/d (2.2%). Hydrocarbon gas liquids (HGL) and residual fuel oil consumption fell by
an estimated 100,000 bbl/d (4.1%) and 60,000 bbl/d (19.7%), respectively.
In 2015, total liquid fuels consumption is forecast to grow by 290,000 bbl/d (1.5%). Lower pump
prices contribute to an 80,000-bbl/d increase (0.9%) in motor gasoline consumption. HGL
consumption is expected to reverse 2014’s decline, increasing by 140,000 bbl/d (5.7%).
Consumption of distillate fuel is projected to increase by 80,000 bbl/d, driven largely by
expanding industrial production. Additionally, some of the growth in distillate fuel consumption
comes from Annex VI to the International Convention for the Prevention of Pollution from Ships
(MARPOL Annex VI), which is an international agreement that generally requires the use of fuels
below 1,000 parts per million sulfur by marine vessels in most U.S. waters, unless alternative
devices, procedures, or compliance methods are used to achieve equivalent emissions
reductions. The increase in marine distillate use because of MARPOL regulations will displace
the use of residual fuel oil.
EIA projects that in 2016 liquid fuels consumption growth will slow to 100,000 bbl/d (0.5%).
Motor gasoline consumption declines by 50,000 bbl/d (0.5%) as the annual average retail

U.S. Energy Information Administration | Short-Term Energy Outlook February 2015 6
gasoline price is projected to increase 17% from the 2015 level. Continuing industrial growth
contributes to a 100,000 bbl/d (3.9%) increase in HGL consumption and a 60,000 bbl/d (1.5%)
increase in distillate use. Jet fuel consumption declines by 10,000 bbl/d (0.4%) despite
moderate increases in air travel, as the introduction of new aircraft improves fuel efficiency.
Liquid Fuels Supply. Forecast U.S. crude oil production increases from an average of 8.6 million
bbl/d in 2014 to 9.3 million bbl/d in 2015 and 9.5 million bbl/d in 2016. With WTI crude oil prices
expected to average $50/bbl in the first half of 2015, EIA expects 2015 drilling activity to decline
because of unattractive economic returns in some areas of both emerging and mature oil
production regions. Many companies have begun redirecting investment away from marginal
exploration and research drilling and focusing on core areas of major tight oil plays. Projected
2015 oil prices remain high enough to support some development drilling activity in the Bakken,
Eagle Ford, Niobrara, and Permian Basin, albeit at lower levels than previously forecast.
Companies that have lower drilling and debt costs and have acreage in the sweet spots of these
regions will continue to drill highly productive wells in 2015.
Nevertheless, EIA expects 2015 production to reach 9.4 million bbl/d in the second quarter, then
decline by 180,000 bbl/d in the third quarter. With projected WTI crude oil prices rising in the
second half of 2015, drilling activity is expected to increase again as companies take advantage
of lower costs for both leasing acreage and drilling services, resulting in growing production
despite the relatively low WTI price. A notable risk to the production forecast is that some
drilled wells will not be completed. EIA will continue monitoring the inventory of uncompleted
wells to inform the production forecast. Additionally, this forecast remains particularly sensitive
to actual prices available at the wellhead and drilling economics that vary across regions and
operators. Projected production for the federal offshore region and Alaska, which rise and fall
respectively, are less sensitive to short-term price movements than onshore production in the
Lower 48 states.
HGL production at natural gas liquids plants, which reached a record high of 3.1 million bbl/d in
October, is projected to increase to 3.3 million bbl/d by the end of 2015. Ethane and propane
are expected to contribute most to the projected growth, with most of the production supplying
domestic petrochemical demand or exports. EIA expects higher rates of ethane recoveries as a
result of planned increases in petrochemical facility feedstock demand, while export terminal
expansions will allow higher quantities of domestically produced propane and butanes to reach
the international market.
The growth in domestic production has contributed to a significant decline in imports of crude
oil and other liquids. The share of total U.S. liquid fuels consumption met by net imports fell
from 60% in 2005 to an estimated 27% in 2014. EIA expects the net import share to decline to
20% in 2016, which would be the lowest level since 1968.
Petroleum Product Prices. U.S. average regular gasoline retail prices averaged $2.12/gal in
January, the lowest monthly average since April 2009. The U.S. regular gasoline retail price,
which averaged $3.36/gal in 2014, is projected to average $2.33/gal in 2015 and $2.73/gal in

U.S. Energy Information Administration | Short-Term Energy Outlook February 2015 7
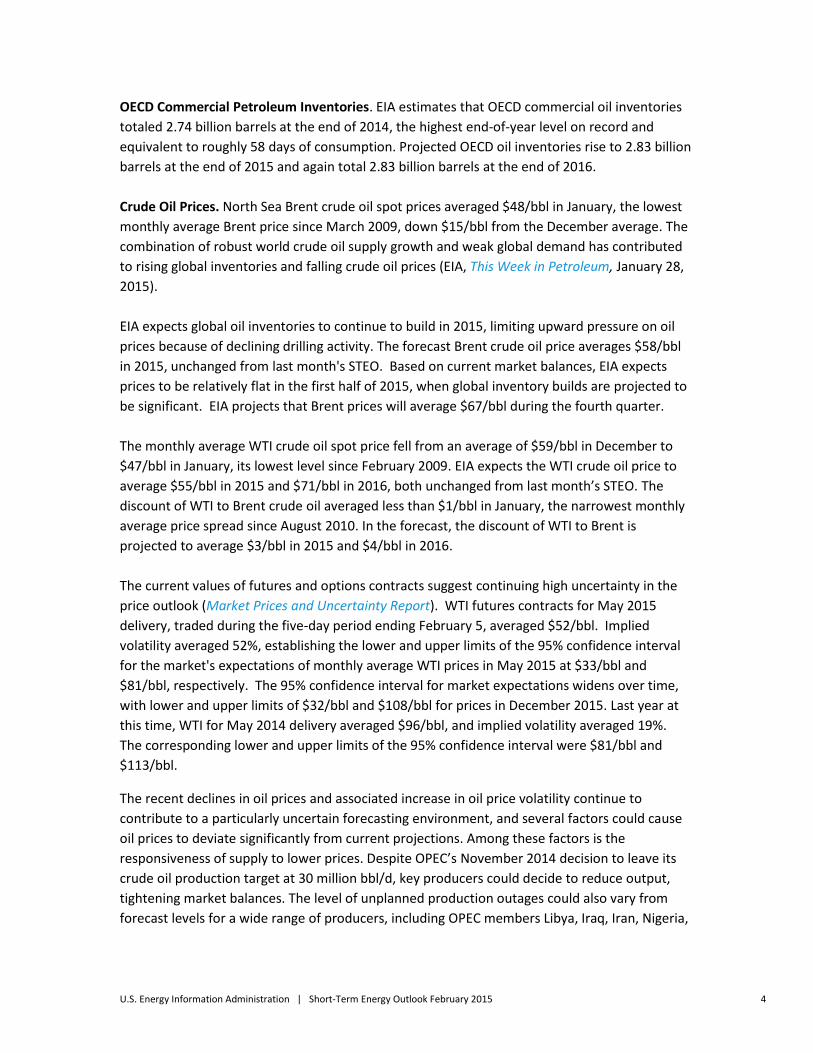
2016, almost unchanged from last month’s STEO. Diesel fuel retail prices, which averaged
$3.83/gal in 2014, are projected to fall to an average of $2.83/gal in 2015 and then rise to
$3.24/gal in 2016.
The May 2015 New York Harbor reformulated blendstock for oxygenate blending (RBOB) futures
contract averaged $1.77/gal for the five trading days ending February 5, 2015, and has a 15%
probability of exceeding $2.10/gal (consistent with a retail price of $2.75/gal) at expiration. The
current values of futures and options contracts suggest there is a 5% probability that the RBOB
futures contract price at expiration may exceed $2.35/gal, consistent with a retail price of
$3.00/gal or higher, and a 8% probability that the RBOB futures price may fall below $1.35/gal,
consistent with a retail price of $2.00/gal or lower. Daily and weekly national average prices can
differ significantly from monthly and seasonal averages, and there are also significant
differences across regions, with monthly average prices in some areas falling above or below the
national average price by $0.30/gal or more.
Lower projected crude oil prices also contribute to lower expected residential heating oil prices.
Average retail heating oil prices are expected to average $2.96/gal this winter, $0.92/gal lower
than last winter. The average household that uses heating oil as its primary space heating fuel is
now expected to spend $1,645 for heating this winter, $710 lower than last winter. Propane
prices are expected to be 17% lower in the Northeast and 27% lower in the Midwest compared
with last winter, resulting in households spending 23% and 35% less on propane in those
regions, respectively.
Natural Gas
Recent data indicate marketed natural gas production reached a record 77.3 Bcf/d in November.
Despite cold weather and reports of production freeze-offs this winter, supply has remained
abundant and prices have fallen. The February 2015 natural gas futures contract expired at
$2.87/MMBtu, and prices for the March contract have fallen further, settling at $2.60/MMBtu
on February 5. Henry Hub spot prices are now projected to average $3.05/MMBtu in 2015,
$1.34/MMBtu lower than in 2014 and $0.39/MMBtu lower than in last month’s forecast. Lower
expected prices in 2015 contribute to increasing consumption of natural gas for power
generation, which is projected to be 5.5% above the 2014 level.
Natural Gas Consumption. EIA projects that U.S. total natural gas consumption will average
74.3 Bcf/d in 2015 and 75.2 Bcf/d in 2016, compared with an estimated 73.3 Bcf/d in 2014.
Growth is largely driven by demand in the industrial and electric power sectors, while residential
and commercial consumption is projected to decline in 2015 and 2016. Natural gas consumption
in the power sector is expected to average 23.5 Bcf/d in 2015, a 0.5 Bcf/d increase from last
month’s STEO. EIA expects power sector consumption to grow by 2.6%, to 24.1 Bcf/d, in 2016.
Industrial sector consumption increases by 5.6% and 1.9% in 2015 and 2016, respectively, as
new industrial projects come online, particularly in the fertilizer and chemicals sectors, and
industrial consumers are able to take advantage of low natural gas prices.

U.S. Energy Information Administration | Short-Term Energy Outlook February 2015 8
Natural Gas Production and Trade. EIA expects that marketed natural gas production will
increase by 2.9 Bcf/d (3.8%) and 1.7 Bcf/d (2.2%) in 2015 and 2016, respectively. This increase
reflects continuing strong production in the Lower 48 states, which more than offsets the long-
term declining production in the Gulf of Mexico. Although natural gas prices have fallen
dramatically in recent months, EIA expects that increases in drilling efficiency and growth in oil
production (albeit at a slower rate) will continue to support growing natural gas production in
the forecast. Additionally, preliminary data indicate freeze-offs modestly reduced production in
January, but production has quickly recovered and growth continues. With most growth
expected to come from the Marcellus Shale, a backlog of drilled but uncompleted wells will
continue to support production growth, as new pipelines come online in the Northeast.
Increases in domestic natural gas production are expected to contribute to lower demand for
natural gas imports from Canada and increasing exports to Mexico. EIA expects exports to
Mexico, particularly from the Eagle Ford Shale in South Texas, to increase because of growing
demand from Mexico's electric power sector, coupled with flat Mexican natural gas production.
Liquefied natural gas (LNG) imports have fallen over the past five years because higher prices in
Europe and Asia are more attractive to LNG exporters than the relatively low prices in the
United States. Forecast LNG gross imports average 0.2 Bcf/d in both 2015 and 2016. EIA
projects that LNG gross exports will increase from an average of 0.04 Bcf/d in 2014 to almost 0.8
Bcf/d in 2016.
Natural Gas Inventories. On January 30, natural gas working inventories totaled 2,428 Bcf, 468
Bcf (24%) above the level at the same time in 2014 and 29 Bcf (1%) below the previous five-year
(2010-14) average. Following last year’s extremely cold winter, inventories fell 1,000 Bcf below
the five-year average in mid-April but since then have consistently narrowed the gap. EIA
projects that end-of-March 2015 inventories will total 1,699 Bcf, 43 Bcf more than the five-year
(2010-14) average.
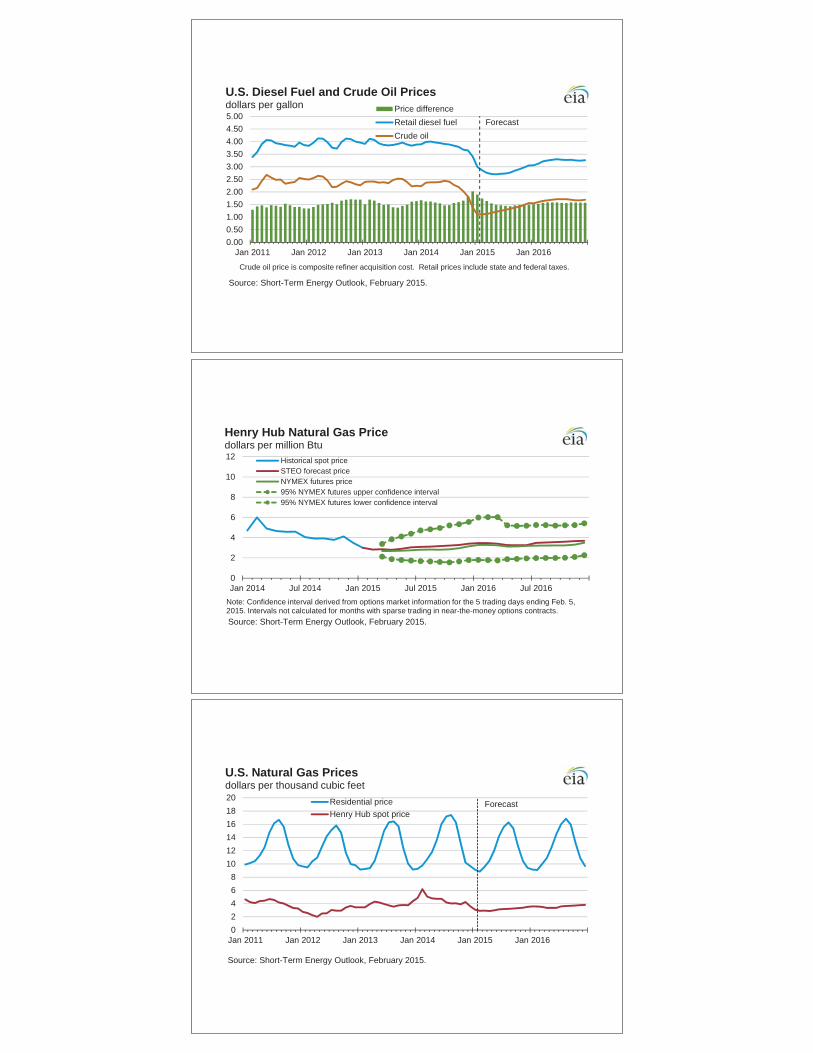
Natural Gas Prices. The Henry Hub natural gas spot price averaged $2.99/MMBtu in January, a
decline of $0.49/MMBtu from December, and the first monthly average price under $3/MMBtu
since September 2012. EIA expects monthly average spot prices to remain less than $3/MMBtu
through the winter, and less than $4/MMBtu through the remainder of the forecast. The
projected Henry Hub natural gas price averages $3.05/MMBtu in 2015 and $3.47/MMBtu in
2016.
Natural gas futures contracts for May 2015 delivery, traded during the five-day period ending
February 5, averaged $2.71/MMBtu. Current options and futures prices imply that market
participants place the lower and upper bounds for the 95% confidence interval for May 2015
contracts at $1.79/MMBtu and $4.11/MMBtu, respectively. At this time last year, the natural
gas futures contract for May 2014 delivery averaged $4.48/MMBtu and the corresponding lower
and upper limits of the 95% confidence interval were $3.28/MMBtu and $6.13/MMBtu.

U.S. Energy Information Administration | Short-Term Energy Outlook February 2015 9
Coal
Total electric power sector coal stocks increased by 6 million short tons (MMst) in November
2014 to 142 MMst at month-end. The increase in coal stocks followed the typical seasonal
pattern where coal-fired electric power plants build stocks during the autumn months in
preparation for increased coal consumption during the winter. Despite the increase, end-of-
November 2014 stocks were 14 MMst (9%) below a year ago and 21% lower than the previous
five-year (2009-13) average for November.
Coal Supply. EIA estimates that coal production for 2014 totaled 997 MMst, 13 MMst (1%)
higher than in 2013. EIA expects that annual production will decline in both 2015 and 2016,
totaling 966 MMst and 960 MMst, respectively.
Coal Consumption. Electric power sector coal consumption was largely unchanged in 2014
compared with the previous year. Power sector coal consumption is projected to decrease by
1.5% in 2015, despite an increase in electricity demand, as natural gas prices decline relative to
coal prices and retirements of coal power plants rise in response to the implementation of the
Mercury and Air Toxics Standards. The full effect of the coal plant retirements will be felt in
2016, as projected electric power sector coal consumption declines by an additional 0.6%.
Coal Trade. Coal exports in 2014 were estimated at 97 MMst, a 17% decline from 2013. The
decline was primarily a result of slowing world coal demand growth, lower international coal
prices, and increasing coal output in other coal-exporting countries. EIA expects no significant
change in global market conditions, and coal exports will fall 15% to 82 MMst in both 2015 and
2016.
Coal Prices. The annual average coal price to the electric power industry fell from a record-high
$2.39/MMBtu in 2011 to an estimated $2.35/MMBtu in 2014. EIA expects the delivered coal
price to average $2.33/MMBtu in 2015 and $2.34/MMBtu in 2016. Electricity
At the end of 2014, the nuclear generating unit at the Vermont Yankee power plant shut down
for decommissioning after more than 40 years of operation. Five other nuclear units have been
retired in the past two years. There are 99 remaining nuclear units in the United States,
including 23 in the Northeast Census region, where Vermont Yankee operated.
Electricity Consumption. Despite the January snowstorms in the Midwest and Northeast,
average U.S. heating degree days (HDD) for the month were 10% lower than in January 2014.
Based on weather forecasts from the National Oceanic and Atmospheric Administration, EIA
expects HDD during the first quarter of 2015 to be 13% lower than last year. Cooling degree
days during the summer months (April—September) are expected to be 6% higher than last
summer. Lower consumption of electricity for space heating coupled with efficiency

U.S. Energy Information Administration | Short-Term Energy Outlook February 2015 10
improvements are projected to offset increased air-conditioning use during the summer, leading
to a projected 0.4% year-over-year decline in residential electricity sales during 2015.
Residential electricity sales are projected to grow by 0.9% in 2016. Projected sales of electricity
to the commercial sector increase by 1.3% in 2015 and by 0.5% in 2016. Projected industrial
electricity sales rise by an average of 1.8% annually in both 2015 and 2016.
Electricity Generation. EIA forecasts that U.S. electricity generation will grow by an average of
1.0% 2015 and 0.9% 2016. The cost of natural gas used for power generation has fallen in
recent months, with the Henry Hub spot price declining from an average of $4.29/MMBtu last
summer to an average of $2.99/MMBtu in January. This decline in fuel costs, combined with
upcoming coal plant retirements, is likely to increase the use of natural gas-fired generating
capacity. EIA expects the share of total generation fueled by natural gas to average 28.4%
during 2015, up from 27.2% last year. In contrast, the share of generation provided by coal falls
from 38.9% to 37.8%. The retirement of the Vermont Yankee plant contributes to a decline in
the Northeast region’s nuclear power fuel share from 35.5% in 2014 to 33.3% this year.
Electricity Retail Prices. EIA expects continued growth in average residential electricity prices
over the forecast period, albeit at a slower pace than in 2014. The U.S. retail residential price is
projected to increase by 1.1% in 2015 and by 1.8% in 2016. Electricity prices in most areas of
the country are projected to increase in 2015. Projected price increases in 2015 are highest in
the Midwest states (2.6%).
Renewables and Carbon Dioxide Emissions
Electricity and Heat Generation from Renewables. EIA projects that total renewables used for
electricity and heat generation will grow by 3.8% in 2015. Conventional hydropower generation
increases by 5.7%, while nonhydropower renewables generation increases by 2.9%. In 2016,
total renewables consumption for electric power and heat generation increases by 2.9% as a
result of a 3.2% decline in hydropower and a 6.0% increase in nonhydropower renewables.
In 2013, the electricity generation shares were 6.6% and 6.2% from hydropower and
nonhydropower renewables, respectively. In 2014, 6.3% of generation came from hydropower
and 6.9% from nonhydropower renewables. This trend is expected to continue, with the
electricity generation share from nonhydropower renewables rising to 7.9% by 2016, and the
hydropower share remaining near 6.5%. Wind is the largest source of nonhydropower
renewable generation, and it is projected to contribute 5.2% of total electricity generation in
2016.
EIA expects continued growth in utility-scale solar power generation, which is projected to
average almost 80 gigawatthours (GWh) per day in 2016. Despite this growth, solar power
averages only 0.7% of total U.S. electricity generation in 2016. Although solar growth has
historically been concentrated in customer-sited distributed generation installations, EIA
expects that utility-scale solar capacity will increase by more than 60% between the end of 2014

U.S. Energy Information Administration | Short-Term Energy Outlook February 2015 11
and the end of 2016, with about half of this new capacity being built in California. Wind
capacity, which grew by 7.7% in 2014, is forecast to increase by 16.1% in 2015 and by another
6.5% in 2016. Because wind is starting from a much larger base than solar, even though the
growth rate is lower, the absolute amount of the increase in capacity is more than twice that of
solar: 15 GW of wind versus 6 GW of utility-scale solar between 2014 and 2016.
Liquid Biofuels. After reaching a record monthly average of 978,000 bbl/d in December 2014,
ethanol production in January 2015 is estimated to be 969,000 bbl/d. Ethanol production
averaged 933,000 bbl/d in 2014, and EIA expects it to average 938,000 bbl/d in 2015 and
936,000 bbl/d in 2016. Biodiesel production averaged an estimated 80,000 bbl/d in 2014 and is
forecast to average 84,000 bbl/d in both 2015 and 2016.
Energy-Related Carbon Dioxide Emissions. EIA estimates that emissions grew 0.9% in 2014.
Emissions are forecast to increase by 0.3% in 2015 and 0.5% in 2016. These forecasts are
sensitive to both weather and economic assumptions.
U.S. Economic Assumptions
Recent Economic Indicators. The Commerce Dapartment’s Bureau of Economic Analysis (BEA)
reported that real GDP grew at an annualized rate of 2.6% from the third quarter to the fourth
quarter of 2014. The increase in real GDP in the fourth quarter reflected positive contributions
from personal consumption expenditures and investment. Growth in the third quarter of 2014
was 5.0%.
EIA used the January 2015 version of the IHS macroeconomic model with EIA's energy price
forecasts as model inputs to develop the economic projections in the STEO.
Production, Income, and Employment. After expanding by 2.4% in 2014, real GDP is projected
to grow by 3.1% in 2015 and by 2.5% in 2016. Growth is expected to rise in 2015 because of
higher business investment spending, increases in consumer purchases, and recent declines in
gasoline prices. However, a stronger dollar and lower demand from slower-growing economies
are expected to reduce export growth and raise import growth. Real disposable income is
projected to grow by 3.3% in 2015 (compared with 2.8% forecast last month) and by 2.6% in
2016. Projected total industrial production grows by 3.4% in both 2015 and 2016. Projected
growth in nonfarm employment averages 2.1% in 2015 and 1.7% in 2016.
Expenditures. Forecast private real fixed investment growth averages 6.0% and 6.6% in 2015
and 2016, respectively. Real consumption expenditures grow faster than real GDP in 2015 and
2016, at 3.5% and 2.9%, respectively. Durable goods expenditures drive consumption spending
in both years. Export growth is 3.9% and 3.2% over the same two years, while import growth is
5.3% in both 2015 and 2016. Total government expenditures rise by 0.6% in 2015 and 0.4% in
2016.

U.S. Energy Information Administration | Short-Term Energy Outlook February 2015 12
This report was prepared by the U.S. Energy Information Administration (EIA), the statistical
and analytical agency within the U.S. Department of Energy. By law, EIA's data, analyses, and
forecasts are independent of approval by any other officer or employee of the United States
Government. The views in this report therefore should not be construed as representing
those of the U.S. Department of Energy or other federal agencies.

Chart Gallery for February 2015
Short-Term Energy Outlook
U.S. Energy Information Administration Independent Statistics & Analysis
020406080
100120140160180200220
Jan 2014 Jul 2014 Jan 2015 Jul 2015 Jan 2016 Jul 2016
West Texas Intermediate (WTI) Crude Oil Pricedollars per barrel
Historical spot priceSTEO price forecastNYMEX futures price95% NYMEX futures upper confidence interval95% NYMEX futures lower confidence interval
Source: Short-Term Energy Outlook, February 2015.
Note: Confidence interval derived from options market information for the 5 trading days ending Feb. 5, 2015. Intervals not calculated for months with sparse trading in near-the-money options contracts.
Forecast
0.000.501.001.502.002.503.003.504.004.505.00
Jan 2011 Jan 2012 Jan 2013 Jan 2014 Jan 2015 Jan 2016
U.S. Gasoline and Crude Oil Pricesdollars per gallon
Price differenceRetail regular gasolineCrude oil
Source: Short-Term Energy Outlook, February 2015.
Crude oil price is composite refiner acquisition cost. Retail prices include state and federal taxes.
Forecast
0.000.501.001.502.002.503.003.504.004.505.00
Jan 2011 Jan 2012 Jan 2013 Jan 2014 Jan 2015 Jan 2016
U.S. Diesel Fuel and Crude Oil Pricesdollars per gallon Price difference
Retail diesel fuelCrude oil
Source: Short-Term Energy Outlook, February 2015.
Crude oil price is composite refiner acquisition cost. Retail prices include state and federal taxes.
0
2
4
6
8
10
12
Jan 2014 Jul 2014 Jan 2015 Jul 2015 Jan 2016 Jul 2016
Henry Hub Natural Gas Pricedollars per million Btu
Historical spot priceSTEO forecast priceNYMEX futures price95% NYMEX futures upper confidence interval95% NYMEX futures lower confidence interval
Source: Short-Term Energy Outlook, February 2015.
Note: Confidence interval derived from options market information for the 5 trading days ending Feb. 5, 2015. Intervals not calculated for months with sparse trading in near-the-money options contracts.
Forecast
02468
101214161820
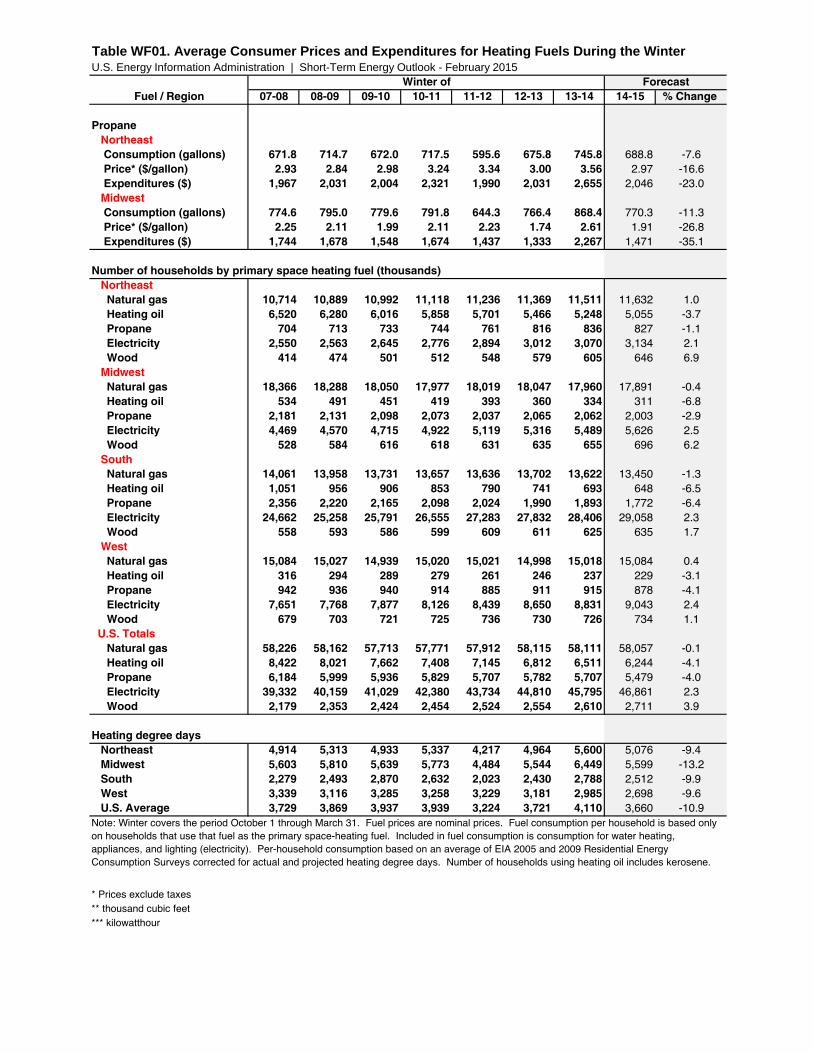
Jan 2011 Jan 2012 Jan 2013 Jan 2014 Jan 2015 Jan 2016
U.S. Natural Gas Pricesdollars per thousand cubic feet
Residential priceHenry Hub spot price
Source: Short-Term Energy Outlook, February 2015.

Forecast
-3-2-10123456
78808284868890929496
2010-Q1 2011-Q1 2012-Q1 2013-Q1 2014-Q1 2015-Q1 2016-Q1
World Liquid Fuels Production andConsumption Balancemillion barrels per day (MMbbl/d)
Implied stock change and balance (right axis)World production (left axis)World consumption (left axis)
Source: Short-Term Energy Outlook, February 2015.
MMbbl/d
0.0
0.5
1.0
1.5
2.0
2.5
3.0
Jan 2012 Jul 2012 Jan 2013 Jul 2013 Jan 2014 Jul 2014 Jan 2015 Jul 2015
Estimated Historical Unplanned OPEC Crude Oil Production Outagesmillion barrels per day
Saudi ArabiaKuwaitIraqNigeriaLibyaIran
Source: Short-Term Energy Outlook, February 2015.
0.0
0.2
0.4
0.6
0.8
1.0
1.2
1.4
Jan 2012 Jan 2013 Jan 2014 Jan 2015
Estimated Historical Unplanned Non-OPEC Liquid Fuels Production Outagesmillion barrels per day Indonesia
Gabon
United States
Mexico
Colombia
Argentina
Australia
Brazil
Canada
North Sea
Yemen
China
Syria
Sudan / S. Sudan
Source: Short-Term Energy Outlook, February 2015.

Forecast
-2-1012345678
7678808284868890929496
2008 2009 2010 2011 2012 2013 2014 2015 2016
World Liquid Fuels Consumptionmillion barrels per day (MMbbl/d)
Change in U.S. consumption (right axis)Change in China consumption (right axis)Change in other consumption (right axis)Total world consumption (left axis)
annual change (MMbbl/d)
Source: Short-Term Energy Outlook, February 2015.
-0.4
-0.2
0.0
0.2
0.4
0.6
0.8
1.0
2014 2015 2016
World Liquid Fuels Consumption Growthmillion barrels per day
OECD* Non-OECD Asia Former Soviet Union Other
Source: Short-Term Energy Outlook, February 2015.
* Countries belonging to the Organization for Economic Cooperation and Development
Forecast
-0.5
0.0
0.5
1.0
1.5
2.0
2014 2015 2016OPEC countries North America Russia and Caspian Sea
Latin America North Sea Other Non-OPEC
World Crude Oil and Liquid Fuels Production Growthmillion barrels per day
Source: Short-Term Energy Outlook, February 2015.
Forecast

-0.50.00.51.01.52.02.53.03.5
Uni
ted
Stat
es
Braz
il
Can
ada
Chi
na
Om
an
Aust
ralia
Mal
aysi
a
Indi
a
Nor
way
Suda
n/S.
Sud
an
Kaza
khst
an
Oth
er N
orth
Sea
Viet
nam
Gab
on
Col
ombi
a
Rus
sia
Syria
Egy
pt
Azer
baija
n
Mex
ico
Uni
ted
King
dom
201620152014
Non-OPEC Crude Oil and Liquid Fuels Production Growthmillion barrels per day
Source: Short-Term Energy Outlook, February 2015.
Forecast
-100
-80
-60
-40
-20
0
20
40
60
80
2012-Q1 2013-Q1 2014-Q1 2015-Q1 2016-Q1-1
0
1
2
3
4
5
6
7
8 World oil consumption growth (left axis)
Non-OPEC production growth (left axis)
Change in WTI price (right axis)
World Consumption and Non-OPEC Production Growthmillion barrels per day dollars per barrel
Source: Short-Term Energy Outlook, February 2015.
0
1
2
3
4
5
6
2004 2005 2006 2007 2008 2009 2010 2011 2012 2013 2014 2015 2016
OPEC surplus crude oil production capacitymillion barrels per day
Source: Short-Term Energy Outlook, February 2015.Note: Shaded area represents 2004-2014 average (2.2 million barrels per day).
Forecast

Forecast
45
50
55
60
65
70
Jan 2010 Jan 2011 Jan 2012 Jan 2013 Jan 2014 Jan 2015 Jan 2016
OECD Commercial Crude Oil Stocksdays of supply
Source: Short-Term Energy Outlook, February 2015.
Note: Colored band around crude oil stocks days of supply represents the range between the minimum and maximum from Jan. 2010 - Dec. 2014.
-0.20.00.20.40.60.81.01.21.41.6
2013 2014 2015 20166789
10111213141516
U.S. Crude Oil and Liquid Fuels Productionmillion barrels per day (MMbbl/d)
Crude oil (right axis) Natural gas plant liquids (right axis)Fuel ethanol (right axis) Biodiesel (right axis)Total production (left axis) Production forecast (left axis)
annual change (MMbbl/d)
Source: Short-Term Energy Outlook, February 2015.
Forecast
275
300
325
350
375
400
425
450
Jan 2010 Jan 2011 Jan 2012 Jan 2013 Jan 2014 Jan 2015 Jan 2016
U.S. Commercial Crude Oil Stocksmillion barrels
Source: Short-Term Energy Outlook, February 2015.
Note: Colored band around storage levels represents the range between the minimum and maximum from Jan. 2010 - Dec. 2014.

-0.30-0.150.000.150.300.450.600.750.90
2013 2014 2015 201616.517.017.518.018.519.019.520.020.5
U.S. Liquid Fuels Product Suppliedmillion barrels per day (MMbbl/d)
Motor gasoline (right axis) Jet fuel (right axis)Distillate fuel (right axis) Other fuels (right axis)Total product supplied (left axis) Product supplied forecast (left axis)
annual change (MMbbl/d)
Source: Short-Term Energy Outlook, February 2015.
Forecast
6080
100120140160180200220240260
Jan 2010 Jan 2011 Jan 2012 Jan 2013 Jan 2014 Jan 2015 Jan 2016
U.S. Gasoline and Distillate Inventoriesmillion barrels
Source: Short-Term Energy Outlook, February 2015.
Note: Colored bands around storage levels represent the range between the minimum and maximum from Jan. 2010 - Dec. 2014.
Total motor gasoline inventory
Total distillate fuel inventory
-3-2-1012345678
2013 2014 2015 20160
102030405060708090
100110
U.S. Natural Gas Consumptionbillion cubic feet per day (Bcf/d)
Electric power (right axis) Residential and comm. (right axis)Industrial (right axis) Other (right axis)Total consumption (left axis) Consumption forecast (left axis)
annual change (Bcf/d)
Source: Short-Term Energy Outlook, February 2015.

-2-10123456789
2013 2014 2015 2016606264666870727476788082
U.S. Natural Gas Production and Importsbillion cubic feet per day (Bcf/d)
Federal Gulf of Mexico production (right axis) U.S. non-Gulf of Mexico production (right axis)U.S. net imports (right axis) Total marketed production (left axis)Marketed production forecast (left axis)
annual change (Bcf/d)
Source: Short-Term Energy Outlook, February 2015.
Forecast
-60%-40%-20%0%20%40%60%80%100%120%
-4,000-3,000-2,000-1,000
01,0002,0003,0004,0005,000
Jan 2011 Jan 2012 Jan 2013 Jan 2014 Jan 2015 Jan 2016
U.S. Working Natural Gas in Storagebillion cubic feet
Deviation from averageStorage level
deviation from average
Source: Short-Term Energy Outlook, February 2015.
Note: Colored band around storage levels represents the range between the minimum and maximum from Jan. 2010 - Dec. 2014.
-20-1001020304050607080
2013 2014 2015 20160
102030405060708090
100
U.S. Coal Consumptionmillion short tons (MMst)
Electric power (right axis) Retail and general industry (right axis)Coke plants (right axis) Total consumption (left axis)Consumption forecast (left axis)
annual change (MMst)
Source: Short-Term Energy Outlook, February 2015.

-40
-20
0
20
40
60
2013 2014 2015 201650
60
70
80
90
100
U.S. Coal Productionmillion short tons (MMst)
Western region (right axis) Appalachian region (right axis)Interior region (right axis) Total production (left axis)Production forecast (left axis)
annual change (MMst)
Source: Short-Term Energy Outlook, February 2015.
Forecast
0255075
100125150175200225250
Jan 2007 Jan 2009 Jan 2011 Jan 2013 Jan 2015
U.S. Electric Power Coal Stocksmillion short tons
Source: Short-Term Energy Outlook, February 2015.
Note: Colored band around stock levels represents the range between the minimum and maximum from Jan. 2007 - Dec. 2014.
-150
-100
-50
0
50
100
150
200
2013 2014 2015 20160
2,000
4,000
6,000
8,000
10,000
12,000
14,000
U.S. Electricity Consumptionmillion kilowatthours per day (kWh/d)
Residential (right axis) Commercial and transportation (right axis)Industrial (right axis) Direct use (right axis)Total consumption (left axis) Consumption forecast (left axis)
annual change (million kWh/d)
Source: Short-Term Energy Outlook, February 2015.

2.6%5.4%
10.3%
2.4%5.7%
2.2%0.3% 1.6% 1.4% 2.0% 3.1%
1.1% 1.8%
-4%
0%
4%
8%
12%
16%
20%
24%
2004 2005 2006 2007 2008 2009 2010 2011 2012 2013 2014 2015 20160
2
4
6
8
10
12
14
U.S. Residential Electricity Pricecents per kilowatthour
Annual growth (right axis) Residential electricity price Price forecast
Source: Short-Term Energy Outlook, February 2015.
21.6% 21.4% 23.3% 23.9% 24.7% 30.3% 27.4% 27.2% 28.4% 28.9%
48.5% 48.2% 44.4% 44.8% 42.3% 37.4% 39.1% 38.9% 37.8% 37.0%
Forecast
0
2,000
4,000
6,000
8,000
10,000
12,000
14,000
2007 2008 2009 2010 2011 2012 2013 2014 2015 2016
U.S. Electricity Generation by Fuel, All Sectorsthousand megawatthours per day
CoalNatural gasPetroleumNuclearHydropowerRenewablesOther sources
Source: Short-Term Energy Outlook, February 2015.
Note: Labels show percentage share of total generation provided by coal and natural gas.
Forecast
0
2
4
6
8
10
12
2007 2008 2009 2010 2011 2012 2013 2014 2015 2016
U.S. Renewable Energy Supplyquadrillion British thermal units (Btu)
SolarGeothermalOther biomassWind powerLiquid biofuelsWood biomassHydropower
Source: Short-Term Energy Outlook, February 2015.
Note: Hydropower excludes pumped storage generation. Liquid biofuels include ethanol and biodiesel. Other biomass includes municipal waste from biogenic sources, landfill gas, and other non-wood waste.

Forecast
0%
2%
4%
6%
8%
10%
12%
1989 1992 1995 1998 2001 2004 2007 2010 2013 2016
U.S. Annual Energy Expendituresshare of gross domestic product
Source: Short-Term Energy Outlook, February 2015.
Forecast
-6%
-4%
-2%
0%
2%
4%
6%
2013 2014 2015 2016
U.S. Energy-Related Carbon Dioxide Emissionsannual growth
All fossil fuels Coal Petroleum Natural gas
Source: Short-Term Energy Outlook, February 2015.
-10%
-5%
0%
5%
10%
15%
20%
25%
30%
35%
70
75
80
85
90
95
100
105
110
115
Jan 2011 Jan 2012 Jan 2013 Jan 2014 Jan 2015 Jan 2016
U.S. Total Industrial Production Indexindex (2007 = 100)
Change from prior year (right axis)Industrial production index (left axis)
Source: Short-Term Energy Outlook, February 2015.
change

-6%
-3%
0%
3%
6%
9%
12%
15%
18%
10,000
10,400
10,800
11,200
11,600
12,000
12,400
12,800
13,200
Jan 2011 Jan 2012 Jan 2013 Jan 2014 Jan 2015 Jan 2016
U.S. Disposable Incomebillion 2009 dollars, seasonally adjusted
Change from prior year (right axis)
Real disposable income (left axis)
Source: Short-Term Energy Outlook, February 2015.
change
0
50
100
150
200
250
300
350
400
April May June July August September
U.S. Summer Cooling Degree Dayspopulation-weighted
2013
2014
2015
2016
Source: Short-Term Energy Outlook, February 2015.
Note: EIA calculations based on from the National Oceanic and Atmospheric Administration data. Horizontal lines indicate each month's prior 10-year average (2005-2014). Projections reflect NOAA's 14-16 month outlook.
0100200300400500600700800900
1000
October November December January February March
U.S. Winter Heating Degree Dayspopulation-weighted
2012/132013/142014/152015/16
Source: Short-Term Energy Outlook, February 2015.
Note: EIA calculations based on National Oceanic and Atmospheric Administration (NOAA) data. Horizontal lines indicate each month's prior 10-year average (Oct 2004 - Mar 2014). Projections reflect NOAA's 14-16 month outlook.

U.S. Census Regions and Divisions
Source: Short-Term Energy Outlook, February 2015.

U.S. Energy Information Administration | Short-Term Energy Outlook - February 2015
07-08 08-09 09-10 10-11 11-12 12-13 13-14 14-15 % Change
Natural Gas Northeast Consumption (Mcf**) 75.2 80.3 75.7 80.7 66.4 76.0 84.1 77.4 -7.9
Price ($/mcf) 15.18 15.83 13.31 12.66 12.21 11.74 11.55 11.33 -1.9
Expenditures ($) 1,141 1,272 1,007 1,022 812 893 971 877 -9.7
Midwest Consumption (Mcf) 78.2 80.7 78.6 80.2 65.4 77.6 88.1 78.3 -11.1
Price ($/mcf) 11.40 11.47 9.44 9.23 8.99 8.36 8.70 8.36 -3.9
Expenditures ($) 892 926 742 740 587 648 766 654 -14.6
South Consumption (Mcf) 44.6 47.3 53.3 49.3 40.9 46.5 52.2 48.0 -8.1
Price ($/mcf) 14.18 14.07 11.52 11.02 11.45 10.71 10.79 10.85 0.6
Expenditures ($) 632 665 613 544 468 498 563 520 -7.5
West Consumption (Mcf) 50.4 47.8 49.9 49.4 49.1 48.6 46.4 43.0 -7.3
Price ($/mcf) 11.31 10.86 9.91 9.67 9.35 9.13 9.96 9.82 -1.4
Expenditures ($) 570 519 494 478 459 444 462 422 -8.6
U.S. Average Consumption (Mcf) 62.5 64.2 64.4 65.0 55.7 62.5 68.0 61.8 -9.1
Price ($/mcf) 12.72 12.87 10.83 10.46 10.25 9.73 9.98 9.80 -1.8
Expenditures ($) 795 826 698 680 571 608 679 606 -10.8
Heating Oil U.S. Average Consumption (gallons) 537.9 576.7 544.8 580.7 471.2 545.5 607.7 555.1 -8.7
Price ($/gallon) 3.33 2.65 2.85 3.38 3.73 3.87 3.88 2.96 -23.5
Expenditures ($) 1,790 1,530 1,552 1,966 1,757 2,113 2,355 1,645 -30.2
Electricity Northeast Consumption (kWh***) 6,835 7,063 6,847 7,076 6,436 6,862 7,224 6,924 -4.2
Price ($/kwh) 0.145 0.152 0.152 0.154 0.154 0.152 0.163 0.167 2.1
Expenditures ($) 988 1,071 1,040 1,091 993 1,046 1,179 1,154 -2.1
Midwest Consumption (kWh) 8,631 8,751 8,660 8,733 7,897 8,588 9,167 8,613 -6.1
Price ($/kwh) 0.090 0.097 0.099 0.105 0.111 0.111 0.112 0.118 5.2
Expenditures ($) 774 851 856 914 875 955 1,024 1,012 -1.2
South Consumption (kWh) 7,778 8,057 8,486 8,224 7,470 7,978 8,387 8,063 -3.9
Price ($/kwh) 0.098 0.109 0.103 0.104 0.107 0.107 0.109 0.111 2.2
Expenditures ($) 765 878 874 856 798 851 912 896 -1.8
West Consumption (kWh) 7,288 7,084 7,239 7,216 7,190 7,152 6,982 6,726 -3.7
Price ($/kwh) 0.104 0.107 0.110 0.112 0.115 0.119 0.124 0.126 1.7
Expenditures ($) 756 755 800 809 825 852 863 845 -2.0
U.S. Average Consumption (kWh) 7,585 7,725 7,937 7,844 7,253 7,673 7,987 7,642 -4.3
Price ($/kwh) 0.104 0.112 0.110 0.113 0.116 0.117 0.120 0.123 2.8
Expenditures ($) 789 866 873 884 843 895 955 939 -1.6
Table WF01. Average Consumer Prices and Expenditures for Heating Fuels During the Winter
Fuel / RegionForecastWinter of
U.S. Energy Information Administration | Short-Term Energy Outlook - February 2015
07-08 08-09 09-10 10-11 11-12 12-13 13-14 14-15 % Change
Table WF01. Average Consumer Prices and Expenditures for Heating Fuels During the Winter
Fuel / RegionForecastWinter of
Propane Northeast Consumption (gallons) 671.8 714.7 672.0 717.5 595.6 675.8 745.8 688.8 -7.6
Price* ($/gallon) 2.93 2.84 2.98 3.24 3.34 3.00 3.56 2.97 -16.6
Expenditures ($) 1,967 2,031 2,004 2,321 1,990 2,031 2,655 2,046 -23.0
Midwest Consumption (gallons) 774.6 795.0 779.6 791.8 644.3 766.4 868.4 770.3 -11.3
Price* ($/gallon) 2.25 2.11 1.99 2.11 2.23 1.74 2.61 1.91 -26.8
Expenditures ($) 1,744 1,678 1,548 1,674 1,437 1,333 2,267 1,471 -35.1
Number of households by primary space heating fuel (thousands) Northeast Natural gas 10,714 10,889 10,992 11,118 11,236 11,369 11,511 11,632 1.0
Heating oil 6,520 6,280 6,016 5,858 5,701 5,466 5,248 5,055 -3.7
Propane 704 713 733 744 761 816 836 827 -1.1
Electricity 2,550 2,563 2,645 2,776 2,894 3,012 3,070 3,134 2.1
Wood 414 474 501 512 548 579 605 646 6.9
Midwest Natural gas 18,366 18,288 18,050 17,977 18,019 18,047 17,960 17,891 -0.4
Heating oil 534 491 451 419 393 360 334 311 -6.8
Propane 2,181 2,131 2,098 2,073 2,037 2,065 2,062 2,003 -2.9
Electricity 4,469 4,570 4,715 4,922 5,119 5,316 5,489 5,626 2.5
Wood 528 584 616 618 631 635 655 696 6.2
South Natural gas 14,061 13,958 13,731 13,657 13,636 13,702 13,622 13,450 -1.3
Heating oil 1,051 956 906 853 790 741 693 648 -6.5
Propane 2,356 2,220 2,165 2,098 2,024 1,990 1,893 1,772 -6.4
Electricity 24,662 25,258 25,791 26,555 27,283 27,832 28,406 29,058 2.3
Wood 558 593 586 599 609 611 625 635 1.7
West Natural gas 15,084 15,027 14,939 15,020 15,021 14,998 15,018 15,084 0.4
Heating oil 316 294 289 279 261 246 237 229 -3.1
Propane 942 936 940 914 885 911 915 878 -4.1
Electricity 7,651 7,768 7,877 8,126 8,439 8,650 8,831 9,043 2.4
Wood 679 703 721 725 736 730 726 734 1.1
U.S. Totals Natural gas 58,226 58,162 57,713 57,771 57,912 58,115 58,111 58,057 -0.1
Heating oil 8,422 8,021 7,662 7,408 7,145 6,812 6,511 6,244 -4.1
Propane 6,184 5,999 5,936 5,829 5,707 5,782 5,707 5,479 -4.0
Electricity 39,332 40,159 41,029 42,380 43,734 44,810 45,795 46,861 2.3
Wood 2,179 2,353 2,424 2,454 2,524 2,554 2,610 2,711 3.9
Heating degree days Northeast 4,914 5,313 4,933 5,337 4,217 4,964 5,600 5,076 -9.4
Midwest 5,603 5,810 5,639 5,773 4,484 5,544 6,449 5,599 -13.2
South 2,279 2,493 2,870 2,632 2,023 2,430 2,788 2,512 -9.9
West 3,339 3,116 3,285 3,258 3,229 3,181 2,985 2,698 -9.6
U.S. Average 3,729 3,869 3,937 3,939 3,224 3,721 4,110 3,660 -10.9
*** kilowatthour
* Prices exclude taxes
** thousand cubic feet
Note: Winter covers the period October 1 through March 31. Fuel prices are nominal prices. Fuel consumption per household is based only
on households that use that fuel as the primary space-heating fuel. Included in fuel consumption is consumption for water heating,
appliances, and lighting (electricity). Per-household consumption based on an average of EIA 2005 and 2009 Residential Energy
Consumption Surveys corrected for actual and projected heating degree days. Number of households using heating oil includes kerosene.

1st 2nd 3rd 4th 1st 2nd 3rd 4th 1st 2nd 3rd 4th 2014 2015 2016Energy Supply
Crude Oil Production (a)(million barrels per day) ......................... 8.09 8.58 8.78 9.05 9.26 9.41 9.23 9.32 9.36 9.47 9.48 9.78 8.63 9.30 9.52
Dry Natural Gas Production(billion cubic feet per day) ..................... 67.72 69.21 71.18 72.51 72.61 72.71 72.78 73.12 73.85 74.16 74.43 75.08 70.17 72.80 74.38
Coal Production(million short tons) ................................ 245 246 255 250 244 233 246 244 248 226 246 241 997 966 960
Energy Consumption
Liquid Fuels(million barrels per day) ......................... 18.81 18.71 19.16 19.38 19.11 19.18 19.45 19.48 19.19 19.31 19.58 19.55 19.02 19.31 19.41
Natural Gas(billion cubic feet per day) ..................... 95.16 61.08 61.61 75.68 92.31 63.27 64.56 77.50 92.22 64.28 65.84 78.71 73.30 74.34 75.25
Coal (b)(million short tons) ................................ 249 213 247 211 228 207 250 221 232 204 248 218 920 905 901
Electricity(billion kilowatt hours per day) ............... 10.91 10.03 11.45 9.97 10.69 10.14 11.74 10.11 10.80 10.25 11.83 10.22 10.59 10.67 10.78
Renewables (c)(quadrillion Btu) ..................................... 2.35 2.56 2.27 2.37 2.42 2.63 2.41 2.41 2.49 2.69 2.44 2.47 9.55 9.87 10.09
Total Energy Consumption (d)(quadrillion Btu) ..................................... 26.57 22.99 23.76 24.43 25.80 23.10 24.27 24.73 26.15 23.27 24.45 24.89 97.75 97.90 98.76
Energy Prices
Crude Oil (e)(dollars per barrel) ................................. 97.56 101.02 96.43 72.89 46.73 50.84 55.96 62.55 66.99 71.00 71.68 70.34 91.88 54.12 70.05
Natural Gas Henry Hub Spot(dollars per million Btu) .......................... 5.21 4.61 3.96 3.80 2.89 2.91 3.12 3.30 3.44 3.26 3.52 3.65 4.39 3.05 3.47
Coal(dollars per million Btu) .......................... 2.33 2.39 2.37 2.30 2.33 2.34 2.33 2.31 2.34 2.36 2.36 2.32 2.35 2.33 2.34
Macroeconomic
Real Gross Domestic Product(billion chained 2009 dollars - SAAR) ..... 15,832 16,010 16,206 16,307 16,439 16,542 16,647 16,734 16,825 16,940 17,066 17,202 16,089 16,590 17,008
Percent change from prior year .............. 1.9 2.6 2.7 2.5 3.8 3.3 2.7 2.6 2.3 2.4 2.5 2.8 2.4 3.1 2.5
GDP Implicit Price Deflator(Index, 2009=100) ................................. 107.7 108.3 108.6 109.1 109.5 110.1 110.6 111.2 111.9 112.4 112.8 113.3 108.4 110.4 112.6
Percent change from prior year .............. 1.4 1.7 1.6 1.6 1.7 1.7 1.8 1.9 2.2 2.0 2.0 1.9 1.6 1.8 2.0
Real Disposable Personal Income(billion chained 2009 dollars - SAAR) ..... 11,810 11,900 11,960 12,063 12,247 12,302 12,362 12,412 12,492 12,582 12,701 12,824 11,933 12,331 12,650
Percent change from prior year .............. 2.4 2.2 2.2 3.0 3.7 3.4 3.4 2.9 2.0 2.3 2.7 3.3 2.4 3.3 2.6
Manufacturing Production Index(Index, 2007=100) ................................. 99.4 101.2 102.4 103.8 104.8 105.8 106.6 107.5 108.2 109.0 110.1 111.3 101.7 106.2 109.6
Percent change from prior year .............. 2.4 3.8 4.6 4.8 5.4 4.6 4.2 3.6 3.3 3.1 3.2 3.5 3.9 4.4 3.3
Weather
U.S. Heating Degree-Days .................... 2,451 480 80 1,536 2,124 472 75 1,537 2,118 477 74 1,535 4,548 4,208 4,204
U.S. Cooling Degree-Days .................... 34 393 774 96 36 390 845 93 41 392 846 94 1,298 1,364 1,374
Table 1. U.S. Energy Markets Summary U.S. Energy Information Administration | Short-Term Energy Outlook - February 2015
2014 2015 2016 Year
Petroleum Supply Annual , DOE/EIA-0340/2; Weekly Petroleum Status Report , DOE/EIA-0208; Petroleum Marketing Monthly , DOE/EIA-0380; Natural Gas Monthly , DOE/EIA-0130;
- = no data availablePrices are not adjusted for inflation.(a) Includes lease condensate.(b) Total consumption includes Independent Power Producer (IPP) consumption.(c) Renewable energy includes minor components of non-marketed renewable energy that is neither bought nor sold, either directly or indirectly, as inputs to marketed energy.EIA does not estimate or project end-use consumption of non-marketed renewable energy.(d) The conversion from physical units to Btu is calculated using a subset of conversion factors used in the calculations of gross energy consumption in EIA’s Monthly Energy Review Consequently, the historical data may not precisely match those published in the MER or the Annual Energy Review (AER).(e) Refers to the refiner average acquisition cost (RAC) of crude oil.Notes: The approximate break between historical and forecast values is shown with historical data printed in bold; estimates and forecasts in italics.Historical data: Latest data available from Energy Information Administration databases supporting the following reports: Petroleum Supply Monthly , DOE/EIA-0109;
Electric Power Monthly , DOE/EIA-0226; Quarterly Coal Report , DOE/EIA-0121; and International Petroleum Monthly , DOE/EIA-0520.Minor discrepancies with published historical data are due to independent rounding. Projections: EIA Regional Short-Term Energy Model. Macroeconomic projections are based on Global Insight Model of the U.S. Economy. Weather projections from National Oceanic and Atmospheric Administration.

1st 2nd 3rd 4th 1st 2nd 3rd 4th 1st 2nd 3rd 4th 2014 2015 2016Crude Oil (dollars per barrel) West Texas Intermediate Spot Average ........................... 98.75 103.35 97.78 73.16 47.74 51.83 57.00 63.50 68.00 72.00 72.67 71.33 93.26 55.02 71.00
Brent Spot Average .......................................................... 108.17 109.70 101.82 76.40 49.25 54.00 60.00 67.00 72.00 76.00 76.67 75.33 99.02 57.56 75.00
Imported Average ............................................................. 94.10 98.59 93.82 70.73 44.21 48.30 53.49 60.01 64.47 68.48 69.18 67.83 89.39 51.57 67.53
Refiner Average Acquisition Cost .................................... 97.56 101.02 96.43 72.89 46.73 50.84 55.96 62.55 66.99 71.00 71.68 70.34 91.88 54.12 70.05
Liquid Fuels (cents per gallon) Refiner Prices for Resale Gasoline ........................................................................ 272 298 276 202 141 165 173 171 190 216 213 189 262 163 202
Diesel Fuel .................................................................... 303 300 288 240 167 177 188 207 220 232 232 229 283 185 228
Heating Oil .................................................................... 303 289 276 219 167 163 174 202 214 216 218 225 269 178 218
Refiner Prices to End Users Jet Fuel ......................................................................... 297 295 289 230 163 171 181 200 215 226 226 223 277 179 223
No. 6 Residual Fuel Oil (a) ............................................ 249 244 243 195 131 128 141 156 165 171 176 173 231 139 171
Retail Prices Including Taxes Gasoline Regular Grade (b) .......................................... 340 368 350 288 213 234 242 242 258 286 284 262 336 233 273
Gasoline All Grades (b) ................................................. 348 375 358 296 222 243 251 251 266 295 293 271 344 242 281
On-highway Diesel Fuel ................................................ 396 394 384 358 287 271 278 298 313 328 327 325 383 283 324
Heating Oil .................................................................... 397 382 369 331 274 256 260 285 301 304 301 308 373 274 303
Natural Gas Henry Hub Spot (dollars per thousand cubic feet) .......... 5.36 4.75 4.08 3.91 2.98 3.00 3.21 3.40 3.54 3.35 3.63 3.76 4.52 3.15 3.57
Henry Hub Spot (dollars per Million Btu) ......................... 5.21 4.61 3.96 3.80 2.89 2.91 3.12 3.30 3.44 3.26 3.52 3.65 4.39 3.05 3.47
End-Use Prices (dollars per thousand cubic feet) Industrial Sector ............................................................ 6.17 5.62 5.06 4.98 4.35 3.79 4.02 4.41 4.73 4.21 4.47 4.85 5.48 4.16 4.58
Commercial Sector ....................................................... 8.66 9.64 9.69 8.39 8.24 8.24 8.84 8.34 8.54 8.77 9.39 8.92 8.84 8.34 8.78
Residential Sector ......................................................... 9.82 13.11 16.92 10.39 9.15 11.58 15.75 10.23 9.34 11.99 16.27 10.57 10.91 10.28 10.56
Electricity Power Generation Fuel Costs (dollars per million Btu) Coal ............................................................................... 2.33 2.39 2.37 2.30 2.33 2.34 2.33 2.31 2.34 2.36 2.36 2.32 2.35 2.33 2.34
Natural Gas .................................................................. 6.82 4.93 4.25 4.37 3.90 3.67 3.86 4.26 4.38 3.97 4.21 4.57 5.00 3.91 4.27
Residual Fuel Oil (c) ...................................................... 19.95 20.44 19.75 16.19 12.45 10.74 10.56 10.98 11.41 12.39 12.96 13.05 19.38 11.24 12.44
Distillate Fuel Oil ........................................................... 23.39 22.74 21.88 18.49 14.87 14.88 15.54 17.54 18.37 18.86 18.98 19.60 22.28 15.70 18.91
End-Use Prices (cents per kilowatthour) Industrial Sector ............................................................ 7.02 6.94 7.36 6.77 6.61 6.80 7.28 6.70 6.69 6.90 7.41 6.81 7.03 6.86 6.96
Commercial Sector ....................................................... 10.57 10.63 11.11 10.60 10.38 10.69 11.16 10.62 10.55 10.87 11.36 10.82 10.74 10.73 10.92
Residential Sector ......................................................... 11.90 12.73 13.00 12.35 12.23 12.79 13.05 12.41 12.37 13.01 13.33 12.67 12.49 12.63 12.85
(c) Includes fuel oils No. 4, No. 5, No. 6, and topped crude.
Table 2. U.S. Energy PricesU.S. Energy Information Administration | Short-Term Energy Outlook - February 2015
2014 2015 2016 Year
- = no data availablePrices are not adjusted for inflation.(a) Average for all sulfur contents.(b) Average self-service cash price.
Projections: EIA Regional Short-Term Energy Model.
Notes: The approximate break between historical and forecast values is shown with historical data printed in bold; estimates and forecasts in italics.Prices exclude taxes unless otherwise noted.Historical data: Latest data available from Energy Information Administration databases supporting the following reports: Petroleum Marketing Monthly , DOE/EIA-0380;Weekly Petroleum Status Report , DOE/EIA-0208; Natural Gas Monthly , DOE/EIA-0130; Electric Power Monthly , DOE/EIA-0226; and Monthly Energy Review , DOE/EIA-0035.WTI and Brent crude oils, and Henry Hub natural gas spot prices from Reuter's News Service (http://www.reuters.com).Minor discrepancies with published historical data are due to independent rounding.

1st 2nd 3rd 4th 1st 2nd 3rd 4th 1st 2nd 3rd 4th 2014 2015 2016Supply (million barrels per day) (a) OECD ................................................. 24.98 25.37 25.62 26.07 25.99 26.11 26.15 26.53 26.19 26.49 26.86 27.29 25.51 26.20 26.71
U.S. (50 States) ............................... 13.08 13.88 14.24 14.52 14.63 14.88 14.86 14.96 14.91 15.24 15.43 15.80 13.94 14.83 15.35
Canada ............................................ 4.43 4.28 4.33 4.52 4.31 4.30 4.45 4.69 4.49 4.54 4.75 4.82 4.39 4.44 4.65
Mexico ............................................. 2.88 2.86 2.78 2.74 2.80 2.77 2.74 2.72 2.67 2.65 2.62 2.60 2.81 2.76 2.63
North Sea (b) ................................... 3.05 2.80 2.71 2.71 2.69 2.59 2.51 2.60 2.55 2.48 2.45 2.48 2.81 2.60 2.49
Other OECD .................................... 1.54 1.55 1.57 1.58 1.57 1.57 1.59 1.57 1.57 1.58 1.60 1.58 1.56 1.57 1.58
Non-OECD ......................................... 66.74 67.02 67.89 68.04 66.92 67.67 68.13 67.52 66.71 67.47 68.05 67.87 67.43 67.56 67.53
OPEC .............................................. 36.37 36.10 36.70 36.79 36.44 36.57 36.66 36.29 36.05 36.14 36.23 36.32 36.49 36.49 36.18
Crude Oil Portion .......................... 30.01 29.72 30.32 30.36 30.05 30.15 30.20 29.81 29.61 29.67 29.73 29.79 30.10 30.05 29.70
Other Liquids ................................ 6.36 6.37 6.38 6.43 6.40 6.42 6.45 6.48 6.44 6.47 6.50 6.53 6.39 6.44 6.48
Eurasia ............................................ 13.90 13.84 13.85 13.93 13.83 13.79 13.81 13.78 13.74 13.72 13.75 13.75 13.88 13.80 13.74
China ............................................... 4.46 4.49 4.42 4.56 4.48 4.51 4.52 4.52 4.52 4.55 4.56 4.56 4.48 4.51 4.55
Other Non-OECD ............................ 12.01 12.60 12.93 12.76 12.18 12.80 13.15 12.93 12.41 13.06 13.52 13.24 12.58 12.77 13.06
Total World Supply ............................. 91.71 92.39 93.51 94.11 92.92 93.77 94.28 94.05 92.91 93.95 94.91 95.16 92.94 93.76 94.24
Non-OPEC Supply .............................. 55.34 56.30 56.81 57.32 56.48 57.20 57.62 57.76 56.86 57.82 58.68 58.84 56.45 57.27 58.05
Consumption (million barrels per day) (c) OECD ................................................. 45.73 44.75 45.81 46.70 46.30 45.11 45.92 46.50 46.18 45.07 45.86 46.37 45.75 45.96 45.87
U.S. (50 States) ............................... 18.81 18.71 19.16 19.38 19.11 19.18 19.45 19.48 19.19 19.31 19.58 19.55 19.02 19.31 19.41
U.S. Territories ................................ 0.34 0.34 0.34 0.34 0.36 0.36 0.36 0.36 0.39 0.39 0.39 0.39 0.34 0.36 0.39
Canada ............................................ 2.43 2.35 2.45 2.37 2.38 2.32 2.43 2.41 2.38 2.32 2.43 2.41 2.40 2.38 2.38
Europe ............................................. 12.99 13.37 13.87 13.56 13.33 13.06 13.50 13.46 13.22 12.96 13.40 13.35 13.45 13.34 13.24
Japan ............................................... 5.02 3.87 3.88 4.54 4.69 3.95 3.98 4.35 4.55 3.82 3.85 4.22 4.32 4.24 4.11
Other OECD .................................... 6.14 6.11 6.11 6.51 6.43 6.25 6.19 6.43 6.45 6.26 6.21 6.45 6.22 6.32 6.34
Non-OECD ......................................... 45.32 46.65 47.04 46.50 45.96 47.54 47.90 47.32 47.02 48.65 49.01 48.41 46.38 47.19 48.28
Eurasia ............................................ 4.82 4.76 4.98 4.96 4.61 4.55 4.82 4.80 4.53 4.47 4.73 4.71 4.88 4.70 4.61
Europe ............................................. 0.71 0.71 0.74 0.73 0.72 0.72 0.74 0.74 0.73 0.73 0.75 0.75 0.72 0.73 0.74
China ............................................... 10.28 10.85 10.80 10.76 10.60 11.18 11.13 11.09 10.93 11.53 11.48 11.43 10.67 11.00 11.34
Other Asia ........................................ 11.65 11.87 11.43 11.74 11.86 12.08 11.63 11.95 12.19 12.41 11.95 12.27 11.67 11.88 12.20
Other Non-OECD ............................ 17.86 18.46 19.11 18.31 18.17 19.01 19.57 18.75 18.65 19.52 20.11 19.25 18.44 18.88 19.38
Total World Consumption ................... 91.05 91.40 92.85 93.19 92.27 92.65 93.81 93.82 93.20 93.72 94.88 94.78 92.13 93.14 94.15
Inventory Net Withdrawals (million barrels per day) U.S. (50 States) .................................. 0.09 -0.67 -0.23 -0.11 -0.11 -0.32 -0.08 0.42 0.09 -0.37 -0.11 0.48 -0.23 -0.02 0.02
Other OECD ....................................... -0.30 -0.03 -0.49 -0.30 -0.20 -0.28 -0.14 -0.24 0.08 0.05 0.03 -0.30 -0.28 -0.21 -0.04
Other Stock Draws and Balance ........ -0.46 -0.30 0.06 -0.50 -0.34 -0.52 -0.25 -0.41 0.13 0.09 0.05 -0.55 -0.30 -0.38 -0.07
Total Stock Draw ............................. -0.67 -0.99 -0.66 -0.91 -0.65 -1.12 -0.47 -0.23 0.30 -0.23 -0.03 -0.37 -0.81 -0.62 -0.09
End-of-period Inventories (million barrels) U.S. Commercial Inventory ................ 1,057 1,123 1,144 1,154 1,164 1,193 1,201 1,162 1,154 1,187 1,198 1,154 1,154 1,162 1,154
OECD Commercial Inventory ............. 2,569 2,637 2,703 2,741 2,768 2,823 2,843 2,827 2,811 2,841 2,848 2,832 2,741 2,827 2,832
(a) Supply includes production of crude oil (including lease condensates), natural gas plant liquids, biofuels, other liquids, and refinery processing gains.
Table 3a. International Petroleum and Other Liquids Production, Consumption, and InventoriesU.S. Energy Information Administration | Short-Term Energy Outlook - February 2015
2014 2015 2016 Year
- = no data availableOECD = Organization for Economic Cooperation and Development: Australia, Austria, Belgium, Canada, Chile, the Czech Republic, Denmark, Estonia, Finland, France, Germany, Greece, Hungary, Iceland, Ireland, Israel, Italy, Japan, Luxembourg, Mexico, the Netherlands, New Zealand, Norway, Poland, Portugal, Slovakia, Slovenia, South Korea, Spain, Sweden, Switzerland, Turkey, the United Kingdom, and the United States.OPEC = Organization of Petroleum Exporting Countries: Algeria, Angola, Ecuador, Iran, Iraq, Kuwait, Libya, Nigeria, Qatar, Saudi Arabia, the United Arab Emirates, Venezuela.
Projections: EIA Regional Short-Term Energy Model.
(b) Includes offshore supply from Denmark, Germany, the Netherlands, Norway, and the United Kingdom.(c) Consumption of petroleum by the OECD countries is synonymous with "petroleum product supplied," defined in the glossary of the EIA Petroleum Supply Monthly , DOE/EIA-0109. Consumption of petroleum by the non-OECD countries is "apparent consumption," which includes internal consumption, refinery fuel and loss, and bunkering.Notes: The approximate break between historical and forecast values is shown with historical data printed in bold; estimates and forecasts in italics.Historical data: Latest data available from Energy Information Administration international energy statistics.Minor discrepancies with published historical data are due to independent rounding.

1st 2nd 3rd 4th 1st 2nd 3rd 4th 1st 2nd 3rd 4th 2014 2015 2016
North America ..................................................... 20.39 21.02 21.35 21.78 21.74 21.95 22.05 22.36 22.07 22.43 22.80 23.22 21.14 22.03 22.63
Canada .................................................................. 4.43 4.28 4.33 4.52 4.31 4.30 4.45 4.69 4.49 4.54 4.75 4.82 4.39 4.44 4.65
Mexico ................................................................... 2.88 2.86 2.78 2.74 2.80 2.77 2.74 2.72 2.67 2.65 2.62 2.60 2.81 2.76 2.63
United States ......................................................... 13.08 13.88 14.24 14.52 14.63 14.88 14.86 14.96 14.91 15.24 15.43 15.80 13.94 14.83 15.35
Central and South America ............................... 4.54 5.17 5.56 5.34 4.75 5.38 5.73 5.49 4.96 5.62 6.00 5.73 5.16 5.34 5.58
Argentina ............................................................... 0.70 0.71 0.73 0.72 0.71 0.72 0.74 0.73 0.71 0.73 0.75 0.74 0.71 0.72 0.73
Brazil ..................................................................... 2.34 2.98 3.32 3.11 2.53 3.17 3.47 3.24 2.72 3.40 3.74 3.47 2.94 3.11 3.33
Colombia ............................................................... 1.03 0.99 1.02 1.03 1.02 0.99 1.01 1.03 1.02 0.98 1.01 1.02 1.02 1.01 1.01
Other Central and S. America ................................ 0.48 0.49 0.49 0.49 0.49 0.50 0.50 0.50 0.50 0.51 0.51 0.50 0.49 0.50 0.50
Europe ................................................................. 4.03 3.79 3.69 3.70 3.67 3.56 3.48 3.57 3.51 3.44 3.42 3.45 3.80 3.57 3.46
Norway .................................................................. 1.94 1.78 1.86 1.77 1.82 1.79 1.77 1.85 1.82 1.80 1.82 1.83 1.84 1.81 1.82
United Kingdom (offshore) ..................................... 0.93 0.85 0.66 0.73 0.67 0.62 0.57 0.58 0.56 0.51 0.46 0.46 0.79 0.61 0.50
Other North Sea .................................................... 0.18 0.17 0.19 0.21 0.20 0.18 0.17 0.17 0.18 0.18 0.17 0.18 0.19 0.18 0.18
Eurasia ................................................................. 13.91 13.85 13.86 13.95 13.84 13.80 13.82 13.79 13.75 13.73 13.76 13.76 13.89 13.81 13.75
Azerbaijan .............................................................. 0.85 0.86 0.87 0.82 0.78 0.77 0.75 0.74 0.73 0.73 0.73 0.73 0.85 0.76 0.73
Kazakhstan ............................................................ 1.73 1.66 1.71 1.70 1.66 1.66 1.66 1.66 1.66 1.65 1.65 1.67 1.70 1.66 1.66
Russia ................................................................... 10.86 10.83 10.79 10.93 10.88 10.86 10.91 10.89 10.86 10.84 10.88 10.86 10.85 10.89 10.86
Turkmenistan ......................................................... 0.27 0.28 0.28 0.27 0.29 0.29 0.29 0.29 0.29 0.29 0.29 0.29 0.28 0.29 0.29
Other Eurasia ........................................................ 0.20 0.21 0.21 0.22 0.23 0.21 0.21 0.21 0.21 0.21 0.21 0.21 0.21 0.22 0.21
Middle East ......................................................... 1.20 1.20 1.20 1.18 1.18 1.18 1.18 1.18 1.20 1.19 1.25 1.24 1.19 1.18 1.22
Oman .................................................................... 0.96 0.96 0.96 0.95 0.96 0.96 0.97 0.97 0.97 0.98 1.03 1.03 0.96 0.97 1.00
Syria ...................................................................... 0.03 0.03 0.03 0.03 0.03 0.03 0.03 0.03 0.03 0.03 0.03 0.03 0.03 0.03 0.03
Yemen ................................................................... 0.14 0.13 0.14 0.13 0.12 0.11 0.11 0.11 0.12 0.11 0.11 0.11 0.13 0.11 0.11
Asia and Oceania ............................................... 8.96 8.98 8.87 9.08 9.08 9.13 9.16 9.14 9.19 9.21 9.23 9.20 8.97 9.13 9.21
Australia ................................................................ 0.45 0.46 0.48 0.48 0.47 0.48 0.50 0.47 0.49 0.49 0.51 0.49 0.47 0.48 0.49
China ..................................................................... 4.46 4.49 4.42 4.56 4.48 4.51 4.52 4.52 4.52 4.55 4.56 4.56 4.48 4.51 4.55
India ...................................................................... 0.98 0.98 0.96 0.98 0.98 1.00 1.00 1.00 1.00 1.00 1.00 1.00 0.98 0.99 1.00
Indonesia ............................................................... 0.92 0.91 0.92 0.92 0.94 0.94 0.93 0.94 0.93 0.93 0.92 0.92 0.92 0.94 0.93
Malaysia ................................................................ 0.69 0.69 0.66 0.69 0.71 0.70 0.71 0.70 0.72 0.71 0.71 0.70 0.68 0.70 0.71
Vietnam ................................................................. 0.33 0.32 0.31 0.31 0.34 0.34 0.34 0.34 0.34 0.34 0.34 0.34 0.32 0.34 0.34
Africa ................................................................... 2.31 2.30 2.29 2.29 2.22 2.21 2.20 2.21 2.19 2.19 2.22 2.23 2.29 2.21 2.21
Egypt ..................................................................... 0.67 0.67 0.66 0.65 0.64 0.63 0.62 0.61 0.61 0.60 0.59 0.58 0.66 0.63 0.60
Equatorial Guinea .................................................. 0.27 0.27 0.27 0.27 0.24 0.24 0.24 0.24 0.21 0.21 0.21 0.21 0.27 0.24 0.21
Gabon ................................................................... 0.24 0.24 0.24 0.24 0.24 0.24 0.23 0.23 0.22 0.22 0.22 0.22 0.24 0.24 0.22
Sudan .................................................................... 0.26 0.26 0.26 0.26 0.25 0.25 0.25 0.25 0.25 0.25 0.25 0.25 0.26 0.25 0.25
Total non-OPEC liquids ....................................... 55.34 56.30 56.81 57.32 56.48 57.20 57.62 57.76 56.86 57.82 58.68 58.84 56.45 57.27 58.05
OPEC non-crude liquids .................................... 6.36 6.37 6.38 6.43 6.40 6.42 6.45 6.48 6.44 6.47 6.50 6.53 6.39 6.44 6.48
Non-OPEC + OPEC non-crude .......................... 61.71 62.67 63.19 63.75 62.87 63.63 64.08 64.24 63.30 64.28 65.18 65.36 62.84 63.71 64.53
Unplanned non-OPEC Production Outages ....... 0.66 0.67 0.60 0.57 n/a n/a n/a n/a n/a n/a n/a n/a 0.62 n/a n/a
Table 3b. Non-OPEC Petroleum and Other Liquids Supply (million barrels per day)U.S. Energy Information Administration | Short-Term Energy Outlook - February 2015
2014 2015 2016 Year
Historical data: Latest data available from Energy Information Administration international energy statistics.Minor discrepancies with published historical data are due to independent rounding. Projections: EIA Regional Short-Term Energy Model.
- = no data availableSudan production represents total production from both north and south.OPEC = Organization of Petroleum Exporting Countries: Algeria, Angola, Ecuador, Iran, Iraq, Kuwait, Libya, Nigeria, Qatar, Saudi Arabia, the United Arab Emirates, Venezuela.Notes: The approximate break between historical and forecast values is shown with historical data printed in bold; estimates and forecasts in italics.Supply includes production of crude oil (including lease condensates), natural gas plant liquids, biofuels, other liquids, and refinery processing gains.Not all countries are shown in each region and sum of reported country volumes may not equal regional volumes.

1st 2nd 3rd 4th 1st 2nd 3rd 4th 1st 2nd 3rd 4th 2014 2015 2016Crude Oil Algeria ........................................................... 1.15 1.15 1.15 1.15 - - - - - - - - 1.15 - -
Angola ........................................................... 1.63 1.63 1.72 1.73 - - - - - - - - 1.68 - -
Ecudaor ......................................................... 0.55 0.56 0.56 0.56 - - - - - - - - 0.56 - -
Iran ................................................................ 2.80 2.80 2.80 2.80 - - - - - - - - 2.80 - -
Iraq ................................................................ 3.26 3.29 3.28 3.53 - - - - - - - - 3.34 - -
Kuwait ........................................................... 2.60 2.60 2.60 2.48 - - - - - - - - 2.57 - -
Libya .............................................................. 0.38 0.23 0.58 0.69 - - - - - - - - 0.47 - -
Nigeria ........................................................... 2.00 1.97 2.07 1.98 - - - - - - - - 2.00 - -
Qatar ............................................................. 0.74 0.75 0.76 0.71 - - - - - - - - 0.74 - -
Saudi Arabia .................................................. 9.80 9.65 9.70 9.63 - - - - - - - - 9.70 - -
United Arab Emirates .................................... 2.70 2.70 2.70 2.70 - - - - - - - - 2.70 - -
Venezuela ..................................................... 2.40 2.40 2.40 2.40 - - - - - - - - 2.40 - -
OPEC Total ................................................ 30.01 29.72 30.32 30.36 30.05 30.15 30.20 29.81 29.61 29.67 29.73 29.79 30.10 30.05 29.70
Other Liquids .................................................. 6.36 6.37 6.38 6.43 6.40 6.42 6.45 6.48 6.44 6.47 6.50 6.53 6.39 6.44 6.48
Total OPEC Supply ........................................ 36.37 36.10 36.70 36.79 36.44 36.57 36.66 36.29 36.05 36.14 36.23 36.32 36.49 36.49 36.18
Crude Oil Production Capacity Africa ............................................................. 5.15 4.96 5.50 5.54 5.16 5.15 5.23 5.33 5.37 5.38 5.40 5.41 5.29 5.22 5.39
South America ............................................... 2.95 2.95 2.95 2.95 2.96 2.96 2.96 2.96 2.87 2.88 2.87 2.88 2.95 2.96 2.87
Middle East ................................................... 23.93 23.88 23.87 23.96 24.06 24.16 24.21 24.11 24.09 24.14 24.19 24.23 23.91 24.14 24.16
OPEC Total ................................................ 32.02 31.80 32.32 32.44 32.18 32.28 32.40 32.40 32.33 32.40 32.46 32.52 32.15 32.32 32.43
Surplus Crude Oil Production Capacity Africa ............................................................. 0.00 0.00 0.00 0.00 0.00 0.00 0.00 0.00 0.00 0.00 0.00 0.00 0.00 0.00 0.00
South America ............................................... 0.00 0.00 0.00 0.00 0.00 0.00 0.00 0.00 0.00 0.00 0.00 0.00 0.00 0.00 0.00
Middle East ................................................... 2.01 2.07 2.00 2.08 2.14 2.13 2.20 2.58 2.72 2.72 2.73 2.73 2.04 2.26 2.73
OPEC Total ................................................ 2.01 2.07 2.00 2.08 2.14 2.13 2.20 2.58 2.72 2.72 2.73 2.73 2.04 2.26 2.73
Unplanned OPEC Production Outages ........ 2.32 2.67 2.32 2.42 n/a n/a n/a n/a n/a n/a n/a n/a 2.43 n/a n/a
Projections: EIA Regional Short-Term Energy Model.
Table 3c. OPEC Crude Oil (excluding condensates) Supply (million barrels per day)U.S. Energy Information Administration | Short-Term Energy Outlook - February 2015
2014 2015 2016 Year
- = no data availableOPEC = Organization of Petroleum Exporting Countries: Algeria, Angola, Libya, and Nigeria (Africa); Ecuador and Venezuela (South America); Iran, Iraq, Kuwait, Qatar, Saudi Arabia, and the United Arab Emirate(Middle East).
Notes: The approximate break between historical and forecast values is shown with historical data printed in bold; estimates and forecasts in italics.Historical data: Latest data available from Energy Information Administration international energy statistics.Minor discrepancies with published historical data are due to independent rounding.

Q1 Q2 Q3 Q4 Q1 Q2 Q3 Q4 Q1 Q2 Q3 Q4 2014 2015 2016
North America ............................................................. 23.20 23.04 23.57 23.84 23.47 23.50 23.86 23.87 23.53 23.61 23.96 23.92 23.42 23.68 23.76Canada .......................................................................... 2.43 2.35 2.45 2.37 2.38 2.32 2.43 2.41 2.38 2.32 2.43 2.41 2.40 2.38 2.38Mexico ........................................................................... 1.95 1.97 1.96 2.08 1.97 1.99 1.96 1.97 1.95 1.97 1.94 1.95 1.99 1.97 1.95United States ................................................................. 18.81 18.71 19.16 19.38 19.11 19.18 19.45 19.48 19.19 19.31 19.58 19.55 19.02 19.31 19.41
Central and South America ..................................... 7.05 7.30 7.33 7.36 7.16 7.43 7.47 7.45 7.26 7.53 7.57 7.55 7.26 7.38 7.48Brazil .............................................................................. 3.03 3.14 3.21 3.20 3.09 3.21 3.28 3.26 3.15 3.27 3.34 3.33 3.15 3.21 3.27
Europe ......................................................................... 13.70 14.08 14.60 14.29 14.05 13.78 14.24 14.20 13.95 13.70 14.15 14.10 14.17 14.07 13.98
Eurasia ......................................................................... 4.85 4.79 5.01 4.99 4.65 4.58 4.85 4.83 4.56 4.50 4.76 4.75 4.91 4.73 4.64Russia ........................................................................... 3.49 3.45 3.65 3.63 3.29 3.25 3.44 3.42 3.14 3.10 3.28 3.26 3.56 3.35 3.20
Middle East ................................................................. 7.98 8.33 8.98 8.23 8.16 8.75 9.32 8.47 8.44 9.05 9.66 8.77 8.38 8.68 8.98
Asia and Oceania ...................................................... 30.54 30.14 29.66 30.79 30.92 30.77 30.26 31.17 31.47 31.36 30.83 31.73 30.28 30.78 31.35China ............................................................................. 10.28 10.85 10.80 10.76 10.60 11.18 11.13 11.09 10.93 11.53 11.48 11.43 10.67 11.00 11.34Japan ............................................................................. 5.02 3.87 3.88 4.54 4.69 3.95 3.98 4.35 4.55 3.82 3.85 4.22 4.32 4.24 4.11India ............................................................................... 3.73 3.72 3.41 3.68 3.88 3.86 3.54 3.83 4.03 4.01 3.68 3.98 3.63 3.77 3.92
Africa ........................................................................... 3.73 3.73 3.68 3.70 3.86 3.85 3.81 3.83 3.99 3.98 3.94 3.96 3.71 3.83 3.96
Total OECD Liquid Fuels Consumption .................. 45.73 44.75 45.81 46.70 46.30 45.11 45.92 46.50 46.18 45.07 45.86 46.37 45.75 45.96 45.87Total non-OECD Liquid Fuels Consumption .......... 45.32 46.65 47.04 46.50 45.96 47.54 47.90 47.32 47.02 48.65 49.01 48.41 46.38 47.19 48.28
Total World Liquid Fuels Consumption .................. 91.05 91.40 92.85 93.19 92.27 92.65 93.81 93.82 93.20 93.72 94.88 94.78 92.13 93.14 94.15
World Index, 2010 Q1 = 100 ........................................ 113.0 113.8 114.7 115.4 116.1 117.0 117.9 118.8 119.7 120.6 121.7 122.7 114.2 117.5 121.2 Percent change from prior year ................................. 2.8 2.7 2.6 2.5 2.7 2.8 2.9 2.9 3.1 3.1 3.1 3.3 2.7 2.8 3.2OECD Index, 2010 Q1 = 100 ....................................... 107.3 107.8 108.5 109.0 109.8 110.4 111.1 111.7 112.3 113.0 113.7 114.5 108.2 110.8 113.4 Percent change from prior year ................................. 1.9 1.9 1.8 1.8 2.3 2.4 2.4 2.5 2.3 2.3 2.3 2.4 1.9 2.4 2.3Non-OECD Index, 2010 Q1 = 100 ............................... 120.3 121.4 122.5 123.6 124.1 125.3 126.7 127.9 129.1 130.5 131.9 133.4 121.9 126.0 131.2 Percent change from prior year ................................. 3.9 3.7 3.6 3.3 3.2 3.3 3.4 3.5 4.0 4.1 4.1 4.3 3.6 3.3 4.1
Real U.S. Dollar Exchange Rate (a)Index, January 2010 = 100 ........................................... 108.28 108.07 109.20 113.83 117.85 118.90 119.47 119.59 119.59 119.34 119.17 118.93 109.85 118.95 119.26Percent change from prior year .................................... 3.8 2.1 1.9 6.7 8.8 10.0 9.4 5.1 1.5 0.4 -0.3 -0.5 3.6 8.3 0.3
Table 3d. World Petrioleum and Other Liquids Consumption (million barrels per day)U.S. Energy Information Administration | Short-Term Energy Outlook - February 2015
2014 2015 2016
Notes: The approximate break between historical and forecast values is shown with historical data printed in bold; estimates and forecasts in italics.Historical data: Latest data available from Energy Information Administration international energy statistics.Minor discrepancies with published historical data are due to independent rounding.
Projections: EIA Regional Short-Term Energy Model.
Oil-weighted Real Gross Domestic Product (a)
- = no data availableOECD = Organisation for Economic Co-operation and Development: Australia, Austria, Belgium, Canada, Chile, the Czech Republic, Denmark, Finland, France, Germany, Greece, Hungary, Iceland, Ireland, Israel, Italy, Japan, Luxembourg, Mexico, the Netherlands, New Zealand, Norway, Poland, Portugal, Slovakia, Slovenia, South Korea, Spain, Sweden, Switzerland, Turkey, the United Kingdom, and the United States.(a) Weighted geometric mean of real indices for various countries with weights equal to each country's share of world oil consumption in the base period. Exchange rate is measured in foreign currency per U.S. dollar.

1st 2nd 3rd 4th 1st 2nd 3rd 4th 1st 2nd 3rd 4th 2014 2015 2016Supply (million barrels per day) Crude Oil Supply Domestic Production (a) ......................................... 8.09 8.58 8.78 9.05 9.26 9.41 9.23 9.32 9.36 9.47 9.48 9.78 8.63 9.30 9.52
Alaska .................................................................. 0.53 0.52 0.43 0.51 0.50 0.49 0.42 0.49 0.47 0.46 0.42 0.47 0.50 0.48 0.46
Federal Gulf of Mexico (b) ................................... 1.32 1.41 1.43 1.41 1.46 1.54 1.48 1.61 1.67 1.65 1.53 1.61 1.39 1.52 1.61
Lower 48 States (excl GOM) ................................ 6.24 6.65 6.92 7.12 7.30 7.38 7.33 7.22 7.22 7.36 7.54 7.70 6.74 7.30 7.46
Crude Oil Net Imports (c) ........................................ 7.11 6.94 7.15 6.84 6.33 6.25 6.68 6.26 6.14 6.31 6.63 5.90 7.01 6.38 6.24
SPR Net Withdrawals ............................................. 0.00 0.05 0.00 0.00 0.00 0.00 0.00 0.00 0.00 0.00 0.00 0.00 0.01 0.00 0.00
Commercial Inventory Net Withdrawals ................. -0.30 0.00 0.25 -0.24 -0.53 0.11 0.21 0.11 -0.25 0.06 0.16 0.13 -0.07 -0.02 0.02
Crude Oil Adjustment (d) ........................................ 0.28 0.31 0.17 0.27 0.29 0.21 0.23 0.09 0.15 0.16 0.20 0.08 0.26 0.20 0.15
Total Crude Oil Input to Refineries ............................. 15.18 15.88 16.35 15.92 15.34 15.98 16.35 15.78 15.40 16.00 16.47 15.88 15.84 15.86 15.94
Other Supply Refinery Processing Gain ....................................... 1.07 1.08 1.09 1.10 1.06 1.06 1.09 1.07 1.05 1.06 1.10 1.07 1.09 1.07 1.07
Natural Gas Plant Liquids Production .................... 2.71 2.95 3.09 3.09 3.07 3.17 3.27 3.31 3.27 3.45 3.57 3.67 2.96 3.21 3.49
Renewables and Oxygenate Production (e) ........... 1.01 1.06 1.06 1.06 1.04 1.04 1.06 1.06 1.02 1.04 1.07 1.07 1.05 1.05 1.05
Fuel Ethanol Production ...................................... 0.91 0.94 0.93 0.95 0.93 0.93 0.94 0.95 0.91 0.93 0.95 0.95 0.93 0.94 0.94
Petroleum Products Adjustment (f) ........................ 0.20 0.22 0.22 0.22 0.20 0.20 0.20 0.20 0.21 0.22 0.21 0.21 0.22 0.20 0.21
Product Net Imports (c) ........................................... -1.73 -1.76 -2.17 -2.15 -2.03 -1.85 -2.23 -2.25 -2.10 -2.03 -2.57 -2.70 -1.95 -2.09 -2.35
Hydrocarbon Gas Liquids .................................... -0.37 -0.58 -0.66 -0.66 -0.72 -0.78 -0.82 -0.81 -0.85 -0.95 -1.02 -1.13 -0.57 -0.78 -0.99
Unfinished Oils .................................................... 0.46 0.49 0.32 0.34 0.39 0.50 0.45 0.38 0.38 0.51 0.47 0.40 0.40 0.43 0.44
Other HC/Oxygenates .......................................... -0.09 -0.09 -0.08 -0.10 -0.10 -0.10 -0.10 -0.10 -0.10 -0.10 -0.11 -0.10 -0.09 -0.10 -0.10
Motor Gasoline Blend Comp. .............................. 0.29 0.58 0.45 0.41 0.37 0.57 0.46 0.40 0.42 0.60 0.45 0.37 0.44 0.45 0.46
Finished Motor Gasoline ...................................... -0.41 -0.36 -0.34 -0.41 -0.35 -0.30 -0.30 -0.30 -0.36 -0.35 -0.43 -0.40 -0.38 -0.31 -0.39
Jet Fuel ................................................................ -0.07 -0.02 -0.09 -0.11 -0.05 -0.02 -0.07 -0.06 -0.06 -0.03 -0.08 -0.08 -0.07 -0.05 -0.06
Distillate Fuel Oil ................................................. -0.67 -1.01 -1.08 -0.95 -0.81 -0.91 -1.01 -0.99 -0.74 -0.88 -1.00 -0.99 -0.93 -0.93 -0.90
Residual Fuel Oil ................................................. -0.24 -0.18 -0.18 -0.16 -0.21 -0.24 -0.25 -0.20 -0.24 -0.26 -0.26 -0.21 -0.19 -0.22 -0.24
Other Oils (g) ....................................................... -0.64 -0.58 -0.51 -0.51 -0.55 -0.56 -0.58 -0.56 -0.55 -0.56 -0.59 -0.57 -0.56 -0.56 -0.56
Product Inventory Net Withdrawals ........................ 0.39 -0.72 -0.48 0.12 0.42 -0.43 -0.29 0.31 0.34 -0.43 -0.27 0.35 -0.17 0.00 0.00
Total Supply ............................................................... 18.84 18.71 19.16 19.31 19.08 19.18 19.45 19.48 19.19 19.31 19.58 19.55 19.01 19.30 19.41
Consumption (million barrels per day) Hydrocarbon Gas Liquids ....................................... 2.66 2.06 2.26 2.59 2.72 2.28 2.40 2.71 2.81 2.38 2.51 2.80 2.39 2.53 2.63
Unfinished Oils ....................................................... 0.08 0.02 -0.06 0.00 0.00 0.01 0.02 0.04 0.00 0.01 0.02 0.04 0.01 0.02 0.02
Motor Gasoline ....................................................... 8.52 9.01 9.10 9.03 8.75 9.10 9.14 9.00 8.67 9.07 9.10 8.95 8.92 9.00 8.95
Fuel Ethanol blended into Motor Gasoline .......... 0.84 0.89 0.89 0.89 0.83 0.87 0.88 0.87 0.81 0.87 0.89 0.88 0.88 0.87 0.86
Jet Fuel ................................................................... 1.40 1.47 1.51 1.49 1.44 1.50 1.51 1.45 1.41 1.51 1.51 1.45 1.47 1.48 1.47
Distillate Fuel Oil .................................................... 4.17 3.93 3.86 4.00 4.14 4.03 3.99 4.11 4.22 4.10 4.05 4.14 3.99 4.07 4.13
Residual Fuel Oil .................................................... 0.23 0.26 0.24 0.29 0.21 0.21 0.20 0.21 0.21 0.19 0.19 0.20 0.26 0.21 0.20
Other Oils (g) .......................................................... 1.75 1.96 2.25 1.97 1.86 2.04 2.20 1.96 1.87 2.04 2.21 1.96 1.98 2.02 2.02
Total Consumption .................................................... 18.81 18.71 19.16 19.38 19.11 19.18 19.45 19.48 19.19 19.31 19.58 19.55 19.02 19.31 19.41
Total Petroleum and Other Liquids Net Imports .... 5.38 5.18 4.98 4.69 4.30 4.40 4.45 4.02 4.03 4.28 4.06 3.20 5.06 4.29 3.89
End-of-period Inventories (million barrels) Commercial Inventory Crude Oil (excluding SPR) ...................................... 383.7 383.9 360.9 382.8 430.8 420.4 401.0 391.2 414.3 408.8 393.7 382.0 382.8 391.2 382.0
Hydrocarbon Gas Liquids ....................................... 98.1 164.1 209.8 173.5 137.8 183.0 212.8 173.5 138.1 183.4 212.4 171.3 173.5 173.5 171.3
Unfinished Oils ....................................................... 91.3 87.3 84.5 79.3 90.5 87.9 85.7 80.5 90.3 87.8 85.3 80.0 79.3 80.5 80.0
Other HC/Oxygenates ............................................. 22.6 23.0 22.4 22.6 25.5 24.1 23.2 23.5 25.5 24.1 23.4 23.8 22.6 23.5 23.8
Total Motor Gasoline .............................................. 220.9 218.8 212.5 239.0 228.5 220.2 217.3 230.3 228.7 222.2 219.3 231.3 239.0 230.3 231.3
Finished Motor Gasoline ...................................... 34.3 28.9 28.8 30.7 30.2 29.9 29.1 31.3 27.7 27.3 25.9 27.6 30.7 31.3 27.6
Motor Gasoline Blend Comp. .............................. 186.6 190.0 183.7 208.3 198.4 190.3 188.2 199.0 201.0 194.9 193.3 203.7 208.3 199.0 203.7
Jet Fuel ................................................................... 36.0 36.3 39.6 37.2 37.5 38.7 40.8 38.5 38.3 39.3 41.3 38.4 37.2 38.5 38.4
Distillate Fuel Oil .................................................... 115.3 121.7 131.3 137.8 123.6 129.6 138.2 141.2 127.1 132.0 140.8 143.6 137.8 141.2 143.6
Residual Fuel Oil .................................................... 36.4 36.7 36.6 33.3 34.6 35.1 34.3 35.2 35.9 35.6 34.2 34.9 33.3 35.2 34.9
Other Oils (g) .......................................................... 52.8 50.9 46.4 48.9 55.4 53.9 47.2 48.5 55.8 54.2 47.3 48.6 48.9 48.5 48.6
Total Commercial Inventory ....................................... 1,057 1,123 1,144 1,154 1,164 1,193 1,201 1,162 1,154 1,187 1,198 1,154 1,154 1,162 1,154
Crude Oil in SPR ....................................................... 696 691 691 691 691 691 691 691 691 691 691 691 691 691 691
(e) Renewables and oxygenate production includes pentanes plus, oxygenates (excluding fuel ethanol), and renewable fuels.
Table 4a. U.S. Petroleum and Other Liquids Supply, Consumption, and InventoriesU.S. Energy Information Administration | Short-Term Energy Outlook - February 2015
2014 2015 2016 Year
- = no data available(a) Includes lease condensate.(b) Crude oil production from U.S. Federal leases in the Gulf of Mexico (GOM).(c) Net imports equals gross imports minus gross exports.(d) Crude oil adjustment balances supply and consumption and was previously referred to as "Unaccounted for Crude Oil."
Petroleum Supply Annual , DOE/EIA-0340/2; and Weekly Petroleum Status Report , DOE/EIA-0208. Minor discrepancies with published historical data are due to independent rounding. Projections: EIA Regional Short-Term Energy Model.
(f) Petroleum products adjustment includes hydrogen/oxygenates/renewables/other hydrocarbons, motor gasoline blend components, and finished motor gasoline.(g) "Other Oils" inludes aviation gasoline blend components, finished aviation gasoline, kerosene, petrochemical feedstocks, special naphthas, lubricants, waxes, petroleum coke, asphalt and road oil, still gas, and miscellaneous products.Notes: The approximate break between historical and forecast values is shown with historical data printed in bold; estimates and forecasts in italics.SPR: Strategic Petroleum ReserveHC: HydrocarbonsHistorical data: Latest data available from Energy Information Administration databases supporting the following reports: Petroleum Supply Monthly , DOE/EIA-0109;

1st 2nd 3rd 4th 1st 2nd 3rd 4th 1st 2nd 3rd 4th 2014 2015 2016HGL Production Natural Gas Processing Plants Ethane ............................................................. 1.03 1.09 1.09 1.10 1.14 1.17 1.20 1.24 1.22 1.26 1.33 1.42 1.08 1.19 1.31 Propane ........................................................... 0.87 0.95 1.02 1.03 1.01 1.04 1.07 1.08 1.08 1.15 1.17 1.19 0.97 1.05 1.15 Butanes ........................................................... 0.48 0.52 0.56 0.57 0.54 0.56 0.58 0.59 0.60 0.62 0.64 0.65 0.53 0.57 0.63 Natural Gasoline (Pentanes Plus) ................... 0.33 0.39 0.42 0.39 0.37 0.40 0.42 0.40 0.37 0.41 0.43 0.41 0.38 0.40 0.41 Refinery and Blender Net Production Ethane/Ethylene .............................................. 0.01 0.01 0.01 0.01 0.01 0.01 0.01 0.01 0.01 0.01 0.01 0.01 0.01 0.01 0.01 Propane/Propylene ......................................... 0.57 0.60 0.59 0.57 0.57 0.59 0.59 0.58 0.57 0.59 0.59 0.58 0.58 0.58 0.59 Butanes/Butylenes .......................................... -0.04 0.27 0.21 -0.18 -0.05 0.24 0.16 -0.16 -0.05 0.24 0.16 -0.16 0.07 0.05 0.05 Renewable Fuels and Oxygenate Plant Net Production Natural Gasoline (Pentanes Plus) ................... -0.02 -0.02 -0.02 -0.02 -0.02 -0.02 -0.02 -0.02 -0.02 -0.02 -0.02 -0.02 -0.02 -0.02 -0.02
HGL Net Imports Ethane ................................................................ -0.01 -0.02 -0.05 -0.06 -0.08 -0.09 -0.11 -0.11 -0.11 -0.12 -0.18 -0.22 -0.04 -0.10 -0.16 Propane/Propylene ............................................ -0.17 -0.34 -0.36 -0.39 -0.39 -0.42 -0.45 -0.43 -0.45 -0.49 -0.50 -0.53 -0.31 -0.42 -0.49 Butanes/Butylenes ............................................. -0.03 -0.06 -0.09 -0.06 -0.08 -0.10 -0.10 -0.11 -0.12 -0.18 -0.16 -0.19 -0.06 -0.09 -0.16 Natural Gasoline (Pentanes Plus) ...................... -0.15 -0.16 -0.16 -0.16 -0.17 -0.16 -0.17 -0.17 -0.17 -0.17 -0.18 -0.19 -0.16 -0.17 -0.18
HGL Refinery and Blender Net Inputs Butanes/Butylenes ............................................. 0.37 0.28 0.30 0.46 0.36 0.27 0.29 0.43 0.34 0.27 0.29 0.42 0.35 0.34 0.33 Natural Gasoline (Pentanes Plus) ...................... 0.14 0.15 0.16 0.17 0.17 0.17 0.18 0.18 0.17 0.17 0.18 0.18 0.15 0.17 0.17
HGL Consumption Ethane/Ethylene ................................................. 1.01 0.97 1.08 1.07 1.07 1.04 1.12 1.15 1.12 1.10 1.18 1.21 1.03 1.09 1.15 Propane/Propylene ............................................ 1.46 0.89 0.97 1.29 1.44 1.01 1.04 1.35 1.49 1.06 1.10 1.39 1.15 1.21 1.26 Butanes/Butylenes ............................................. 0.16 0.17 0.16 0.20 0.19 0.20 0.19 0.17 0.17 0.18 0.17 0.16 0.18 0.19 0.17 Natural Gasoline (Pentanes Plus) ...................... 0.03 0.03 0.05 0.02 0.02 0.03 0.05 0.05 0.03 0.04 0.05 0.04 0.03 0.04 0.04
HGL Inventories (million barrels) Ethane/Ethylene ................................................. 29.90 37.06 38.70 36.51 34.84 38.49 38.17 37.46 36.18 39.89 39.67 39.26 35.57 37.25 38.75 Propane/Propylene ............................................ 28.32 57.12 82.37 75.47 53.42 71.41 86.49 75.45 49.73 67.84 82.13 68.94 75.47 75.45 68.94 Butanes/Butylenes ............................................. 25.95 52.24 72.22 42.28 29.89 52.09 67.78 41.98 33.50 55.05 70.45 44.53 42.28 41.98 44.53 Natural Gasoline (Pentanes Plus) ...................... 13.04 14.82 17.92 20.43 19.13 20.11 20.91 19.13 18.39 19.85 20.64 18.97 20.43 19.13 18.97
Refinery and Blender Net Inputs Crude OIl .............................................................. 15.18 15.88 16.35 15.92 15.34 15.98 16.35 15.78 15.40 16.00 16.47 15.88 15.84 15.86 15.94
Hydrocarbon Gas Liquids .................................... 0.52 0.43 0.46 0.62 0.53 0.44 0.47 0.61 0.51 0.44 0.47 0.59 0.51 0.51 0.51
Other Hydrocarbons/Oxygenates ........................ 1.08 1.16 1.16 1.12 1.08 1.12 1.13 1.11 1.07 1.13 1.14 1.13 1.13 1.11 1.12
Unfinished Oils ..................................................... 0.24 0.51 0.41 0.39 0.27 0.52 0.45 0.40 0.27 0.52 0.47 0.42 0.39 0.41 0.42
Motor Gasoline Blend Components ..................... 0.71 1.06 0.83 0.31 0.66 0.84 0.65 0.46 0.58 0.85 0.63 0.43 0.73 0.65 0.62
Aviation Gasoline Blend Components ................. 0.00 0.00 0.00 0.00 0.00 0.00 0.00 0.00 0.00 0.00 0.00 0.00 0.00 0.00 0.00
Total Refinery and Blender Net Inputs .................... 17.73 19.04 19.21 18.37 17.88 18.89 19.05 18.36 17.84 18.94 19.19 18.45 18.59 18.55 18.61
Refinery Processing Gain .................................. 1.07 1.08 1.09 1.10 1.06 1.06 1.09 1.07 1.05 1.06 1.10 1.07 1.09 1.07 1.07
Refinery and Blender Net Production Hydrocarbon Gas Liquids .................................... 0.54 0.87 0.81 0.40 0.52 0.84 0.76 0.42 0.53 0.85 0.76 0.43 0.66 0.63 0.64
Finished Motor Gasoline ...................................... 9.26 9.82 9.74 9.60 9.27 9.57 9.59 9.48 9.19 9.59 9.67 9.52 9.61 9.48 9.49
Jet Fuel ................................................................. 1.45 1.49 1.64 1.57 1.50 1.54 1.60 1.49 1.47 1.55 1.61 1.50 1.54 1.53 1.53
Distillate Fuel ........................................................ 4.66 4.96 4.99 4.97 4.74 4.96 5.04 5.07 4.75 4.98 5.09 5.11 4.90 4.96 4.98
Residual Fuel ....................................................... 0.46 0.44 0.42 0.42 0.43 0.46 0.44 0.42 0.46 0.45 0.43 0.41 0.43 0.44 0.44
Other Oils (a) ........................................................ 2.43 2.52 2.71 2.51 2.48 2.59 2.71 2.54 2.50 2.58 2.72 2.54 2.54 2.58 2.59
Total Refinery and Blender Net Production ............ 18.80 20.11 20.30 19.47 18.94 19.95 20.14 19.42 18.89 20.00 20.29 19.52 19.68 19.62 19.68
Refinery Distillation Inputs ................................ 15.51 16.17 16.64 16.25 15.65 16.28 16.68 16.13 15.72 16.31 16.81 16.24 16.15 16.19 16.27
Refinery Operable Distillation Capacity ........... 17.93 17.89 17.81 17.81 17.83 17.83 17.83 17.83 17.83 17.83 17.83 17.83 17.86 17.83 17.83
Refinery Distillation Utilization Factor .............. 0.87 0.90 0.93 0.91 0.88 0.91 0.94 0.90 0.88 0.91 0.94 0.91 0.90 0.91 0.91
Table 4b. U.S. Hydrocarbon Gas Liquids (HGL) and Petroleum Refinery Balances (million barrels per day, except inventories and utilization factor)U.S. Energy Information Administration | Short-Term Energy Outlook - February 2015
2014 2015 2016 Year
Projections: EIA Regional Short-Term Energy Model.
- = no data available(a) "Other Oils" includes aviation gasoline blend components, finished aviation gasoline, kerosene, petrochemical feedstocks, special naphthas, lubricants, waxes, petroleum coke, asphalt and road oil, still gas, and miscellaneous products.Notes: The approximate break between historical and forecast values is shown with historical data printed in bold; estimates and forecasts in italics.Historical data: Latest data available from Energy Information Administration databases supporting the following reports: Petroleum Supply Monthly , DOE/EIA-0109; Petroleum Supply Annual , DOE/EIA-0340/2; Weekly Petroleum Status Report , DOE/EIA-0208.Minor discrepancies with published historical data are due to independent rounding.

1st 2nd 3rd 4th 1st 2nd 3rd 4th 1st 2nd 3rd 4th 2014 2015 2016Prices (cents per gallon) Refiner Wholesale Price ...................... 272 298 276 202 141 165 173 171 190 216 213 189 262 163 202
Gasoline Regular Grade Retail Prices Including Taxes PADD 1 .............................................. 344 365 348 292 216 231 239 244 260 284 282 266 337 233 273
PADD 2 .............................................. 337 365 343 278 204 233 240 236 252 285 282 254 331 229 269
PADD 3 .............................................. 318 345 329 265 193 215 222 220 237 265 262 238 314 213 251
PADD 4 .............................................. 326 350 363 297 199 225 240 237 241 276 284 259 335 225 265
PADD 5 .............................................. 362 401 386 315 245 265 273 270 283 316 314 290 366 264 301
U.S. Average ................................... 340 368 350 288 213 234 242 242 258 286 284 262 336 233 273
Gasoline All Grades Including Taxes 348 375 358 296 222 243 251 251 266 295 293 271 344 242 281
End-of-period Inventories (million barrels) Total Gasoline Inventories PADD 1 .............................................. 57.7 63.1 55.6 62.7 63.0 61.5 55.8 59.2 61.3 62.1 57.1 59.9 62.7 59.2 59.9
PADD 2 .............................................. 49.0 49.7 47.2 52.9 51.1 48.6 49.2 50.5 50.8 48.2 49.1 49.8 52.9 50.5 49.8
PADD 3 .............................................. 77.7 72.8 74.9 82.3 77.7 75.5 77.2 81.1 79.1 77.1 78.1 82.1 82.3 81.1 82.1
PADD 4 .............................................. 6.5 6.1 7.4 8.0 6.8 6.6 6.8 7.7 7.1 6.8 6.9 7.7 8.0 7.7 7.7
PADD 5 .............................................. 30.0 27.1 27.3 33.0 29.9 28.1 28.3 31.8 30.4 28.0 28.1 31.7 33.0 31.8 31.7
U.S. Total ........................................ 220.9 218.8 212.5 239.0 228.5 220.2 217.3 230.3 228.7 222.2 219.3 231.3 239.0 230.3 231.3
Finished Gasoline Inventories U.S. Total ........................................ 34.3 28.9 28.8 30.7 30.2 29.9 29.1 31.3 27.7 27.3 25.9 27.6 30.7 31.3 27.6
Gasoline Blending Components Inventories U.S. Total ........................................ 186.6 190.0 183.7 208.3 198.4 190.3 188.2 199.0 201.0 194.9 193.3 203.7 208.3 199.0 203.7
Table 4c. U.S. Regional Motor Gasoline Prices and InventoriesU.S. Energy Information Administration | Short-Term Energy Outlook - February 2015
2014 2015 2016 Year
Petroleum Supply Monthly , DOE/EIA-0109; Petroleum Supply Annual , DOE/EIA-0340/2; and Weekly Petroleum Status Report , DOE/EIA-0208.Minor discrepancies with published historical data are due to independent rounding. Projections: EIA Regional Short-Term Energy Model.
- = no data availablePrices are not adjusted for inflation.Notes: The approximate break between historical and forecast values is shown with historical data printed in bold; estimates and forecasts in italics.Regions refer to Petroleum Administration for Defense Districts (PADD).See “Petroleum for Administration Defense District” in EIA’s Energy Glossary (http://www.eia.doe.gov/glossary/index.html) for a list of States in each region.Historical data : Latest data available from Energy Information Administration databases supporting the following reports: Petroleum Marketing Monthly , DOE/EIA-0380;

1st 2nd 3rd 4th 1st 2nd 3rd 4th 1st 2nd 3rd 4th 2014 2015 2016Supply (billion cubic feet per day) Total Marketed Production ............ 71.62 73.43 75.60 76.98 77.07 77.17 77.25 77.61 78.39 78.71 79.01 79.69 74.43 77.28 78.95
Alaska ...................................... 0.99 0.93 0.85 0.97 1.00 0.85 0.77 0.93 0.97 0.82 0.75 0.91 0.93 0.89 0.86
Federal GOM (a) ....................... 3.29 3.42 3.41 3.37 3.22 3.16 3.18 3.05 3.10 3.05 2.87 2.84 3.37 3.15 2.97
Lower 48 States (excl GOM) ..... 67.35 69.09 71.34 72.63 72.85 73.16 73.30 73.63 74.31 74.84 75.39 75.94 70.12 73.24 75.12
Total Dry Gas Production ............. 67.72 69.21 71.18 72.51 72.61 72.71 72.78 73.12 73.85 74.16 74.43 75.08 70.17 72.80 74.38
LNG Gross Imports ..................... 0.17 0.17 0.15 0.14 0.17 0.17 0.18 0.17 0.14 0.16 0.17 0.15 0.16 0.17 0.15
LNG Gross Exports ..................... 0.03 0.02 0.09 0.03 0.00 0.00 0.43 0.59 0.68 0.69 0.72 1.07 0.04 0.26 0.79
Pipeline Gross Imports ................ 8.44 6.52 6.47 7.20 7.49 6.37 6.71 7.01 7.29 6.22 6.54 6.73 7.15 6.89 6.69
Pipeline Gross Exports ................ 4.67 3.89 3.85 3.67 4.27 4.40 4.44 4.77 4.87 4.72 4.91 5.09 4.01 4.47 4.90
Supplemental Gaseous Fuels ...... 0.17 0.16 0.13 0.16 0.16 0.16 0.16 0.16 0.16 0.16 0.16 0.16 0.15 0.16 0.16
Net Inventory Withdrawals ........... 22.75 -12.71 -12.96 0.68 15.86 -10.45 -9.43 2.93 16.80 -10.82 -9.95 3.12 -0.65 -0.33 -0.23
Total Supply ................................... 94.55 59.44 61.03 76.99 92.01 64.55 65.53 78.02 92.68 64.48 65.72 79.08 72.92 74.97 75.48
Balancing Item (b) .......................... 0.61 1.64 0.58 -1.31 0.30 -1.28 -0.98 -0.53 -0.47 -0.20 0.12 -0.37 0.38 -0.62 -0.23
Total Primary Supply ....................... 95.16 61.08 61.61 75.68 92.31 63.27 64.56 77.50 92.22 64.28 65.84 78.71 73.30 74.34 75.25
Consumption (billion cubic feet per day) Residential ................................... 28.70 7.46 3.70 15.65 25.39 6.87 3.70 16.06 24.67 6.72 3.52 15.69 13.81 12.95 12.63
Commercial ................................. 16.46 6.23 4.59 10.39 14.50 5.97 4.52 10.28 14.47 5.99 4.52 10.22 9.39 8.79 8.79
Industrial ..................................... 22.96 20.03 19.66 21.71 23.94 21.31 20.78 23.07 24.21 21.57 21.40 23.58 21.08 22.27 22.69
Electric Power (c) ......................... 19.70 21.04 27.21 20.98 20.93 22.55 28.99 21.36 21.10 23.28 29.69 22.19 22.25 23.48 24.08
Lease and Plant Fuel ................... 4.11 4.22 4.34 4.42 4.42 4.43 4.44 4.46 4.50 4.52 4.54 4.58 4.27 4.44 4.53
Pipeline and Distribution Use ....... 3.14 2.01 2.03 2.44 3.03 2.06 2.03 2.17 3.17 2.10 2.08 2.35 2.40 2.32 2.43
Vehicle Use ................................. 0.09 0.09 0.09 0.09 0.09 0.09 0.09 0.09 0.10 0.10 0.10 0.10 0.09 0.09 0.10
Total Consumption ......................... 95.16 61.08 61.61 75.68 92.31 63.27 64.56 77.50 92.22 64.28 65.84 78.71 73.30 74.34 75.25
End-of-period Inventories (billion cubic feet) Working Gas Inventory ................ 857 2,005 3,187 3,126 1,699 2,650 3,517 3,248 1,719 2,704 3,619 3,332 3,126 3,248 3,332
Producing Region (d) ................ 358 691 953 1,075 681 940 1,105 1,101 707 997 1,177 1,161 1,075 1,101 1,161
East Consuming Region (d) ...... 315 952 1,752 1,614 716 1,256 1,882 1,657 680 1,242 1,888 1,650 1,614 1,657 1,650
West Consuming Region (d) .... 184 362 483 437 302 453 530 490 333 465 554 521 437 490 521
Table 5a. U.S. Natural Gas Supply, Consumption, and InventoriesU.S. Energy Information Administration | Short-Term Energy Outlook - February 2015
2014 2015 2016 Year
LNG: liquefied natural gas.Historical data: Latest data available from Energy Information Administration databases supporting the following reports: Natural Gas Monthly , DOE/EIA-0130; and Electric Power Monthly , DOE/EIA-0226.Minor discrepancies with published historical data are due to independent rounding. Projections: EIA Regional Short-Term Energy Model.
- = no data available(a) Marketed production from U.S. Federal leases in the Gulf of Mexico.(b) The balancing item represents the difference between the sum of the components of natural gas supply and the sum of components of natural gas demand.(c) Natural gas used for electricity generation and (a limited amount of) useful thermal output by electric utilities and independent power producers.(d) For a list of States in each inventory region refer to Methodology for EIA Weekly Underground Natural Gas Storage Estimates (http://tonto.eia.doe.gov/oog/info/ngs/methodology.html).Notes: The approximate break between historical and forecast values is shown with historical data printed in bold; estimates and forecasts in italics.

1st 2nd 3rd 4th 1st 2nd 3rd 4th 1st 2nd 3rd 4th 2014 2015 2016Wholesale/Spot Henry Hub Spot Price ........ 5.36 4.75 4.08 3.91 2.98 3.00 3.21 3.40 3.54 3.35 3.63 3.76 4.52 3.15 3.57
Residential New England ..................... 13.65 15.98 17.80 14.23 13.14 14.02 16.81 13.54 13.08 14.42 17.42 14.07 14.48 13.68 13.90
Middle Atlantic ................... 10.71 13.04 17.25 11.40 10.24 12.73 17.28 11.89 10.88 13.48 17.94 12.39 11.65 11.50 12.13
E. N. Central ...................... 8.67 12.96 16.85 8.69 7.67 10.80 16.34 8.62 7.92 11.26 16.88 8.92 9.62 8.84 9.15
W. N. Central ..................... 9.10 11.73 18.17 9.75 8.03 10.53 16.92 9.24 8.24 11.01 17.39 9.52 10.06 9.24 9.48
S. Atlantic .......................... 11.34 16.38 22.98 12.94 11.15 15.87 22.01 12.90 11.48 16.32 22.56 13.17 13.06 12.94 13.26
E. S. Central ...................... 9.63 14.08 19.70 11.12 9.36 12.96 17.89 10.88 9.40 13.58 18.59 11.39 11.01 10.67 10.86
W. S. Central ..................... 8.53 14.22 20.25 11.14 8.01 12.65 18.20 10.70 8.14 13.28 18.92 11.12 10.74 10.13 10.48
Mountain ........................... 9.07 11.22 15.15 9.62 8.65 9.62 13.22 8.66 8.26 9.57 13.39 8.90 10.05 9.15 9.03
Pacific ................................ 10.97 11.66 12.41 10.88 9.68 9.81 10.70 9.69 9.43 9.98 11.13 9.95 11.25 9.84 9.90
U.S. Average .................. 9.82 13.11 16.92 10.39 9.15 11.58 15.75 10.23 9.34 11.99 16.27 10.57 10.91 10.28 10.56
Commercial New England ..................... 11.35 12.82 11.73 11.26 11.11 10.26 10.32 10.51 11.09 10.73 10.71 10.89 11.62 10.73 10.94
Middle Atlantic ................... 9.30 9.06 8.04 8.10 8.83 8.21 8.05 8.98 9.35 8.85 8.59 9.56 8.82 8.66 9.23
E. N. Central ...................... 8.02 9.96 10.18 7.53 7.32 8.35 9.04 7.56 7.76 8.90 9.63 8.15 8.27 7.66 8.17
W. N. Central ..................... 8.35 9.10 10.19 8.00 7.48 7.40 8.51 7.53 7.73 7.88 9.01 8.04 8.47 7.57 7.94
S. Atlantic .......................... 9.23 10.56 10.91 9.33 9.33 9.64 10.32 9.57 9.80 10.30 10.95 10.23 9.66 9.58 10.15
E. S. Central ...................... 8.90 10.71 11.17 9.65 9.16 9.41 9.75 9.09 9.21 9.97 10.58 9.83 9.59 9.24 9.66
W. S. Central ..................... 7.49 9.24 9.26 8.16 7.26 7.40 8.02 7.56 7.51 7.94 8.62 8.19 8.21 7.47 7.93
Mountain ........................... 7.81 8.74 9.90 8.24 7.92 7.48 8.75 7.93 7.70 7.44 8.80 8.08 8.33 7.94 7.88
Pacific ................................ 9.29 9.26 9.56 8.96 8.37 7.83 8.69 8.65 8.77 8.60 9.36 9.30 9.22 8.40 8.99
U.S. Average .................. 8.66 9.64 9.69 8.39 8.24 8.24 8.84 8.34 8.54 8.77 9.39 8.92 8.84 8.34 8.78
Industrial New England ..................... 10.03 9.97 8.04 8.84 8.83 7.85 7.89 8.88 9.21 8.51 8.41 9.43 9.39 8.48 8.99
Middle Atlantic ................... 9.28 8.87 8.15 7.98 8.16 7.13 7.63 8.27 8.41 7.63 8.03 8.67 8.78 7.94 8.29
E. N. Central ...................... 8.03 8.87 7.89 6.66 6.48 5.80 6.06 6.31 6.75 6.36 6.50 6.73 7.76 6.27 6.65
W. N. Central ..................... 7.34 6.28 5.91 6.11 5.09 4.38 4.68 5.20 5.46 4.76 4.97 5.51 6.50 4.87 5.21
S. Atlantic .......................... 6.91 6.42 5.90 5.99 5.32 4.83 5.16 5.49 5.71 5.37 5.60 5.96 6.33 5.21 5.67
E. S. Central ...................... 6.37 6.14 5.31 5.49 5.10 4.53 4.74 5.11 5.40 5.01 5.26 5.60 5.86 4.89 5.33
W. S. Central ..................... 5.15 4.91 4.52 4.09 3.22 3.13 3.42 3.54 3.67 3.51 3.88 3.97 4.67 3.33 3.76
Mountain ........................... 6.55 6.68 6.95 6.55 5.71 5.24 5.81 5.95 5.62 5.38 6.07 6.20 6.66 5.70 5.82
Pacific ................................ 7.84 7.63 7.70 7.29 6.32 5.76 6.24 6.52 6.44 6.17 6.65 7.06 7.62 6.23 6.60
U.S. Average .................. 6.17 5.62 5.06 4.98 4.35 3.79 4.02 4.41 4.73 4.21 4.47 4.85 5.48 4.16 4.58
Table 5b. U.S. Regional Natural Gas Prices (dollars per thousand cubic feetU.S. Energy Information Administration | Short-Term Energy Outlook - February 2015
2014 2015 2016 Year
Natural gas Henry Hub spot price from Reuter's News Service (http://www.reuters.com).Minor discrepancies with published historical data are due to independent rounding. Projections: EIA Regional Short-Term Energy Model.
- = no data availablePrices are not adjusted for inflation.Notes: The approximate break between historical and forecast values is shown with historical data printed in bold; estimates and forecasts in italics.Regions refer to U.S. Census divisions. See "Census division" in EIA’s Energy Glossary (http://www.eia.doe.gov/glossary/index.html) for a list of States in each region.Historical data: Latest data available from Energy Information Administration databases supporting the Natural Gas Monthly , DOE/EIA-0130.

1st 2nd 3rd 4th 1st 2nd 3rd 4th 1st 2nd 3rd 4th 2014 2015 2016Supply (million short tons) Production ........................................... 245.2 245.8 255.3 250.3 243.7 232.6 246.3 243.9 248.0 225.7 245.9 240.7 996.7 966.4 960.3
Appalachia ....................................... 67.5 69.7 67.5 65.6 67.0 65.7 60.9 62.0 67.1 62.3 59.5 59.8 270.3 255.6 248.6
Interior .............................................. 46.3 44.8 49.3 47.0 46.7 46.5 48.2 47.8 47.9 45.6 48.8 48.1 187.4 189.2 190.4
Western ........................................... 131.4 131.4 138.5 137.7 130.1 120.4 137.1 134.1 132.9 117.8 137.6 132.9 538.9 521.6 521.2
Primary Inventory Withdrawals ............. 1.0 -0.1 0.6 -2.3 0.5 -0.1 0.6 -2.3 0.0 1.5 2.3 -1.9 -0.8 -1.3 1.9
Imports ................................................ 2.4 3.5 3.2 2.7 2.4 2.5 3.3 2.9 2.2 2.4 3.3 2.9 11.9 11.0 10.8
Exports ................................................ 27.7 24.6 22.7 22.2 19.9 22.4 19.5 20.5 19.0 22.0 19.7 21.3 97.2 82.3 81.9
Metallurgical Coal ............................. 16.9 15.8 15.2 14.7 13.2 12.6 10.2 11.1 12.3 12.5 10.7 12.0 62.6 47.0 47.4
Steam Coal ...................................... 10.9 8.8 7.5 7.5 6.7 9.8 9.3 9.4 6.7 9.5 9.0 9.3 34.6 35.2 34.5
Total Primary Supply .............................. 220.9 224.7 236.4 228.5 226.7 212.6 230.7 223.9 231.2 207.6 231.9 220.3 910.6 893.9 891.1
Secondary Inventory Withdrawals ........ 31.1 -15.2 8.1 -15.6 1.8 -8.8 16.3 -5.6 -2.0 -6.7 13.3 -5.6 8.3 3.7 -1.0
Waste Coal (a) .................................... 3.2 2.8 2.6 2.6 2.7 2.7 2.7 2.7 2.8 2.8 2.8 2.8 11.2 10.8 11.1
Total Supply ........................................... 255.2 212.3 247.1 215.5 231.2 206.5 249.7 221.1 232.0 203.7 247.9 217.5 930.1 908.5 901.1
Consumption (million short tons) Coke Plants ......................................... 4.8 5.1 5.2 5.3 4.7 4.8 5.8 5.8 5.0 5.0 5.9 5.8 20.5 21.1 21.7
Electric Power Sector (b) ..................... 231.7 196.8 231.4 194.4 212.2 191.2 233.5 204.3 215.5 188.0 231.5 200.6 854.3 841.1 835.7
Retail and Other Industry ..................... 12.0 10.9 10.8 11.0 11.2 10.5 10.5 11.0 11.4 10.6 10.5 11.1 44.8 43.2 43.7
Residential and Commercial ............. 0.7 0.4 0.4 0.6 0.7 0.4 0.4 0.6 0.7 0.5 0.4 0.6 2.2 2.1 2.2
Other Industrial ................................. 11.3 10.5 10.4 10.4 10.5 10.1 10.1 10.4 10.7 10.1 10.1 10.5 42.6 41.0 41.5
Total Consumption ................................ 248.6 212.9 247.4 210.7 228.1 206.5 249.7 221.1 232.0 203.7 247.9 217.5 919.6 905.4 901.1
Discrepancy (c) 6.6 -0.5 -0.3 4.8 3.1 0.0 0.0 0.0 0.0 0.0 0.0 0.0 10.5 3.1 0.0
End-of-period Inventories (million short tons) Primary Inventories (d) ......................... 41.7 41.7 41.1 43.4 42.9 43.0 42.4 44.7 44.7 43.2 40.8 42.8 43.4 44.7 42.8
Secondary Inventories ......................... 123.7 138.9 130.8 146.4 144.6 153.4 137.1 142.7 144.7 151.4 138.2 143.7 146.4 142.7 143.7
Electric Power Sector ........................ 118.0 132.9 124.2 139.3 138.4 146.5 129.6 134.8 137.8 143.8 130.1 135.3 139.3 134.8 135.3
Retail and General Industry .............. 3.5 3.6 4.4 4.8 4.2 4.5 5.1 5.5 4.8 5.0 5.6 5.9 4.8 5.5 5.9
Coke Plants ...................................... 1.8 1.9 1.8 1.9 1.6 2.0 1.9 1.9 1.6 2.0 2.0 2.0 1.9 1.9 2.0
Coal Market Indicators Coal Miner Productivity (Tons per hour) ................................. 5.47 5.47 5.47 5.47 5.61 5.61 5.61 5.61 5.46 5.46 5.46 5.46 5.47 5.61 5.46
Total Raw Steel Production (Million short tons per day) ................ 0.262 0.263 0.271 0.262 0.269 0.281 0.268 0.260 0.275 0.289 0.274 0.264 0.264 0.269 0.275
Cost of Coal to Electric Utilities (Dollars per million Btu) .................... 2.33 2.39 2.37 2.30 2.33 2.34 2.33 2.31 2.34 2.36 2.36 2.32 2.35 2.33 2.34
Table 6. U.S. Coal Supply, Consumption, and InventoriesU.S. Energy Information Administration | Short-Term Energy Outlook - February 2015
2014 2015 2016 Year
Historical data: Latest data available from Energy Information Administration databases supporting the following reports: Quarterly Coal Report , DOE/EIA-0121; and Electric Power Monthly , DOE/EIA-0226.Minor discrepancies with published historical data are due to independent rounding. Projections: EIA Regional Short-Term Energy Model.
- = no data available(a) Waste coal includes waste coal and cloal slurry reprocessed into briquettes.(b) Coal used for electricity generation and (a limited amount of) useful thermal output by electric utilities and independent power producers.(c) The discrepancy reflects an unaccounted-for shipper and receiver reporting difference, assumed to be zero in the forecast period.(d) Primary stocks are held at the mines and distribution points.Notes: The approximate break between historical and forecast values is shown with historical data printed in bold; estimates and forecasts in italics.

1st 2nd 3rd 4th 1st 2nd 3rd 4th 1st 2nd 3rd 4th 2014 2015 2016
Electricity Generation ......................... 11.47 10.75 12.04 10.56 11.19 10.93 12.38 10.74 11.29 11.05 12.47 10.85 11.20 11.31 11.42
Electric Power Sector (a) ................ 11.04 10.34 11.60 10.14 10.76 10.52 11.95 10.32 10.85 10.64 12.03 10.42 10.78 10.89 10.99
Comm. and Indus. Sectors (b) ....... 0.43 0.40 0.43 0.42 0.43 0.41 0.43 0.42 0.44 0.41 0.44 0.43 0.42 0.42 0.43
Net Imports ....................................... 0.11 0.12 0.16 0.15 0.14 0.12 0.14 0.10 0.11 0.11 0.14 0.10 0.13 0.12 0.12
Total Supply ....................................... 11.58 10.87 12.20 10.70 11.33 11.05 12.52 10.83 11.40 11.16 12.61 10.95 11.34 11.44 11.53
Losses and Unaccounted for (c) ...... 0.67 0.84 0.75 0.73 0.64 0.91 0.78 0.72 0.60 0.91 0.78 0.73 0.75 0.76 0.76
Retail Sales ........................................ 10.53 9.67 11.07 9.61 10.31 9.79 11.36 9.74 10.42 9.89 11.44 9.84 10.22 10.30 10.40
Residential Sector ........................... 4.35 3.36 4.26 3.47 4.05 3.38 4.41 3.53 4.11 3.40 4.41 3.57 3.86 3.84 3.87
Commercial Sector ......................... 3.62 3.64 4.06 3.54 3.64 3.69 4.15 3.58 3.65 3.72 4.17 3.59 3.72 3.76 3.78
Industrial Sector .............................. 2.54 2.66 2.73 2.57 2.60 2.70 2.79 2.61 2.64 2.75 2.84 2.66 2.63 2.68 2.72
Transportation Sector ..................... 0.02 0.02 0.02 0.02 0.02 0.02 0.02 0.02 0.02 0.02 0.02 0.02 0.02 0.02 0.02
Direct Use (d) ..................................... 0.38 0.35 0.38 0.37 0.38 0.36 0.38 0.37 0.38 0.36 0.39 0.37 0.37 0.37 0.38
Total Consumption ............................ 10.91 10.03 11.45 9.97 10.69 10.14 11.74 10.11 10.80 10.25 11.83 10.22 10.59 10.67 10.78
Average residential electricity usage per customer (kWh) ................ 3,050 2,377 3,044 2,480 2,824 2,373 3,126 2,494 2,868 2,365 3,095 2,495 10,951 10,817 10,822
Prices
Coal ................................................. 2.33 2.39 2.37 2.30 2.33 2.34 2.33 2.31 2.34 2.36 2.36 2.32 2.35 2.33 2.34
Natural Gas ..................................... 6.82 4.93 4.25 4.37 3.90 3.67 3.86 4.26 4.38 3.97 4.21 4.57 5.00 3.91 4.27
Residual Fuel Oil ............................. 19.95 20.44 19.75 16.19 12.45 10.74 10.56 10.98 11.41 12.39 12.96 13.05 19.38 11.24 12.44
Distillate Fuel Oil .............................. 23.39 22.74 21.88 18.49 14.87 14.88 15.54 17.54 18.37 18.86 18.98 19.60 22.28 15.70 18.91
Residential Sector ........................... 11.90 12.73 13.00 12.35 12.23 12.79 13.05 12.41 12.37 13.01 13.33 12.67 12.49 12.63 12.85
Commercial Sector ......................... 10.57 10.63 11.11 10.60 10.38 10.69 11.16 10.62 10.55 10.87 11.36 10.82 10.74 10.73 10.92
Industrial Sector .............................. 7.02 6.94 7.36 6.77 6.61 6.80 7.28 6.70 6.69 6.90 7.41 6.81 7.03 6.86 6.96
Prices are not adjusted for inflation.
Table 7a. U.S. Electricity Industry OverviewU.S. Energy Information Administration | Short-Term Energy Outlook - February 2015
2014 2015 2016 Year
Electricity Supply (billion kilowatthours per day)
Electricity Consumption (billion kilowatthours per day unless noted)
Power Generation Fuel Costs (dollars per million Btu)
End-Use Prices (cents per kilowatthour)
- = no data available. kWh = kilowatthours. Btu = British thermal units.
Historical data: Latest data available from Energy Information Administration databases supporting the following reports: Electric Power Monthly , DOE/EIA-0226; and Electric Power Annual , DOE/EIA-0348.Minor discrepancies with published historical data are due to independent rounding. Projections: EIA Regional Short-Term Energy Model.
(a) Generation supplied by electricity-only and combined-heat-and-power (CHP) plants operated by electric utilities and independent power producers.(b) Generation supplied by CHP and electricity-only plants operated by businesses in the commercial and industrial sectors, primarily for onsite use.(c) Includes transmission and distribution losses, data collection time-frame differences, and estimation error.(d) Direct Use represents commercial and industrial facility use of onsite net electricity generation; and electrical sales or transfers to adjacent or colocated facilities for which revenue information is not available. See Table 7.6 of the EIA Monthly Energy Review .Notes: The approximate break between historical and forecast values is shown with historical data printed in bold; estimates and forecasts in italics.

1st 2nd 3rd 4th 1st 2nd 3rd 4th 1st 2nd 3rd 4th 2014 2015 2016Residential Sector New England ............... 154 111 136 117 147 114 139 121 145 115 138 124 129 130 130
Middle Atlantic ............. 423 315 383 324 402 318 406 329 398 320 403 333 361 363 364
E. N. Central ................ 616 446 513 481 562 443 559 487 560 444 555 490 514 513 512
W. N. Central ............... 352 246 293 265 321 246 315 270 327 247 314 273 289 288 290
S. Atlantic .................... 1,081 858 1,088 859 1,001 858 1,121 881 1,024 868 1,125 896 971 966 978
E. S. Central ................ 404 278 363 296 362 281 375 293 374 282 375 297 335 328 332
W. S. Central ............... 641 501 729 509 578 521 731 514 589 522 734 519 595 586 591
Mountain ...................... 239 242 320 229 246 243 343 235 253 247 346 239 258 267 271
Pacific contiguous ....... 421 347 420 383 419 340 407 382 426 343 410 386 393 387 391
AK and HI ..................... 14 11 12 13 14 12 12 13 14 12 12 13 13 13 12
Total .......................... 4,345 3,355 4,257 3,474 4,051 3,375 4,408 3,526 4,109 3,399 4,412 3,570 3,857 3,840 3,873
Commercial Sector New England ............... 153 138 154 138 151 138 157 138 148 137 155 136 146 146 144
Middle Atlantic ............. 442 413 461 406 434 414 469 408 439 415 471 408 430 431 433
E. N. Central ................ 510 490 526 483 509 498 545 489 512 503 550 489 502 510 513
W. N. Central ............... 284 273 298 270 282 279 306 272 282 280 308 274 281 285 286
S. Atlantic .................... 803 842 920 795 809 853 936 808 812 862 941 809 840 852 856
E. S. Central ................ 239 237 271 228 239 241 283 232 243 243 288 234 244 249 252
W. S. Central ............... 495 522 609 503 502 536 624 511 501 543 631 513 533 544 547
Mountain ...................... 239 257 287 244 246 262 296 248 248 267 301 252 257 263 267
Pacific contiguous ....... 438 447 515 460 448 453 515 458 447 454 512 462 465 468 469
AK and HI ..................... 17 16 17 17 17 16 17 17 17 16 17 17 16 17 17
Total .......................... 3,620 3,636 4,058 3,545 3,636 3,689 4,147 3,581 3,648 3,721 4,174 3,593 3,715 3,764 3,785
Industrial Sector New England ............... 49 49 52 49 49 49 53 48 49 49 53 48 50 50 50
Middle Atlantic ............. 201 198 205 196 199 197 204 194 205 205 212 201 200 199 206
E. N. Central ................ 525 532 544 521 531 537 547 519 536 545 556 527 531 533 541
W. N. Central ............... 234 240 253 238 245 255 269 251 251 262 276 258 242 255 262
S. Atlantic .................... 372 397 404 384 377 399 404 381 378 404 409 386 389 390 394
E. S. Central ................ 279 287 296 283 297 291 289 284 300 296 294 289 286 290 294
W. S. Central ............... 431 465 471 440 449 480 498 462 452 483 502 465 452 473 475
Mountain ...................... 213 239 250 218 220 242 258 229 226 248 266 236 230 237 244
Pacific contiguous ....... 226 240 244 220 222 236 250 231 226 240 254 235 232 235 239
AK and HI ..................... 13 14 14 14 14 14 14 14 14 14 15 14 14 14 14
Total .......................... 2,543 2,660 2,734 2,565 2,602 2,699 2,787 2,614 2,637 2,747 2,835 2,659 2,626 2,676 2,720
Total All Sectors (a) New England ............... 357 300 344 305 348 302 350 308 344 303 347 309 327 327 326
Middle Atlantic ............. 1,078 936 1,059 937 1,047 941 1,091 943 1,055 952 1,099 956 1,002 1,005 1,015
E. N. Central ................ 1,654 1,469 1,584 1,487 1,603 1,479 1,653 1,497 1,610 1,493 1,662 1,508 1,548 1,558 1,568
W. N. Central ............... 870 760 844 773 849 780 890 794 860 789 898 805 812 828 838
S. Atlantic .................... 2,260 2,100 2,415 2,042 2,190 2,114 2,465 2,073 2,217 2,138 2,480 2,094 2,204 2,211 2,232
E. S. Central ................ 922 803 931 807 898 813 947 809 916 821 957 820 866 867 878
W. S. Central ............... 1,567 1,488 1,811 1,453 1,530 1,538 1,853 1,487 1,542 1,549 1,867 1,497 1,580 1,603 1,614
Mountain ...................... 692 739 857 692 713 748 898 713 728 762 914 726 745 768 783
Pacific contiguous ....... 1,087 1,037 1,181 1,065 1,092 1,030 1,174 1,073 1,101 1,039 1,178 1,085 1,093 1,092 1,101
AK and HI ..................... 44 41 43 44 44 42 43 45 44 42 43 45 43 43 44
Total .......................... 10,531 9,673 11,069 9,606 10,312 9,785 11,364 9,743 10,417 9,888 11,444 9,844 10,219 10,302 10,400
Table 7b. U.S. Regional Electricity Retail Sales (Million Kilowatthours per Day)U.S. Energy Information Administration | Short-Term Energy Outlook - February 2015
2014 2015 2016 Year
Historical data: Latest data available from Energy Information Administration databases supporting the following reports: Electric Power Monthly , DOE/EIA-0226; and Electric Power Annual , DOE/EIA-0348. Minor discrepancies with published historical data are due to independent rounding. Projections: EIA Regional Short-Term Energy Model.
- = no data available(a) Total retail sales to all sectors includes residential, commercial, industrial, and transportation sector sales.Notes: The approximate break between historical and forecast values is shown with historical data printed in bold; estimates and forecasts in italics.Retail Sales represents total retail electricity sales by electric utilities and power marketers. Regions refer to U.S. Census divisions. See "Census division" in EIA’s Energy Glossary (http://www.eia.doe.gov/glossary/index.html) for a list of States in each region.

1st 2nd 3rd 4th 1st 2nd 3rd 4th 1st 2nd 3rd 4th 2014 2015 2016Residential Sector New England .............. 17.46 18.03 17.60 18.17 18.23 18.23 17.77 18.52 17.99 18.33 18.09 18.83 17.78 18.17 18.29
Middle Atlantic ............ 16.28 16.58 16.66 16.02 16.18 16.79 16.91 16.41 16.73 17.34 17.48 16.91 16.39 16.57 17.11
E. N. Central ............... 11.56 12.95 12.98 12.68 12.17 13.09 13.29 12.74 12.55 13.49 13.70 13.10 12.48 12.81 13.20
W. N. Central .............. 10.05 11.80 12.31 10.72 10.42 11.99 12.45 10.94 10.78 12.22 12.67 11.15 11.15 11.44 11.68
S. Atlantic ................... 11.31 11.98 12.13 11.62 11.42 11.91 12.03 11.56 11.45 11.96 12.15 11.68 11.76 11.74 11.82
E. S. Central ............... 10.30 11.21 10.97 10.61 10.59 11.17 11.01 10.59 10.72 11.41 11.26 10.76 10.74 10.84 11.03
W. S. Central .............. 10.37 11.44 11.39 10.96 10.62 11.11 11.21 10.77 10.52 11.25 11.41 10.95 11.04 10.95 11.05
Mountain ..................... 10.94 12.02 12.32 11.33 11.16 12.26 12.61 11.61 11.50 12.64 13.00 11.97 11.71 11.98 12.34
Pacific ......................... 12.97 12.77 15.51 13.12 13.50 13.33 15.63 13.18 13.68 13.50 15.98 13.52 13.65 13.95 14.20
U.S. Average ........... 11.90 12.73 13.00 12.35 12.23 12.79 13.05 12.41 12.37 13.01 13.33 12.67 12.49 12.63 12.85
Commercial Sector New England .............. 15.24 14.07 14.45 14.25 14.74 14.38 14.54 14.30 14.73 14.37 14.54 14.32 14.52 14.49 14.49
Middle Atlantic ............ 14.26 13.28 13.94 12.99 13.23 13.28 14.07 13.16 13.42 13.51 14.34 13.41 13.64 13.45 13.69
E. N. Central ............... 9.69 9.93 10.00 9.81 9.79 10.00 10.03 9.93 9.91 10.12 10.15 10.01 9.86 9.94 10.05
W. N. Central .............. 8.60 9.38 9.86 8.71 8.57 9.47 10.05 8.87 8.80 9.72 10.31 9.09 9.15 9.26 9.50
S. Atlantic ................... 9.83 9.67 9.71 9.68 9.78 9.77 9.90 9.90 9.93 9.92 10.08 10.08 9.72 9.84 10.00
E. S. Central ............... 10.28 10.51 10.40 10.20 10.15 10.36 10.46 10.57 10.46 10.70 10.78 10.84 10.35 10.39 10.70
W. S. Central .............. 8.12 8.29 8.30 8.17 7.76 7.71 7.72 7.54 7.76 7.75 7.82 7.66 8.23 7.68 7.75
Mountain ..................... 9.18 9.82 10.18 9.45 9.17 9.99 10.32 9.58 9.38 10.22 10.56 9.80 9.69 9.80 10.02
Pacific ......................... 11.95 13.14 15.63 13.83 12.27 13.99 16.16 13.79 12.62 14.40 16.64 14.20 13.73 14.14 14.54
U.S. Average ........... 10.57 10.63 11.11 10.60 10.38 10.69 11.16 10.62 10.55 10.87 11.36 10.82 10.74 10.73 10.92
Industrial Sector New England .............. 12.96 11.28 11.39 11.14 11.40 11.03 11.33 10.68 11.33 11.01 11.35 10.70 11.68 11.11 11.10
Middle Atlantic ............ 8.75 7.37 7.28 7.04 7.50 7.31 7.54 7.16 7.49 7.33 7.57 7.19 7.61 7.38 7.40
E. N. Central ............... 7.00 6.83 7.01 6.83 6.76 6.85 7.07 6.91 6.76 6.84 7.05 6.87 6.92 6.90 6.88
W. N. Central .............. 6.56 6.68 7.32 6.33 6.37 6.68 7.35 6.42 6.46 6.78 7.47 6.51 6.73 6.72 6.82
S. Atlantic ................... 6.80 6.68 6.97 6.55 6.39 6.54 6.93 6.50 6.43 6.61 7.00 6.56 6.75 6.60 6.66
E. S. Central ............... 6.18 6.22 6.76 5.76 5.66 5.98 6.66 5.95 5.80 6.14 6.81 6.04 6.24 6.06 6.20
W. S. Central .............. 5.87 6.04 6.34 5.88 5.69 5.75 6.05 5.60 5.95 6.06 6.42 5.94 6.04 5.78 6.10
Mountain ..................... 6.21 6.76 7.37 6.23 6.03 6.59 7.35 6.15 6.11 6.72 7.55 6.35 6.68 6.56 6.72
Pacific ......................... 7.96 8.30 9.60 8.69 7.74 8.24 9.25 8.23 7.66 8.21 9.27 8.26 8.66 8.39 8.38
U.S. Average ........... 7.02 6.94 7.36 6.77 6.61 6.80 7.28 6.70 6.69 6.90 7.41 6.81 7.03 6.86 6.96
All Sectors (a) New England .............. 15.85 15.05 15.20 15.22 15.72 15.26 15.31 15.35 15.60 15.29 15.44 15.52 15.35 15.42 15.47
Middle Atlantic ............ 14.00 13.13 13.63 12.78 13.25 13.19 13.88 13.03 13.49 13.44 14.16 13.29 13.41 13.36 13.61
E. N. Central ............... 9.53 9.72 9.93 9.69 9.61 9.78 10.15 9.79 9.77 9.92 10.29 9.91 9.72 9.84 9.98
W. N. Central .............. 8.64 9.31 9.95 8.66 8.63 9.35 10.08 8.80 8.87 9.53 10.26 8.96 9.14 9.23 9.42
S. Atlantic ................... 10.04 10.05 10.34 9.91 9.95 10.03 10.38 9.98 10.03 10.12 10.51 10.11 10.09 10.10 10.21
E. S. Central ............... 9.05 9.22 9.47 8.79 8.84 9.07 9.52 8.96 9.04 9.30 9.75 9.12 9.14 9.11 9.31
W. S. Central .............. 8.42 8.65 9.04 8.45 8.23 8.25 8.65 8.05 8.28 8.40 8.85 8.27 8.66 8.32 8.47
Mountain ..................... 8.87 9.56 10.16 9.06 8.89 9.63 10.34 9.15 9.11 9.86 10.61 9.40 9.46 9.56 9.80
Pacific ......................... 11.51 11.89 14.33 12.50 11.81 12.45 14.49 12.37 12.00 12.66 14.80 12.66 12.61 12.82 13.07
U.S. Average ........... 10.26 10.34 10.91 10.21 10.15 10.34 10.94 10.22 10.29 10.50 11.14 10.41 10.45 10.43 10.60
Table 7c. U.S. Regional Electricity Prices (Cents per Kilowatthour)U.S. Energy Information Administration | Short-Term Energy Outlook - February 2015
2014 2015 2016 Year
Historical data: Latest data available from Energy Information Administration databases supporting the following reports: Electric Power Monthly , DOE/EIA-0226; and Electric Power Annual , DOE/EIA-0348.Minor discrepancies with published historical data are due to independent rounding. Projections: EIA Regional Short-Term Energy Model.
- = no data availablePrices are not adjusted for inflation.(a) Volume-weighted average of retail prices to residential, commercial, industrial, and transportation sectors.Notes: The approximate break between historical and forecast values is shown with historical data printed in bold; estimates and forecasts in italics.Regions refer to U.S. Census divisions. See "Census division" in EIA’s Energy Glossary (http://www.eia.doe.gov/glossary/index.html) for a list of States in each region.

1st 2nd 3rd 4th 1st 2nd 3rd 4th 1st 2nd 3rd 4th 2014 2015 2016United States Coal ............................................... 4,873 4,037 4,628 3,890 4,380 3,904 4,698 4,099 4,414 3,827 4,643 4,000 4,355 4,271 4,222
Natural Gas ................................... 2,700 2,870 3,702 2,924 2,940 3,051 3,876 2,994 2,962 3,148 3,968 3,108 3,051 3,217 3,298
Petroleum (a) ................................ 147 63 65 57 83 71 77 71 85 72 77 68 83 76 75
Other Gases .................................. 28 29 35 33 28 30 37 34 29 31 38 35 32 32 33
Nuclear .......................................... 2,201 2,060 2,289 2,183 2,182 2,074 2,206 2,055 2,148 2,101 2,235 2,089 2,184 2,129 2,143
Renewable Energy Sources: Conventional Hydropower .......... 703 850 652 639 752 891 723 640 734 860 674 634 711 751 725
Wind ........................................... 553 549 367 550 545 586 433 557 628 670 486 612 504 530 599
Wood Biomass ........................... 116 112 119 117 120 116 125 117 120 118 127 120 116 119 121
Waste Biomass .......................... 51 53 56 56 55 57 59 58 56 58 60 58 54 57 58
Geothermal ................................ 45 45 44 46 46 44 45 45 45 44 45 45 45 45 45
Solar ........................................... 33 61 62 45 43 83 81 47 48 97 100 62 50 64 77
Pumped Storage Hydropower ....... -12 -17 -19 -15 -13 -12 -15 -13 -13 -12 -15 -13 -16 -13 -13
Other Nonrenewable Fuels (b) ...... 31 33 35 33 33 35 36 34 33 35 36 34 33 34 35
Total Generation ........................... 11,470 10,746 12,036 10,557 11,194 10,930 12,381 10,738 11,290 11,047 12,472 10,853 11,202 11,312 11,417
Northeast Census Region Coal ............................................... 359 250 214 195 305 200 249 246 323 191 219 219 254 250 238
Natural Gas ................................... 409 480 627 482 471 516 645 511 471 533 676 540 500 536 555
Petroleum (a) ................................ 55 2 3 3 10 5 6 6 10 5 6 5 16 7 7
Other Gases .................................. 2 2 1 2 2 2 2 2 2 2 2 2 2 2 2
Nuclear .......................................... 542 471 539 532 505 474 504 468 488 477 508 471 521 488 486
Hydropower (c) .............................. 97 104 89 96 106 113 101 98 102 107 94 97 96 104 100
Other Renewables (d) ................... 72 63 60 75 72 64 60 71 75 67 63 75 67 67 70
Other Nonrenewable Fuels (b) ...... 11 12 13 12 11 12 12 12 11 12 12 12 12 12 12
Total Generation ........................... 1,547 1,384 1,545 1,396 1,482 1,385 1,579 1,413 1,483 1,394 1,580 1,421 1,468 1,465 1,469
South Census Region Coal ............................................... 2,122 1,851 2,100 1,620 1,792 1,730 2,028 1,653 1,773 1,665 1,989 1,591 1,922 1,801 1,755
Natural Gas ................................... 1,538 1,722 2,083 1,620 1,733 1,874 2,239 1,684 1,736 1,911 2,257 1,726 1,742 1,883 1,908
Petroleum (a) ................................ 54 28 26 22 34 28 30 27 35 29 31 25 32 30 30
Other Gases .................................. 11 11 14 14 10 12 15 14 11 12 15 15 12 13 13
Nuclear .......................................... 966 882 994 976 969 923 982 920 975 954 1,014 957 955 948 975
Hydropower (c) .............................. 146 103 75 118 156 113 89 121 152 107 83 121 110 120 116
Other Renewables (d) ................... 239 254 201 247 255 279 233 276 308 331 268 308 235 261 304
Other Nonrenewable Fuels (b) ...... 13 13 14 14 14 14 14 14 14 14 15 14 13 14 14
Total Generation ........................... 5,089 4,862 5,507 4,630 4,963 4,973 5,630 4,709 5,003 5,023 5,673 4,757 5,022 5,069 5,114
Midwest Census Region Coal ............................................... 1,805 1,440 1,682 1,517 1,697 1,475 1,784 1,585 1,717 1,466 1,772 1,571 1,610 1,635 1,632
Natural Gas ................................... 194 179 206 182 203 193 251 174 205 214 279 203 190 205 225
Petroleum (a) ................................ 14 13 12 8 13 12 13 11 13 11 12 11 12 12 12
Other Gases .................................. 11 12 14 12 11 12 15 13 11 12 15 13 12 13 13
Nuclear .......................................... 533 543 586 523 546 520 553 513 524 513 545 506 546 533 522
Hydropower (c) .............................. 30 42 41 36 33 46 47 36 32 44 44 36 37 41 39
Other Renewables (d) ................... 251 213 147 254 242 230 166 248 272 259 185 269 216 222 246
Other Nonrenewable Fuels (b) ...... 4 5 5 4 4 5 5 4 4 5 5 4 4 5 5
Total Generation ........................... 2,841 2,446 2,695 2,537 2,749 2,492 2,834 2,584 2,778 2,523 2,858 2,613 2,629 2,665 2,693
West Census Region Coal ............................................... 587 497 632 557 587 499 638 615 601 505 663 620 568 585 597
Natural Gas ................................... 558 489 786 640 533 468 741 625 549 491 754 639 619 592 609
Petroleum (a) ................................ 24 21 24 23 26 26 28 28 28 26 28 28 23 27 27
Other Gases .................................. 5 5 6 6 5 5 6 6 5 5 6 6 5 5 5
Nuclear .......................................... 160 164 170 152 162 156 166 154 161 157 167 155 162 160 160
Hydropower (c) .............................. 418 585 427 374 444 607 472 372 436 590 438 367 451 473 457
Other Renewables (d) ................... 236 290 240 237 239 313 283 228 243 329 302 245 251 266 280
Other Nonrenewable Fuels (b) ...... 4 3 4 3 4 4 4 4 4 4 4 4 4 4 4
Total Generation ........................... 1,992 2,054 2,289 1,993 2,000 2,079 2,339 2,032 2,027 2,107 2,362 2,063 2,083 2,113 2,140
Table 7d. U.S. Regional Electricity Generation, All Sectors (Thousand megawatthours per day) U.S. Energy Information Administration | Short-Term Energy Outlook - February 2015
2014 2015 2016 Year
Historical data: Latest data available from U.S. Energy Information Administration Electric Power Monthly and Electric Power Annual.
Projections: EIA Regional Short-Term Energy Model.
(a) Residual fuel oil, distillate fuel oil, petroleum coke, and other petroleum liquids.(b) Batteries, chemicals, hydrogen, pitch, purchased steam, sulfur, nonrenewable waste, and miscellaneous technologies.(c) Conventional hydroelectric and pumped storage generation.(d) Wind, biomass, geothermal, and solar generation.Notes: Data reflect generation supplied by electricity-only and combined-heat-and-power (CHP) plants operated by electric utilities, independent power producers, andthe commercial and industrial sectors. The approximate break between historical and forecast values is shown with historical data printed in bold; estimates and forecasts in italics.
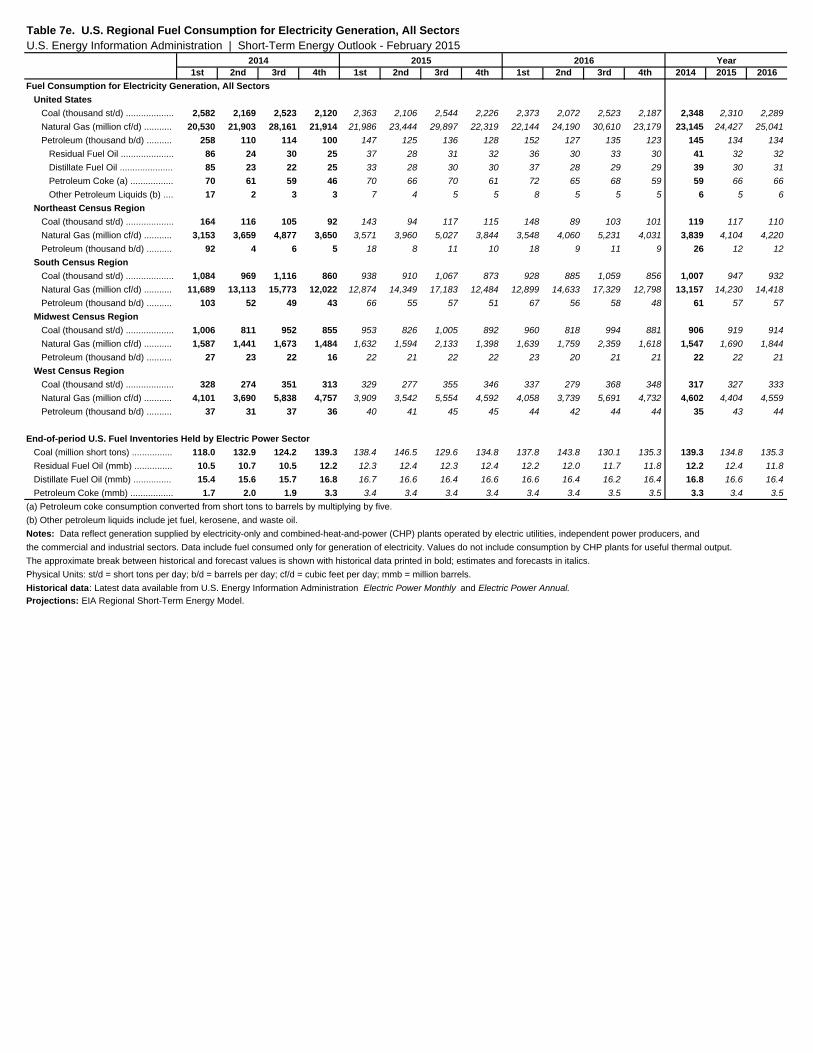
1st 2nd 3rd 4th 1st 2nd 3rd 4th 1st 2nd 3rd 4th 2014 2015 2016Fuel Consumption for Electricity Generation, All Sectors United States Coal (thousand st/d) ................... 2,582 2,169 2,523 2,120 2,363 2,106 2,544 2,226 2,373 2,072 2,523 2,187 2,348 2,310 2,289
Natural Gas (million cf/d) ........... 20,530 21,903 28,161 21,914 21,986 23,444 29,897 22,319 22,144 24,190 30,610 23,179 23,145 24,427 25,041
Petroleum (thousand b/d) .......... 258 110 114 100 147 125 136 128 152 127 135 123 145 134 134
Residual Fuel Oil ..................... 86 24 30 25 37 28 31 32 36 30 33 30 41 32 32
Distillate Fuel Oil ..................... 85 23 22 25 33 28 30 30 37 28 29 29 39 30 31
Petroleum Coke (a) ................. 70 61 59 46 70 66 70 61 72 65 68 59 59 66 66
Other Petroleum Liquids (b) .... 17 2 3 3 7 4 5 5 8 5 5 5 6 5 6
Northeast Census Region Coal (thousand st/d) ................... 164 116 105 92 143 94 117 115 148 89 103 101 119 117 110
Natural Gas (million cf/d) ........... 3,153 3,659 4,877 3,650 3,571 3,960 5,027 3,844 3,548 4,060 5,231 4,031 3,839 4,104 4,220
Petroleum (thousand b/d) .......... 92 4 6 5 18 8 11 10 18 9 11 9 26 12 12
South Census Region Coal (thousand st/d) ................... 1,084 969 1,116 860 938 910 1,067 873 928 885 1,059 856 1,007 947 932
Natural Gas (million cf/d) ........... 11,689 13,113 15,773 12,022 12,874 14,349 17,183 12,484 12,899 14,633 17,329 12,798 13,157 14,230 14,418
Petroleum (thousand b/d) .......... 103 52 49 43 66 55 57 51 67 56 58 48 61 57 57
Midwest Census Region Coal (thousand st/d) ................... 1,006 811 952 855 953 826 1,005 892 960 818 994 881 906 919 914
Natural Gas (million cf/d) ........... 1,587 1,441 1,673 1,484 1,632 1,594 2,133 1,398 1,639 1,759 2,359 1,618 1,547 1,690 1,844
Petroleum (thousand b/d) .......... 27 23 22 16 22 21 22 22 23 20 21 21 22 22 21
West Census Region Coal (thousand st/d) ................... 328 274 351 313 329 277 355 346 337 279 368 348 317 327 333
Natural Gas (million cf/d) ........... 4,101 3,690 5,838 4,757 3,909 3,542 5,554 4,592 4,058 3,739 5,691 4,732 4,602 4,404 4,559
Petroleum (thousand b/d) .......... 37 31 37 36 40 41 45 45 44 42 44 44 35 43 44
End-of-period U.S. Fuel Inventories Held by Electric Power Sector Coal (million short tons) ................ 118.0 132.9 124.2 139.3 138.4 146.5 129.6 134.8 137.8 143.8 130.1 135.3 139.3 134.8 135.3
Residual Fuel Oil (mmb) ............... 10.5 10.7 10.5 12.2 12.3 12.4 12.3 12.4 12.2 12.0 11.7 11.8 12.2 12.4 11.8
Distillate Fuel Oil (mmb) ............... 15.4 15.6 15.7 16.8 16.7 16.6 16.4 16.6 16.6 16.4 16.2 16.4 16.8 16.6 16.4
Petroleum Coke (mmb) ................. 1.7 2.0 1.9 3.3 3.4 3.4 3.4 3.4 3.4 3.4 3.5 3.5 3.3 3.4 3.5
Table 7e. U.S. Regional Fuel Consumption for Electricity Generation, All SectorsU.S. Energy Information Administration | Short-Term Energy Outlook - February 2015
2014 2015 2016 Year
Historical data: Latest data available from U.S. Energy Information Administration Electric Power Monthly and Electric Power Annual.
Projections: EIA Regional Short-Term Energy Model.
(a) Petroleum coke consumption converted from short tons to barrels by multiplying by five.(b) Other petroleum liquids include jet fuel, kerosene, and waste oil.Notes: Data reflect generation supplied by electricity-only and combined-heat-and-power (CHP) plants operated by electric utilities, independent power producers, andthe commercial and industrial sectors. Data include fuel consumed only for generation of electricity. Values do not include consumption by CHP plants for useful thermal output.The approximate break between historical and forecast values is shown with historical data printed in bold; estimates and forecasts in italics.Physical Units: st/d = short tons per day; b/d = barrels per day; cf/d = cubic feet per day; mmb = million barrels.

1st 2nd 3rd 4th 1st 2nd 3rd 4th 1st 2nd 3rd 4th 2014 2015 2016Electric Power Sector Hydroelectric Power (a) ........................ 0.595 0.731 0.565 0.552 0.637 0.766 0.627 0.553 0.628 0.739 0.585 0.547 2.442 2.583 2.499
Wood Biomass (b) ................................. 0.065 0.059 0.064 0.065 0.067 0.060 0.073 0.066 0.068 0.061 0.075 0.068 0.253 0.267 0.272
Waste Biomass (c) ................................ 0.061 0.062 0.066 0.067 0.065 0.068 0.072 0.070 0.067 0.069 0.072 0.070 0.255 0.274 0.278
Wind ...................................................... 0.473 0.475 0.321 0.481 0.467 0.507 0.378 0.487 0.544 0.580 0.425 0.536 1.750 1.839 2.084
Geothermal .......................................... 0.038 0.039 0.039 0.040 0.039 0.038 0.039 0.039 0.039 0.038 0.039 0.039 0.156 0.156 0.156
Solar ...................................................... 0.028 0.051 0.053 0.038 0.036 0.071 0.070 0.040 0.041 0.082 0.087 0.053 0.171 0.217 0.263
Subtotal .............................................. 1.260 1.417 1.108 1.204 1.311 1.510 1.259 1.256 1.387 1.569 1.282 1.314 4.989 5.336 5.552
Industrial Sector Hydroelectric Power (a) ........................ 0.008 0.005 0.005 0.007 0.006 0.006 0.006 0.006 0.006 0.006 0.006 0.006 0.025 0.024 0.025
Wood Biomass (b) ................................. 0.305 0.317 0.326 0.319 0.300 0.291 0.304 0.308 0.298 0.293 0.307 0.311 1.267 1.203 1.209
Waste Biomass (c) ................................ 0.042 0.042 0.042 0.044 0.043 0.040 0.043 0.042 0.043 0.041 0.044 0.043 0.170 0.169 0.171
Geothermal .......................................... 0.001 0.001 0.001 0.001 0.001 0.001 0.001 0.001 0.001 0.001 0.001 0.001 0.004 0.004 0.004
Biofuel Losses and Co-products (f) ...... 0.188 0.197 0.197 0.201 0.193 0.194 0.200 0.201 0.190 0.195 0.201 0.202 0.784 0.789 0.789
Subtotal .............................................. 0.547 0.567 0.577 0.576 0.547 0.537 0.560 0.562 0.543 0.540 0.564 0.567 2.267 2.206 2.215
Commercial Sector Wood Biomass (b) ................................. 0.018 0.018 0.018 0.019 0.018 0.017 0.018 0.018 0.018 0.017 0.019 0.018 0.072 0.071 0.072
Waste Biomass (c) ................................ 0.011 0.011 0.011 0.012 0.012 0.011 0.012 0.011 0.012 0.011 0.012 0.012 0.045 0.046 0.046
Geothermal .......................................... 0.005 0.005 0.005 0.005 0.005 0.005 0.005 0.005 0.005 0.005 0.005 0.005 0.020 0.020 0.020
Subtotal .............................................. 0.035 0.036 0.036 0.037 0.036 0.034 0.036 0.035 0.036 0.034 0.036 0.036 0.144 0.140 0.142
Residential Sector Wood Biomass (b) ................................. 0.143 0.145 0.146 0.146 0.141 0.142 0.144 0.144 0.141 0.142 0.144 0.144 0.580 0.571 0.571
Geothermal .......................................... 0.010 0.010 0.010 0.010 0.010 0.010 0.010 0.010 0.010 0.010 0.010 0.010 0.040 0.040 0.040
Solar (d) ................................................. 0.062 0.063 0.063 0.063 0.075 0.076 0.076 0.076 0.075 0.076 0.076 0.076 0.252 0.303 0.303
Subtotal .............................................. 0.215 0.217 0.220 0.220 0.226 0.228 0.230 0.230 0.226 0.228 0.230 0.230 0.871 0.914 0.914
Transportation Sector Ethanol (e) ............................................. 0.256 0.276 0.277 0.280 0.258 0.270 0.277 0.272 0.252 0.270 0.278 0.275 1.089 1.078 1.075
Biodiesel (e) ........................................... 0.040 0.048 0.055 0.050 0.047 0.049 0.050 0.051 0.047 0.049 0.049 0.051 0.194 0.196 0.196
Subtotal .............................................. 0.296 0.324 0.332 0.331 0.305 0.319 0.326 0.323 0.299 0.319 0.326 0.326 1.283 1.274 1.270
All Sectors Total Hydroelectric Power (a) ........................ 0.602 0.736 0.571 0.558 0.643 0.772 0.634 0.559 0.634 0.745 0.591 0.554 2.467 2.608 2.524
Wood Biomass (b) ................................. 0.530 0.539 0.554 0.550 0.526 0.512 0.540 0.536 0.526 0.514 0.544 0.541 2.173 2.113 2.125
Waste Biomass (c) ................................ 0.114 0.115 0.119 0.123 0.119 0.119 0.127 0.123 0.122 0.121 0.128 0.124 0.472 0.489 0.495
Wind ...................................................... 0.473 0.475 0.321 0.481 0.467 0.507 0.378 0.487 0.544 0.580 0.425 0.536 1.750 1.839 2.084
Geothermal .......................................... 0.054 0.055 0.055 0.056 0.055 0.054 0.055 0.055 0.055 0.054 0.055 0.055 0.219 0.220 0.220
Solar ...................................................... 0.091 0.116 0.118 0.102 0.112 0.147 0.147 0.117 0.117 0.159 0.164 0.131 0.426 0.524 0.571
Ethanol (e) ............................................. 0.260 0.281 0.282 0.282 0.260 0.275 0.282 0.277 0.256 0.275 0.283 0.280 1.105 1.094 1.094
Biodiesel (e) ........................................... 0.040 0.048 0.055 0.050 0.047 0.049 0.050 0.051 0.047 0.049 0.049 0.051 0.194 0.196 0.196
Biofuel Losses and Co-products (f) ...... 0.188 0.197 0.197 0.201 0.193 0.194 0.200 0.201 0.190 0.195 0.201 0.202 0.784 0.789 0.789
Total Consumption ................................. 2.354 2.561 2.272 2.367 2.424 2.628 2.411 2.406 2.490 2.690 2.439 2.473 9.554 9.870 10.092
(e) Fuel ethanol and biodiesel consumption in the transportation sector includes production, stock change, and imports less exports. Some biodiesel may be consumed in the residential sector in
Table 8. U.S. Renewable Energy Consumption (Quadrillion Btu)U.S. Energy Information Administration | Short-Term Energy Outlook - February 2015
2014 2015 2016 Year
- = no data available(a) Conventional hydroelectric power only. Hydroelectricity generated by pumped storage is not included in renewable energy.(b) Wood and wood-derived fuels.(c) Municipal solid waste from biogenic sources, landfill gas, sludge waste, agricultural byproducts, and other biomass.(d) Includes small-scale solar thermal and photovoltaic energy used in the commercial, industrial, and electric power sectors.
(f) Losses and co-products from the production of fuel ethanol and biodiesel
Notes: The approximate break between historical and forecast values is shown with historical data printed in bold; estimates and forecasts in italics.Historical data: Latest data available from EIA databases supporting the following reports: Electric Power Monthly, DOE/EIA-0226 and Renewable Energy Annual, DOE/EIA-0603; Petroleum Supply Monthly, DOE/EIA-0109. Minor discrepancies with published historical data are due to independent rounding. Projections: EIA Regional Short-Term Energy Model.

1st 2nd 3rd 4th 1st 2nd 3rd 4th 1st 2nd 3rd 4th 2014 2015 2016MacroeconomicReal Gross Domestic Product (billion chained 2009 dollars - SAAR) ........ 15,832 16,010 16,206 16,307 16,439 16,542 16,647 16,734 16,825 16,940 17,066 17,202 16,089 16,590 17,008
Real Personal Consumption Expend. (billion chained 2009 dollars - SAAR) ........ 10,844 10,913 11,000 11,114 11,207 11,303 11,401 11,480 11,556 11,630 11,710 11,797 10,968 11,348 11,673
Real Fixed Investment (billion chained 2009 dollars - SAAR) ........ 2,536 2,595 2,643 2,668 2,709 2,743 2,786 2,828 2,873 2,926 2,970 3,024 2,610 2,766 2,948
Business Inventory Change (billion chained 2009 dollars - SAAR) ........ 40 100 95 108 101 88 77 65 52 49 52 59 86 83 53
Real Government Expenditures (billion chained 2009 dollars - SAAR) ........ 2,869 2,881 2,912 2,889 2,897 2,902 2,908 2,912 2,913 2,916 2,918 2,919 2,888 2,905 2,917
Real Exports of Goods & Services (billion chained 2009 dollars - SAAR) ........ 2,027 2,081 2,104 2,126 2,143 2,157 2,174 2,190 2,205 2,224 2,247 2,269 2,084 2,166 2,236
Real Imports of Goods & Services (billion chained 2009 dollars - SAAR) ........ 2,474 2,541 2,535 2,581 2,606 2,640 2,689 2,734 2,766 2,796 2,822 2,856 2,533 2,667 2,810
Real Disposable Personal Income (billion chained 2009 dollars - SAAR) ........ 11,810 11,900 11,960 12,063 12,247 12,302 12,362 12,412 12,492 12,582 12,701 12,824 11,933 12,331 12,650
Non-Farm Employment (millions) .................................................. 137.8 138.5 139.2 140.1 140.7 141.5 142.1 142.7 143.3 143.9 144.4 145.0 138.9 141.8 144.2
Civilian Unemployment Rate (percent) .................................................. 6.6 6.2 6.1 5.7 5.6 5.5 5.4 5.3 5.3 5.3 5.2 5.2 6.2 5.4 5.2
Housing Starts (millions - SAAR) ....................................... 0.93 0.99 1.03 1.04 1.08 1.15 1.18 1.24 1.26 1.30 1.33 1.42 0.99 1.16 1.33
Industrial Production Indices (Index, 2007=100)Total Industrial Production ........................... 102.2 103.7 104.7 106.1 106.8 107.4 108.0 108.8 109.6 110.7 111.9 113.2 104.2 107.7 111.4
Manufacturing .......................................... 99.4 101.2 102.4 103.8 104.8 105.8 106.6 107.5 108.2 109.0 110.1 111.3 101.7 106.2 109.6
Food .................................................... 106.1 106.5 105.6 107.2 108.1 108.8 109.4 110.1 110.8 111.5 112.3 113.0 106.3 109.1 111.9
Paper ................................................... 82.4 83.3 82.7 83.0 83.5 84.1 84.4 84.8 84.9 85.2 85.5 86.0 82.8 84.2 85.4
Petroleum and Coal Products ................ 97.7 98.2 98.9 99.6 99.9 100.1 100.4 100.7 100.9 101.0 101.3 101.6 98.6 100.3 101.2
Chemicals ............................................. 87.7 88.4 90.1 92.3 93.3 94.3 94.8 95.4 96.0 96.7 97.5 98.6 89.6 94.4 97.2
Nonmetallic Mineral Products ................ 75.5 77.4 80.0 79.6 80.7 81.9 83.2 84.7 86.2 87.7 89.2 90.7 78.1 82.6 88.5
Primary Metals ...................................... 101.9 106.2 108.4 108.2 109.7 111.3 111.7 113.1 113.5 114.6 115.7 117.4 106.2 111.4 115.3
Coal-weighted Manufacturing (a) .............. 91.8 93.7 94.7 95.2 96.1 97.2 97.7 98.6 99.2 100.0 100.8 102.0 93.8 97.4 100.5
Distillate-weighted Manufacturing (a) ........ 92.3 93.9 95.0 95.8 96.5 97.4 98.1 99.1 99.8 100.6 101.5 102.4 94.2 97.8 101.1
Electricity-weighted Manufacturing (a) ....... 97.1 99.1 100.2 101.2 102.2 103.4 104.1 105.1 105.8 106.6 107.6 108.9 99.4 103.7 107.2
Natural Gas-weighted Manufacturing (a) ... 93.6 94.6 95.8 96.9 97.8 98.9 99.3 100.1 100.6 101.4 102.3 103.7 95.2 99.0 102.0
Price IndexesConsumer Price Index (all urban consumers) (index, 1982-1984=1.00) ............................ 2.35 2.37 2.38 2.37 2.35 2.36 2.37 2.39 2.41 2.43 2.44 2.45 2.37 2.37 2.43
Producer Price Index: All Commodities (index, 1982=1.00) .................................... 2.06 2.07 2.07 2.03 1.96 1.97 1.99 2.01 2.04 2.05 2.06 2.07 2.06 1.98 2.05
Producer Price Index: Petroleum (index, 1982=1.00) .................................... 2.88 2.99 2.90 2.29 1.58 1.70 1.81 1.89 2.04 2.23 2.23 2.11 2.77 1.75 2.15
GDP Implicit Price Deflator (index, 2009=100) ..................................... 107.7 108.3 108.6 109.1 109.5 110.1 110.6 111.2 111.9 112.4 112.8 113.3 108.4 110.4 112.6
MiscellaneousVehicle Miles Traveled (b) (million miles/day) ...................................... 7,640 8,616 8,547 8,171 7,909 8,755 8,667 8,309 7,942 8,810 8,709 8,364 8,246 8,412 8,457
Air Travel Capacity (Available ton-miles/day, thousands) .......... 503 545 558 525 516 548 553 529 520 552 556 531 533 537 540
Aircraft Utilization (Revenue ton-miles/day, thousands) .......... 310 345 351 328 320 352 355 331 324 355 358 335 334 339 343
Airline Ticket Price Index (index, 1982-1984=100) ............................. 297.3 334.3 301.0 298.2 284.3 301.6 294.6 299.2 301.7 322.4 314.3 316.1 307.7 294.9 313.6
Raw Steel Production (million short tons per day) ........................ 0.262 0.263 0.271 0.262 0.269 0.281 0.268 0.260 0.275 0.289 0.274 0.264 0.264 0.269 0.275
Carbon Dioxide (CO 2) Emissions (million metric tons)Petroleum ................................................... 548 556 568 573 553 565 574 575 561 567 576 575 2,245 2,267 2,278
Natural Gas ................................................. 461 298 304 374 447 308 319 382 452 313 325 388 1,437 1,457 1,478
Coal ............................................................ 462 397 459 399 426 386 466 413 433 381 463 407 1,717 1,690 1,683
Total Fossil Fuels ........................................ 1,471 1,251 1,332 1,346 1,426 1,260 1,359 1,370 1,446 1,261 1,363 1,370 5,399 5,414 5,440
SAAR = Seasonally-adjusted annual rate
Table 9a. U.S. Macroeconomic Indicators and CO2 EmissionsU.S. Energy Information Administration | Short-Term Energy Outlook - February 2015
2014 2015 2016 Year
Projections: EIA Regional Short-Term Energy Model. Macroeconomic projections are based on Global Insight Model of the U.S. Economy.
- = no data available
(a) Fuel share weights of individual sector indices based on EIA Manufacturing Energy Consumption Survey .(b) Total highway travel includes gasoline and diesel fuel vehicles.Notes: The approximate break between historical and forecast values is shown with historical data printed in bold; estimates and forecasts in italics.Historical data : Latest data available from U.S. Department of Commerce, Bureau of Economic Analysis; Federal Reserve System, Statistical release G17; Federal Highway Administration;and Federal Aviation Administration. Minor discrepancies with published historical data are due to independent rounding.

1st 2nd 3rd 4th 1st 2nd 3rd 4th 1st 2nd 3rd 4th 2014 2015 2016Real Gross State Product (Billion $2009) New England ................ 858 865 875 879 885 890 895 898 902 907 913 919 869 892 911
Middle Atlantic .............. 2,365 2,386 2,410 2,414 2,428 2,442 2,457 2,470 2,481 2,494 2,508 2,524 2,394 2,449 2,502
E. N. Central ................. 2,186 2,207 2,229 2,239 2,253 2,263 2,275 2,286 2,296 2,307 2,320 2,335 2,215 2,269 2,315
W. N. Central ................ 1,031 1,042 1,055 1,061 1,069 1,076 1,083 1,088 1,094 1,100 1,108 1,117 1,047 1,079 1,105
S. Atlantic ...................... 2,807 2,841 2,872 2,892 2,916 2,937 2,959 2,976 2,994 3,016 3,039 3,065 2,853 2,947 3,029
E. S. Central ................. 724 732 742 746 752 756 761 765 769 773 779 784 736 758 776
W. S. Central ................ 1,936 1,966 1,998 2,020 2,041 2,052 2,060 2,070 2,084 2,104 2,124 2,147 1,980 2,056 2,115
Mountain ....................... 1,028 1,041 1,055 1,064 1,077 1,084 1,092 1,098 1,105 1,115 1,125 1,135 1,047 1,088 1,120
Pacific ........................... 2,821 2,855 2,894 2,915 2,942 2,964 2,986 3,003 3,021 3,043 3,069 3,095 2,871 2,974 3,057
Industrial Output, Manufacturing (Index, Year 2007=100) New England ................ 96.6 98.1 98.9 99.9 100.7 101.6 102.3 102.9 103.4 104.1 105.0 106.0 98.4 101.9 104.6
Middle Atlantic .............. 94.1 94.9 95.3 96.6 97.5 98.3 99.1 99.8 100.4 101.2 102.1 103.2 95.2 98.7 101.7
E. N. Central ................. 101.6 103.1 104.7 106.5 107.5 108.5 109.4 110.3 111.2 112.0 113.1 114.3 104.0 108.9 112.7
W. N. Central ................ 102.8 104.7 105.6 107.2 108.0 109.1 110.0 110.9 111.7 112.5 113.6 114.9 105.1 109.5 113.2
S. Atlantic ...................... 94.9 96.7 97.9 99.6 100.5 101.5 102.2 103.0 103.6 104.4 105.2 106.3 97.3 101.8 104.9
E. S. Central ................. 97.0 98.8 100.7 102.2 103.4 104.5 105.4 106.3 107.0 107.9 108.8 109.9 99.7 104.9 108.4
W. S. Central ................ 104.7 106.9 108.4 109.8 110.7 111.7 112.5 113.4 114.1 115.0 116.2 117.6 107.4 112.1 115.7
Mountain ....................... 101.5 103.8 105.0 106.1 107.4 108.5 109.7 110.8 111.6 112.7 114.0 115.4 104.1 109.1 113.4
Pacific ........................... 100.0 101.5 102.5 103.9 104.9 105.7 106.5 107.3 107.9 108.7 109.7 110.9 101.9 106.1 109.3
Real Personal Income (Billion $2009) New England ................ 759 761 765 773 787 791 795 798 803 809 815 822 765 792 812
Middle Atlantic .............. 2,036 2,038 2,053 2,071 2,105 2,114 2,123 2,134 2,151 2,162 2,178 2,198 2,049 2,119 2,172
E. N. Central ................. 1,854 1,864 1,873 1,890 1,922 1,932 1,940 1,947 1,961 1,972 1,986 2,001 1,870 1,935 1,980
W. N. Central ................ 873 882 884 893 910 916 921 926 933 939 947 955 883 918 944
S. Atlantic ...................... 2,476 2,495 2,508 2,534 2,581 2,599 2,615 2,629 2,653 2,675 2,700 2,728 2,503 2,606 2,689
E. S. Central ................. 653 657 660 665 677 681 684 687 693 698 703 709 659 682 700
W. S. Central ................ 1,544 1,557 1,570 1,588 1,618 1,630 1,640 1,649 1,663 1,679 1,696 1,715 1,565 1,634 1,688
Mountain ....................... 868 873 879 888 905 912 918 923 931 940 950 961 877 914 946
Pacific ........................... 2,325 2,345 2,359 2,384 2,429 2,446 2,461 2,475 2,495 2,517 2,542 2,568 2,353 2,453 2,530
Households (Thousands) New England ................ 5,754 5,756 5,756 5,762 5,767 5,771 5,777 5,785 5,793 5,803 5,815 5,827 5,762 5,785 5,827
Middle Atlantic .............. 15,806 15,810 15,806 15,822 15,834 15,839 15,851 15,868 15,885 15,913 15,943 15,974 15,822 15,868 15,974
E. N. Central ................. 18,527 18,532 18,521 18,530 18,538 18,541 18,554 18,576 18,600 18,634 18,671 18,709 18,530 18,576 18,709
W. N. Central ................ 8,391 8,403 8,410 8,426 8,442 8,454 8,470 8,488 8,507 8,532 8,558 8,585 8,426 8,488 8,585
S. Atlantic ...................... 24,163 24,221 24,264 24,342 24,417 24,485 24,563 24,653 24,745 24,852 24,965 25,080 24,342 24,653 25,080
E. S. Central ................. 7,431 7,434 7,432 7,440 7,447 7,452 7,460 7,472 7,487 7,507 7,528 7,550 7,440 7,472 7,550
W. S. Central ................ 14,068 14,111 14,141 14,190 14,236 14,278 14,323 14,374 14,427 14,488 14,553 14,617 14,190 14,374 14,617
Mountain ....................... 8,582 8,604 8,624 8,655 8,685 8,711 8,741 8,775 8,810 8,854 8,901 8,949 8,655 8,775 8,949
Pacific ........................... 18,149 18,198 18,235 18,294 18,347 18,395 18,445 18,499 18,560 18,630 18,699 18,770 18,294 18,499 18,770
Total Non-farm Employment (Millions) New England ................ 7.1 7.1 7.1 7.2 7.2 7.2 7.3 7.3 7.3 7.3 7.3 7.4 7.1 7.2 7.3
Middle Atlantic .............. 18.6 18.7 18.8 18.8 18.8 18.9 19.0 19.1 19.1 19.2 19.2 19.3 18.7 19.0 19.2
E. N. Central ................. 21.0 21.0 21.1 21.2 21.3 21.4 21.5 21.5 21.6 21.7 21.7 21.8 21.1 21.4 21.7
W. N. Central ................ 10.3 10.4 10.4 10.5 10.5 10.6 10.6 10.6 10.7 10.7 10.8 10.8 10.4 10.6 10.7
S. Atlantic ...................... 26.1 26.2 26.4 26.6 26.7 26.9 27.1 27.2 27.3 27.5 27.6 27.7 26.3 27.0 27.5
E. S. Central ................. 7.6 7.7 7.7 7.8 7.8 7.8 7.9 7.9 7.9 8.0 8.0 8.0 7.7 7.8 8.0
W. S. Central ................ 16.2 16.3 16.5 16.6 16.7 16.8 16.8 16.9 17.0 17.1 17.2 17.3 16.4 16.8 17.1
Mountain ....................... 9.7 9.7 9.8 9.9 9.9 10.0 10.1 10.1 10.2 10.2 10.3 10.3 9.8 10.0 10.2
Pacific ........................... 21.0 21.1 21.2 21.4 21.5 21.6 21.8 21.8 21.9 22.0 22.1 22.2 21.2 21.7 22.1
Table 9b. U.S. Regional Macroeconomic DataU.S. Energy Information Administration | Short-Term Energy Outlook - February 2015
2014 2015 2016 Year
Projections: Macroeconomic projections are based on the Global Insight Model of the U.S. Economy.
- = no data availableNotes: The approximate break between historical and forecast values is shown with historical data printed in bold; estimates and forecasts in italics.Regions refer to U.S. Census divisions. See "Census division" in EIA’s Energy Glossary (http://www.eia.doe.gov/glossary/index.html) for a list of States in each region.Historical data: Latest data available from U.S. Department of Commerce, Bureau of Economic Analysis; Federal Reserve System, Statistical release G17.Minor discrepancies with published historical data are due to independent rounding.

1st 2nd 3rd 4th 1st 2nd 3rd 4th 1st 2nd 3rd 4th 2014 2015 2016Heating Degree Days New England ................. 3,566 884 146 2,076 3,264 867 137 2,198 3,197 872 137 2,198 6,672 6,466 6,405
Middle Atlantic ............... 3,442 706 100 1,964 3,018 683 90 1,995 2,930 687 90 1,995 6,212 5,786 5,703
E. N. Central .................. 3,932 726 168 2,359 3,205 723 129 2,256 3,148 727 129 2,256 7,185 6,312 6,260
W. N. Central ................. 3,862 754 177 2,503 3,175 680 154 2,437 3,221 683 154 2,437 7,295 6,446 6,495
South Atlantic ................ 1,712 196 14 1,036 1,463 211 16 1,004 1,469 212 16 1,002 2,958 2,693 2,699
E. S. Central .................. 2,271 231 18 1,407 1,886 265 22 1,332 1,864 265 22 1,332 3,926 3,505 3,484
W. S. Central ................. 1,485 93 4 845 1,308 97 5 822 1,171 89 5 822 2,426 2,232 2,087
Mountain ........................ 2,128 714 152 1,746 2,117 656 137 1,813 2,167 654 137 1,812 4,739 4,723 4,771
Pacific ............................ 1,253 468 57 982 1,195 474 78 1,114 1,379 499 78 1,114 2,761 2,860 3,070
U.S. Average ............. 2,451 480 80 1,536 2,124 472 75 1,537 2,118 477 74 1,535 4,548 4,208 4,204
Heating Degree Days, Prior 10-year Average New England ................. 3,152 836 134 2,167 3,166 838 134 2,146 3,154 829 140 2,145 6,289 6,285 6,267
Middle Atlantic ............... 2,905 660 88 1,983 2,936 667 90 1,976 2,927 658 95 1,971 5,636 5,668 5,651
E. N. Central .................. 3,117 690 120 2,243 3,192 694 123 2,261 3,198 695 131 2,256 6,170 6,271 6,280
W. N. Central ................. 3,209 686 149 2,404 3,273 691 150 2,432 3,278 696 156 2,439 6,449 6,545 6,569
South Atlantic ................ 1,465 194 14 1,006 1,481 196 14 1,012 1,480 191 15 1,009 2,679 2,703 2,695
E. S. Central .................. 1,810 236 19 1,336 1,853 236 19 1,358 1,873 233 20 1,352 3,402 3,466 3,478
W. S. Central ................. 1,157 85 5 827 1,189 86 5 834 1,212 86 5 835 2,075 2,113 2,138
Mountain ........................ 2,267 728 156 1,887 2,259 730 151 1,871 2,253 720 148 1,872 5,038 5,011 4,994
Pacific ............................ 1,554 625 96 1,236 1,533 621 92 1,205 1,505 604 88 1,203 3,511 3,452 3,400
U.S. Average ............. 2,161 492 77 1,569 2,183 493 77 1,567 2,177 486 79 1,563 4,298 4,319 4,305
Cooling Degree Days New England ................. 0 75 341 0 0 86 409 0 0 86 409 0 417 495 495
Middle Atlantic ............... 0 154 430 6 0 164 554 5 0 164 554 5 590 724 724
E. N. Central .................. 0 232 377 3 0 218 543 8 0 218 543 8 612 768 768
W. N. Central ................. 0 263 539 12 3 274 683 11 3 274 682 11 813 971 970
South Atlantic ................ 109 644 1,063 197 108 615 1,138 227 114 616 1,138 227 2,013 2,088 2,096
E. S. Central .................. 6 504 921 65 21 493 1,038 67 27 493 1,038 67 1,496 1,619 1,625
W. S. Central ................. 34 776 1,437 218 58 820 1,473 195 84 831 1,474 196 2,465 2,547 2,585
Mountain ........................ 31 439 873 96 19 444 969 87 21 446 969 87 1,439 1,519 1,524
Pacific ............................ 39 224 687 111 29 203 588 74 31 202 587 74 1,062 895 895
U.S. Average ............. 34 393 774 96 36 390 845 93 41 392 846 94 1,298 1,364 1,374
Cooling Degree Days, Prior 10-year Average New England ................. 0 83 417 1 0 85 419 1 0 82 412 1 500 505 495
Middle Atlantic ............... 0 167 558 5 0 168 557 5 0 165 542 6 730 730 714
E. N. Central .................. 3 230 546 6 3 234 545 6 3 228 532 6 785 787 770
W. N. Central ................. 7 277 678 9 7 282 683 9 7 280 676 9 972 981 972
South Atlantic ................ 110 636 1,154 213 110 635 1,155 210 111 645 1,142 211 2,112 2,110 2,109
E. S. Central .................. 35 528 1,045 57 33 526 1,053 52 32 533 1,040 53 1,666 1,664 1,658
W. S. Central ................. 102 882 1,506 190 94 883 1,518 183 91 886 1,508 184 2,680 2,678 2,668
Mountain ........................ 18 420 922 70 17 424 930 75 18 431 936 76 1,431 1,446 1,461
Pacific ............................ 26 166 589 58 26 170 601 65 27 178 602 67 839 862 874
U.S. Average ............. 41 393 843 83 41 396 849 84 41 399 842 85 1,361 1,369 1,366
Table 9c. U.S. Regional Weather DataU.S. Energy Information Administration | Short-Term Energy Outlook - February 2015
2014 2015 2016 Year
Historical data: Latest data available from U.S. Department of Commerce, National Oceanic and Atmospheric Association (NOAA).Projections: Based on forecasts by the NOAA Climate Prediction Center (http://www.cpc.ncep.noaa.gov/pacdir/DDdir/NHOME3.shtml).
- = no data availableNotes: Regional degree days for each period are calculated by EIA as contemporaneous period population-weighted averages ofstate degree day data published by the National Oceanic and Atmospheric Administration (NOAA).See Change in Regional and U.S. Degree-Day Calculations (http://www.eia.gov/forecasts/steo/special/pdf/2012_sp_04.pdf) for more information.The approximate break between historical and forecast values is shown with historical data printed in bold; estimates and forecasts in italics.Regions refer to U.S. Census divisions. See "Census division" in EIA’s Energy Glossary (http://www.eia.gov/tools/glossary/) for a list of states in each region.