Embed Size (px)
Citation preview
Short-Term Energy and Summer Fuels Outlook
Guy CarusoAdministrator,
Energy Information Administration
2006 Summer Transportation Fuels Outlook Conference
April 11, 2006Washington, DC
Several Key Factors Drive the Short-Term Fuels Forecast
1) Rising world oil consumption;
2) Low global surplus production capacity and tight crude oil supply relative to demand;
3) Supply concerns in international oil markets (such as in Nigeria, Iraq, and Iran);
4) The challenges of: Stricter sulfur standards under the Tier 2 Gasoline program; MTBE phase-out; A shift to ultra low sulfur diesel.
All these factors contribute to higher prices for petroleum products, particularly in the coming months.
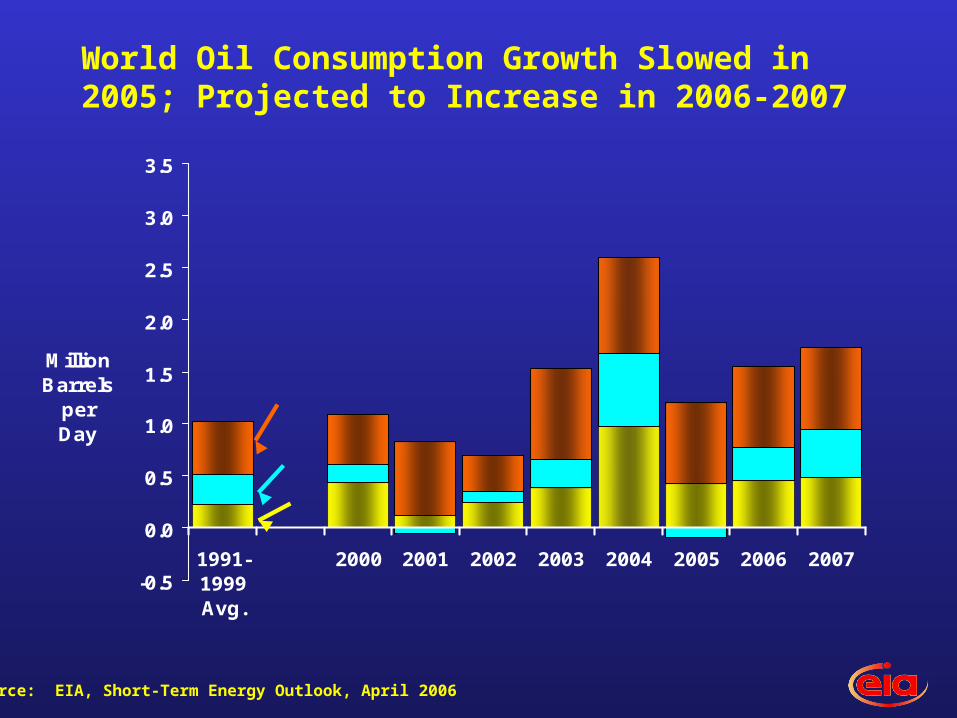
World Oil Consumption Growth Slowed in 2005; Projected to Increase in 2006-2007
Source: EIA, Short-Term Energy Outlook, April 2006
-0.5
0.0
0.5
1.0
1.5
2.0
2.5
3.0
3.5
1991-1999Avg.
2000 2001 2002 2003 2004 2005 2006 2007
Million Barrels
per Day
US
Rest of World
China
-0.6
-0.4
-0.2
0
0.2
0.4
0.6
0.8
1
Ang
ola
Rus
sia
Bra
zil
Aze
rbai
jan
Can
ada
US
Kaz
akhs
tan
Suda
nC
hina
Aus
tral
iaM
alay
sia
Viet
nam
Ecua
dor
Gab
onO
man
Egyp
tTu
nisi
aC
olom
bia
Indi
aSy
ria
Oth
er N
orth
Sea
Mex
ico UK
Nor
way
Million barrelsper day(AnnualChange)
2005 2006 2007
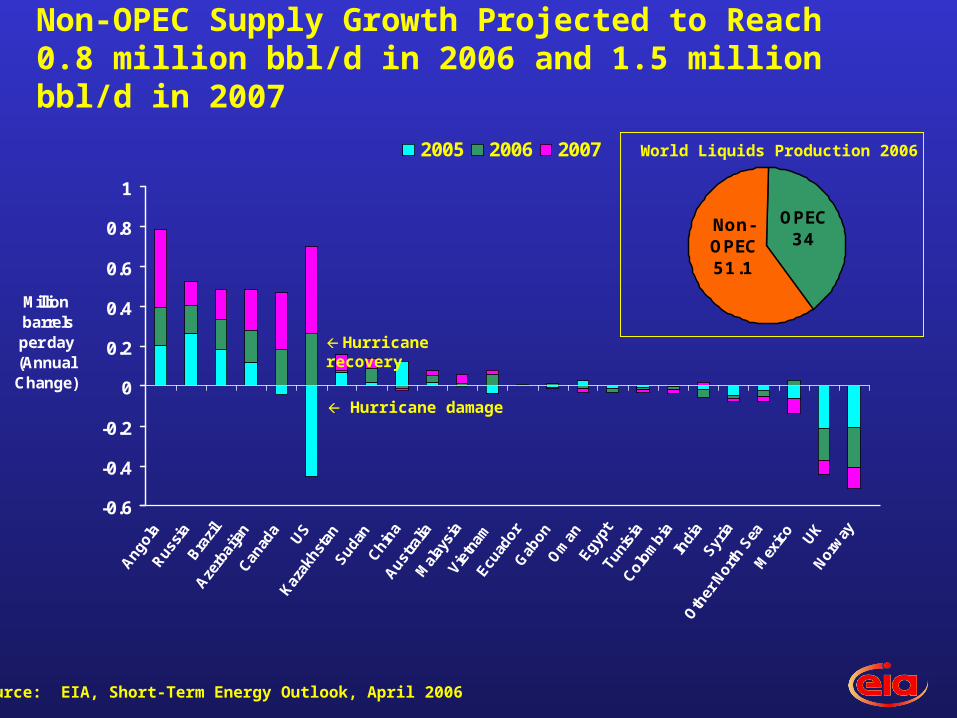
Non-OPEC Supply Growth Projected to Reach 0.8 million bbl/d in 2006 and 1.5 million bbl/d in 2007
Hurricane recovery
Hurricane damage
OPEC 34
Non-OPEC 51.1
World Liquids Production 2006
Source: EIA, Short-Term Energy Outlook, April 2006
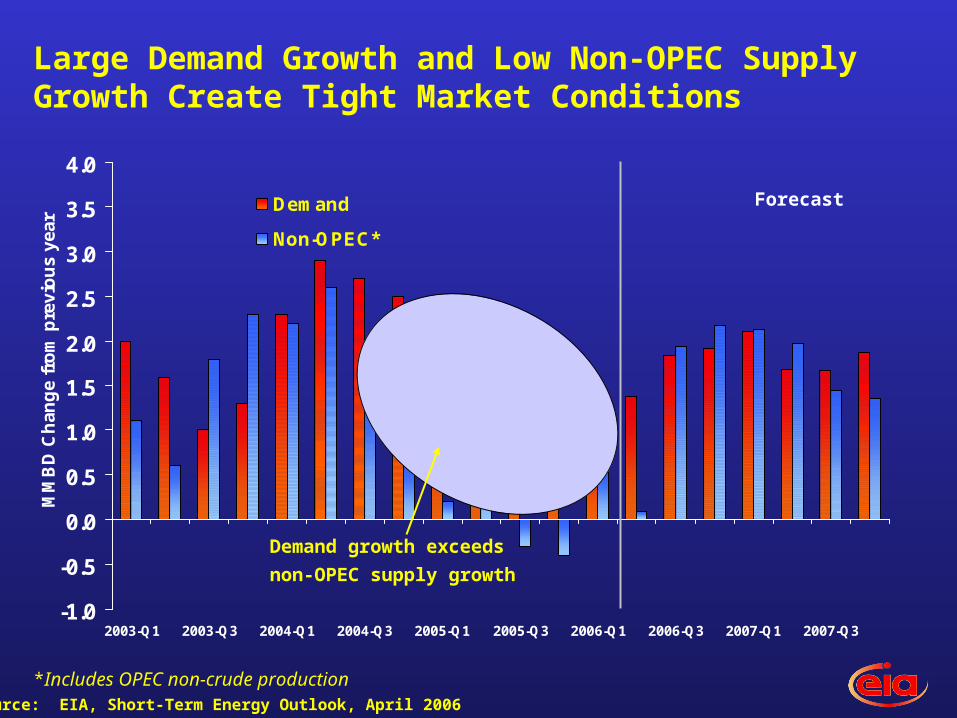
Large Demand Growth and Low Non-OPEC Supply Growth Create Tight Market Conditions
-1.0
-0.5
0.0
0.5
1.0
1.5
2.0
2.5
3.0
3.5
4.0
2003-Q1 2003-Q3 2004-Q1 2004-Q3 2005-Q1 2005-Q3 2006-Q1 2006-Q3 2007-Q1 2007-Q3
MM
BD
Ch
ang
e fr
om
pre
vio
us
year
Demand
Non-OPEC*
*Includes OPEC non-crude production
Demand growth exceeds
non-OPEC supply growth
Source: EIA, Short-Term Energy Outlook, April 2006
Forecast
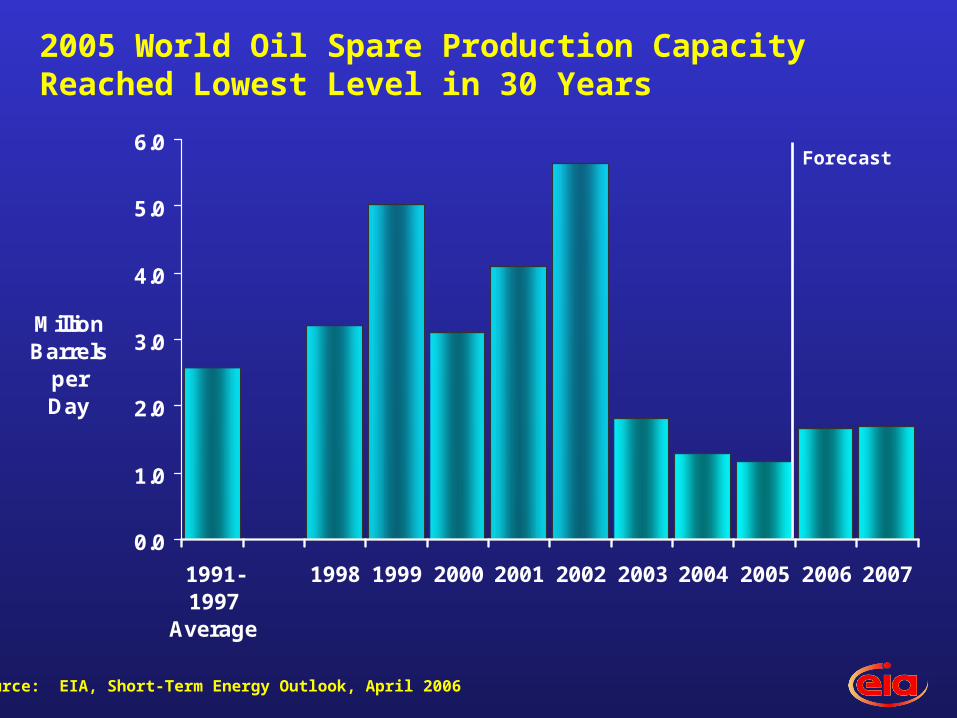
0.0
1.0
2.0
3.0
4.0
5.0
6.0
1991-1997
Average
1998 1999 2000 2001 2002 2003 2004 2005 2006 2007
Million Barrels
per Day
Forecast
2005 World Oil Spare Production Capacity Reached Lowest Level in 30 Years
Source: EIA, Short-Term Energy Outlook, April 2006
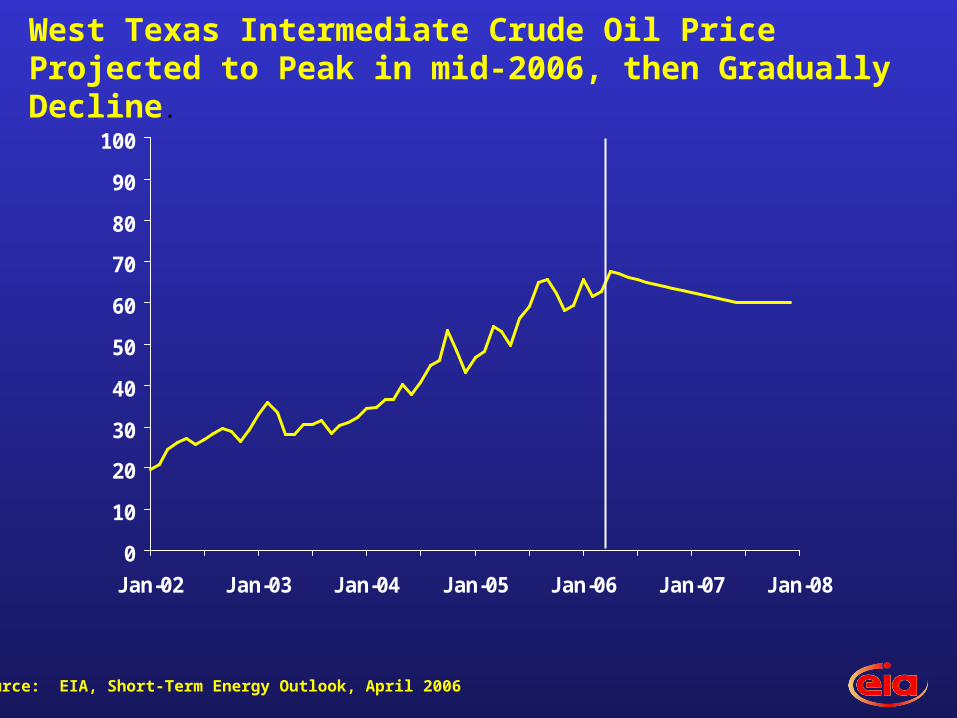
West Texas Intermediate Crude Oil Price Projected to Peak in mid-2006, then Gradually Decline.
0
10
20
30
40
50
60
70
80
90
100
Jan-02 Jan-03 Jan-04 Jan-05 Jan-06 Jan-07 Jan-08
Dollarsper
barrel
Forecast
Source: EIA, Short-Term Energy Outlook, April 2006
1) High crude oil costs (up 13 percent from 2005 - summer to summer);
2) Increased gasoline demand growth (up 1.5 percent from 2005 – summer to summer);
3) Adequate stocks but refining capacity constraints;
4) Tighter constraints on sulfur content in gasoline and phase-out of MTBE;
Several Factors Are Driving 2006 U.S. Summer (April – September) Outlook for Motor Fuels
Source: EIA, Short-Term Energy Outlook, April 2006
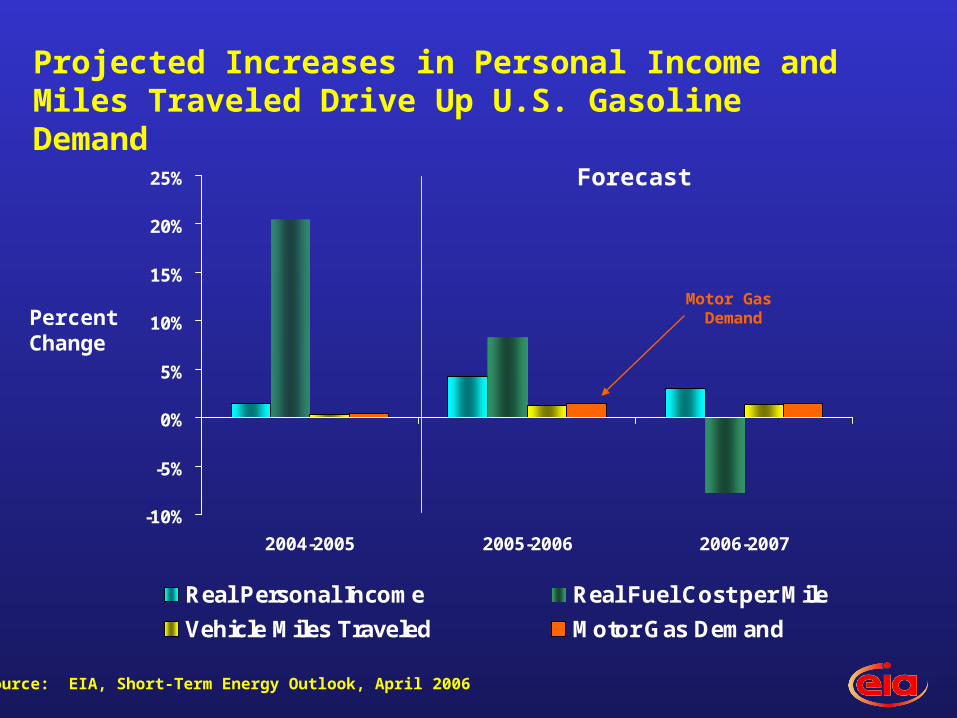
Projected Increases in Personal Income and Miles Traveled Drive Up U.S. Gasoline Demand
-10%
-5%
0%
5%
10%
15%
20%
25%
2004-2005 2005-2006 2006-2007
Real Personal Income Real Fuel Cost per Mile
Vehicle Miles Traveled Motor Gas Demand
Forecast
PercentChange
Source: EIA, Short-Term Energy Outlook, April 2006
Motor Gas Demand
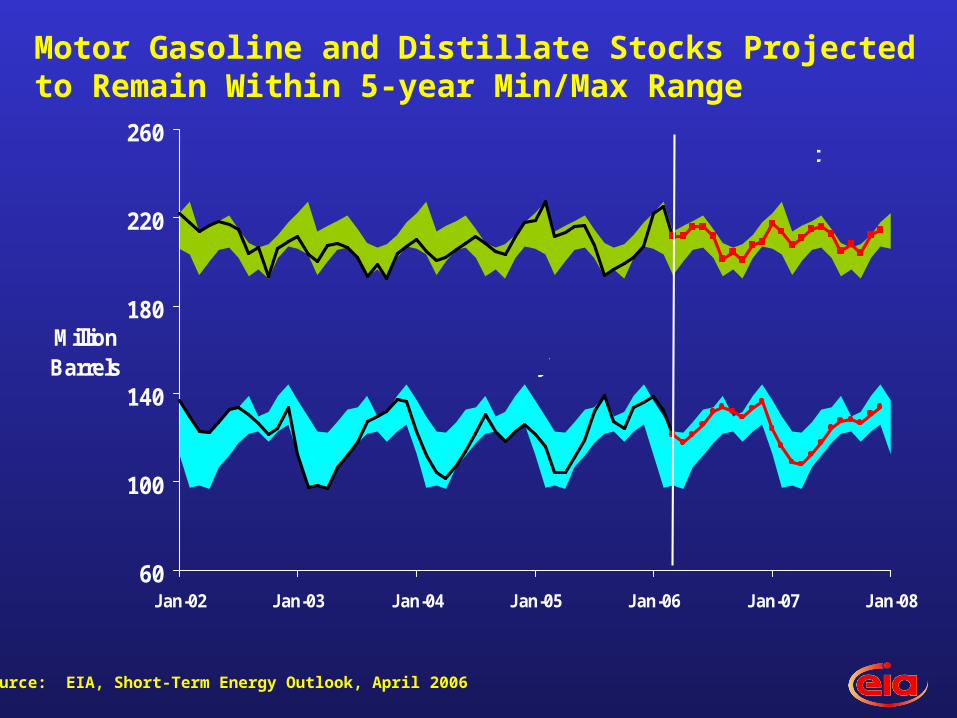
Motor Gasoline and Distillate Stocks Projected to Remain Within 5-year Min/Max Range
60
100
140
180
220
260
Jan-02 Jan-03 Jan-04 Jan-05 Jan-06 Jan-07 Jan-08
MillionBarrels
NOTE: Colored bands represent previous 5-year minimum/maximum ranges
ForecastTotal Motor Gasoline Inventory
Total Distillate Fuel Inventory
Source: EIA, Short-Term Energy Outlook, April 2006
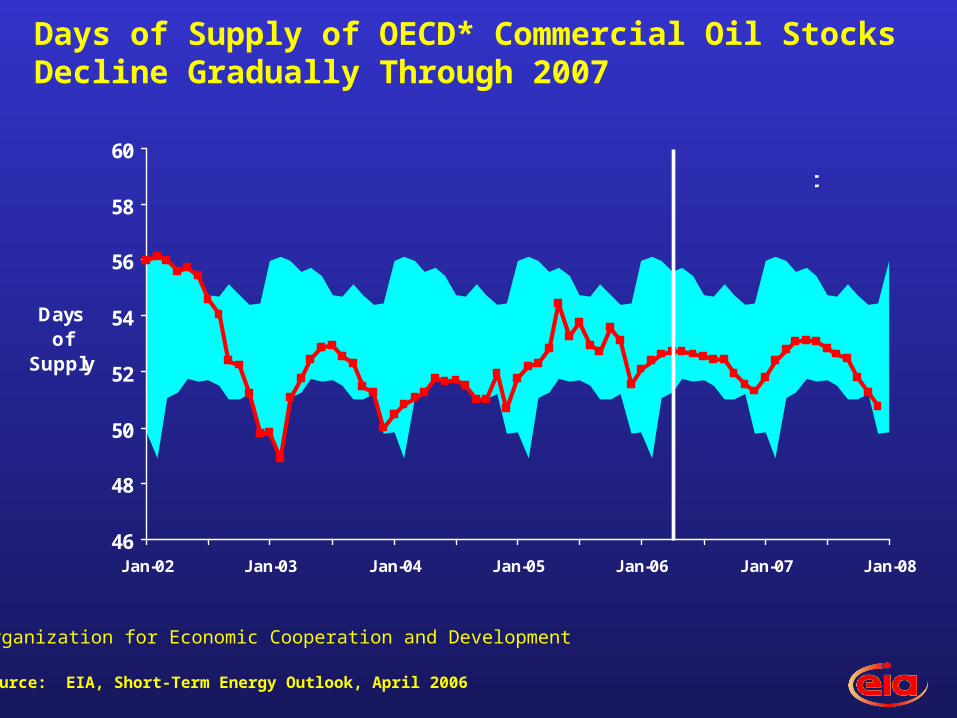
Days of Supply of OECD* Commercial Oil Stocks Decline Gradually Through 2007
* Organization for Economic Cooperation and Development
46
48
50
52
54
56
58
60
Jan-02 Jan-03 Jan-04 Jan-05 Jan-06 Jan-07 Jan-08
Daysof
Supply
Forecast
Source: EIA, Short-Term Energy Outlook, April 2006
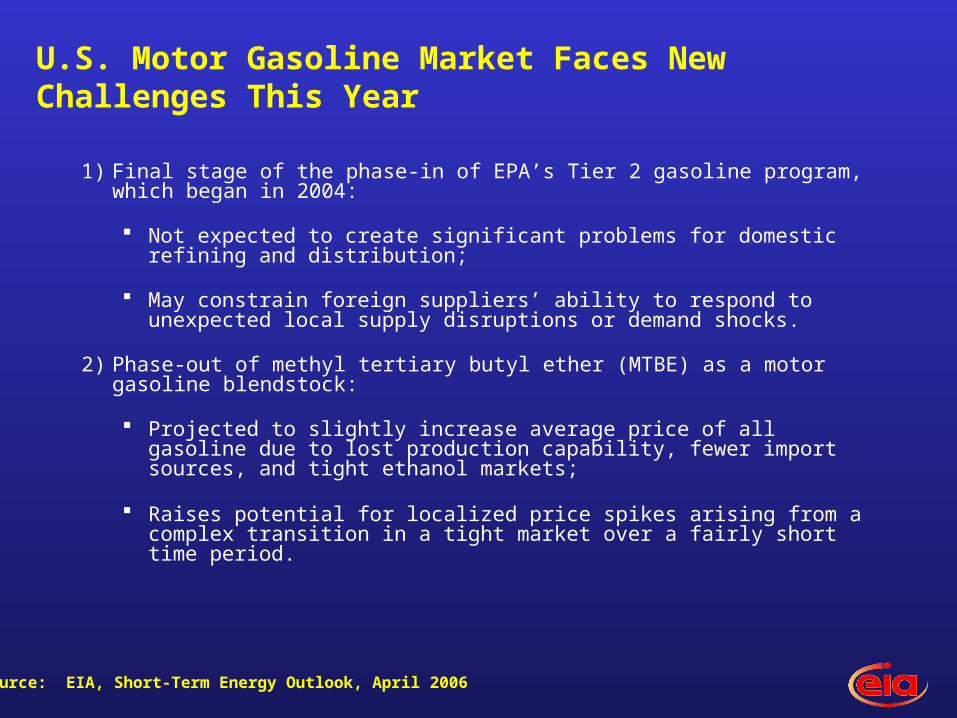
U.S. Motor Gasoline Market Faces New Challenges This Year
1) Final stage of the phase-in of EPA’s Tier 2 gasoline program, which began in 2004:
Not expected to create significant problems for domestic refining and distribution;
May constrain foreign suppliers’ ability to respond to unexpected local supply disruptions or demand shocks.
2) Phase-out of methyl tertiary butyl ether (MTBE) as a motor gasoline blendstock:
Projected to slightly increase average price of all gasoline due to lost production capability, fewer import sources, and tight ethanol markets;
Raises potential for localized price spikes arising from a complex transition in a tight market over a fairly short time period.
Source: EIA, Short-Term Energy Outlook, April 2006
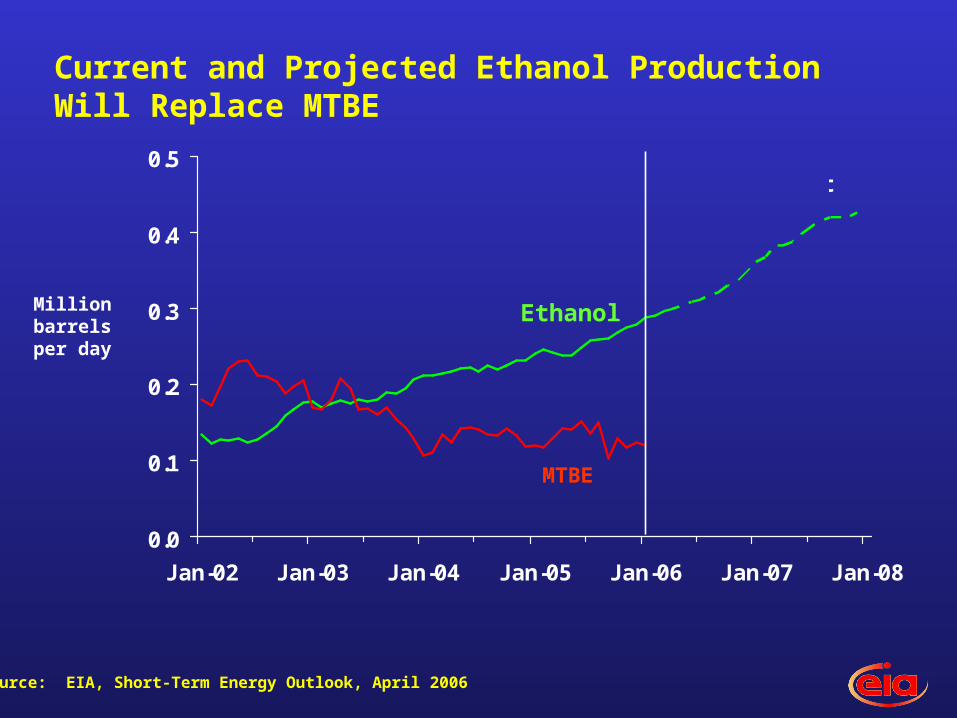
0.0
0.1
0.2
0.3
0.4
0.5
Jan-02 Jan-03 Jan-04 Jan-05 Jan-06 Jan-07 Jan-08
Forecast
Ethanol
MTBE
Current and Projected Ethanol Production Will Replace MTBE
Millionbarrelsper day
Source: EIA, Short-Term Energy Outlook, April 2006
0.00
0.25
0.50
0.75
1.00
1.25
1.50
Jan-01 Jan-02 Jan-03 Jan-04 Jan-05 Jan-06 Jan-07 Jan-08
Finished Gasoline Total Gasoline
ForecastHurricanes Katrina and Rita
Million barrels per day
Gasoline and Blending Components Imports Projected to Average 9.9% of Summer Demand
Source: EIA, Short-Term Energy Outlook, April 2006
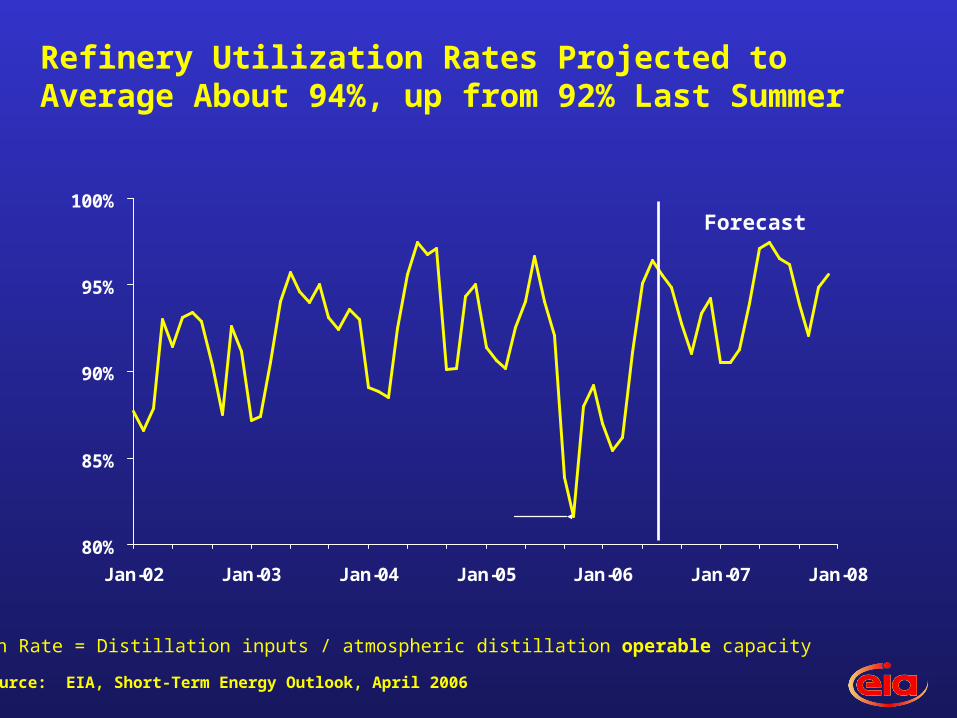
80%
85%
90%
95%
100%
Jan-02 Jan-03 Jan-04 Jan-05 Jan-06 Jan-07 Jan-08
Hurricanes Katrina and Rita
Refinery Utilization Rates Projected to Average About 94%, up from 92% Last Summer
Forecast
Utilization Rate = Distillation inputs / atmospheric distillation operable capacity
Source: EIA, Short-Term Energy Outlook, April 2006
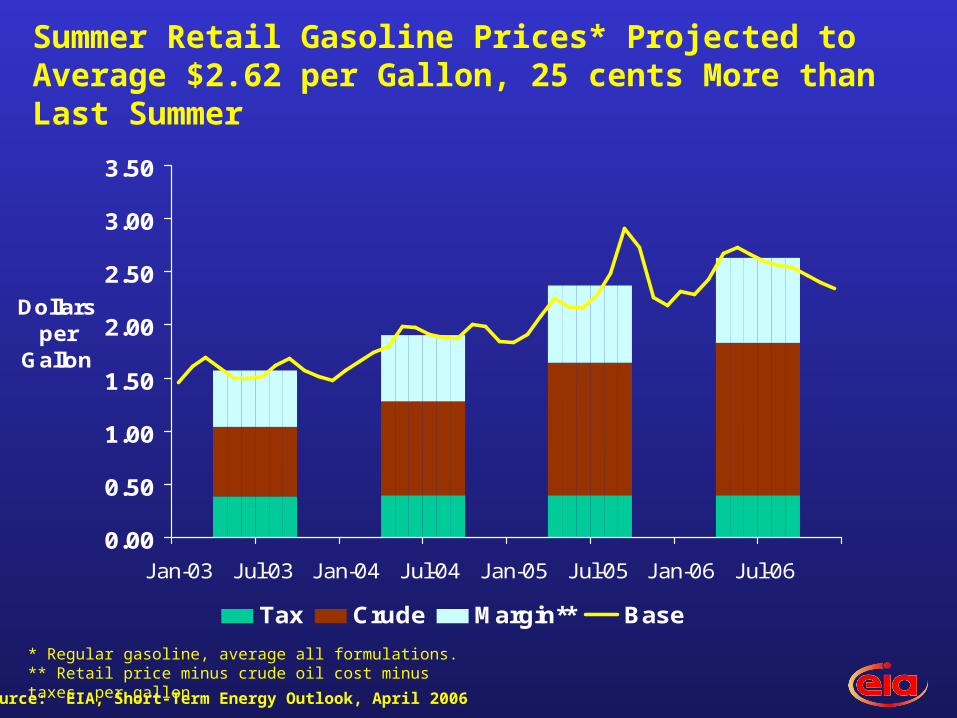
Summer Retail Gasoline Prices* Projected to Average $2.62 per Gallon, 25 cents More than Last Summer
* Regular gasoline, average all formulations.** Retail price minus crude oil cost minus taxes, per gallon
0.00
0.50
1.00
1.50
2.00
2.50
3.00
3.50
Jan-03 Jul-03 Jan-04 Jul-04 Jan-05 Jul-05 Jan-06 Jul-06
Dollars per
Gallon
Tax Crude Margin** Base
2003Avg. $1.56
2004Avg. $1.90
2005Avg. $2.37
2006Avg. $2.62
Source: EIA, Short-Term Energy Outlook, April 2006
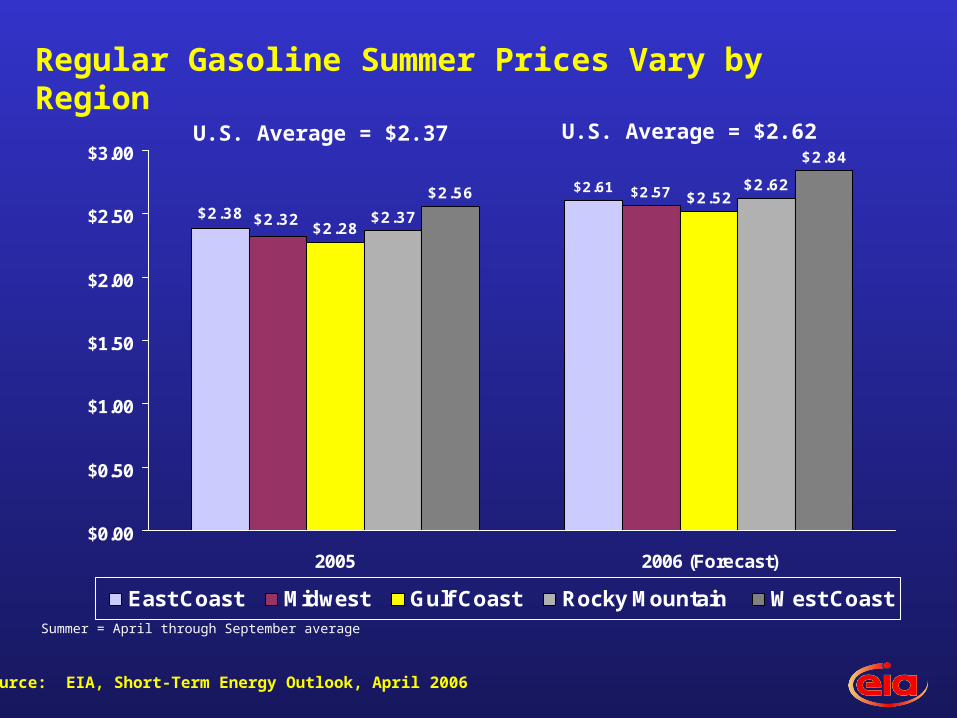
Regular Gasoline Summer Prices Vary by Region
U.S. Average = $2.37 U.S. Average = $2.62
Source: EIA, Short-Term Energy Outlook, April 2006
Summer = April through September average
$2.61 $2.57
$2.28
$2.52$2.37
$2.62$2.56
$2.84
$2.38 $2.32
$0.00
$0.50
$1.00
$1.50
$2.00
$2.50
$3.00
2005 2006 (Forecast)
East Coast Midwest Gulf Coast Rocky Mountain West Coast
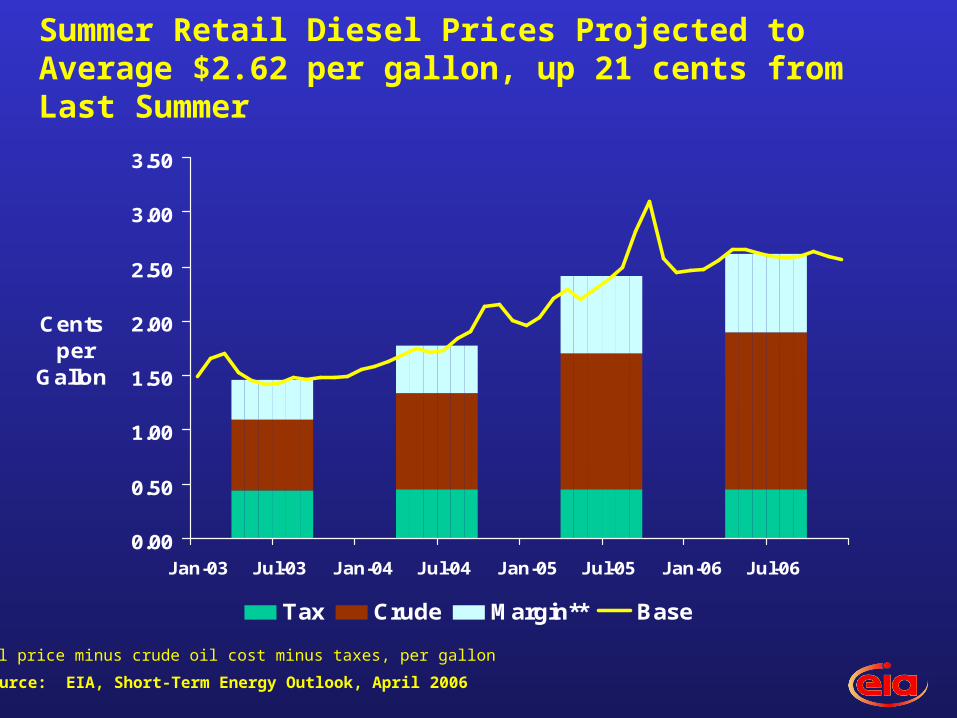
Summer Retail Diesel Prices Projected to Average $2.62 per gallon, up 21 cents from Last Summer
0.00
0.50
1.00
1.50
2.00
2.50
3.00
3.50
Jan-03 Jul-03 Jan-04 Jul-04 Jan-05 Jul-05 Jan-06 Jul-06
Cents per
Gallon
Tax Crude Margin** Base
2003Avg. $1.47
2004Avg. $1.77
2005Avg. $2.41
2006Avg. $2.62
Source: EIA, Short-Term Energy Outlook, April 2006
** Retail price minus crude oil cost minus taxes, per gallon
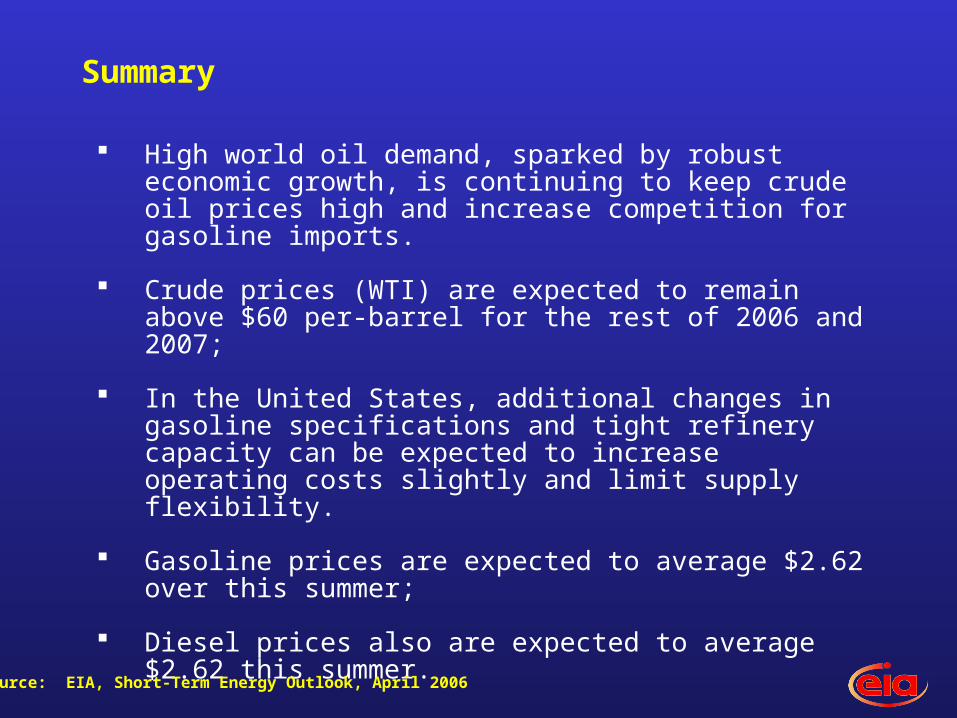
High world oil demand, sparked by robust economic growth, is continuing to keep crude oil prices high and increase competition for gasoline imports.
Crude prices (WTI) are expected to remain above $60 per-barrel for the rest of 2006 and 2007;
In the United States, additional changes in gasoline specifications and tight refinery capacity can be expected to increase operating costs slightly and limit supply flexibility.
Gasoline prices are expected to average $2.62 over this summer;
Diesel prices also are expected to average $2.62 this summer.
Summary
Source: EIA, Short-Term Energy Outlook, April 2006

Extra Slides
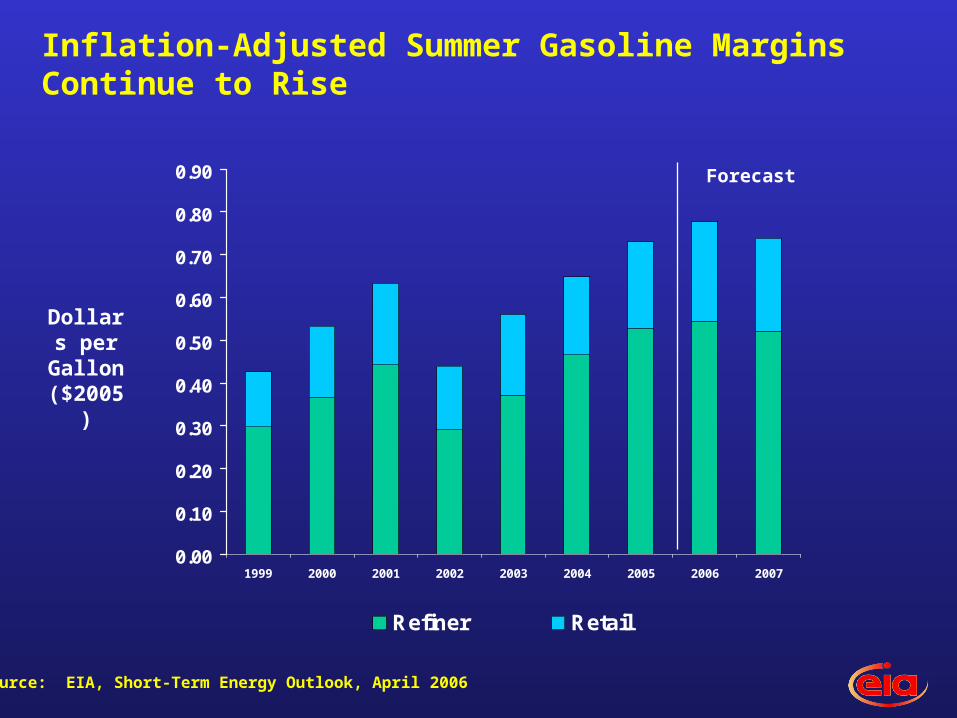
0.00
0.10
0.20
0.30
0.40
0.50
0.60
0.70
0.80
0.90
1999 2000 2001 2002 2003 2004 2005 2006 2007
Refiner Retail
Forecast
Dollars per
Gallon ($2005)
Inflation-Adjusted Summer Gasoline Margins Continue to Rise
Source: EIA, Short-Term Energy Outlook, April 2006
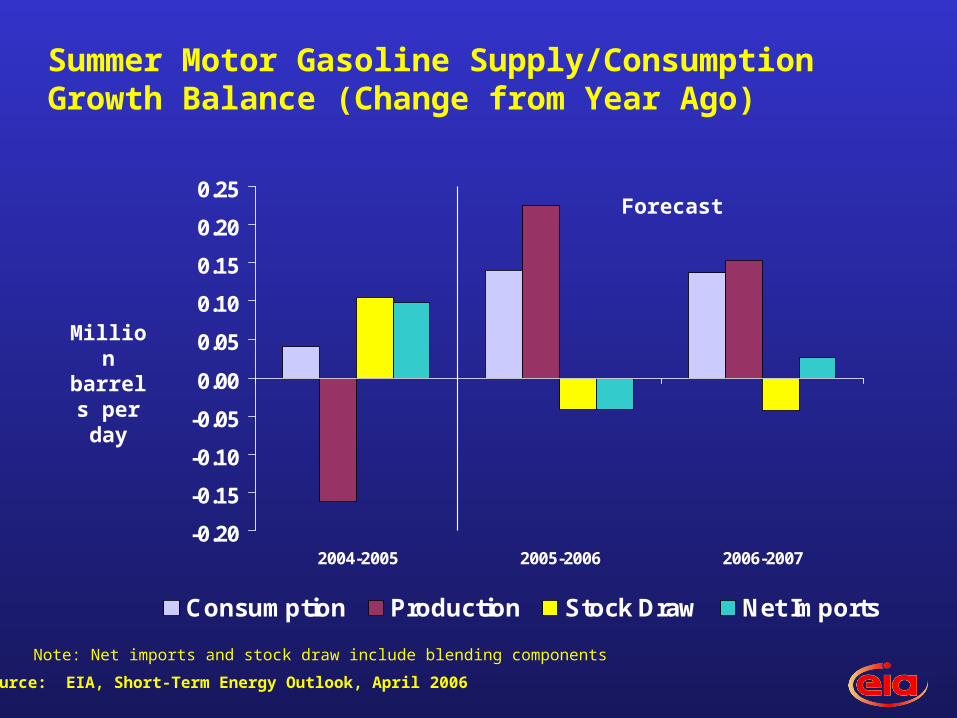
-0.20
-0.15
-0.10
-0.05
0.00
0.05
0.10
0.15
0.20
0.25
2004-2005 2005-2006 2006-2007
Consumption Production Stock Draw Net Imports
Summer Motor Gasoline Supply/Consumption Growth Balance (Change from Year Ago)
Forecast
Million barrels per day
Note: Net imports and stock draw include blending components
Source: EIA, Short-Term Energy Outlook, April 2006
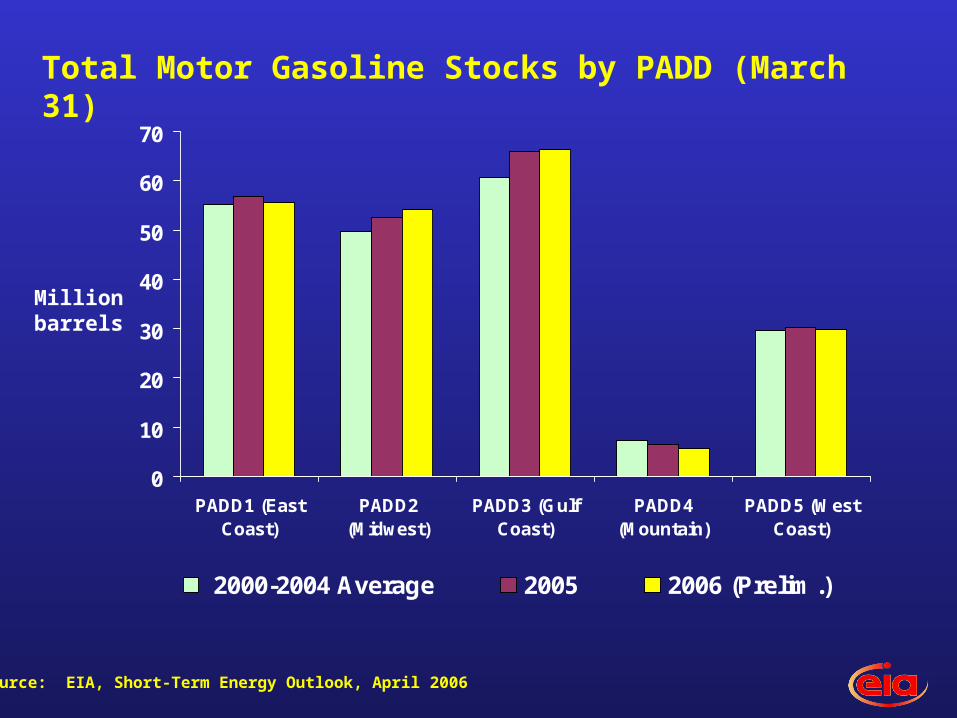
0
10
20
30
40
50
60
70
PADD1 (EastCoast)
PADD2(Midwest)
PADD3 (GulfCoast)
PADD4(Mountain)
PADD5 (WestCoast)
2000-2004 Average 2005 2006 (Prelim.)
Total Motor Gasoline Stocks by PADD (March 31)
Million barrels
Source: EIA, Short-Term Energy Outlook, April 2006
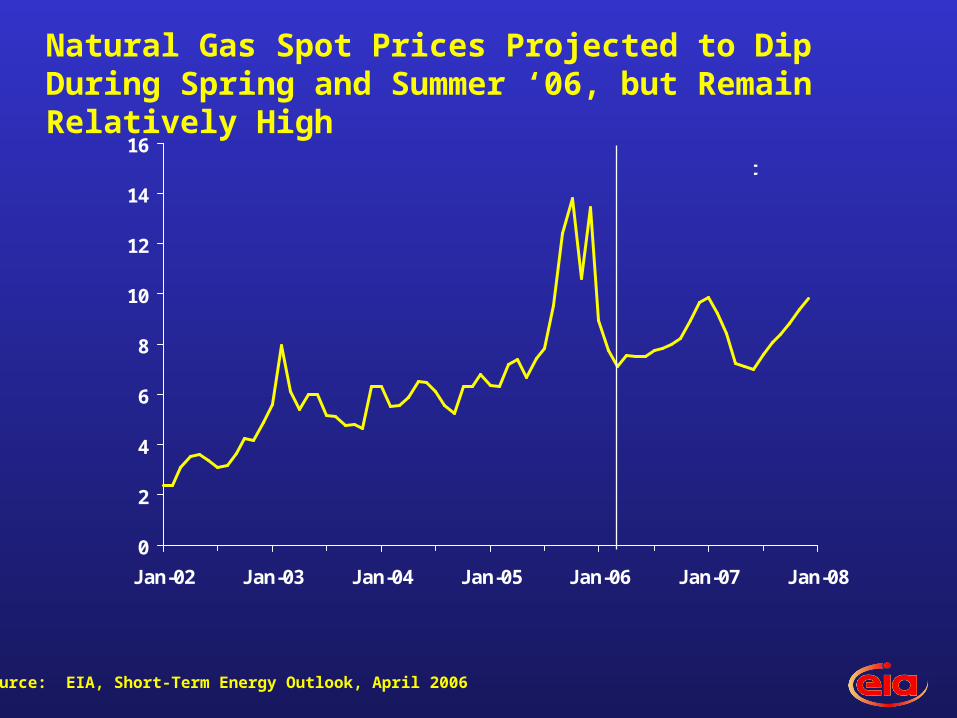
Natural Gas Spot Prices Projected to Dip During Spring and Summer ‘06, but Remain Relatively High
0
2
4
6
8
10
12
14
16
Jan-02 Jan-03 Jan-04 Jan-05 Jan-06 Jan-07 Jan-08
Forecast
Dollars per
thousand cubic feet
Source: EIA, Short-Term Energy Outlook, April 2006
-100
0
1000 J
MontBilli
o
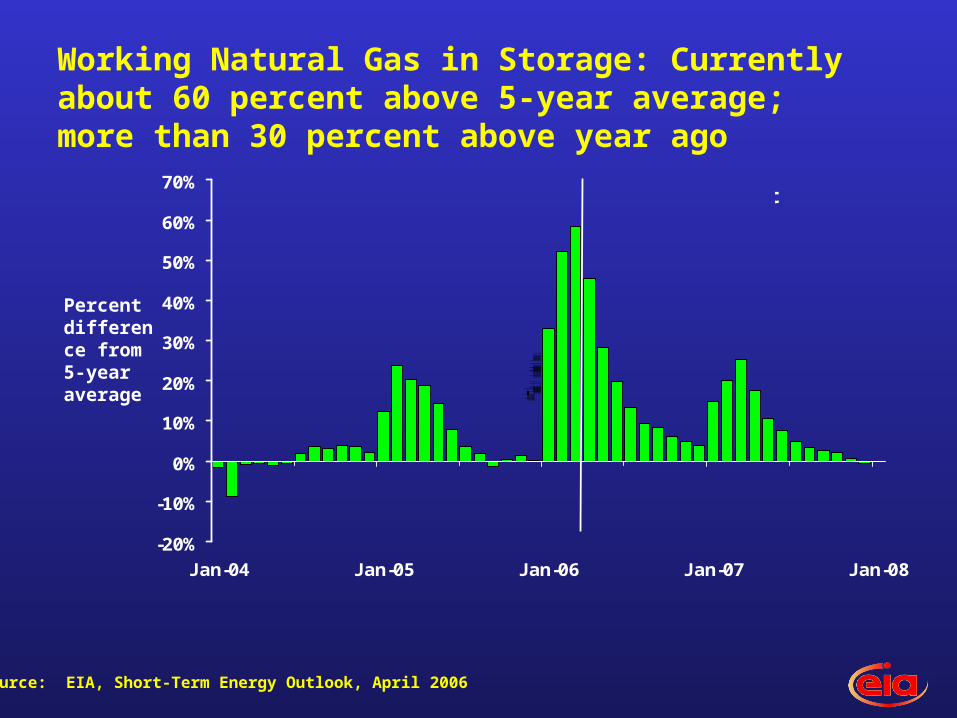
Working Natural Gas in Storage: Currently about 60 percent above 5-year average; more than 30 percent above year ago
-100
0
1000 J
MontBill
io
-100
0
1000 J
MontBill
io
-100
0
1000 J
MontBill
io
-500
0
500 A
MontBill
io
-70%
J
MontPer
ce
-70%
J
MontPe
rce
Source: EIA, Short-Term Energy Outlook, April 2006
Percent difference from 5-year average
-20%
-10%
0%
10%
20%
30%
40%
50%
60%
70%
Jan-04 Jan-05 Jan-06 Jan-07 Jan-08
Forecast