Embed Size (px)
Citation preview
EIA Short-Term Energy and Winter Fuels OutlookWinter Fuels Outlook
O b 8 2013 | W hi DCOctober 8, 2013 | Washington, DC
www.eia.govU.S. Energy Information Administration Independent Statistics & Analysis
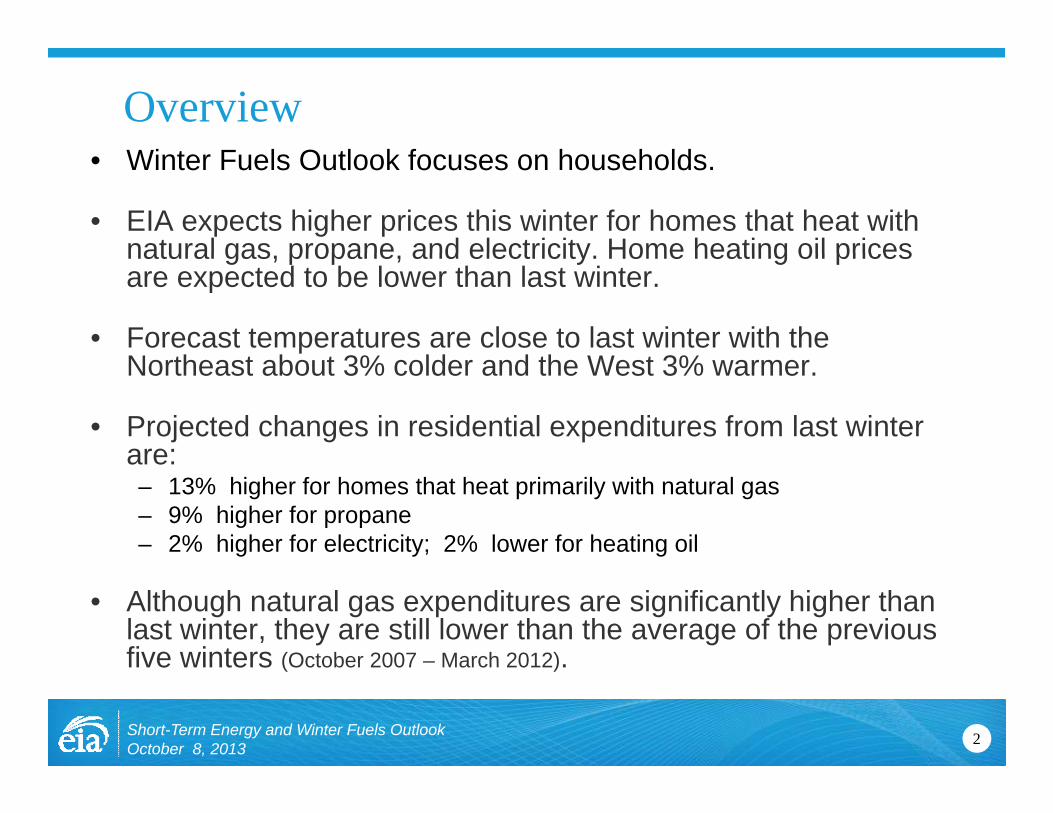
OverviewWi t F l O tl k f h h ld• Winter Fuels Outlook focuses on households.
• EIA expects higher prices this winter for homes that heat with natural gas propane and electricity Home heating oil pricesnatural gas, propane, and electricity. Home heating oil prices are expected to be lower than last winter.
• Forecast temperatures are close to last winter with the N th t b t 3% ld d th W t 3%Northeast about 3% colder and the West 3% warmer.
• Projected changes in residential expenditures from last winter are:are:– 13% higher for homes that heat primarily with natural gas– 9% higher for propane– 2% higher for electricity; 2% lower for heating oil
• Although natural gas expenditures are significantly higher than last winter, they are still lower than the average of the previous five winters (October 2007 – March 2012)five winters (October 2007 March 2012).
2Short-Term Energy and Winter Fuels OutlookOctober 8, 2013
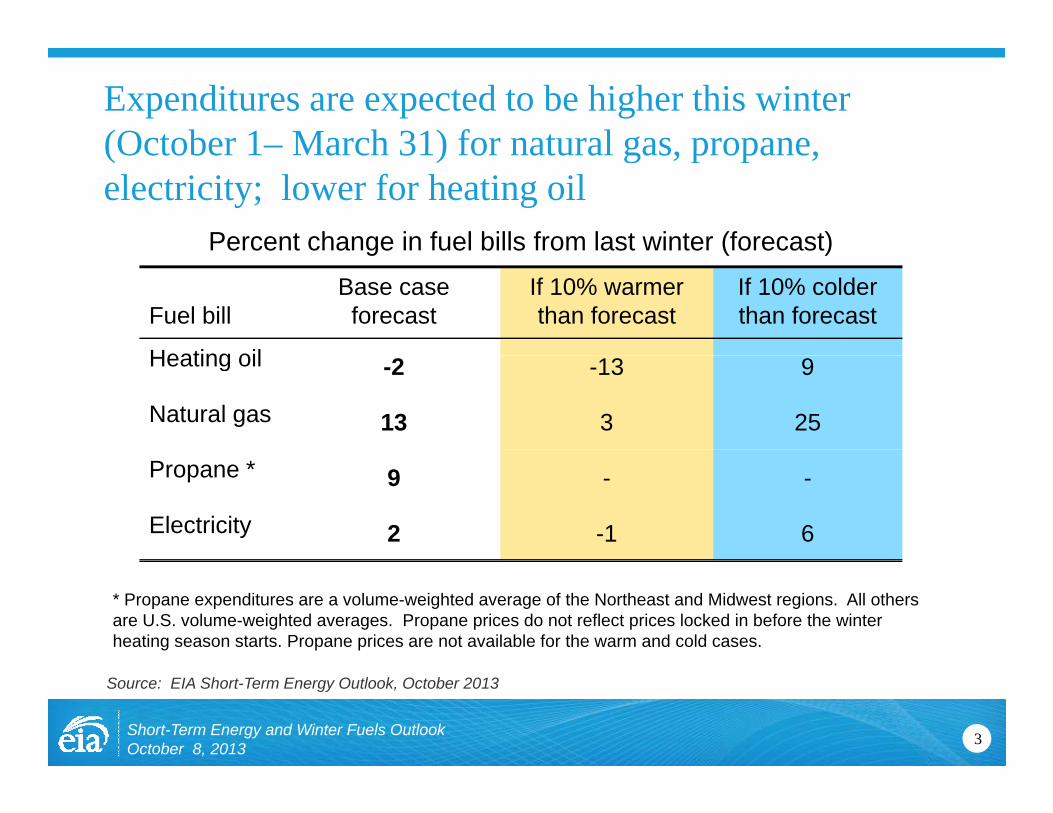
Expenditures are expected to be higher this winter (October 1– March 31) for natural gas propane(October 1 March 31) for natural gas, propane, electricity; lower for heating oil
Percent change in fuel bills from last winter (forecast)g ( )
Fuel billBase case
forecastIf 10% warmer than forecast
If 10% colder than forecast
Heating oilHeating oil -2 -13 9
Natural gas 13 3 25
Propane * 9 - -
Electricity 2 -1 6
* Propane expenditures are a volume-weighted average of the Northeast and Midwest regions. All others are U.S. volume-weighted averages. Propane prices do not reflect prices locked in before the winter heating season starts. Propane prices are not available for the warm and cold cases.
3Short-Term Energy and Winter Fuels OutlookOctober 8, 2013
Source: EIA Short-Term Energy Outlook, October 2013
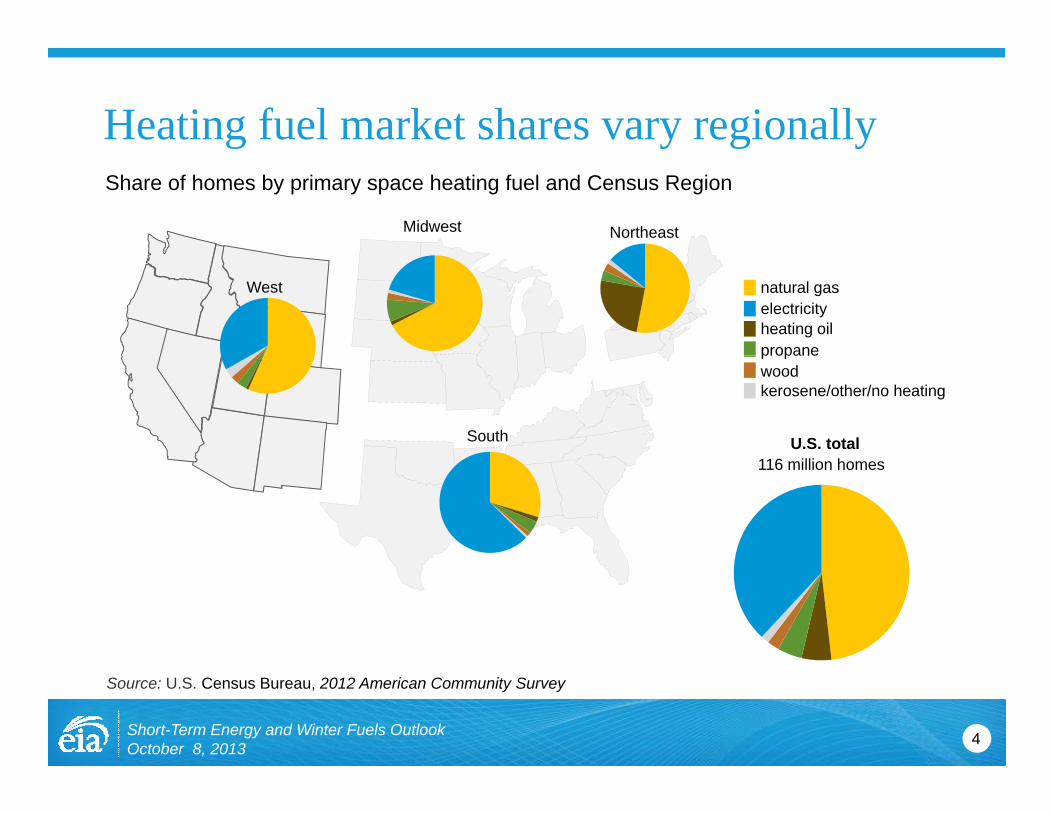
Heating fuel market shares vary regionallyShare of homes by primary space heating fuel and Census Region
NortheastMidwest
West natural gas
propaneheating oilelectricity
South U.S. total
propanewoodkerosene/other/no heating
116 million homes
4Short-Term Energy and Winter Fuels OutlookOctober 8, 2013
Source: U.S. Census Bureau, 2012 American Community Survey
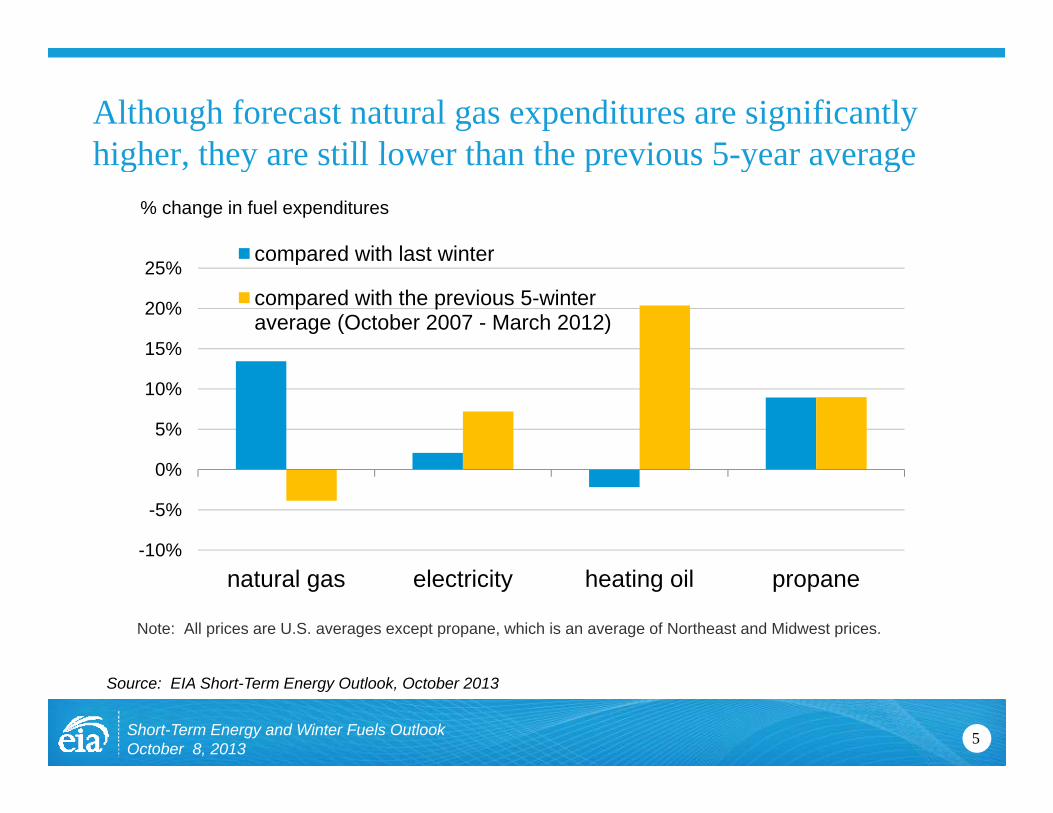
Although forecast natural gas expenditures are significantly higher they are still lower than the previous 5 year averagehigher, they are still lower than the previous 5-year average
compared with last winter
% change in fuel expenditures
15%
20%
25%compared with last winter
compared with the previous 5-winter average (October 2007 - March 2012)
5%
10%
-10%
-5%
0%
natural gas electricity heating oil propane
Note: All prices are U.S. averages except propane, which is an average of Northeast and Midwest prices.
5
Source: EIA Short-Term Energy Outlook, October 2013
Short-Term Energy and Winter Fuels OutlookOctober 8, 2013
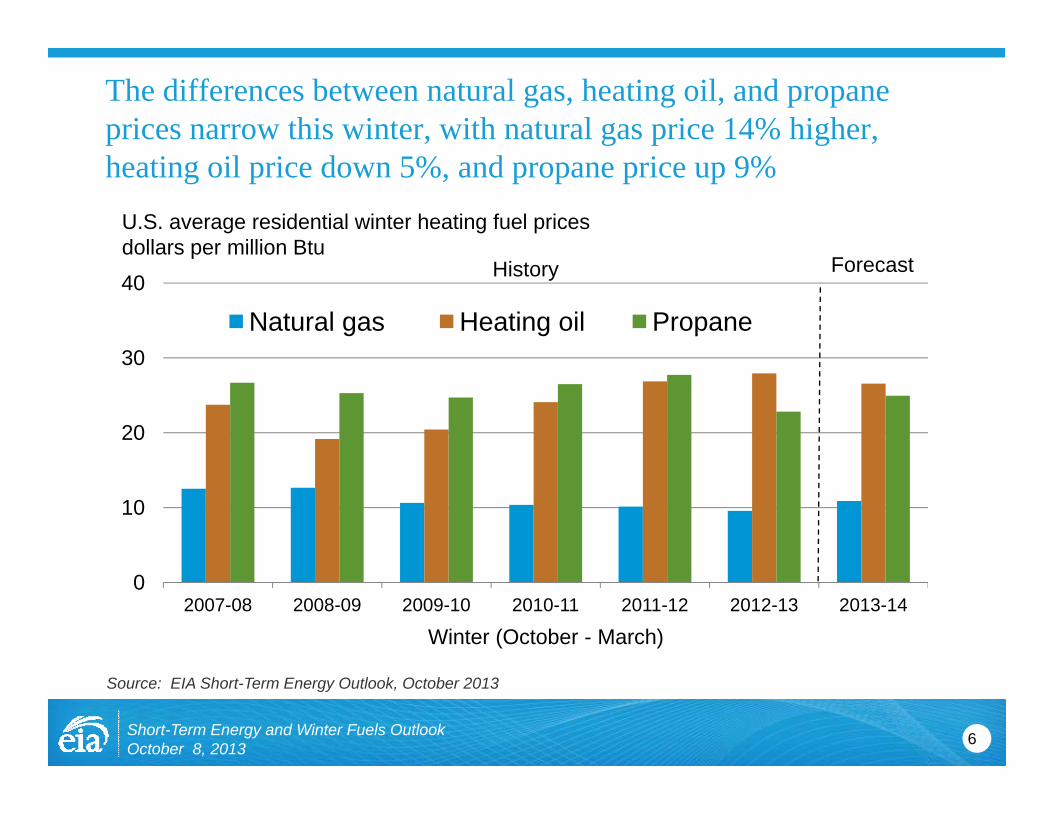
The differences between natural gas, heating oil, and propane prices narrow this winter, with natural gas price 14% higher, heating oil price down 5%, and propane price up 9%
U.S. average residential winter heating fuel pricesdollars per million Btu
30
40
Natural gas Heating oil Propane
dollars per million BtuForecastHistory
20
30
10
02007-08 2008-09 2009-10 2010-11 2011-12 2012-13 2013-14
Winter (October - March)
6Short-Term Energy and Winter Fuels OutlookOctober 8, 2013
Source: EIA Short-Term Energy Outlook, October 2013
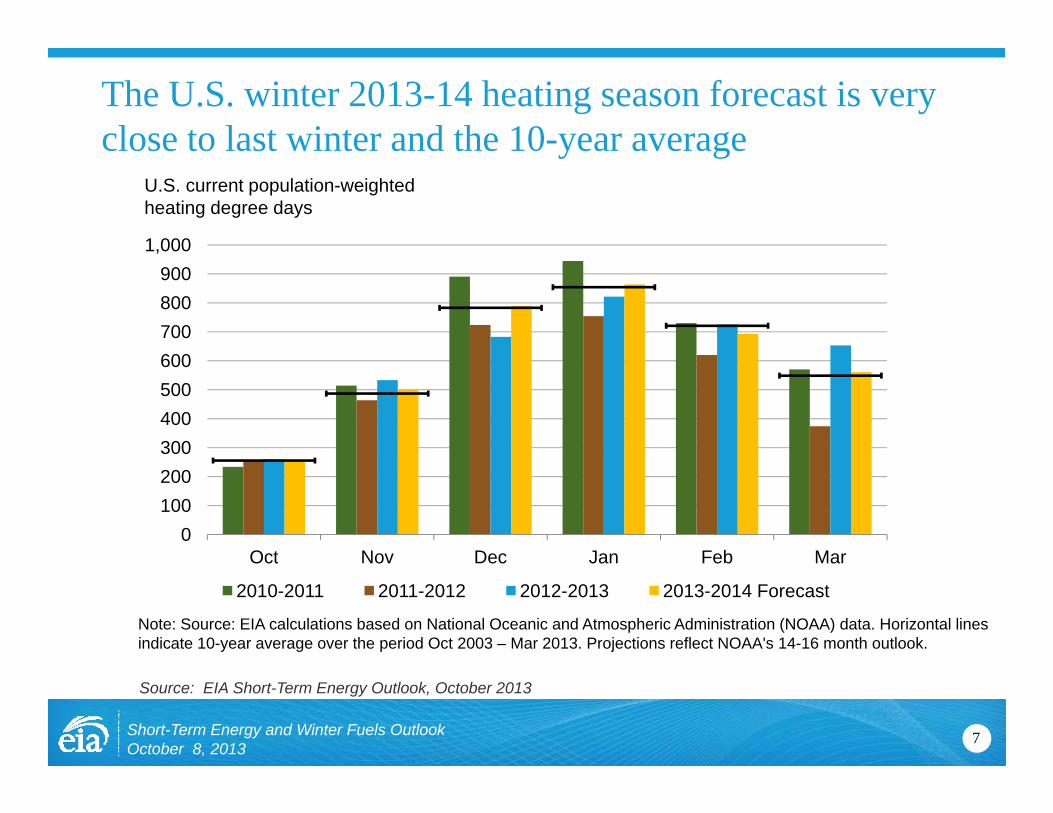
The U.S. winter 2013-14 heating season forecast is very close to last winter and the 10-year average
U.S. current population-weightedheating degree days
1,000
close to last winter and the 10 year average
600700800900
,
300400500600
0100200
Oct Nov Dec Jan Feb MarOct Nov Dec Jan Feb Mar
2010-2011 2011-2012 2012-2013 2013-2014 Forecast
Note: Source: EIA calculations based on National Oceanic and Atmospheric Administration (NOAA) data. Horizontal lines indicate 10-year average over the period Oct 2003 – Mar 2013. Projections reflect NOAA's 14-16 month outlook.
7Short-Term Energy and Winter Fuels OutlookOctober 8, 2013
Source: EIA Short-Term Energy Outlook, October 2013
Natural Gas
8Short-Term Energy and Winter Fuels OutlookOctober 8, 2013
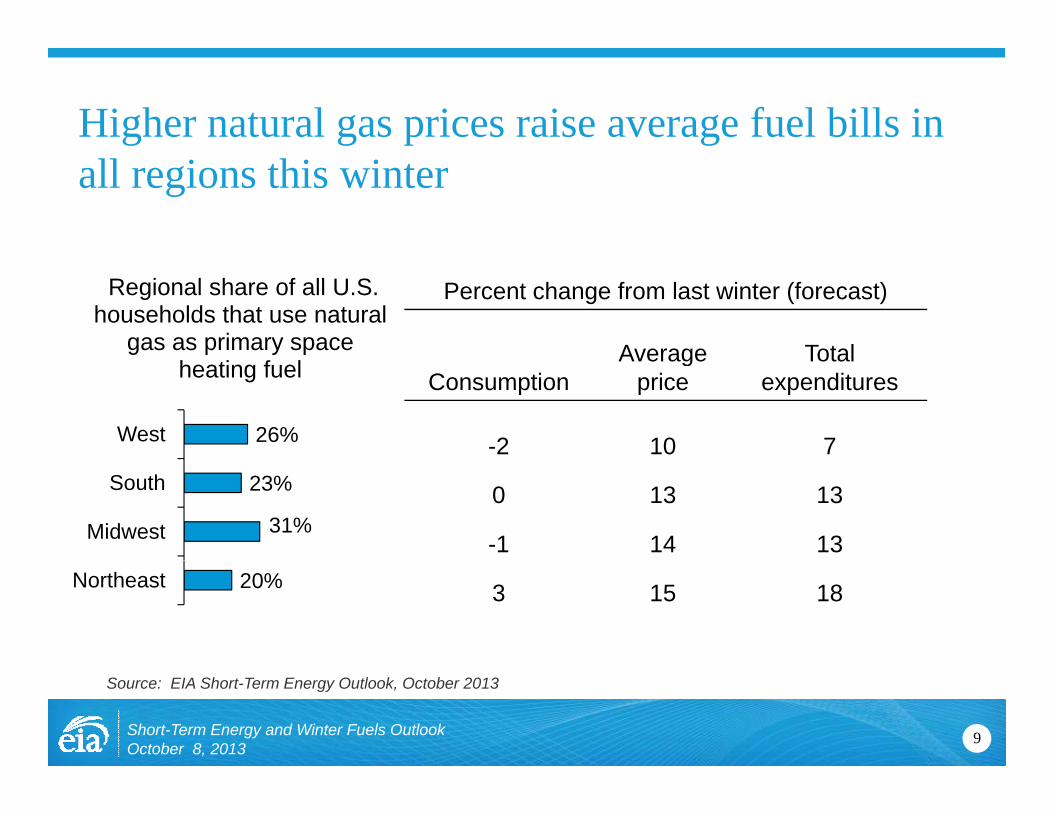
Higher natural gas prices raise average fuel bills in all regions this winter
Percent change from last winter (forecast)
Average Total
Regional share of all U.S. households that use natural
gas as primary space
ConsumptionAverage
priceTotal
expenditures
-2 10 726%West
heating fuel
0 13 13
-1 14 1331%
23%
Midwest
South
3 15 1820%Northeast
9Short-Term Energy and Winter Fuels OutlookOctober 8, 2013
Source: EIA Short-Term Energy Outlook, October 2013
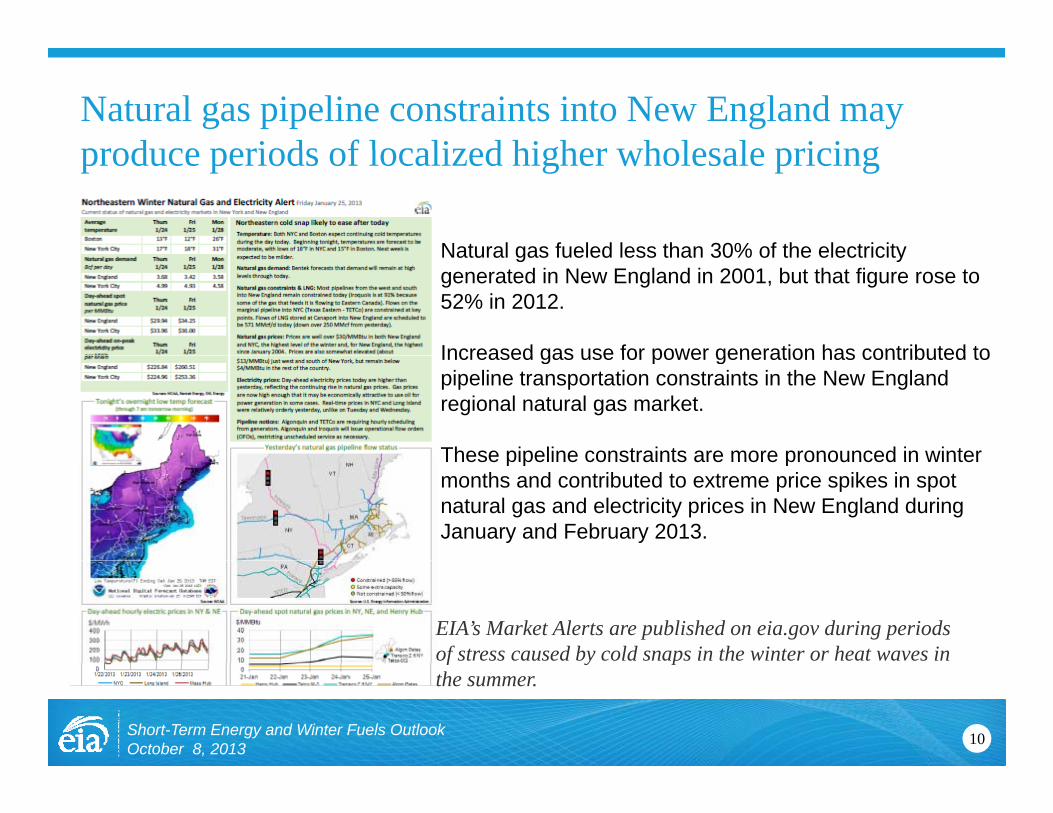
Natural gas pipeline constraints into New England may produce periods of localized higher wholesale pricingproduce periods of localized higher wholesale pricing
Natural gas fueled less than 30% of the electricityNatural gas fueled less than 30% of the electricity generated in New England in 2001, but that figure rose to 52% in 2012.
Increased gas use for power generation has contributed toIncreased gas use for power generation has contributed to pipeline transportation constraints in the New England regional natural gas market.
These pipeline constraints are more pronounced in winterThese pipeline constraints are more pronounced in winter months and contributed to extreme price spikes in spot natural gas and electricity prices in New England during January and February 2013.
EIA’s Market Alerts are published on eia.gov during periods of stress caused by cold snaps in the winter or heat waves in
10Short-Term Energy and Winter Fuels OutlookOctober 8, 2013
f y pthe summer.
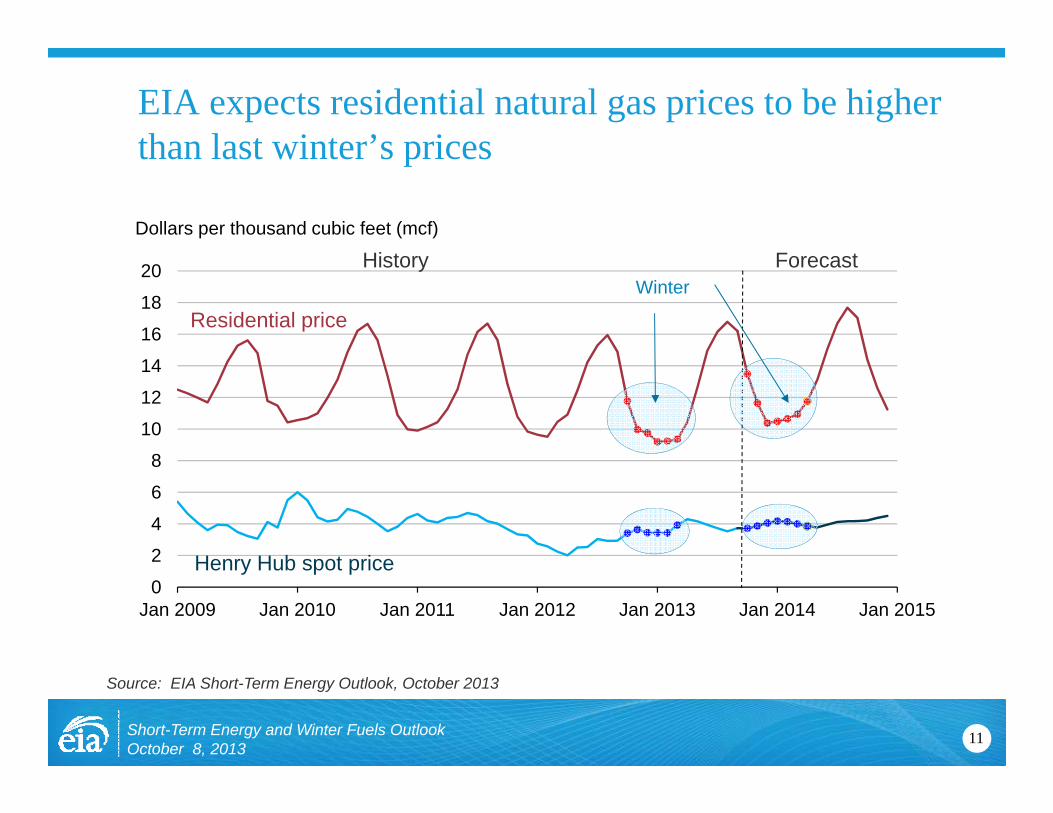
EIA expects residential natural gas prices to be higher than last winter’s pricesthan last winter s prices
F tHi tDollars per thousand cubic feet (mcf)
16
18
20Winter
Residential price
ForecastHistory
8
10
12
14
2
4
6
8
Henry Hub spot price0
2
Jan 2009 Jan 2010 Jan 2011 Jan 2012 Jan 2013 Jan 2014 Jan 2015
Henry Hub spot price
11Short-Term Energy and Winter Fuels OutlookOctober 8, 2013
Source: EIA Short-Term Energy Outlook, October 2013
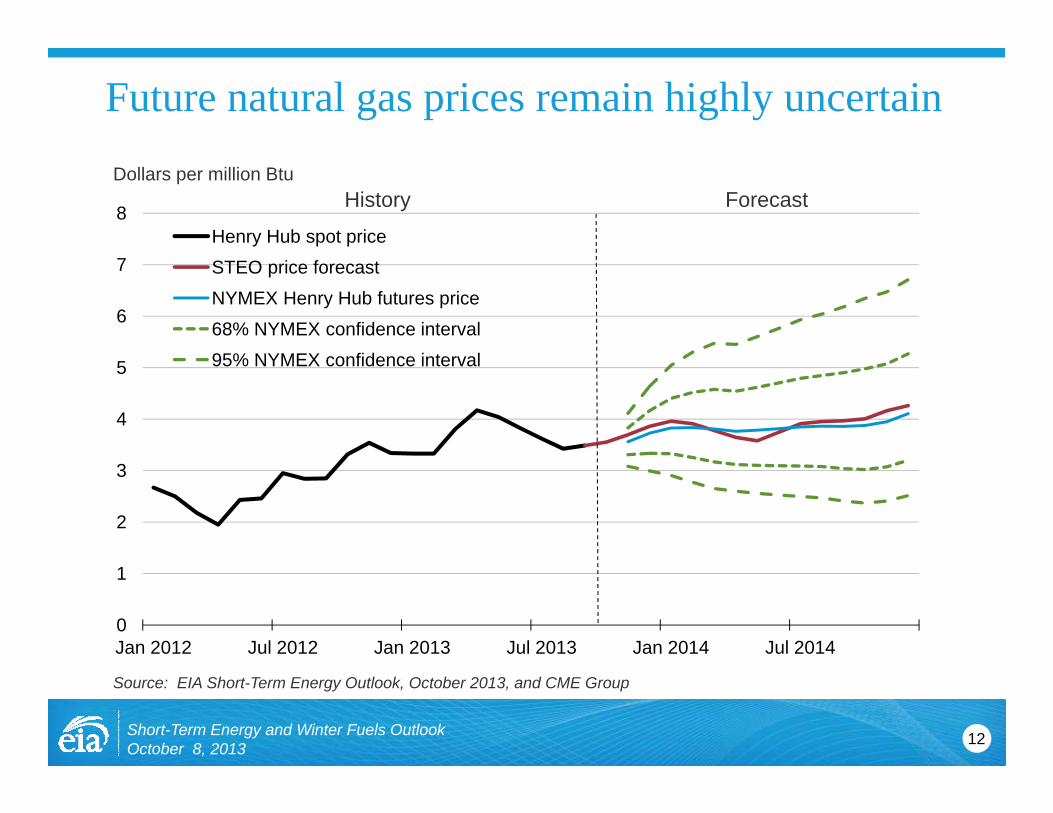
Future natural gas prices remain highly uncertain
8Henry Hub spot price
Dollars per million BtuHistory Forecast
6
7 STEO price forecastNYMEX Henry Hub futures price68% NYMEX confidence interval95% NYMEX fid i t l
4
5 95% NYMEX confidence interval
2
3
0
1
Jan 2012 Jul 2012 Jan 2013 Jul 2013 Jan 2014 Jul 2014
12
Source: EIA Short-Term Energy Outlook, October 2013, and CME Group
Short-Term Energy and Winter Fuels OutlookOctober 8, 2013
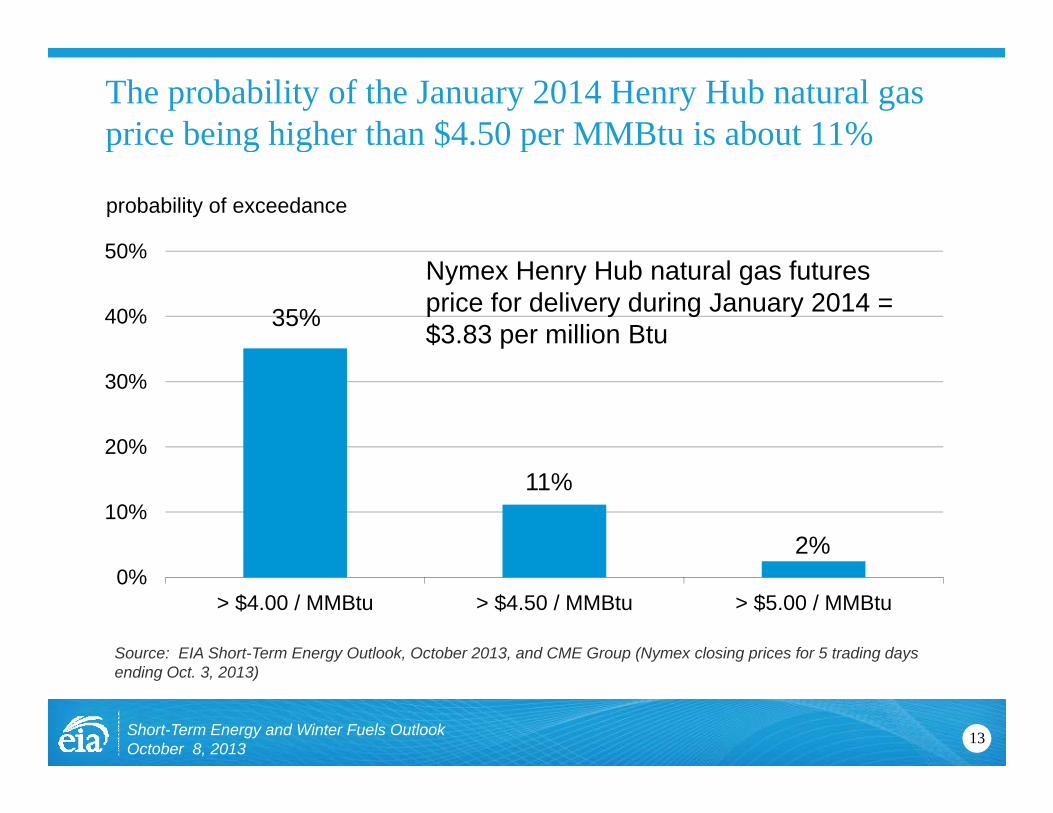
The probability of the January 2014 Henry Hub natural gas price being higher than $4.50 per MMBtu is about 11%p g g p
50%
probability of exceedance
35%40%
50%Nymex Henry Hub natural gas futures price for delivery during January 2014 = $3.83 per million Btu
20%
30%
11%
2%10%
0%> $4.00 / MMBtu > $4.50 / MMBtu > $5.00 / MMBtu
Source: EIA Short-Term Energy Outlook, October 2013, and CME Group (Nymex closing prices for 5 trading days
13Short-Term Energy and Winter Fuels OutlookOctober 8, 2013
ending Oct. 3, 2013)
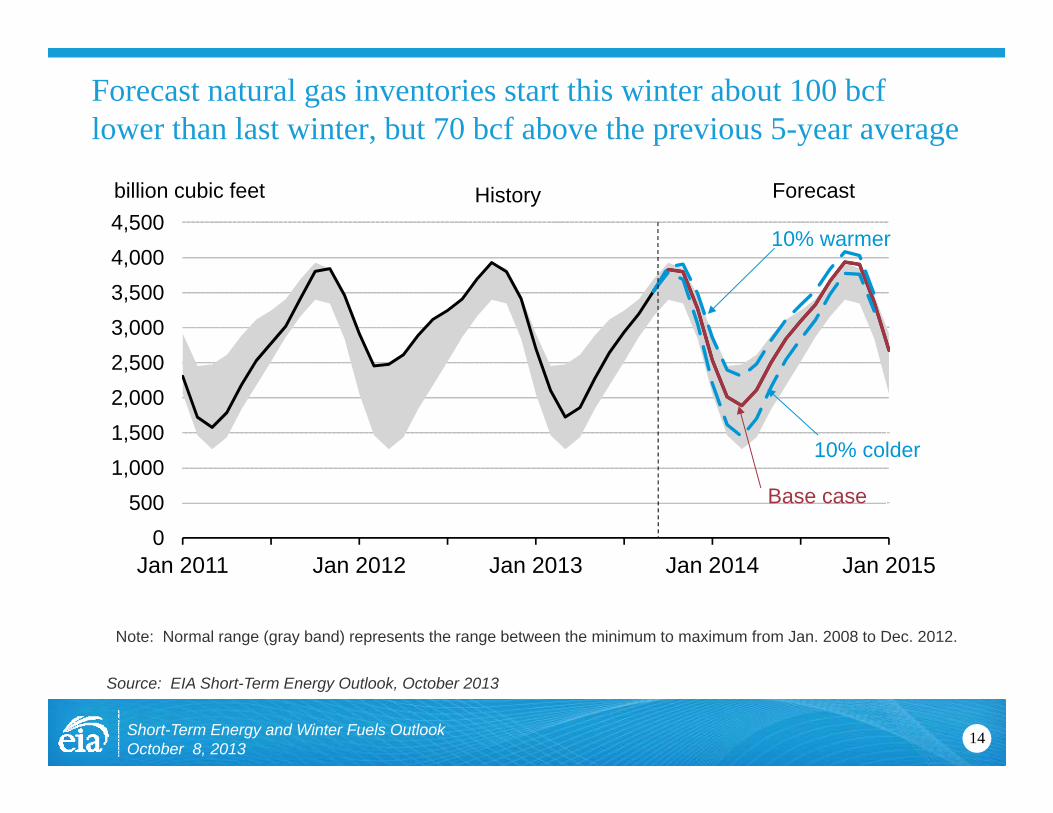
Forecast natural gas inventories start this winter about 100 bcflower than last winter, but 70 bcf above the previous 5-year average
4 0004,500billion cubic feet Forecast
10% warmer
History
2 5003,0003,5004,000
1,5002,0002,500
10% colder
0500
1,000
J 2011 J 2012 J 2013 J 2014 J 2015
Base case
Jan 2011 Jan 2012 Jan 2013 Jan 2014 Jan 2015
Note: Normal range (gray band) represents the range between the minimum to maximum from Jan. 2008 to Dec. 2012.
14Short-Term Energy and Winter Fuels OutlookOctober 8, 2013
Source: EIA Short-Term Energy Outlook, October 2013
Heating Oil
15Short-Term Energy and Winter Fuels OutlookOctober 8, 2013
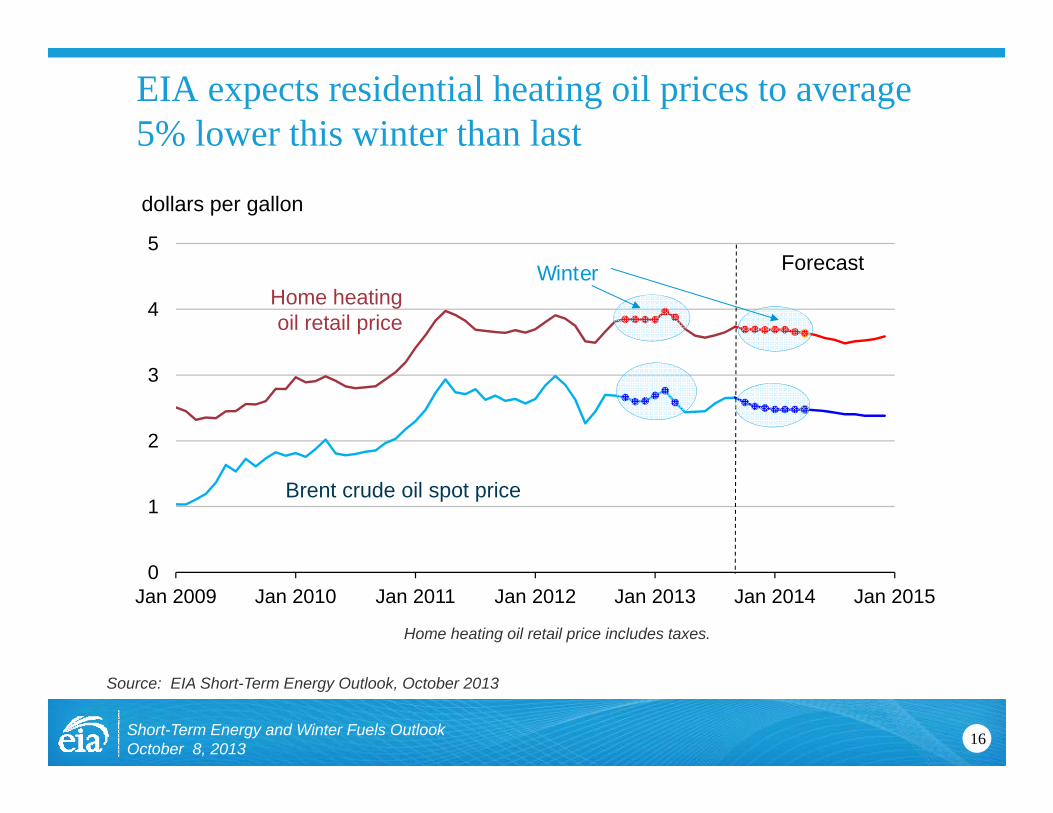
EIA expects residential heating oil prices to average 5% lower this winter than last
5
dollars per gallon
4
Winter Home heating oil retail price
Forecast
2
3
1Brent crude oil spot price
0Jan 2009 Jan 2010 Jan 2011 Jan 2012 Jan 2013 Jan 2014 Jan 2015
Home heating oil retail price includes taxes.
16Short-Term Energy and Winter Fuels OutlookOctober 8, 2013
Source: EIA Short-Term Energy Outlook, October 2013
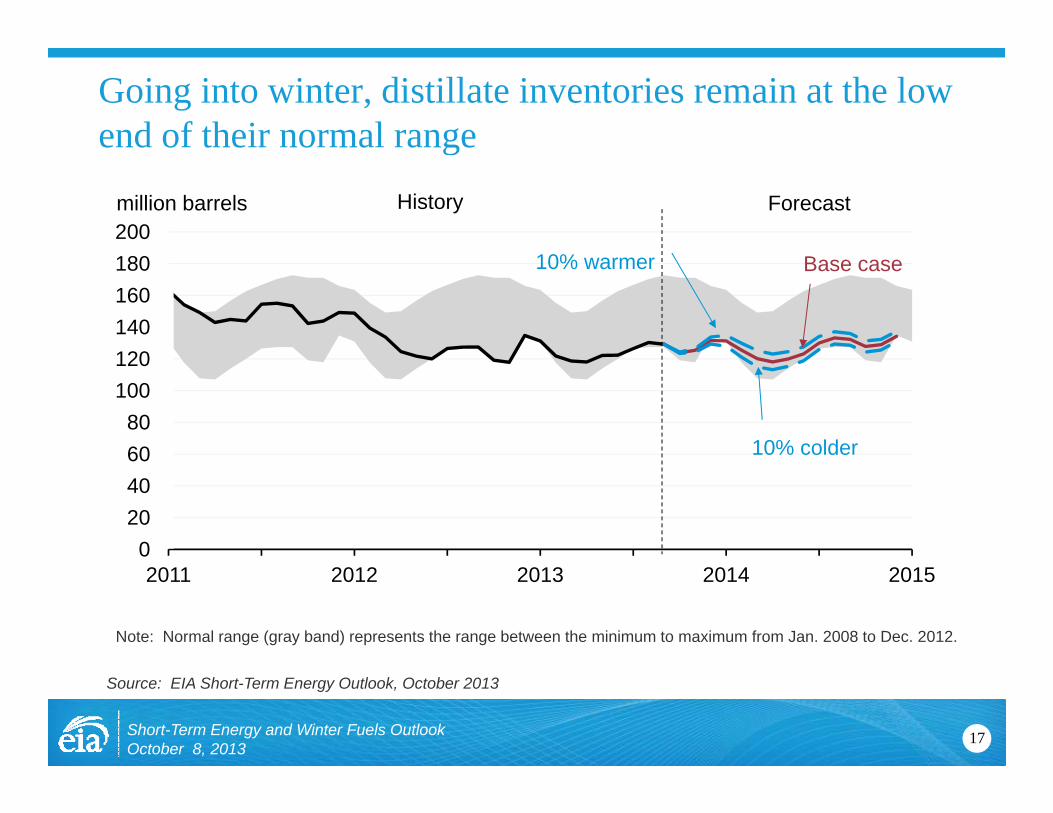
Going into winter, distillate inventories remain at the low end of their normal rangeg
200million barrels ForecastHistory
120140160180 Base case10% warmer
6080
100120
10% colder
0204060
2011 2012 2013 2014 2015
Note: Normal range (gray band) represents the range between the minimum to maximum from Jan. 2008 to Dec. 2012.
17Short-Term Energy and Winter Fuels OutlookOctober 8, 2013
Source: EIA Short-Term Energy Outlook, October 2013
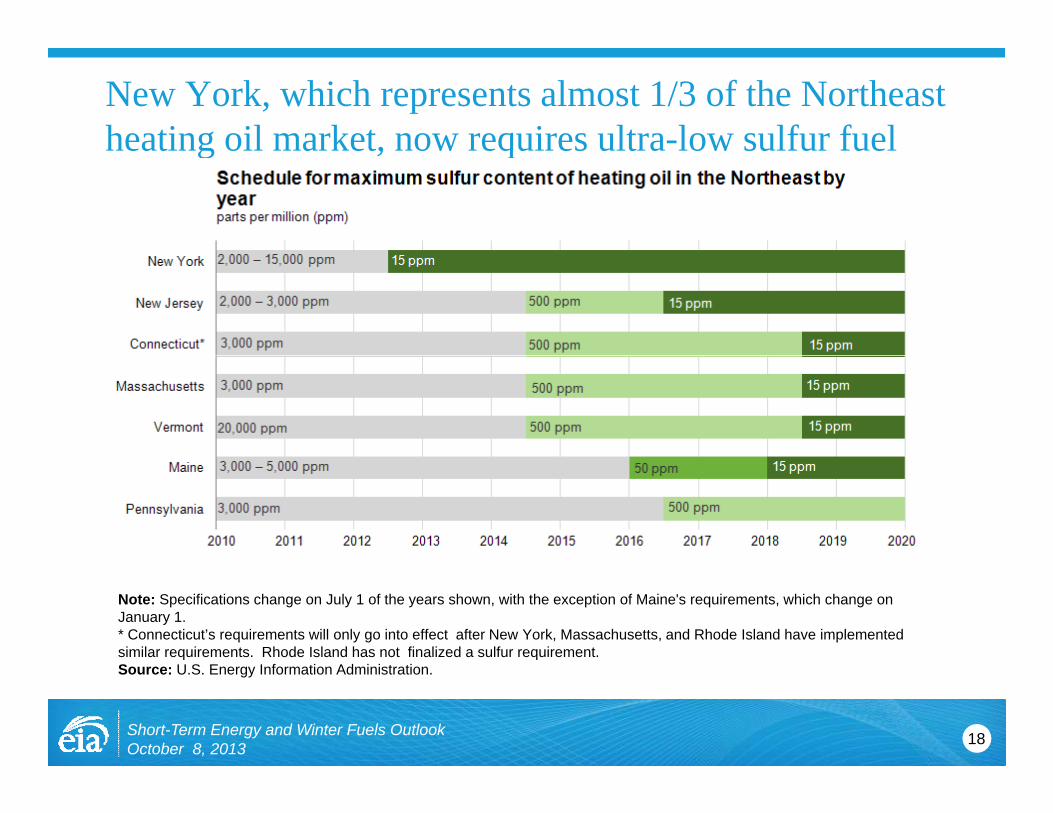
New York, which represents almost 1/3 of the Northeast heating oil market, now requires ultra-low sulfur fuelheating oil market, now requires ultra low sulfur fuel
15 ppm
15 ppm
Note: Specifications change on July 1 of the years shown, with the exception of Maine's requirements, which change on January 1.* Connecticut’s requirements will only go into effect after New York, Massachusetts, and Rhode Island have implemented similar requirements. Rhode Island has not finalized a sulfur requirement.
18Short-Term Energy and Winter Fuels OutlookOctober 8, 2013
Source: U.S. Energy Information Administration.
Electricity
19Short-Term Energy and Winter Fuels OutlookOctober 8, 2013
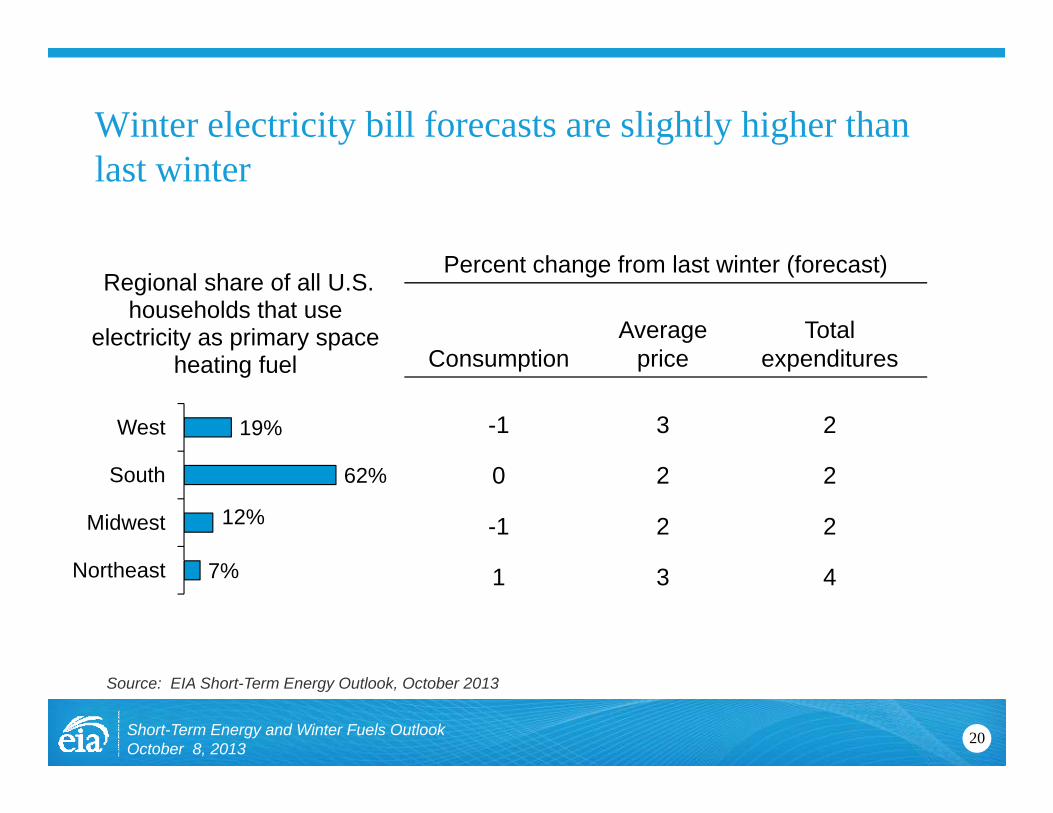
Winter electricity bill forecasts are slightly higher than last winter
Percent change from last winter (forecast)
ConsumptionAverage
priceTotal
expenditures
Regional share of all U.S. households that use
electricity as primary space f Consumption price expenditures
-1 3 219%West
heating fuel
0 2 2
-1 2 212%
62%
Midwest
South
1 3 47%Northeast
20Short-Term Energy and Winter Fuels OutlookOctober 8, 2013
Source: EIA Short-Term Energy Outlook, October 2013
Propane
21Short-Term Energy and Winter Fuels OutlookOctober 8, 2013
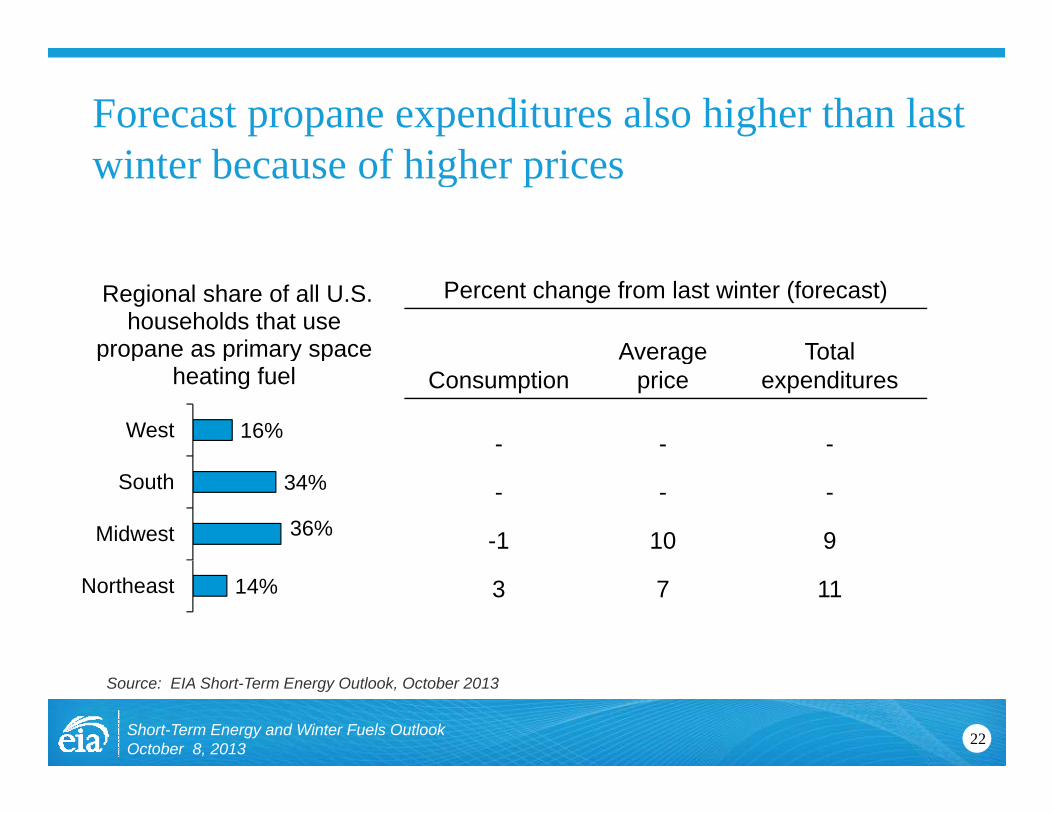
Forecast propane expenditures also higher than last i b f hi h iwinter because of higher prices
Percent change from last winter (forecast)
Average Total
Regional share of all U.S. households that use
propane as primary spaceConsumption
Average price
Total expenditures
- - -16%West
propane as primary space heating fuel
- - -
-1 10 936%
34%
Midwest
South
3 7 1114%Northeast
22Short-Term Energy and Winter Fuels OutlookOctober 8, 2013
Source: EIA Short-Term Energy Outlook, October 2013
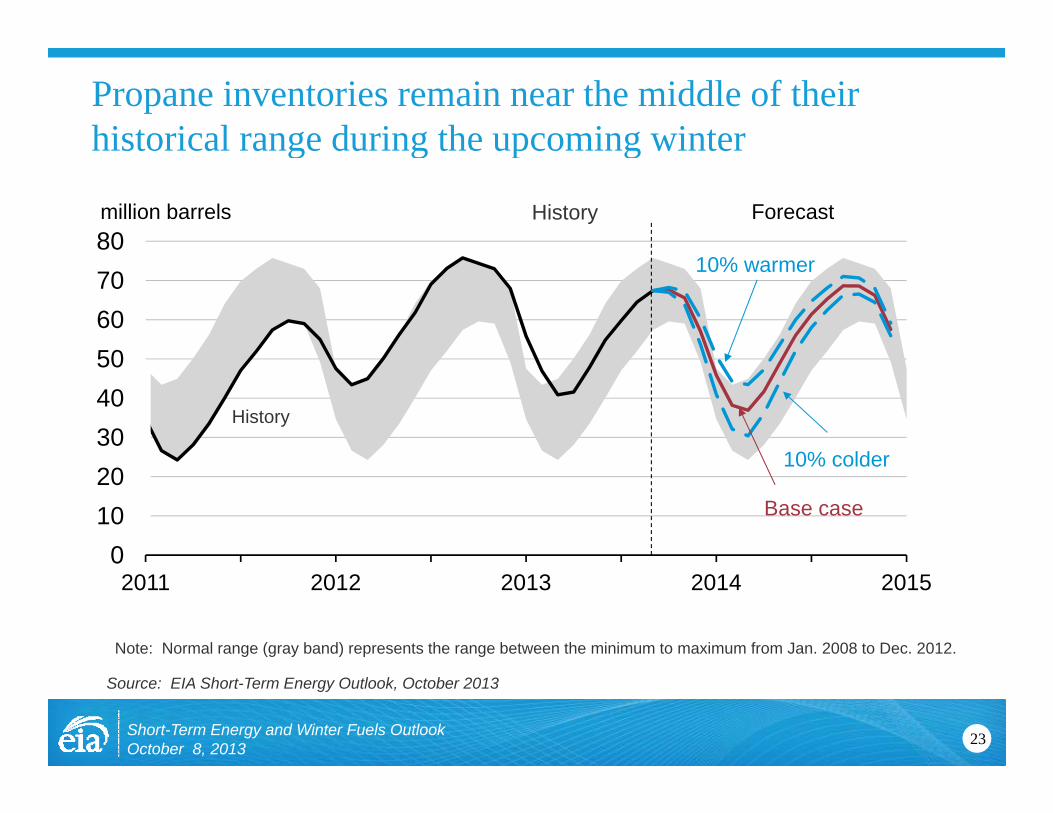
Propane inventories remain near the middle of their historical range during the upcoming winterhistorical range during the upcoming winter
80million barrels Forecast History
506070
10% warmer
304050
10% colder
History
01020
Base case
10% colder
02011 2012 2013 2014 2015
Note: Normal range (gray band) represents the range between the minimum to maximum from Jan. 2008 to Dec. 2012.
23Short-Term Energy and Winter Fuels OutlookOctober 8, 2013
Source: EIA Short-Term Energy Outlook, October 2013
For more informationFor more informationU.S. Energy Information Administration home page | www.eia.gov
Short-Term Energy Outlook | www.eia.gov/steo
Annual Energy Outlook | www.eia.gov/aeo
International Energy Outlook | www.eia.gov/ieo
Monthly Energy Review | www eia gov/merMonthly Energy Review | www.eia.gov/mer
State Energy Portal | http://www.eia.gov/state
24Short-Term Energy and Winter Fuels OutlookOctober 8, 2013