Embed Size (px)
Citation preview
A monthly newsletter from the EBRI Education and Research Fund © 2014 Employee Benefit Research Institute
June 2014 • Vol. 35, No. 6
“Short” Falls: Who’s Most Likely to Come up Short in Retirement, and When? p. 2
Consumer Engagement Among HSA and HRA Enrollees: Findings from the 2013 EBRI/Greenwald & Associates Consumer Engagement in Health Care Survey, p. 19
A T A G L A N C E
“Short” Falls: Who’s Most Likely to Come up Short in Retirement, and When? by Jack VanDerhei, Ph.D., EBRI
This Notes article provides new results showing how many years into retirement Baby Boomer and Gen Xer households are simulated to run short of money, by preretirement income quartile.
Under a variety of simulated post-retirement expense scenarios, the lowest preretirement income quartile is the cohort where the vast majority of the retirement readiness shortfall occurs, and the soonest. When nursing home and home health-care expenses are factored in, the number of households in the lowest-income quartile that is projected to run short of money within 20 years of retirement is considerably larger than those in the other three income quartiles combined.
Extending the results to a maximum of 35 years in retirement (age 100, assuming retirement at age 65), 83
percent of the lowest-income quartile households would run short of money and almost half (47 percent) of those in the second-income quartile would face a similar situation. Only 28 percent of those in the third-income quartile and 13 percent of those in the highest income quartile are simulated to run short of money eventually.
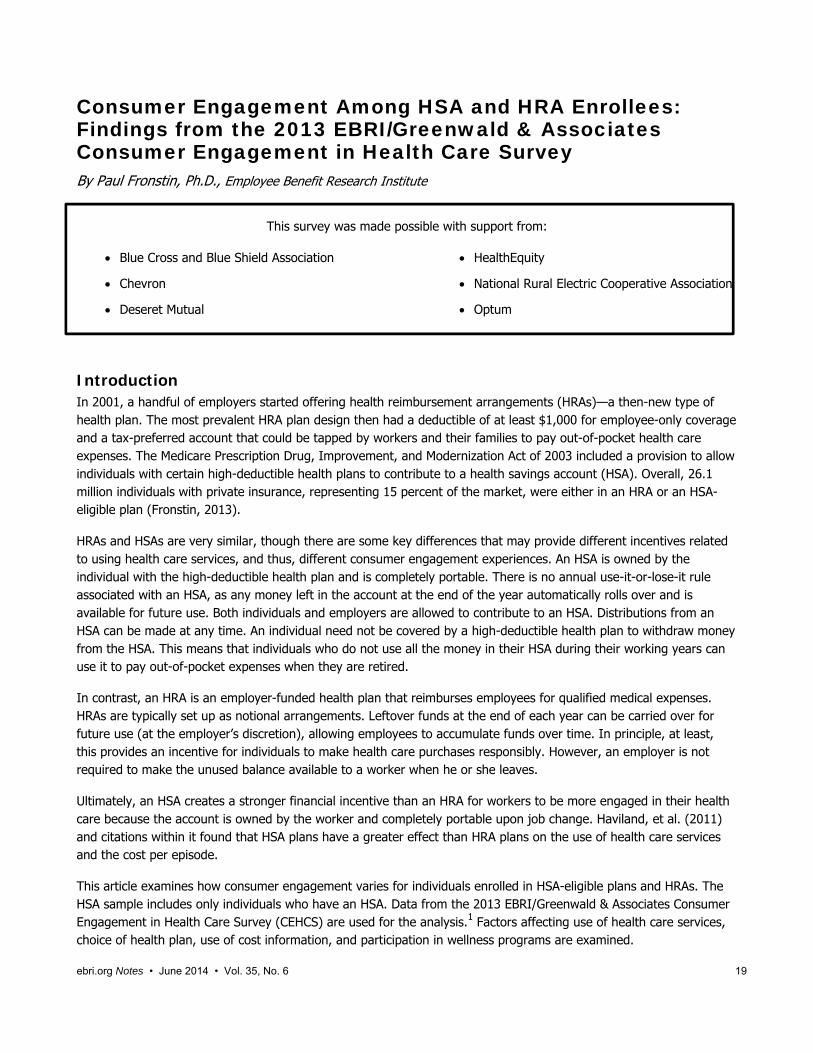
Consumer Engagement Among HSA and HRA Enrollees: Findings from the 2013 EBRI/Greenwald & Associates Consumer Engagement in Health Care Survey, By Paul Fronstin, Ph.D., EBRI
Health reimbursement arrangements (HRAs) and health savings accounts (HSAs) are very similar, though there are some key differences that may produce different incentives related to using health care services, and thus, different consumer engagement experiences.
Adults with an HSA were more likely than those with an HRA to exhibit a number of cost-conscious behaviors related to use of health care services. Those with an HSA were more likely than those with an HRA to report that they asked for a generic drug instead of a brand name; checked the price of a service before getting care; asked a doctor to recommend less costly prescriptions; developed a budget to manage health care expenses; and used an online cost-tracking tool provided by the health plan. Adults with an HSA were also more likely than those with an HRA to be engaged in their choice of health plan. Individuals with an HSA were more likely than individuals with an HRA to report that they had participated in a health-risk assessment, health-promotion program, or biometric screening program when it was available.
ebri.org Notes • June 2014 • Vol. 35, No. 6 2
“Short” Falls: Who’s Most Likely to Come up Short in Retirement, and When? By Jack VanDerhei, Ph.D., Employee Benefit Research Institute
Introduction Will Americans have enough to live on when they retire? As the pace of Baby Boomers1 crossing the traditional threshold age of retirement accelerates, so has the frequency with which this question is posed. Unfortunately, the answers provided are as diverse, and sometimes disparate, as the projection models that produce those results.
One explanation for the disparity among the results from the various models lies in the different age cohorts examined. For example, some models limit their analysis to households already retired, while others focus on households still working, but old enough that reasonably accurate projections regarding their future wages and prospects for accumulating retirement wealth are obtainable. Other models attempt to analyze the prospects for all working households, including those whose relative youth makes accurate, long-term predictions somewhat problematic. Another explanation for the wide range of results lies in the basic objective of the particular model used for the analysis.
This Notes article begins with a brief introduction of the various methods of quantifying retirement income adequacy, along with a description of EBRI’s Retirement Security Projection Model® (RSPM). This is followed by a series of results from the RSPM focusing on the percentage of Baby-Boomer and Gen-Xer2 households simulated to run short of money in retirement, as well as an estimate of how soon after retirement this is expected to take place. In that there are different perspectives on the flexibility of individuals in retirement to adjust lifestyle and/or spending, results are presented under three separate thresholds of deterministic expense (80, 90 and 100 percent of average expenses), as well as with and without nursing home and home health-care expenses.
Quantifying Retirement Income Adequacy Several different approaches have been used to quantify and model retirement income adequacy. Some either (1) model only the accumulation side of the equation and then rely on some type of preretirement income replacement rate measure as a threshold for success, or (2) make use of a so-called “life-cycle” model that attempts to smooth/spread some type of consumption-based utility over the decision-maker’s lifetime.
EBRI’s Retirement Security Projection Model® takes a different—and arguably unique—perspective, drawn from the objective of its original applications.3 Rather than focusing on an individual’s projected ability to achieve a designated percentage of his or her preretirement income as a proxy for retirement income adequacy, RSPM grew out of a multi-year project to analyze the future economic well-being of the retired population at the state level, focused on identifying the point at which individuals would run short of money and perhaps become a financial obligation of the state. EBRI and the Milbank Memorial Fund, working with the office of the governor of Oregon, set out in the late 1990s to see if this situation could be evaluated for the state.4 The resulting analysis focused primarily on simulated retirement wealth with a comparison to ad hoc thresholds for retirement expenditures.5
With the assistance of the Kansas Insurance Department, the Employee Benefit Research Institute (EBRI) was able to create the EBRI Retirement Readiness RatingTM (RRR) based on a full stochastic decumulation model that takes into account the household’s longevity risk, post-retirement investment risk, and exposure to long-term nursing-home and home health-care risks. The first state-level RSPM results were presented to the Kansas Long-Term Care Services Task Force on July 11, 2002, and the results of a separate study for the state of Massachusetts were presented on Dec. 1, 2002. Thereafter, RSPM was expanded to a national model, with the initial results presented at the EBRI-ERF Policy Forum in December 2003.6
ebri.org Notes • June 2014 • Vol. 35, No. 6 3
In that the initial stakeholders of the model were interested in determining what percentage of future retirement cohorts would run short of money in retirement and when, EBRI specifically chose not to rely on a replacement-rate target as a measure of success in RSPM, for several reasons:
Because very few households annuitize all (or even most) of their individual accounts in retirement, a replacement-rate focus would overlook the potential risk of outliving their income (longevity risk).
While the annuity purchase price relied upon in a replacement-rate target does depend on an implicit assumption with respect to (at least some) future market returns, it does not typically account for the potential investment risk associated with “risky” asset allocations (investment risk).
Previous EBRI research7 has demonstrated that one of the biggest financial obstacles in terms of maintaining retirement income adequacy for households who might otherwise have sufficient financial resources at retirement age is the risk of long-term care costs for a prolonged period. As with the annuitization experience cited above, in the real world few retirees have long-term care insurance policies in place that would cover the potentially catastrophic financial impact of this exposure. Therefore, any attempt to simply add the cost of long-term care insurance into a replacement-rate methodology will vastly underestimate the potential severity of this exposure.
In a similar vein, a life-cycle smoothing model was rejected for the development of RSPM, given the extraordinarily low levels of “optimal” savings that approach provides for low-income individuals at retirement. While there is little doubt that some households may be able to subsist at low-income levels in retirement as a result of the support from means-tested programs (including early eligibility for Medicaid), from a public policy perspective EBRI chose to establish a threshold that would allow households to afford average expenditures throughout their retirement, while at the same time accounting for the potential impact of uninsured long-term care costs.
Results One of the primary outputs of RSPM is the production of RRRs for various subgroups of the population. The RRR is defined as the percentage of simulated life-paths that do not run short of money in retirement. A previous EBRI publication used the 2014 version of RSPM to show that the RRRs for Baby Boomer and Gen Xer households ranged between 56.7 and 58.5 percent, depending on age cohort.8 When the results were analyzed by preretirement wage quartile, the RRR varied from 16.8 percent for the lowest income quartile to 86.4 percent for the highest income quartile.
This Notes article provides new results showing how many years into retirement Baby Boomer and Gen Xer households are simulated to run short of money, by preretirement income quartile. Figures 1, 3 and 5 include nursing home and home health-care expenses in the simulation, whereas Figures 2, 4 and 6 provide results if the impact of these potentially catastrophic expenses is ignored.
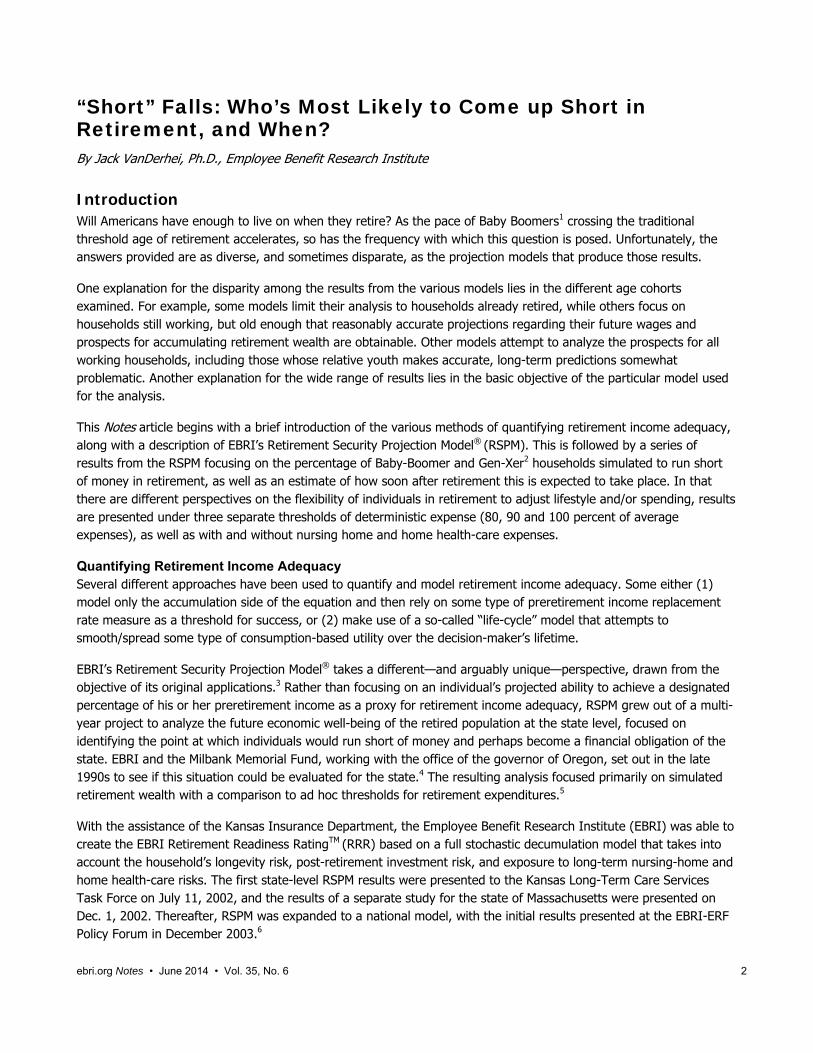
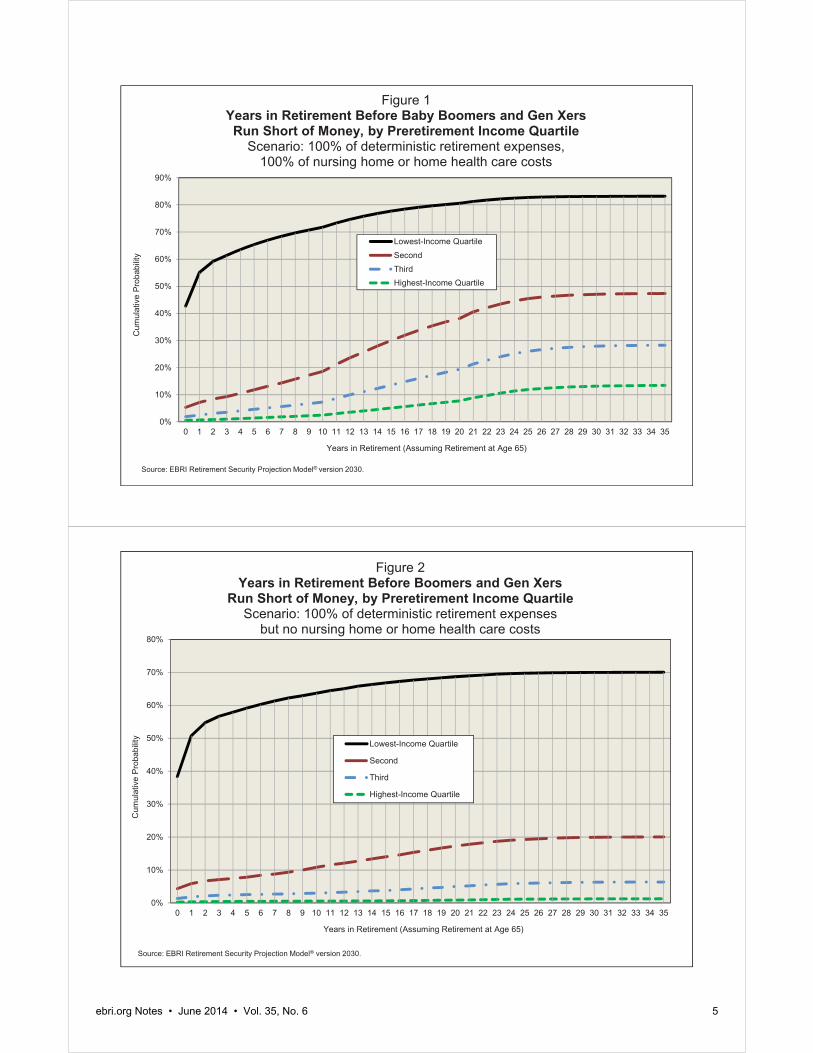
First-Year Shortfalls Figure 1 shows the results assuming that 100 percent of the simulated deterministic expenses are met; in other words, 100 percent of the average expenses (based on post-retirement income) for components likely to be encountered on a regular basis (e.g., food, housing, transportation). In addition to these relatively predictable expenses, the stochastic costs arising from nursing home and home health-care expenses are assumed to be covered in years when the model simulates their existence.
Note that in Figure 1, while 5 percent or less of those in the second-, third-, and highest-income quartiles would run short of money in the first year of retirement, more than 2 in 5 (43 percent) of those in the lowest-income quartile would, based on deterministic and stochastic costs. Moreover, by the 10th year in retirement (assuming retirement at age 65), nearly 3 in 4 (72 percent) of the lowest-income quartile households would run short of money, while fewer
ebri.org Notes • June 2014 • Vol. 35, No. 6 4
than 1 in 5 (19 percent) of those in the second-income quartile would face a similar situation. Only 7 percent of those in the third-income quartile and 2 percent of those in the highest-income quartile are simulated to run short of money within a decade.
By the 20th year in retirement (again, assuming retirement at age 65), more than 4 in 5 (81 percent) of the lowest-income quartile households would run short of money, compared with 38 percent of those in the second-income quartile that would face a similar situation. Only 19 percent of those in the third-income quartile and 8 percent of those in the highest-income quartile are simulated to run short of money by the twentieth year.
These values continue to increase until all households either run short of money or there are no surviving retirees. By the 35th year in retirement (age 100, assuming retirement at age 65), 83 percent of the lowest-income quartile households would run short of money and almost half (47 percent) of those in the second-income quartile would face a similar situation. Only 28 percent of those in the third-income quartile and 13 percent of those in the highest-income quartile are simulated to run short of money eventually.
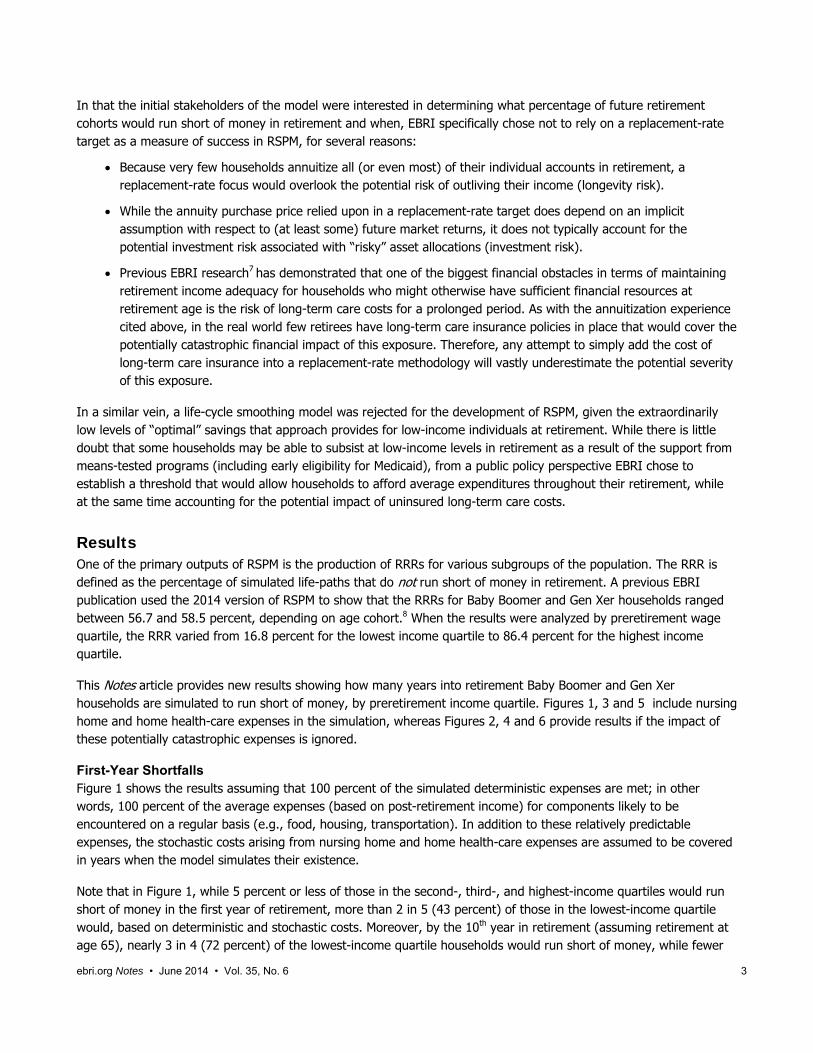
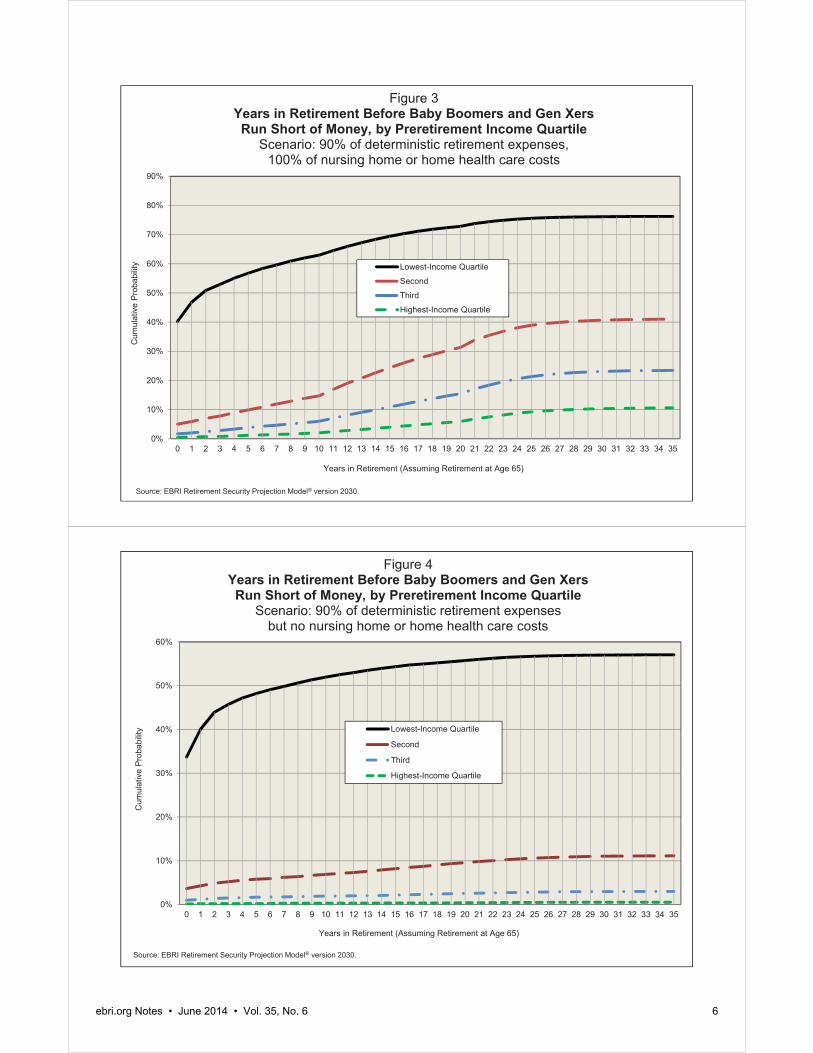
The Impact of Nursing Home and Home Health-Care Expenses Figure 2 simulates the same scenario as Figure 1 in terms of deterministic expenses, but this time the model assumes that any cost of nursing home or home health-care expenses are not borne by the household. As expected, the percentage of households in any income quartile that run short of money within a particular time period is smaller in Figure 2 than in Figure 1, where those costs are contemplated. Moreover, the differences illustrate the significance that ignoring these important costs makes in any accurate simulation of retirement income adequacy.
Although 4 percent or less of those in the second, third-, and highest-income quartiles are simulated to run short of money in the first year of retirement in Figure 2, 38 percent of those in the lowest-income quartile would have a deficit based on deterministic and stochastic costs alone. By the 10th year in retirement, 64 percent of lowest-income quartile households would run short of money, but only 11 percent of those in the second-income quartile would face a similar situation. Only 3 percent of those in the third-income quartile and 1 percent of those in the highest-income quartile are simulated to run short of money by the 10th year.
Even ignoring the cost of nursing home or home health-care expenses, by the 20th year in retirement, more than two-thirds (69 percent) of the lowest-income quartile households would run short of money. On the other hand, only 17 percent of those in the second-income quartile would face a similar situation, as would 5 percent of those in the third-income quartile and 1 percent of those in the highest-income quartile. By the 35th year in retirement, 70 percent of the lowest-income quartile households would run short of money and 20 percent of those in the second-income quartile would face a similar situation. Only 6 percent of those in the third-income quartile and 1 percent of those in the highest-income quartile are simulated to run short of money eventually.
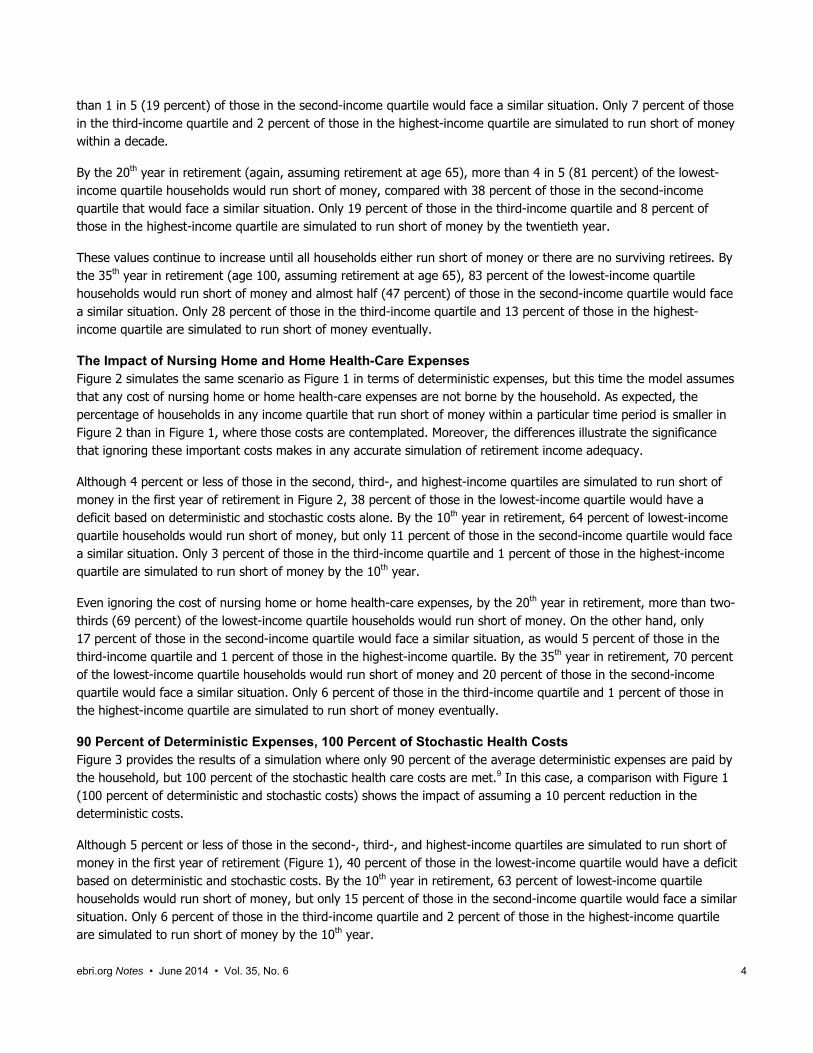
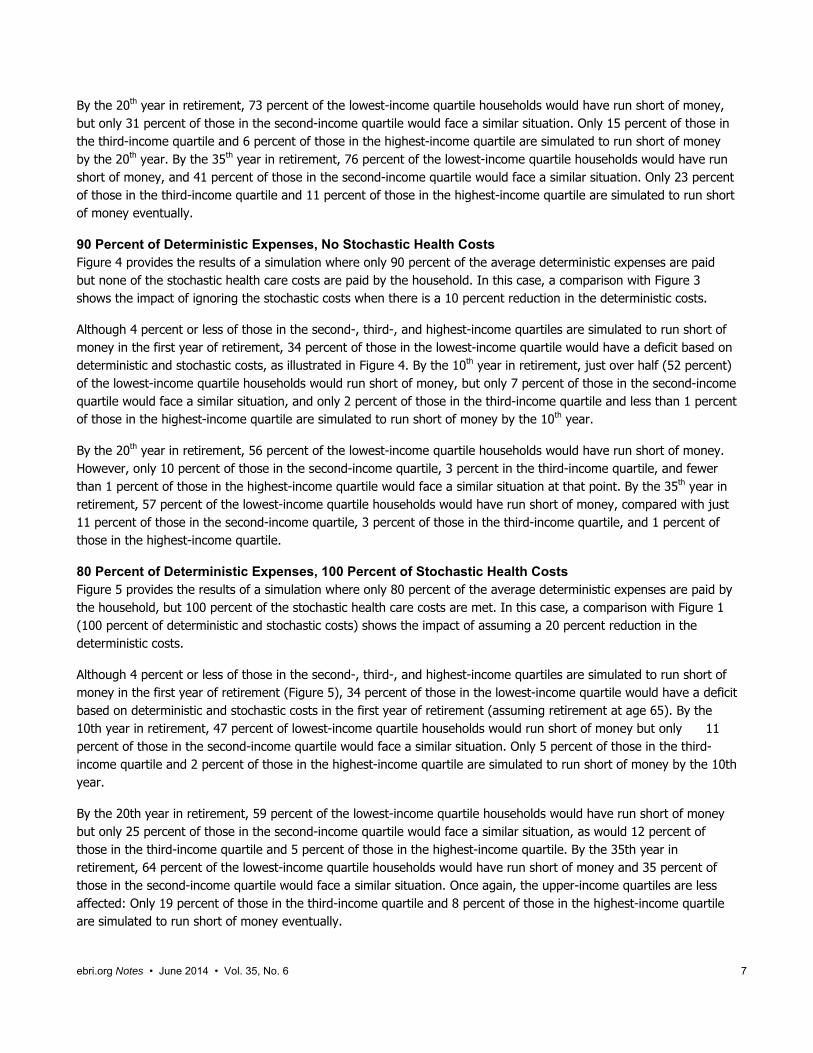
90 Percent of Deterministic Expenses, 100 Percent of Stochastic Health Costs Figure 3 provides the results of a simulation where only 90 percent of the average deterministic expenses are paid by the household, but 100 percent of the stochastic health care costs are met.9 In this case, a comparison with Figure 1 (100 percent of deterministic and stochastic costs) shows the impact of assuming a 10 percent reduction in the deterministic costs.
Although 5 percent or less of those in the second-, third-, and highest-income quartiles are simulated to run short of money in the first year of retirement (Figure 1), 40 percent of those in the lowest-income quartile would have a deficit based on deterministic and stochastic costs. By the 10th year in retirement, 63 percent of lowest-income quartile households would run short of money, but only 15 percent of those in the second-income quartile would face a similar situation. Only 6 percent of those in the third-income quartile and 2 percent of those in the highest-income quartile are simulated to run short of money by the 10th year.
0%
10%
20%
30%
40%
50%
60%
70%
80%
90%
0 1 2 3 4 5 6 7 8 9 10 11 12 13 14 15 16 17 18 19 20 21 22 23 24 25 26 27 28 29 30 31 32 33 34 35
Cum
ulat
ive
Prob
abilit
y
Years in Retirement (Assuming Retirement at Age 65)
Lowest-Income QuartileSecondThirdHighest-Income Quartile
Figure 1Years in Retirement Before Baby Boomers and Gen Xers Run Short of Money, by Preretirement Income Quartile
Scenario: 100% of deterministic retirement expenses, 100% of nursing home or home health care costs
Source: EBRI Retirement Security Projection Model® version 2030.
0%
10%
20%
30%
40%
50%
60%
70%
80%
0 1 2 3 4 5 6 7 8 9 10 11 12 13 14 15 16 17 18 19 20 21 22 23 24 25 26 27 28 29 30 31 32 33 34 35
Cum
ulat
ive
Prob
abilit
y
Years in Retirement (Assuming Retirement at Age 65)
Lowest-Income Quartile
Second
Third
Highest-Income Quartile
Figure 2Years in Retirement Before Boomers and Gen Xers
Run Short of Money, by Preretirement Income Quartile Scenario: 100% of deterministic retirement expenses
but no nursing home or home health care costs
Source: EBRI Retirement Security Projection Model® version 2030.
ebri.org Notes • June 2014 • Vol. 35, No. 6 5
0%
10%
20%
30%
40%
50%
60%
70%
80%
90%
0 1 2 3 4 5 6 7 8 9 10 11 12 13 14 15 16 17 18 19 20 21 22 23 24 25 26 27 28 29 30 31 32 33 34 35
Cum
ulat
ive
Prob
abilit
y
Years in Retirement (Assuming Retirement at Age 65)
Lowest-Income Quartile
Second
Third
Highest-Income Quartile
Figure 3Years in Retirement Before Baby Boomers and Gen Xers Run Short of Money, by Preretirement Income Quartile
Scenario: 90% of deterministic retirement expenses, 100% of nursing home or home health care costs
Source: EBRI Retirement Security Projection Model® version 2030.
0%
10%
20%
30%
40%
50%
60%
0 1 2 3 4 5 6 7 8 9 10 11 12 13 14 15 16 17 18 19 20 21 22 23 24 25 26 27 28 29 30 31 32 33 34 35
Cum
ulat
ive
Prob
abilit
y
Years in Retirement (Assuming Retirement at Age 65)
Lowest-Income Quartile
Second
Third
Highest-Income Quartile
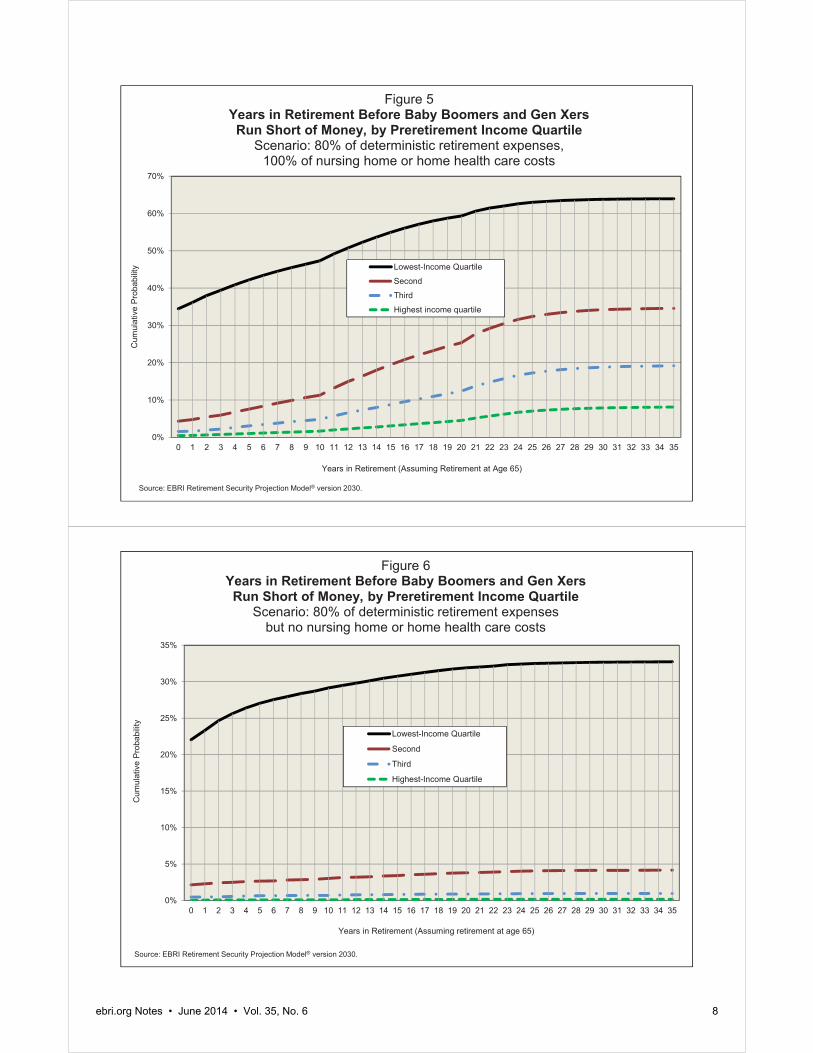
Figure 4Years in Retirement Before Baby Boomers and Gen Xers Run Short of Money, by Preretirement Income Quartile
Scenario: 90% of deterministic retirement expenses but no nursing home or home health care costs
Source: EBRI Retirement Security Projection Model® version 2030.
ebri.org Notes • June 2014 • Vol. 35, No. 6 6
ebri.org Notes • June 2014 • Vol. 35, No. 6 7
By the 20th year in retirement, 73 percent of the lowest-income quartile households would have run short of money, but only 31 percent of those in the second-income quartile would face a similar situation. Only 15 percent of those in the third-income quartile and 6 percent of those in the highest-income quartile are simulated to run short of money by the 20th year. By the 35th year in retirement, 76 percent of the lowest-income quartile households would have run short of money, and 41 percent of those in the second-income quartile would face a similar situation. Only 23 percent of those in the third-income quartile and 11 percent of those in the highest-income quartile are simulated to run short of money eventually.
90 Percent of Deterministic Expenses, No Stochastic Health Costs Figure 4 provides the results of a simulation where only 90 percent of the average deterministic expenses are paid but none of the stochastic health care costs are paid by the household. In this case, a comparison with Figure 3 shows the impact of ignoring the stochastic costs when there is a 10 percent reduction in the deterministic costs.
Although 4 percent or less of those in the second-, third-, and highest-income quartiles are simulated to run short of money in the first year of retirement, 34 percent of those in the lowest-income quartile would have a deficit based on deterministic and stochastic costs, as illustrated in Figure 4. By the 10th year in retirement, just over half (52 percent) of the lowest-income quartile households would run short of money, but only 7 percent of those in the second-income quartile would face a similar situation, and only 2 percent of those in the third-income quartile and less than 1 percent of those in the highest-income quartile are simulated to run short of money by the 10th year.
By the 20th year in retirement, 56 percent of the lowest-income quartile households would have run short of money. However, only 10 percent of those in the second-income quartile, 3 percent in the third-income quartile, and fewer than 1 percent of those in the highest-income quartile would face a similar situation at that point. By the 35th year in retirement, 57 percent of the lowest-income quartile households would have run short of money, compared with just 11 percent of those in the second-income quartile, 3 percent of those in the third-income quartile, and 1 percent of those in the highest-income quartile.
80 Percent of Deterministic Expenses, 100 Percent of Stochastic Health Costs Figure 5 provides the results of a simulation where only 80 percent of the average deterministic expenses are paid by the household, but 100 percent of the stochastic health care costs are met. In this case, a comparison with Figure 1 (100 percent of deterministic and stochastic costs) shows the impact of assuming a 20 percent reduction in the deterministic costs.
Although 4 percent or less of those in the second-, third-, and highest-income quartiles are simulated to run short of money in the first year of retirement (Figure 5), 34 percent of those in the lowest-income quartile would have a deficit based on deterministic and stochastic costs in the first year of retirement (assuming retirement at age 65). By the 10th year in retirement, 47 percent of lowest-income quartile households would run short of money but only 11 percent of those in the second-income quartile would face a similar situation. Only 5 percent of those in the third-income quartile and 2 percent of those in the highest-income quartile are simulated to run short of money by the 10th year.
By the 20th year in retirement, 59 percent of the lowest-income quartile households would have run short of money but only 25 percent of those in the second-income quartile would face a similar situation, as would 12 percent of those in the third-income quartile and 5 percent of those in the highest-income quartile. By the 35th year in retirement, 64 percent of the lowest-income quartile households would have run short of money and 35 percent of those in the second-income quartile would face a similar situation. Once again, the upper-income quartiles are less affected: Only 19 percent of those in the third-income quartile and 8 percent of those in the highest-income quartile are simulated to run short of money eventually.
0%
10%
20%
30%
40%
50%
60%
70%
0 1 2 3 4 5 6 7 8 9 10 11 12 13 14 15 16 17 18 19 20 21 22 23 24 25 26 27 28 29 30 31 32 33 34 35
Cum
ulat
ive
Prob
abilit
y
Years in Retirement (Assuming Retirement at Age 65)
Lowest-Income Quartile
Second
Third
Highest income quartile
Figure 5Years in Retirement Before Baby Boomers and Gen Xers Run Short of Money, by Preretirement Income Quartile
Scenario: 80% of deterministic retirement expenses, 100% of nursing home or home health care costs
Source: EBRI Retirement Security Projection Model® version 2030.
0%
5%
10%
15%
20%
25%
30%
35%
0 1 2 3 4 5 6 7 8 9 10 11 12 13 14 15 16 17 18 19 20 21 22 23 24 25 26 27 28 29 30 31 32 33 34 35
Cum
ulat
ive
Prob
abilit
y
Years in Retirement (Assuming retirement at age 65)
Lowest-Income Quartile
Second
Third
Highest-Income Quartile
Figure 6Years in Retirement Before Baby Boomers and Gen Xers Run Short of Money, by Preretirement Income Quartile
Scenario: 80% of deterministic retirement expenses but no nursing home or home health care costs
Source: EBRI Retirement Security Projection Model® version 2030.
ebri.org Notes • June 2014 • Vol. 35, No. 6 8
ebri.org Notes • June 2014 • Vol. 35, No. 6 9
80 Percent of Deterministic Expenses, No Stochastic Health Costs Finally, Figure 6 provides the results of a simulation where only 80 percent of the average deterministic expenses are paid, but none of the stochastic health care costs are paid by the household. In this case, a comparison with Figure 5 shows the impact of ignoring the stochastic costs when there is a 20 percent reduction in the deterministic costs.
Although 2 percent or less of those in the second-, third- and highest-income quartiles are simulated to run short of money in the first year of retirement, 22 percent of those in the lowest-income quartile would have a deficit based on deterministic and stochastic costs. By the 10th year in retirement, 29 percent of lowest-income quartile households would run short of money but only 3 percent of those in the second-income quartile, only 1 percent of those in the third-income quartile, and less than 1 percent of those in the highest-income quartile are simulated to run short of money.
By the 20th year in retirement, 32 percent of the lowest-income quartile households would have run short of money. In contrast, only 4 percent of those in the second-income quartile would face a similar situation, and only 1 percent of those in the third-income quartile and less than 1 percent of those in the highest-income quartile are simulated to run short of money by that point. By the 35th year in retirement, a third of the lowest-income quartile households would have run short of money, while only 4 percent of those in the second-income quartile, 1 percent of those in the third-income quartile, and less than 1 percent of those in the highest-income quartile are simulated to run short of money eventually.
Summary The results presented in Figures 1 through 6 show that the years of retirement before Baby Boomer and Gen Xer households run short of money vary tremendously by:
Preretirement-income quartile.
The percentage of average deterministic costs assumed paid by the household.
Whether or not nursing home and home health-care expenses are included in the simulation.
However, even when 100 percent of average deterministic costs are paid by the household and nursing home and home health-care expenses are included (Figure 1), only the households in the lowest-income quartile eventually end up with a majority of the households running short of money during retirement.
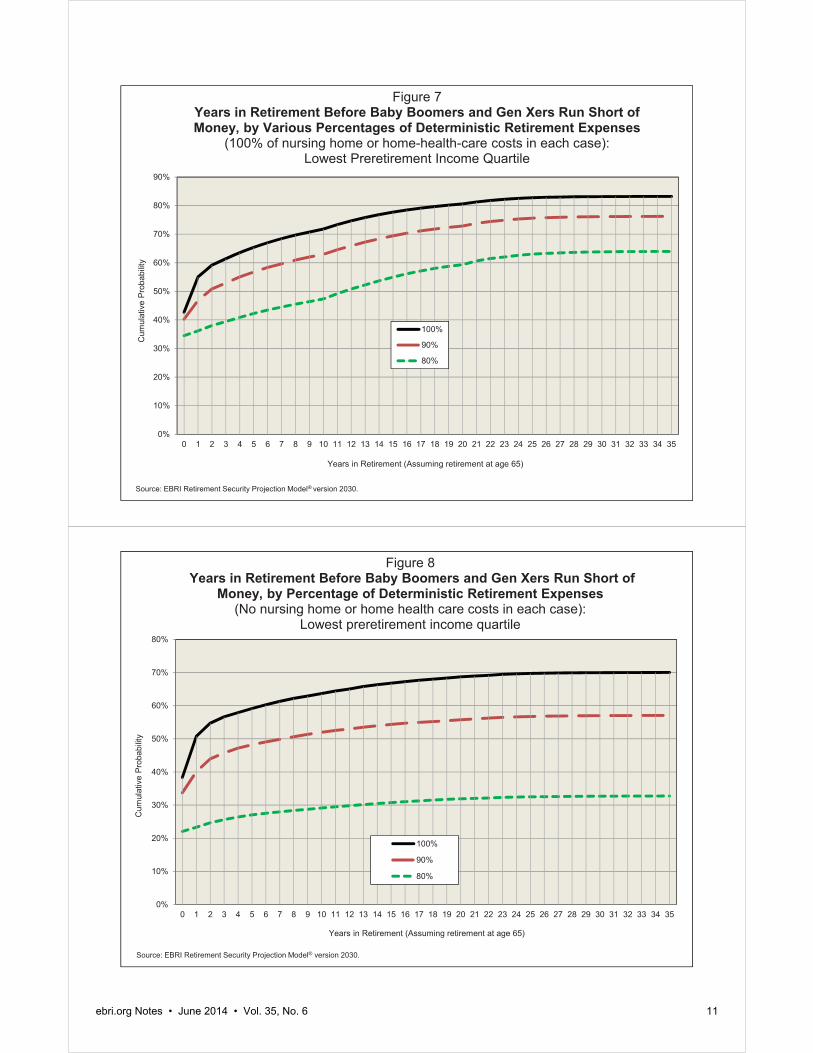
Figure 7 summarizes the results for the households in the lowest-income quartile from Figures 1, 3 and 5. The results show that even if this cohort were able to sustain a lifestyle assuming a 20 percent reduction in average deterministic costs, the percentage of households that would run short of money by the 35th year of retirement would only decrease from 83 percent to 64 percent. Figure 8 summarizes the results for the households in the lowest-income quartile from Figures 2, 4 and 6. The results show that if this cohort were able to sustain a 20 percent reduction in average deterministic costs, and if the financial implications from nursing home and home health-care costs are ignored, the percentage of households who are projected to run short of money in retirement would decrease substantially: from 70 percent to 33 percent by the 35th year of retirement.
Each of the six analyses with results presented in Figures 1 through 6 show the same stark conclusion: The lowest preretirement income quartile is the cohort where the vast majority of the shortfall occurs, and the soonest. When nursing home and home health-care expenses are factored in (Figures 1, 3 and 5), the number of households in the lowest-income quartile that is projected to run short of money within 20 years of retirement is considerably larger than those in the other three income quartiles combined. Indeed, as the results across multiple scenarios and
ebri.org Notes • June 2014 • Vol. 35, No. 6 10
assumptions show, the lowest-income quartile is the most vulnerable, while longevity and long-term care are the biggest risk factors across the entire income spectrum.10
In presenting these results, EBRI does not favor or oppose any specific modification to the current retirement system. Rather, EBRI’s mission remains to provide objective analysis that can inform decision making by others. As the various design and program modification alternatives are debated (both reforms and status quo), it is instructive to keep in mind who’s most likely to come up short in retirement, when, and why.
0%
10%
20%
30%
40%
50%
60%
70%
80%
90%
0 1 2 3 4 5 6 7 8 9 10 11 12 13 14 15 16 17 18 19 20 21 22 23 24 25 26 27 28 29 30 31 32 33 34 35
Cum
ulat
ive
Prob
abilit
y
Years in Retirement (Assuming retirement at age 65)
100%
90%
80%
Figure 7Years in Retirement Before Baby Boomers and Gen Xers Run Short of Money, by Various Percentages of Deterministic Retirement Expenses
(100% of nursing home or home-health-care costs in each case): Lowest Preretirement Income Quartile
Source: EBRI Retirement Security Projection Model® version 2030.
0%
10%
20%
30%
40%
50%
60%
70%
80%
0 1 2 3 4 5 6 7 8 9 10 11 12 13 14 15 16 17 18 19 20 21 22 23 24 25 26 27 28 29 30 31 32 33 34 35
Cum
ulat
ive
Prob
abilit
y
Years in Retirement (Assuming retirement at age 65)
100%
90%
80%
Figure 8Years in Retirement Before Baby Boomers and Gen Xers Run Short of
Money, by Percentage of Deterministic Retirement Expenses (No nursing home or home health care costs in each case):
Lowest preretirement income quartile
Source: EBRI Retirement Security Projection Model® version 2030.
ebri.org Notes • June 2014 • Vol. 35, No. 6 11
ebri.org Notes • June 2014 • Vol. 35, No. 6 12
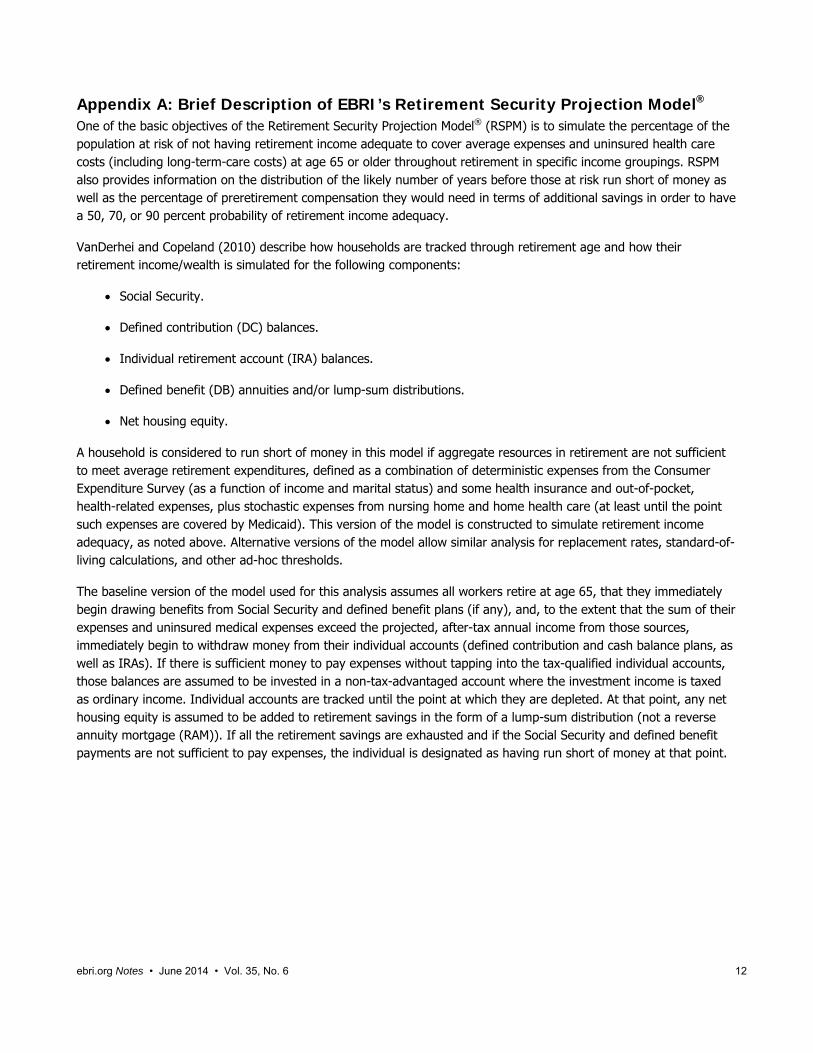
Appendix A: Brief Description of EBRI’s Retirement Security Projection Model® One of the basic objectives of the Retirement Security Projection Model® (RSPM) is to simulate the percentage of the population at risk of not having retirement income adequate to cover average expenses and uninsured health care costs (including long-term-care costs) at age 65 or older throughout retirement in specific income groupings. RSPM also provides information on the distribution of the likely number of years before those at risk run short of money as well as the percentage of preretirement compensation they would need in terms of additional savings in order to have a 50, 70, or 90 percent probability of retirement income adequacy.
VanDerhei and Copeland (2010) describe how households are tracked through retirement age and how their retirement income/wealth is simulated for the following components:
Social Security.
Defined contribution (DC) balances.
Individual retirement account (IRA) balances.
Defined benefit (DB) annuities and/or lump-sum distributions.
Net housing equity.
A household is considered to run short of money in this model if aggregate resources in retirement are not sufficient to meet average retirement expenditures, defined as a combination of deterministic expenses from the Consumer Expenditure Survey (as a function of income and marital status) and some health insurance and out-of-pocket, health-related expenses, plus stochastic expenses from nursing home and home health care (at least until the point such expenses are covered by Medicaid). This version of the model is constructed to simulate retirement income adequacy, as noted above. Alternative versions of the model allow similar analysis for replacement rates, standard-of-living calculations, and other ad-hoc thresholds.
The baseline version of the model used for this analysis assumes all workers retire at age 65, that they immediately begin drawing benefits from Social Security and defined benefit plans (if any), and, to the extent that the sum of their expenses and uninsured medical expenses exceed the projected, after-tax annual income from those sources, immediately begin to withdraw money from their individual accounts (defined contribution and cash balance plans, as well as IRAs). If there is sufficient money to pay expenses without tapping into the tax-qualified individual accounts, those balances are assumed to be invested in a non-tax-advantaged account where the investment income is taxed as ordinary income. Individual accounts are tracked until the point at which they are depleted. At that point, any net housing equity is assumed to be added to retirement savings in the form of a lump-sum distribution (not a reverse annuity mortgage (RAM)). If all the retirement savings are exhausted and if the Social Security and defined benefit payments are not sufficient to pay expenses, the individual is designated as having run short of money at that point.
ebri.org Notes • June 2014 • Vol. 35, No. 6 13
Appendix B: Brief Chronology of the EBRI Retirement Security Projection Model® The Retirement Security Projection Model® (RSPM) grew out of a multi-year project to analyze the future economic
well-being of the retired population at the state level. The Employee Benefit Research Institute (EBRI) and the
Milbank Memorial Fund, working with the office of the governor of Oregon, set out in the late 1990s to see if this
situation could be evaluated for the state. The resulting analysis (VanDerhei and Copeland, September 2001)
focused primarily on simulated retirement wealth with a comparison to ad hoc thresholds for retirement expenditures.
The April 2001 EBRI Issue Brief (VanDerhei and Copeland, April 2001) highlighted the changes in private pension
plan participation for defined benefit (DB) and defined contribution (DC) plans and used the model to quantify how
much the importance of individual-account plans was expected to increase because of these changes.
With the assistance of the Kansas Insurance Department, EBRI was able to create the EBRI Retirement Readiness
RatingTM (RRR) based on a full stochastic decumulation model that took into account the household’s longevity risk,
post-retirement investment risk, and exposure to potentially catastrophic nursing home and home health-care risks.
The first state-level RSPM results were presented to the Kansas Long-Term Care Services Task Force on July 11,
2002 (VanDerhei and Copeland, July 2002), and the results of the Massachusetts study were presented on Dec. 1,
2002 (VanDerhei and Copeland, December 2002).
RSPM was expanded to a national model—the first national, micro-simulation, retirement-income-adequacy model,
built in part from administrative 401(k) data. The initial results were presented at the EBRI December 2003 policy
forum (VanDerhei and Copeland, 2003).
The basic model was subsequently modified for testimony for the Senate Special Committee on Aging to quantify
the beneficial impact of a mandatory contribution of 5 percent of compensation (VanDerhei, 2004).
The model was enhanced to allow an analysis of the impact of annuitizing defined contribution and individual
retirement account (IRA) balances at retirement age (VanDerhei and Copeland, 2004).
Additional refinements were introduced to evaluate the impact of purchasing long-term care insurance on retirement
income adequacy (VanDerhei, 2005).
The model was used to evaluate the impact of defined benefit freezes on participants by simulating the minimum
employer-contribution rate that would be needed to financially indemnify the employees for the reduction in their
expected retirement income under various rate-of-return assumptions (VanDerhei, March 2006).
Later that year, an updated version of the model was developed to enhance the EBRI interactive Ballpark E$timate®
by providing Monte Carlo simulations of the replacement rates needed for specific probabilities of retirement-income
adequacy under alternative-risk-management treatments (VanDerhei, September 2006).
RSPM was significantly enhanced for the May 2008 EBRI policy forum by allowing automatic enrollment of 401(k)
participants with the potential for automatic escalation of contributions to be included (VanDerhei and Copeland,
2008).
Additional modifications were added for a Pension Research Council presentation that involved a “winners/losers”
analysis of defined benefit freezes and the enhanced employer contributions provided to defined contribution plans
at the time the defined benefit plans were frozen (Copeland and VanDerhei, 2010).
Also in 2009, a new subroutine was added to allow simulations of various styles of target-date funds for a
comparison with participant-directed investments (VanDerhei, June 2009).
In April 2010, the model was completely re-parameterized with 401(k)-plan design parameters for sponsors that had
adopted automatic-enrollment provisions (VanDerhei, April 2010).
A completely updated version of the national model was produced for the May 2010 EBRI policy forum and used in
the July 2010 EBRI Issue Brief (VanDerhei and Copeland, 2010).
ebri.org Notes • June 2014 • Vol. 35, No. 6 14
The new model was used to analyze how eligibility for participation in a defined contribution plan impacts retirement
income adequacy in September 2010 (VanDerhei, September 2010), and was later used to compute Retirement
Savings Shortfalls (RSS) for Baby Boomers and Generation Xers in October 2010 (VanDerhei, October 2010a).
In October 2010 testimony before the Senate Health, Education, Labor and Pensions Committee on “The Wobbly
Stool: Retirement (In)security in America,” the model was used to analyze the relative importance of employer-
provided retirement benefits and Social Security (VanDerhei, October 2010b).
The November 2010 EBRI Issue Brief expanded upon earlier work by EBRI to provide the first results of a new
simulation model that estimated the impact of changing 401(k) plan design variables and assumptions on retirement
income adequacy. Until recently however, there was extremely limited evidence on the impact of automatic
contribution escalation (VanDerhei and Lucas, 2010).
In February 2011, the model was used to analyze the impact of the 2008–2009 crisis in the financial and real estate
markets on retirement income adequacy (VanDerhei, February 2011).
An April 2011 article introduced a new method of analyzing the results from RSPM (VanDerhei, April 2011). Rather
than simply computing an overall percentage of the simulated life paths in a particular cohort that would not have
sufficient retirement income to pay for the simulated expenses, the new method computed the percentage of
households that would meet that requirement more than a specified percentage of times in the simulation.
As explored in the June 2011 EBRI Issue Brief, the RSPM allowed retirement-income adequacy to be assessed at
retirement ages later than 65 (VanDerhei and Copeland, June 2011).
In a July 2011 EBRI Notes article (VanDerhei, July 2011), RSPM was used to provide preliminary evidence of the
impact of the “20/20 caps” on projected retirement accumulations proposed by the National Commission on Fiscal
Responsibility and Reform.
The August 2011 EBRI Notes article (VanDerhei, August 2011) used RSPM to analyze the impact of defined benefit
plans in achieving retirement income adequacy for Baby Boomers and Gen Xers.
In September, it was used to support testimony before the Senate Finance Committee (VanDerhei, September
2011) in analyzing the potential impact of various types of tax-reform options on retirement income. This was
expanded in the November 2011 EBRI Issue Brief (VanDerhei, November 2011).
A March 2012 EBRI Notes article (VanDerhei, March 2012) used new survey results to update the analysis of the
potential impact of various types of tax-reform options on retirement income.
The May 2012 EBRI Notes article (VanDerhei, May 2012) provided 2012 updates for the previously published RRRs
as well as the RSS.
The June 2012 EBRI Notes article (VanDerhei, June 2012) introduced severity categories in the RSS projections for
Gen Xers.
The August 2012 EBRI Notes article (VanDerhei, August 2012) provided additional evidence on whether deferring
retirement to age 70 would provide retirement income adequacy for the vast majority of Baby Boomers and Gen
Xers.
The September 2012 EBRI Notes article (VanDerhei, September 2012) analyzed the impact of increasing the
default-contribution rate for automatic enrollment 401(k) plans with automatic escalation of contributions.
The November 2012 EBRI Notes article (VanDerhei, November 2012) reclassified the RRRs to provide additional
information on those substantially above the threshold; close to the threshold; and substantially below the threshold.
The March 2013 EBRI Notes article (VanDerhei and Adams, March 2013) used a modified version of RSPM to
assess the probability that respondent households would not run short of money in retirement if they did, in fact,
accumulate the amount they said would be required in the 2013 Retirement Confidence Survey.
ebri.org Notes • June 2014 • Vol. 35, No. 6 15
The June 2013 EBRI Issue Brief (VanDerhei, June 2013a) used RSPM to provide a direct comparison of the likely
benefits under specific types of DC and DB retirement plans.
The June 2013 EBRI Notes article (VanDerhei, June 2013b) used RSPM to show that 25–27 percent of Baby
Boomers and Gen Xers who would have had adequate retirement income under return assumptions based on
historical averages were simulated to end up running short of money in retirement if today’s historically low interest
rates were assumed to be a permanent condition.
The August 2013 EBRI Issue Brief (VanDerhei, August 2013) used RSPM to analyze the Obama administration’s
fiscal year (FY) 2014 budget proposal to include a cap on tax-deferred retirement savings that would limit the
amounts accumulated in specified retirement accounts to that necessary to provide the maximum annuity permitted
for a tax-qualified defined benefit plan under current law.
The December 2013 EBRI Notes article (VanDerhei, December 2013) used RSPM to expand the analysis in the
June 2013 EBRI Issue Brief. Rather than trying to reflect the real-world variation in DB accruals, the baseline
analysis in the previous analysis used the median accrual rate in the sample (1.5 percent of final compensation per
year of participation) as the stylized value for the baseline counterfactual simulations. The new research computed
the actual final-average DB accrual that would be required to provide an equal amount of retirement income at age
65 as would be produced by the annuitized value of the projected sum of the 401(k) and IRA rollover balances.
The January 2014 EBRI Notes article (VanDerhei, January 2014) used RSPM to model the likelihood that 401(k)
participants currently ages 25–29 would have sufficient 401(k) accumulations that, when combined with Social
Security benefits, could replace 60, 70 or 80 percent of their preretirement income on an inflation-adjusted basis.
The February 2014 EBRI Issue Brief (VanDerhei, February 2014) focused on how the probability of not running short
of money in retirement varies with respect to longevity, investment return, and potential long-term health care costs
in retirement (e.g., nursing home costs).
References Copeland, Craig, and Jack VanDerhei. “The Declining Role of Private Defined Benefit Pension Plans: Who Is Affected, and
How.” In Robert L. Clark and Olivia Mitchell, eds., Reorienting Retirement Risk Management. New York: Oxford
University Press for the Pension Research Council, 2010: 122–136.
VanDerhei, Jack. “What Causes EBRI Retirement Readiness Ratings to Vary: Results from the 2014 Retirement Security
Projection Model,®” EBRI Issue Brief, no. 396, February 2014.
.”The Role of Social Security, Defined Benefits, and Private Retirement Accounts in the Face of the Retirement
Crisis,” EBRI Notes, no. 1 (Employee Benefit Research Institute, January 2014): 8–21.
. “How Much Would it Take? Achieving Retirement Income Equivalency between Final-Average-Pay Defined Benefit
Plan Accruals and Voluntary Enrollment 401(k) Plans in the Private Sector.” EBRI Notes, no. 12 (Employee Benefit
Research Institute, December 2013): 11–23.
. “The Impact of a Retirement Savings Account Cap,” EBRI Issue Brief, no. 389, (Employee Benefit Research
Institute, August 2013).
. “Reality Checks: A Comparative Analysis of Future Benefits from Private-Sector, Voluntary-Enrollment 401(k) Plans
vs. Stylized, Final-Average-Pay Defined Benefit and Cash Balance Plans.” EBRI Issue Brief, no. 387 (Employee
Benefit Research Institute, June 2013a). http://www.ebri.org/publications/ib/index.cfm?fa=ibDisp&content_id=5229
. “What a Sustained Low-yield Rate Environment Means for Retirement Income Adequacy: Results From the 2013
EBRI Retirement Security Projection Model.®” EBRI Notes, no. 3 (Employee Benefit Research Institute, June
2013b): 2–12.
ebri.org Notes • June 2014 • Vol. 35, No. 6 16
. “All or Nothing? An Expanded Perspective on Retirement Readiness.” EBRI Notes, no. 11 (Employee Benefit
Research Institute, November 2012): 11–23.
. “Increasing Default Deferral Rates in Automatic Enrollment 401(k) Plans: The Impact on Retirement Savings
Success in Plans With Automatic Escalation.” EBRI Notes, no. 9 (Employee Benefit Research Institute, September
2012): 12–22.
. “Is Working to Age 70 Really the Answer for Retirement Income Adequacy?” EBRI Notes, no. 8 (Employee Benefit
Research Institute, August 2012): 10–21.
. “Retirement Readiness Ratings and Retirement Savings Shortfalls for Gen Xers: The Impact of Eligibility for
Participation in a 401(k) Plan.” EBRI Notes, no. 6 (Employee Benefit Research Institute, June 2012): 9–21.
. “Retirement Income Adequacy for Boomers and Gen Xers: Evidence from the 2012 EBRI Retirement Security
Projection Model.®” EBRI Notes, no. 5 (Employee Benefit Research Institute, May 2012): 2–14.
. “Modifying the Federal Tax Treatment of 401(k) Plan Contributions: Projected Impact on Participant Account
Balances.” EBRI Notes, no. 3 (Employee Benefit Research Institute, March 2012): 2–18.
. “Tax Reform Options: Promoting Retirement Security.” EBRI Issue Brief, no. 364 (Employee Benefit Research
Institute, November 2011).
. Testimony. U.S. Congress. Senate Finance Committee. Tax Reform Options: Promoting Retirement Security (T-
170), 15 Sept. 2011.
. “The Importance of Defined Benefit Plans for Retirement Income Adequacy.” EBRI Notes, no. 8 (Employee Benefit
Research Institute, August 2011): 7–16.
. “Capping Tax-Preferred Retirement Contributions: Preliminary Evidence of the Impact of the National Commission
on Fiscal Responsibility and Reform Recommendations.” EBRI Notes, no. 7 (Employee Benefit Research Institute,
July 2011): 2–6.
. “Retirement Income Adequacy: Alternative Thresholds and the Importance of Future Eligibility in Defined
Contribution Retirement Plans.” EBRI Notes, no. 4 (Employee Benefit Research Institute, April 2011): 10–19.
. “The Impact of Modifying the Exclusion of Employee Contributions for Retirement Savings Plans From Taxable
Income: Results From the 2011 Retirement Confidence Survey.” EBRI Notes, no. 3 (Employee Benefit Research
Institute, March 2011): 2–10.
. “A Post-Crisis Assessment of Retirement Income Adequacy for Baby Boomers and Gen Xers.” EBRI Issue Brief, no.
354 (Employee Benefit Research Institute, February 2011).
. Testimony. U.S. Congress. Senate Health, Education, Labor and Pensions Committee. The Wobbly Stool:
Retirement (In)security in America (T-166), 7 Oct. 2010b.
. “Retirement Savings Shortfalls for Today’s Workers.” EBRI Notes, no. 10 (Employee Benefit Research Institute,
October 2010a): 2−9.
. “Retirement Income Adequacy for Today’s Workers: How Certain, How Much Will It Cost, and How Does Eligibility
for Participation in a Defined Contribution Plan Help?” EBRI Notes, no. 9 (Employee Benefit Research Institute,
September 2010): 13–20.
. “The Impact of Automatic Enrollment in 401(k) Plans on Future Retirement Accumulations: A Simulation Study
Based on Plan Design Modifications of Large Plan Sponsors.” EBRI Issue Brief, no. 341 (Employee Benefit
Research Institute, April 2010). http://www.ebri.org/publications/ib/index.cfm?fa=ibDisp&content_id=4495
. “Falling Stocks: What Will Happen to Retirees' Incomes? The Worker Perspective,” Presentation for The Economic
Crisis of 2008: What Will Happen to Retirees’ Incomes? 2009 APPAM Fall Conference (November 2009).
ebri.org Notes • June 2014 • Vol. 35, No. 6 17
. Testimony. Joint DOL/SEC Public Hearing on Target Dates Funds. How Would Target-Date Funds Likely Impact
Future 401(k) Accumulations? (T-160), 18 June 2009. www.ebri.org/pdf/publications/testimony/t160.pdf
. “The Expected Impact of Automatic Escalation of 401(k) Contributions on Retirement Income.” EBRI Notes, no. 9
(Employee Benefit Research Institute, September 2007): 2–8
. “Measuring Retirement Income Adequacy: Calculating Realistic Income Replacement Rates.” EBRI Issue Brief, no.
297 (Employee Benefit Research Institute, September 2006).
. “Defined Benefit Plan Freezes: Who's Affected, How Much, and Replacing Lost Accruals.” EBRI Issue Brief, no. 291
(Employee Benefit Research Institute, March 2006).
. “Projections of Future Retirement Income Security: Impact of Long Term Care Insurance.” 2005 American Society
on Aging/National Council on Aging Joint Conference, March 2005.
. Testimony. U.S. Congress. Senate Special Committee on Aging. Retirement Planning: Do We Have a Crisis in
America? Results From the EBRI-ERF Retirement Security Projection Model (T-141), 27 Jan. 2004.
VanDerhei, Jack, and Nevin Adams. “A Little Help: The Impact of On-line Calculators and Financial Advisors on Setting
Adequate Retirement-Savings Targets: Evidence from the 2013 Retirement Confidence Survey,” EBRI Notes, no. 3
(Employee Benefit Research Institute, March 2013).
VanDerhei, Jack, and Craig Copeland. “The Impact of Deferring Retirement Age on Retirement Income Adequacy.” EBRI
Issue Brief, no. 358 (Employee Benefit Research Institute, June 2011).
. “The EBRI Retirement Readiness Rating:TM Retirement Income Preparation and Future Prospects.” EBRI Issue
Brief, no. 344 (Employee Benefit Research Institute, July 2010).
. “The Impact of PPA on Retirement Income for 401(k) Participants.” EBRI Issue Brief, no. 318 (Employee Benefit
Research Institute, June 2008).
. “ERISA At 30: The Decline of Private-Sector Defined Benefit Promises and Annuity Payments: What Will It Mean?”
EBRI Issue Brief, no. 269 (Employee Benefit Research Institute, May 2004).
. “Can America Afford Tomorrow's Retirees: Results From the EBRI-ERF Retirement Security Projection Model.®”
EBRI Issue Brief, no. 263 (Employee Benefit Research Institute, November 2003).
. “Kansas Future Retirement Income Assessment Project.” A project of the EBRI Education and Research Fund and
the Milbank Memorial Fund. July 16, 2002.
. “Massachusetts Future Retirement Income Assessment Project.” A project of the EBRI Education and Research
Fund and the Milbank Memorial Fund. December 1, 2002.
. “Oregon Future Retirement Income Assessment Project.” A project of the EBRI Education and Research Fund and
the Milbank Memorial Fund. September 2001.
. “A Behavioral Model for Predicting Employee Contributions to 401(k) Plans.” North American Actuarial Journal
(November 2001).
. “The Changing Face of Private Retirement Plans.” EBRI Issue Brief, no. 232 (Employee Benefit Research Institute,
April 2001).
VanDerhei, Jack, and Lori Lucas. “The Impact of Auto-enrollment and Automatic Contribution Escalation on Retirement
Income Adequacy.” EBRI Issue Brief, no. 349 (Employee Benefit Research Institute, November 2010); and DCIIA
Research Report (November 2010).
ebri.org Notes • June 2014 • Vol. 35, No. 6 18
Endnotes 1 The generation born between 1948–1964.
2 The generation born between 1965–1974.
3 See Appendix A for a brief technical description of RSPM. Additional detail is provided in VanDerhei and Copeland
(2010).
4 A brief chronology of RSPM is contained in Appendix B.
5 VanDerhei and Copeland (April 2001) used the early version of the model to highlight the changes in private‐pension‐plan participation for defined benefit (DB) and defined contribution (DC) plans and used the model to quantify how much the importance of individual‐account plans was expected to increase because of these changes.
6 VanDerhei and Copeland (2003).
7 See VanDerhei (June 2012) for details.
8 VanDerhei (February 2014).
9 This a different set of scenarios than those modeled in Appendix B of VanDerhei (February 2014). In that case, a consistent 10 or 20 percent reduction was taken across both categories of expenditures. In this Notes article, it was decided to only take the reductions for the component the household is likely to have a fair amount of control over (i.e., the deterministic expenses).
10 See VanDerhei (February 2014) for additional detail on the impact of longevity risk and long‐term care costs.
ebri.org Notes • June 2014 • Vol. 35, No. 6 19
Consumer Engagement Among HSA and HRA Enrollees: Findings from the 2013 EBRI/Greenwald & Associates Consumer Engagement in Health Care Survey By Paul Fronstin, Ph.D., Employee Benefit Research Institute
This survey was made possible with support from:
Blue Cross and Blue Shield Association
Chevron
Deseret Mutual
HealthEquity
National Rural Electric Cooperative Association
Optum
Introduction In 2001, a handful of employers started offering health reimbursement arrangements (HRAs)—a then-new type of health plan. The most prevalent HRA plan design then had a deductible of at least $1,000 for employee-only coverage and a tax-preferred account that could be tapped by workers and their families to pay out-of-pocket health care expenses. The Medicare Prescription Drug, Improvement, and Modernization Act of 2003 included a provision to allow individuals with certain high-deductible health plans to contribute to a health savings account (HSA). Overall, 26.1 million individuals with private insurance, representing 15 percent of the market, were either in an HRA or an HSA-eligible plan (Fronstin, 2013).
HRAs and HSAs are very similar, though there are some key differences that may provide different incentives related to using health care services, and thus, different consumer engagement experiences. An HSA is owned by the individual with the high-deductible health plan and is completely portable. There is no annual use-it-or-lose-it rule associated with an HSA, as any money left in the account at the end of the year automatically rolls over and is available for future use. Both individuals and employers are allowed to contribute to an HSA. Distributions from an HSA can be made at any time. An individual need not be covered by a high-deductible health plan to withdraw money from the HSA. This means that individuals who do not use all the money in their HSA during their working years can use it to pay out-of-pocket expenses when they are retired.
In contrast, an HRA is an employer-funded health plan that reimburses employees for qualified medical expenses. HRAs are typically set up as notional arrangements. Leftover funds at the end of each year can be carried over for future use (at the employer’s discretion), allowing employees to accumulate funds over time. In principle, at least, this provides an incentive for individuals to make health care purchases responsibly. However, an employer is not required to make the unused balance available to a worker when he or she leaves.
Ultimately, an HSA creates a stronger financial incentive than an HRA for workers to be more engaged in their health care because the account is owned by the worker and completely portable upon job change. Haviland, et al. (2011) and citations within it found that HSA plans have a greater effect than HRA plans on the use of health care services and the cost per episode.
This article examines how consumer engagement varies for individuals enrolled in HSA-eligible plans and HRAs. The HSA sample includes only individuals who have an HSA. Data from the 2013 EBRI/Greenwald & Associates Consumer Engagement in Health Care Survey (CEHCS) are used for the analysis.1 Factors affecting use of health care services, choice of health plan, use of cost information, and participation in wellness programs are examined.
ebri.org Notes • June 2014 • Vol. 35, No. 6 20
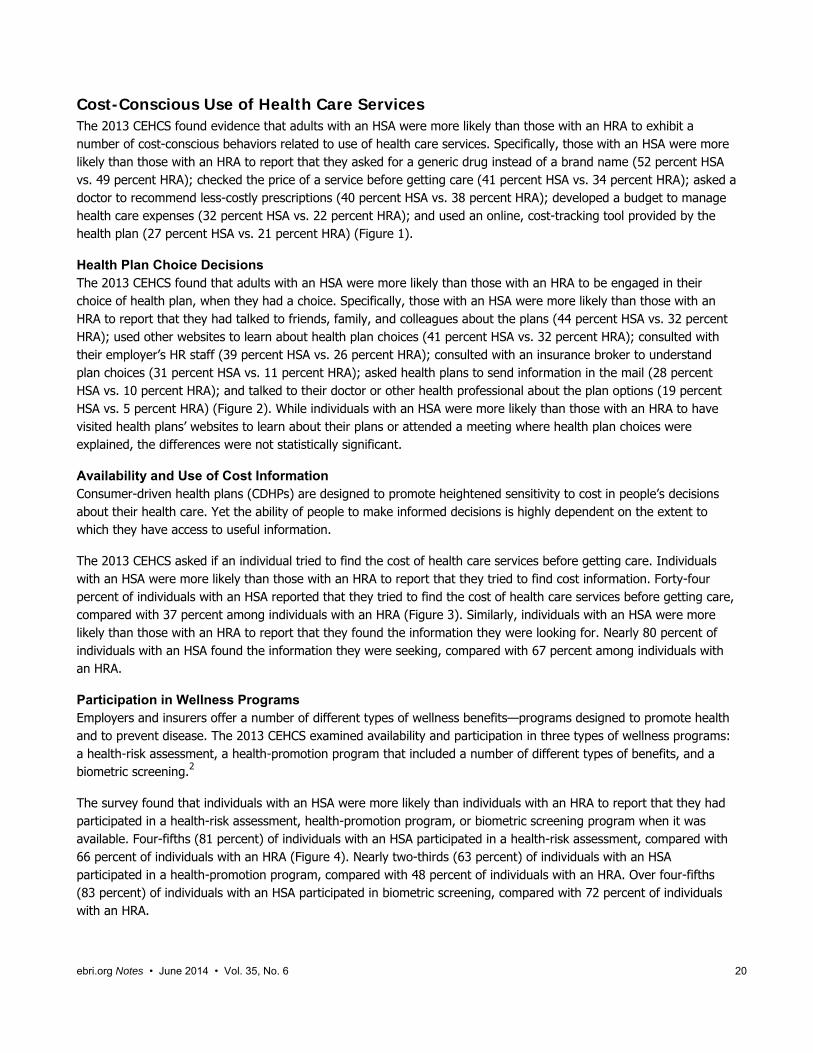
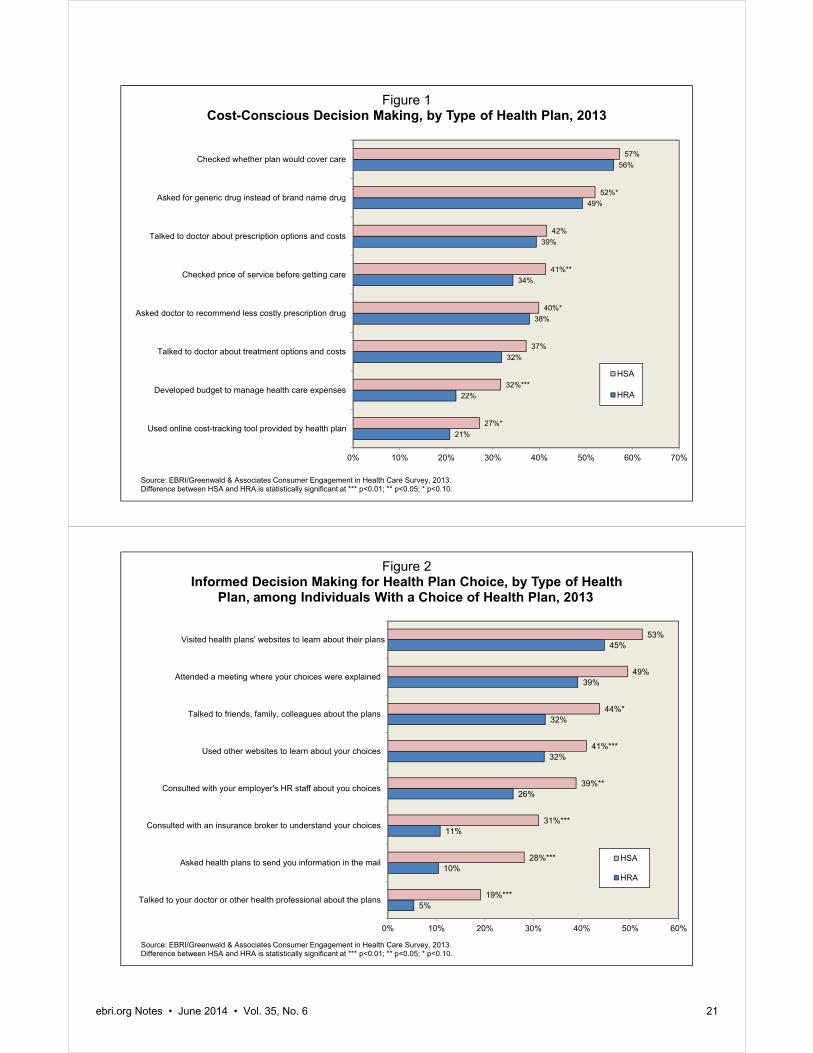
Cost-Conscious Use of Health Care Services The 2013 CEHCS found evidence that adults with an HSA were more likely than those with an HRA to exhibit a number of cost-conscious behaviors related to use of health care services. Specifically, those with an HSA were more likely than those with an HRA to report that they asked for a generic drug instead of a brand name (52 percent HSA vs. 49 percent HRA); checked the price of a service before getting care (41 percent HSA vs. 34 percent HRA); asked a doctor to recommend less-costly prescriptions (40 percent HSA vs. 38 percent HRA); developed a budget to manage health care expenses (32 percent HSA vs. 22 percent HRA); and used an online, cost-tracking tool provided by the health plan (27 percent HSA vs. 21 percent HRA) (Figure 1).
Health Plan Choice Decisions The 2013 CEHCS found that adults with an HSA were more likely than those with an HRA to be engaged in their choice of health plan, when they had a choice. Specifically, those with an HSA were more likely than those with an HRA to report that they had talked to friends, family, and colleagues about the plans (44 percent HSA vs. 32 percent HRA); used other websites to learn about health plan choices (41 percent HSA vs. 32 percent HRA); consulted with their employer’s HR staff (39 percent HSA vs. 26 percent HRA); consulted with an insurance broker to understand plan choices (31 percent HSA vs. 11 percent HRA); asked health plans to send information in the mail (28 percent HSA vs. 10 percent HRA); and talked to their doctor or other health professional about the plan options (19 percent HSA vs. 5 percent HRA) (Figure 2). While individuals with an HSA were more likely than those with an HRA to have visited health plans’ websites to learn about their plans or attended a meeting where health plan choices were explained, the differences were not statistically significant.
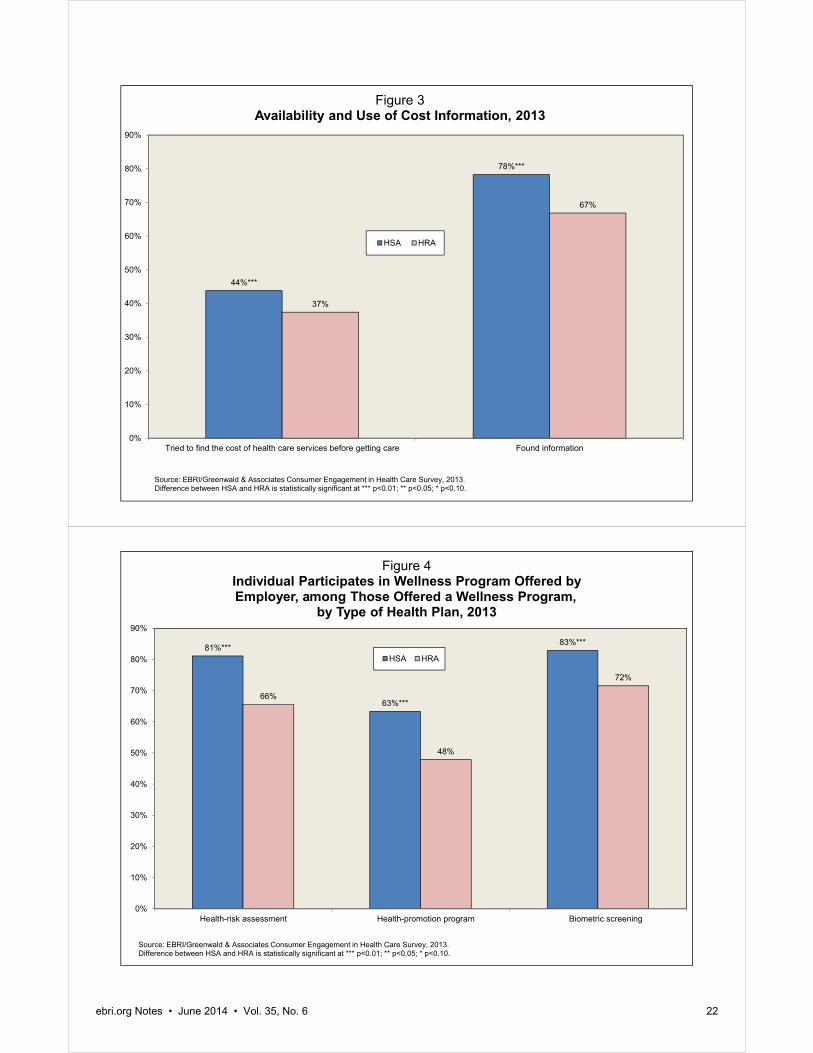
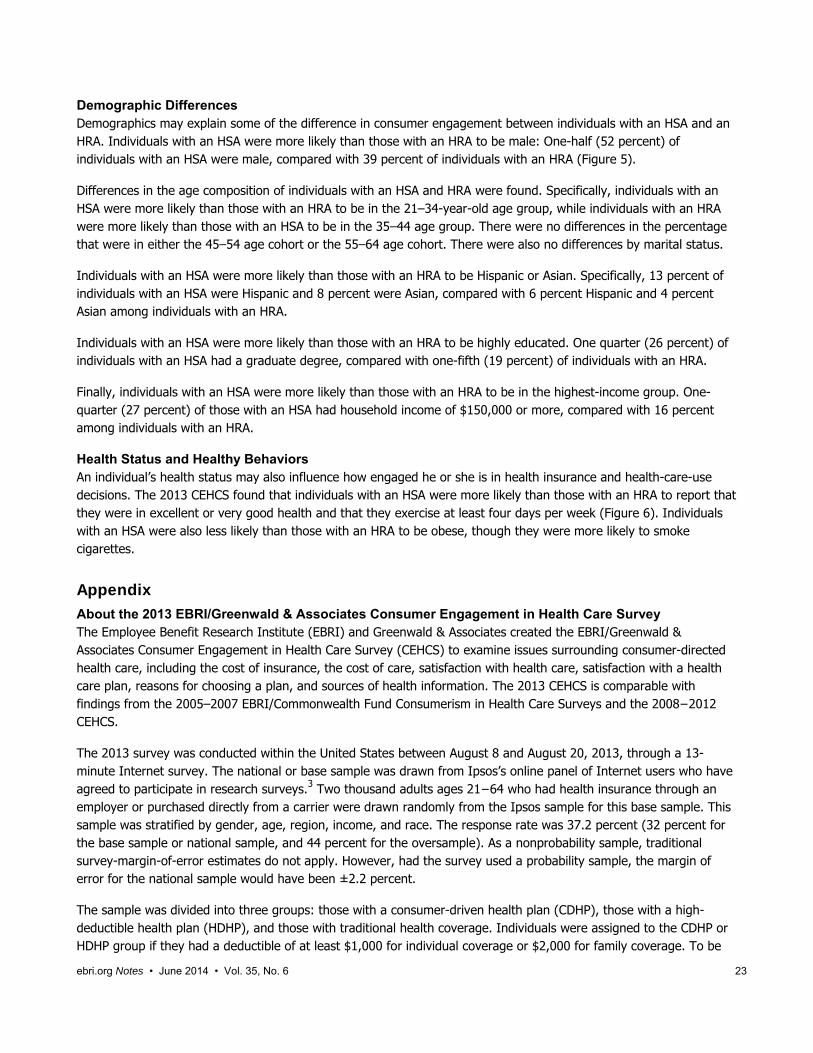
Availability and Use of Cost Information Consumer-driven health plans (CDHPs) are designed to promote heightened sensitivity to cost in people’s decisions about their health care. Yet the ability of people to make informed decisions is highly dependent on the extent to which they have access to useful information.
The 2013 CEHCS asked if an individual tried to find the cost of health care services before getting care. Individuals with an HSA were more likely than those with an HRA to report that they tried to find cost information. Forty-four percent of individuals with an HSA reported that they tried to find the cost of health care services before getting care, compared with 37 percent among individuals with an HRA (Figure 3). Similarly, individuals with an HSA were more likely than those with an HRA to report that they found the information they were looking for. Nearly 80 percent of individuals with an HSA found the information they were seeking, compared with 67 percent among individuals with an HRA.
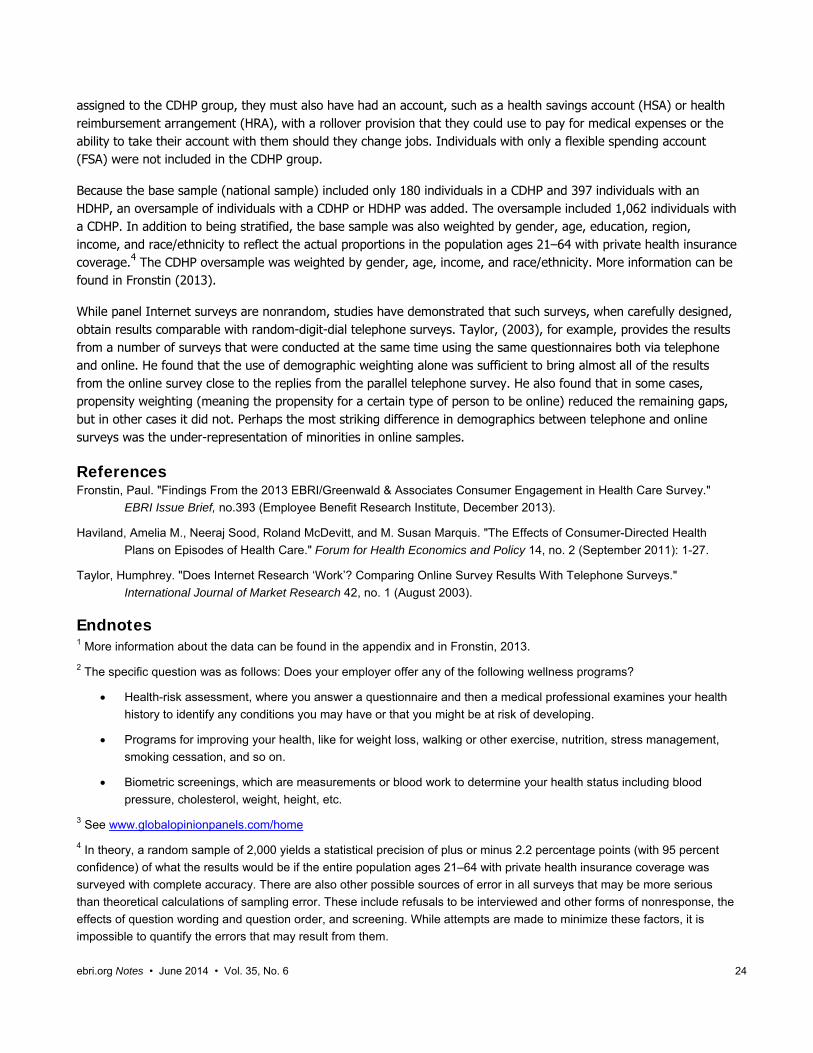
Participation in Wellness Programs Employers and insurers offer a number of different types of wellness benefits—programs designed to promote health and to prevent disease. The 2013 CEHCS examined availability and participation in three types of wellness programs: a health-risk assessment, a health-promotion program that included a number of different types of benefits, and a biometric screening.2
The survey found that individuals with an HSA were more likely than individuals with an HRA to report that they had participated in a health-risk assessment, health-promotion program, or biometric screening program when it was available. Four-fifths (81 percent) of individuals with an HSA participated in a health-risk assessment, compared with 66 percent of individuals with an HRA (Figure 4). Nearly two-thirds (63 percent) of individuals with an HSA participated in a health-promotion program, compared with 48 percent of individuals with an HRA. Over four-fifths (83 percent) of individuals with an HSA participated in biometric screening, compared with 72 percent of individuals with an HRA.
21%
22%
32%
38%
34%
39%
49%
56%
27%*
32%***
37%
40%*
41%**
42%
52%*
57%
0% 10% 20% 30% 40% 50% 60% 70%
Used online cost-tracking tool provided by health plan
Developed budget to manage health care expenses
Talked to doctor about treatment options and costs
Asked doctor to recommend less costly prescription drug
Checked price of service before getting care
Talked to doctor about prescription options and costs
Asked for generic drug instead of brand name drug
Checked whether plan would cover care
Figure 1Cost-Conscious Decision Making, by Type of Health Plan, 2013
HSA
HRA
Source: EBRI/Greenwald & Associates Consumer Engagement in Health Care Survey, 2013.Difference between HSA and HRA is statistically significant at *** p<0.01; ** p<0.05; * p<0.10.
5%
10%
11%
26%
32%
32%
39%
45%
19%***
28%***
31%***
39%**
41%***
44%*
49%
53%
0% 10% 20% 30% 40% 50% 60%
Talked to your doctor or other health professional about the plans
Asked health plans to send you information in the mail
Consulted with an insurance broker to understand your choices
Consulted with your employer's HR staff about you choices
Used other websites to learn about your choices
Talked to friends, family, colleagues about the plans
Attended a meeting where your choices were explained
Visited health plans' websites to learn about their plans
Figure 2Informed Decision Making for Health Plan Choice, by Type of Health
Plan, among Individuals With a Choice of Health Plan, 2013
HSA
HRA
Source: EBRI/Greenwald & Associates Consumer Engagement in Health Care Survey, 2013.Difference between HSA and HRA is statistically significant at *** p<0.01; ** p<0.05; * p<0.10.
ebri.org Notes • June 2014 • Vol. 35, No. 6 21
44%***
78%***
37%
67%
0%
10%
20%
30%
40%
50%
60%
70%
80%
90%
Tried to find the cost of health care services before getting care Found information
Figure 3Availability and Use of Cost Information, 2013
HSA HRA
Source: EBRI/Greenwald & Associates Consumer Engagement in Health Care Survey, 2013.Difference between HSA and HRA is statistically significant at *** p<0.01; ** p<0.05; * p<0.10.
81%***
63%***
83%***
66%
48%
72%
0%
10%
20%
30%
40%
50%
60%
70%
80%
90%
Health-risk assessment Health-promotion program Biometric screening
Figure 4Individual Participates in Wellness Program Offered by Employer, among Those Offered a Wellness Program,
by Type of Health Plan, 2013
HSA HRA
Source: EBRI/Greenwald & Associates Consumer Engagement in Health Care Survey, 2013.Difference between HSA and HRA is statistically significant at *** p<0.01; ** p<0.05; * p<0.10.
ebri.org Notes • June 2014 • Vol. 35, No. 6 22
ebri.org Notes • June 2014 • Vol. 35, No. 6 23
Demographic Differences Demographics may explain some of the difference in consumer engagement between individuals with an HSA and an HRA. Individuals with an HSA were more likely than those with an HRA to be male: One-half (52 percent) of individuals with an HSA were male, compared with 39 percent of individuals with an HRA (Figure 5).
Differences in the age composition of individuals with an HSA and HRA were found. Specifically, individuals with an HSA were more likely than those with an HRA to be in the 21–34-year-old age group, while individuals with an HRA were more likely than those with an HSA to be in the 35–44 age group. There were no differences in the percentage that were in either the 45–54 age cohort or the 55–64 age cohort. There were also no differences by marital status.
Individuals with an HSA were more likely than those with an HRA to be Hispanic or Asian. Specifically, 13 percent of individuals with an HSA were Hispanic and 8 percent were Asian, compared with 6 percent Hispanic and 4 percent Asian among individuals with an HRA.
Individuals with an HSA were more likely than those with an HRA to be highly educated. One quarter (26 percent) of individuals with an HSA had a graduate degree, compared with one-fifth (19 percent) of individuals with an HRA.
Finally, individuals with an HSA were more likely than those with an HRA to be in the highest-income group. One-quarter (27 percent) of those with an HSA had household income of $150,000 or more, compared with 16 percent among individuals with an HRA.
Health Status and Healthy Behaviors An individual’s health status may also influence how engaged he or she is in health insurance and health-care-use decisions. The 2013 CEHCS found that individuals with an HSA were more likely than those with an HRA to report that they were in excellent or very good health and that they exercise at least four days per week (Figure 6). Individuals with an HSA were also less likely than those with an HRA to be obese, though they were more likely to smoke cigarettes.
Appendix About the 2013 EBRI/Greenwald & Associates Consumer Engagement in Health Care Survey The Employee Benefit Research Institute (EBRI) and Greenwald & Associates created the EBRI/Greenwald & Associates Consumer Engagement in Health Care Survey (CEHCS) to examine issues surrounding consumer-directed health care, including the cost of insurance, the cost of care, satisfaction with health care, satisfaction with a health care plan, reasons for choosing a plan, and sources of health information. The 2013 CEHCS is comparable with findings from the 2005–2007 EBRI/Commonwealth Fund Consumerism in Health Care Surveys and the 2008−2012 CEHCS.
The 2013 survey was conducted within the United States between August 8 and August 20, 2013, through a 13-minute Internet survey. The national or base sample was drawn from Ipsos’s online panel of Internet users who have agreed to participate in research surveys.3 Two thousand adults ages 21−64 who had health insurance through an employer or purchased directly from a carrier were drawn randomly from the Ipsos sample for this base sample. This sample was stratified by gender, age, region, income, and race. The response rate was 37.2 percent (32 percent for the base sample or national sample, and 44 percent for the oversample). As a nonprobability sample, traditional survey-margin-of-error estimates do not apply. However, had the survey used a probability sample, the margin of error for the national sample would have been ±2.2 percent.
The sample was divided into three groups: those with a consumer-driven health plan (CDHP), those with a high-deductible health plan (HDHP), and those with traditional health coverage. Individuals were assigned to the CDHP or HDHP group if they had a deductible of at least $1,000 for individual coverage or $2,000 for family coverage. To be
ebri.org Notes • June 2014 • Vol. 35, No. 6 24
assigned to the CDHP group, they must also have had an account, such as a health savings account (HSA) or health reimbursement arrangement (HRA), with a rollover provision that they could use to pay for medical expenses or the ability to take their account with them should they change jobs. Individuals with only a flexible spending account (FSA) were not included in the CDHP group.
Because the base sample (national sample) included only 180 individuals in a CDHP and 397 individuals with an HDHP, an oversample of individuals with a CDHP or HDHP was added. The oversample included 1,062 individuals with a CDHP. In addition to being stratified, the base sample was also weighted by gender, age, education, region, income, and race/ethnicity to reflect the actual proportions in the population ages 21–64 with private health insurance coverage.4 The CDHP oversample was weighted by gender, age, income, and race/ethnicity. More information can be found in Fronstin (2013).
While panel Internet surveys are nonrandom, studies have demonstrated that such surveys, when carefully designed, obtain results comparable with random-digit-dial telephone surveys. Taylor, (2003), for example, provides the results from a number of surveys that were conducted at the same time using the same questionnaires both via telephone and online. He found that the use of demographic weighting alone was sufficient to bring almost all of the results from the online survey close to the replies from the parallel telephone survey. He also found that in some cases, propensity weighting (meaning the propensity for a certain type of person to be online) reduced the remaining gaps, but in other cases it did not. Perhaps the most striking difference in demographics between telephone and online surveys was the under-representation of minorities in online samples.
References Fronstin, Paul. "Findings From the 2013 EBRI/Greenwald & Associates Consumer Engagement in Health Care Survey."
EBRI Issue Brief, no.393 (Employee Benefit Research Institute, December 2013).
Haviland, Amelia M., Neeraj Sood, Roland McDevitt, and M. Susan Marquis. "The Effects of Consumer-Directed Health
Plans on Episodes of Health Care." Forum for Health Economics and Policy 14, no. 2 (September 2011): 1-27.
Taylor, Humphrey. "Does Internet Research ‘Work’? Comparing Online Survey Results With Telephone Surveys."
International Journal of Market Research 42, no. 1 (August 2003).
Endnotes 1 More information about the data can be found in the appendix and in Fronstin, 2013.
2 The specific question was as follows: Does your employer offer any of the following wellness programs?
Health-risk assessment, where you answer a questionnaire and then a medical professional examines your health
history to identify any conditions you may have or that you might be at risk of developing.
Programs for improving your health, like for weight loss, walking or other exercise, nutrition, stress management,
smoking cessation, and so on.
Biometric screenings, which are measurements or blood work to determine your health status including blood
pressure, cholesterol, weight, height, etc.
3 See www.globalopinionpanels.com/home
4 In theory, a random sample of 2,000 yields a statistical precision of plus or minus 2.2 percentage points (with 95 percent
confidence) of what the results would be if the entire population ages 21–64 with private health insurance coverage was
surveyed with complete accuracy. There are also other possible sources of error in all surveys that may be more serious
than theoretical calculations of sampling error. These include refusals to be interviewed and other forms of nonresponse, the
effects of question wording and question order, and screening. While attempts are made to minimize these factors, it is
impossible to quantify the errors that may result from them.
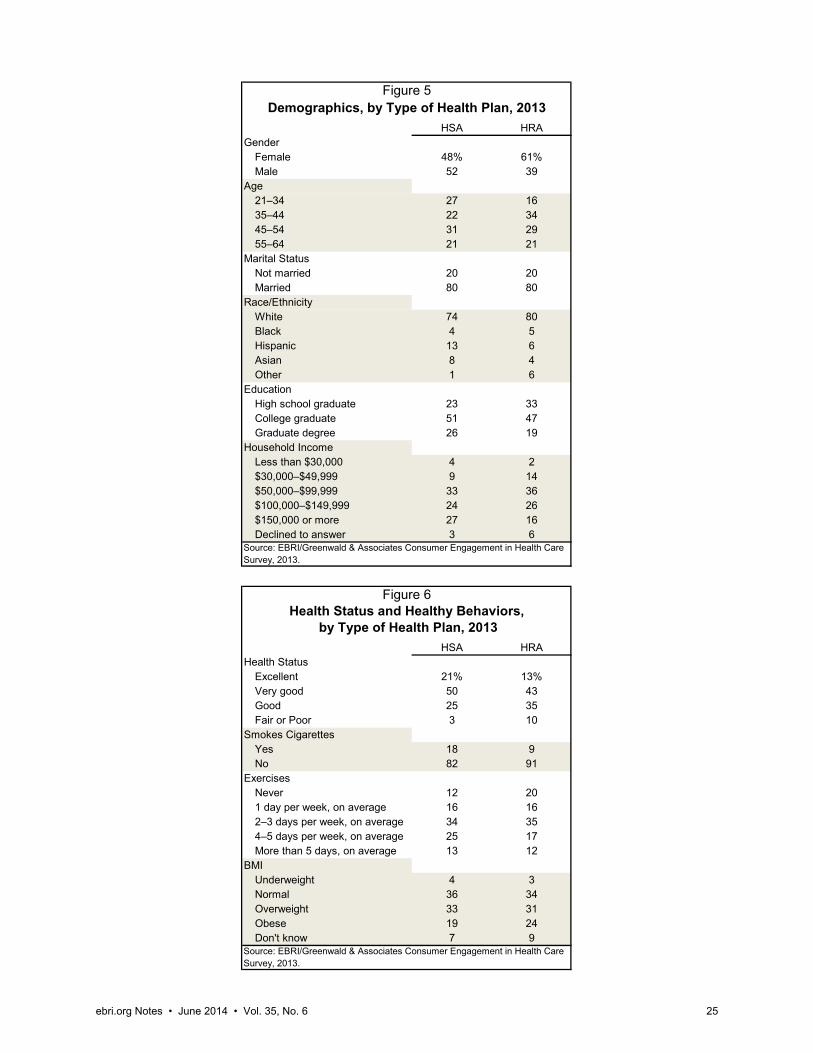
HSA HRAGender
Female 48% 61%Male 52 39
Age21–34 27 1635–44 22 3445–54 31 2955–64 21 21
Marital StatusNot married 20 20Married 80 80
Race/EthnicityWhite 74 80Black 4 5Hispanic 13 6Asian 8 4Other 1 6
EducationHigh school graduate 23 33College graduate 51 47Graduate degree 26 19
Household IncomeLess than $30,000 4 2$30,000–$49,999 9 14$50,000–$99,999 33 36$100,000–$149,999 24 26$150,000 or more 27 16Declined to answer 3 6
HSA HRAHealth Status
Excellent 21% 13%Very good 50 43Good 25 35Fair or Poor 3 10
Smokes CigarettesYes 18 9No 82 91
ExercisesNever 12 201 day per week, on average 16 162–3 days per week, on average 34 354–5 days per week, on average 25 17More than 5 days, on average 13 12
BMIUnderweight 4 3Normal 36 34Overweight 33 31Obese 19 24Don't know 7 9
Source: EBRI/Greenwald & Associates Consumer Engagement in Health Care Survey, 2013.
Figure 5Demographics, by Type of Health Plan, 2013
Source: EBRI/Greenwald & Associates Consumer Engagement in Health Care Survey, 2013.
Figure 6
by Type of Health Plan, 2013Health Status and Healthy Behaviors,
ebri.org Notes • June 2014 • Vol. 35, No. 6 25
1100 13th Street NW · Suite 878 Washington, DC 20005
(202) 659-0670 www.ebri.org
www.choosetosave.org
Where the world turns for the facts on U.S. employee benefits. Retirement and health benefits are at the heart of workers’, employers’, and our nation’s economic security. Founded in 1978, EBRI is the most authoritative and objective source of information on these critical, complex issues. EBRI focuses solely on employee benefits research — no lobbying or advocacy.
EBRI stands alone in employee benefits research as an independent, nonprofit, and nonpartisan organization. It analyzes and reports research data without spin or underlying agenda. All findings, whether on financial data, options, or trends, are revealing and reliable — the reason EBRI information is the gold standard for private analysts and decision makers, government policymakers, the media, and the public.
EBRI explores the breadth of employee benefits and related issues.
EBRI studies the world of health and retirement benefits — issues such as 401(k)s, IRAs, retirement income adequacy, consumer-driven benefits, Social Security, tax treatment of both retirement and health benefits, cost management, worker and employer attitudes, policy reform proposals, and pension assets and funding. There is widespread recognition that if employee benefits data exist, EBRI knows it.
EBRI delivers a steady stream of invaluable research and analysis.
EBRI publications include in-depth coverage of key issues and trends; summaries of research findings and policy developments; timely factsheets on hot topics; regular updates on legislative and regulatory developments; comprehensive reference resources on benefit programs and workforce issues; and major surveys of public attitudes.
EBRI meetings present and explore issues with thought leaders from all sectors. EBRI regularly provides congressional testimony, and briefs policymakers, member organizations,
and the media on employer benefits. EBRI issues press releases on newsworthy developments, and is among the most widely quoted
sources on employee benefits by all media. EBRI directs members and other constituencies to the information they need and undertakes new
research on an ongoing basis. EBRI maintains and analyzes the most comprehensive database of 401(k)-type programs in the
world. Its computer simulation analyses on Social Security reform and retirement income adequacy are unique.
EBRI makes information freely available to all.
EBRI assumes a public service responsibility to make its findings completely accessible at www.ebri.org — so that all decisions that relate to employee benefits, whether made in Congress or board rooms or families’ homes, are based on the highest quality, most dependable information. EBRI’s Web site posts all research findings, publications, and news alerts. EBRI also extends its education and public service role to improving Americans’ financial knowledge through its award-winning public service campaign ChoosetoSave® and the companion site www.choosetosave.org
EBRI is supported by organizations from all industries and sectors that appreciate the value of unbiased, reliable information on employee benefits. Visit www.ebri.org/about/join/ for more.
CHECK OUT EBRI’S WEB SITE! EBRI’s website is easy to use and packed with useful information! Look for these special features:
• EBRI’s entire library of research publications starts at the main Web page. Click on EBRI Issue Briefs and EBRI Notes for our in-depth and nonpartisan periodicals.
• Visit EBRI’s blog, or subscribe to the EBRIef e-letter.
• EBRI’s reliable health and retirement surveys are just a click away through the topic boxes at the top of the page.
• Need a number? Check out the EBRI Databook on Employee Benefits.
• Instantly get e-mail notifications of the latest EBRI data, surveys, publications, and meetings and seminars by clicking on the “Notify Me” or “RSS” buttons at the top of our home page.
There’s lots more!
Visit EBRI on-line today: www.ebri.org
EBRI Employee Benefit Research Institute Notes (ISSN 10854452) is published monthly by the Employee Benefit Research Institute, 1100 13th St. NW, Suite 878, Washington, DC 20005-4051, at $300 per year or is included as part of a membership subscription. Periodicals postage rate paid in Washington, DC, and additional mailing offices. POSTMASTER: Send address changes to: EBRI Notes, 1100 13th St. NW, Suite 878, Washington, DC 20005-4051. Copyright 2014 by Employee Benefit Research Institute. All rights reserved, Vol. 35, no. 6.
The Employee Benefit Research Institute (EBRI) was founded in 1978. Its mission is to contribute to, to encourage, and to enhance the development of sound employee benefit programs and sound public policy through objective research and education. EBRI is the only private, nonprofit, nonpartisan, Washington, DC-based organization committed exclusively to public policy research and education on economic security and employee benefit issues. EBRI’s membership includes a cross-section of pension funds; businesses; trade associations; labor unions; health care providers and insurers; government organizations; and service firms.
EBRI’s work advances knowledge and understanding of employee benefits and their importance to the nation’s economy among policymakers, the news media, and the public. It does this by conducting and publishing policy research, analysis, and special reports on employee benefits issues; holding educational briefings for EBRI members, congressional and federal agency staff, and the news media; and sponsoring public opinion surveys on employee benefit issues. EBRI’s Education and Research Fund (EBRI-ERF) performs the charitable, educational, and scientific functions of the Institute. EBRI-ERF is a tax-exempt organization supported by contributions and grants.
EBRI Issue Briefs are periodicals providing expert evaluations of employee benefit issues and trends, as well as critical analyses of employee benefit policies and proposals. EBRI Notes is a monthly periodical providing current information on a variety of employee benefit topics. EBRIef is a weekly roundup of EBRI research and insights, as well as updates on surveys, studies, litigation, legislation and regulation affecting employee benefit plans, while EBRI’s Blog supplements our regular publications, offering commentary on questions received from news reporters, policymakers, and others. EBRI’s Fundamentals of Employee Benefit Programs offers a straightforward, basic explanation of employee benefit programs in the private and public sectors. The EBRI Databook on Employee Benefits is a statistical reference work on employee benefit programs and work force-related issues.
Contact EBRI Publications, (202) 659-0670; fax publication orders to (202) 775-6312. Subscriptions to EBRI Issue Briefs are included as part of EBRI membership, or as part of a $199 annual subscription to EBRI Notes and EBRI Issue Briefs. Change of Address: EBRI, 1100 13th St. NW, Suite 878, Washington, DC, 20005-4051, (202) 659-0670; fax number, (202) 775-6312; e-mail: [email protected] Membership Information: Inquiries regarding EBRI membership and/or contributions to EBRI-ERF should be directed to EBRI President Dallas Salisbury at the above address, (202) 659-0670; e-mail: [email protected]
Editorial Board: Dallas L. Salisbury, publisher; Stephen Blakely, editor. Any views expressed in this publication and those of the authors should not be ascribed to the officers, trustees, members, or other sponsors of the Employee Benefit Research Institute, the EBRI Education and Research Fund, or their staffs. Nothing herein is to be construed as an attempt to aid or hinder the adoption of any pending legislation, regulation, or interpretative rule, or as legal, accounting, actuarial, or other such professional advice.
EBRI Notes is registered in the U.S. Patent and Trademark Office. ISSN: 10854452 10854452/90 $ .50+.50
© 2014, Employee Benefit Research InstituteEducation and Research Fund. All rights reserved.
Who we are
What we do
Our publications
Orders/ Subscriptions