Embed Size (px)
Citation preview

6 November 2017
Piramal Enterprises Limited Q2 & H1 FY2018 Results Presentation

Piramal Enterprises Limited – Q2 & H1 FY2018 Results Presentation Page 2
Key Financial Highlights
29% growth in revenues
during Q2 FY2018
25% growth in net profit
during Q2 FY2018
28% growth in revenues
during H1 FY2018
28% growth in net profit
during H1 FY2018
Rs.2,536 Crores Rs.384 Crores
Rs.4,790 Crores Rs.686 Crores

Piramal Enterprises Limited – Q2 & H1 FY2018 Results Presentation
Operational highlights for the quarter
Successfully raised ~Rs.5,000 Crores through Qualified
Institutional Placement (QIP) of Compulsorily Convertible
Debentures (CCDs)
Received Housing Finance Licence from National Housing Board; disbursed Rs.202 Crores
in first month of operation
Despite subdued performance of the industry due to GST
launch, India Consumer Product business grew by 20% for the
quarter
Successfully cleared 3 regulatory audits including 1
USFDA audit
Total Loan Book grew 69% to Rs.33,261 Crores; CFG loan
book grew 100% to Rs.5,863 Crores
Proposed merger of Piramal Finance and Piramal Capital
with Piramal Housing Finance
India Consumer Products Global Pharma Financial Services
Financial Services Overall Financial Services
Page 3
Announced USD 55 mn expansion of API manufacturing
capabilities & capacities in North America and Asia
Acquired Context Matters, a US-based data and analytics
company to expand Global Market Access Intelligence
offerings
Healthcare Insight & Analytics
Global Pharma

Piramal Enterprises Limited – Q2 & H1 FY2018 Results Presentation
345 455 731
1,450
2,270 1,319
1,501
1,644
1,725
1,970
407
448
523
532
508
2,095
2,425
2,904
3,742
4,790
H1 FY14 H1 FY15 H1 FY16 H1 FY17 H1 FY18
FS Pharma HIA Others
Delivering robust growth track record
(179)
97
405
537
686
H1 FY14 H1 FY15 H1 FY16 H1 FY17 H1 FY18
Business-wise Revenue Trend Net profit & Margin Trend
Net Profit
1
Note: 1. H1 FY2015 net profit excludes exceptional gain on sale of 11% stake in Vodafone India partly offset by the amount written down on account of scaling back of our investments in NCE
research. 2. H1 FY2016, H1 FY2017 and H1 FY2018 results have been prepared based on IND AS 3. HIA – Healthcare Insight and Analytics
Page 4
(In Rs. Crores)
3 yrs CAGR – 25% 3 yrs CAGR – 92%

Piramal Enterprises Limited – Q2 & H1 FY2018 Results Presentation Page 5
Revenues Net Profits
Period Reported Period
(Rs. Cr) Previous Period
(Rs. Cr) % YoY Change
Reported Period (Rs. Cr)
Previous Period (Rs. Cr)
% YoY Change
Q1FY15 1,182 965 +22% 55 (147) NM
Q2FY15 1,243 1,131 +10% 41 (32) NM
Q3FY15 1,400 1,286 +9% 224 (11) NM
Q4FY15 1,298 1,121 +16% 100 (311) NM
Q1FY16 1,401 1,182 +19% 169 55 +206%
Q2FY16 1,504 1,243 +21% 235 41 +473%
Q3FY16 1,786 1,400 +28% 307 224 +37%
Q4FY16 1,691 1,298 +30% 193 100 +93%
Q1FY17 1,776 1,401 +27% 231 169 +36%
Q2FY17 1,966 1,504 +31% 306 235 +30%
Q3FY17 2,342 1,786 +31% 404 307 +32%
Q4FY17 2,463 1,691 +46% 311 193 +61%
Q1FY18 2,254 1,776 +27% 302 231 +31%
Q2FY18 2,536 1,966 +29% 384 306 +25%
Note: 1. All periods of FY2017, Q1 FY2018 and Q2 FY2018 results have been reported in line with Ind AS Accounting and the results of the corresponding periods of the previous year have
been reinstated to make them comparable with the reported period. Prior period numbers are as reported in their respective period. 2. FY2015 quarterly net profit numbers exclude exceptional gain from Vodafone transaction and exceptional loss from NCE shutdown 3. NM – Not measurable
Consistently delivering strong performance since last many quarters
Overall top line growth has been higher than 25% in each of the last 8 quarters
Our normalised net profit has grown over 25% in each of the last 10 quarters

Financial Services
Piramal Enterprises Limited – Q2 & H1 FY2018 Results Presentation Page 6
29%
-2%
20%
24%
45%
Total Revenue
Healthcare Insight and Analytics
India Consumer Products
Global Pharma
Financial Services
% change - Q2 FY2018 vs. Q2 FY2017 Revenues
Revenue growth across key business segments

Piramal Enterprises Limited – Q2 & H1 FY2018 Results Presentation Page 7
Quartile 1
Top 25 companies
Quartile 2
26-50 companies
Quartile 3
51-75 companies
Quartile 4
76-100 companies
BSE-100 5Yr Revenue CAGR 5Yr Net Profit CAGR
PEL among best performing companies in terms of revenue and profitability growth
Source : Factset
• PEL among top 5 companies (within BSE 100 Index) in terms of 5 years revenue CAGR
• PEL among top 5 companies (within BSE 100 Index) in terms of 5 years Net Profit CAGR
• Very few companies are currently delivering similar / better track record of consistent growth in revenue and net profit over last so many quarters
PEL’s relative positioning in terms of 5 year revenue and net profit CAGR among BSE 100 companies

Piramal Enterprises Limited – Q2 & H1 FY2018 Results Presentation
Fund Raising
Page 8

Piramal Enterprises Limited – Q2 & H1 FY2018 Results Presentation
Deal Highlights
First major fund raise in the history of PEL
Raising up to Rs.7,000 Crores (around US$ 1 billion) :
— Around Rs.5,000 Crores through Qualified Institutional Placement (QIP) of Compulsorily Convertible Debentures (CCDs)
— Up to Rs.2,000 Crores through Rights Issue
Largest QIP deal by any company (excluding banks) in India
First QIP of INR denominated CCDs in India - A milestone deal in the history of Corporate India
— Structure of the deal to set a benchmark for future fund raising deals in India
Widespread participation from FII long only investors, global university endowment fund, domestic institutions and alternative asset managers comprising over 30 institutional investors
Page 9

Piramal Enterprises Limited – Q2 & H1 FY2018 Results Presentation Page 10
Raising over a billion dollar capital via CCDs and rights issue
Successfully raised ~Rs.5,000 Crores
through CCDs
Plans to raise up to Rs.2,000 Crores
through Rights Issue
CCDs QIP Rights issue
Board and promoters are keen to give the existing
shareholders of PEL an equal opportunity to participate in the fund raising
Board approved a Rights Issue of equity shares at a price of Rs.2,380 for up to Rs.2,000 Crores
Promoter Group to underwrite the Rights Issuance to an extent of 90% of the size
Issued 464,330 CCDs of the face value of Rs.107,600
each with a coupon of 7.80% p.a.
It can be converted into pure equity at any time till the maturity date
Each CCD will be compulsorily converted into 40 equity shares on maturity (at the end of the 18 months from the date of allotment)
Conversion price fixed at Rs.2,690 per equity share

Piramal Enterprises Limited – Q2 & H1 FY2018 Results Presentation Page 11
The structure of the deal to set a benchmark for the future fund raising deals in India
Interest coupon is nearly same / lower than the cost of the borrowing for PEL
Equity base to get enhanced progressively in next 18 months in line with business requirements
Attracted a large number of the top institutional investors
Protects from the down-side (investors will get the interest coupon for next 18 months)
Gives all upside (CCDs can be converted into pure equity at any time in future)
Provides the benefits of both debt and equity instruments
Listing of CCDs should bring liquidity to the instrument
For Investors For PEL
A win-win for both Investors and PEL

Piramal Enterprises Limited – Q2 & H1 FY2018 Results Presentation
Participation from global pension funds, FII long only investors, domestic institutions and alternative asset managers
Page 12
86% 14%
FIIs DIIs
63% 37%
Top 6 Rest
50%
35%
15%
North America Asia Europe
No. Top 10 QIP participants
1 CDPQ 2 CAPITAL INTERNATIONAL 3 EASTBRIDGE CAPITAL 4 UNIVERSITY OF CALIFORNIA 5 JUPITER ASSET MANAGEMENT 6 KARST PEAK CAPITAL 7 STEADVIEW CAPITAL 8 DISCOVERY CAPITAL 9 MYRIAD ASSET MANGEMENT
10 RELIANCE INDUSTRIES
86% of CCDs were allotted to FIIs Top 6 investors contributed 63% of the
allotted CCDs Investors were spread across geographies

Piramal Enterprises Limited – Q2 & H1 FY2018 Results Presentation
Financial Services
Page 13

Piramal Enterprises Limited – Q2 & H1 FY2018 Results Presentation
812 2650
3,602
9,020
19,640
33,261
As onSept 2012
As onSept 2013
As onSept 2014
As onSept 2015
As onSept 2016
As onSept 2017
Continued scaling up of loan book (Rs. Crores)
Built a robust and scalable financial services platform
Page 14
Consistently delivering exceptional performance
• Total Loan Book grew by 69% to Rs.33,261 Crores as on 30 Sept 2017 vs. Rs.19,640 Crores as on 30 Sept 2016
• Received Housing Finance Licence and started operations in Sept 2017
• Proposed merger of Piramal Capital and Piramal Finance into Piramal Housing Finance
• Continue to deliver 25%+ RoE for over last 10 quarters
• Robust asset quality
— Gross NPAs ratio (based on 90 dpd) remained stable at 0.2% in Q2 FY2018
— Provisioning maintained at 2%

Financial Services
Piramal Enterprises Limited – Q2 & H1 FY2018 Results Presentation Page 15
Strong trend in growth of income and exits/repayments
128 159 34
5
45
5
73
1 1
,45
0 2
,27
0
145 235
38
1
48
2
1,0
66
1,9
02
273 394
726
937
1,797
3,352
FY12 FY13 FY14 FY15 FY16 FY17 H1 FY18
H1 H2
Rapidly growing income from Financial Services business (in Rs. Crores)
Notes: 1. Excludes our investment in Vodafone India, which was exited during FY2015 2. Exits from Asset Management business have been included on calendar year basis
Strong trend of cumulative exits / repayments1,2 (in Rs. Crores)
223 830 1,027
2,150
4,799
8,531
13,625
18,977
FY11 FY12 FY13 FY14 FY15 FY16 FY17 H1 FY18
Loan Book
Asset Management

Piramal Enterprises Limited – Q2 & H1 FY2018 Results Presentation
Significantly diversifying the lending portfolio; lowering overall risk profile
Page 16
86%
59% 44% 38%
29% 29%
23% 34% 40%
43% 39%
4% 3% 6% 7%
8% 9%
8% 15% 16% 15% 15% 18%
0%
20%
40%
60%
80%
100%
Mar-15 Sep-15 Mar-16 Sep-16 Mar-17 Sep-17
Mezzanine RE RE Construction Finance - Residential RE Construction Finance - Commercial
RE Lease Rent Discounting Corporate Finance Group Emerging Corporate Lending
Housing Finance
Note : RE – Real Estate
New
New
Trend of changing portfolio mix (%)
4,919 9,020 13,338 19,640 24,975 33,261 Total

Piramal Enterprises Limited – Q2 & H1 FY2018 Results Presentation
Strong growth in Real Estate loan book and commencement of Housing finance business
Page 17
Real Estate Lending :
• Loan book grew by 61% to Rs.26,874 Crores as on 30 Sept 2017
— Construction Finance is now 59% of our Real Estate loan book
— Rs.2,290 Crores repaid / prepaid during the quarter
• Covering 110+ developers, 200+ transactions and over 360 projects across India
• Technology platform for wholesale as well retail segment have gone live during the quarter
Housing Finance :
• Received housing finance licence in Aug 2017
• Disbursed Rs.202 Crores in Sept 2017
• Opened a hub and two branches in Mumbai region and hired 150+ employees
• Strong underwriting and asset monitoring processes are in place
Rapidly growing Real Estate (incl. Housing Finance) loan book (in Rs. Crores)
812
2650 2,677
7,632
16,706
27,076
As onSept 2012
As onSept 2013
As onSept 2014
As onSept 2015
As onSept 2016
As onSept 2017
Note : For more details on housing finance click here : Call transcript Presentation

Financial Services
Piramal Enterprises Limited – Q2 & H1 FY2018 Results Presentation Page 18
Robust growth in Corporate Finance and Emerging Corporate loan book
Corporate Finance Group (CFG) :
• Loan book grew by 100% to Rs.5,863 Crores as 30 Sept 2017
— Disbursed Rs.2,857 Crores during the quarter
— Introduced new products like Flexi Line of Credit and Project Finance
— Investments worth Rs.1,800 Crores along with APG and Goldman Sachs
— Successfully exited two deals worth Rs.240 Crores
Emerging Corporate Lending (ECL):
• Sector-agnostic platform with funding provided to diverse sectors such as automotive dealerships, auto ancillaries, manufacturing, pharmaceuticals and hospitality
• Offering solutions with ticket size ranging from Rs.10 Crores to Rs.100 Crores
• Loan Book grew to Rs.322 Crores as on 30 Sept 2017; an increase of Rs.182 Crores in last one quarter
Strong growth in Corporate Finance and ECL portfolio (in Rs. Crores)
925
1,388
2,934
6,186
As onSept 2014
As onSept 2015
As onSept 2016
As onSept 2017

Financial Services
Piramal Enterprises Limited – Q2 & H1 FY2018 Results Presentation Page 19
Benefits of merger
Optimum capital adequacy requirement to improve
returns
One entity to provide end-to-end financing solutions
Diversified portfolio comprising both retail and wholesale should improve
credit rating, in turn reducing borrowing cost
Capitalising on the in-house Brickex arm for sourcing
and facilitating home loans
Open up avenues for combined entity to raise
funds from diversified lenders
Leveraging robust asset monitoring capabilities of the wholesale platform for retail construction finance
loans
Mutual Fund can lend higher amount to HFCs as
against NBFCs
Restructuring will enhance management and
operational efficiency due to integration of common
functions like IT, HR, Finance, Legal, etc.
Proposed merger of Piramal Finance and Piramal Capital with Piramal Housing Finance
Note : The combined entity’s name to be changed to Piramal Capital Limited

Piramal Enterprises Limited – Q2 & H1 FY2018 Results Presentation Page 20
Alternative Asset Management business (Rs. Crores)
Gross AUM as on30 Sept 2016
Exits in RealEstate Gross AUM
Increase in CFGAUM (under APG)
Gross AUM as on30 Sept 2017
7,315
(698)
175 6,792
Total gross assets under management at Rs. 6,792 Crores
Real Estate :
• Real Estate gross funds under management was Rs.5,792 Crores
• Continued exits from vintage funds
• JV with Ivanhoé Cambridge: Timing opportune for securing deals on attractive valuations
— First deal with Ivanhoé Cambridge under negotiation
Corporate Finance :
• Investments made by APG under our alliance with them include total disbursements of Rs.1,000 Crores as on 30 Sept 2017
• Of the Rs.1,800 Crores invested by the CFG, Rs.1,025 Crores taken over by APG and Goldman Sachs in Q3 FY2018
Alternative Asset Management

Piramal Enterprises Limited – Q2 & H1 FY2018 Results Presentation
Loan book performance against various parameters
Particulars H1 FY2018
Total Loan Book size Rs.33,261 Crores
Average Yield on Loans 15%
Average Cost of Borrowings 8.5%
Cost to Income Ratio 14.6%
Gross NPA ratio (based on 90 dpd) 0.2%
Total Provisioning 2.0%
ROA 4.2%
ROE 25%+
Performance metrics
Page 21

Financial Services
Piramal Enterprises Limited – Q2 & H1 FY2018 Results Presentation Page 22
Q4 FY15
Q1 FY16
Q2 FY16
Q3 FY16
Q4 FY16
Q1 FY17
Q2 FY17
Q3 FY17
Q4 FY17
Q1 FY18
Q2 FY18
Loan book growth (%)
67% 138% 150% 181% 174% 112% 113% 105% 87% 79% 69%
GNPA ratio % 1.9% 1.5% 1.1% 1.2% 0.9% 0.6% 0.4% 0.5% 0.4% 0.2% 0.2%
RoE% 21% 25%+ 25%+ 25%+ 25%+ 25%+ 25%+ 25%+ 25%+ 25%+ 25%+
Consistently delivering exceptional performance quarter after quarter
Trend of key ratios

Financial Services
Piramal Enterprises Limited – Q2 & H1 FY2018 Results Presentation Page 23
H1
FY2
01
8 R
oE
(%
)
H1 FY2018 Gross NPA ratio (%)
12%
15%
18%
21%
24%
27%
30%
0.0%0.5%1.0%1.5%2.0%2.5%
Performing better than the best performing banks and NBFCs of India
Note: Banks and NBFCs includes Bajaj Finance, HDFC Ltd, Indiabulls Housing Finance, HDFC Bank, Kotak Bank, IndusInd Bank and Yes Bank
X-axis : H1 FY2018 Gross NPA Ratio (%) Y-axis : H1 FY2018 RoE (%) Size of the circle : H1 FY2018 Loan book growth (%)
PEL PEL’s Financial Services business Banks & NBFCs

Piramal Enterprises Limited – Q2 & H1 FY2018 Results Presentation
Pharma
Page 24

Financial Services
Piramal Enterprises Limited – Q2 & H1 FY2018 Results Presentation Page 25
• Revenue Performance : Q2 FY2018 revenue grew 24% to Rs.963 Crores on account of organic initiatives and successful integration of acquisitions happened during last year:
— Products acquired from Janssen and Mallinckrodt
— Ash Stevens facility
• Transition and integration of acquired products from Mallinckrodt & Janssen:
— Significant completion of transition and integration of Gablofen® acquired from Mallinckrodt in the US market
— Transition and integration of products acquired from Janssen is in progress and will continue as per plan
• In collaboration with our local marketing partner, we launched Sevoflurane variant in Turkey
610
778
1,052 1,157
1,330
1,526 1,545
1,809
H1FY11
H1FY12
H1FY13
H1FY14
H1FY15
H1FY16
H1FY17
H1FY18
Revenue Performance (Rs in Crores)
Global Pharma : Successfully integrating acquisitions; maintaining high focus on quality
Revenue

Piramal Enterprises Limited – Q2 & H1 FY2018 Results Presentation Page 26
• Capacity Expansion :
— Global Pharma services business announced USD 55 mn expansion of API manufacturing capabilities & capacities in North America and Asia to support commercialisation of pipeline of >80 programs that are at Phase II or beyond currently
— New capex of USD 4mn sanctioned at Ahmedabad’s formulation development facility to facilitate expansion for a Big Pharma customer
— Phase I of the USD 25 mn expansion at Lexington is progressing well and new high speed filling line for liquid injectables is expected to start in November 2017
• Focus on Quality:
— During Q2 FY2018, the Company underwent 3 regulatory audits (including 1 USFDA audit) and 36 customer audits
— PEL won the ‘Regulatory Procedures and Compliance’ award at the prestigious CPhI Pharma Awards (2017) in Germany
— PEL won the ‘Industry Partner of the Year’ award at Global Generics and Biosimilars Awards 2017 in Germany
Global Pharma : Successfully integrating acquisitions; maintaining high focus on quality

Piramal Enterprises Limited – Q2 & H1 FY2018 Results Presentation Page 27
India Consumer Products : Well-positioned to recover shortfall post GST launch
• Revenue performance: Revenue for the quarter grew by 20% to Rs.119 Crores as the business recovered strongly from the impact of channel destocking led by the newly introduced GST tax regime in Q1 FY2018
— Despite subdued performance in the industry (~1% growth for the quarter) due to GST, our business registered a strong growth
• GST Transition: While there was significant destocking and wholesale continued to remain muted, our consumer offtakes were robust
— Despite the challenges of demonetization and GST, consumer offtakes remained robust across categories over past 6 quarters
— Destocking by trade has seen recovery since July. However, it is yet to fully recover
— Wholesale channel has been impacted by GST. However, it is yet to recover completely
• New Launches / Relaunches - Sloan’s pain relieving spray, Waterbury’s compound, Jungle Magic Garden Sciencz and Little’s breast pump were launched / re-launched during the quarter
103 111 118
180 161
H1FY14
H1FY15
H1FY16
H1FY17
H1FY18
Revenue Performance (In Rs. Crores)
Consumer Products
Allergan JV
Total Revenue
269 257
196
180 163

Piramal Enterprises Limited – Q2 & H1 FY2018 Results Presentation Page 28
Gross Contribution Improvement
Shift in consumer influence model
GST - Opportunity for us to improve business fundamentals
Business is undergoing transformation on cost structure to deliver significant improvement in profitability margins
Reducing Supply Chain Costs • Business took conscious efforts to reduce its supply chain costs by reducing CFA count, providing optimal level of service at lower cost. Distribution
expenses are expected to come down further.
Closing Stock Reduction
• Our average inventory days significantly reduced from those in pre GST levels.
Promo Optimization • In Q2 FY2018, promo spends were brought to pre demonetization levels, distribution network was realigned, trade schemes and promo mix were
optimized.
• Brands across portfolio have seen increase in gross margins on account of vendor negotiations and operational excellence bringing cost efficiencies.
• Business has transitioned towards digital platform as its key communication medium for influencing consumers, maximising reach to target group and conducting focused pilot / campaigns to target consumers.

Piramal Enterprises Limited – Q2 & H1 FY2018 Results Presentation
Healthcare Insight and Analytics
Page 29
Piramal Enterprises Limited – Q2 & H1 FY2018 Results Presentation
Healthcare Insight and Analytics
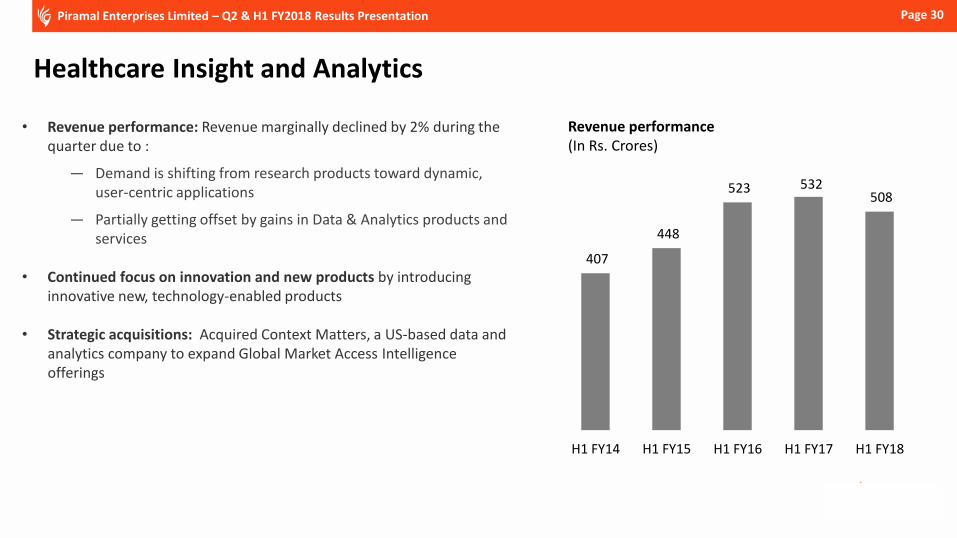
• Revenue performance: Revenue marginally declined by 2% during the quarter due to :
— Demand is shifting from research products toward dynamic, user-centric applications
— Partially getting offset by gains in Data & Analytics products and services
• Continued focus on innovation and new products by introducing
innovative new, technology-enabled products
• Strategic acquisitions: Acquired Context Matters, a US-based data and analytics company to expand Global Market Access Intelligence offerings
Revenue performance (In Rs. Crores)
407
448
523 532 508
H1 FY14 H1 FY15 H1 FY16 H1 FY17 H1 FY18
Page 30

Piramal Enterprises Limited – Q2 & H1 FY2018 Results Presentation
Financials
Page 31

Piramal Enterprises Limited – Q2 & H1 FY2018 Results Presentation
Diversified Revenue Mix (In Rs. Crores or as stated)
Net Sales break-up Quarter II ended
% Sales Half year ended
30-Sept-17 30-Sept-16 % Change 30-Sept-17 30-Sept-16 % Change
Financial Services 1,186 815 45.4% 47.4% 2,270 1,450 56.6%
Pharma 1,083 874 23.9% 41.1% 1,970 1,725 14.2%
Global Pharma 963 774 24.4% - 1,809 1,545 17.1%
India Consumer Products 119 99 20.1% - 161 180 (10.5%)
Healthcare Insight and Analytics 256 262 (2.4%) 10.6% 508 532 (4.5%)
Others 12 15 - 0.9% 43 36 -
Total 2,536 1,966 29.0% 100% 4,790 3,742 28.0%
Note:
1. Foreign Currency denominated revenue in Q2 FY2018 was Rs.1,178 Crores (46% of total revenue) and in H1 FY2018 was Rs. 2,223 Crores (46% of the total revenue)
Page 32

Piramal Enterprises Limited – Q2 & H1 FY2018 Results Presentation
Consolidated P&L
Particulars Quarter II Ended Half year ended
30-Sept-17 30-Sept-16 % Change 30-Sept-17 30-Sept-16 % Change
Net Sales 2,536 1,966 29% 4,790 3,742 28%
Non-operating other income 75 42 78% 159 95 67%
Total income 2,611 2,008 30% 4,949 3,838 29%
Other Operating Expenses 1,266 1,223 4% 2,458 2,361 4%
OPBIDTA 1,345 786 71% 2,491 1,477 69%
Interest Expenses 725 455 59% 1,398 851 64%
Depreciation 129 73 76% 252 150 68%
Profit before tax & exceptional items 491 257 91% 841 476 76%
Exceptional items (Expenses)/Income - - - - -
Income tax 190 3 - 292 49 -
Profit after tax (before MI & Prior Period items) 301 254 19% 549 427 28%
Minority interest - - - -
Share of Associates 82 52 58% 137 110 24%
Net Profit after Tax 384 306 25% 686 537 28%
Net Profit Margin % 15% 16% - 14% 14% -
EPS (Rs./share) 22.3 17.8 25% 39.8 31.1 28%
Notes: 1. Income under share of associates primarily includes our share of profits at Shriram Capital and profit under JV with Allergan, as per the new accounting
standards.
(In Rs. Crores or as stated)
Page 33

Piramal Enterprises Limited – Q2 & H1 FY2018 Results Presentation
Consolidated Balance Sheet Particulars 30 Sept 2017 31 March 2017
Equity Share Capital 35 35
Other Equity 14,896 14,848
Non Controlling Interests 12 13
Borrowings (Current & Non Current) 38,833 30,451
Deferred Tax Liabilities (Net) 35 31
Other Liabilities 2,677 2,675
Provisions 133 187
Total 56,620 48,239
PPE, Intangibles (Under Development), CWIP 5,595 5,425
Goodwill on Consolidation 5,535 5,427
Financial Assets
Investment 20,898 21,717
Others 12,921 5,887
Other Non Current Assets 421 399
Deferred Tax Asset (Net) 660 625
Current Assets
Inventories 812 723
Trade receivable 1,134 1,108
Cash & Cash Equivalents & Other Bank balances 1,395 1,541
Other Financial & Non Financial Assets 7,249 5,387
Total 56,620 48,239
Note : The above numbers have been regrouped from IND AS Financial Statements for Presentation purposes only
(In Rs. Crores)
Page 34

Piramal Enterprises Limited – Q2 & H1 FY2018 Results Presentation
Awards and recognitions
Page 35
Piramal Pharma Solutions won the ‘Regulatory Procedures and Compliance’ award at the prestigious
CPhI Pharma Awards (2017) in Germany
Won the ‘Industry Partner of the Year’ award at Global Generics and Biosimilars Awards 2017 in
Germany
Piramal Finance received ‘Best Overall Investment Manager for Real Estate in India’ award by
Euromoney Real Estate Awards 2017
Piramal Finance Limited was ranked 4th amongst Top 10 India’s Great Mid-size Workplaces by Great Place
to Work Institute

Piramal Enterprises Limited – Q2 & H1 FY2018 Results Presentation
Awards and recognitions
Page 36
Piramal Enterprises won the Gold Award at the 2016 Vision Awards Annual Report Competition, held by
the League of American Communications Professionals (LACP)
Mr. Ajay Piramal, Chairman of Piramal Group has been honored with the CNBC Asia Business Leader Award
2017
Mr Khushru Jijina, MD & CEO of Piramal Housing Finance has been conferred with the ‘AsiaOne Global
Indian of the Year 2016-17’ under the ‘Business Leadership (Finance)’ Category
Piramal Enterprises has been rated among best companies in India Disclosure Index by FTI Consulting

Piramal Enterprises Limited – Q2 & H1 FY2018 Results Presentation Page 37
For Investors : Hitesh Dhaddha Email : [email protected] Phone : +91 22 3046 6444 Bhavna Sinyal Email : [email protected] Phone : +91 22 3046 6570