Embed Size (px)
Citation preview
Short and long-term leakage through composite liners The 2011 Arthur Casagrande Lecture R. Kerry Rowe GeoEngineering Centre at Queen’s-RMC, Queen’s University, Kingston, Ontario, Canada ABSTRACT The factors that may affect short-term leakage through composite liners are examined. It is shown that the leakage through composite liners is only a very small fraction of that expected for either a geomembrane (GM) or clay liner (CL) alone. However, the calculated leakage through holes in a GM in direct contact with a clay liner is typically substantially smaller than that actually observed in the field. It is shown that calculated leakage taking account of typical connected wrinkle lengths observed in the field explains the observed field leakage through composite liners. Provided that care is taken to avoid excessive connected wrinkle lengths, the leakage through composite liners is very small compared to a typical GM or CL alone. It is shown that the leakage through composite liners with a geosynthetic clay liner (GCL) is typically much less than for composite liners with a compacted clay liner (CCL). Finally, factors that will affect long-term leakage through composite liners are discussed. It is concluded that composite liners have performed extremely well in field applications for a couple of decades and that recent research both helps understand why they have worked so well, but also provides new insight into issues that need to be considered to ensure excellent long-term liner performance of composite liners—especially for applications where the liner temperature can exceed about 35oC. RÉSUMÉ Les facteurs qui peuvent influencer à court terme les fuites à travers les étanchéités composites sont examinés. On démontre que les fuites à travers ce type d'étanchéité sont moindres que celles anticipées pour une géomembrane (GM) ou une couche d’argile (CA) seule. Toutefois, les fuites calculées pour les défauts dans une GM mise en contact direct avec une CA sont typiquement beaucoup plus petites que celles observées sur le terrain. On montre que la contribution des fuites calculée en tenant compte de la longueur typique de plis raccordés entre eux explique l’ampleur des fuites observées sur le terrain pour de telles étanchéités composites (GM et CA). Lorsque l’on réduit la présence de longueurs excessives de plis raccordés, les fuites à travers les étanchéités composites peuvent s’avérer très faibles lorsque comparées à celles des GM ou CA utilisées seules. Il est aussi démontré que les fuites à travers les étanchéités composites comportant un géosynthétique bentonique (GSB) sont typiquement bien moindres que pour les étanchéités composites avec une couche d’argile compactée (CAC). Finalement, on discute des facteurs qui affectent les fuites à long terme à travers les étanchéités composites. Les travaux montrent que ces étanchéités composites se sont très bien comportés sur le terrain depuis deux décennies, et que les recherches récentes aident à comprendre les raisons qui expliquent ces bonnes performances. Les études fournissent aussi une nouvelle perception des aspects qui doivent être considérés pour assurer une excellente performance à long terme des étanchéités composites, particulièrement dans le cas où la température peut excéder 35°C. RESUMEN En este trabajo se examinan los factores que pueden afectar a corto plazo las filtraciones a través de mantas de revestimiento compuestas. Se ha demostrado que la filtración a través de mantas de revestimiento compuestas es tan sólo una pequeña fracción de la filtración esperada a través de geomembranas (GM) o mantas de arcilla (CL) aisladas. Sin embargo, la filtración calculada a través de agujeros en GM en contacto directo con una capa de arcilla es normalmente mucho menor que la filtración observada en el campo. Se demuestra que la filtración calculada teniendo en cuenta longitudes típicas de pliegues conectados, observados en el campo, explica la filtración observada en campo a través de mantas compuestas. Siempre que se tenga cuidado de evitar pliegues conectados muy largos, la filtración a través de mantas compuestas es muy pequeña en comparación con la filtración típica en GM o CL aisladas. Se demuestra que la filtración a través de mantas compuestas con una capa de arcilla geosintética (GCL) es generalmente mucho menor que para mantas compuestas con una capa de arcilla compactada (CCL). Finalmente, se discuten los factores que afectan las filtraciones a través de mantas compuestas a largo plazo. Se concluye que las mantas compuestas han funcionado extremadamente bien en aplicaciones de campo por un par de décadas y que las investigaciones recientes han ayudado a no solo a entender por qué han funcionado tan bien, sino que también han proporcionado un mejor entendimiento de los factores que deben considerarse para garantizar un excelente comportamiento a largo plazo de las mantas compuestas—especialmente en aplicaciones donde la temperatura de las mantas puede exceder los 35 oC.
1 INTRODUCTION Composite liners are comprised of a geomembrane (GM) over a clay liner. Typically the clay liner (CL) will be either a compacted clay liner (CCL) or a geosynthetic clay liner (GCL). The composite liner may rest on either a permeable (e.g., drainage) layer or a subsoil which may act as an attenuation layer (AL). GMs used in landfill related applications are usually high density polyethylene (HDPE) with a thickness typically ranging from 1.5 mm to 2.5 mm. GCLs (typically < 10 mm thick off the roll) come in a variety of forms but invariably involve a thin layer of bentonite clay which may be glued to a carrier plastic layer or contained between two geotextiles. The most common GCLs have a geotextile on either side of the bentonite layer and are held together by needle-punching or, in some cases, stitching. These are sometimes called reinforced GCLs because of the presence of the needle-punched or stitched fibres, which place some constraint on the swelling of the GCL as it hydrates in addition to contributing to the internal shear strength of the GCL (both positive attributes). The AL is a subgrade (usually already in place) that typically has a hydraulic conductivity, kA ≤ 1x10⁻⁷ m/s.
A composite liner is intended to minimize the migration of fluids (both liquids and gases) by the processes of diffusion and advection. There are a wide range of applications for composite liners but this paper focuses on their use as bottom liners for municipal solid waste (MSW) landfills and leachate lagoons, although much of the material presented and discussed has a broader range of application.
To some extent, a composite liner takes advantage of the strengths of one material to offset the weaknesses of the other. For example, an intact GM is an excellent barrier to the advective and diffusive migration of fluids such as landfill leachate and many contaminants in the leachate (e.g., volatile fatty acids, sodium, chloride, ammonia, sulphate, iron, lead, zinc, mercury, arsenic, etc.)—except where it has a hole. Even one relatively small hole per hectare (1 mm diameter) can result in significant leakage for a GM if there is no hydraulic resistance adjacent to the GM. CCLs and GCLs under ideal conditions can also perform as excellent advective barriers to leachate but may not be as effective as a diffusion barrier as the GM to the contaminants listed above. In contrast, certain contaminants found in small quantities in leachate (e.g., volatile organic compounds such as benzene, toluene, dichloromethane, etc.) can readily diffuse through standard HDPE GMs, while a suitable clay liner and attenuation layer can provide much better resistance to their migration (Rowe 2005). Thus the combined use of a GM together with a GCL or CCL and an attenuation layer has the potential to provide excellent diffusive resistance to a wide range of chemicals found in landfill leachate by taking advantage of the better performance of the GM in preventing diffusion of some contaminants and the better performance of the clay liner and attenuation layer in minimizing the migration of other contaminants.
However, the combination of the GM and CL does more than take advantage of the benefits of the two
materials—together they act as a composite liner which, as will be shown, demonstrates superior performance than one would expect simply based on the sum of the parts.
The objective of this paper is to explore the factors that can affect the performance of GMs and CLs (with emphasis on GCLs) as part of composite liners for containing MSW leachate both in landfills and leachate lagoons. The paper follows three of the writer’s past papers that have addressed some of these issues, namely the keynote lecture at the 6th International Conference on Geosynthetics in Atlanta (Rowe 1998), the 45th Rankine lecture (Rowe 2005) and the 23rd Rocha Lecture (Rowe 2007). This paper will touch on some of the same issues as these three papers—but with an emphasis on highlighting what has been learned with respect to selected topics in the intervening years and addressing the issue of leakage (advective flow) in much more detail than the earlier papers. Thus this paper only deals with a few of the many issues addressed in the previous papers and, except where essential for understanding, does not repeat material in those three papers. The interested reader will find much information in those papers that is very relevant today and which complements the material presented in this paper.
2 HOLES IN GEOMEMBRANES In the absence of holes, the leakage of water or leachate through a typical 1.5 mm HDPE GM used in landfill applications is negligible. However, experience has shown that it is extremely difficult to ensure no holes exist in practical situations. Holes may arise from: (a) manufacturing defects; (b) handling of the GM rolls; (c) on-site placement and seaming; (d) the placement of drainage gravel over the liner system; (e) trafficking over the liner or the overlying protection layer; (f) placement of the waste in a landfill or cleaning of residue from the pond of a leachate lagoon; and (f) subsequent stress cracking. Table 1 summarizes the hole sizes reported by Colucci and Lavagnolo (1995). Here 50% of holes had an area of less than 100 mm2 (radius ro < 5.64 mm). Nosko and Touze-Foltz (2000) reported 3 holes/ha following installation and 12 holes/ha following placement of the drainage layer. In principle, holes arising from sources (a) through (d) having a diameter greater than 1 mm should be detected by an electrical leak detection survey since this is a calibration requirement of ASTM D7002 (ASTM 2010a). However, these surveys are not generally required and even then holes can be missed and subsequent holes can develop. Giroud and Bonaparte (2001) suggested that 2.5 to 5 holes/ha be used for design calculations of leakage for GMs installed with strict construction quality assurance.
The holes discussed above represent those present shortly after construction and placing of the waste (or filling of a lagoon with leachate). As will be discussed later, the number of holes may increase in the long-term due to ageing of the GM.
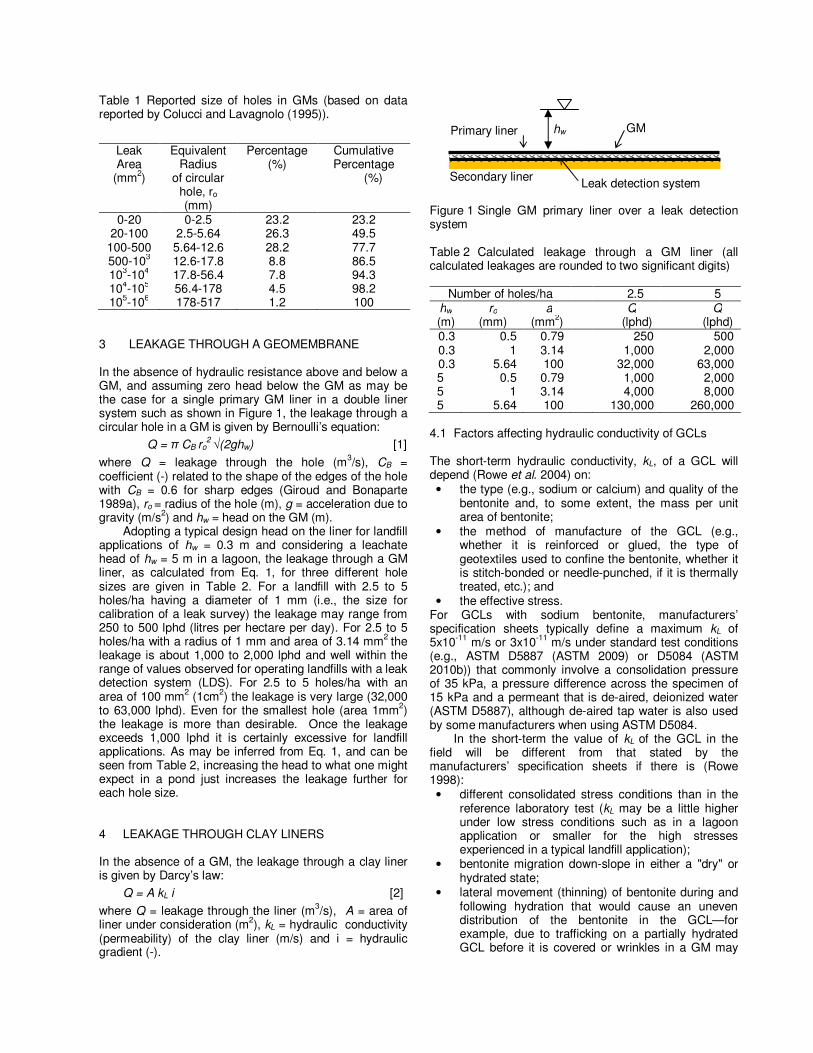
Table 1 Reported size of holes in GMs (based on data reported by Colucci and Lavagnolo (1995)).
Leak Area
(mm2)
Equivalent Radius
of circular hole, ro (mm)
Percentage (%)
Cumulative Percentage
(%)
0-20 0-2.5 23.2 23.2 20-100 2.5-5.64 26.3 49.5
100-500 5.64-12.6 28.2 77.7 500-103 12.6-17.8 8.8 86.5 103-104 17.8-56.4 7.8 94.3 104-105 56.4-178 4.5 98.2 105-106 178-517 1.2 100
3 LEAKAGE THROUGH A GEOMEMBRANE In the absence of hydraulic resistance above and below a GM, and assuming zero head below the GM as may be the case for a single primary GM liner in a double liner system such as shown in Figure 1, the leakage through a circular hole in a GM is given by Bernoulli’s equation:
Q = π CB ro2 √(2ghw) [1]
where Q = leakage through the hole (m3/s), CB = coefficient (-) related to the shape of the edges of the hole with CB = 0.6 for sharp edges (Giroud and Bonaparte 1989a), ro = radius of the hole (m), g = acceleration due to gravity (m/s2) and hw = head on the GM (m).
Adopting a typical design head on the liner for landfill applications of hw = 0.3 m and considering a leachate head of hw = 5 m in a lagoon, the leakage through a GM liner, as calculated from Eq. 1, for three different hole sizes are given in Table 2. For a landfill with 2.5 to 5 holes/ha having a diameter of 1 mm (i.e., the size for calibration of a leak survey) the leakage may range from 250 to 500 lphd (litres per hectare per day). For 2.5 to 5 holes/ha with a radius of 1 mm and area of 3.14 mm2 the leakage is about 1,000 to 2,000 lphd and well within the range of values observed for operating landfills with a leak detection system (LDS). For 2.5 to 5 holes/ha with an area of 100 mm2 (1cm2) the leakage is very large (32,000 to 63,000 lphd). Even for the smallest hole (area 1mm2) the leakage is more than desirable. Once the leakage exceeds 1,000 lphd it is certainly excessive for landfill applications. As may be inferred from Eq. 1, and can be seen from Table 2, increasing the head to what one might expect in a pond just increases the leakage further for each hole size.
4 LEAKAGE THROUGH CLAY LINERS In the absence of a GM, the leakage through a clay liner is given by Darcy’s law:
Q = A kL i [2]
where Q = leakage through the liner (m3/s), A = area of liner under consideration (m2), kL = hydraulic conductivity (permeability) of the clay liner (m/s) and i = hydraulic gradient (-).
Figure 1 Single GM primary liner over a leak detection system Table 2 Calculated leakage through a GM liner (all calculated leakages are rounded to two significant digits)
Number of holes/ha 2.5 5 hw ro a Q Q (m) (mm) (mm2) (lphd) (lphd) 0.3 0.5 0.79 250 500 0.3 1 3.14 1,000 2,000 0.3 5.64 100 32,000 63,000 5 0.5 0.79 1,000 2,000 5 1 3.14 4,000 8,000 5 5.64 100 130,000 260,000
4.1 Factors affecting hydraulic conductivity of GCLs The short-term hydraulic conductivity, kL, of a GCL will depend (Rowe et al. 2004) on: • the type (e.g., sodium or calcium) and quality of the
bentonite and, to some extent, the mass per unit area of bentonite;
• the method of manufacture of the GCL (e.g., whether it is reinforced or glued, the type of geotextiles used to confine the bentonite, whether it is stitch-bonded or needle-punched, if it is thermally treated, etc.); and
• the effective stress. For GCLs with sodium bentonite, manufacturers’ specification sheets typically define a maximum kL of 5x10-11 m/s or 3x10-11 m/s under standard test conditions (e.g., ASTM D5887 (ASTM 2009) or D5084 (ASTM 2010b)) that commonly involve a consolidation pressure of 35 kPa, a pressure difference across the specimen of 15 kPa and a permeant that is de-aired, deionized water (ASTM D5887), although de-aired tap water is also used by some manufacturers when using ASTM D5084.
In the short-term the value of kL of the GCL in the field will be different from that stated by the manufacturers’ specification sheets if there is (Rowe 1998): • different consolidated stress conditions than in the
reference laboratory test (kL may be a little higher under low stress conditions such as in a lagoon application or smaller for the high stresses experienced in a typical landfill application);
• bentonite migration down-slope in either a "dry" or hydrated state;
• lateral movement (thinning) of bentonite during and following hydration that would cause an uneven distribution of the bentonite in the GCL—for example, due to trafficking on a partially hydrated GCL before it is covered or wrinkles in a GM may
GM
Leak detection system Secondary liner
Primary liner hw
create an area of reduced bentonite in an underlying GCL (Stark 1998); or
• desiccation of the GCL. In addition to the factors noted above, the long-term kL value for a GCL in the field may be different from that in the manufacturer’s literature if there is: • interaction between the leachate permeating the
GCL and the bentonite in the GCL (e.g., Rad et al. 1994; Petrov et al. 1997; Petrov and Rowe 1997; Ruhl and Daniel 1997; Rowe 1998; Shackelford et al. 2000; Jo et al. 2001, 2004; Kolstad et al. 2004; Rowe 2007; Musso and Pejon 2010);
• loss or internal erosion of bentonite into underlying subsoil or drainage layers (Rowe and Orsini 2003)—an additional geotextile filter may be required to avoid bentonite loss for some GCLs (Estornell and Daniel 1992); or
• cation exchange with carbonate in the bentonite (e.g., for some sodium activated calcium bentonites) or divalent cations in the adjacent soil/pore water (e.g., James et al. 1997), especially if combined with wet-dry cycles (e.g., Melchior 1997; Lin and Benson 2000; Meer and Benson 2007; Benson et al. 2010; Scalia and Benson 2011).
Rowe (1998) tabulated data from a number of papers for 8 different GCLs containing natural sodium bentonite. The hydraulic conductivity with respect to water ranged from 5x10-11 m/s at “low” (3 to 4 kPa) confining stress to 1x10-
11 m/s at “intermediate” (34 to 38 kPa) confining stress and 7x10-12 m/s at “high” (109 to 117 kPa) confining stress.
When GCLs are permeated with salt solutions or simulated or real MSW leachates, the confining stress at the time of hydration and the hydrating fluid can have a significant effect on the final hydraulic conductivity as shown in a number of the papers cited above. For example, Petrov and Rowe (1997) showed that a GCL hydrated with clean water at 3 to 4 kPa and then permeated with a 0.1 M NaCl solution (Na+ ~ 2300 mg/L) at the same low stress level had a hydraulic conductivity of 1x10⁻¹⁰ m/s whereas the same GCL hydrated at the same stress but permeated with a 0.1 M NaCl solution at higher stress (112 kPa) had a hydraulic conductivity of 1.5x10⁻¹¹ m/s (about one order of magnitude lower), and a sample hydrated with water and then permeated with 0.1 M NaCl all at 108 kPa had a hydraulic conductivity of 0.7x10⁻¹¹ m/s. Thus it is important to carefully consider the hydrating conditions and final stress level when selecting the hydraulic conductivity of the GCL to be used for calculating leakage on a given project. It also follows that for a given GCL, the hydraulic conductivity relevant to a liner for the bottom of a landfill may be lower than for the same GCL being used in a leachate holding or treatment pond.
The chemical composition of the permeating fluid can have a very significant effect on the hydraulic conductivity of a GCL as has been demonstrated by many of the papers cited above. A great deal has been published on the interaction of GCLs with simple salt solutions (predominantly NaCl, CaCl2 and to a lesser extent KCl); relatively little work has been done on simulated MSW leachates. Rowe (1998) summarized what had been done
at that time and there has been little additional insight with respect to MSW leachate in the last decade. Most of the comparable data is at about 30 to 35 kPa, at which stress Ruhl and Daniel (1997) reported kL < 1x10-12 m/s for a real MSW leachate (see Rowe 1998 for a discussion of this low value) but a very high kL = 2x10⁻⁸ m/s for a very aggressive “synthetic leachate”. This synthetic leachate was not based on any real landfill leachate but rather was “designed” to have high sodium and calcium concentrations that would greatly increase the value of kL for the sodium bentonite being tested. At the same stress, Petrov and Rowe (1997) reported kL = 7x10-11 m/s for a synthetic leachate based on the composition of the Keele Valley landfill leachate at the time. Lange et al. (2010) reported tests at 25 kPa using a simulated MSW leachate which gave kL = 4x10-11 m/s.
Based on a review of the available data, the “typical” or “base case” value of kL for consideration in this paper was taken to be the typically specified kL = 5x10-11 m/s since it represents a reasonable value for GCLs permeated with water at low (3 to 4 kPa) stress levels but also closely approximates the values obtained for GCLs permeated with a realistic simulated MSW leachate at stresses of 25 to 35 kPa (Petrov and Rowe 1997; Lange et al. 2010). It is recognised that, especially at low confining stress, permeation with leachate could result in higher hydraulic conductivities and a value of kL = 2x10⁻¹⁰ m/s was selected as a second base case. To assess the effect of kL on leakage, additional calculations were performed for kL = 7x10-12 m/s as a lower bound, kL = 1x10⁻¹⁰ m/s as an intermediate, and kL = 2x10⁻⁸ m/s as a relatively extreme upper bound based on the very aggressive synthetic leachate used by Ruhl and Daniel (1997).
Given the importance of the hydration of a GCL prior to contact with leachate on its long-term hydraulic performance, it is surprising that the hydration of GCLs from the underlying subsoil has received very little attention and it is simply assumed that they will be adequately hydrated by the time they need to perform their containment function. Daniel et al. (1993) showed that, when placed on sand at 3% gravimetric moisture content, an initially air dry GCL reached 88% moisture content after 40 to 45 days. Eberle and von Maubeuge (1997) showed that an initially air dry GCL placed over sand with a moisture content of 8 to 10% reached a moisture content of 100% in less than 24 hours and 140% after 60 days. However, Rayhani et al. (2011) showed much slower hydration for three different needle-punched GCLs on underlying sand and silty sand of up to 70 weeks. They demonstrated that the initial moisture content of the subsoil can have a large effect on the rate of hydration and the final equilibrium GCL moisture content. For example, GCLs on subsoil with initial moisture contents close to field capacity hydrated quickly and their final moisture contents were essentially the same as if the GCL had been immersed in water. In contrast, GCLs on the subsoil at initial moisture content close to their residual moisture content (5% for the silty sand and 2% for the sand considered) only hydrated to a gravimetric moisture content of 30 to 35%, which is about a quarter of the fully hydrated value.
Rayhani et al. (2011) also demonstrated that the method of GCL manufacture had a significant effect on both the rate of GCL hydration and the final GCL moisture content when the subsoil had low moisture contents. This difference was related to different water retention curves for the three GCLs (Beddoe et al. 2011), the difference in confinement of the bentonite provided by different carrier geotextiles and the presence or absence of thermal treatment of the needle-punched fibres. The best hydration performance was observed for GCLs manufactured with a scrim-reinforced and thermally treated nonwoven carrier geotextile.
4.2 Factors affecting hydraulic conductivity of CCLs
Much has been written on compacted clay liners (see Rowe et al. 2004 for a review). The short-term hydraulic conductivity, kL, of a CCL will depend (Rowe et al. 2004) on: • the plasticity and grain size distribution of the soil; • the moisture content at which it is compacted; • the method of compaction; and • the effective stress.
In the long-term, the value of kL will depend on: • interaction between the leachate permeating the
CCL and the clay minerals; and • desiccation.
Desiccation results from drying of the clay from its as-compacted state and may be especially severe for CCLs compacted near or above the plastic limit. Desiccation may occur (a) after construction of the clay liner and before placing the drainage layer or GM; (b) after placing the GM and before covering with the drainage layer; and/or (c) after placing the waste.
These issues have been discussed by Rowe et al. (2004) and Rowe (2005) and are elaborated further later in this paper. Based on experience (e.g., Benson et al. 1994, 1999; Daniel and Koerner 1995; Rowe et al. 2004), CCLs typically have a design kL = 1x10⁻⁹ m/s. Well- constructed liners may achieve kL = 5x10⁻¹⁰ m/s or even kL ≤ 1x10⁻¹⁰ m/s after consolidation (Rowe 2005); however, it is also not unusual for a CCL to have kL = 1x10⁻⁸ m/s unless great care is taken in the selection of the soil and compaction. These values will be used to calculate leakage in some of the following sections. 4.3 Calculated leakage through clay liners
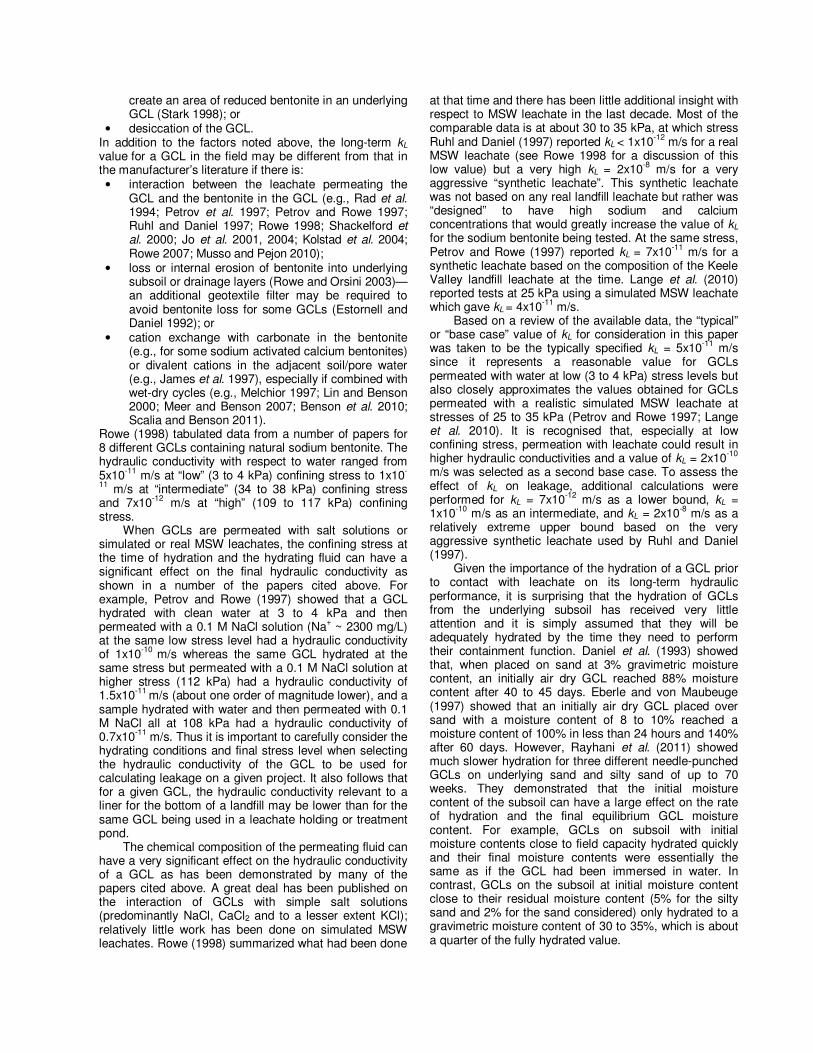
Table 3 gives the calculated leakage for a primary clay liner in a double liner system where the primary liner is underlain by a leak detection layer to collect the leakage through the primary liner (Figure 2). Leakages are given for a typical CCL design kL = 1x10⁻⁹ m/s and thickness HL = 0.6 m and a typical GCL kL = 5x10-11 m/s and HL = 0.01 m, assuming zero head below the liner (ha = 0 m) and no attenuation layer (HA = 0 m). Under these circumstances, the leakage through the GCL and CCL are very similar—both about 1300 lphd. This is within the range expected for a GM alone having 2.5 to 5 holes (ro = 1 mm) per hectare (Table 1).
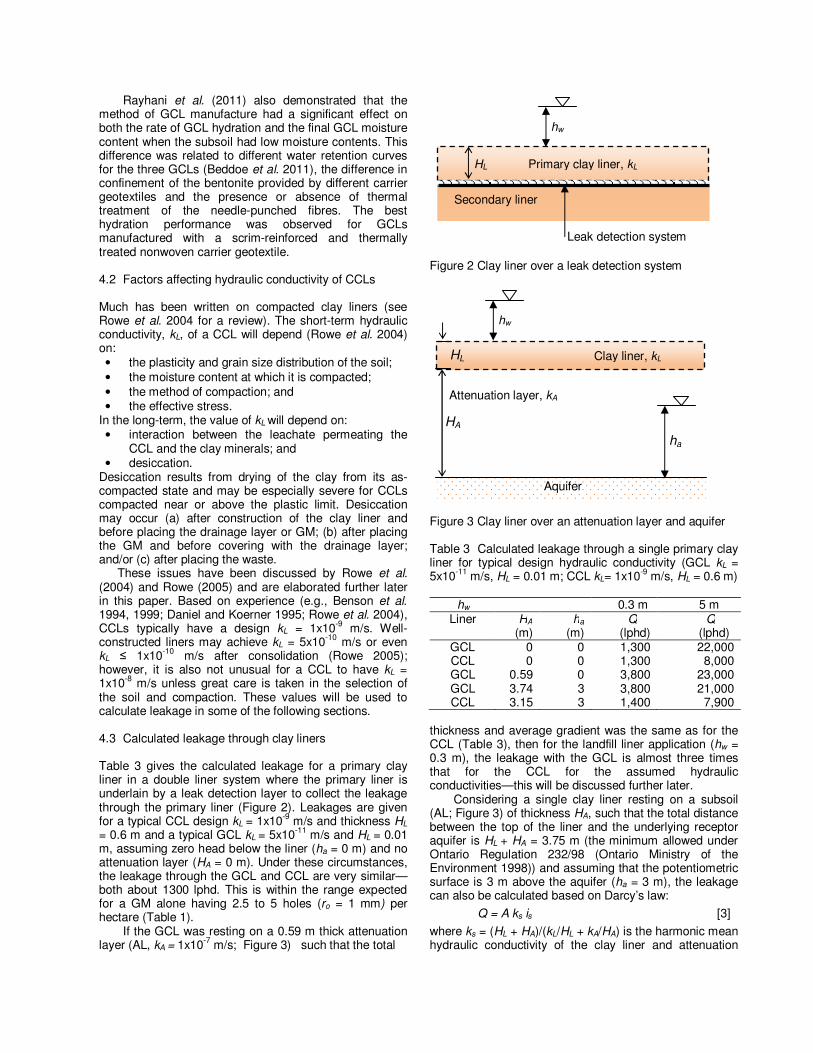
If the GCL was resting on a 0.59 m thick attenuation layer (AL, kA = 1x10⁻⁷ m/s; Figure 3) such that the total
Figure 2 Clay liner over a leak detection system
Figure 3 Clay liner over an attenuation layer and aquifer
Table 3 Calculated leakage through a single primary clay liner for typical design hydraulic conductivity (GCL kL = 5x10-11 m/s, HL = 0.01 m; CCL kL= 1x10⁻⁹ m/s, HL = 0.6 m)
hw 0.3 m 5 m Liner HA ha Q Q
(m) (m) (lphd) (lphd) GCL 0 0 1,300 22,000 CCL 0 0 1,300 8,000 GCL 0.59 0 3,800 23,000 GCL 3.74 3 3,800 21,000 CCL 3.15 3 1,400 7,900
thickness and average gradient was the same as for the CCL (Table 3), then for the landfill liner application (hw = 0.3 m), the leakage with the GCL is almost three times that for the CCL for the assumed hydraulic conductivities—this will be discussed further later.
Considering a single clay liner resting on a subsoil (AL; Figure 3) of thickness HA, such that the total distance between the top of the liner and the underlying receptor aquifer is HL + HA = 3.75 m (the minimum allowed under Ontario Regulation 232/98 (Ontario Ministry of the Environment 1998)) and assuming that the potentiometric surface is 3 m above the aquifer (ha = 3 m), the leakage can also be calculated based on Darcy’s law:
Q = A ks is [3]
where ks = (HL + HA)/(kL/HL + kA/HA) is the harmonic mean hydraulic conductivity of the clay liner and attenuation
hw
Primary clay liner, kL
Leak detection system
HL
Secondary liner
hw
Aquifer
HA
Clay liner, kL
Attenuation layer, kA
ha
HL
layer (m/s), and is = (hw + HL + HA - ha)/(HL + HA) is the average hydraulic gradient (-) across the CL and AL. The leakage for the GCL and CCL for this case is given in the last two rows of Table 3. Again, for these parameters, the leakage through the single GCL is greater than for the CCL.
In a lagoon application (hw = 5 m; Table 3) the leakages are higher due to the higher gradients but the trends are the same as discussed above except for the GCL alone which now gives much great leakage (due to the much higher gradient) than the CCL alone.
A key parameter in assessing the performance of a single clay liner is the hydraulic conductivity. The hydraulic conductivity of a GCL or a CCL can vary depending on many factors as discussed earlier. The leakages calculated using typical upper bounds for bottom liner applications discussed in this paper (kL = 2x10⁻¹⁰ m/s for the GCL and kL = 1x10⁻⁸ m/s for the CCL—under extreme conditions higher values are possible) are given in Table 4. For the “typical” worst case conditions (Table 4) the GCL typically performs about the same as the CCL except for the case of a primary liner in a double lined system (rows 1 and 2 of Table 4), where the GCL performs substantially better than the CCL for the landfill liner case. Table 4 Calculated leakage through a single primary clay liner for upper bound hydraulic conductivity (GCL kL = 2x10⁻¹⁰ m/s, HL = 0.01 m; CCL kL= 1x10⁻⁸ m/s, HL = 0.6 m)
hw 0.3 m 5 m Liner HA ha Q Q
(m) (m) (lphd) (lphd) GCL 0 0 5,400 87,000 CCL 0 0 13,000 81,000 GCL 0.59 0 14,000 87,000 GCL 3.74 3 10,000 57,000 CCL 3.15 3 9,900 54,000 Just as the hydraulic conductivity can be worse than
typical design parameters it can also be better (especially in landfill bottom liners when there is significant applied stress; see Rowe et al. 2004). The leakages calculated for the cases discussed above but using typical lower bounds of hydraulic conductivity (kL = 7x10-12 m/s for a GCL and kL = 1x10⁻¹⁰ m/s for a CCL) are given in Table 5. As might be expected, the leakages are substantially reduced compared to the typical design parameters (Table 3).
The examples discussed above serve to illustrate two points. First, when a clay liner is used as a single liner it is very important to consider the factors that can affect hydraulic conductivity and adopt a design value relevant to the expected conditions at the site, as they may be quite different to “typical” values obtained by permeating a GCL or CCL with water in the laboratory (Rowe et al. 2004). For example, hydraulic conductivity values can be significantly affected by both the permeant and stress (Petrov and Rowe 1997). Thus the hydraulic conductivity in a bottom liner application with 50 m of overlying waste may be quite different to that in a leachate lagoon application. Second, in many of the cases considered above, the leakage exceeds what would normally be
considered acceptable in terms of potential impact on an underlying aquifer. Table 5 Calculated leakage through a single primary clay liner for lower bound hydraulic conductivity (GCL kL = 7x10-12 m/s, HL= 0.01 m; CCL kL= 1x10⁻¹⁰ m/s, HL= 0.6 m)
hw 0.3 m 5 m Liner HA ha Q Q
(m) (m) (lphd) (lphd) GCL 0 0 190 3,000 CCL 0 0 130 810 GCL 0.59 0 540 3,400 GCL 3.74 3 620 3,400 CCL 3.15 3 150 820
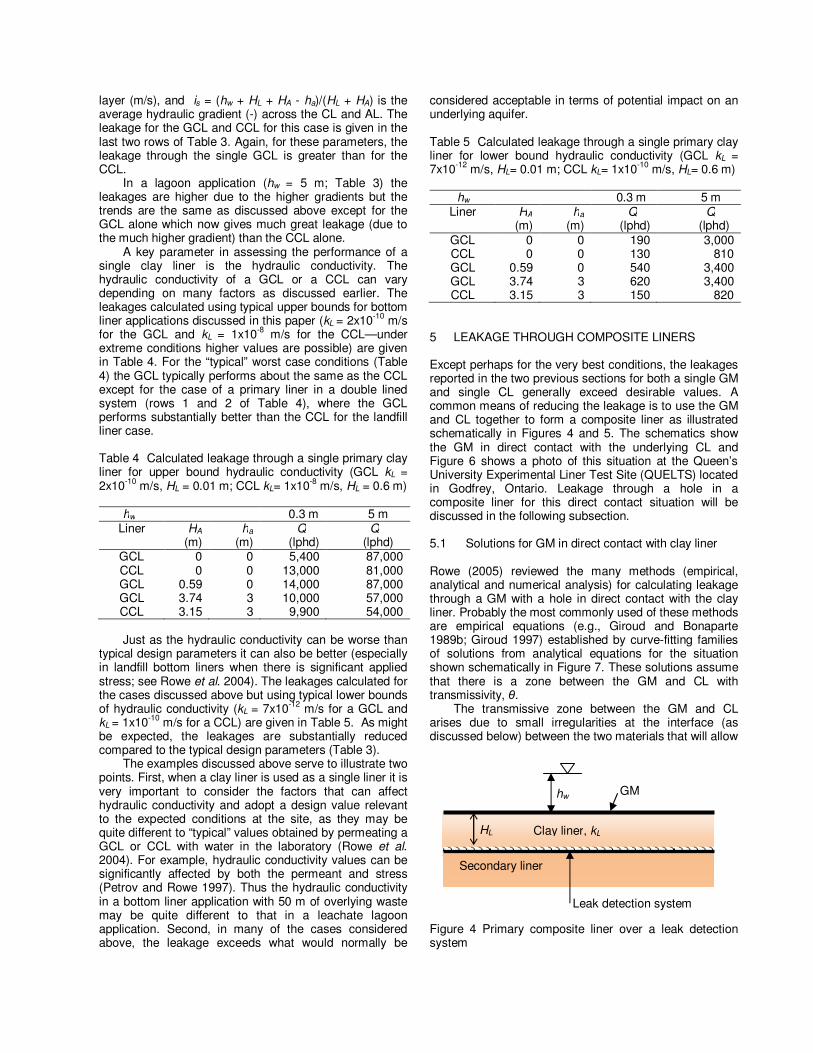
5 LEAKAGE THROUGH COMPOSITE LINERS Except perhaps for the very best conditions, the leakages reported in the two previous sections for both a single GM and single CL generally exceed desirable values. A common means of reducing the leakage is to use the GM and CL together to form a composite liner as illustrated schematically in Figures 4 and 5. The schematics show the GM in direct contact with the underlying CL and Figure 6 shows a photo of this situation at the Queen’s University Experimental Liner Test Site (QUELTS) located in Godfrey, Ontario. Leakage through a hole in a composite liner for this direct contact situation will be discussed in the following subsection. 5.1 Solutions for GM in direct contact with clay liner Rowe (2005) reviewed the many methods (empirical, analytical and numerical analysis) for calculating leakage through a GM with a hole in direct contact with the clay liner. Probably the most commonly used of these methods are empirical equations (e.g., Giroud and Bonaparte 1989b; Giroud 1997) established by curve-fitting families of solutions from analytical equations for the situation shown schematically in Figure 7. These solutions assume that there is a zone between the GM and CL with transmissivity, θ.
The transmissive zone between the GM and CL arises due to small irregularities at the interface (as discussed below) between the two materials that will allow Figure 4 Primary composite liner over a leak detection system
hw
Clay liner, kL
Leak detection system
HL
Secondary liner
GM
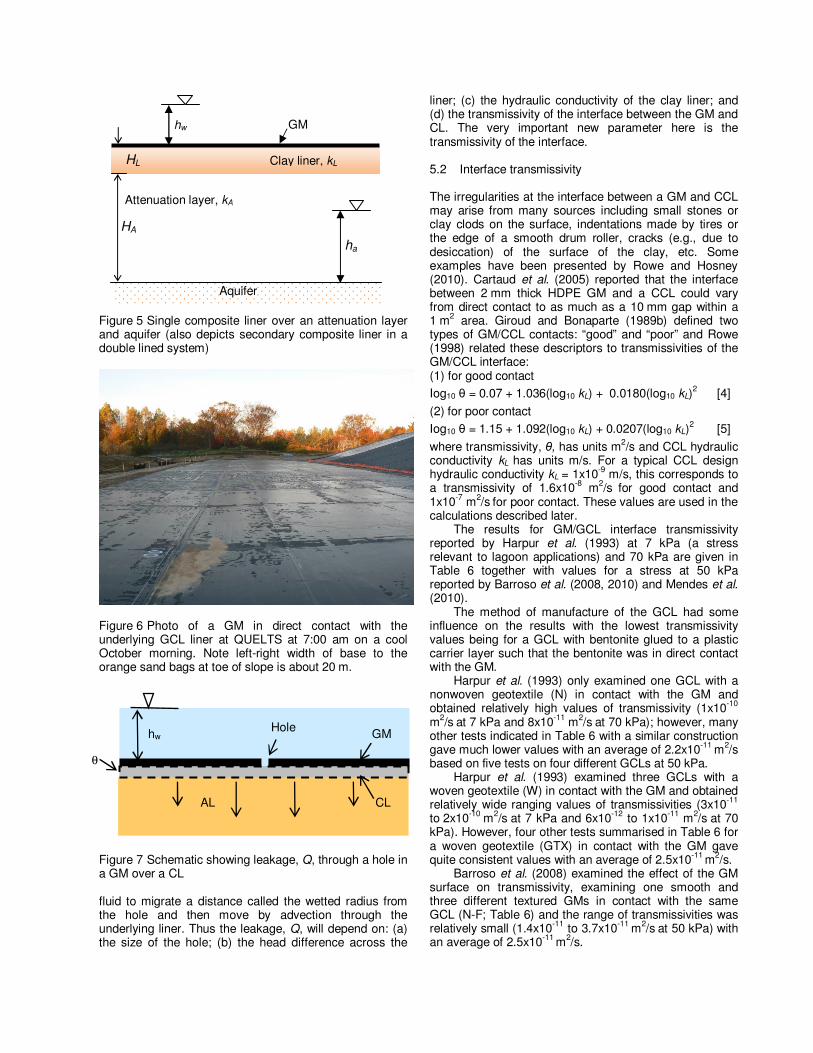
Figure 5 Single composite liner over an attenuation layer and aquifer (also depicts secondary composite liner in a double lined system)
Figure 6 Photo of a GM in direct contact with the underlying GCL liner at QUELTS at 7:00 am on a cool October morning. Note left-right width of base to the orange sand bags at toe of slope is about 20 m. Figure 7 Schematic showing leakage, Q, through a hole in a GM over a CL fluid to migrate a distance called the wetted radius from the hole and then move by advection through the underlying liner. Thus the leakage, Q, will depend on: (a) the size of the hole; (b) the head difference across the
liner; (c) the hydraulic conductivity of the clay liner; and (d) the transmissivity of the interface between the GM and CL. The very important new parameter here is the transmissivity of the interface. 5.2 Interface transmissivity The irregularities at the interface between a GM and CCL may arise from many sources including small stones or clay clods on the surface, indentations made by tires or the edge of a smooth drum roller, cracks (e.g., due to desiccation) of the surface of the clay, etc. Some examples have been presented by Rowe and Hosney (2010). Cartaud et al. (2005) reported that the interface between 2 mm thick HDPE GM and a CCL could vary from direct contact to as much as a 10 mm gap within a 1 m2 area. Giroud and Bonaparte (1989b) defined two types of GM/CCL contacts: “good” and “poor” and Rowe (1998) related these descriptors to transmissivities of the GM/CCL interface: (1) for good contact
Iog10 θ = 0.07 + 1.036(log10 kL) + 0.0180(log10 kL)2 [4]
(2) for poor contact
Iog10 θ = 1.15 + 1.092(log10 kL) + 0.0207(log10 kL)2 [5]
where transmissivity, θ, has units m2/s and CCL hydraulic conductivity kL has units m/s. For a typical CCL design hydraulic conductivity kL = 1x10⁻⁹ m/s, this corresponds to a transmissivity of 1.6x10⁻⁸ m2/s for good contact and 1x10⁻⁷ m2/s for poor contact. These values are used in the calculations described later.
The results for GM/GCL interface transmissivity reported by Harpur et al. (1993) at 7 kPa (a stress relevant to lagoon applications) and 70 kPa are given in Table 6 together with values for a stress at 50 kPa reported by Barroso et al. (2008, 2010) and Mendes et al. (2010).
The method of manufacture of the GCL had some influence on the results with the lowest transmissivity values being for a GCL with bentonite glued to a plastic carrier layer such that the bentonite was in direct contact with the GM.
Harpur et al. (1993) only examined one GCL with a nonwoven geotextile (N) in contact with the GM and obtained relatively high values of transmissivity (1x10⁻¹⁰
m2/s at 7 kPa and 8x10-11 m2/s at 70 kPa); however, many other tests indicated in Table 6 with a similar construction gave much lower values with an average of 2.2x10⁻¹¹ m2/s based on five tests on four different GCLs at 50 kPa.
Harpur et al. (1993) examined three GCLs with a woven geotextile (W) in contact with the GM and obtained relatively wide ranging values of transmissivities (3x10-11
to 2x10⁻¹⁰ m2/s at 7 kPa and 6x10-12 to 1x10-11 m2/s at 70 kPa). However, four other tests summarised in Table 6 for a woven geotextile (GTX) in contact with the GM gave quite consistent values with an average of 2.5x10⁻¹¹ m2/s.
Barroso et al. (2008) examined the effect of the GM surface on transmissivity, examining one smooth and three different textured GMs in contact with the same GCL (N-F; Table 6) and the range of transmissivities was relatively small (1.4x10⁻¹¹ to 3.7x10⁻¹¹ m2/s at 50 kPa) with an average of 2.5x10⁻¹¹ m2/s.
hw
Aquifer
HA
Clay liner, kL
Attenuation layer, kA
ha
HL
GM
hw Hole
θ
GM
CL AL
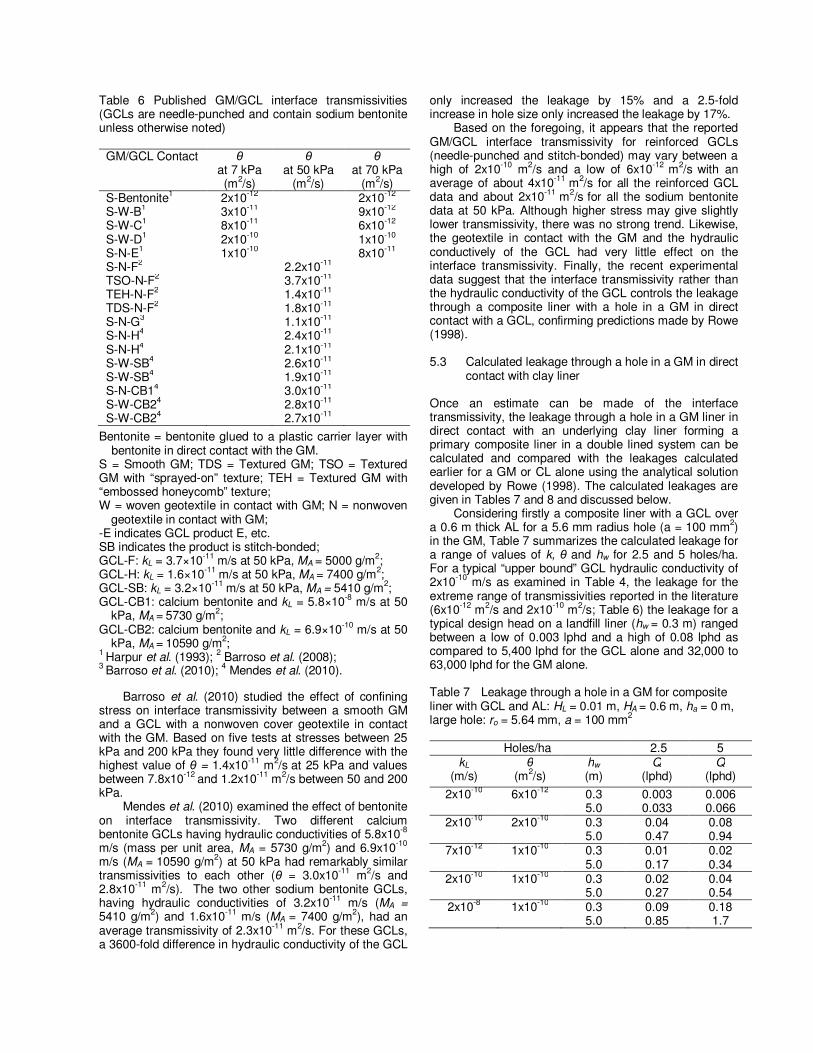
Table 6 Published GM/GCL interface transmissivities (GCLs are needle-punched and contain sodium bentonite unless otherwise noted)
GM/GCL Contact θ at 7 kPa (m2/s)
θ at 50 kPa
(m2/s)
θ at 70 kPa
(m2/s) S-Bentonite1 2x10-12 2x10-12 S-W-B1 3x10-11 9x10-12 S-W-C1 8x10-11 6x10-12 S-W-D1 2x10⁻¹⁰ 1x10⁻¹⁰ S-N-E1 1x10⁻¹⁰ 8x10-11 S-N-F2 2.2x10⁻¹¹ TSO-N-F2 3.7x10⁻¹¹ TEH-N-F2 1.4x10⁻¹¹ TDS-N-F2 1.8x10⁻¹¹ S-N-G3 1.1x10⁻¹¹ S-N-H4 2.4x10⁻¹¹ S-N-H4 2.1x10⁻¹¹ S-W-SB4 2.6x10⁻¹¹ S-W-SB4 1.9x10⁻¹¹ S-N-CB14 3.0x10⁻¹¹ S-W-CB24 2.8x10⁻¹¹ S-W-CB24 2.7x10⁻¹¹
Bentonite = bentonite glued to a plastic carrier layer with bentonite in direct contact with the GM.
S = Smooth GM; TDS = Textured GM; TSO = Textured GM with “sprayed-on” texture; TEH = Textured GM with “embossed honeycomb” texture; W = woven geotextile in contact with GM; N = nonwoven
geotextile in contact with GM; -E indicates GCL product E, etc. SB indicates the product is stitch-bonded; GCL-F: kL = 3.7×10⁻¹¹ m/s at 50 kPa, MA = 5000 g/m2; GCL-H: kL = 1.6×10⁻¹¹ m/s at 50 kPa, MA = 7400 g/m2; GCL-SB: kL = 3.2×10⁻¹¹ m/s at 50 kPa, MA = 5410 g/m2; GCL-CB1: calcium bentonite and kL = 5.8×10⁻⁸ m/s at 50
kPa, MA = 5730 g/m2; GCL-CB2: calcium bentonite and kL = 6.9×10⁻¹⁰ m/s at 50
kPa, MA = 10590 g/m2; 1 Harpur et al. (1993); 2 Barroso et al. (2008); 3 Barroso et al. (2010); 4 Mendes et al. (2010).
Barroso et al. (2010) studied the effect of confining stress on interface transmissivity between a smooth GM and a GCL with a nonwoven cover geotextile in contact with the GM. Based on five tests at stresses between 25 kPa and 200 kPa they found very little difference with the highest value of θ = 1.4x10⁻¹¹ m2/s at 25 kPa and values between 7.8x10⁻¹² and 1.2x10⁻¹¹ m2/s between 50 and 200 kPa.
Mendes et al. (2010) examined the effect of bentonite on interface transmissivity. Two different calcium bentonite GCLs having hydraulic conductivities of 5.8x10⁻⁸ m/s (mass per unit area, MA = 5730 g/m2) and 6.9x10⁻¹⁰ m/s (MA = 10590 g/m2) at 50 kPa had remarkably similar transmissivities to each other (θ = 3.0x10⁻¹¹ m2/s and 2.8x10⁻¹¹ m2/s). The two other sodium bentonite GCLs, having hydraulic conductivities of 3.2x10⁻¹¹ m/s (MA = 5410 g/m2) and 1.6x10⁻¹¹ m/s (MA = 7400 g/m2), had an average transmissivity of 2.3x10⁻¹¹ m2/s. For these GCLs, a 3600-fold difference in hydraulic conductivity of the GCL
only increased the leakage by 15% and a 2.5-fold increase in hole size only increased the leakage by 17%.
Based on the foregoing, it appears that the reported GM/GCL interface transmissivity for reinforced GCLs (needle-punched and stitch-bonded) may vary between a high of 2x10⁻¹⁰ m2/s and a low of 6x10-12 m2/s with an average of about 4x10-11 m2/s for all the reinforced GCL data and about 2x10-11 m2/s for all the sodium bentonite data at 50 kPa. Although higher stress may give slightly lower transmissivity, there was no strong trend. Likewise, the geotextile in contact with the GM and the hydraulic conductively of the GCL had very little effect on the interface transmissivity. Finally, the recent experimental data suggest that the interface transmissivity rather than the hydraulic conductivity of the GCL controls the leakage through a composite liner with a hole in a GM in direct contact with a GCL, confirming predictions made by Rowe (1998). 5.3 Calculated leakage through a hole in a GM in direct
contact with clay liner Once an estimate can be made of the interface transmissivity, the leakage through a hole in a GM liner in direct contact with an underlying clay liner forming a primary composite liner in a double lined system can be calculated and compared with the leakages calculated earlier for a GM or CL alone using the analytical solution developed by Rowe (1998). The calculated leakages are given in Tables 7 and 8 and discussed below.
Considering firstly a composite liner with a GCL over a 0.6 m thick AL for a 5.6 mm radius hole (a = 100 mm2) in the GM, Table 7 summarizes the calculated leakage for a range of values of k, θ and hw for 2.5 and 5 holes/ha. For a typical “upper bound” GCL hydraulic conductivity of 2x10⁻¹⁰ m/s as examined in Table 4, the leakage for the extreme range of transmissivities reported in the literature (6x10-12 m2/s and 2x10⁻¹⁰ m2/s; Table 6) the leakage for a typical design head on a landfill liner (hw = 0.3 m) ranged between a low of 0.003 lphd and a high of 0.08 lphd as compared to 5,400 lphd for the GCL alone and 32,000 to 63,000 lphd for the GM alone. Table 7 Leakage through a hole in a GM for composite liner with GCL and AL: HL = 0.01 m, HA = 0.6 m, ha = 0 m, large hole: ro = 5.64 mm, a = 100 mm2
Holes/ha 2.5 5 kL
(m/s) θ
(m2/s) hw (m)
Q (lphd)
Q (lphd)
2x10⁻¹⁰ 6x10-12 0.3 0.003 0.006 5.0 0.033 0.066
2x10⁻¹⁰ 2x10⁻¹⁰ 0.3 0.04 0.08 5.0 0.47 0.94
7x10-12 1x10⁻¹⁰ 0.3 0.01 0.02 5.0 0.17 0.34
2x10⁻¹⁰ 1x10⁻¹⁰ 0.3 0.02 0.04 5.0 0.27 0.54
2x10⁻⁸ 1x10⁻¹⁰ 0.3 0.09 0.18 5.0 0.85 1.7
Table 8 Leakage through a hole in a GM for composite liner with CCL: HL = 0.6 m, ha = 0 m, kL = 1x10⁻⁹ m/s, good contact: θ = 1.6 x10⁻⁸ m2/s
Hole Radius Area
Small Large 1 mm 5.64 mm
3.14 mm2 100 mm2 Holes/ha 2.5 5 2.5 5
hw Q Q Q Q (m) (lphd) (lphd) (lphd) (lphd) 0.3 1.0 2.0 1.3 2.6 5.0 14 26 18 36
Similarly, considering a pond application (hw = 5 m), the leakage ranged between a low of 0.03 lphd and a high of 0.9 lphd as compared to 87,000 lphd for the GCL alone and 130,000 to 260,000 lphd for the GM alone. Even compared with the most optimistic value of kL = 7x10-12 m/s for the GCL but poor interface transmissivity (1x10⁻¹⁰ m2/s) for the composite liner, the calculated leakage (for 5 holes/ha) of 0.02 lphd for hw = 0.3 m and 0.3 lphd for hw = 5 m are very small compared to about 190 lphd and 3,000 lphd for a GCL alone (Table 5). This demonstrates the potentially vast reduction in leakage that can be obtained with a composite liner involving a GCL compared with either a GCL or GM alone in the base liner of a landfill or leachate lagoon.
The results in Table 7 also show that for a given value of kL = 2x10⁻¹⁰ m/s, a 30-fold increase in θ (6x10-12 to 2x10⁻¹⁰ m2/s) increased leakage by a factor of about 14 while for a given value of θ = 1x10⁻¹⁰ m2/s, an almost 3000-fold increase in kL only increased leakage by a factor of about 5. Thus for a composite liner where the GM is in direct contact with the GCL, it is the interface transmissivity rather than the hydraulic conductivity of the GCL that controls leakage.
Considering, secondly, a composite liner with a CCL and a hole in the GM, Table 8 summarizes the calculated leakage for a typical design kL = 1x10⁻⁹ m/s, good contact conditions and hw of 0.3 m and 5 m for both 2.5 and 5 holes/ha. For a landfill bottom liner with hw = 0.3 m the leakage for a CCL alone (Table 3) was 1,300 lphd and for a GM alone with 5 holes/ha was 2,000 lphd and 63,000 lphd for a small (ro = 1 mm) and large (ro = 5.64 mm) hole respectively (Table 2). In comparison, for a composite liner with a similar CCL, the calculated leakage was only 2 and 2.6 lphd for a small and large hole respectively (Table 8).
For a leachate lagoon liner with hw = 5 m, the leakage for a CCL alone (Table 3) was 8,000 lphd and for a GM alone with 5 holes/ha was 8,000 lphd and 260,000 lphd for a small and large hole respectively (Table 2). In comparison, for a composite liner with a similar CCL, the calculated leakage was only 26 and 36 lphd for a small and large hole respectively (Table 8).
Thus, as was found with a GCL, it is also evident that with a CCL the performance of a composite liner is substantially better than a CCL or GM liner used alone.
5.4 Comparison between leakage observed and
calculated through composite liners where the GM is in direct contact with clay liner
The calculations for a composite liner with a GM in direct contact with a CL presented in the previous section suggest that composite liners are remarkably good—but the question remains as to how well do these calculations compare with reality? Considering primary composite liners in a double lined landfill system (Figure 4) where there is a leak detection system, the leakage can be calculated for different conditions and compared with what has actually been observed in well-documented landfills. Table 9 presents one such comparison; Rowe (2005) presents others.
For a composite liner with a 0.9 m thick CCL, calculations are presented for 5 holes/ha (ro = 5.64 mm) for excellent conditions (kL = 1x10⁻¹⁰ m/s and good contact with θ = 1.6x10⁻⁸ m2/s) and marginal conditions (kL = 1x10-
9 m/s and poor contact with θ = 1x10⁻⁷ m2/s), together with the range of observed average monthly flows and the peak flow for a number of similar liners (Table 9). Even the worst case calculation is well below the lowest average monthly flow for the actual landfills considered and an order of magnitude below the peak flow.
For a composite liner with a GCL, the calculated leakage for good conditions (kL = 5x10-11 m/s; θ = 2x10-12 m2/s) and poor conditions (kL = 2x10⁻¹⁰ m/s; θ = 2x10⁻¹⁰ m2/s) are consistent with the low end of the range but two to four orders of magnitude below the upper end of the range and three to four orders of magnitude below the peak flows (Table 9).
The results presented here further illustrate the point made by Rowe (2005) that calculations of leakage for composite liners assuming direct contact between the GM and the CL significantly (i.e., by one or more orders of magnitude) underestimate the actual leakage in typical North American landfills. Rowe (2005) postulated that the reason for the discrepancy was that GMs in North American landfills are not generally in direct contact with Table 9 Comparison between observed and calculated leakage (direct contact solution) during the active period for 0.9 m thick CCL and 0.01 m thick GCL in a primary liner over a geonet leak detection system
Liner kL
(m/s)
θ
(m2/s)
Calcu-
lated1
Observed2
(lphd)
Range3 Peak4
CCL 1x10⁻¹⁰ 1.6x10⁻⁸ 6 60-1605 3905
CCL 1x10⁻⁹ 1x10⁻⁷ 40
GCL 5x10-11 2x10-12 0.001 0-11 54
GCL 2x10⁻¹⁰ 2x10⁻¹⁰ 0.06 1 Hole ro = 5.6 mm; hw = 0.3 m, ha = 0 m; HA = 0 m, 5
holes/ha; calculations rounded to one significant figure; 2 Bonaparte et al. (2002); 3 Weighted average flow based on data from Bonaparte et
al. (2002); 4 Maximum peak flow; 5 Specifically for 0.9 m CCL in Table 4 of Rowe (2005).
Note that leakages up to almost 2,000 lphd have been reported for other composite liners with a CCL.
the CL (i.e., at the time covered they do NOT look like the GM in Figure 6) but rather that there are wrinkles which, if coincident with a hole, would substantially increase leakage. Rowe (2005) showed theoretically that the Rowe (1998) equation for leakage through wrinkles could explain the observed leakage, but at that time there was very little data available to confirm the length of connected wrinkles that were required to explain the observed leakage; as indicated below, that data is now available. 5.5 Wrinkles in HDPE geomembranes Although it has long been recognised that HDPE GMs experience significant thermal expansion and consequent wrinkling (waves) upon heating (e.g., Giroud and Peggs 1990; Giroud and Morel 1992; Pelte et al. 1994; Giroud 1995; Koerner et al. 1999; Touze-Foltz et al. 2001), there was a paucity of data regarding actual wrinkle dimensions on a scale larger than 40 m x 40 m that could be used to quantify leakage for realistic wrinkle geometries.
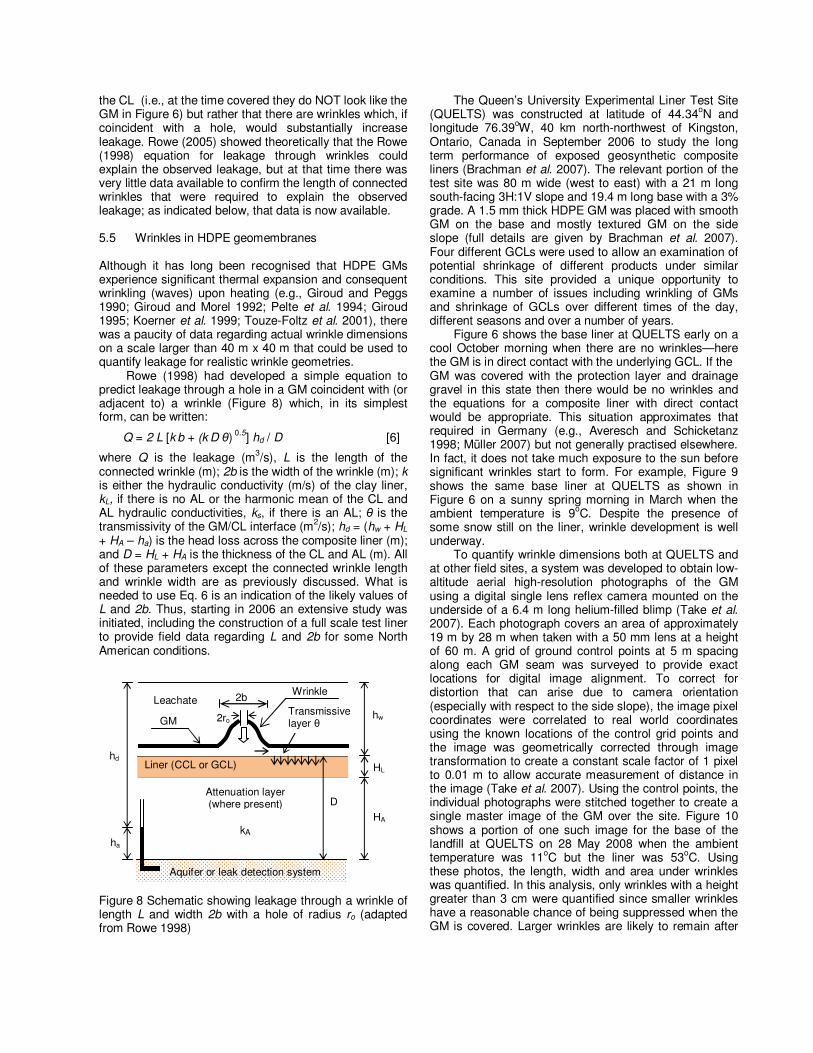
Rowe (1998) had developed a simple equation to predict leakage through a hole in a GM coincident with (or adjacent to) a wrinkle (Figure 8) which, in its simplest form, can be written:
Q = 2 L [k b + (k D θ) 0.5] hd / D [6]
where Q is the leakage (m3/s), L is the length of the connected wrinkle (m); 2b is the width of the wrinkle (m); k is either the hydraulic conductivity (m/s) of the clay liner, kL, if there is no AL or the harmonic mean of the CL and AL hydraulic conductivities, ks, if there is an AL; θ is the transmissivity of the GM/CL interface (m2/s); hd = (hw + HL + HA – ha) is the head loss across the composite liner (m); and D = HL + HA is the thickness of the CL and AL (m). All of these parameters except the connected wrinkle length and wrinkle width are as previously discussed. What is needed to use Eq. 6 is an indication of the likely values of L and 2b. Thus, starting in 2006 an extensive study was initiated, including the construction of a full scale test liner to provide field data regarding L and 2b for some North American conditions.
Figure 8 Schematic showing leakage through a wrinkle of length L and width 2b with a hole of radius ro (adapted from Rowe 1998)
The Queen’s University Experimental Liner Test Site (QUELTS) was constructed at latitude of 44.34oN and longitude 76.39oW, 40 km north-northwest of Kingston, Ontario, Canada in September 2006 to study the long term performance of exposed geosynthetic composite liners (Brachman et al. 2007). The relevant portion of the test site was 80 m wide (west to east) with a 21 m long south-facing 3H:1V slope and 19.4 m long base with a 3% grade. A 1.5 mm thick HDPE GM was placed with smooth GM on the base and mostly textured GM on the side slope (full details are given by Brachman et al. 2007). Four different GCLs were used to allow an examination of potential shrinkage of different products under similar conditions. This site provided a unique opportunity to examine a number of issues including wrinkling of GMs and shrinkage of GCLs over different times of the day, different seasons and over a number of years.
Figure 6 shows the base liner at QUELTS early on a cool October morning when there are no wrinkles—here the GM is in direct contact with the underlying GCL. If the GM was covered with the protection layer and drainage gravel in this state then there would be no wrinkles and the equations for a composite liner with direct contact would be appropriate. This situation approximates that required in Germany (e.g., Averesch and Schicketanz 1998; Müller 2007) but not generally practised elsewhere. In fact, it does not take much exposure to the sun before significant wrinkles start to form. For example, Figure 9 shows the same base liner at QUELTS as shown in Figure 6 on a sunny spring morning in March when the ambient temperature is 9oC. Despite the presence of some snow still on the liner, wrinkle development is well underway.
To quantify wrinkle dimensions both at QUELTS and at other field sites, a system was developed to obtain low-altitude aerial high-resolution photographs of the GM using a digital single lens reflex camera mounted on the underside of a 6.4 m long helium-filled blimp (Take et al. 2007). Each photograph covers an area of approximately 19 m by 28 m when taken with a 50 mm lens at a height of 60 m. A grid of ground control points at 5 m spacing along each GM seam was surveyed to provide exact locations for digital image alignment. To correct for distortion that can arise due to camera orientation (especially with respect to the side slope), the image pixel coordinates were correlated to real world coordinates using the known locations of the control grid points and the image was geometrically corrected through image transformation to create a constant scale factor of 1 pixel to 0.01 m to allow accurate measurement of distance in the image (Take et al. 2007). Using the control points, the individual photographs were stitched together to create a single master image of the GM over the site. Figure 10 shows a portion of one such image for the base of the landfill at QUELTS on 28 May 2008 when the ambient temperature was 11oC but the liner was 53oC. Using these photos, the length, width and area under wrinkles was quantified. In this analysis, only wrinkles with a height greater than 3 cm were quantified since smaller wrinkles have a reasonable chance of being suppressed when the GM is covered. Larger wrinkles are likely to remain after
k = 1x10⁻⁷ m/s kA
Aquifer or leak detection system
D
2ro hw
Attenuation layer (where present)
Liner (CCL or GCL)
Leachate
HL
HA
ha
2b
GM
hd
Wrinkle Wrinkle
Transmissive layer θ
covering (Stone 1984; Soong and Koerner 1998; Gudina and Brachman 2006; Brachman and Gudina 2008).
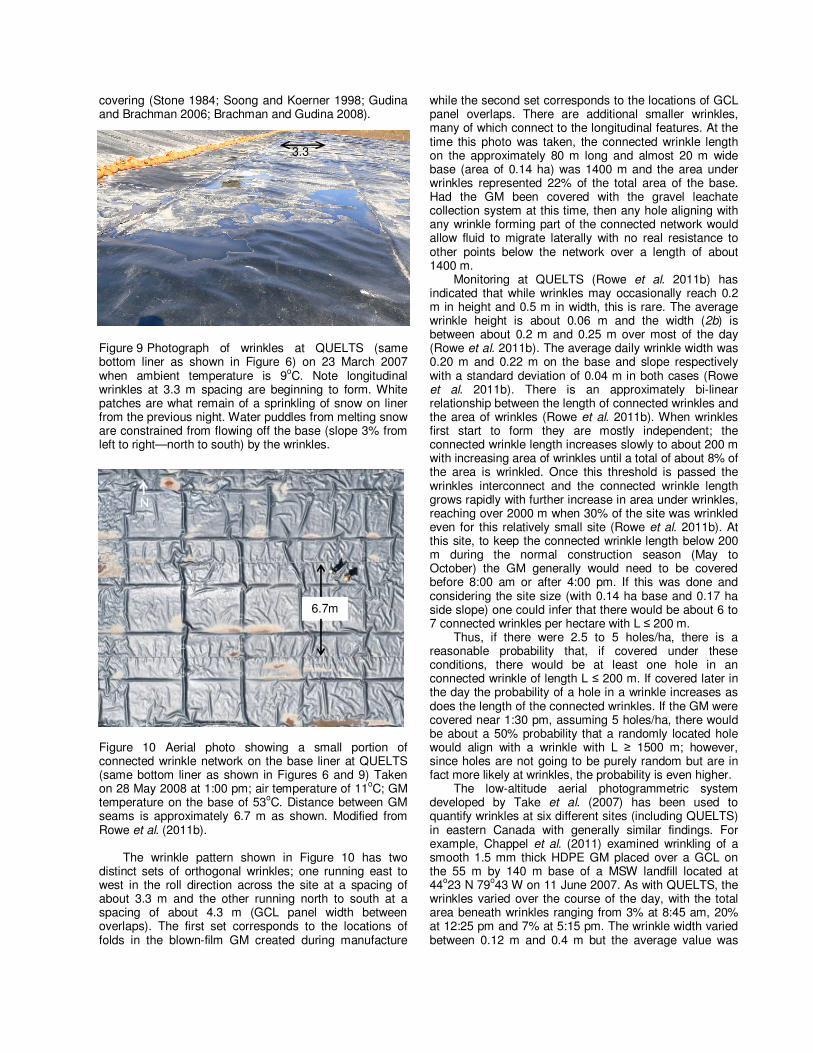
Figure 9 Photograph of wrinkles at QUELTS (same bottom liner as shown in Figure 6) on 23 March 2007 when ambient temperature is 9oC. Note longitudinal wrinkles at 3.3 m spacing are beginning to form. White patches are what remain of a sprinkling of snow on liner from the previous night. Water puddles from melting snow are constrained from flowing off the base (slope 3% from left to right—north to south) by the wrinkles.
Figure 10 Aerial photo showing a small portion of connected wrinkle network on the base liner at QUELTS (same bottom liner as shown in Figures 6 and 9) Taken on 28 May 2008 at 1:00 pm; air temperature of 11oC; GM temperature on the base of 53oC. Distance between GM seams is approximately 6.7 m as shown. Modified from Rowe et al. (2011b).
The wrinkle pattern shown in Figure 10 has two distinct sets of orthogonal wrinkles; one running east to west in the roll direction across the site at a spacing of about 3.3 m and the other running north to south at a spacing of about 4.3 m (GCL panel width between overlaps). The first set corresponds to the locations of folds in the blown-film GM created during manufacture
while the second set corresponds to the locations of GCL panel overlaps. There are additional smaller wrinkles, many of which connect to the longitudinal features. At the time this photo was taken, the connected wrinkle length on the approximately 80 m long and almost 20 m wide base (area of 0.14 ha) was 1400 m and the area under wrinkles represented 22% of the total area of the base. Had the GM been covered with the gravel leachate collection system at this time, then any hole aligning with any wrinkle forming part of the connected network would allow fluid to migrate laterally with no real resistance to other points below the network over a length of about 1400 m.
Monitoring at QUELTS (Rowe et al. 2011b) has indicated that while wrinkles may occasionally reach 0.2 m in height and 0.5 m in width, this is rare. The average wrinkle height is about 0.06 m and the width (2b) is between about 0.2 m and 0.25 m over most of the day (Rowe et al. 2011b). The average daily wrinkle width was 0.20 m and 0.22 m on the base and slope respectively with a standard deviation of 0.04 m in both cases (Rowe et al. 2011b). There is an approximately bi-linear relationship between the length of connected wrinkles and the area of wrinkles (Rowe et al. 2011b). When wrinkles first start to form they are mostly independent; the connected wrinkle length increases slowly to about 200 m with increasing area of wrinkles until a total of about 8% of the area is wrinkled. Once this threshold is passed the wrinkles interconnect and the connected wrinkle length grows rapidly with further increase in area under wrinkles, reaching over 2000 m when 30% of the site was wrinkled even for this relatively small site (Rowe et al. 2011b). At this site, to keep the connected wrinkle length below 200 m during the normal construction season (May to October) the GM generally would need to be covered before 8:00 am or after 4:00 pm. If this was done and considering the site size (with 0.14 ha base and 0.17 ha side slope) one could infer that there would be about 6 to 7 connected wrinkles per hectare with L ≤ 200 m.
Thus, if there were 2.5 to 5 holes/ha, there is a reasonable probability that, if covered under these conditions, there would be at least one hole in an connected wrinkle of length L ≤ 200 m. If covered later in the day the probability of a hole in a wrinkle increases as does the length of the connected wrinkles. If the GM were covered near 1:30 pm, assuming 5 holes/ha, there would be about a 50% probability that a randomly located hole would align with a wrinkle with L ≥ 1500 m; however, since holes are not going to be purely random but are in fact more likely at wrinkles, the probability is even higher.
The low-altitude aerial photogrammetric system developed by Take et al. (2007) has been used to quantify wrinkles at six different sites (including QUELTS) in eastern Canada with generally similar findings. For example, Chappel et al. (2011) examined wrinkling of a smooth 1.5 mm thick HDPE GM placed over a GCL on the 55 m by 140 m base of a MSW landfill located at 44o23 N 79o43 W on 11 June 2007. As with QUELTS, the wrinkles varied over the course of the day, with the total area beneath wrinkles ranging from 3% at 8:45 am, 20% at 12:25 pm and 7% at 5:15 pm. The wrinkle width varied between 0.12 m and 0.4 m but the average value was
6.7m
N
3.3
quite consistent throughout the day ranging between 0.22 m and 0.24 m with an overall daily average of 0.23 m. The connected wrinkle length increased from 30 m at 8:45 am to 2500 m at 1:45 pm. The base of this landfill was effectively divided into four approximately equal sub-areas about 55 m x 25 m (~ 0.2 ha) by sandbags at about 3 m spacing. This generally isolated the sub-areas with respect to wrinkles and hence limited the length of connected wrinkle. The longest wrinkle (L = 2500 m) actually broke through between two sub-areas where a sand bag was missing. Had the sand bag been present the longest connected wrinkle would have been about 1550 m. This demonstrates that unless the lateral extent of wrinkling is constrained, the presence of linear wrinkle features along (and across) rolls related to linear geometric imperfections (e.g., folds in blown-film extruded GM, seams in flat dye extruded GMs, GCL overlaps, track marks on CCLs, etc.) that typically develop, the likely connected wrinkle length will increase with the size of the unrestrained area (other things being equal).
Chappel et al. (2008) examined a 140 m wide by 65 m long 3H:1V slope covered with a 1.5 mm thick textured GM in July 2006. The maximum ambient temperature during monitoring was 28°C. A statistical analysis of the wrinkle network on the slope indicated that 92% of wrinkles had a width of between 0.1 and 0.3 m with an average wrinkle width of 0.21 m (standard deviation = 0.06 m).
In summary, based on the presently available data, it can be concluded that although wrinkles may reach heights of 0.2 m or more and widths up to 0.5 m on occasion, a detailed analysis of a very large number of wrinkles at a number of sites at different times of day and year indicate that for 1.5 mm thick (smooth or textured) HDPE GM, at least during the typical eastern Canadian construction season, wrinkles were typically about 0.06 m high and about (2b =) 0.2 m to 0.25 m wide. The typical width did not change significantly over most of the day. The length of connected length varied substantially with time of day and to some extent with the size of the unconstrained area. If the GM were covered with the leachate collection layer before 8:00 am in the morning or after about 4:00 pm in the afternoon, then there would have been about 6 to 7 connected wrinkles per hectare with L ≤ 200 m. This length would increase with the time of day the GM was covered, typically peaking at around 1:00 pm, until the connected length was about 2000 m for areas unrestrained up to about 0.2 ha (and larger for larger unrestrained areas).
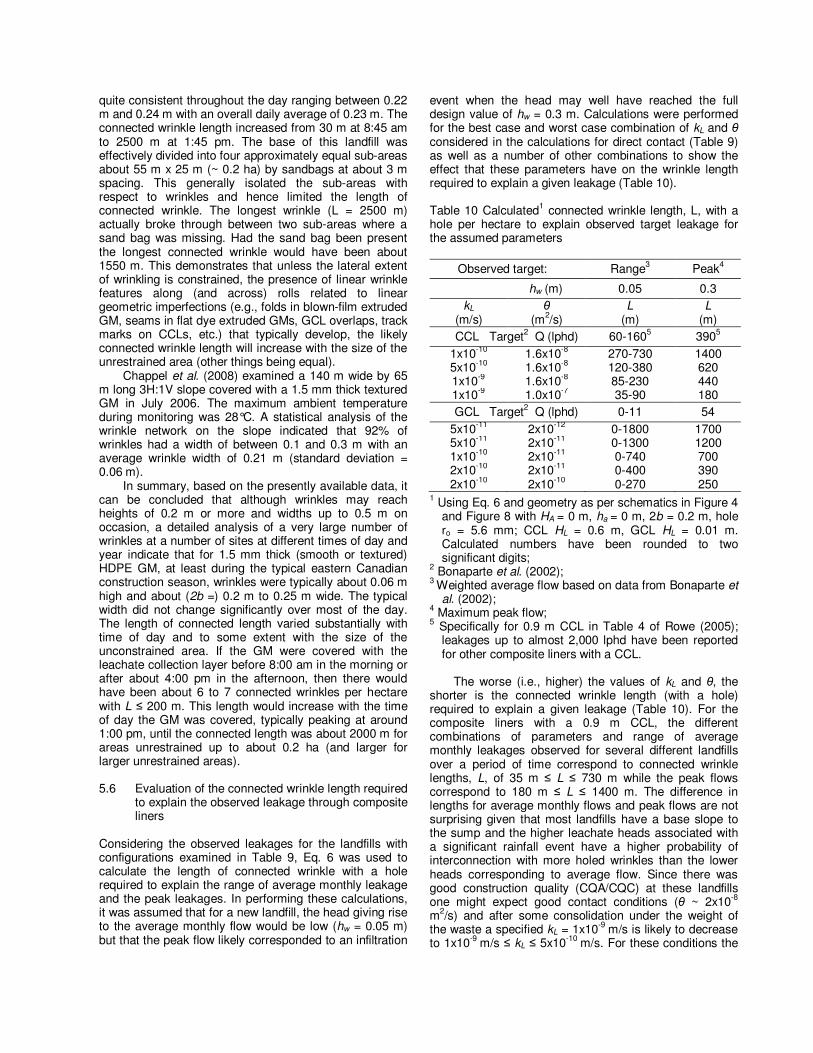
5.6 Evaluation of the connected wrinkle length required
to explain the observed leakage through composite liners
Considering the observed leakages for the landfills with configurations examined in Table 9, Eq. 6 was used to calculate the length of connected wrinkle with a hole required to explain the range of average monthly leakage and the peak leakages. In performing these calculations, it was assumed that for a new landfill, the head giving rise to the average monthly flow would be low (hw = 0.05 m) but that the peak flow likely corresponded to an infiltration
event when the head may well have reached the full design value of hw = 0.3 m. Calculations were performed for the best case and worst case combination of kL and θ considered in the calculations for direct contact (Table 9) as well as a number of other combinations to show the effect that these parameters have on the wrinkle length required to explain a given leakage (Table 10).
Table 10 Calculated1 connected wrinkle length, L, with a hole per hectare to explain observed target leakage for the assumed parameters
Observed target: Range3 Peak4
hw (m) 0.05 0.3 kL
(m/s) θ
(m2/s) L
(m) L
(m) CCL Target2 Q (lphd) 60-1605 3905
1x10⁻¹⁰ 1.6x10⁻⁸ 270-730 1400 5x10⁻¹⁰ 1.6x10⁻⁸ 120-380 620 1x10⁻⁹ 1.6x10⁻⁸ 85-230 440 1x10⁻⁹ 1.0x10⁻⁷ 35-90 180 GCL Target2 Q (lphd) 0-11 54
5x10-11 2x10-12 0-1800 1700 5x10-11 2x10-11 0-1300 1200 1x10⁻¹⁰ 2x10-11 0-740 700 2x10⁻¹⁰ 2x10-11 0-400 390 2x10⁻¹⁰ 2x10⁻¹⁰ 0-270 250
1 Using Eq. 6 and geometry as per schematics in Figure 4 and Figure 8 with HA = 0 m, ha = 0 m, 2b = 0.2 m, hole ro = 5.6 mm; CCL HL = 0.6 m, GCL HL = 0.01 m. Calculated numbers have been rounded to two significant digits;
2 Bonaparte et al. (2002); 3 Weighted average flow based on data from Bonaparte et
al. (2002); 4 Maximum peak flow; 5 Specifically for 0.9 m CCL in Table 4 of Rowe (2005);
leakages up to almost 2,000 lphd have been reported for other composite liners with a CCL.
The worse (i.e., higher) the values of kL and θ, the
shorter is the connected wrinkle length (with a hole) required to explain a given leakage (Table 10). For the composite liners with a 0.9 m CCL, the different combinations of parameters and range of average monthly leakages observed for several different landfills over a period of time correspond to connected wrinkle lengths, L, of 35 m ≤ L ≤ 730 m while the peak flows correspond to 180 m ≤ L ≤ 1400 m. The difference in lengths for average monthly flows and peak flows are not surprising given that most landfills have a base slope to the sump and the higher leachate heads associated with a significant rainfall event have a higher probability of interconnection with more holed wrinkles than the lower heads corresponding to average flow. Since there was good construction quality (CQA/CQC) at these landfills one might expect good contact conditions (θ ~ 2x10⁻⁸ m2/s) and after some consolidation under the weight of the waste a specified kL = 1x10⁻⁹ m/s is likely to decrease to 1x10⁻⁹ m/s ≤ kL ≤ 5x10⁻¹⁰ m/s. For these conditions the
connected wrinkle lengths required to explain average monthly flows are 85 m ≤ L ≤ 380 m while the peak flows correspond to 440 m ≤ L ≤ 620 m.
For composite liners with a GCL, the lowest monthly leakages were very small and suggest little or no role for wrinkles, however, leakage for the upper end of the range of average monthly flows corresponds to the connected wrinkle lengths of 270 m ≤ L ≤ 1800 m while the peak flows correspond to 250 m ≤ L ≤ 1700 m. Assuming an average transmissivity for sodium bentonite at 50 kPa (based on data in Table 6) of θ = 2x10-11 m2/s and 2x10⁻¹⁰
m/s ≤ kL ≤ 5x10-11 m/s, the wrinkle lengths required to explain the peak average monthly flows are 400 m ≤ L ≤ 1300 m while the peak flows correspond to 390 m ≤ L ≤ 1200 m with the most likely range (allowing for some interaction between the GCL and leachate in the low stress zone below the wrinkle so that 2x10⁻¹⁰ m/s ≤ kL ≤ 1x10⁻¹⁰ m/s) being about 400 m to 700 m for both peak average monthly and peak leakages.
While care is needed not to over-interpret these results, it would appear that at low heads, connected wrinkle lengths (with a hole) of 85 m ≤ L ≤ 700 m and at higher heads 400 m ≤ L ≤ 700 m most likely explain the observed leakages. These lengths are consistent with what one would expect based on the field studies reported in the previous section if the GM was covered when the area of base with wrinkles was between about 3% and 15%. For the climatic conditions of southern Ontario (Rowe et al. 2011b) this would correspond to generally covering before about 10:00 am or after about 2:30 pm (i.e., not when wrinkling is most extensive, around the middle of the day). This is also consistent with the findings that wrinkles with height greater than about 3 cm are likely to remain after loading due to placing of the waste (Stone 1984; Soong and Koerner 1998; Gudina and Brachman 2006; Brachman and Gudina 2008).
Considering the foregoing and the findings of the previous section and assuming good CQA/CQC, it can be tentatively concluded that if care is taken not to cover the GM with the leachate collection layer during a period of massive wrinkling (i.e., when more than 15% of the area is wrinkled), that for landfill design purposes, one could assume one holed wrinkle per hectare with an connected wrinkle length L = 700 m. If additional care is taken to limit the area of wrinkles to less than about 10%, for design purposes one could assume one holed wrinkle per hectare with an connected wrinkle length L = 200 m. For 5% wrinkled area the corresponding length is L = 150 m and for 3% wrinkled area, L = 100 m (at this point the linear wrinkles tend to dominate). When wrinkles are eliminated (e.g., Figure 6), the direct contact solutions become applicable. 5.7 Calculated leakage for composite liners with
wrinkles To provide insight regarding the magnitude of leakage that might be expected in landfill liners (design head hw = 0.3 m) for a number of composite liner configurations, leakage was calculated for connected wrinkles (with a hole) of lengths 100, 200 and 700 m (based on the discussion in the previous section). As indicated in the
discussion of interface transmissivity, leakage does not appear to be affected by a change from sodium to calcium bentonite and hence may not be significantly affected by interaction with leachate; thus θ was kept constant for a given CL.
For composite primary liners (Figure 4 but with a wrinkle) in a double liner system with a leak detection layer immediately below the liner (ha = 0 m), the calculated leakage is given in Table 11.
For typical CCL design kL = 1x10⁻⁹ m/s in good contact with the GM, the calculated leakage is less than 100 lphd if the connected wrinkle length is less than about 120 m but becomes reasonably large once the connected wrinkle length approaches 200 m (e.g., if about 10% of the base is wrinkled). Some consolidation of the liner may be expected to reduce the hydraulic conductivity. Assuming consolidation reduces kL to 5x10⁻¹⁰ m/s there is a reduction in leakage (Table 11) but it is still desirable to keep connected wrinkles to less than 200 m (area of wrinkles ≤ 10%). However, even with a 700 m connected wrinkle, the leakages are: • still less than for a GM alone (Table 2) for five
extremely small (ro = 0.5 mm) holes/ha; • two orders of magnitude smaller than for a GM with
five same sized holes/ha as considered here (a = 100 mm2); and
• almost three times less than for a CCL alone (kL = 1x10⁻⁹ m/s).
For a CCL, the width of the wrinkle is small compared to the thickness of the CCL and most of the leakage occurs due to migration of fluid in the transmissive zone away from the wrinkle. Therefore, the actual width of the wrinkle has relatively little effect on the leakage (the leakage for 2b = 0.2 m is only 1 to 2% more than that for 2b = 0.1 m) for the CCL cases examined in Table 11 and thus the effect of the weight of the waste on consolidation of the CCL can be considered to apply to the entire leaking area with negligible error. However this is not the case for GCLs because:
(a) the thickness of the GCL is much smaller than the wrinkle width and the stress due to the weight of the waste only causes consolidation for the GCL outside the wrinkle that remains after compression due to the waste while the GCL below the wrinkle has very little stress and will be more susceptible to clay-leachate interaction; and
(b) the interface transmissivity is so low that the area under the wrinkle contributes significantly to the leakage, thus the leakage for 2b = 0.2 m is 40 to 60% more than for 2b = 0.1 m for the cases examined in Table 11 and hence the hydraulic conductivity of the GCL below the wrinkle plays a significant role in the leakage.
As indicated in an earlier section, the typical width of a wrinkle at the time of covering is about 0.2 to 0.25 m. Brachman and Gudina (2008) demonstrated that with an applied pressure of 250 kPa this wrinkle width reduces to about half the initial value, and since Table 11 corresponds to landfill applications, a value of 2b = 0.1 m was adopted for the calculation reported in that table.
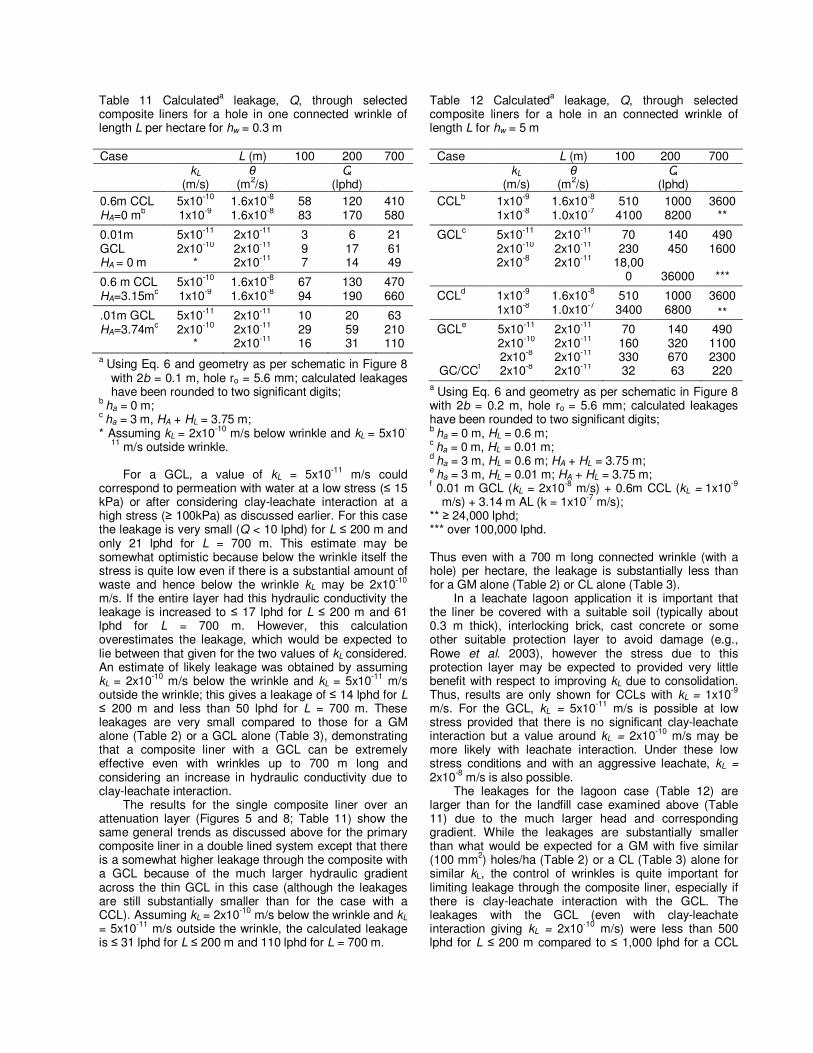
Table 11 Calculateda leakage, Q, through selected composite liners for a hole in one connected wrinkle of length L per hectare for hw = 0.3 m Case L (m) 100 200 700 kL θ Q (m/s) (m2/s) (lphd) 0.6m CCL 5x10⁻¹⁰ 1.6x10⁻⁸ 58 120 410 HA=0 mb 1x10⁻⁹ 1.6x10⁻⁸ 83 170 580
0.01m 5x10-11 2x10-11 3 6 21 GCL 2x10⁻¹⁰ 2x10-11 9 17 61 HA = 0 m * 2x10-11 7 14 49
0.6 m CCL 5x10⁻¹⁰ 1.6x10⁻⁸ 67 130 470 HA=3.15mc 1x10⁻⁹ 1.6x10⁻⁸ 94 190 660
.01m GCL 5x10-11 2x10-11 10 20 63 HA=3.74mc 2x10⁻¹⁰ 2x10-11 29 59 210 * 2x10-11 16 31 110 a Using Eq. 6 and geometry as per schematic in Figure 8
with 2b = 0.1 m, hole ro = 5.6 mm; calculated leakages have been rounded to two significant digits;
b ha = 0 m;
c ha = 3 m, HA + HL = 3.75 m;
* Assuming kL = 2x10⁻¹⁰ m/s below wrinkle and kL = 5x10-
11 m/s outside wrinkle.
For a GCL, a value of kL = 5x10-11 m/s could correspond to permeation with water at a low stress (≤ 15 kPa) or after considering clay-leachate interaction at a high stress (≥ 100kPa) as discussed earlier. For this case the leakage is very small (Q < 10 lphd) for L ≤ 200 m and only 21 lphd for L = 700 m. This estimate may be somewhat optimistic because below the wrinkle itself the stress is quite low even if there is a substantial amount of waste and hence below the wrinkle kL may be 2x10⁻¹⁰ m/s. If the entire layer had this hydraulic conductivity the leakage is increased to ≤ 17 lphd for L ≤ 200 m and 61 lphd for L = 700 m. However, this calculation overestimates the leakage, which would be expected to lie between that given for the two values of kL considered. An estimate of likely leakage was obtained by assuming kL = 2x10⁻¹⁰ m/s below the wrinkle and kL = 5x10-11 m/s outside the wrinkle; this gives a leakage of ≤ 14 lphd for L ≤ 200 m and less than 50 lphd for L = 700 m. These leakages are very small compared to those for a GM alone (Table 2) or a GCL alone (Table 3), demonstrating that a composite liner with a GCL can be extremely effective even with wrinkles up to 700 m long and considering an increase in hydraulic conductivity due to clay-leachate interaction.
The results for the single composite liner over an attenuation layer (Figures 5 and 8; Table 11) show the same general trends as discussed above for the primary composite liner in a double lined system except that there is a somewhat higher leakage through the composite with a GCL because of the much larger hydraulic gradient across the thin GCL in this case (although the leakages are still substantially smaller than for the case with a CCL). Assuming kL = 2x10⁻¹⁰ m/s below the wrinkle and kL
= 5x10-11 m/s outside the wrinkle, the calculated leakage is ≤ 31 lphd for L ≤ 200 m and 110 lphd for L = 700 m.
Table 12 Calculateda leakage, Q, through selected composite liners for a hole in an connected wrinkle of length L for hw = 5 m
Case L (m) 100 200 700 kL θ Q (m/s) (m2/s) (lphd) CCLb 1x10⁻⁹ 1.6x10⁻⁸ 510 1000 3600 1x10⁻⁸ 1.0x10⁻⁷ 4100 8200 **
GCLc 5x10-11 2x10-11 70 140 490 2x10⁻¹⁰ 2x10-11 230 450 1600 2x10⁻⁸ 2x10-11 18,00
0 36000 ***
CCLd 1x10⁻⁹ 1.6x10⁻⁸ 510 1000 3600 1x10⁻⁸ 1.0x10⁻⁷ 3400 6800 ** GCLe 5x10-11 2x10-11 70 140 490 2x10⁻¹⁰ 2x10-11 160 320 1100 2x10⁻⁸ 2x10-11 330 670 2300 GC/CCf 2x10⁻⁸ 2x10-11 32 63 220
a Using Eq. 6 and geometry as per schematic in Figure 8 with 2b = 0.2 m, hole ro = 5.6 mm; calculated leakages have been rounded to two significant digits; b ha = 0 m, HL = 0.6 m;
c ha = 0 m, HL = 0.01 m;
d ha = 3 m, HL = 0.6 m; HA + HL = 3.75 m;
e ha = 3 m, HL = 0.01 m; HA + HL = 3.75 m;
f 0.01 m GCL (kL = 2x10⁻⁸ m/s) + 0.6m CCL (kL = 1x10⁻⁹ m/s) + 3.14 m AL (k = 1x10⁻⁷ m/s);
** ≥ 24,000 lphd; *** over 100,000 lphd. Thus even with a 700 m long connected wrinkle (with a hole) per hectare, the leakage is substantially less than for a GM alone (Table 2) or CL alone (Table 3).
In a leachate lagoon application it is important that the liner be covered with a suitable soil (typically about 0.3 m thick), interlocking brick, cast concrete or some other suitable protection layer to avoid damage (e.g., Rowe et al. 2003), however the stress due to this protection layer may be expected to provided very little benefit with respect to improving kL due to consolidation. Thus, results are only shown for CCLs with kL = 1x10⁻⁹ m/s. For the GCL, kL = 5x10-11 m/s is possible at low stress provided that there is no significant clay-leachate interaction but a value around kL = 2x10⁻¹⁰ m/s may be more likely with leachate interaction. Under these low stress conditions and with an aggressive leachate, kL = 2x10⁻⁸ m/s is also possible.
The leakages for the lagoon case (Table 12) are larger than for the landfill case examined above (Table 11) due to the much larger head and corresponding gradient. While the leakages are substantially smaller than what would be expected for a GM with five similar (100 mm2) holes/ha (Table 2) or a CL (Table 3) alone for similar kL, the control of wrinkles is quite important for limiting leakage through the composite liner, especially if there is clay-leachate interaction with the GCL. The leakages with the GCL (even with clay-leachate interaction giving kL = 2x10⁻¹⁰ m/s) were less than 500 lphd for L ≤ 200 m compared to ≤ 1,000 lphd for a CCL
with L ≤ 200 m. For a primary composite liner underlain by a LDS, the leakage is large if GCL-leachate interaction led to kL = 2x10⁻⁸ m/s. With the same kL but the GCL in a composite liner with an attenuation layer, the leakage is substantially reduced to ≤ 670 lphd for L ≤ 200 m. For leachate lagoons where interaction between the GCL and leachate is a significant concern (i.e., where kL ~ 2x10⁻⁸ m/s might be anticipated) the use of a composite liner with a GCL and CCL together can result in a substantial reduction in leakage as shown in the last row of Table 12. Here the GCL serves to restrict the lateral migration of leachate between the GM and the GCL due to its good interface transmissivity while the thickness of the CCL controls the leakage in the zones beneath the wrinkle and out to where leachate can migrate between the GM and GCL. For this case the leakage was 63 lphd for L ≤ 200 m and 220 lphd for L = 700 m. Similar values are obtained for a GM, GCL and 0.6 m CCL in a primary liner underlain by a LDS. 6. OTHER FACTORS INFLUENCING LONG TERM
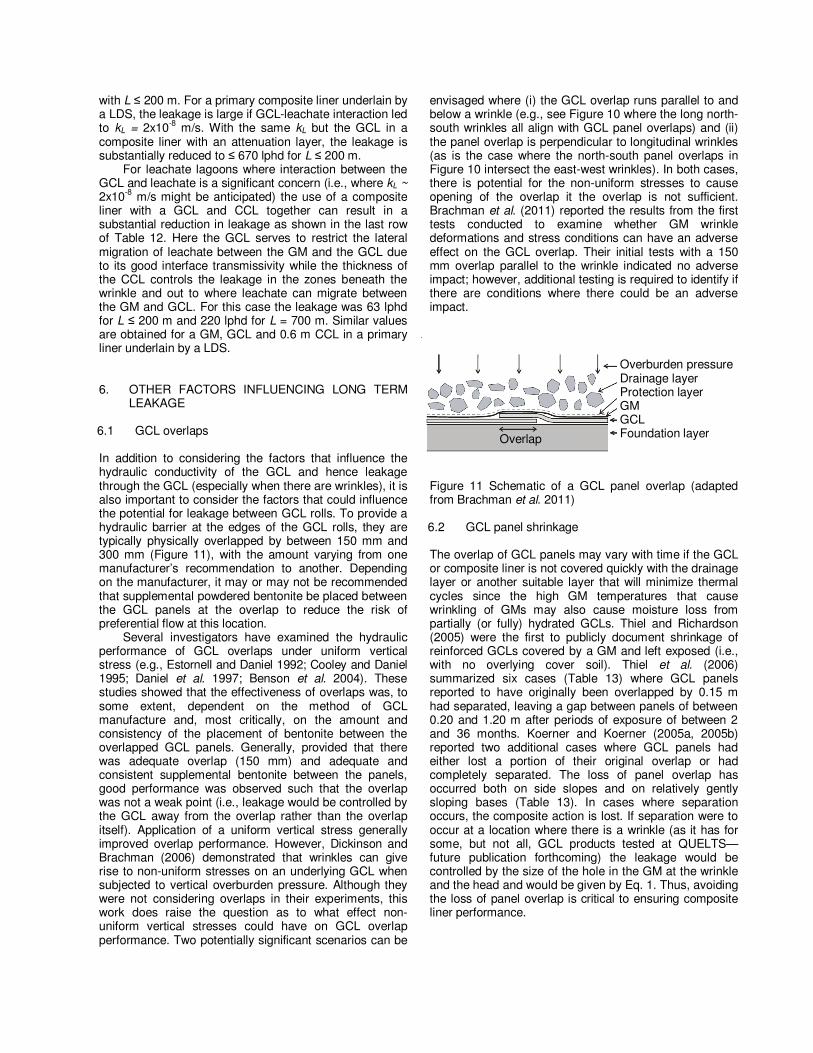
LEAKAGE 6.1 GCL overlaps In addition to considering the factors that influence the hydraulic conductivity of the GCL and hence leakage through the GCL (especially when there are wrinkles), it is also important to consider the factors that could influence the potential for leakage between GCL rolls. To provide a hydraulic barrier at the edges of the GCL rolls, they are typically physically overlapped by between 150 mm and 300 mm (Figure 11), with the amount varying from one manufacturer’s recommendation to another. Depending on the manufacturer, it may or may not be recommended that supplemental powdered bentonite be placed between the GCL panels at the overlap to reduce the risk of preferential flow at this location.
Several investigators have examined the hydraulic performance of GCL overlaps under uniform vertical stress (e.g., Estornell and Daniel 1992; Cooley and Daniel 1995; Daniel et al. 1997; Benson et al. 2004). These studies showed that the effectiveness of overlaps was, to some extent, dependent on the method of GCL manufacture and, most critically, on the amount and consistency of the placement of bentonite between the overlapped GCL panels. Generally, provided that there was adequate overlap (150 mm) and adequate and consistent supplemental bentonite between the panels, good performance was observed such that the overlap was not a weak point (i.e., leakage would be controlled by the GCL away from the overlap rather than the overlap itself). Application of a uniform vertical stress generally improved overlap performance. However, Dickinson and Brachman (2006) demonstrated that wrinkles can give rise to non-uniform stresses on an underlying GCL when subjected to vertical overburden pressure. Although they were not considering overlaps in their experiments, this work does raise the question as to what effect non-uniform vertical stresses could have on GCL overlap performance. Two potentially significant scenarios can be
envisaged where (i) the GCL overlap runs parallel to and below a wrinkle (e.g., see Figure 10 where the long north-south wrinkles all align with GCL panel overlaps) and (ii) the panel overlap is perpendicular to longitudinal wrinkles (as is the case where the north-south panel overlaps in Figure 10 intersect the east-west wrinkles). In both cases, there is potential for the non-uniform stresses to cause opening of the overlap it the overlap is not sufficient. Brachman et al. (2011) reported the results from the first tests conducted to examine whether GM wrinkle deformations and stress conditions can have an adverse effect on the GCL overlap. Their initial tests with a 150 mm overlap parallel to the wrinkle indicated no adverse impact; however, additional testing is required to identify if there are conditions where there could be an adverse impact. Figure 11 Schematic of a GCL panel overlap (adapted from Brachman et al. 2011) 6.2 GCL panel shrinkage The overlap of GCL panels may vary with time if the GCL or composite liner is not covered quickly with the drainage layer or another suitable layer that will minimize thermal cycles since the high GM temperatures that cause wrinkling of GMs may also cause moisture loss from partially (or fully) hydrated GCLs. Thiel and Richardson (2005) were the first to publicly document shrinkage of reinforced GCLs covered by a GM and left exposed (i.e., with no overlying cover soil). Thiel et al. (2006) summarized six cases (Table 13) where GCL panels reported to have originally been overlapped by 0.15 m had separated, leaving a gap between panels of between 0.20 and 1.20 m after periods of exposure of between 2 and 36 months. Koerner and Koerner (2005a, 2005b) reported two additional cases where GCL panels had either lost a portion of their original overlap or had completely separated. The loss of panel overlap has occurred both on side slopes and on relatively gently sloping bases (Table 13). In cases where separation occurs, the composite action is lost. If separation were to occur at a location where there is a wrinkle (as it has for some, but not all, GCL products tested at QUELTS—future publication forthcoming) the leakage would be controlled by the size of the hole in the GM at the wrinkle and the head and would be given by Eq. 1. Thus, avoiding the loss of panel overlap is critical to ensuring composite liner performance.
Overburden pressure Drainage layer Protection layer GM GCL Foundation layer
Overlap
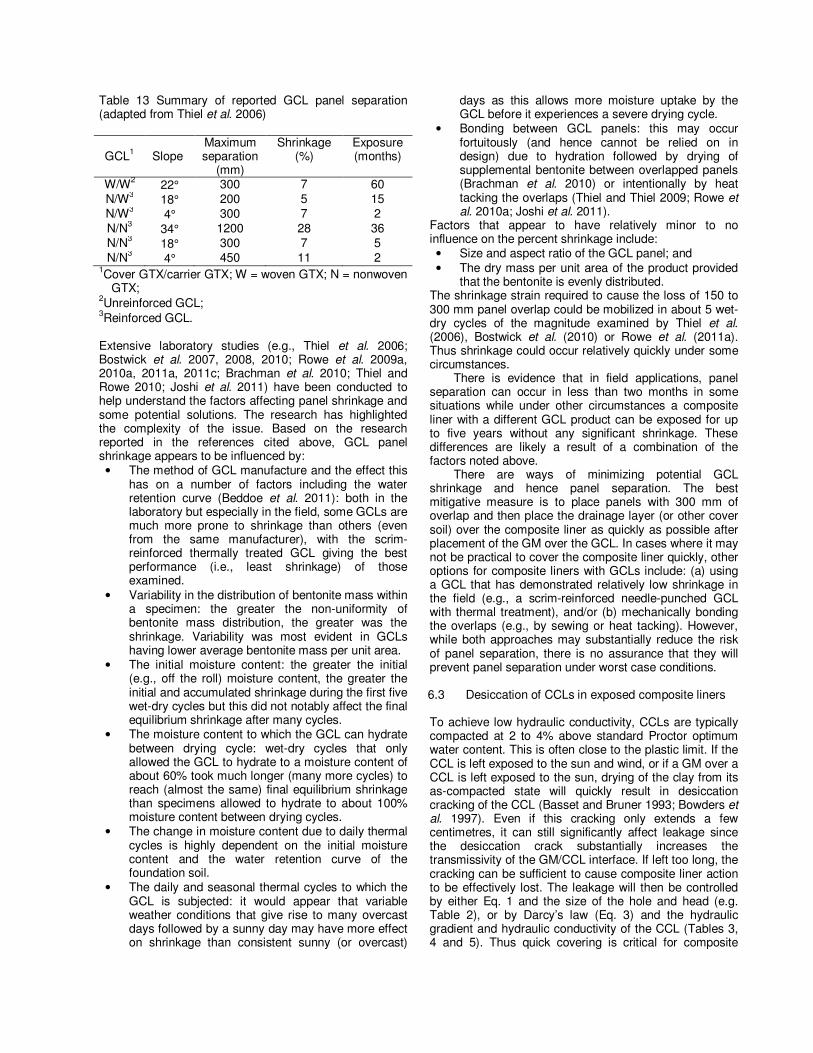
Table 13 Summary of reported GCL panel separation (adapted from Thiel et al. 2006)
GCL1 Slope
Maximum separation
(mm)
Shrinkage (%)
Exposure (months)
W/W2 22° 300 7 60 N/W3 18° 200 5 15 N/W3 4° 300 7 2 N/N3 34° 1200 28 36 N/N3 18° 300 7 5 N/N3 4° 450 11 2
1Cover GTX/carrier GTX; W = woven GTX; N = nonwoven GTX;
2Unreinforced GCL; 3Reinforced GCL. Extensive laboratory studies (e.g., Thiel et al. 2006; Bostwick et al. 2007, 2008, 2010; Rowe et al. 2009a, 2010a, 2011a, 2011c; Brachman et al. 2010; Thiel and Rowe 2010; Joshi et al. 2011) have been conducted to help understand the factors affecting panel shrinkage and some potential solutions. The research has highlighted the complexity of the issue. Based on the research reported in the references cited above, GCL panel shrinkage appears to be influenced by: • The method of GCL manufacture and the effect this
has on a number of factors including the water retention curve (Beddoe et al. 2011): both in the laboratory but especially in the field, some GCLs are much more prone to shrinkage than others (even from the same manufacturer), with the scrim-reinforced thermally treated GCL giving the best performance (i.e., least shrinkage) of those examined.
• Variability in the distribution of bentonite mass within a specimen: the greater the non-uniformity of bentonite mass distribution, the greater was the shrinkage. Variability was most evident in GCLs having lower average bentonite mass per unit area.
• The initial moisture content: the greater the initial (e.g., off the roll) moisture content, the greater the initial and accumulated shrinkage during the first five wet-dry cycles but this did not notably affect the final equilibrium shrinkage after many cycles.
• The moisture content to which the GCL can hydrate between drying cycle: wet-dry cycles that only allowed the GCL to hydrate to a moisture content of about 60% took much longer (many more cycles) to reach (almost the same) final equilibrium shrinkage than specimens allowed to hydrate to about 100% moisture content between drying cycles.
• The change in moisture content due to daily thermal cycles is highly dependent on the initial moisture content and the water retention curve of the foundation soil.
• The daily and seasonal thermal cycles to which the GCL is subjected: it would appear that variable weather conditions that give rise to many overcast days followed by a sunny day may have more effect on shrinkage than consistent sunny (or overcast)
days as this allows more moisture uptake by the GCL before it experiences a severe drying cycle.
• Bonding between GCL panels: this may occur fortuitously (and hence cannot be relied on in design) due to hydration followed by drying of supplemental bentonite between overlapped panels (Brachman et al. 2010) or intentionally by heat tacking the overlaps (Thiel and Thiel 2009; Rowe et al. 2010a; Joshi et al. 2011).
Factors that appear to have relatively minor to no influence on the percent shrinkage include: • Size and aspect ratio of the GCL panel; and • The dry mass per unit area of the product provided
that the bentonite is evenly distributed. The shrinkage strain required to cause the loss of 150 to 300 mm panel overlap could be mobilized in about 5 wet-dry cycles of the magnitude examined by Thiel et al. (2006), Bostwick et al. (2010) or Rowe et al. (2011a). Thus shrinkage could occur relatively quickly under some circumstances.
There is evidence that in field applications, panel separation can occur in less than two months in some situations while under other circumstances a composite liner with a different GCL product can be exposed for up to five years without any significant shrinkage. These differences are likely a result of a combination of the factors noted above.
There are ways of minimizing potential GCL shrinkage and hence panel separation. The best mitigative measure is to place panels with 300 mm of overlap and then place the drainage layer (or other cover soil) over the composite liner as quickly as possible after placement of the GM over the GCL. In cases where it may not be practical to cover the composite liner quickly, other options for composite liners with GCLs include: (a) using a GCL that has demonstrated relatively low shrinkage in the field (e.g., a scrim-reinforced needle-punched GCL with thermal treatment), and/or (b) mechanically bonding the overlaps (e.g., by sewing or heat tacking). However, while both approaches may substantially reduce the risk of panel separation, there is no assurance that they will prevent panel separation under worst case conditions. 6.3 Desiccation of CCLs in exposed composite liners To achieve low hydraulic conductivity, CCLs are typically compacted at 2 to 4% above standard Proctor optimum water content. This is often close to the plastic limit. If the CCL is left exposed to the sun and wind, or if a GM over a CCL is left exposed to the sun, drying of the clay from its as-compacted state will quickly result in desiccation cracking of the CCL (Basset and Bruner 1993; Bowders et al. 1997). Even if this cracking only extends a few centimetres, it can still significantly affect leakage since the desiccation crack substantially increases the transmissivity of the GM/CCL interface. If left too long, the cracking can be sufficient to cause composite liner action to be effectively lost. The leakage will then be controlled by either Eq. 1 and the size of the hole and head (e.g. Table 2), or by Darcy’s law (Eq. 3) and the hydraulic gradient and hydraulic conductivity of the CCL (Tables 3, 4 and 5). Thus quick covering is critical for composite
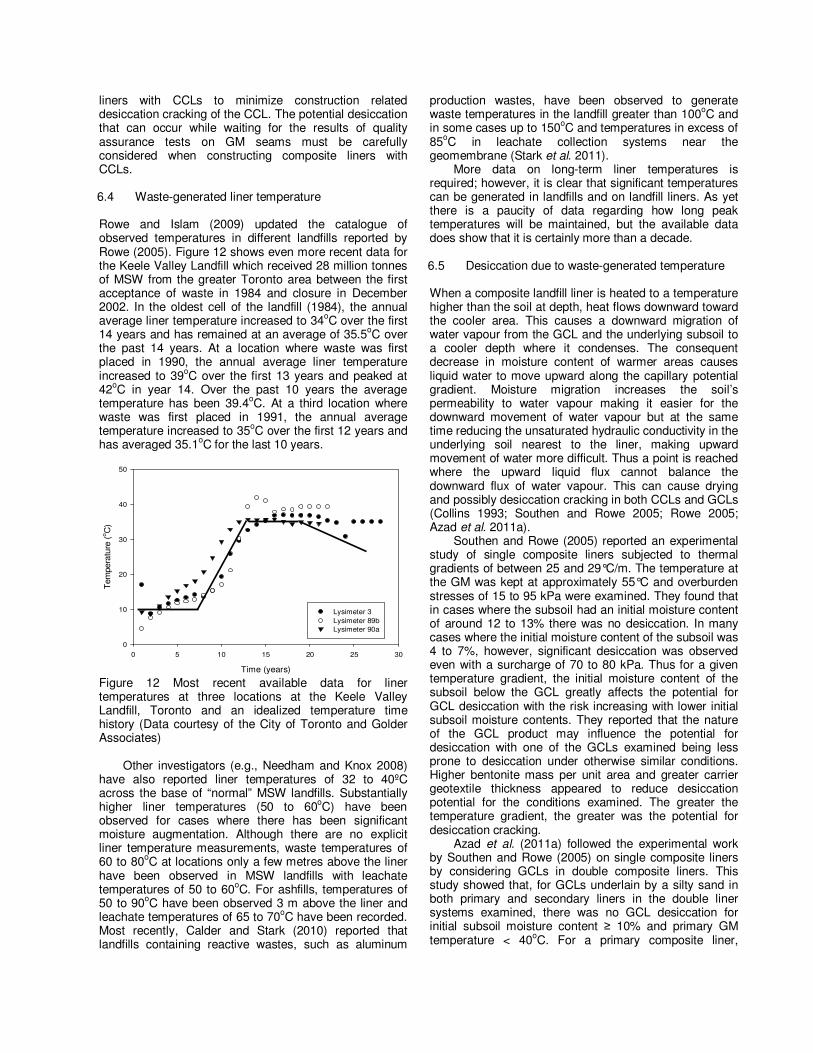
liners with CCLs to minimize construction related desiccation cracking of the CCL. The potential desiccation that can occur while waiting for the results of quality assurance tests on GM seams must be carefully considered when constructing composite liners with CCLs. 6.4 Waste-generated liner temperature Rowe and Islam (2009) updated the catalogue of observed temperatures in different landfills reported by Rowe (2005). Figure 12 shows even more recent data for the Keele Valley Landfill which received 28 million tonnes of MSW from the greater Toronto area between the first acceptance of waste in 1984 and closure in December 2002. In the oldest cell of the landfill (1984), the annual average liner temperature increased to 34oC over the first 14 years and has remained at an average of 35.5oC over the past 14 years. At a location where waste was first placed in 1990, the annual average liner temperature increased to 39oC over the first 13 years and peaked at 42oC in year 14. Over the past 10 years the average temperature has been 39.4oC. At a third location where waste was first placed in 1991, the annual average temperature increased to 35oC over the first 12 years and has averaged 35.1oC for the last 10 years.
Time (years)
0 5 10 15 20 25 30
Tem
pera
ture
(o C
)
0
10
20
30
40
50
Lysimeter 3Lysimeter 89bLysimeter 90a
Figure 12 Most recent available data for liner temperatures at three locations at the Keele Valley Landfill, Toronto and an idealized temperature time history (Data courtesy of the City of Toronto and Golder Associates)
Other investigators (e.g., Needham and Knox 2008)
have also reported liner temperatures of 32 to 40ºC across the base of “normal” MSW landfills. Substantially higher liner temperatures (50 to 60oC) have been observed for cases where there has been significant moisture augmentation. Although there are no explicit liner temperature measurements, waste temperatures of 60 to 80oC at locations only a few metres above the liner have been observed in MSW landfills with leachate temperatures of 50 to 60oC. For ashfills, temperatures of 50 to 90oC have been observed 3 m above the liner and leachate temperatures of 65 to 70oC have been recorded. Most recently, Calder and Stark (2010) reported that landfills containing reactive wastes, such as aluminum
production wastes, have been observed to generate waste temperatures in the landfill greater than 100oC and in some cases up to 150oC and temperatures in excess of 85oC in leachate collection systems near the geomembrane (Stark et al. 2011).
More data on long-term liner temperatures is required; however, it is clear that significant temperatures can be generated in landfills and on landfill liners. As yet there is a paucity of data regarding how long peak temperatures will be maintained, but the available data does show that it is certainly more than a decade.
6.5 Desiccation due to waste-generated temperature
When a composite landfill liner is heated to a temperature higher than the soil at depth, heat flows downward toward the cooler area. This causes a downward migration of water vapour from the GCL and the underlying subsoil to a cooler depth where it condenses. The consequent decrease in moisture content of warmer areas causes liquid water to move upward along the capillary potential gradient. Moisture migration increases the soil’s permeability to water vapour making it easier for the downward movement of water vapour but at the same time reducing the unsaturated hydraulic conductivity in the underlying soil nearest to the liner, making upward movement of water more difficult. Thus a point is reached where the upward liquid flux cannot balance the downward flux of water vapour. This can cause drying and possibly desiccation cracking in both CCLs and GCLs (Collins 1993; Southen and Rowe 2005; Rowe 2005; Azad et al. 2011a).
Southen and Rowe (2005) reported an experimental study of single composite liners subjected to thermal gradients of between 25 and 29°C/m. The temperature at the GM was kept at approximately 55°C and overburden stresses of 15 to 95 kPa were examined. They found that in cases where the subsoil had an initial moisture content of around 12 to 13% there was no desiccation. In many cases where the initial moisture content of the subsoil was 4 to 7%, however, significant desiccation was observed even with a surcharge of 70 to 80 kPa. Thus for a given temperature gradient, the initial moisture content of the subsoil below the GCL greatly affects the potential for GCL desiccation with the risk increasing with lower initial subsoil moisture contents. They reported that the nature of the GCL product may influence the potential for desiccation with one of the GCLs examined being less prone to desiccation under otherwise similar conditions. Higher bentonite mass per unit area and greater carrier geotextile thickness appeared to reduce desiccation potential for the conditions examined. The greater the temperature gradient, the greater was the potential for desiccation cracking.
Azad et al. (2011a) followed the experimental work by Southen and Rowe (2005) on single composite liners by considering GCLs in double composite liners. This study showed that, for GCLs underlain by a silty sand in both primary and secondary liners in the double liner systems examined, there was no GCL desiccation for initial subsoil moisture content ≥ 10% and primary GM temperature < 40oC. For a primary composite liner,
desiccation cracking did occur on a foundation layer at 10 to 11% initial moisture content and a GM temperature of 45oC. For a secondary composite liner, desiccation was observed when the subsoil below the GCL had an initial moisture content of about 5% and the primary GM temperature was 40oC. Thus, unless care is taken to ensure the subsoil has an appropriate initial moisture content, desiccation cracking may occur even at the upper end of the temperature range for a normal MSW landfill.
For GCLs in a primary composite liner resting directly on a geonet drainage layer, it was found that the risk of desiccation was greatest for GCLs at low initial moisture content. Thus in these situations it is desirable for the GCL to hydrate before a significant thermal gradient is applied.
Both Southen and Rowe (2005) and Azad et al. (2011a) conducted hydraulic conductivity tests on desiccated GCL samples. They found that for all three products tested (one Canadian, one European and one Australian), the desiccated GCL self-healed during permeation and the hydraulic conductivity decreased from a desiccated kL of 1x10⁻⁹ to 1x10⁻⁸ m/s to the healed kL ≤ 2x10-11 m/s when permeated with clean water. This situation may not have been as good had the desiccated GCL been permeated with a leachate.
The experiments reported by Southen and Rowe (2005) and Azad et al. (2011a) have been modelled using the Zhou and Rowe (2003) model (Southen and Rowe 2011 and Azad et al. 2011b respectively) and the model was found to give very encouraging agreement with the experimental observations.
In summary, there is potential for desiccation of GCLs even at traditional MSW landfill liner temperatures (35 to 40oC) under conditions of low stress and where the foundation soil has low initial moisture content. Thus, placement of a GCL over relatively dry subsoil (< 10% initial moisture content) should be avoided for landfill applications. Increasing stress was shown to reduce the potential for desiccation (other things being equal). As the liner temperature increased, the risk of desiccation increases and thus special care is required for waste that can generate heat in excess of about 30 to 40oC on the liner (e.g., MSW incinerator ash containing aluminum, reactive wastes, and MSW waste when the landfill is operated as a bioreactor). 6.6 Geomembrane service life
As demonstrated in previous sections, a composite liner can be extremely effective at controlling leakage from a landfill or lagoon. This is only the case as long as the GM remains relatively intact (i.e., with only the holes that occur in the short-term as discussed earlier). GMs do, however, have a finite service life. Traditionally the service life is considered to have three stages; Stage I: antioxidant depletion; Stage II: induction; and Stage III: degradation of the polymer to failure (Hsuan and Koerner 1998). Rowe (2005) provided a detailed discussion of the information available up to early 2005 with respect to the service life of HDPE GMs. Since that time, considerable research has been conducted to further address
questions regarding the service life of HDPE GMs (Rowe and Rimal 2008a, 2008b; Rowe et al. 2008, 2009b, 2010b, 2010c). The key findings from the work reported in these papers for the HDPE GMs and conditions examined can be summarized as follows: • The service life of an HDPE GM is dependent on the
polyethylene resin, the carbon black and the antioxidant package in the specific GM. Even for a given manufacturer these may vary from time to time and the service life predictions in the cited publications are only for GMs with properties similar to or better than those tested; they do not apply to all HDPE GMs;
• The antioxidant depletion time (Stage I) was shorter for GMs immersed in simulated MSW leachate than for GMs immersed in water. The longest depletion time (Stage I) was measured for GMs in air;
• When immersed in water and leachate, antioxidant depletion was primarily associated with outward diffusion of antioxidants to the adjacent liquid;
• Using Arrhenius modeling for the GM tested, the predicted antioxidant depletion time (Stage I) at a typical MSW liner temperature of 35oC was about 10 years in leachate, 35 years in water and 65 years in air;
• The key component of MSW leachate with respect to depletion of antioxidants (Stage I) is surfactant (soaps). Even a relatively small amount of surfactant can substantially increase the rate of antioxidant depletion;
• GM thickness has a significant effect on the depletion of antioxidants (Stage I). A 2.5 mm GM had an approximately 50% longer time to antioxidant depletion than a 1.5 mm GM;
• Using Arrhenius modelling for the GM tested, the antioxidant depletion time for a GM at a typical MSW landfill liner temperature of 35oC was estimated to be 10 years for the GM immersed in leachate, 40 years for the GM in a composite liner with a traditional GTX protection layer, 50 years with a 15 mm thick sand protection layer above the GTX and 65 years when the GM was separated from the leachate by an overlying GCL;
• There was no significant effect of 250 kPa of applied stress on the depletion of antioxidants (Stage I).
Rowe and Islam (2009) developed a technique for estimating the service life of HDPE GMs based on the landfill liner temperature-time history and the data available in 2008 for 5 GMs. Figure 13 shows a schematic of the temperature-time history they examined where To is the temperature of the liner in the absence of any heat generated by the waste. It was assumed that the liner temperature started at this temperature and remained approximately constant until a time t1 (which was zero in some cases), after which the temperature increased linearly with time to an average peak temperature Tp at time t2. The average peak temperature was assumed to remain constant at this value until time t3 after which it decreased linearly, returning to To at time t4. They considered a wide range of temperature-time histories. Table 14 summarizes two of the temperature-time
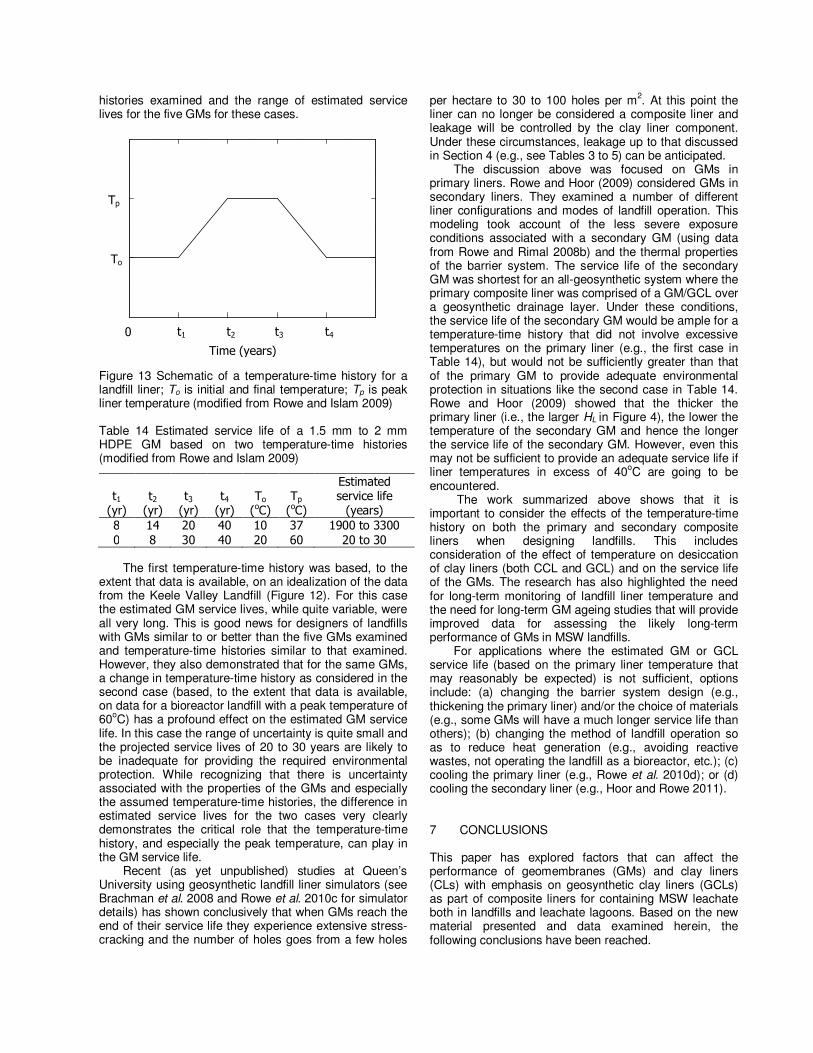
histories examined and the range of estimated service lives for the five GMs for these cases. Figure 13 Schematic of a temperature-time history for a landfill liner; To is initial and final temperature; Tp is peak liner temperature (modified from Rowe and Islam 2009) Table 14 Estimated service life of a 1.5 mm to 2 mm HDPE GM based on two temperature-time histories (modified from Rowe and Islam 2009)
t1
(yr) t2
(yr) t3
(yr) t4
(yr) To
(oC) Tp (oC)
Estimated service life (years)
8 14 20 40 10 37 1900 to 3300 0 8 30 40 20 60 20 to 30
The first temperature-time history was based, to the
extent that data is available, on an idealization of the data from the Keele Valley Landfill (Figure 12). For this case the estimated GM service lives, while quite variable, were all very long. This is good news for designers of landfills with GMs similar to or better than the five GMs examined and temperature-time histories similar to that examined. However, they also demonstrated that for the same GMs, a change in temperature-time history as considered in the second case (based, to the extent that data is available, on data for a bioreactor landfill with a peak temperature of 60oC) has a profound effect on the estimated GM service life. In this case the range of uncertainty is quite small and the projected service lives of 20 to 30 years are likely to be inadequate for providing the required environmental protection. While recognizing that there is uncertainty associated with the properties of the GMs and especially the assumed temperature-time histories, the difference in estimated service lives for the two cases very clearly demonstrates the critical role that the temperature-time history, and especially the peak temperature, can play in the GM service life.
Recent (as yet unpublished) studies at Queen’s University using geosynthetic landfill liner simulators (see Brachman et al. 2008 and Rowe et al. 2010c for simulator details) has shown conclusively that when GMs reach the end of their service life they experience extensive stress-cracking and the number of holes goes from a few holes
per hectare to 30 to 100 holes per m2. At this point the liner can no longer be considered a composite liner and leakage will be controlled by the clay liner component. Under these circumstances, leakage up to that discussed in Section 4 (e.g., see Tables 3 to 5) can be anticipated.
The discussion above was focused on GMs in primary liners. Rowe and Hoor (2009) considered GMs in secondary liners. They examined a number of different liner configurations and modes of landfill operation. This modeling took account of the less severe exposure conditions associated with a secondary GM (using data from Rowe and Rimal 2008b) and the thermal properties of the barrier system. The service life of the secondary GM was shortest for an all-geosynthetic system where the primary composite liner was comprised of a GM/GCL over a geosynthetic drainage layer. Under these conditions, the service life of the secondary GM would be ample for a temperature-time history that did not involve excessive temperatures on the primary liner (e.g., the first case in Table 14), but would not be sufficiently greater than that of the primary GM to provide adequate environmental protection in situations like the second case in Table 14. Rowe and Hoor (2009) showed that the thicker the primary liner (i.e., the larger HL in Figure 4), the lower the temperature of the secondary GM and hence the longer the service life of the secondary GM. However, even this may not be sufficient to provide an adequate service life if liner temperatures in excess of 40oC are going to be encountered.
The work summarized above shows that it is important to consider the effects of the temperature-time history on both the primary and secondary composite liners when designing landfills. This includes consideration of the effect of temperature on desiccation of clay liners (both CCL and GCL) and on the service life of the GMs. The research has also highlighted the need for long-term monitoring of landfill liner temperature and the need for long-term GM ageing studies that will provide improved data for assessing the likely long-term performance of GMs in MSW landfills.
For applications where the estimated GM or GCL service life (based on the primary liner temperature that may reasonably be expected) is not sufficient, options include: (a) changing the barrier system design (e.g., thickening the primary liner) and/or the choice of materials (e.g., some GMs will have a much longer service life than others); (b) changing the method of landfill operation so as to reduce heat generation (e.g., avoiding reactive wastes, not operating the landfill as a bioreactor, etc.); (c) cooling the primary liner (e.g., Rowe et al. 2010d); or (d) cooling the secondary liner (e.g., Hoor and Rowe 2011). 7 CONCLUSIONS This paper has explored factors that can affect the performance of geomembranes (GMs) and clay liners (CLs) with emphasis on geosynthetic clay liners (GCLs) as part of composite liners for containing MSW leachate both in landfills and leachate lagoons. Based on the new material presented and data examined herein, the following conclusions have been reached.
0
3
6
9
t1 t2 t3 t4
Time (years)
To
0
Tp
Based on the typically assumed 2.5 to 5 holes/ha used for design calculations of leakage through GMs installed with strict CQA/CQC, even very small holes (diameter = 1 mm) in a GM used as a single liner, would cause leakage of 250 to 500 lphd for a 0.3 m design head in a landfill and 1,000 to 2,000 lphd for a lagoon with 5 m head. For a typical design hole with an area of 1 cm2, the corresponding leakages are 32,000 to 63,000 lphd for a 0.3 m head and 130,000 to 260,000 lphd for a 5 m head.
For a single clay liner as part of the primary liner in a double liner system, the leakages assuming typical design hydraulic conductivities are about 1300 lphd for both a GCL (kL = 5x10-11 m/s, HL = 0.01 m) and CCL (kL = 1x10⁻⁹ m/s, HL = 0.6 m) for a landfill application with head of 0.3 m and about 22,000 lphd for a GCL and 8,000 lphd for a CCL in a lagoon application (hw = 5 m).
For 5 holes/ha (each with an area, a = 1 cm2) in the GM component of a composite liner in a double liner system where the GM is in direct contact with the CL (i.e., there are no wrinkles), the calculated leakage for a GCL is less than 0.2 lphd even for a hydraulic conductivity as high as 2x10⁻⁸ m/s and less than 3 lphd for a CCL (kL = 1x10⁻⁹ m/s, HL = 0.6 m) for a typical landfill design head (hw = 0.3 m) and less than 2 lphd for a GCL and 36 lphd for a CCL in a lagoon application (hw = 5 m). Thus a well-constructed composite liner where the GM is in direct contact with the CL can result in leakages many orders of magnitude less than that which might be expected for a single GM or CL.
When a clay liner is used as a single liner it is very important to consider the factors that can affect hydraulic conductivity and to adopt a design value relevant to the expected conditions on the site since they may be quite different from “typical” values obtained by permeating a GCL or CCL with water in the laboratory. For a GCL, the typically specified kL = 5x10-11 m/s may be a reasonable value for GCLs permeated with water at low (3 to 4 kPa) stress levels and can also closely approximate the values obtained for GCLs permeated with a realistic simulated MSW leachate at stresses of 25 to 35 kPa. However, permeation of a GCL with leachate at low confining stress (e.g., in leachate lagoon applications) could result in a value of kL = 2x10⁻¹⁰ m/s or, in a very extreme case, kL = 2x10⁻⁸ m/s. On the other hand, at higher stresses applicable to landfill applications, much lower hydraulic conductivities of 7x10-12 m/s may be achieved. For CCLs a typical design kL is 1x10⁻⁹ m/s. Well-constructed CCLs may achieve kL = 5x10⁻¹⁰ m/s or even kL ≤ 1x10⁻¹⁰ m/s after consolidation; however, a CCL could also have kL = 1x10⁻⁸ m/s unless care is taken in the selection of the soil and compaction procedures.
The leakage through a single CL is linearly proportional to kL; however, this is not the case for composite liners where the GM is in direct contact with the CL. In this case, it is the interface transmissivity rather than the hydraulic conductivity of the CL that controls leakage, especially for a GCL.
The reported GM/GCL interface transmissivity for a reinforced GCL (needle-punched and stitch-bonded) may vary between a high of 2x10⁻¹⁰ m2/s and a low of 6x10-12
m2/s with an average of about 4x10-11 m2/s for all the reinforced GCL data and about 2x10-11 m2/s for all the
GCLs containing sodium bentonite at 50 kPa. Although higher stress may give slightly lower transmissivity, there was no strong trend. Likewise the geotextile in contact with the GM and the hydraulic conductively of the GCL had very little effect on the interface transmissivity. A typical design transmissivity for a GM/CCL assuming good construction practice appears to be about 2x10⁻⁸ m2/s.
Although wrinkles can be avoided, this is expensive and is not typical in the Americas. New calculations presented in this paper further illustrate the point raised by Rowe (2005) that calculations of leakage for composite liners assuming direct contact (i.e., no linear features like wrinkles) between the GM and the CL significantly underestimate (i.e., by one or more orders of magnitude) the actual leakage in typical North American landfills.
The Rowe (1998) equation for leakage through wrinkles (Eq. 6) can explain the observed leakage in North American landfills for heads and connected wrinkle lengths typical of that observed in landfills during construction.
Based on the presently available data, it can be concluded that although wrinkles may reach heights of 0.2 m or more and widths up to 0.5 m on occasion, for 1.5 mm thick HDPE GM (smooth or textured), at least during the typical eastern Canadian construction season, wrinkles were typically about 0.06 m high and about (2b =) 0.2 m to 0.25 m wide. The typical width did not change significantly over most of the day. The length of connected wrinkles varied substantially with the time of day and to some extent with the size of the unconstrained area. If the GM were covered with the leachate collection layer before 8:00am or after 4:00 pm, there would have been about 6 to 7 connected wrinkles per hectare with connected length L ≤ 200 m. This length would increase with the time of day the GM was covered, typically peaking at around 1:00 pm with an connected length of about 2,000 m for an unrestrained area of up to about 0.2 ha (and larger for larger unrestrained areas).
It would appear that at low heads, connected wrinkle lengths (with a hole) of 85 m ≤ L ≤ 700 m and at higher heads 400 m ≤ L ≤ 700 m most likely explain the leakages typically observed through a primary composite liner in double lined landfills in North America. These lengths are consistent with what one would expect based on the field studies reported by Rowe et al. (2011b) if the GM was covered when the area of the base with wrinkles was between about 3% and 15%.
Allowing for typical wrinkles, the leakage through composite liners can still be very small compared to a single GM or CL alone for a landfill application (hw = 0.3 m). For a GCL with kL = 2x10⁻¹⁰ m/s below the wrinkle and kL = 5x10-11 m/s outside the wrinkle, the calculated leakage is less than about 14 lphd for L ≤ 200 m and less than 50 lphd for L ≤ 700 m. For a 0.6 m thick CCL (kL = 1x10⁻⁹ m/s), the corresponding calculated leakages were less than about 83 lphd for L ≤ 200 m and less than 580 lphd for L ≤ 700 m.
For leachate lagoons where interaction between the GCL and leachate is a significant concern (i.e., where kL ~ 2x10⁻⁸ m/s might be anticipated in some cases), the use of a composite liner with a GCL and CCL together can
result in a substantial reduction in leakage. Here the GCL serves to restrict the lateral migration of leachate between the GM and the GCL due to its good interface transmissivity while the thickness of the CCL controls the leakage in the zones beneath the wrinkle and out to where leachate can migrate between the GM and GCL. For this case (hw = 5 m) the leakage was 65 lphd for L = 200 m and 220 lphd for L = 700m.
To ensure good composite liner action, it is important that: (a) CCLs below the GM not be allowed to desiccate (even desiccation of the upper few centimetres of liner will substantially increase the GM/CCL interface transmissivity and hence leakage), and (b) GCL panels not be allowed to shrink to the point where overlap integrity is lost. The best way of protecting the integrity of both the CCL and GCL is to cover the composite liner with the drainage or other soil protective layer quickly after placement of the GM. CCLs can significantly desiccate after only a few hours of exposure given that GM temperatures can easily reach 50 to 70oC on a sunny day. GCL panel separation is not as urgent a problem as CCL desiccation but panel separation can occur in less than two months in some situations while in other circumstances the composite liner can be exposed for up to five years without separation. These differences are likely a result of a combination of the factors discussed in this paper. The shrinkage strain required to cause the loss of 150 to 300 mm of panel overlap could be mobilized in about 5 wet-dry cycles of the magnitude examined in several studies reviewed in this paper.
The potential for loss of GCL panel overlap can be minimized by placing panels with 300 mm of overlap and then placing the drainage layer (or other cover soil) as quickly as possible after placement of the GM over the GCL as noted above. In cases where this may not be practical, other options include: (a) using a GCL that has demonstrated relatively low shrinkage in the field (e.g., scrim-reinforced needle-punched GCL with thermal treatment), and (b) mechanically bonding the overlaps (e.g., by sewing or heat tacking). However, while both approaches may substantially reduce the risk of panel separation, there is no assurance that they will prevent panel separation under worst case conditions; the best solution is to cover the composite liner quickly.
Heat generated in a landfill may result in landfill liner temperatures of 30 to 40ºC for “normal” MSW landfills. Substantially higher liner temperatures (50 to 60oC) have been observed for cases where there has been significant moisture augmentation. Although there are no explicit liner temperature measurements, waste temperatures of 60 to 80oC at locations only a few metres above the liner have been observed in MSW landfills with leachate temperatures of 50 to 60oC. For ashfills, temperatures of 50 to 90oC have been observed 3 m above the liner and leachate temperatures of 65 to 70oC have been recorded. Landfills containing reactive wastes, such as aluminum production wastes, have been observed to generate waste temperatures in the landfill greater than 100oC and in some cases up to 150oC.
CCLs are particularly prone to desiccation, especially when compacted near (or above) the plastic limit as is often done to achieve a low hydraulic conductivity.
Desiccation may occur: (a) after construction of the clay liner and before placing the drainage layer or geomembrane; (b) after placing the geomembrane and before covering with the drainage layer; and/or (c) after placement of waste. In the first two cases the heat is generated by the sun, while in the last case the heat is generated by the waste.
There is also potential for desiccation of GCLs even at traditional MSW landfill liner temperatures (35 to 40oC) under conditions of low stress and where the foundation soil has low initial moisture content. As the liner temperature increases, the risk of desiccation increases and thus special care is required for waste that can generate heat in excess of about 35 to 40oC on the liner (e.g., MSW incinerator ash containing aluminum, reactive waste, and when aggressively operating a MSW landfill as a bioreactor).
The presently available data suggest that for landfill liners with maximum temperatures of 30 to 40ºC, the service life of a 1.5 mm HDPE GM with a good resin and antioxidant package may be very long (thousands of years). However, the same data suggests that for liners subjected to temperatures of 60oC the service life can be reduced to decades (and even less at higher temperatures).
It is important to consider the effects of the temperature-time history on both the primary and secondary composite liners when designing MSW landfills. This includes consideration of the effect of temperature on desiccation of clay liners (both CCL and GCL) and on the service life of the GMs. Recent research has highlighted the need for long-term monitoring of landfill liner temperature and the need for long-term GM ageing studies that will provide improved data for assessing the likely long-term performance of GMs in MSW landfills.
For applications where the estimated GM or GCL service life based on the primary liner temperature that may reasonably be expected is not sufficient, options include: (a) changing the barrier system design (e.g., thickening the primary liner) and/or the choice of materials (e.g., some GMs will have a much longer service life than others); (b) changing the method of landfill operation so as to reduce heat generation (e.g., avoiding reactive wastes, not operating as a bioreactor, etc.); (c) cooling the primary liner; or (d) cooling the secondary liner.
To minimize leakage through composite liners, it would appear that future design guidelines need to pay more attention to issues such as: (a) wrinkles in GMs; (b) the hydraulic conductivity of GCLs used in low stress applications (e.g., leachate lagoons) where there are wrinkles and potential for interaction with leachate; (c) selection of the best GCL for a given application (they are not all the same); (d) the temperatures to which the liner may be subjected during its design life; (e) potential for desiccation of clay liners when the waste or fluid to be contained will be at temperatures of 35oC or higher; and (f) tensile strains in the GM. Also, installation guidelines and construction specifications need to pay more attention to issues such as: (a) when to cover GMs to control wrinkles to an acceptable level; (b) avoiding desiccation of CCLs before they are covered with a GM;
(c) covering the GM above a CCL quickly so that it does not desiccate when the GM is exposed to the sun; (d) the moisture content of the subgrade upon which a GCL is placed; (e) placing GCLs with a 300 mm overlap or mechanically bonding the panels; and (f) covering the composite liner as quickly as practicable (the longer it is exposed to the sun the greater the potential problems that can arise).
Based on the available data, it can be concluded that composite liners have performed extremely well in field applications for a couple of decades. Recent research both helps understand why they have worked so well, but also provides new insight into issues that need to be considered to ensure excellent long-term liner performance of composite liners—especially for applications where the liner temperature can exceed about 35oC. 8 ACKNOWLEDGEMENTS The research presented in this paper was funded by the Natural Science and Engineering Research Council of Canada (NSERC) using equipment funded by the Canada Foundation for Innovation (CFI) and the Ontario Ministry of Research and Innovation. The writer is very grateful to: his colleagues in the GeoEngineering Centre at Queen’s-RMC, especially Drs. Richard Brachman, Andy Take and Greg Siemens and Grace Hsuan from Drexel University who have contributed greatly to this research; our industrial partners, Terrafix Geosynthetics Inc., Solmax International, Ontario Ministry of Environment, AECOM, AMEC Earth and Environmental, Golder Associates Ltd., Canadian Nuclear Safety Commission, CTT Group, Knight Piésold and Thiel Engineering for their advice and support with this research; many past and present graduate students whose co-authored papers are referenced as well as F. Abdelaal, M Chappel and A. Ewais for their contributions to as yet unpublished research; R. Brachman, M. Chappel, A. Hoor, M. Hosney and A. Verge for their assistance with the preparation of figures; the anonymous reviewers, L. Ashe, R. Brachman, and especially A. Verge for carefully reviewing the manuscript. The views expressed herein are those of the writer and not necessarily those of the many people who have assisted with the research or review of the manuscript. 9 NOTATION a Area of a hole in GM (m2 or mm2) A Area of liner under consideration (m2) AL Attenuation layer (typically k ≤ 10-7 m/s) b Half-width of a wrinkle (m) CB Coefficient related to the shape of the edges
of the hole in GM (-) CL Clay liner (either CCL or GCL) CCL Compacted clay liner CQA/CQC Construction quality assurance/construction
quality control
GCL Geosynthetic clay liner GM Geomembrane GTX Geotextile g Acceleration due to gravity (m/s2) ha Height of potentiometric surface above
aquifer (m) HA Thickness of attenuation layer (m) HL Thickness of clay liner (m) hw Leachate head on liner (m) i Hydraulic gradient (-) is Hydraulic gradient across CL and AL (-) HDPE High density polyethylene k Hydraulic conductivity/permeability (m/s) kA Hydraulic conductivity of AL (m/s) kL Hydraulic conductivity of clay liner (m/s) ks Harmonic mean hydraulic conductivity of CL
and AL (m/s) L Length of connected wrinkle (m) lphd Litres per hectare per day LDS Leak detection system MSW Municipal solid waste MA Mass per unit area of GCL (g/m2) N Nonwoven geotextile Q Leakage (m3/s or lphd) QUELTS Queen’s University Experimental Liner Test
Site ro Radius of a hole in a GM (m) S Smooth GM SB Stitch-bonded TDS Textured GM TEH Spayed-on textured GM TSO Embossed honeycomb textured GM W Woven geotextile θ GM/CL interface transmissivity (m2/s) 10 REFERENCES
ASTM Standard D7002. 2010a. Standard Practice for Leak
Location on Exposed Geomembranes Using the Water Puddle System, ASTM International, West Conshohocken, PA, 2010, DOI: 10.1520/D7002-10, www.astm.org.
ASTM Standard D5084. 2010b. Standard Test Methods for Measurement of Hydraulic Conductivity of Saturated Porous Materials Using a Flexible Wall Permeameter, ASTM International, West Conshohocken, PA, 2010, DOI: 10.1520/D5084-10, www.astm.org.
ASTM Standard D5887. 2009. Standard Test Method for Measurement of Index Flux Through Saturated Geosynthetic Clay Liner Specimens Using a Flexible Wall Permeameter, ASTM International, West Conshohocken, PA, 2009, DOI: 10.1520/D5887-09, www.astm.org.
Averesch, U. and Schicketanz, R. 1998. Installation procedure and welding of geomembranes in the construction of composite landfill liner systems: The fixing berm construction method, 6th International Conference on Geosynthetics, Atlanta, Industrial Fabrics Association International, St. Paul, MN, pp. 307-313.
Azad, F., Rowe, R.K., El-Zein, A. and Airey, D. 2011a. Laboratory investigation of thermally induced desiccation of GCLs in double composite liner systems, Geotextiles and Geomembranes, 29(6) (in press).
Azad, F., El-Zein, A., Rowe, R.K. and Airey, D. 2011b. Modeling of thermally induced desiccation of geosynthetic clay liners in double composite liner systems, Geotextiles and Geomembranes (in review).
Barroso, M.C.P., Lopes, M.G.D.A. and Bergamini, G. 2010. Effect of the waste pressure on fluid migration through geomembrane defects, Proceedings 9th International Conference on Geosynthetics, Guaruja, Brazil, 959-962.
Barroso, M., Touze-Foltz, N. and von Maubeuge, K., 2008. Influence of the Textured Structure of Geomembranes on the Flow Rate Through Geomembrane-GCL Composite Liners, proceedings EuroGeo4, 8p.
Basset, C.R. and Bruner, R.J. 1993. Clay desiccation of a single-composite liner system, Geosynthetics 93, Vancouver, 1329-1340.
Beddoe, R.A., Take, W.A. and Rowe, R.K. 2011. Water retention behaviour of geosynthetic clay liners, ASCE Journal of Geotechnical and Geoenvironmental Engineering, Published online March 2, 2011 (doi:10.1061 /(ASCE)GT.1943-5606.0000526)
Benson, C.H, Kucukkirca, I.E. and Scalia, J. 2010. Properties of geosynthetics exhumed from a final cover at a solid waste landfill, Geotextiles and Geomembranes, 28(6): 536-546.
Benson, C.H., Jo, H.Y. and Abichou, T. 2004. Forensic analysis of excessive leakage from lagoons lined with a composite GCL. Geosynthetics International, 11(3): 242-252.
Benson, C.H., Daniel, D.E. and Boutwell, G.P. 1999. Field performance of compacted clay liners, ASCE Journal of Geotechnical and Geoenvironmental Engineering, 125(5): 390-403.
Benson, C.H., Zhai, H. and Wang, X. 1994. Estimating hydraulic conductivity of compacted clay liners, ASCE Journal of Geotechnical Engineering, 120(2): 366-387.
Bonaparte, R., Daniel, D. and Koerner, R.M. (2002) Assessment and recommendations for improving the performance of waste containment systems, EPA Report, CR-821448-01-0.
Bostwick, L.E., Rowe, R.K., Take, W.A. and Brachman, R.W.I. 2010. Anisotropy and directional shrinkage of geosynthetic clay liners, Geosynthetics International, 17(3): 1-14.
Bostwick, L.E., Rowe, R.K., Take, W.A. and Brachman, R.W.I. 2008. Observations of the dimensional stability of four GCL products under combined thermal and moisture cycles, Geoamericas 2008, Cancun, Mexico, 435-443.
Bostwick, L.E., Rowe, R.K., Take, W.A. and Brachman, R.W.I. 2007. The effect of sample size on shrinkage of a non scrim reinforced geosynthetic clay liner, 60th Canadian Geotechnical Conference, Ottawa, ON, 2123-2128.
Bowders, J.J., Daniel, D.E., Wellington, J. and Houssidas, V. 1997. Managing desiccation cracking in compacted clay
liners beneath geomembranes, Geosynthetics ’97, Long Beach, 527-540.
Brachman, R.W.I., Joshi, P., Rowe, R. K. and Gudina, S. 2011. Physical response of geomembrane wrinkles near GCL overlaps, Geo-Frontiers 2011, Dallas, 1152-1161.
Brachman, R.W.I, Gudina, S., Rowe, R.K. and Take, W.A. 2010. Adhesion from supplemental bentonite placed at GCL overlaps, 63rd Canadian Geotechnical Conference, Calgary, 1359-1364.
Brachman, R.W.I., Rowe, R.K., Arnepalli, D.N., Dickinson, S., Islam, Z. and Sabir, A. 2008. Development of an apparatus to simulate the ageing of geomembranes under chemical exposure, elevated temperatures and applied stresses, GEOAMERICAS 2008, Cancun, Mexico, 444-451.
Brachman, R.W.I., Rowe, R.K., Take, W.A., Arnepalli, D., Chappel, M., Bostwick, L. and Beddoe, R. 2007. Queen's geosynthetic liner site, 60th Can. Geotech. Conf., Ottawa, 2135-2142.
Brachman, R.W.I. and Gudina, S. 2008. Geomembrane strains and wrinkle deformations in a GM/GCL composite liner, Geotextiles and Geomembranes, 26(6): 488–497.
Calder, G.V. and Stark, T.D. 2010. Aluminum reactions and problems in municipal solid waste landfills, Practice Periodical of Hazardous, Toxic and Radioactive Waste Management, 14(4): 258-265.
Cartaud, F., Goblet, P. and Touze-Foltz, N. 2005. Numerical simulation of the flow in the interface of a composite bottom liner, Geotextiles and Geomembranes (December 2005), 23 (6), pg. 513-533.
Chappel, M.J., Brachman, R.W.I., Take, W.A. and Rowe, R.K. 2011. Large-scale quantification of wrinkles in a smooth, black, HDPE geomembrane, ASCE Journal of Geotechnical and Geoenvironmental Engineering (in press).
Chappel, M.J., Take, W.A., Brachman, R.W.I. and Rowe, R.K. 2008. A case study of wrinkles in a textured geomembrane on a slope, GEOAMERICAS 2008, Cancun, Mexico, 452-458.
Colucci, P. and Lavagnolo, M.C. 1995. Three years field experience in electrical control of synthetic landfill liners, 5th International Landfill Symposium, Cagliari, 437-452.
Collins, H.J. 1993. Impact of the temperature inside the landfill on the behaviour of barrier systems, 4th International Landfill Symposium, S. Margherita di Pula: Cagliari, Italy, 417-432.
Cooley, B.H. and Daniel, D.E. 1995. Seam performance of overlapped geosynthetic clay liners. Geosynthetics ’95, Nashville, TN, USA, IFAI, St. Paul, MN, USA, 691-705.
Daniel, D.E., Trautwein, S.J. and Goswami, P. 1997. Measurement of hydraulic properties of GCLs using a flow box. In Testing and Acceptance Criteria for Geosynthetic Clay Liners, STP 1308 (ed. L. W. Well), American Society for Testing and Materials, West Conshohocken, Pennsylvania, USA. 196-207.
Daniel, D.E. and Koerner, R.M. 1995. Waste containment facilities: Guidance for construction, quality assurance
and quality control of liner and cover systems, ASCE, New York.
Daniel, D.E., Shan, H.Y. and Anderson J.D. 1993. Effects of Partial Wetting on the Performance of the Bentonite Component of a Geosynthetic Clay Liner, Proceedings Geosynthetics '93, Industrial Fabrics Association International, St. Paul, Minnesota, V. 3, 1993, pp. 1483-1496.
Dickinson, S. and Brachman, R.W.I. 2006. Deformations of a geosynthetic clay liner beneath a geomembrane wrinkle and coarse gravel. Geotextiles and Geomembranes. 24(5): 285-298.
Eberle, M.A. and von Maubeuge, K. 1997. Measuring the in-situ moisture content of geosynthetic clay liners (GCLs) using time domain reflectometry (TDR), 6th Int. Conf. on Geosynthetics, Atlanta, 1: 205-210. Estornell, P.M. and Daniel, D.E. 1992. Hydraulic
conductivity of three Geosynthetic Clay Liners, Journal of Geotechnical Engineering, ASCE 118(10): 1592-1606.
Giroud, J.P. 1997. Equations for calculating the rate of liquid migration through composite liners due to geomembrane defects, Geosynthetics International, 4 (3-4): 335-348.
Giroud, J.P. (1995) Wrinkle management for polyethylene geomembranes requires active approach, Geotechnical Fabrics Report, 13(3): 14-17.
Giroud, J.P. and Bonaparte, R. 2001. Geosynthetics in liquid-containing structures, Chapter 26 of Geotechnical and Geoenvironmental Engineering Handbook, Kluwer Academic Publishing, Norwell, 789-824.
Giroud, J.P. and Bonaparte, R. 1989a. Leakage through liners constructed with geomembranes - Part I: Geomembrane liners, Geotextiles and Geomembranes, 8: 27-68.
Giroud, J.P. and Bonaparte, R. 1989b Leakage through liners constructed with geomembranes - Part II: Composite liners, Geotextiles and Geomembranes, 8: 71-112.
Giroud, J.P. and Morel, N. 1992. Analysis of geomembrane wrinkles, Geotextiles and Geomembranes, 11(3): 255-276 (Erratum: 12(4): 378).
Giroud, J.P. and Peggs, I.D. 1990. Geomembrane construction quality assurance, Waste Containment Systems: Construction, Regulation and Performance, ASCE Geotechnical Special Publication No. 26, R. Bonaparte (Ed.), pp. 190-225.
Gudina, S., Brachman, R.W.I. 2006. Physical response of geomembrane wrinkles overlying compacted clay, Journal of Geotechnical and Geoenvironmental Engineering, ASCE, 132(10):1346-1353.
Harpur, W.A., Wilson-Fahmy, R.F. and Koerner, R.F. 1993. Evaluation of the contact between geosynthetic clay liners and geomembranes in terms of transmissivity, geosynthetic liner systems: innovations, concerns and design. In: Koerner, Wilson-Fahmy (Eds.), Proceedings of a Geosynthetic Liner Systems Seminar held in Philadelphia, USA, pp. 143–154.
Hoor, A. and Rowe, R.K. 2011. Application of Thermal Insulation in Landfill Liners, Geo-Frontiers 2011, Dallas, March 2011, 1034-1044.
Hsuan Y.G. and Koerner R.M. 1998. Antioxidant depletion lifetime in high density polyethylene geomembranes. Journal of Geotechnical and Geoenvironmental Engineering ASCE 124(6): 532-541.
James, A., Fullerton, D. and Drake, R. 1997. Field performance of GCL under ion exchange conditions. Journal of Geotechnical and Geoenvironmental Engineering, ASCE 123: 897-901.
Jo, H., Benson, C. and Edil, T. 2004. Hydraulic conductivity and cation exchange in non-prehydrated and prehydrated bentonite permeated with weak inorganic single salt solutions, Clays and Clay Minerals, 52(6): 661-679.
Jo, H., Katsumi, T., Benson, C. and Edit, T. 2001. Hydraulic conductivity and swelling of non-prehydrated GCLs permeated with single species salt solutions, Journal of Geotechnical and Geoenvironmental Engineering, ASCE, 132(10): 1346-1353.
Joshi, P., Brachman, R.W.I. and Rowe, R.K. 2011. Heat-tacked overlap strength of four GCLs, 2011 Pan-Am and CGS Conference, Toronto, October.
Koerner, R.M. and Koerner, G.R. 2005a. InSitu separation of GCL panels beneath exposed geomembranes, Geotechnical Fabrics Report, June-July 2005: 34-39. Koerner, K.R. and Koerner, R.M., 2005b. GRI White Paper
#5 on In-Situ Separation of GCL Panels Beneath Exposed Geomembranes, Geosynthetic Research Institute.
Koerner, G.R., Eith, A.W., Tanese, M. 1999. Properties of exhumed HDPE field waves, Geotextiles and Geomembranes, 17(4): 247-261.
Kolstad, D., Benson, C. and Edil, T. 2004. Hydraulic conductivity and swell of non-prehydrated GCLs permeated with multispecies inorganic solutions, Journal of Geotechnical and Geoenvironmental Engineering, ASCE, 130(12): 1236-1249.
Lange, K., Rowe, R.K. and Jamieson, H. 2010. The potential role of geosynthetic clay liners in mine water treatment systems, Geotextiles and Geomembranes, 28(2): 199-205.
Meer, S. and Benson, C. 2007. Hydraulic conductivity of geosynthetic clay liners exhumed from landfill final covers, Journal of Geotechnical and Geoenvironmental Engineering, ASCE, 133(5): 550-563.
Melchior, S. 1997. In-situ studies on the performance of landfill caps. International Containment Technology Conference, Florida State University, Talahhassee, FL, 365-373.
Mendes, M.J.A., Touz-Foltz, N., Palmeira, E.M. and Pierson, P. 2010. Influence of structural and material properties of GCLs on interface flow in composite liners due to geomembrane defects. Geosynthetics International, 17(1): 34-47.
Müller, W. 2007. HDPE Geomembranes in Geotechnics, Springer-Verlag, Berlin Heidelberg.
Musso, M. and Pejon, O.J. 2010. Hydraulic conductivity and chemical performance of Brazilian geosynthetic clay liner (GCL) using KCl and CuCl2 solutions, 9th International Conference on Geosynthetics, Brazil: 1035-1038.
Needham, A. and Knox, K. 2008. Long-term basal temperatures at Beddington farmlands landfill and temperature influences on HDPE liner service life, proceedings EuroGeo4, Paper number 325, 7p.
Nosko, V. and Touze-Foltz, N. 2000. Geomembrane liner failure: Modeling of its influence on contaminant transfer, 2nd European Geosynthetics Conference, Bologna, Italy: 557-560.
Ontario Ministry of the Environment (1998) Landfill standards: a guideline on the regulatory and approval requirements for the new or expanding landfilling sites, Ontario Ministry of the Environment, Ontario Regulation 232/98. Queen’s Printer for Ontario, Toronto.
Pelte, T., Pierson, P. and Gourc, J.P. 1994. Thermal analysis of geomembranes exposed to solar radiation, Geosynthetics International, 1(1), 21-44.
Petrov, R.J., Rowe, R.K. and Quigley, R.M. 1997. Selected factors influencing GCL hydraulic conductivity, Journal of Geotechnical and Geoenvironmental Engineering, ASCE, 123 (8): 683-695.
Petrov, R.J. and Rowe, R.K. 1997. Geosynthetic clay liner compatibility by hydraulic conductivity testing: Factors impacting performance, Canadian Geotechnical Journal, 34(6):863-885.
Rad, N.S., Jacobson, B.D. and Bachus, R.C. 1994. Compatibility of geosynthetic clay liners with organic and inorganic permeants, Proceedings of 5th International Conference on Geosynthetics, Singapore, 1165-1168.
Rayhani, M.T., Rowe, R.K., Brachman, R.W.I., Take, W.A. and Siemens, G. 2011. Factors affecting GCL hydration under isothermal conditions, Geotextiles and Geomembranes, 29(6) (in press).
Rowe, R.K. 1998. Geosynthetics and the minimization of contaminant migration through barrier systems beneath solid waste, 6th International Conference on Geosynthetics, Atlanta, Industrial Fabrics Association International, St. Paul, USA, 27-103.
Rowe, R.K. 2005. Long-term performance of contaminant barrier systems, 45th Rankine Lecture, Geotechnique, 55(9):631-678.
Rowe, R.K. 2007. Advances and remaining challenges for geosynthetics in geoenvironmental engineering applications, 23rd Manual Rocha Lecture, Soils and Rocks, 30(1) (3-30).
Rowe, R.K. and Hoor, A. 2009. Predicted temperatures and service lives of secondary geomembrane landfill liners, Geosynthetics International, 16(2): 71-82.
Rowe, R.K. and Hosney, M.S. 2010. A systems engineering approach to minimizing leachate leakage from landfills, 9th International Conference on Geosynthetics, Guaruja, Brazil, 501-510.
Rowe, R.K. and Islam, M.Z. 2009. Impact on landfill liner time-temperature history on the service-life of HDPE geomembranes, Waste Management, 29(10): 2689-2699.
Rowe, R.K. and Orsini, C. 2003. Effect of GCL and subgrade type on internal erosion in GCLs, Geotextiles and Geomembrane, 21(1):1-24.
Rowe, R.K. and Rimal, S. 2008a. Depletion of antioxidants from an HDPE geomembrane in a composite liner, ASCE Journal of Geotechnical and Geoenvironmental Engineering, 134(1):68-78.
Rowe, R.K. and Rimal, S. 2008b. Ageing of HDPE geomembrane in three composite liner configurations, ASCE Journal of Geotechnical and Geoenvironmental Engineering, 134(7): 906-916.
Rowe, R.K., Bostwick, L.E. and Take, W.A. 2011a. Effect of GCL properties on shrinkage when subjected to wet-dry cycles, ASCE Journal of Geotechnical and Geoenvironmental Engineering, (Accepted 8/2/11; GTENG-1188,doi:10.1061/(ASCE)GT.1943-5606.00005 22).
Rowe, R.K., Chappel, M.J., Take, W.A. and Brachman, R.W.I. 2011b. A Field study of wrinkles in a geomembrane at a composite liner test site (in review).
Rowe, R.K. Rayhani, M.T. Take, W.A. Siemens, G. and Brachman, R.W.I. 2011c. GCL Hydration under Simulated Daily Thermal Cycles, Geosynthetics International (in press).
Rowe, R.K., Bostwick, L.E. and Thiel, R. 2010a. Shrinkage characteristics of heat-tacked GCL seams, Geotextiles and Geomembranes, 28(4):352-359.
Rowe, R.K., Islam, M.Z. and Hsuan, Y.G. 2010b. Effect of thickness on the ageing of HDPE geomembranes, ASCE Journal of Geotechnical and Geoenvironmental Engineering, 136(2): 299-309
Rowe, R.K., Islam, M.Z., Brachman, R.W.I., Arnepalli, D.N. and Ewais, A. 2010c. Antioxidant depletion from an HDPE geomembrane under simulated landfill conditions, ASCE Journal of Geotechnical and Geoenvironmental Engineering, 136:(7): 930-939.
Rowe, R.K., Hoor, A. and Pollard, A. 2010d. Examination of a method for reducing the temperature of MSW landfill liners, ASCE Journal of Environmental Engineering, 136(8): 794-803.
Rowe, R.K., Bostwick, L.E. and Thiel, R. 2009a. GCL Shrinkage and the potential benefits of heat-tacked GCL seams. Geosynthetics ’09, IFAI, Salt Lake City, Utah, USA, pp. 10-18.
Rowe, R.K., Rimal, S. and Sangam, H.P. 2009b. Ageing of HDPE geomembrane exposed to air, water and leachate at different temperatures, Geotextiles and Geomembranes, 27(2): 131-151.
Rowe, R.K., Islam, M.Z. and Hsuan, Y.G. 2008. Leachate chemical composition effects on OIT depletion in HDPE geomembranes, Geosynthetics International, 15(2): 136-151
Rowe, R.K., Quigley, R.M., Brachman, R.W.I. and Booker, J.R. 2004. Barrier Systems for Waste Disposal Facilities, Taylor & Francis Books Ltd (E & FN Spon) London, 587p.
Rowe, R.K., Sangam, H.P. and Lake, C.B. 2003. Evaluation of an HDPE geomembrane after 14 years as a leachate lagoon liner, Canadian Geotechnical Journal, 40(3): 536-550.
Ruhl, J.L. and Daniel, D.E. 1997. Geosynthetic clay liners permeated with chemical solutions and leachates, Journal of Geotechnical and Geoenvironmental Engineering, ASCE, 123(4): 369-380.
Scalia, J. and Benson, C. 2011. Hydraulic conductivity of geosynthetic clay liners exhumed from landfill final covers with composite barriers, Journal of Geotechnical and Geoenvironmental Engineering, ASCE, 137(1): 1-13.
Shackelford, C., Benson, C., Katsumi, T. and Edil, T. 2000. Evaluating the hydraulic conductivity of GCLs permeated with non-standard liquids, Geotextiles and Geomembranes, 18(2-3): 133-161.
Soong, T.Y. and Koerner, R.M. 1998. Laboratory study of high density polyethylene geomembrane waves, 6th International Conference on Geosynthetics, Atlanta, GA, USA Vol. 1 301-306.
Southen, J.M. and Rowe, R.K. 2011. Numerical modelling of thermally induced desiccation of geosynthetic clay liners observed in laboratory experiments, Geosynthetics International (in press).
Southen, J.M. and Rowe, R.K., 2005. Laboratory investigation of geosynthetic clay liner desiccation in a composite liner subjected to thermal gradients, Journal of Geotechnical and Geoenvironmental Engineering, ASCE, 131: 925-935.
Stark, T.D. 1998. Bentonite Migration in Geosynthetic Clay Liners, 6th International Conference on Geosynthetics, Atlanta, Industrial Fabrics Association International.
Stark, T.D., Martin, J.W., Gerbasi, G.T., Thalhamer, T. and Gortner, R.E., 2011. Aluminum waste reaction indicators in a subtitle D landfill, ASCE Journal of Geotechnical and Geoenvironmental Engineering (in press).
Stone, J.L. 1984. Leakage monitoring of the geomembrane for proton decay experiment, International Conference on Geomembranes, Denver, USA, 475-480.
Take, W.A., Chappel, M.J., Brachman, R.W.I. and Rowe, R.K. 2007. Quantifying geomembrane wrinkles using aerial photography and digital image processing, Geosynthetics International, 14(4): 219-227.
Thiel, R. and Richardson, G. 2005. Concern for GCL shrinkage when installed on slopes, GRI-18 at GeoFrontiers, GII Publications, Folsom, PA, USA, paper 2.31.
Thiel, R. and Rowe, R.K. 2010. Technical developments related to the problem of GCL panel shrinkage when placed below an exposed geomembrane, 3rd International Symposium on GCLs, Würzburg, Germany, September 2010, 93-102.
Thiel, R. and Thiel, C. 2009. GCL Shrinkage - A Possible Solution, GFR, V27N1, Feb-Mar 2009, 10-21.
Thiel, R., Giroud, J.P., Erickson, R., Criley, K. and Bryk, J. 2006. Laboratory measurements of GCL shrinkage under cyclic changes in temperature and hydration conditions, 8th International Conference on Geosynthetics, Yokohama, Japan 1: 21-44.
Touze-Foltz, N., Schmittbuhl, J. and Memier, M. 2001. Geometric and spatial parameters of geomembrane wrinkles on large scale model tests, Geosynthetics 2001, Portland, USA, 715-728.
Zhou, Y. and Rowe, R.K. 2003. Development of a technique for modelling clay liner desiccation. International Journal for Numerical and Analytical Methods in Geomechanics, 27(6): 473-493.