Embed Size (px)
Citation preview
Assessing Geometry of Rock Masses using Static and Mobile LiDAR Scanning Matthew J. Lato Norwegian Geotechnical Institute, Oslo, Norway Rob Harrap, Jean Hutchinson & Mark Diederichs Queen’s University, Dept. Geological Science and Geological Engineering, Canada Derek Martin University of Alberta, Dept. Civil & Environmental Engineering, Canada ABSTRACT Transportation corridor management is regularly performed for evaluation of road conditions, hazards, and planning, and is traditionally based on the manual inspection of the corridors. Recent research projects have evaluated advanced remote sensing technologies, such as LiDAR and photogrammetry, to replace preliminary field evaluations with desktop studies through evaluation of 3d sensor data. This research has demonstrated the applicability of both static and mobile terrestrial LiDAR to improving transportation corridor management systems. Through rapid deployment in combination with versatile scanning techniques and data processing options, LiDAR has become a state-of-the-art technology for transportation corridor analysis and management. LiDAR data can be used for rockmass evaluation, change detection, rockfall hazard evaluation, as well as numerous standard survey measurements. RÉSUMÉ La gestion des corridors de transport est effectuée regulièrement par les ministères de transport pour évaluer l'état des routes, les risques, et pour la planification. Traditionellement, ces activités ont été faites par une inspection manuelle des corridors. Certains récents projets de recherche à grande échelle au Canada et à l'étranger ont évalué les technologies de la télédétection de pointe, tels que le LiDAR et la photogrammétrie, afin de remplacer les évaluations préliminaires menées sur le terrain avec l'évaluation des données à l'ordinateur. Les résultats de cette recherche ont démontré l'applicabilité du LiDAR statique et du LiDAR mobile terrestre à l'amélioration des systèmes de gestion des corridors de transport. La combinaison de sa deploiement rapide, ses moyens d'auscultation polyvalents, et plusieurs options pour la traitement des données a permis au LiDAR de devenir une technologie de pointe pour l'analyse et la gestion des corridors de transport. Les données du LiDAR peuvent être utilisées pour l'évaluation de masses rocheuses, la détection automatisée des changements, l'évaluation du danger d'une chute de pierres, ainsi que pour effectuer de nombreuses mesures d'arpentage standards. 1 INTRODUCTION Rapid safe techniques for assessing rockmass quality are required by organizations that must maintain infrastructure adjacent to steep rock slopes. High and steep rock slopes contain abundant faces that cannot be accurately measured using traditional field based approaches to determine fracture orientation and geometry, and some slopes are simply not safe to approach. Safe techniques that provide accurate results at reduced cost compared to current practices are desirable, whether savings are due to field efficiency or reduced secondary costs. Photogrammetric and laser scanning methods allow determination of geometries from a distance, although with some question of accuracy and how results compare to traditional methods. LiDAR scanning, where distances are measured by scanning an area of interest with a distance-ranging laser beam, can capture rock mass geometry at a range of accuracies from both static – tripod, and mobile – vehicle, platforms. Recently several LiDAR systems that place scanners on ground vehicles coupled with inertial and GPS navigation have become available, offering the potential to capture LiDAR point
clouds at flow-of-traffic speeds and then post-process these to determine rock mass geometry and zones of potential instability. Different sensors and different platform configurations influence both what is seen, since the LiDAR will sample points orthogonal to the beam direction disproportionately, and what the point density on a surface of interest is, which profoundly influences what can be resolved and with what accuracy.
Workflows developed by Lato, (2009) allow accurate determination of geometries using short and medium range static LiDAR scanners as well as from high-speed mobile systems such as the Terrapoint TITAN scanning system. These workflows incorporate scale-dependent face capture, stereonet preparation, and change-detection when multiple scans over a suitable time period are available. We are now working to assess the accuracy of LiDAR systems and workflows as a step towards using LiDAR-based regional corridor assessment for Canadian railway corridors. This includes assessment of the geometric accuracy of LiDAR scanners under different geometric, environmental, and target conditions, analysis of the stability of workflows under widely varying data density and accuracy conditions, and development of in-
situ-target based operational assessment methods for future scanning work. We present an overview of our recent research including a summary of tools, workflows, and preliminary operational recommendations.
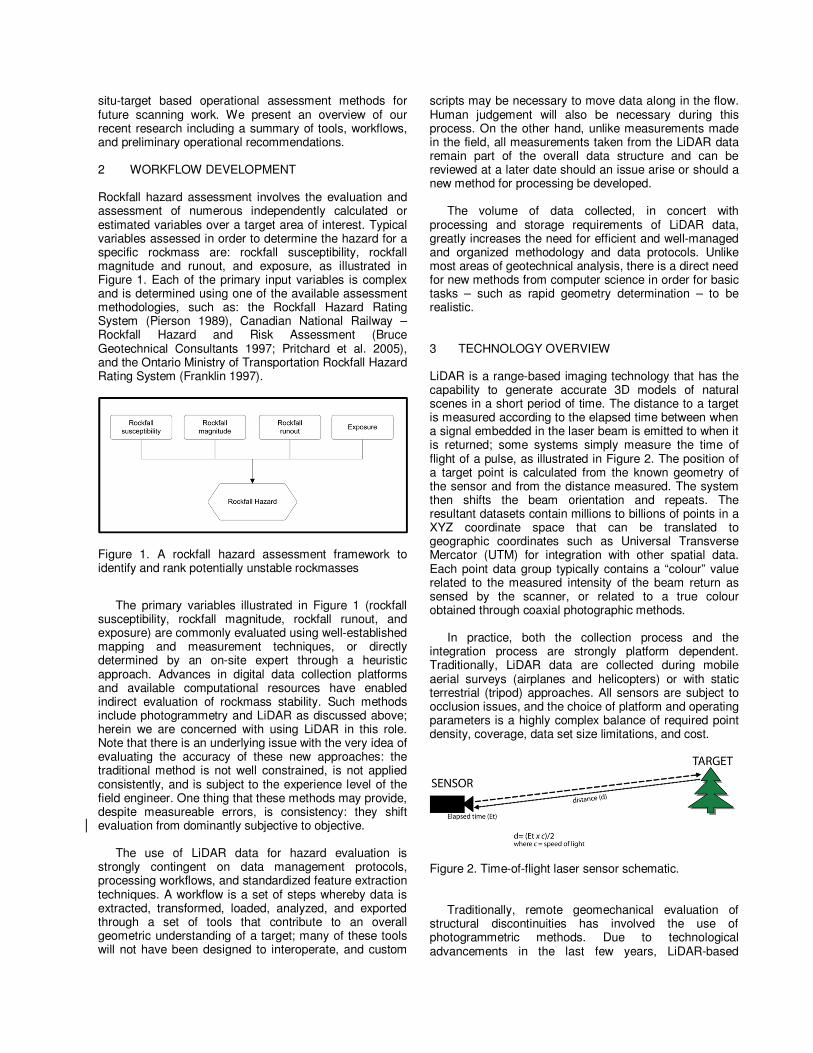
2 WORKFLOW DEVELOPMENT Rockfall hazard assessment involves the evaluation and assessment of numerous independently calculated or estimated variables over a target area of interest. Typical variables assessed in order to determine the hazard for a specific rockmass are: rockfall susceptibility, rockfall magnitude and runout, and exposure, as illustrated in Figure 1. Each of the primary input variables is complex and is determined using one of the available assessment methodologies, such as: the Rockfall Hazard Rating System (Pierson 1989), Canadian National Railway – Rockfall Hazard and Risk Assessment (Bruce Geotechnical Consultants 1997; Pritchard et al. 2005), and the Ontario Ministry of Transportation Rockfall Hazard Rating System (Franklin 1997).
Figure 1. A rockfall hazard assessment framework to identify and rank potentially unstable rockmasses
The primary variables illustrated in Figure 1 (rockfall
susceptibility, rockfall magnitude, rockfall runout, and exposure) are commonly evaluated using well-established mapping and measurement techniques, or directly determined by an on-site expert through a heuristic approach. Advances in digital data collection platforms and available computational resources have enabled indirect evaluation of rockmass stability. Such methods include photogrammetry and LiDAR as discussed above; herein we are concerned with using LiDAR in this role. Note that there is an underlying issue with the very idea of evaluating the accuracy of these new approaches: the traditional method is not well constrained, is not applied consistently, and is subject to the experience level of the field engineer. One thing that these methods may provide, despite measureable errors, is consistency: they shift evaluation from dominantly subjective to objective.
The use of LiDAR data for hazard evaluation is
strongly contingent on data management protocols, processing workflows, and standardized feature extraction techniques. A workflow is a set of steps whereby data is extracted, transformed, loaded, analyzed, and exported through a set of tools that contribute to an overall geometric understanding of a target; many of these tools will not have been designed to interoperate, and custom
scripts may be necessary to move data along in the flow. Human judgement will also be necessary during this process. On the other hand, unlike measurements made in the field, all measurements taken from the LiDAR data remain part of the overall data structure and can be reviewed at a later date should an issue arise or should a new method for processing be developed.
The volume of data collected, in concert with
processing and storage requirements of LiDAR data, greatly increases the need for efficient and well-managed and organized methodology and data protocols. Unlike most areas of geotechnical analysis, there is a direct need for new methods from computer science in order for basic tasks – such as rapid geometry determination – to be realistic.
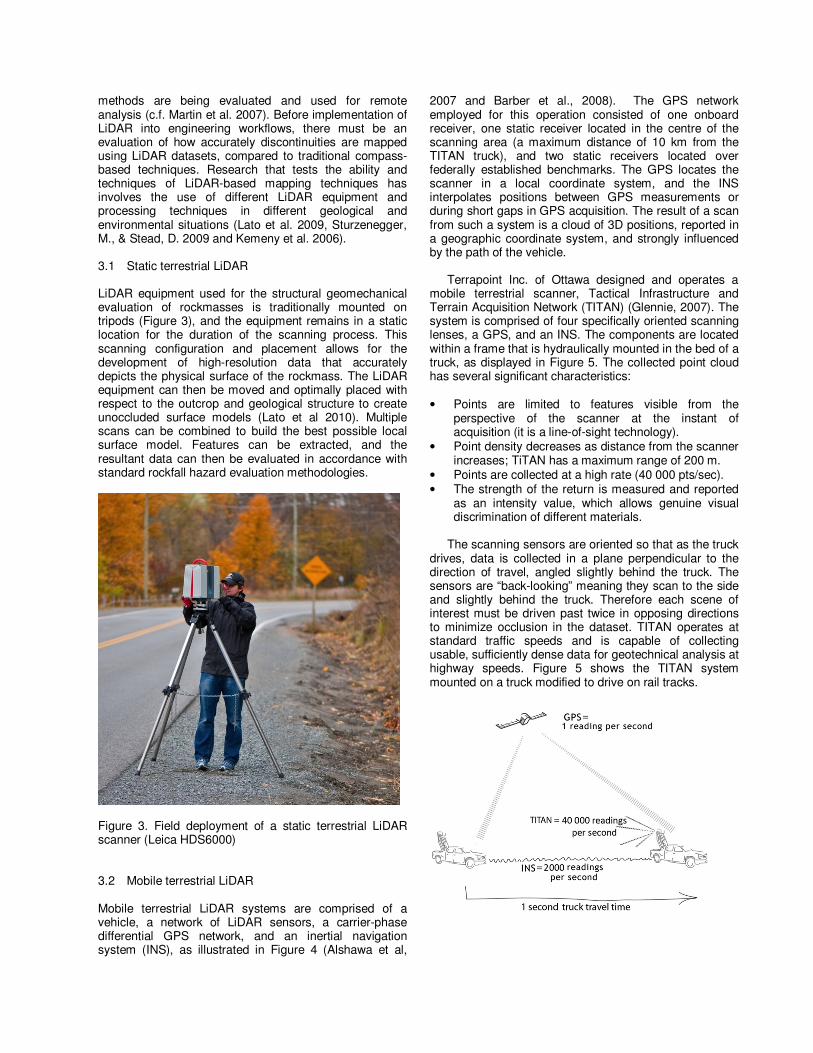
3 TECHNOLOGY OVERVIEW LiDAR is a range-based imaging technology that has the capability to generate accurate 3D models of natural scenes in a short period of time. The distance to a target is measured according to the elapsed time between when a signal embedded in the laser beam is emitted to when it is returned; some systems simply measure the time of flight of a pulse, as illustrated in Figure 2. The position of a target point is calculated from the known geometry of the sensor and from the distance measured. The system then shifts the beam orientation and repeats. The resultant datasets contain millions to billions of points in a XYZ coordinate space that can be translated to geographic coordinates such as Universal Transverse Mercator (UTM) for integration with other spatial data. Each point data group typically contains a “colour” value related to the measured intensity of the beam return as sensed by the scanner, or related to a true colour obtained through coaxial photographic methods.
In practice, both the collection process and the integration process are strongly platform dependent. Traditionally, LiDAR data are collected during mobile aerial surveys (airplanes and helicopters) or with static terrestrial (tripod) approaches. All sensors are subject to occlusion issues, and the choice of platform and operating parameters is a highly complex balance of required point density, coverage, data set size limitations, and cost.
Figure 2. Time-of-flight laser sensor schematic.
Traditionally, remote geomechanical evaluation of structural discontinuities has involved the use of photogrammetric methods. Due to technological advancements in the last few years, LiDAR-based
methods are being evaluated and used for remote analysis (c.f. Martin et al. 2007). Before implementation of LiDAR into engineering workflows, there must be an evaluation of how accurately discontinuities are mapped using LiDAR datasets, compared to traditional compass-based techniques. Research that tests the ability and techniques of LiDAR-based mapping techniques has involves the use of different LiDAR equipment and processing techniques in different geological and environmental situations (Lato et al. 2009, Sturzenegger, M., & Stead, D. 2009 and Kemeny et al. 2006). 3.1 Static terrestrial LiDAR LiDAR equipment used for the structural geomechanical evaluation of rockmasses is traditionally mounted on tripods (Figure 3), and the equipment remains in a static location for the duration of the scanning process. This scanning configuration and placement allows for the development of high-resolution data that accurately depicts the physical surface of the rockmass. The LiDAR equipment can then be moved and optimally placed with respect to the outcrop and geological structure to create unoccluded surface models (Lato et al 2010). Multiple scans can be combined to build the best possible local surface model. Features can be extracted, and the resultant data can then be evaluated in accordance with standard rockfall hazard evaluation methodologies.
Figure 3. Field deployment of a static terrestrial LiDAR scanner (Leica HDS6000) 3.2 Mobile terrestrial LiDAR Mobile terrestrial LiDAR systems are comprised of a vehicle, a network of LiDAR sensors, a carrier-phase differential GPS network, and an inertial navigation system (INS), as illustrated in Figure 4 (Alshawa et al,
2007 and Barber et al., 2008). The GPS network employed for this operation consisted of one onboard receiver, one static receiver located in the centre of the scanning area (a maximum distance of 10 km from the TITAN truck), and two static receivers located over federally established benchmarks. The GPS locates the scanner in a local coordinate system, and the INS interpolates positions between GPS measurements or during short gaps in GPS acquisition. The result of a scan from such a system is a cloud of 3D positions, reported in a geographic coordinate system, and strongly influenced by the path of the vehicle.
Terrapoint Inc. of Ottawa designed and operates a mobile terrestrial scanner, Tactical Infrastructure and Terrain Acquisition Network (TITAN) (Glennie, 2007). The system is comprised of four specifically oriented scanning lenses, a GPS, and an INS. The components are located within a frame that is hydraulically mounted in the bed of a truck, as displayed in Figure 5. The collected point cloud has several significant characteristics:
• Points are limited to features visible from the
perspective of the scanner at the instant of acquisition (it is a line-of-sight technology).
• Point density decreases as distance from the scanner increases; TiTAN has a maximum range of 200 m.
• Points are collected at a high rate (40 000 pts/sec). • The strength of the return is measured and reported
as an intensity value, which allows genuine visual discrimination of different materials.
The scanning sensors are oriented so that as the truck
drives, data is collected in a plane perpendicular to the direction of travel, angled slightly behind the truck. The sensors are “back-looking” meaning they scan to the side and slightly behind the truck. Therefore each scene of interest must be driven past twice in opposing directions to minimize occlusion in the dataset. TITAN operates at standard traffic speeds and is capable of collecting usable, sufficiently dense data for geotechnical analysis at highway speeds. Figure 5 shows the TITAN system mounted on a truck modified to drive on rail tracks.
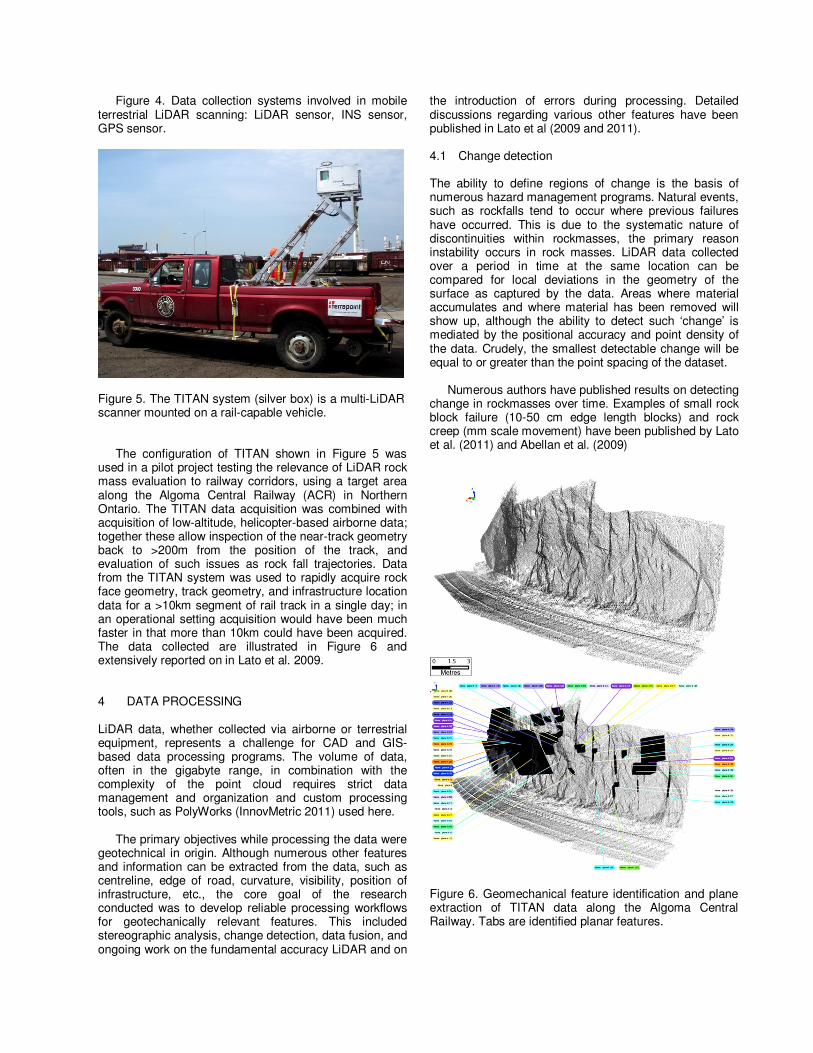
Figure 4. Data collection systems involved in mobile terrestrial LiDAR scanning: LiDAR sensor, INS sensor, GPS sensor.
Figure 5. The TITAN system (silver box) is a multi-LiDAR scanner mounted on a rail-capable vehicle.
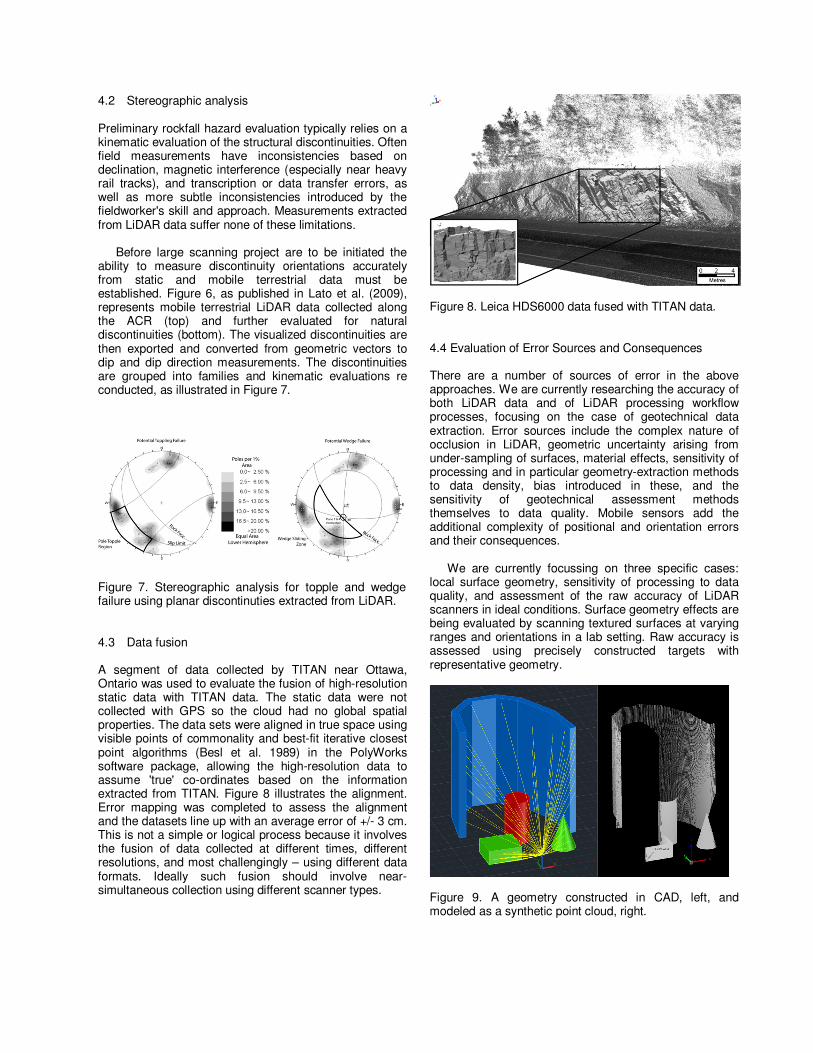
The configuration of TITAN shown in Figure 5 was used in a pilot project testing the relevance of LiDAR rock mass evaluation to railway corridors, using a target area along the Algoma Central Railway (ACR) in Northern Ontario. The TITAN data acquisition was combined with acquisition of low-altitude, helicopter-based airborne data; together these allow inspection of the near-track geometry back to >200m from the position of the track, and evaluation of such issues as rock fall trajectories. Data from the TITAN system was used to rapidly acquire rock face geometry, track geometry, and infrastructure location data for a >10km segment of rail track in a single day; in an operational setting acquisition would have been much faster in that more than 10km could have been acquired. The data collected are illustrated in Figure 6 and extensively reported on in Lato et al. 2009. 4 DATA PROCESSING LiDAR data, whether collected via airborne or terrestrial equipment, represents a challenge for CAD and GIS- based data processing programs. The volume of data, often in the gigabyte range, in combination with the complexity of the point cloud requires strict data management and organization and custom processing tools, such as PolyWorks (InnovMetric 2011) used here.
The primary objectives while processing the data were geotechnical in origin. Although numerous other features and information can be extracted from the data, such as centreline, edge of road, curvature, visibility, position of infrastructure, etc., the core goal of the research conducted was to develop reliable processing workflows for geotechanically relevant features. This included stereographic analysis, change detection, data fusion, and ongoing work on the fundamental accuracy LiDAR and on
the introduction of errors during processing. Detailed discussions regarding various other features have been published in Lato et al (2009 and 2011). 4.1 Change detection The ability to define regions of change is the basis of numerous hazard management programs. Natural events, such as rockfalls tend to occur where previous failures have occurred. This is due to the systematic nature of discontinuities within rockmasses, the primary reason instability occurs in rock masses. LiDAR data collected over a period in time at the same location can be compared for local deviations in the geometry of the surface as captured by the data. Areas where material accumulates and where material has been removed will show up, although the ability to detect such ‘change’ is mediated by the positional accuracy and point density of the data. Crudely, the smallest detectable change will be equal to or greater than the point spacing of the dataset.
Numerous authors have published results on detecting change in rockmasses over time. Examples of small rock block failure (10-50 cm edge length blocks) and rock creep (mm scale movement) have been published by Lato et al. (2011) and Abellan et al. (2009)
Figure 6. Geomechanical feature identification and plane extraction of TITAN data along the Algoma Central Railway. Tabs are identified planar features.
4.2 Stereographic analysis Preliminary rockfall hazard evaluation typically relies on a kinematic evaluation of the structural discontinuities. Often field measurements have inconsistencies based on declination, magnetic interference (especially near heavy rail tracks), and transcription or data transfer errors, as well as more subtle inconsistencies introduced by the fieldworker's skill and approach. Measurements extracted from LiDAR data suffer none of these limitations.
Before large scanning project are to be initiated the
ability to measure discontinuity orientations accurately from static and mobile terrestrial data must be established. Figure 6, as published in Lato et al. (2009), represents mobile terrestrial LiDAR data collected along the ACR (top) and further evaluated for natural discontinuities (bottom). The visualized discontinuities are then exported and converted from geometric vectors to dip and dip direction measurements. The discontinuities are grouped into families and kinematic evaluations re conducted, as illustrated in Figure 7.
Figure 7. Stereographic analysis for topple and wedge failure using planar discontinuties extracted from LiDAR. 4.3 Data fusion A segment of data collected by TITAN near Ottawa, Ontario was used to evaluate the fusion of high-resolution static data with TITAN data. The static data were not collected with GPS so the cloud had no global spatial properties. The data sets were aligned in true space using visible points of commonality and best-fit iterative closest point algorithms (Besl et al. 1989) in the PolyWorks software package, allowing the high-resolution data to assume 'true' co-ordinates based on the information extracted from TITAN. Figure 8 illustrates the alignment. Error mapping was completed to assess the alignment and the datasets line up with an average error of +/- 3 cm. This is not a simple or logical process because it involves the fusion of data collected at different times, different resolutions, and most challengingly – using different data formats. Ideally such fusion should involve near-simultaneous collection using different scanner types.
Figure 8. Leica HDS6000 data fused with TITAN data. 4.4 Evaluation of Error Sources and Consequences There are a number of sources of error in the above approaches. We are currently researching the accuracy of both LiDAR data and of LiDAR processing workflow processes, focusing on the case of geotechnical data extraction. Error sources include the complex nature of occlusion in LiDAR, geometric uncertainty arising from under-sampling of surfaces, material effects, sensitivity of processing and in particular geometry-extraction methods to data density, bias introduced in these, and the sensitivity of geotechnical assessment methods themselves to data quality. Mobile sensors add the additional complexity of positional and orientation errors and their consequences.
We are currently focussing on three specific cases: local surface geometry, sensitivity of processing to data quality, and assessment of the raw accuracy of LiDAR scanners in ideal conditions. Surface geometry effects are being evaluated by scanning textured surfaces at varying ranges and orientations in a lab setting. Raw accuracy is assessed using precisely constructed targets with representative geometry.
Figure 9. A geometry constructed in CAD, left, and modeled as a synthetic point cloud, right.
Sensitivity to processing is being studied via simulation: we have built a tool that builds synthetic point clouds with no error from CAD models, as shown in Figure 9. The simulation includes both object interaction with a simulated beam and occlusion effects; the resulting clouds can be precisely modified to introduce known errors. These varying point clouds, fed into geotechnical analysis, reveal the degree to which the analytical workflows developed in earlier research are sensitive to data quality. Our goal is to introduce not only best practices for processing but also the use of simple on-site targets during data acquisition to provide reliable estimates of accuracy under current operating conditions. 5 DISCUSSION The use of photogrammetric or LiDAR methods in geotechnical rock mass evaluation is an emerging area both in research and in practice. It introduces new approaches that may be safer, more consistent, and more accurate than previous field-based evaluation methods. Combination of multiple methods, for example combining airborne and terrestrial LiDAR, or coupling photogrammetric analysis to LiDAR surface models, is an area of active research and likely to further extend the reach and reliability of these new methods. The value of multi-dataset fusion is that multiple hazards can be evaluated in concert: for example, airborne LiDAR can be used to constrain rock fall trajectories (Lan and Martin 2009) on larger slopes while track-based data evaluates the along-track environment as discussed herein.
The new methods introduced here are not without issue: a great deal of human judgement is needed to assess how to scan a particular rock mass, how to process the LiDAR and subsequently the geometric data, how to assess the reliability of this data, and especially how to compare it to rock mass evaluations determined by other methods. There is a danger, as new methods proliferate, that we will end up with a number of evaluation schemes and criteria that cannot be easily or meaningfully compared. On the other hand, detailed analysis of LiDAR accuracy and careful case studies on real field sites using multiple methods will together constrain how LiDAR fits into the suite of tools available to engineers faced with problematic slopes. 6 CONCLUSIONS Research described above highlights the use of LiDAR to characterize rock masses along transportation corridors. This research show that LiDAR provides information that in many cases is very difficult, if not impossible, to capture using traditional field methods. We show that changes in surface geometry over time can be meaningfully delineated, rock mass geometry can be assessed, and that data from multiple scanners and multiple methods can be integrated for key areas. We introduce ongoing work on the fundamental accuracy of LiDAR scanners, on
errors introduced during processing, and on consequent reliability of geometric measures derived through these.
As the national and international interest in using LiDAR equipment and data increases, the importance of understanding the data, how processing effects the data, and accuracy of the derived results is critical. LiDAR is widely accepted as a state-of-the-art approach for rapid measurement and imaging, and through research such as the program sponsored through the RGHRP, state-of-practice engineering applications will evolve that directly exploit the immense potential of LiDAR. 7 ACKNOWLEDGEMENTS The research funding for this project has been supplied by GEOIDE, NSERC, PREA, and the Canadian Railway Ground Hazard Research Program. The authors would like to thank Terrapoint for data collection and data processing assistance. REFERENCES Abellan, A, M Jaboyedoff, T Oppikofer, and J M Vilaplana
(2009). Detection of millimetric deformation using a terrestrial laser scanner: experiment and application to a rockfall event. Natural Hazards and Earth System Sciences 9: 365-372.
Alshawa, M., Smigiel, E., Grussenmeyer, P., & Landes, T. (2007). Integration of a terrestrial LiDAR on a mobile mapping platform: first experiences. 5th International Symposium on Mobile Mapping Technology, (p. 6). Italy.
Amann, M.-C., Bosch, T., Myllyla, R., & Rioux, M. (2001). Laser ranging: a critical review of usual techniques for distance measurement. Optical Engineering, 40(1) , 10 19.
Barber, D., Mills, J., & Smith-Voysey, S. (2008). Geometric validation of a ground-based mobile laser scanning system. Journal of Photogrammetry and Remote Sensing, 63, 128-141.
Besl, P J, N D McKay. (1989). A method for registration of 3D shapes. IEEE Transactions on Pattern Analysis and Machine Intelligence 14, 239-256
Bruce Geotechnical Consultants Inc. in association with Oboni Associates Inc. (1997). Canadian National Railway Rockfall Hazard and Risk Assessment System. Field Implementation Manual.
Franklin, J. A., & Senior, S. A. (1997). Outline of RHRON, the Ontario rockfall hazard rating system. Proc. of the International Symposium on Engineering Geology and the Environment, pp. 647-656. Athens, Greece.
Glennie, C. (2007). Rigorous 3D error analysis of kinematic scanning LiDAR systems. Journal of Applied Geodesy, 1, 147-157.
InnovMetric. (2011). PolyWorks V11. Quebec City, Quebec, Canada.
Kemeny, J., Henwood, J, and Turner, K. (2006). The use of ground-based LiDAR for geotechnical aspects of highway projects: Proceedings, 57th Annual Highway Geology Symposium, Breckenridge, Colorado, September 27-29, p. 161.
Lan, H., Martin, C.D. (2009) Evaluating the effect of topography on the rock fall process using LiDAR. In Hudson, J. A., Tham, L. G., Feng, X.-T., and Kwong, A. K. L., editors, Proc. ISRM-Sponsored International Symposium on Rock Mechanics: Rock Characterization, Modeling and Engineering Design Methods, SINOROCK 2009, page 69. University of Hong Kong, China.
Lato M, Diederichs M.S, Hutchinson D.J, Harrap R (Accepted March 2011) “Evaluating roadside rockmasses for rockfall hazards using LiDAR data: optimizing data collection and processing protocols” Natural Hazards, 30 man. pg, 24 fig.
Lato, M, Diederichs, M, and Hutchinson, D.J (2010) “Bias correction for static LiDAR scanning of rock outcrops for structural characterization” Rock Mechanics and Rock Eng., 43 (5), 615-628.
Lato, M., Hutchinson, D.J., Diederichs, M.S., Ball, D., and Harrap, R. (2009) “Engineered monitoring of rockfall hazards along transportation corridors: using mobile terrestrial LiDAR” Natural Hazards Earth Systems Science, 9, 935–946.
Lato, M., Hutchinson, D. J., Diederichs, M. S., & Harrap, R. (2008). Optimization of LiDAR scanning and processing for automated structural evaluation of discontinuities in rockmasses. International Journal of Rock Mechanics and Mining Science , 46, 194-199.
Leica Geosystems. (2007). HDS6000. Heerbrugg, Switzerland.
Martin, C.D., Tannant, D.D., and Lan, H. (2007) Comparison of terrestrial-based, high resolution, LiDAR and digital photogrammetry surveys of a rock slope. In Eberhardt, E., Stead, D., and Morrison, T., eds., Proceedings 1
st Canada-US
Rock Mecahnics Symposium, Vancouver, volume 1, p. 37-44, Taylor and Francis Group, London.
Pierson, L. A. (1991). “Rockfall hazard rating system” Final Report, Federal Highway Administration, Oregon State Highway Division, Salem, USA.
Pritchard, M., Porter, M., Savigny, K. W., Bruce, I., Oboni, F., Keegan, T. (2005). CN rockfall hazard risk management system: Experience, enhancements, and future direction. The American Railway Engineering and Maintenance-of-Way Association. Chicago, USA.
Sturzenegger, M., & Stead, D. (2009). Close-range terrestrial digital photogrammetry and terrestrial laser scanning for discontinuity characterization on rock cuts. Engineering Geology , 106, 163-182