Embed Size (px)
Citation preview

Electrical potential field around the laboratory resistivity equipment Marluci Cristina Pregnolato, Anna Silvia P. Peixoto & Marcia Tiemi Yamasaki Department of Civil Engineer – São Paulo State University, Bauru, SP, Brazil ABSTRACT The resistivity piezocone is becoming a useful tool in the geo-environmental investigation of contamination plumes. However, the values reported in the literature refer to typical soils from temperature climates, and thus do not reflect the behaviour of tropical soils. Therefore, two different diameters sensors (20 and 30mm) were built in order to study the intervening factors such as moisture, compaction, porosity and degree of saturation. This paper presents a study of the electrical potential field around the resistivity modules to evaluate the boundary contour of the calibration system and the compaction cylinder were the soils tests were carry out. In addition, a pure sand and a tropical clayey sand were compacted in electrical insulator cylinder and the bulk resistivity were obtained in order to analyses the influence electric potencial field and the boundary contour. RESUMEN El resistividad piezocono se está convirtiendo en una herramienta útil en la investigación geo-ambiental de las plumas de contaminación. Sin embargo, los valores reportados en la literatura no reflejan el comportamiento de los suelos tropicales. Por lo tanto, dos sensores de diferentes diámetros (20 y 30 mm) se construyeron en el laboratorio para estudio los factores que intervienen, tales como la humedad, la compactación, la porosidad y el grado de saturación. Este trabajo presenta un estudio del campo de potencial eléctrico en torno a los módulos de resistencia para evaluar el contorno de los límites del sistema de calibración y el cilindro de compactación de los suelos fueron las pruebas se llevan a cabo. Además, una arena pura y tropical arena arcillosa fueron compactadas en el cilindro aislante eléctrico y la resistividad se han obtenido con el fin de los análisis de la influencia potencial del campo eléctrico y el contorno de los límites de la compactación de cilindros. 1 INTRODUCTION The detection of contamination plumes is extremely important, since they may represent serious risks for the population and the environment. The resistivity peizocone (RCPTU), as Campanella & Weemees (1990) and Campanella & Kokan (1993) suggestions, has a resistivity module installed at the back of standard piezocone. This resource enables continuous measurements to be taken of the resistance to an electric current applied to the ground. When that value is compared with reference values, is possible to detect of probable presence of contamination.
These reference values are established based on field work or on similar geological environments. In that way, the study here presents part of a research to obtain reference values of electric resistivity to tropical soils.
Two resistivity modules with different diameters were development in order two study the intervening factors such as moisture, compaction, porosity and degree of saturation. The electrical potential field around the probe were analysed in order to evaluate the boundary contour of the calibration system and the compaction cylinder were the tests were carry out.
In addition, a pure sand and a tropical clayey sand were compacted in an electrical insulator mold and the bulk resistivity were obtained by two methods: firstly with two copper plates and after with 20mm sensor. The analyses of the results showed that there no representative difference between the two methods to the clayey sand. The discrepancy in the pure sand showed the necessity of done more tests with a large cylinder.
2 THEORETICAL CONCEPTS In its ASTM G57-95a standard, the American Society for Testing and Materials Standards describes both field and laboratory procedures for measuring soil resistivity using fours electrodes in the Wenner array, in which they are spaced equally in the arrangement shown in Figure 1. The measure of apparent resistivity in this arrangement is calculated from Equation 1:
[1]
Where: “ρap” is the apparent resistivity (Ω.m); “a” is the distance between the electrodes (m); “ is the difference in potencial (mV), and “I” is the current intensity (mA)
The University of British Columbia (UBC) has being studied the resistivity piezocone (RCPTU) to obtain geo-environmental parameters since 1989. In that way, Daniel et al (2003) presented the difference between the electric potential field to non-isolated and isolated resistivity modules. Comparing Figure 1 with Figure 2, the isolated module has the equipotential lines near the theory, despite the electrodes configuration are quite different. Nevertheless, the equipotential lines of non-isolated module indicate that significant amounts of electrical current are lost to the steel drill rods.
Oh et al (2009) studied in laboratory the applicability of resistivity cone to investigate the sensitivity of the electrical resistivity of cone on water content and different types of

contaminants. The authors considered the electric current flow in 3-dimensional full-space around the cone to provide a means of computing the geometric factor for diameter of cone and electrode spacing’s, eq. 2 and Figure 3.
[2]
Where: “s” is the distance of separation between two adjacent electrodes; “d” is the cone diameter, and “G” is the geometric factor
Figure 1. Wenner Array
Figure 2. Electric potentials measured in salt-water tub around the UBC (a) non-isolated and (b) isolated resistivity modules apud Daniel et al (2003)
Figure 3. Electrical current and equi-potential surface around a cylindrical electrode of cone apud Oh et al (2009) 2.1 Bulk electrical resistivity
According to Davies & Campanella (1995), the resistivity piezocone can be used for the evaluation of environmental and geotechnical parameters. In areas where the reference values are exceeded, complementary evaluations can be made using samples collected at discrete depths for subsequent chemistry analysis. These reference values are established from field work or from similar geological environments. Table 1 summarizes several typical resistivity measurements of saturated bulk soil mixtures and pore fluid.
Table 1. Summary of some typical resistivity measurements of saturated bulk soil mixtures and pore fluid apud Campanella 2008. Material Type Bulk
resistivity Fluid
resistivity Deltaic sands with saltwater intrusion 2 0.5 Drinking water form sand >50 >15 Typical landfill leachate 1-30 0.5-10 Mine tailings (base metal) & oxidized sulphide leachate
0,01-20 0.005-15
Mine tailings (base metal) no oxidizied sulphide leachate
20-100 15-50
Arsenic contaminated sand and gravel 1-10 0.5-4 Industry site: inorganic contaminants in sand
0.5-1.5 0.3-0.5
Industrial site: wood waste in clayey silts 200-1000 75-450 Industrial site: wood waste in clayey silts 300-600 80-200
1Conductivity (µS/cm) = 10,000 ÷ [Resistivity (Ω.m)] Despite of the difficulties of the piezocone results
interpretation to tropical soils, since the ground water level is sometimes deeper than the layer which is impenetrable to the cone, the RCPTU results allow optimizes the soil and water sampling. Mondelli et al (2007) confirmed that that application in the identification of contaminant-saturated zones through in situ test carried in a municipal solid waste disposal site in Brazil.
In that way, Peixoto et al (2010) developed two resistivity sensors, according to RCPTU, but in a laboratory scale, with diameters of 20mm and 30mm, Figures 4 and 5 respectively, in order to study the

intervening factors such as power supply frequency, moisture, compaction, porosity and degree of saturation.
Figure 4. 20mm sensor apud Peixoto et al (2010)
Figure 5. 30mm sensor apud Peixoto et al (2010)
Those intervening factors were studied by Yamasaki et al (2010). The electrical resistivity tests were carried out by two manners: firstly using two copper plates pressed against the specimen; and using the same equipment of Figure 4. It was used a compacted clayey sand obtained at same place of Mondelli et al (2007). The compaction mold was built with an electrical insulator.
Figure 6 shows the electrical bulk resistivity versus moisture content, comparing both tests: the 20mm sensor and the plates.
Figure 6. Comparison between both methods to obtain laboratory bulk resistivity test apud Yamasaki et al (2010).
The results to moisture content upper than 15%, that
means saturation degree near 90%, are quite closed. Those differences could be explained by the edge effect by the compaction cylinder and the electrical potential field around the sensor. In addition, that graph confirms the difficulty in analyses results in the unsaturated zone where the air is considered an insulate material, disturbing the lectures.
3 ELECTRICAL POTENTIAL FIELD They were used the two resistivity modules developed by Peixoto et al (2010), Figures 3 and 4, to study the electrical potential field.
3.1 Test Proceeding The electrical potential field test was carried out with the both sensors (20mm and 30mm) in a tank with 1 m diameter with distilled water, wash water, 250ppm salt water and 500ppm salt water. The electric potentials were measured at 0.02m points on a grid pattern around the modules (Figure 7). The Table 2 summarize the input data of the tests. Table 2. Input data of the electrical potential field tests Sensor Water Potential MN
(V) Input Current
(mA) Condutivity
(µS/cm)
Distilled 0.009 0.012 0.75 20mm Wash 0.262 1.53 135 250ppm 0.314 5.82 543 500ppm 0.320 10.7 1065 Distilled 0.009 0.009 0.59 30mm Wash 0.274 1.97 134 250ppm 0.327 7.17 494 500ppm 0.290 12.96 1062
Figure 7. Electrical potencial field test 3.2 Test Results They were done eight contour maps according the input data presented in Table 2. The equipotential lines were by kriging method.
The output potential MN was obtained and the electrical resistivity was calculate with the calibration equation and then, it compared with the value obtained by the electric conductivity (EC) meter.
The analyses considered if the output potential MN (see Figure 1) was in a horizontal distance smaller than the compaction cylinder edge, or x coordinate at 6.5cm.
In the both sensors (20mm and 30mm), to electrical resistivity near the wash water value (70Ωm), the electrical field went not over the cylinder limit, 0.262V and 0.274, Figure 8 and 9 respectively.

Figure 8. Electrical field, 20mm sensor, wash water
Figure 9. Electrical potential, 30mm sensor, wash water
Figure 10. Electrical field, 20mm sensor, 500ppm salt water
Figure 11. Electrical field, 30mm sensor, 500ppm salt water In other side, to high conductivities, or low resistivities, like the electrical field of Figures 10 and 11, with the conductivity near 1000µS/cm, or 10Ωm, the dimension tank was not sufficient to the output potential, 0.320V and 0.290V, respectively. In those situations, the current flow lines are higher and probably it lead to limit effect in the compaction cylinder. 4 STUDY OF EDGE EFFECT IN LABORATORY
BULK RESISTIVITY TEST The tests were carried out by two manners: firstly using two copper plates pressed against the specimen (Figure 12); and using the 20mm sensor (Figure 13).
Figure 12. Apparatus for tests with copper plates
Figure 13. Apparatus for tests with 20mm cone sensor
Edge of compaction cylinder
Edge of compaction cylinder
Edge of compaction cylinder
Edge of compaction cylinder

4.1 Clayey sand test Results The clayey sand soil was collect in a no contaminated place of a municipal solid waste disposal site in Brazil. It is a colluvium soil, non-colloidal active and CL. The Standard Proctor maximum dry specific mass is 1.838g/cm3 and the optimum water content is 15.2%.
In order to verify the difference between the electrical resistivity obtained by to methods, it was considered gravimetric water content, the degree of saturation and void ratio, Figures 14 to 15.
In a first time it could be assumed there are differences between the both methods to the compacted clayey sand. Nevertheless, if it would be considered the range of resistivity values presented in the Table 1, the results are acceptable.
Figure 14. Moisture content to clayey sand
Figure 15. Degree of saturation to clayey sand
Figure 15. Bulk resistivity versus void ratio
4.2 Pure sand test Results The pure sand is considered SP by the Unified Soil Classification System and has 65% of medium size. In that case, the standard compaction is not possible. Consequently, the specimen was prepared by soil air pluviation.
In the first tests it was observed a great difference between the plates and sensor resistivity results. In this way, the tests were carried out in two containers: the compaction cylinder with 0.15m diameter and a tank with 0.45m diameter.
The disparity of the results, besides the diameter container, near 100 times, indicates the electrical potential field either depends of the propagation current in a specific environment, fluid or soil.
Figure 16. Moisture content to pure sand
Figure 17. Degree of saturation to pure sand
Figure 18. Void ratio to pure sand
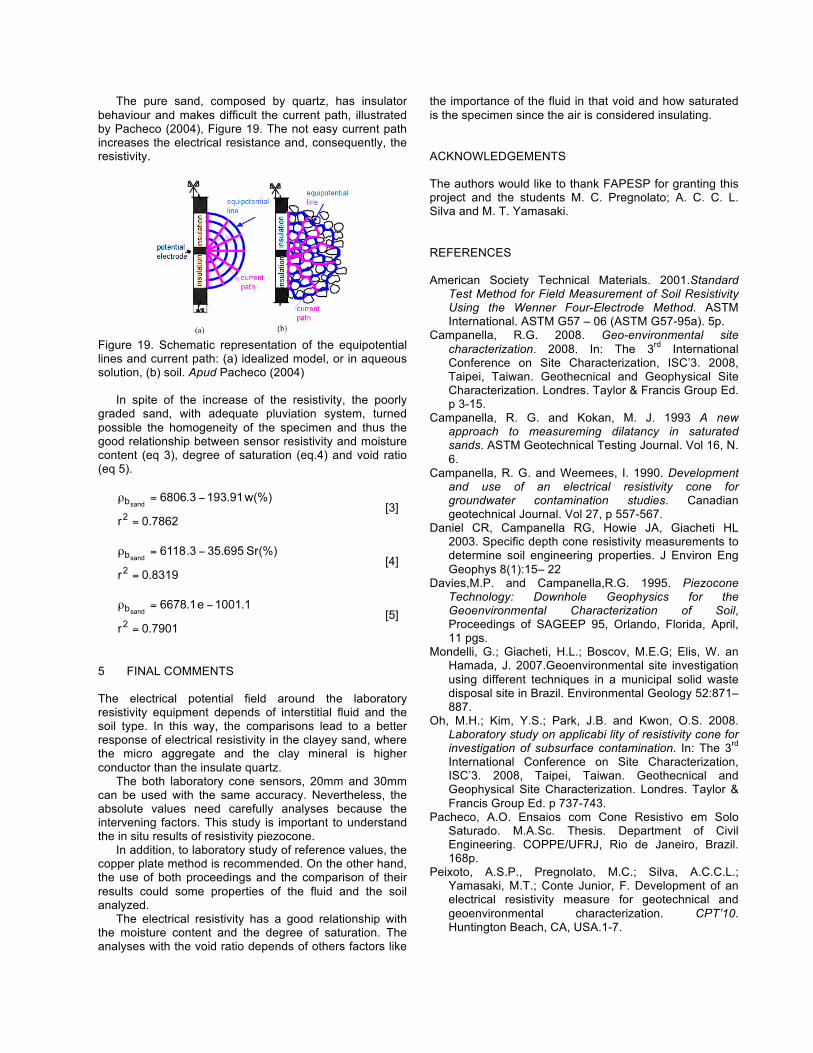
The pure sand, composed by quartz, has insulator behaviour and makes difficult the current path, illustrated by Pacheco (2004), Figure 19. The not easy current path increases the electrical resistance and, consequently, the resistivity.
Figure 19. Schematic representation of the equipotential lines and current path: (a) idealized model, or in aqueous solution, (b) soil. Apud Pacheco (2004)
In spite of the increase of the resistivity, the poorly graded sand, with adequate pluviation system, turned possible the homogeneity of the specimen and thus the good relationship between sensor resistivity and moisture content (eq 3), degree of saturation (eq.4) and void ratio (eq 5).
[3]
[4]
[5]
5 FINAL COMMENTS The electrical potential field around the laboratory resistivity equipment depends of interstitial fluid and the soil type. In this way, the comparisons lead to a better response of electrical resistivity in the clayey sand, where the micro aggregate and the clay mineral is higher conductor than the insulate quartz.
The both laboratory cone sensors, 20mm and 30mm can be used with the same accuracy. Nevertheless, the absolute values need carefully analyses because the intervening factors. This study is important to understand the in situ results of resistivity piezocone.
In addition, to laboratory study of reference values, the copper plate method is recommended. On the other hand, the use of both proceedings and the comparison of their results could some properties of the fluid and the soil analyzed.
The electrical resistivity has a good relationship with the moisture content and the degree of saturation. The analyses with the void ratio depends of others factors like
the importance of the fluid in that void and how saturated is the specimen since the air is considered insulating. ACKNOWLEDGEMENTS The authors would like to thank FAPESP for granting this project and the students M. C. Pregnolato; A. C. C. L. Silva and M. T. Yamasaki. REFERENCES American Society Technical Materials. 2001.Standard
Test Method for Field Measurement of Soil Resistivity Using the Wenner Four-Electrode Method. ASTM International. ASTM G57 – 06 (ASTM G57-95a). 5p.
Campanella, R.G. 2008. Geo-environmental site characterization. 2008. In: The 3rd International Conference on Site Characterization, ISC’3. 2008, Taipei, Taiwan. Geothecnical and Geophysical Site Characterization. Londres. Taylor & Francis Group Ed. p 3-15.
Campanella, R. G. and Kokan, M. J. 1993 A new approach to measureming dilatancy in saturated sands. ASTM Geotechnical Testing Journal. Vol 16, N. 6.
Campanella, R. G. and Weemees, I. 1990. Development and use of an electrical resistivity cone for groundwater contamination studies. Canadian geotechnical Journal. Vol 27, p 557-567.
Daniel CR, Campanella RG, Howie JA, Giacheti HL 2003. Specific depth cone resistivity measurements to determine soil engineering properties. J Environ Eng Geophys 8(1):15– 22
Davies,M.P. and Campanella,R.G. 1995. Piezocone Technology: Downhole Geophysics for the Geoenvironmental Characterization of Soil, Proceedings of SAGEEP 95, Orlando, Florida, April, 11 pgs.
Mondelli, G.; Giacheti, H.L.; Boscov, M.E.G; Elis, W. an Hamada, J. 2007.Geoenvironmental site investigation using different techniques in a municipal solid waste disposal site in Brazil. Environmental Geology 52:871–887.
Oh, M.H.; Kim, Y.S.; Park, J.B. and Kwon, O.S. 2008. Laboratory study on applicabi lity of resistivity cone for investigation of subsurface contamination. In: The 3rd International Conference on Site Characterization, ISC’3. 2008, Taipei, Taiwan. Geothecnical and Geophysical Site Characterization. Londres. Taylor & Francis Group Ed. p 737-743.
Pacheco, A.O. Ensaios com Cone Resistivo em Solo Saturado. M.A.Sc. Thesis. Department of Civil Engineering. COPPE/UFRJ, Rio de Janeiro, Brazil. 168p.
Peixoto, A.S.P., Pregnolato, M.C.; Silva, A.C.C.L.; Yamasaki, M.T.; Conte Junior, F. Development of an electrical resistivity measure for geotechnical and geoenvironmental characterization. CPT’10. Huntington Beach, CA, USA.1-7.

Weemees, I. A. 1990. Development of an Electrical Resistivity Cone for Groundwater Contamination Studies. M.A.Sc. Thesis. Department of Civil Engineering, University of British Columbia. Vancouver, BC. 86p.
Yamasaki, M. T.; Peixoto, A.S.P and Ulson, J.A.C. 2010. Ensaio de laboratório para avaliação da resistividade elétrica em um solo tropical arenoso. Cobramseg’2010. Gramado, Rio Grande do Sul. Brazil.1-7.