Embed Size (px)
Citation preview
International Journal of Engineering Trends and Technology (IJETT) – Volume 35 Number 6- May 2016
ISSN: 2231-5381 http://www.ijettjournal.org Page 256
Short and Efficient Desizing and Scouring
Process of Cotton Textile Materials Mangesh D. Teli*and Tesfaye Tolessa Adere
Institute of Chemical Technology, Matunga (E), Mumbai 400019, India
Abstract Now days, all research efforts in the field of wet
processing of textiles are directed towards
sustainable process through chemical substitution,
shortening and simplification of the processing
sequence for minimizing water and energy
consumption and reducing effluent load and the
number of operations or shorten the process time.
Thus, it has become necessary to combine several
textile processing stages. This part of research work
deals with design of combined enzymatic desizing
and scouring process for cotton textile by using a
mixture of BEISOL T2090 and BEISOL PRO
enzymes. To optimize the combined bio-desizing and
bioscouring, the Box-Behnken design (BBD) was
utilized during the investigation. The range of
process parameters were taken in three different
levels at equal intervals. The treatment effectiveness
on fabric properties was evaluated via weight loss
(%), TEGEWA rate, tensile strength, and water
absorbency (wettability). Furthermore, the
properties of the combined treatment of the fabric
after common bleaching process were investigated
and compared to the conventional processes.
Keyword: Cotton fabric, Enzyme, Desizing,
Bioscouring, Bleaching, Sustainable Process.
I. INTRODUCTION
Cotton grows on the seeds of the cotton plant and is
one of the most recognized textiles in the world. It is
considered as one of the oldest natural materials
used to make fabric. Cotton fibre is a single
biological cell with a multilayer structure [1, 2].
These layers are structurally and chemically
different, and contain approximately 10% by weight
of non-cellulosic substances such as lipids, waxes,
pectic substances, organic acids,proteins/nitrogenous
substances, non- cellulosic polysaccharides, and
other unidentified compounds included within the
outer layer of the fibre. These non-cellulosic
materials create a physical hydrophobic barrier
which protects the fibre from the environment
throughout development; they provide lubrication
during textile processing, and affect the
enhancement of the fabrics wettability and
absorbency [3, 4].
The processing of raw cotton in order to improve its
performance in further finishing stages consists of
three consecutive steps: desizing, scouring and
bleaching. Desizing removes the size applied to
warp yarns prior to weaving; scouring breaks down
pectins and waxes and helps remove other impurities
present in cotton fibres to improve water
absorptivity; and bleaching commonly done with
hydrogen peroxide under near boiling temperature,
removes coloured impurities from fabrics that may
produce an undesirable appearance and hinder
dyeing performance[5,6].
In conventional textile wet processing, the above
sequences are often done separately which involve
high resource consumption and the chemicals used
for all these steps are quite toxic and the process is
costly because it consumes large quantities of energy,
water, and auxiliary agents, as well as requiring
neutralization that generates substantial levels of
electrolytes in effluent. In addition, conventional
scouring can give rise to undesirable reduction of
fibre strength [7,8].The potential for the
environmental contamination and depletion of
natural resources is also serious [9].
Now days, industry has become increasingly aware
about the optimal use of resources like water, energy.
Also on the other hand as the fallout of pollution
caused by industrial textile processes through
chemical substitution, use of enzymes and process
optimization have become essentials. It is possible to
combine any of the two or all processes that can
result in huge savings in terms of water, energy and
reduced effluent load. This approach supports
sustainable textile processing that is now becoming
inevitable for the textile industries [10, 11].
The use of enzymes in the textile industry is an
example of white industrial biotechnology, which
allows the sustainable processing in fibre processing,
and strategies that are, non-polluting, conserving of
energy and natural resources, economically viable,
safe and healthy for workers, and communities
[12,13]. Therefore, consumption of energy and raw-
materials, as well as increased awareness of
environmental concerns related to the use and
disposal of chemicals into landfills, water or release
into the air during chemical processing of textiles are
the principal reasons for the application of enzymes
in wet processing of textile materials.
International Journal of Engineering Trends and Technology (IJETT) – Volume 35 Number 6- May 2016
ISSN: 2231-5381 http://www.ijettjournal.org Page 257
The present work aims at: i) Optimizing combine
process parameters including BEISOL T2090,
BEISOL PRO enzymes concentration, and
temperature of reaction. (ii) Comparing the
combined use of the desizing, and scouring
processes using BEISOL T2090 and BEISOL PRO
enzymes, respectively with the combined process of
chemical treatment through measuring quality of
treated cotton fabric in terms of weight loss,
TEGEWA rate, tensile strength, and fabric
absorbency.
Through this attempt, alternative preparatory
processes have been brought under focus
successfully by application of biotechnology in
desizing and scouring for cotton preparation. Thus,
the efforts were made towards reducing the water
intake and minimizing the intermediate number of
washings and also to minimize the intake of
chemicals wherever possible to make existing
process, ‘more sustainable’ and ‘environment
friendly’.
II. MATERIALS AND METHODS
A. Fabric
Greige cotton was used for the experiment. The
process trials were carried out on the fabric of plain
weave 100% raw cotton fabric with 120 GSM.
B. Chemicals
Two commercial grade enzymes namely BEISOL
T2090 and BEISOL PRO and auxiliary chemicals
namely Felosan NFG (wetting agent) and Beixion
NE (sequestering agent) were kindly supplied by
CHT Indian Pvt.Ltd. Sodium hydroxide and sodium
bicarbonate were of laboratory grade chemicals
supplied by S.D Fine Chemicals, Mumbai.
III. CONVENTIONAL METHODS
A. Desizing process
The desizing was carried out in in Rota dyer
laboratory machine at pH 7 at 60 °C for material
liquor ratio 1:20 with BEISOL T2090 concentration
2% (o.w.f) and wetting agent Felosan NFG 1.5 %
(o.w.f) and sequestering agent Beixion NE 2%
(o.w.f). The process time for the de-sizing enzymes
was 30 minute excluding the time required for
heating at heating rate of 3°C /min.
B. Chemical Scouring process
Initially weighed desized woven cotton fabric was
treated in Rota dyer machine with 3% (o.w.f) NaOH,
and wetting agent Felosan NFG 1.5 % (o.w.f) and
sequestering agent Beixion NE 2% (o.w.f) at boil for
1h, excluding the time required for heating at a
heating rate 3°C/min, at MLR of 1:20. After this, the
sample was given hot wash at 90°C for 10 min and
at 60 oC for 10 min followed by cold wash and dried.
C. Combined Treatment of Desizing and
Bioscouring
Conventionally desizing is carried out with acid or
enzymes (starch based sizes) and is carried out in
acidic medium. This type of desizing cannot be
combined with alkaline scouring where higher pH is
required. A possibility of combining desizing with
scouring arises if desizing can be carried out in
alkaline conditions. This is possible if oxidative
desizing is carried out, but it has its own limitations.
In using enzymatic processes, the combined
treatment of desizing and bioscouring was carried
out with an aqueous solution containing a mixture of
BEISOL T2090 and BEISOL PRO enzymes of
different concentrations and wetting agent Felosan
NFG 1.5% (o.w.f) and sequestering agent Beixion
NE 2% (o.w.f) at varying temperatures. A material
to liquor ratio of 1:20 was used. The treated samples
were washed with soap at 90 oC and then washed
with cold water and finally air dried.
D. Hydrogen Peroxide Bleaching
Both conventional enzymatic desizing and alkaline
or enzymatic scouring processes were first carried
out. Samples were then bleached separately with
aqueous solution containing 4g/l H2O2, X g/l NaOH
and wetting agent Felosan NFG 1.5% (o.w.f) and
sequestering agent Beixion NE 2% (o.w.f) and 2g/l
sodium silicate for 60 min using a material to liquor
ratio of 1:20 in Rota dyer machine. After the
treatment, the fabric was washed two times with hot
water and cold water and finally air dried. The
bleaching experiments were carried out in triplicate
in Rota dyer machine.
E. Design of Experiment
To optimize the combined enzymatic desizing and
bioscouring, the Box-Behnken design (BBD) was
utilized during the investigation. The range of
process parameters were taken in three different
levels at equal intervals such as, enzyme
concentration of BEISOL T2090 (2%, 3%, 4%)
o.w.f and BEISOL PRO (2%, 3%, 4%) o.w.f, and
temperature (80 oC, 90
oC, 100
oC). The independent
variables (enzymes concentration and temperature)
and their levels (low, medium, high) were chosen
based on supplier’s recommendation. These
variables, in three levels, were used in different
combinations according to the Box - Behnken three
level designs as shown in Table 1. The samples were
subjected to combine enzymatic desizing and
bioscouring as per the 17 trials suggested by the
design. After each process the fabrics were dried and
tested for weight loss and tensile strength loss,
TEGEWA rate and absorbency to evaluate the
efficiency of the processes.
International Journal of Engineering Trends and Technology (IJETT) – Volume 35 Number 6- May 2016
ISSN: 2231-5381 http://www.ijettjournal.org Page 258
F. Testing and analysis Testing of Desized
fabric
With starch sizes, the iodine reagent (Iodine+
Potassium Iodide) produces a coloured complex of
intense violet blue colour. The coloured complex
formed is a two-dimensional complex, where iodine,
the linear chain, is included in a two-dimensional
structure of the starch. This test is practical because
it directly indicates either the presence of the starch
by a characteristic deep blue colouration or the
absence of the starch by a yellowish orange or no
colouration on the fabric.
Preparation of the iodine solution
For preparation of iodine solution 10 g of potassium
iodide was dissolved in 100mL of water and 0.65g
of iodine was added into it. This solution was stirred
for complete dissolution. To the above solution,
800mL water was added and further ethanol was
added to make up the volume up to 1L. The samples
were stained with iodine solution and the degree of
desizing was evaluated on the basis of violet scale
(Tegewa) calibrated from 1 to 9 as a reference.
Rating 1 is poor, and a 9 rating is the best which
indicates complete removal of size. For effective
desizing of the samples, grade 6 or more is needed
Testing of scoured fabric
Standard drop penetration test was carried out for the
absorbency. The absorbency test standard is
AATCC-79-2000. A drop of water allowed to fall
from a fixed height on to taut fabric and the time
required for specular reflection of the water drop to
disappear is measured and recorded as wetting time.
Loss in tensile strength
Tensile strength and elongation were measured as
per ASTM D5034. A sample of 16x2.5cm was taken
for the test. The tensile strength of the fabric was
determined by cloth tensile strength tester. Four
readings for every sample were taken and the
average was calculated. The performance of
scouring was evaluated by calculating the tensile
strength (TS) loss% as follows:
TS Loss (%) = T1 − T2 × 100
T1
Where T1 is tensile strength-before treatment and T2
is tensile strength after treatment.
IV. RESULTS AND DISCUSSION
As already stated, this study aims at establishing
conditions for sustainable pre-treatment of cotton textiles. Conditions for desizing and bioscouring
have been thoroughly studied and reported by
carrying out experiments given by the Box-Behnken
design. The optimal conditions using enzymes for
combined processes of 100 % cotton-based fabrics
were established. The design experiment and results
of the 17 trials are presented in Table 1
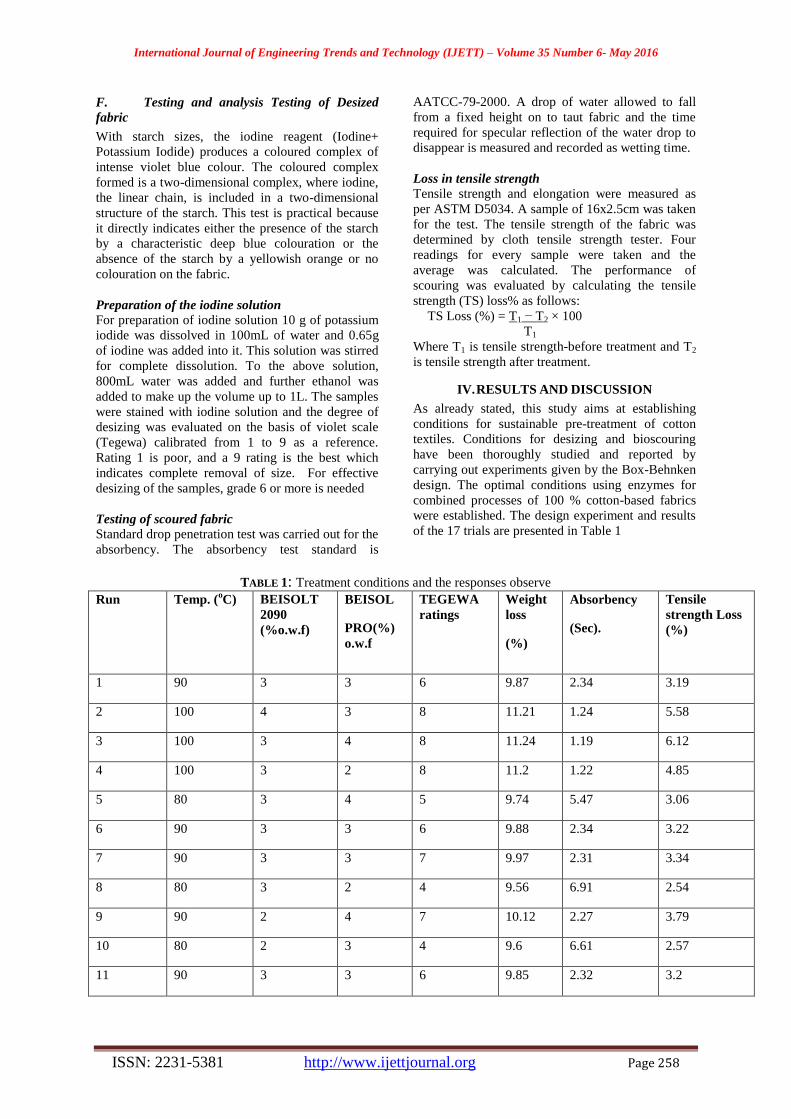
TABLE 1: Treatment conditions and the responses observe
Run
Temp. (oC) BEISOLT
2090
(%o.w.f)
BEISOL
PRO(%)
o.w.f
TEGEWA
ratings
Weight
loss
(%)
Absorbency
(Sec).
Tensile
strength Loss
(%)
1 90 3 3 6 9.87 2.34 3.19
2 100 4 3 8 11.21 1.24 5.58
3 100 3 4 8 11.24 1.19 6.12
4 100 3 2 8 11.2 1.22 4.85
5 80 3 4 5 9.74 5.47 3.06
6 90 3 3 6 9.88 2.34 3.22
7 90 3 3 7 9.97 2.31 3.34
8 80 3 2 4 9.56 6.91 2.54
9 90 2 4 7 10.12 2.27 3.79
10 80 2 3 4 9.6 6.61 2.57
11 90 3 3 6 9.85 2.32 3.2
International Journal of Engineering Trends and Technology (IJETT) – Volume 35 Number 6- May 2016
ISSN: 2231-5381 http://www.ijettjournal.org Page 259
Run
Temp. (oC) BEISOLT
2090
(%o.w.f)
BEISOL
PRO(%)
o.w.f
TEGEWA
ratings
Weight
loss
(%)
Absorbency
(Sec).
Tensile
strength Loss
(%)
12 90 3 3 6 9.95 2.34 3.25
13 80 4 3 5 9.68 6.12 2.94
14 100 2 3 8 11.14 1.37 5.25
15 90 4 2 7 9.91 2.67 3.68
16 90 4 4 8 10.39 1.68 4.63
17 90 2 2 7 9.81 2.67 3.12
A. Desizing efficiency in terms of TEGEWA
ratings
As per results in Table 2, the Model F-value of 28.62
implies the model is significant and there is only a
0.01% chance that a "Model F-Value". Values of
"Prob > F" less than 0.05 indicate model terms are
significant. In this case A, A2, B
2, and C
2 are
significant model terms. Values greater than 0.10
indicate the model terms are not significant. If there
are many insignificant model terms (not counting
those required to support hierarchy), model
reduction may improve your model. The "Lack of
Fit F-value" of 0.00 implies the Lack of Fit is not
significant relative to the pure error.
Table 2: ANOVA for TEGEWA ratings
Source Sum of
Squares
DF Mean
Square
F Value Prob >F
Model 29.44 9 3.27 28.62 0.0001 Significant
A 24.50 1 24.50 214.38 <0.0001
B 0.50 1 0.50 4.38 0.0748
C 0.50 1 0.50 4.38 0.0748
A2 0.95 1 0.95 8.31 0.0235
B2 1.16 1 1.16 10.15 0.0153
C2 1.16 1 1.16 10.15 0.0153
AB 0.25 1 0.25 2.19 0.1827
AC 0.25 1 0.25 2.19 0.1827
BC 0.25 1 0.25 2.19 0.1827
Residual 0.80 7 0.11
Lack of Fit 0 3 0 0 1.0000 not significant
Pure Error 0.80 4 0.20
Cor Total 30.24 16
International Journal of Engineering Trends and Technology (IJETT) – Volume 35 Number 6- May 2016
ISSN: 2231-5381 http://www.ijettjournal.org Page 260
Final Equation in Terms of Coded Factors:
TEGEWA Ratings =+6.20+1.7A+0.25B+0.25C-
0.48A2+0.53B
2+0.53C
2-0.25AB-0.25AC +0.25BC
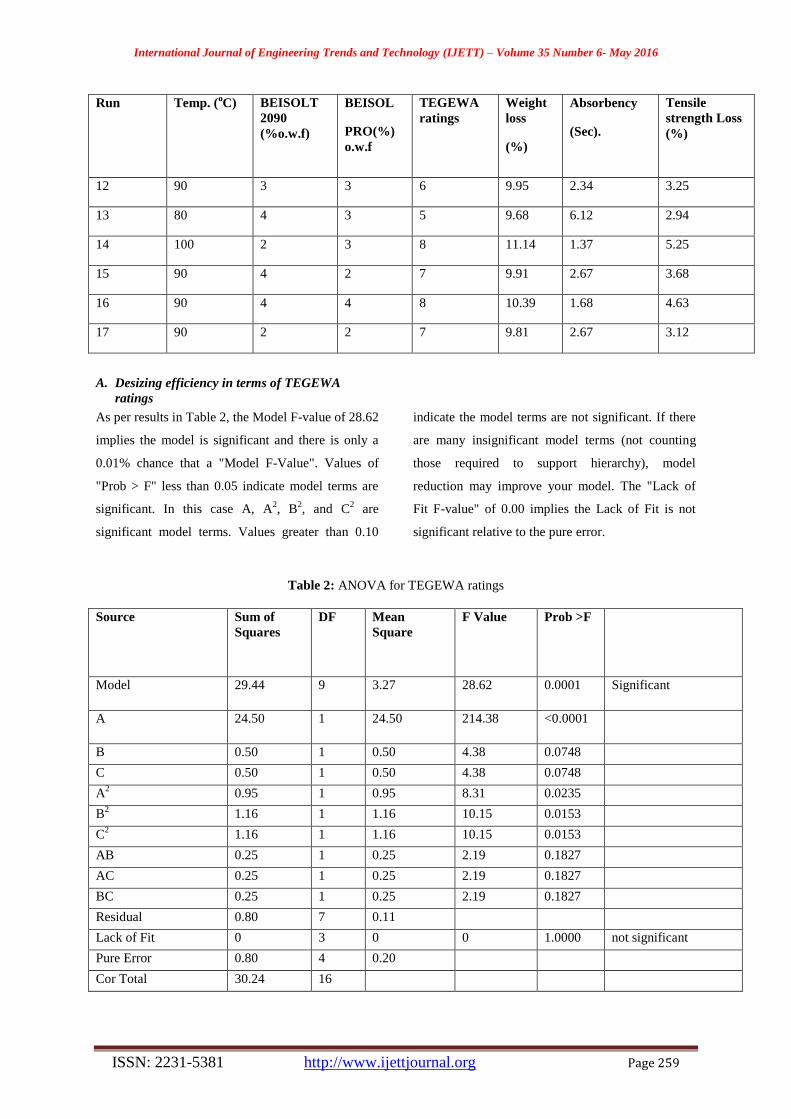
In Fig.1 (a), the response surface plot shows that the
highest TEGEWA rate was seen when BEISOL
T2090 concentration and temperature were in the
high levels. It shows that the TEGEWA rate was 8
(as it is also indicated in Table.1) when BEISOL
T2090 concentration of 4% (o.w.f) and temperature
100 oC with constant BEISOL PRO were used. This
result proves that the high levels are the ideal
conditions for the optimization process as the
standard TEGEWA rate is being greater than 6.
Figure 1(a): Effect of BEISOL T2090 concentration
and temperature on TEGEWA rate at constant
concentration of BEISOL PRO.
In Fig.1 (b), the response surface plot shows that the
highest TEGEWA rate was seen when BEISOL
PRO enzyme concentration and temperature were at
the higher levels. It shows that the TEGEWA rate
was 8 when BEISOL PRO concentration of 4%
(o.w.f) and temperature 100 oC were used with
constant BEISOL T2090. This result proves that the
high levels are the ideal conditions for the
optimization process as the standard TEGEWA rate
is being greater than 6.
Fig.1(c) shows that the TEGEWA rate was 8
(Table.1) when the two enzymes concentration
BEISOL PRO and BEISOL T2090 were 4% (o.w.f)
at constant temperature of 90oC. This result proves
that the high levels are the ideal conditions for the
optimization process as the standard TEGEWA rate
being greater than 6
Figure 1(c): Effect of enzymes concentration,
BEISOL T2090 and BEISOL PRO, on TEGEWA
rate at constant temperature of 90 oC.
B. Weight Loss
The Model F-value of 78.61 implies the model is
significant and A, C, A2 are significant model terms.
Values greater than 0.10 indicate the model terms
are not significant. The "Lack of Fit F-value" of 5.67
implies there is a 6.35% chance that a "Lack of Fit
F-value”. This large could occur due to loss.
Figure1 (b): Effect of BEISOL PRO concentration and temperature on TEGEWA rate at constant concentration
of BEISOLT209
International Journal of Engineering Trends and Technology (IJETT) – Volume 35 Number 6- May 2016
ISSN: 2231-5381 http://www.ijettjournal.org Page 261
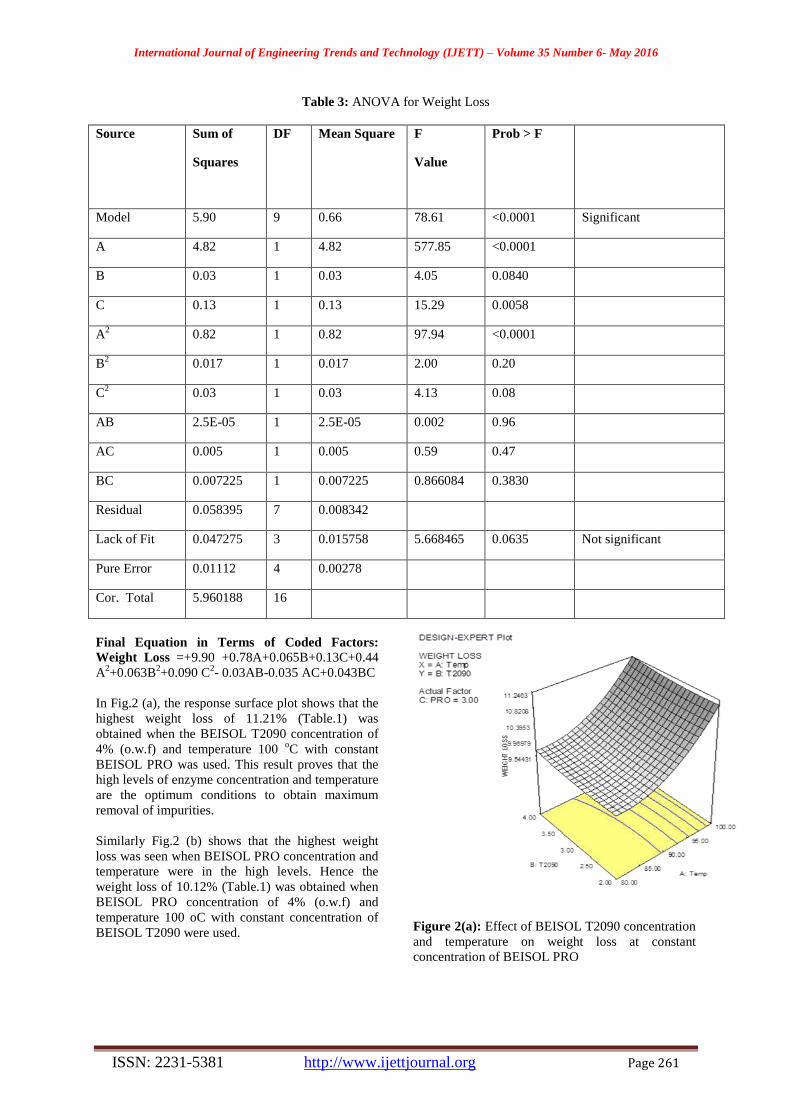
Table 3: ANOVA for Weight Loss
Source Sum of
Squares
DF Mean Square F
Value
Prob > F
Model 5.90 9 0.66 78.61 <0.0001 Significant
A 4.82 1 4.82 577.85 <0.0001
B 0.03 1 0.03 4.05 0.0840
C 0.13 1 0.13 15.29 0.0058
A2 0.82 1 0.82 97.94 <0.0001
B2 0.017 1 0.017 2.00 0.20
C2 0.03 1 0.03 4.13 0.08
AB 2.5E-05 1 2.5E-05 0.002 0.96
AC 0.005 1 0.005 0.59 0.47
BC 0.007225 1 0.007225 0.866084 0.3830
Residual 0.058395 7 0.008342
Lack of Fit 0.047275 3 0.015758 5.668465 0.0635 Not significant
Pure Error 0.01112 4 0.00278
Cor. Total 5.960188 16
Final Equation in Terms of Coded Factors:
Weight Loss =+9.90 +0.78A+0.065B+0.13C+0.44
A2+0.063B
2+0.090 C
2- 0.03AB-0.035 AC+0.043BC
In Fig.2 (a), the response surface plot shows that the
highest weight loss of 11.21% (Table.1) was
obtained when the BEISOL T2090 concentration of
4% (o.w.f) and temperature 100 oC with constant
BEISOL PRO was used. This result proves that the
high levels of enzyme concentration and temperature
are the optimum conditions to obtain maximum
removal of impurities.
Similarly Fig.2 (b) shows that the highest weight
loss was seen when BEISOL PRO concentration and
temperature were in the high levels. Hence the
weight loss of 10.12% (Table.1) was obtained when
BEISOL PRO concentration of 4% (o.w.f) and
temperature 100 oC with constant concentration of
BEISOL T2090 were used.
Figure 2(a): Effect of BEISOL T2090 concentration
and temperature on weight loss at constant
concentration of BEISOL PRO
International Journal of Engineering Trends and Technology (IJETT) – Volume 35 Number 6- May 2016
ISSN: 2231-5381 http://www.ijettjournal.org Page 262
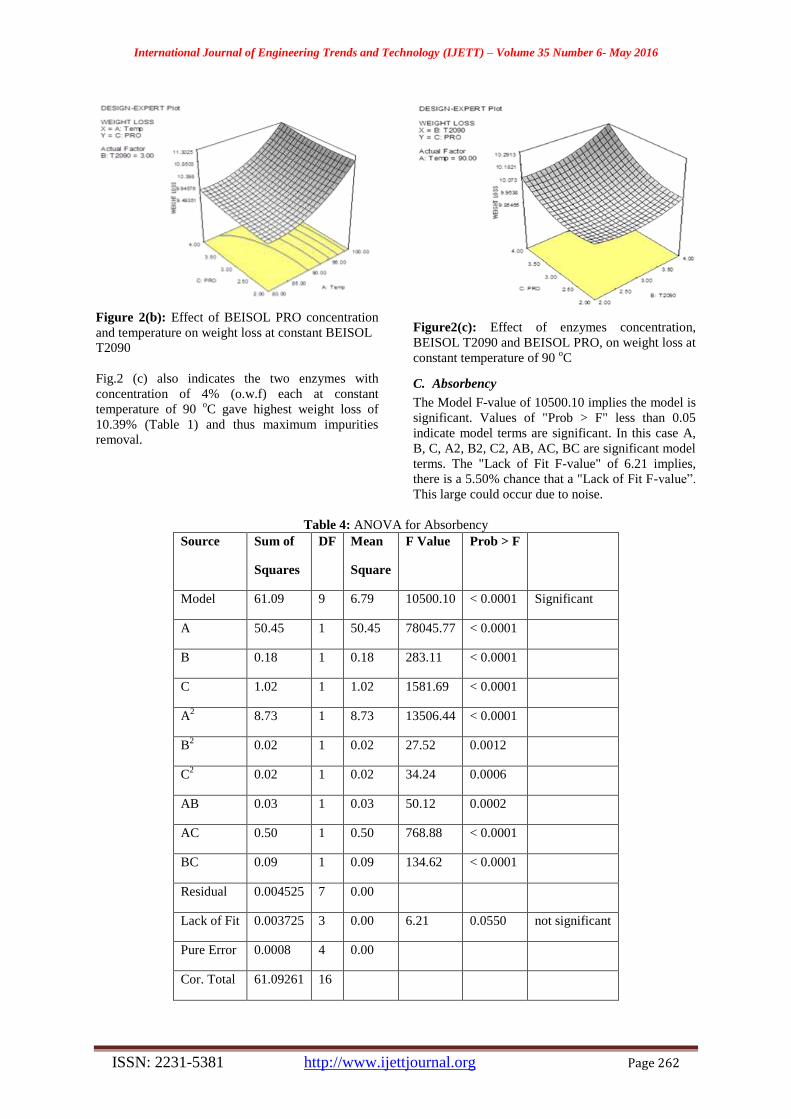
Figure 2(b): Effect of BEISOL PRO concentration
and temperature on weight loss at constant BEISOL
T2090
Fig.2 (c) also indicates the two enzymes with
concentration of 4% (o.w.f) each at constant
temperature of 90 oC gave highest weight loss of
10.39% (Table 1) and thus maximum impurities
removal.
Figure2(c): Effect of enzymes concentration,
BEISOL T2090 and BEISOL PRO, on weight loss at
constant temperature of 90 oC
C. Absorbency
The Model F-value of 10500.10 implies the model is
significant. Values of "Prob > F" less than 0.05
indicate model terms are significant. In this case A,
B, C, A2, B2, C2, AB, AC, BC are significant model
terms. The "Lack of Fit F-value" of 6.21 implies,
there is a 5.50% chance that a "Lack of Fit F-value”.
This large could occur due to noise.
Table 4: ANOVA for Absorbency
Source Sum of
Squares
DF Mean
Square
F Value Prob > F
Model 61.09 9 6.79 10500.10 < 0.0001 Significant
A 50.45 1 50.45 78045.77 < 0.0001
B 0.18 1 0.18 283.11 < 0.0001
C 1.02 1 1.02 1581.69 < 0.0001
A2 8.73 1 8.73 13506.44 < 0.0001
B2 0.02 1 0.02 27.52 0.0012
C2 0.02 1 0.02 34.24 0.0006
AB 0.03 1 0.03 50.12 0.0002
AC 0.50 1 0.50 768.88 < 0.0001
BC 0.09 1 0.09 134.62 < 0.0001
Residual 0.004525 7 0.00
Lack of Fit 0.003725 3 0.00 6.21 0.0550 not significant
Pure Error 0.0008 4 0.00
Cor. Total 61.09261 16
International Journal of Engineering Trends and Technology (IJETT) – Volume 35 Number 6- May 2016
ISSN: 2231-5381 http://www.ijettjournal.org Page 263
Table 5: Summary of statical data analysis
Std. Dev. 0.106754 R-Squared 0.995776
Mean 3.784118 Adj R-Squared 0.990346
C.V. 2.821108 Pred R-Squared 0.943581
PRESS 1.065613 Adeq Precision 44.16706
The "Pred R-Squared" of 0.9436 is in reasonable
agreement with the "Adj R-Squared" of 0.9903.
"Adeq Precision" measures the signal to noise ratio.
A ratio greater than 4 is desirable. Thus ratio of
44.167 indicates an adequate signal. This model can
be used to navigate the design space
Final Equation in Terms of Coded Factors:
Absorbency=+2.33-2.51A-0.1B
0.36C+1.44A2+0.065B
2-
0.072C2+0.090AB+0.35AC-0.15BC
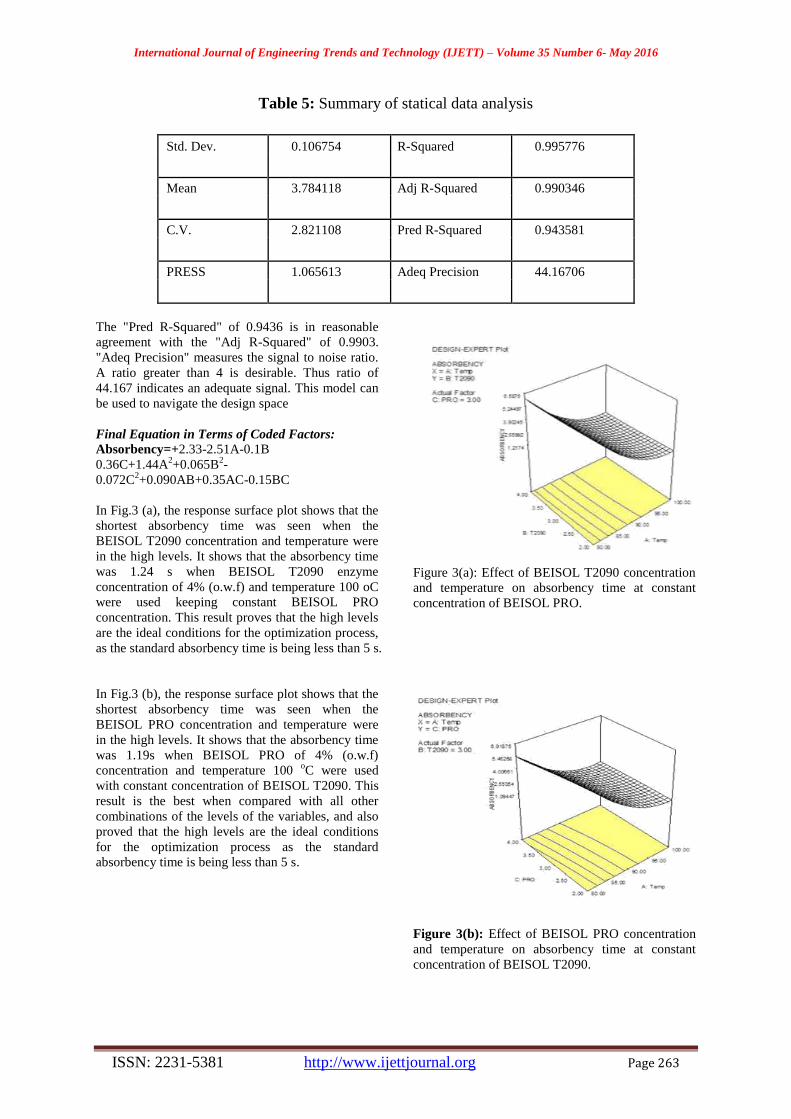
In Fig.3 (a), the response surface plot shows that the
shortest absorbency time was seen when the
BEISOL T2090 concentration and temperature were
in the high levels. It shows that the absorbency time
was 1.24 s when BEISOL T2090 enzyme
concentration of 4% (o.w.f) and temperature 100 oC
were used keeping constant BEISOL PRO
concentration. This result proves that the high levels
are the ideal conditions for the optimization process,
as the standard absorbency time is being less than 5 s.
Figure 3(a): Effect of BEISOL T2090 concentration
and temperature on absorbency time at constant
concentration of BEISOL PRO.
In Fig.3 (b), the response surface plot shows that the
shortest absorbency time was seen when the
BEISOL PRO concentration and temperature were
in the high levels. It shows that the absorbency time
was 1.19s when BEISOL PRO of 4% (o.w.f)
concentration and temperature 100 oC were used
with constant concentration of BEISOL T2090. This
result is the best when compared with all other
combinations of the levels of the variables, and also
proved that the high levels are the ideal conditions
for the optimization process as the standard
absorbency time is being less than 5 s.
Figure 3(b): Effect of BEISOL PRO concentration
and temperature on absorbency time at constant
concentration of BEISOL T2090.
International Journal of Engineering Trends and Technology (IJETT) – Volume 35 Number 6- May 2016
ISSN: 2231-5381 http://www.ijettjournal.org Page 264
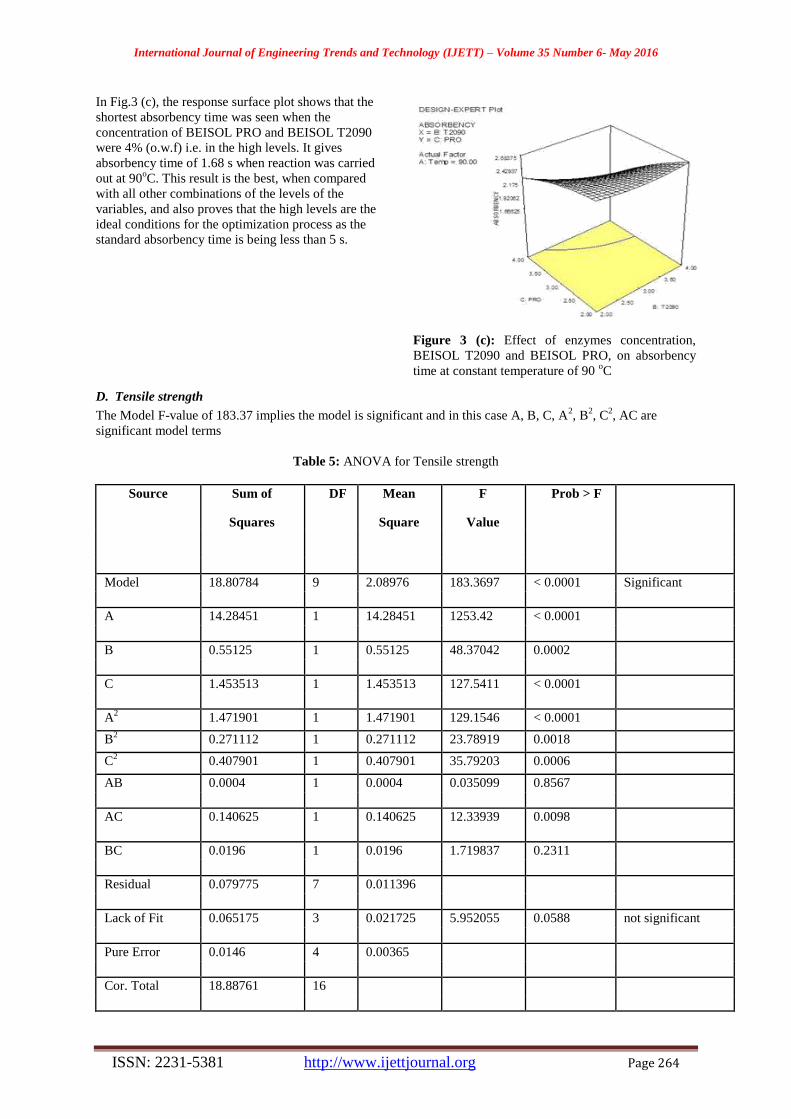
In Fig.3 (c), the response surface plot shows that the
shortest absorbency time was seen when the
concentration of BEISOL PRO and BEISOL T2090
were 4% (o.w.f) i.e. in the high levels. It gives
absorbency time of 1.68 s when reaction was carried
out at 90oC. This result is the best, when compared
with all other combinations of the levels of the
variables, and also proves that the high levels are the
ideal conditions for the optimization process as the
standard absorbency time is being less than 5 s.
Figure 3 (c): Effect of enzymes concentration,
BEISOL T2090 and BEISOL PRO, on absorbency
time at constant temperature of 90 oC
D. Tensile strength
The Model F-value of 183.37 implies the model is significant and in this case A, B, C, A2, B
2, C
2, AC are
significant model terms
Table 5: ANOVA for Tensile strength
Source Sum of DF Mean F Prob > F
Squares Square Value
Model 18.80784 9 2.08976 183.3697 < 0.0001 Significant
A 14.28451 1 14.28451 1253.42 < 0.0001
B 0.55125 1 0.55125 48.37042 0.0002
C 1.453513 1 1.453513 127.5411 < 0.0001
A2 1.471901 1 1.471901 129.1546 < 0.0001
B2 0.271112 1 0.271112 23.78919 0.0018
C2 0.407901 1 0.407901 35.79203 0.0006
AB 0.0004 1 0.0004 0.035099 0.8567
AC 0.140625 1 0.140625 12.33939 0.0098
BC 0.0196 1 0.0196 1.719837 0.2311
Residual 0.079775 7 0.011396
Lack of Fit 0.065175 3 0.021725 5.952055 0.0588 not significant
Pure Error 0.0146 4 0.00365
Cor. Total 18.88761 16
International Journal of Engineering Trends and Technology (IJETT) – Volume 35 Number 6- May 2016
ISSN: 2231-5381 http://www.ijettjournal.org Page 265
Final Equation in Terms of Coded Factors:
Strength Loss
=+3.24+1.34A+0.26B+0.43C+0.59A2+0.25B
2+0.31
C20.01AB+0.19AC+0.07BC
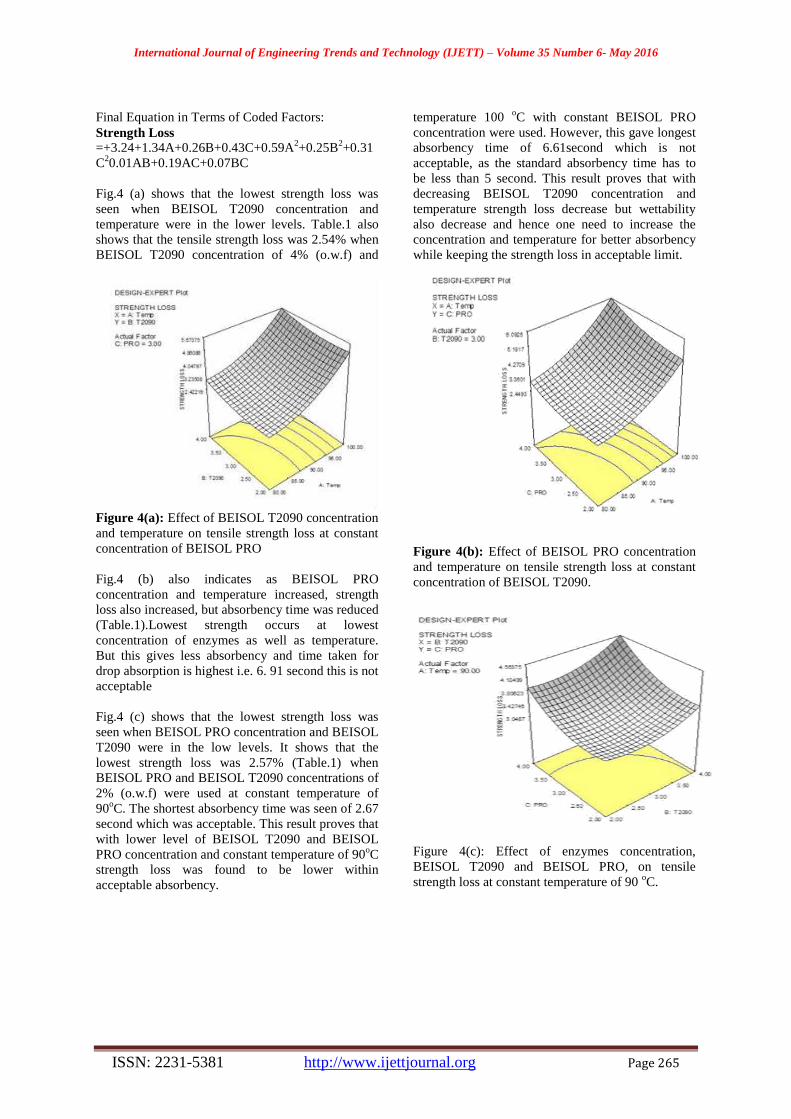
Fig.4 (a) shows that the lowest strength loss was
seen when BEISOL T2090 concentration and
temperature were in the lower levels. Table.1 also
shows that the tensile strength loss was 2.54% when
BEISOL T2090 concentration of 4% (o.w.f) and
temperature 100 oC with constant BEISOL PRO
concentration were used. However, this gave longest
absorbency time of 6.61second which is not
acceptable, as the standard absorbency time has to
be less than 5 second. This result proves that with
decreasing BEISOL T2090 concentration and
temperature strength loss decrease but wettability
also decrease and hence one need to increase the
concentration and temperature for better absorbency
while keeping the strength loss in acceptable limit.
Figure 4(a): Effect of BEISOL T2090 concentration
and temperature on tensile strength loss at constant
concentration of BEISOL PRO
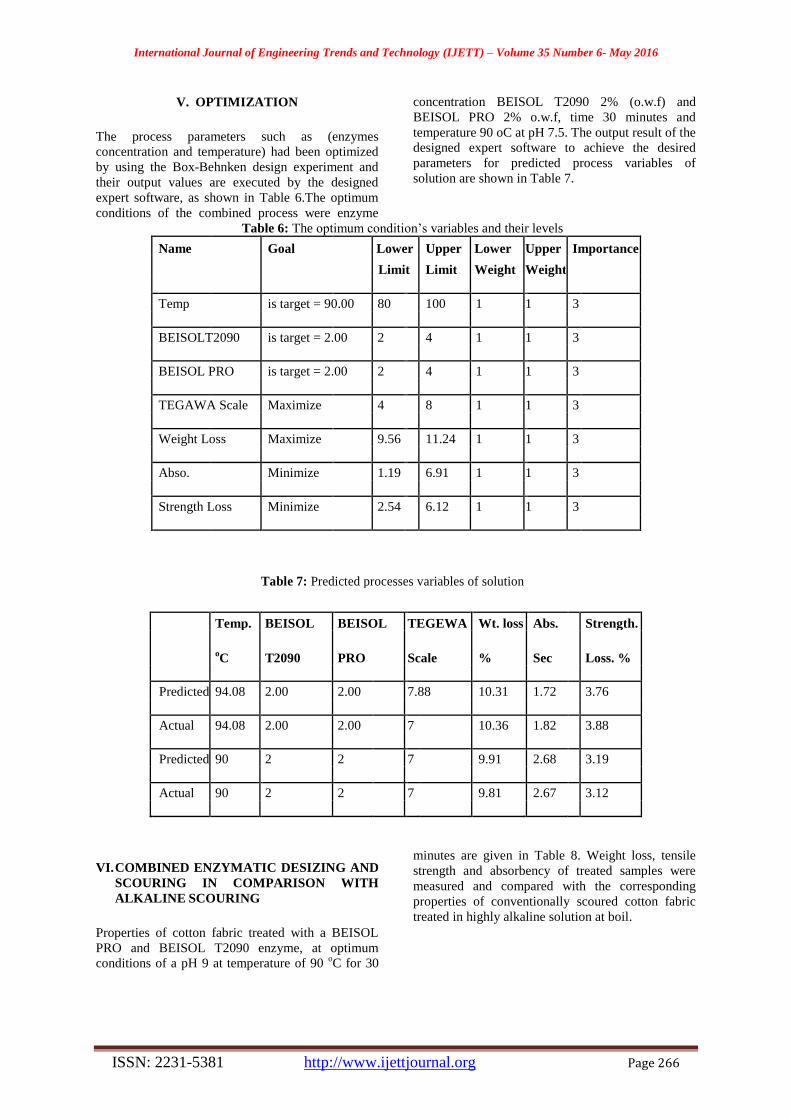
Fig.4 (b) also indicates as BEISOL PRO
concentration and temperature increased, strength
loss also increased, but absorbency time was reduced
(Table.1).Lowest strength occurs at lowest
concentration of enzymes as well as temperature.
But this gives less absorbency and time taken for
drop absorption is highest i.e. 6. 91 second this is not
acceptable
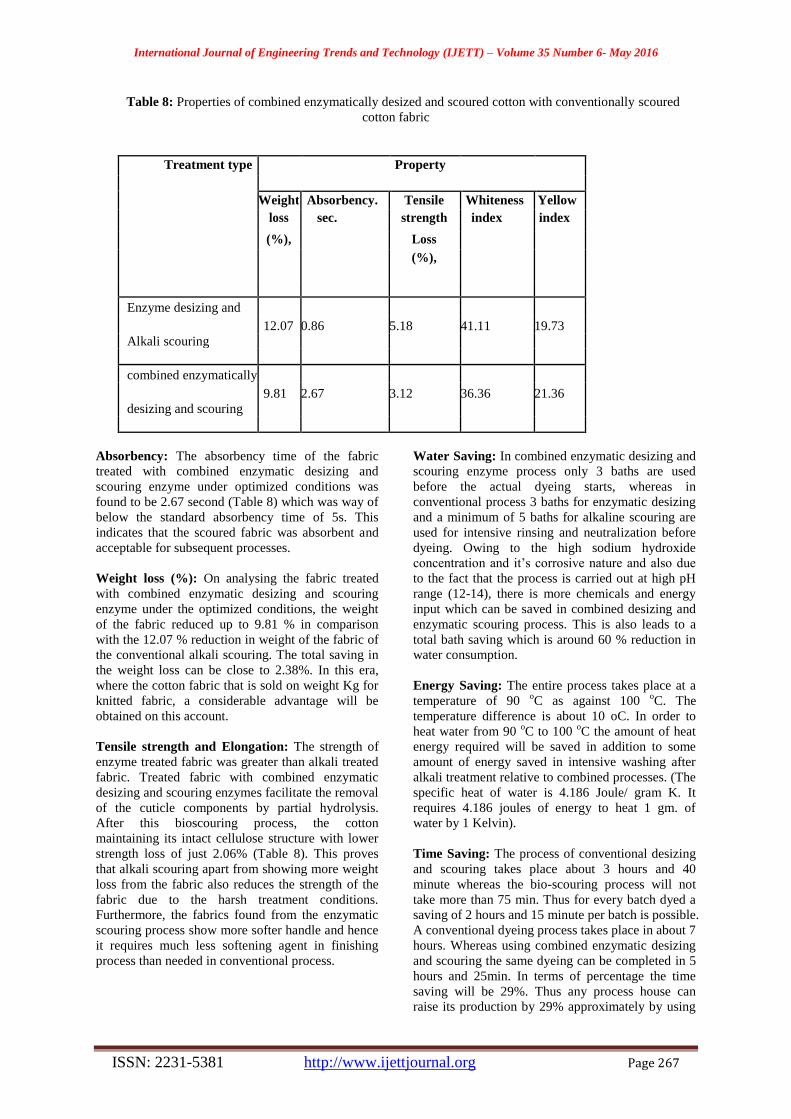
Fig.4 (c) shows that the lowest strength loss was
seen when BEISOL PRO concentration and BEISOL
T2090 were in the low levels. It shows that the
lowest strength loss was 2.57% (Table.1) when
BEISOL PRO and BEISOL T2090 concentrations of
2% (o.w.f) were used at constant temperature of
90oC. The shortest absorbency time was seen of 2.67
second which was acceptable. This result proves that
with lower level of BEISOL T2090 and BEISOL
PRO concentration and constant temperature of 90oC
strength loss was found to be lower within
acceptable absorbency.
Figure 4(b): Effect of BEISOL PRO concentration
and temperature on tensile strength loss at constant
concentration of BEISOL T2090.
Figure 4(c): Effect of enzymes concentration,
BEISOL T2090 and BEISOL PRO, on tensile
strength loss at constant temperature of 90 oC.
International Journal of Engineering Trends and Technology (IJETT) – Volume 35 Number 6- May 2016
ISSN: 2231-5381 http://www.ijettjournal.org Page 266
V. OPTIMIZATION
The process parameters such as (enzymes
concentration and temperature) had been optimized
by using the Box-Behnken design experiment and
their output values are executed by the designed
expert software, as shown in Table 6.The optimum
conditions of the combined process were enzyme
concentration BEISOL T2090 2% (o.w.f) and
BEISOL PRO 2% o.w.f, time 30 minutes and
temperature 90 oC at pH 7.5. The output result of the
designed expert software to achieve the desired
parameters for predicted process variables of
solution are shown in Table 7.
Table 6: The optimum condition’s variables and their levels
Name Goal Lower Upper Lower Upper Importance
Limit Limit Weight Weight
Temp is target = 90.00 80 100 1 1 3
BEISOLT2090 is target = 2.00 2 4 1 1 3
BEISOL PRO is target = 2.00 2 4 1 1 3
TEGAWA Scale Maximize 4 8 1 1 3
Weight Loss Maximize 9.56 11.24 1 1 3
Abso. Minimize 1.19 6.91 1 1 3
Strength Loss Minimize 2.54 6.12 1 1 3
Table 7: Predicted processes variables of solution
Temp. BEISOL BEISOL TEGEWA Wt. loss Abs. Strength.
oC T2090 PRO Scale % Sec Loss. %
Predicted 94.08 2.00 2.00 7.88 10.31 1.72 3.76
Actual 94.08 2.00 2.00 7 10.36 1.82 3.88
Predicted 90 2 2 7 9.91 2.68 3.19
Actual 90 2 2 7 9.81 2.67 3.12
VI. COMBINED ENZYMATIC DESIZING AND
SCOURING IN COMPARISON WITH
ALKALINE SCOURING
Properties of cotton fabric treated with a BEISOL
PRO and BEISOL T2090 enzyme, at optimum
conditions of a pH 9 at temperature of 90 oC for 30
minutes are given in Table 8. Weight loss, tensile
strength and absorbency of treated samples were
measured and compared with the corresponding
properties of conventionally scoured cotton fabric
treated in highly alkaline solution at boil.
International Journal of Engineering Trends and Technology (IJETT) – Volume 35 Number 6- May 2016
ISSN: 2231-5381 http://www.ijettjournal.org Page 267
Table 8: Properties of combined enzymatically desized and scoured cotton with conventionally scoured
cotton fabric
Treatment type Property
Weight Absorbency. Tensile Whiteness Yellow
loss sec. strength index index
(%), Loss
(%),
Enzyme desizing and
12.07 0.86 5.18 41.11 19.73
Alkali scouring
combined enzymatically
9.81 2.67 3.12 36.36 21.36
desizing and scouring
Absorbency: The absorbency time of the fabric
treated with combined enzymatic desizing and
scouring enzyme under optimized conditions was
found to be 2.67 second (Table 8) which was way of
below the standard absorbency time of 5s. This
indicates that the scoured fabric was absorbent and
acceptable for subsequent processes.
Weight loss (%): On analysing the fabric treated
with combined enzymatic desizing and scouring
enzyme under the optimized conditions, the weight
of the fabric reduced up to 9.81 % in comparison
with the 12.07 % reduction in weight of the fabric of
the conventional alkali scouring. The total saving in
the weight loss can be close to 2.38%. In this era,
where the cotton fabric that is sold on weight Kg for
knitted fabric, a considerable advantage will be
obtained on this account.
Tensile strength and Elongation: The strength of
enzyme treated fabric was greater than alkali treated
fabric. Treated fabric with combined enzymatic
desizing and scouring enzymes facilitate the removal
of the cuticle components by partial hydrolysis.
After this bioscouring process, the cotton
maintaining its intact cellulose structure with lower
strength loss of just 2.06% (Table 8). This proves
that alkali scouring apart from showing more weight
loss from the fabric also reduces the strength of the
fabric due to the harsh treatment conditions.
Furthermore, the fabrics found from the enzymatic
scouring process show more softer handle and hence
it requires much less softening agent in finishing
process than needed in conventional process.
Water Saving: In combined enzymatic desizing and
scouring enzyme process only 3 baths are used
before the actual dyeing starts, whereas in
conventional process 3 baths for enzymatic desizing
and a minimum of 5 baths for alkaline scouring are
used for intensive rinsing and neutralization before
dyeing. Owing to the high sodium hydroxide
concentration and it’s corrosive nature and also due
to the fact that the process is carried out at high pH
range (12-14), there is more chemicals and energy
input which can be saved in combined desizing and
enzymatic scouring process. This is also leads to a
total bath saving which is around 60 % reduction in
water consumption.
Energy Saving: The entire process takes place at a
temperature of 90 oC as against 100
oC. The
temperature difference is about 10 oC. In order to
heat water from 90 oC to 100
oC the amount of heat
energy required will be saved in addition to some
amount of energy saved in intensive washing after
alkali treatment relative to combined processes. (The
specific heat of water is 4.186 Joule/ gram K. It
requires 4.186 joules of energy to heat 1 gm. of
water by 1 Kelvin).
Time Saving: The process of conventional desizing
and scouring takes place about 3 hours and 40
minute whereas the bio-scouring process will not
take more than 75 min. Thus for every batch dyed a
saving of 2 hours and 15 minute per batch is possible.
A conventional dyeing process takes place in about 7
hours. Whereas using combined enzymatic desizing
and scouring the same dyeing can be completed in 5
hours and 25min. In terms of percentage the time
saving will be 29%. Thus any process house can
raise its production by 29% approximately by using
International Journal of Engineering Trends and Technology (IJETT) – Volume 35 Number 6- May 2016
ISSN: 2231-5381 http://www.ijettjournal.org Page 268
the combined enzymatic desizing and scouring
process. Because it results in lower weight and
strength loss, lower pollution load, comparable
whiteness and it is adequate for further dyeing.
Environmental Benefits: Reduced effluent
treatment cost, as avoiding too much of caustic soda,
which in turn reduces TDS in a great extant and
hence the removal of total dissolved solid requires
high operating cost of effluent treatment. This can be
totally avoided.
VII. COMBINED DESIZING AND SCOURING AND
CONVENTIONALLY SCOURED COTTON FABRIC
AFTER COMMON BLEACHING
The effect of the H2O2 bleaching of the differently
pre-treated (enzymatic, caustic) fabric was studied
the fabrics properties in terms on the comparing of
the afore mentioned properties of enzymatically and
conventionally pre-treated and H2O2 bleached
(Table9), the results show that the application of
H2O2 bleaching subsequent to combined desizing
and scouring is beneficial.
Table 9: Properties of enzymatically combined desizing and scouring and conventionally scoured cotton fabric
after common bleaching
Treatment type Property
Whiteness Yellow Absorbency. Tensile strength
index Index sec. loss
(%),
Bleached fabric after Alkali 69.42 6.29 <1 8.08
Scouring
Bleached fabric after combined 67.22 7.91 <1 5.33
enzymatically desizing and
Scouring
VIII. CONCLUSION
The optimum conditions of the combined process of
enzymatic desizing and scouring were enzyme
concentration of BEISOL T2090 for desizing and
BEISOL PRO for scouring at 2% o.w.f (on weight
of fabric), time 30 minute and temperature 90oC and
pH 7.5.
Throughout the cotton fabric treatment, the effects of
enzyme admixture with each other were assessed via
determination of the response in terms of
absorbency, TEGEWA rate, weight loss and tensile
strength loss. The optimized conditions met the
pretreatment requirements within acceptable limits
and were suitable for 100% cotton. The outcomes of
these studies reflect the role of enzyme in general
and BEISOL T2090 and BEISOL PRO enzymes in
particular for the sustainable pretreatment of cotton
textiles in combine process. The combined treatment
of enzymatic desizing and bioscouring is a low cost
process because it shows reduction in water and
energy consumption, reduction in the generation of
effluent and it is also ecofriendly and gave higher
productivity for cotton pretreatment processes than
that of existing process. It is thus ‘more sustainable’
and ‘environment friendly’.
IX. ACKNOWLEDGEMENT
One of the co-author Tesfaye Tolessa Adere is
grateful to authorities to ICT and ETIDI for giving
him an opportunity to undertake this work in ICT.
He is also thankful to Mr. Pintu Pandit for assisting
him in using statistical Box-Bohnken Design.
International Journal of Engineering Trends and Technology (IJETT) – Volume 35 Number 6- May 2016
ISSN: 2231-5381 http://www.ijettjournal.org Page 269
X. REFERENCE
[1] Gordon and Y-L. Hsieh, Cotton, Science and technology,
Cambridge, England,2007
[2] W. E. Morton and J. W. S. Hearle, Physical properties of
textile fibres, Boca Raton Boston New York Washington, DC, 2008.
[3] Mena Chem Lewin and Stephen B-Sello, Handbook of
Fibre, Science and Technology-Volume NY, 1985S. [4] Howard L. Needles, Textile Fibers, Dyes, Finishes, and
Processes, University of California, Davis, March, 1986
[5] S.R. Karmakar, Chemical Technology in the Pre-treatment Processes of Textile, Elsevier, Amsterdam, 1999
[6] Charles Tomasino, Chemistry & Technology of Fabric
Preparation & Finishing, Raleigh, North Carolina, 1992. [7] Lange, N.K.; Liu, J.; Husain, P.A.; Condon, B.
Biopreparation the new advanced way of preparing of
fabric and yarn. Sept. 1999 [8] Mohamed M. Hashem, FIBRES & TEXTILES in Eastern
Europe April / June 2007, Vol. 15, No. 2 (61)
[9] N. A. Ibrahim; Seham Z. Abd Allah; Hala A. T.Borham b
& Talaat M. Hassan.. Polymer-Plastics Technology .(2002)
[10] Edward Menezes and Mrinal Choudhari, Pre-treatment of
Textiles Prior to Dyeing, Mumbai,India,2011
[11] Abu Bakar Siddiquee, Md. Mahbubul Bashar, Priti Sarker, Tanzina Tasmina Tohfa, Md. Amjad Hossan, Md.Ibrahim
Azad, Nazma AkhtarInternational Journal of Engineering
& Technology, 3 (1) (2014) [12] Aiteromem, A.L, International Dyer, Vol.7, 2008:
[13] Kiro Mojsov, International Journal of Management, 4(1),
2014. [14] A. Cavaco-Paulo and G. M. Gübitz, Textile processing with
enzymes, Portugal, 2003.
[15] BASF. Pretreatment of Cotton and Cotton/Polyester, Technical Information, 1999.
[16] Bhuvenesh C. Goswami, Marcel Dekker, Textile Sizing,
South Carolina, U.S.A. 2004.


![Eco-Efficient Dry Wool Scouring with total by-products ... · Ppt0000004 [Sola lettura] Author: Alessio M Subject Keywords () Created Date: 6/19/2016 6:32:42 PM](https://img.pdfslide.us/doc/110x75/5f92a7610050232286192c9c/eco-efficient-dry-wool-scouring-with-total-by-products-ppt0000004-sola-lettura.jpg)