Embed Size (px)
Citation preview

Shelf Drilling Q4 2020 Results HighlightsMarch 4, 2021
2Mar 2021 |
DisclaimerThis presentation (the "Presentation") has been prepared by Shelf Drilling, Ltd. ("Shelf Drilling" or the "Company") exclusively for information purposes and may not be reproduced or redistributed, in whole or in part, to any other person.
The Presentation is being made only to, and is only directed at, persons to whom such presentation may lawfully be communicated (’relevant persons’). Any person who is not a relevant person should not act or rely on the Presentation or any of itscontents.
The Presentation does not constitute an offering of securities or otherwise constitute an invitation or inducement to any person to underwrite, subscribe for or otherwise acquire securities in the Company. The release, publication or distribution of thePresentation in certain jurisdictions may be restricted by law, and therefore persons in such jurisdictions into which this Presentation is released, published or distributed should inform themselves about, and observe, such restrictions.
The Presentation contains certain forward-looking statements relating to the business, financial performance and results of the Company and/or the industry in which it operates. Forward-looking statements concern future circumstances and results andother statements that are not historical facts, sometimes identified by the words “believes”, expects”, "predicts", "intends", "projects", "plans", "estimates", "aims", "foresees", "anticipates", "targets", and similar expressions. The forward-lookingstatements contained in the Presentation, including assumptions, opinions and views of the Company or cited from third party sources are solely opinions and forecasts which are subject to risks, uncertainties and other factors that may cause actualevents to differ materially from any anticipated development. None of the Company or any of its shareholders or subsidiary undertakings or any such person's officers or employees provides any assurance that the assumptions underlying such forward-looking statements are free from errors nor does any of them accept any responsibility for the future accuracy of the opinions expressed in the Presentation or the actual occurrence of the forecasted developments. The Company assumes no obligation,except as required by law, to update any forward-looking statements or to conform these forward-looking statements to its actual results.
The Company uses certain financial information calculated on a basis other than in accordance with accounting principles generally accepted in the United States (“GAAP”), including EBITDA, Adjusted EBITDA, and Adjusted EBITDA margin, Capitalexpenditures and deferred costs and Net Debt, as supplemental financial measures in this presentation. These non-GAAP financial measures are provided as additional insight into the Company’s ongoing financial performance and to enhance the user’soverall understanding of the Company’s financial results and the potential impact of any corporate development activities.
‘‘EBITDA’’ as used herein represents revenues less: operating expenses, selling, general and administrative expenses, provision for doubtful accounts, share-based compensation expense, net of forfeitures, and other, net, and excludes interest expense andfinancing charges, interest income, income taxes, depreciation, amortization, loss on impairment and loss on disposal of asset. ‘‘Adjusted EBITDA’’ as used herein represents EBITDA as adjusted for the exclusion of acquired rig reactivation costs andrestructuring costs. These terms, as we define them, may not be comparable to similarly titled measures employed by other companies and are not a measure of performance calculated in accordance with US GAAP. EBITDA and Adjusted EBITDA should notbe considered in isolation or as a substitute for operating income, net income or other income or cash flow statement data prepared in accordance with US GAAP. We believe that EBITDA and Adjusted EBITDA are useful because they are widely used byinvestors in our industry to measure a company’s operating performance without regard to items such as interest, income tax expense (benefit), depreciation and amortization and other non-recurring expenses (benefits), which can vary substantially fromcompany to company. EBITDA and Adjusted EBITDA have significant limitations, such as not reflecting our cash requirements for capital expenditures and deferred costs, contractual commitments, working capital, taxes or debt service. Our managementuses EBITDA and Adjusted EBITDA for the reasons stated above. In addition, our management uses Adjusted EBITDA in presentations to our Board of Directors to provide a consistent basis to measure operating performance of management; as a measurefor planning and forecasting overall expectations; for evaluation of actual results against such expectations; and in communications with equity holders, lenders, note holders, rating agencies and others concerning our financial performance.
“Capital expenditures and deferred costs” as used herein include fixed asset purchases, investments associated with the construction of newbuild rigs and certain expenditures associated with regulatory inspections, major equipment overhauls, contractpreparation, rig upgrades, mobilization and stacked rig reactivations. Capital expenditures are included in property and equipment. Deferred costs are included in other current assets and other long-term assets. This term, as we define it, may not becomparable to similarly titled measures employed by other companies and is not calculated in accordance with US GAAP. Capital expenditures and deferred costs should not be considered in isolation or as a substitute for capital expenditures prepared inaccordance with US GAAP. We believe that Capital expenditures and deferred costs is a useful measure as it better represents the overall level of the Company’s capital investments. Capital expenditures and deferred costs as used herein is a non-US GAAPmeasure defined and periodically reported in the Company’s financial statements on a consistent basis.
“Net Debt” as used herein represents Total Debt less Cash and Cash Equivalents. This term, as we define it, may not be comparable to similarly titled measures employed by other companies and is not a measure of performance calculated in accordancewith US GAAP. Net Debt should not be considered in isolation or as a substitute for total debt prepared in accordance with US GAAP. We believe that Net Debt is useful because it is widely used by investors in our industry to measure a company’s financialposition.
The quarterly financial information included in this Presentation has not been audited and may be subject to modifications.
The Presentation contains information obtained from third parties. You are advised that such third party information has not been prepared specifically for inclusion in the Presentation and the Company has not undertaken any independent investigationto confirm the accuracy or completeness of such information.
An investment in the Company involves risk, and several factors could cause the actual results, performance or achievements of the Company to be materially different from any future results, performance or achievements that may be expressed orimplied by statements and information in the Presentation, including, among others, the risk factors described in the Company’s Form 10-K equivalent for the period ended December 31, 2020 and the Company's prospectus dated 7 May 2019. Should anyrisks or uncertainties materialize, or should underlying assumptions prove incorrect, actual results may vary materially from those described in the Presentation.
No representation or warranty (express or implied) is made as to, and no reliance should be placed on, any information, including projections, estimates, targets and opinions, contained herein, and no liability whatsoever is accepted as to any errors,omissions or misstatements contained herein, and, accordingly, none of the Company or any of its shareholders or subsidiary undertakings or any such person’s officers or employees accepts any liability whatsoever arising directly or indirectly from the useof the Presentation.
By attending or receiving the Presentation you acknowledge that you will be solely responsible for your own assessment of the market and the market position of the Company and that you will conduct your own analysis and be solely responsible forforming your own view of the potential future performance of the Company’s business.
The Presentation speaks as of March 4, 2021. Neither the delivery of this Presentation nor any further discussions of the Company with any of the recipients shall, under any circumstances, create any implication that there has been no change in the affairsof the Company since such date.
3Mar 2021 |
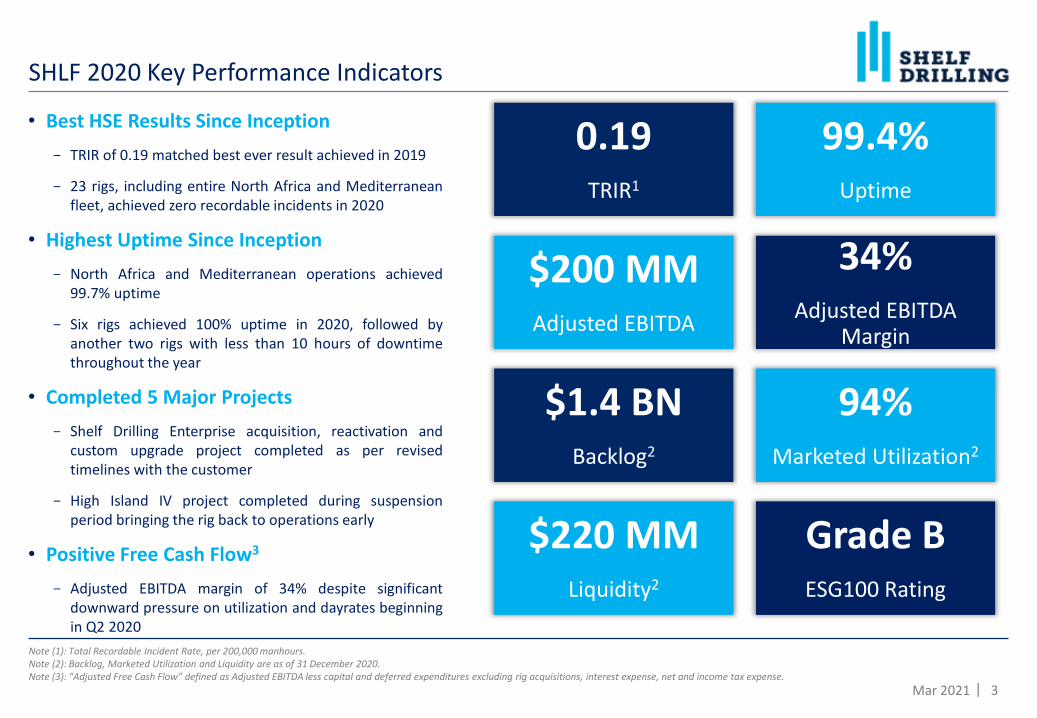
• Best HSE Results Since Inception
- TRIR of 0.19 matched best ever result achieved in 2019
- 23 rigs, including entire North Africa and Mediterraneanfleet, achieved zero recordable incidents in 2020
• Highest Uptime Since Inception
- North Africa and Mediterranean operations achieved99.7% uptime
- Six rigs achieved 100% uptime in 2020, followed byanother two rigs with less than 10 hours of downtimethroughout the year
• Completed 5 Major Projects
- Shelf Drilling Enterprise acquisition, reactivation andcustom upgrade project completed as per revisedtimelines with the customer
- High Island IV project completed during suspensionperiod bringing the rig back to operations early
• Positive Free Cash Flow3
- Adjusted EBITDA margin of 34% despite significantdownward pressure on utilization and dayrates beginningin Q2 2020
SHLF 2020 Key Performance Indicators
Note (1): Total Recordable Incident Rate, per 200,000 manhours. Note (2): Backlog, Marketed Utilization and Liquidity are as of 31 December 2020.Note (3): “Adjusted Free Cash Flow” defined as Adjusted EBITDA less capital and deferred expenditures excluding rig acquisitions, interest expense, net and income tax expense.
0.19TRIR1
99.4%Uptime
$200 MMAdjusted EBITDA
34%Adjusted EBITDA
Margin
$1.4 BNBacklog2
94%Marketed Utilization2
$220 MMLiquidity2
Grade BESG100 Rating
4Mar 2021 |
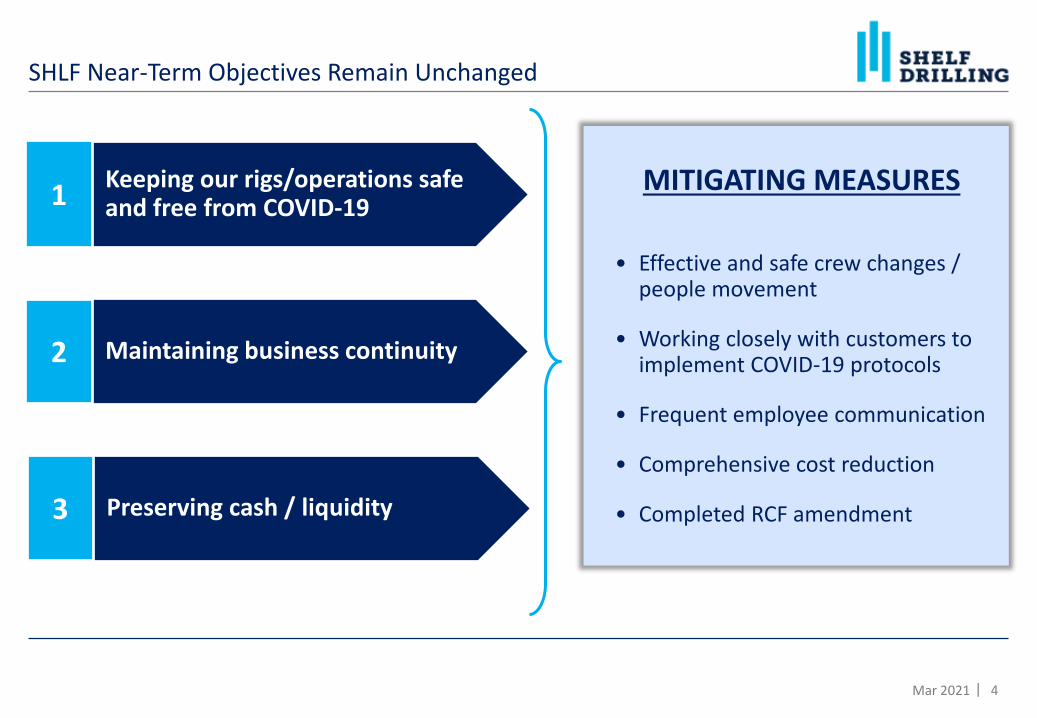
SHLF Near-Term Objectives Remain Unchanged
MITIGATING MEASURES
• Effective and safe crew changes / people movement
• Working closely with customers to implement COVID-19 protocols
• Frequent employee communication
• Comprehensive cost reduction
• Completed RCF amendment
Keeping our rigs/operations safe and free from COVID-191
Maintaining business continuity2
Preserving cash / liquidity3
5Mar 2021 |
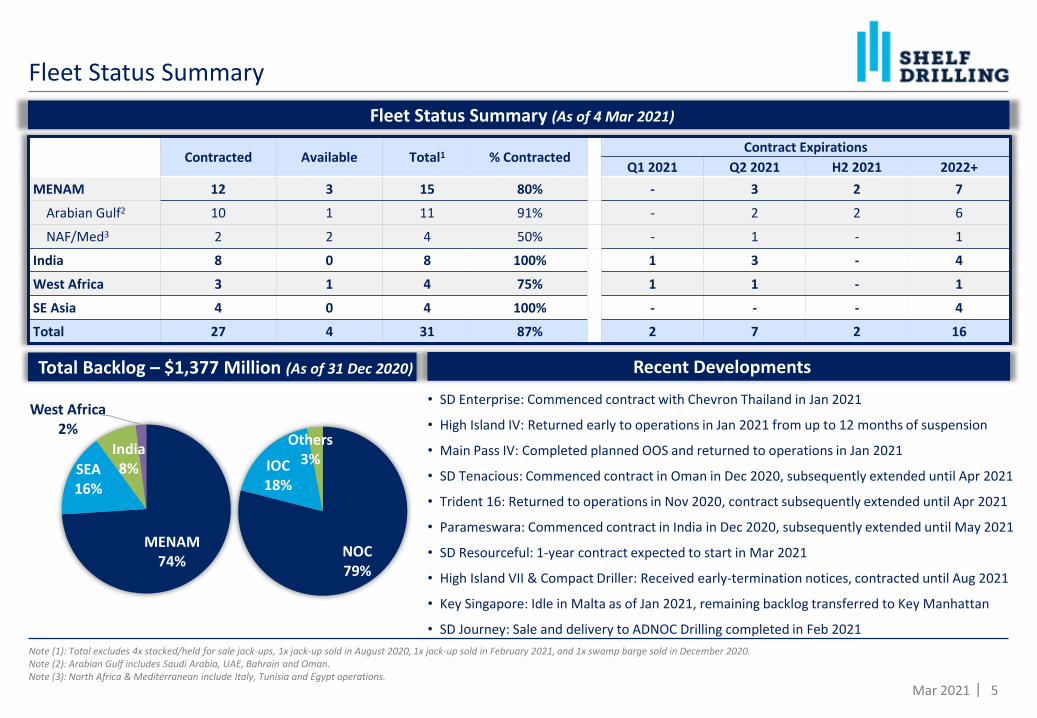
• SD Enterprise: Commenced contract with Chevron Thailand in Jan 2021
• High Island IV: Returned early to operations in Jan 2021 from up to 12 months of suspension
• Main Pass IV: Completed planned OOS and returned to operations in Jan 2021
• SD Tenacious: Commenced contract in Oman in Dec 2020, subsequently extended until Apr 2021
• Trident 16: Returned to operations in Nov 2020, contract subsequently extended until Apr 2021
• Parameswara: Commenced contract in India in Dec 2020, subsequently extended until May 2021
• SD Resourceful: 1-year contract expected to start in Mar 2021
• High Island VII & Compact Driller: Received early-termination notices, contracted until Aug 2021
• Key Singapore: Idle in Malta as of Jan 2021, remaining backlog transferred to Key Manhattan
• SD Journey: Sale and delivery to ADNOC Drilling completed in Feb 2021
Fleet Status Summary
Note (1): Total excludes 4x stacked/held for sale jack-ups, 1x jack-up sold in August 2020, 1x jack-up sold in February 2021, and 1x swamp barge sold in December 2020. Note (2): Arabian Gulf includes Saudi Arabia, UAE, Bahrain and Oman.Note (3): North Africa & Mediterranean include Italy, Tunisia and Egypt operations.
MENAM74%
SEA16%
India8%
West Africa2%
•Total Backlog – $1,377 Million (As of 31 Dec 2020)
Contracted Available Total1 % ContractedContract Expirations
Q1 2021 Q2 2021 H2 2021 2022+
MENAM 12 3 15 80% - 3 2 7
Arabian Gulf2 10 1 11 91% - 2 2 6
NAF/Med3 2 2 4 50% - 1 - 1
India 8 0 8 100% 1 3 - 4
West Africa 3 1 4 75% 1 1 - 1
SE Asia 4 0 4 100% - - - 4
Total 27 4 31 87% 2 7 2 16
•Fleet Status Summary (As of 4 Mar 2021)
•Recent Developments
NOC79%
IOC18%
Others3%
6Mar 2021 |
$0
$10
$20
$30
$40
$50
$60
$70
$80
$90
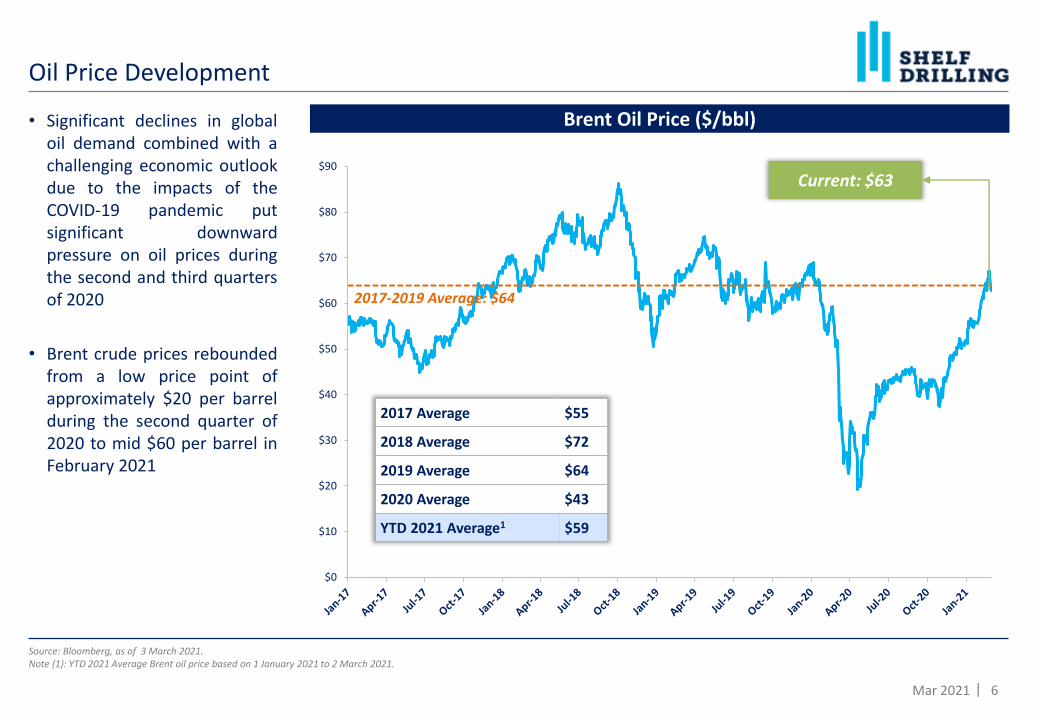
Oil Price Development
Source: Bloomberg, as of 3 March 2021.Note (1): YTD 2021 Average Brent oil price based on 1 January 2021 to 2 March 2021.
Brent Oil Price ($/bbl)
2017 Average $55
2018 Average $72
2019 Average $64
2020 Average $43
YTD 2021 Average1 $59
2017-2019 Average: $64
Current: $63
• Significant declines in globaloil demand combined with achallenging economic outlookdue to the impacts of theCOVID-19 pandemic putsignificant downwardpressure on oil prices duringthe second and third quartersof 2020
• Brent crude prices reboundedfrom a low price point ofapproximately $20 per barrelduring the second quarter of2020 to mid $60 per barrel inFebruary 2021

7Aug 2020 |
50%
55%
60%
65%
70%
75%
80%
85%
90%
95%
200
220
240
260
280
300
320
340
360
380
400
Jan 2017 Jul 2017 Jan 2018 Jul 2018 Jan 2019 Jul 2019 Jan 2020 Jul 2020 Jan 2021
Marketed Contracted
Marketed Util %
• Global number of contracted jack-up rigsdecreased from 382 rigs in January 2020to 346 in February 2021
- Marketed utilization fell from 88% to81% during the same period
• Modest decline in aggregate supply ofjack-up rigs in 2020, when more rigs leftthe global fleet than newbuilds entered,contributing to the global marketedutilization rates
• Oil price rebound in early 2021 has notyet translated into an increase inutilization and dayrates although we arenow seeing an increase in contractingopportunities across multiple regions(particularly West Africa and India)
Global Jack-up Fleet
# of Contracted Jack-ups
Source: IHS Petrodata, as of 28 February 2021
Previous Cycle Peak (April 2014) 457 JUs
Previous Cycle Trough (Jan 2017) 303 JUs
January 2020 382 JUs
February 2021 346 JUs
Shelf Drilling Q4 2020 Results Highlights
Q4 2020 Results
9Mar 2021 |
Shelf Drilling Q4 2020 Results Highlights
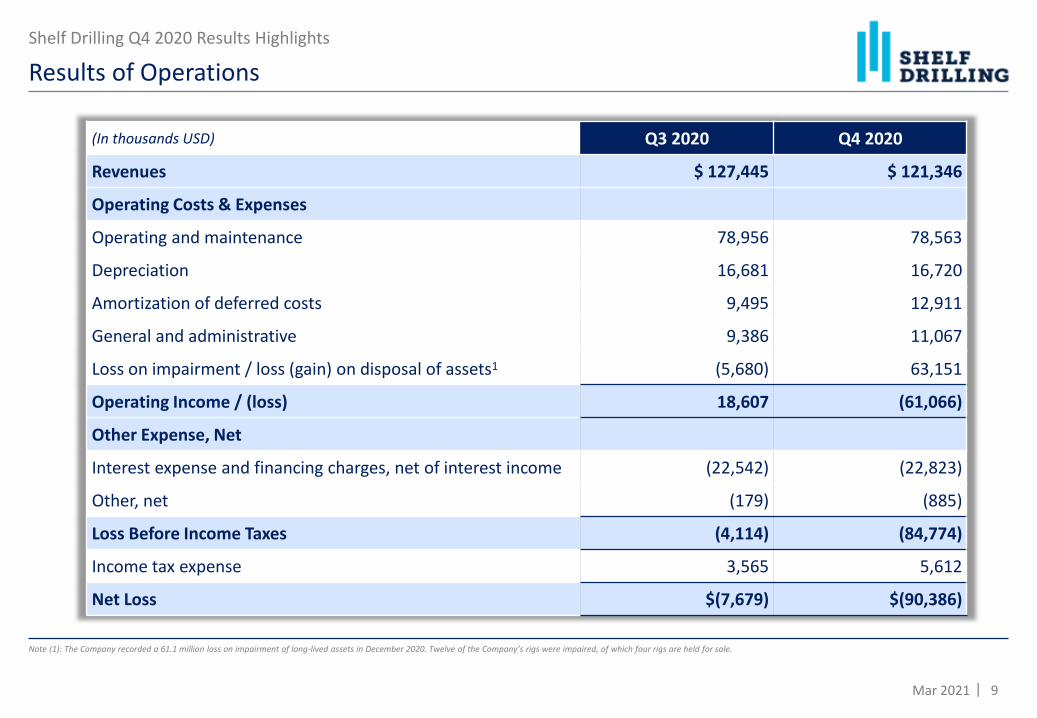
Results of Operations
(In thousands USD) Q3 2020 Q4 2020
Revenues $ 127,445 $ 121,346
Operating Costs & Expenses
Operating and maintenance 78,956 78,563
Depreciation 16,681 16,720
Amortization of deferred costs 9,495 12,911
General and administrative 9,386 11,067
Loss on impairment / loss (gain) on disposal of assets1 (5,680) 63,151
Operating Income / (loss) 18,607 (61,066)
Other Expense, Net
Interest expense and financing charges, net of interest income (22,542) (22,823)
Other, net (179) (885)
Loss Before Income Taxes (4,114) (84,774)
Income tax expense 3,565 5,612
Net Loss $(7,679) $(90,386)
Note (1): The Company recorded a 61.1 million loss on impairment of long-lived assets in December 2020. Twelve of the Company’s rigs were impaired, of which four rigs are held for sale.
10Mar 2021 |
Shelf Drilling Q4 2020 Results Highlights
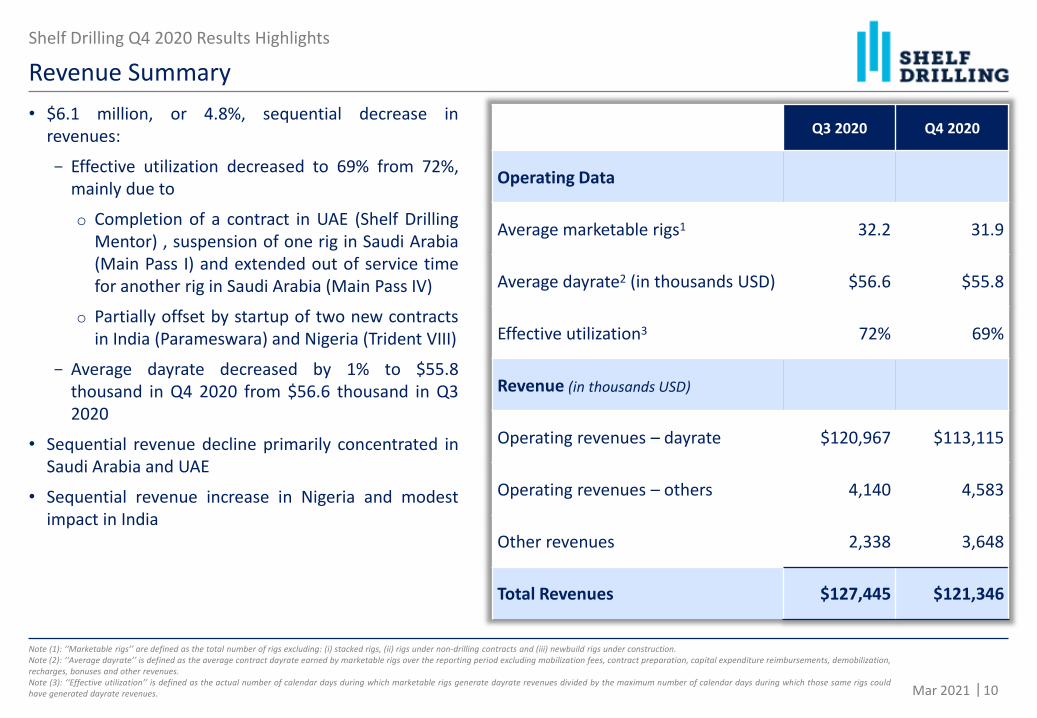
Revenue Summary
Note (1): ‘‘Marketable rigs’’ are defined as the total number of rigs excluding: (i) stacked rigs, (ii) rigs under non-drilling contracts and (iii) newbuild rigs under construction.Note (2): ‘‘Average dayrate’’ is defined as the average contract dayrate earned by marketable rigs over the reporting period excluding mobilization fees, contract preparation, capital expenditure reimbursements, demobilization,recharges, bonuses and other revenues.Note (3): ‘‘Effective utilization’’ is defined as the actual number of calendar days during which marketable rigs generate dayrate revenues divided by the maximum number of calendar days during which those same rigs couldhave generated dayrate revenues.
• $6.1 million, or 4.8%, sequential decrease inrevenues:
- Effective utilization decreased to 69% from 72%,mainly due to
o Completion of a contract in UAE (Shelf DrillingMentor) , suspension of one rig in Saudi Arabia(Main Pass I) and extended out of service timefor another rig in Saudi Arabia (Main Pass IV)
o Partially offset by startup of two new contractsin India (Parameswara) and Nigeria (Trident VIII)
- Average dayrate decreased by 1% to $55.8thousand in Q4 2020 from $56.6 thousand in Q32020
• Sequential revenue decline primarily concentrated inSaudi Arabia and UAE
• Sequential revenue increase in Nigeria and modestimpact in India
Q3 2020 Q4 2020
Operating Data
Average marketable rigs1 32.2 31.9
Average dayrate2 (in thousands USD) $56.6 $55.8
Effective utilization3 72% 69%
Revenue (in thousands USD)
Operating revenues – dayrate $120,967 $113,115
Operating revenues – others 4,140 4,583
Other revenues 2,338 3,648
Total Revenues $127,445 $121,346
11Mar 2021 |
Shelf Drilling Q4 2020 Results Highlights
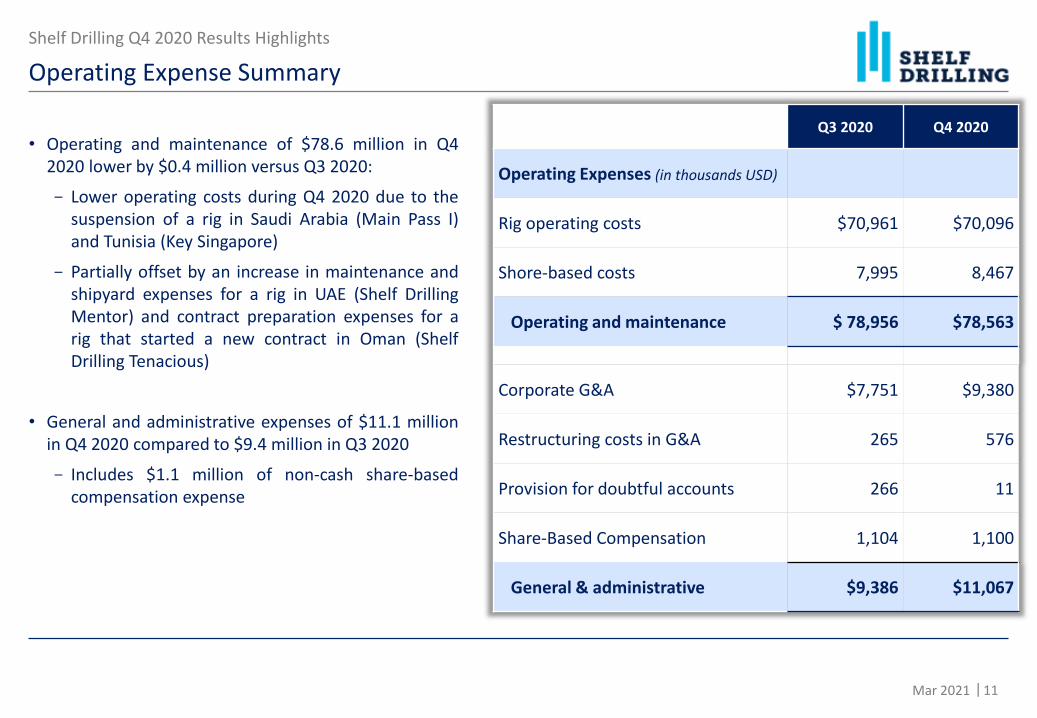
Operating Expense Summary
• Operating and maintenance of $78.6 million in Q42020 lower by $0.4 million versus Q3 2020:
- Lower operating costs during Q4 2020 due to thesuspension of a rig in Saudi Arabia (Main Pass I)and Tunisia (Key Singapore)
- Partially offset by an increase in maintenance andshipyard expenses for a rig in UAE (Shelf DrillingMentor) and contract preparation expenses for arig that started a new contract in Oman (ShelfDrilling Tenacious)
• General and administrative expenses of $11.1 millionin Q4 2020 compared to $9.4 million in Q3 2020
- Includes $1.1 million of non-cash share-basedcompensation expense
Q3 2020 Q4 2020
Operating Expenses (in thousands USD)
Rig operating costs $70,961 $70,096
Shore-based costs 7,995 8,467
Operating and maintenance $ 78,956 $78,563
Corporate G&A $7,751 $9,380
Restructuring costs in G&A 265 576
Provision for doubtful accounts 266 11
Share-Based Compensation 1,104 1,100
General & administrative $9,386 $11,067
12Mar 2021 |
Shelf Drilling Q4 2020 Results Highlights
Adjusted EBITDA Reconciliation
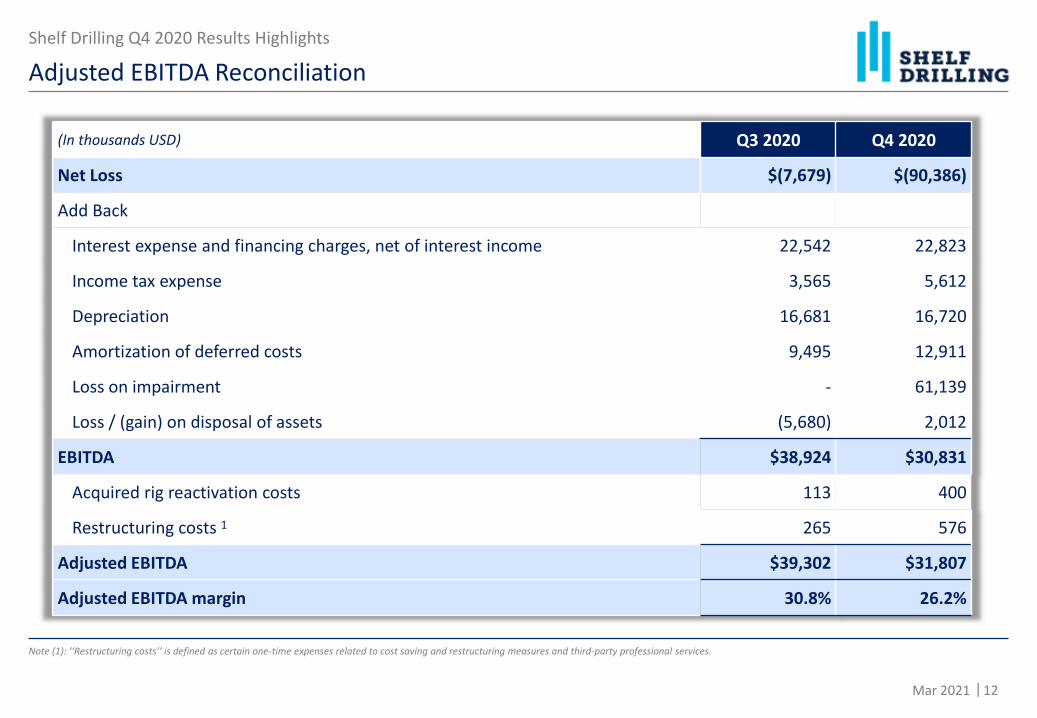
Note (1): ‘‘Restructuring costs’’ is defined as certain one-time expenses related to cost saving and restructuring measures and third-party professional services.
(In thousands USD) Q3 2020 Q4 2020
Net Loss $(7,679) $(90,386)
Add Back
Interest expense and financing charges, net of interest income 22,542 22,823
Income tax expense 3,565 5,612
Depreciation 16,681 16,720
Amortization of deferred costs 9,495 12,911
Loss on impairment - 61,139
Loss / (gain) on disposal of assets (5,680) 2,012
EBITDA $38,924 $30,831
Acquired rig reactivation costs 113 400
Restructuring costs 1 265 576
Adjusted EBITDA $39,302 $31,807
Adjusted EBITDA margin 30.8% 26.2%
13Mar 2021 |
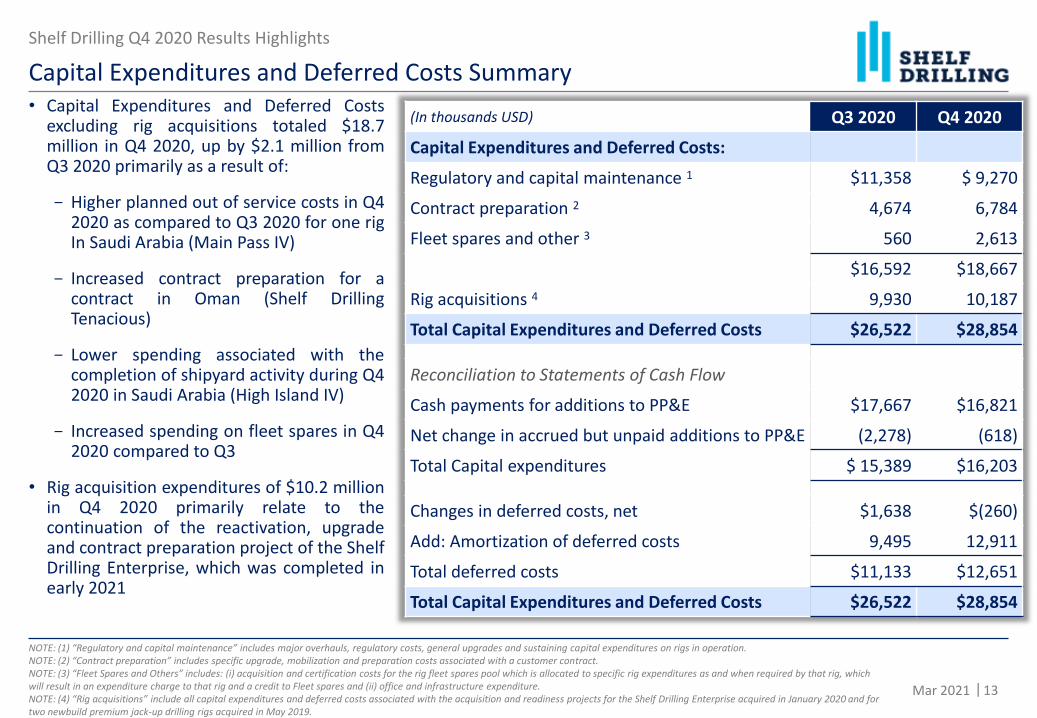
• Capital Expenditures and Deferred Costsexcluding rig acquisitions totaled $18.7million in Q4 2020, up by $2.1 million fromQ3 2020 primarily as a result of:
- Higher planned out of service costs in Q42020 as compared to Q3 2020 for one rigIn Saudi Arabia (Main Pass IV)
- Increased contract preparation for acontract in Oman (Shelf DrillingTenacious)
- Lower spending associated with thecompletion of shipyard activity during Q42020 in Saudi Arabia (High Island IV)
- Increased spending on fleet spares in Q42020 compared to Q3
• Rig acquisition expenditures of $10.2 millionin Q4 2020 primarily relate to thecontinuation of the reactivation, upgradeand contract preparation project of the ShelfDrilling Enterprise, which was completed inearly 2021
Shelf Drilling Q4 2020 Results Highlights
Capital Expenditures and Deferred Costs Summary
NOTE: (1) “Regulatory and capital maintenance” includes major overhauls, regulatory costs, general upgrades and sustaining capital expenditures on rigs in operation. NOTE: (2) “Contract preparation” includes specific upgrade, mobilization and preparation costs associated with a customer contract.NOTE: (3) “Fleet Spares and Others” includes: (i) acquisition and certification costs for the rig fleet spares pool which is allocated to specific rig expenditures as and when required by that rig, which will result in an expenditure charge to that rig and a credit to Fleet spares and (ii) office and infrastructure expenditure.NOTE: (4) “Rig acquisitions” include all capital expenditures and deferred costs associated with the acquisition and readiness projects for the Shelf Drilling Enterprise acquired in January 2020 and for two newbuild premium jack-up drilling rigs acquired in May 2019.
(In thousands USD) Q3 2020 Q4 2020
Capital Expenditures and Deferred Costs:
Regulatory and capital maintenance 1 $11,358 $ 9,270
Contract preparation 2 4,674 6,784
Fleet spares and other 3 560 2,613
$16,592 $18,667
Rig acquisitions 4 9,930 10,187
Total Capital Expenditures and Deferred Costs $26,522 $28,854
Reconciliation to Statements of Cash Flow
Cash payments for additions to PP&E $17,667 $16,821
Net change in accrued but unpaid additions to PP&E (2,278) (618)
Total Capital expenditures $ 15,389 $16,203
Changes in deferred costs, net $1,638 $(260)
Add: Amortization of deferred costs 9,495 12,911
Total deferred costs $11,133 $12,651
Total Capital Expenditures and Deferred Costs $26,522 $28,854
14Mar 2021 |
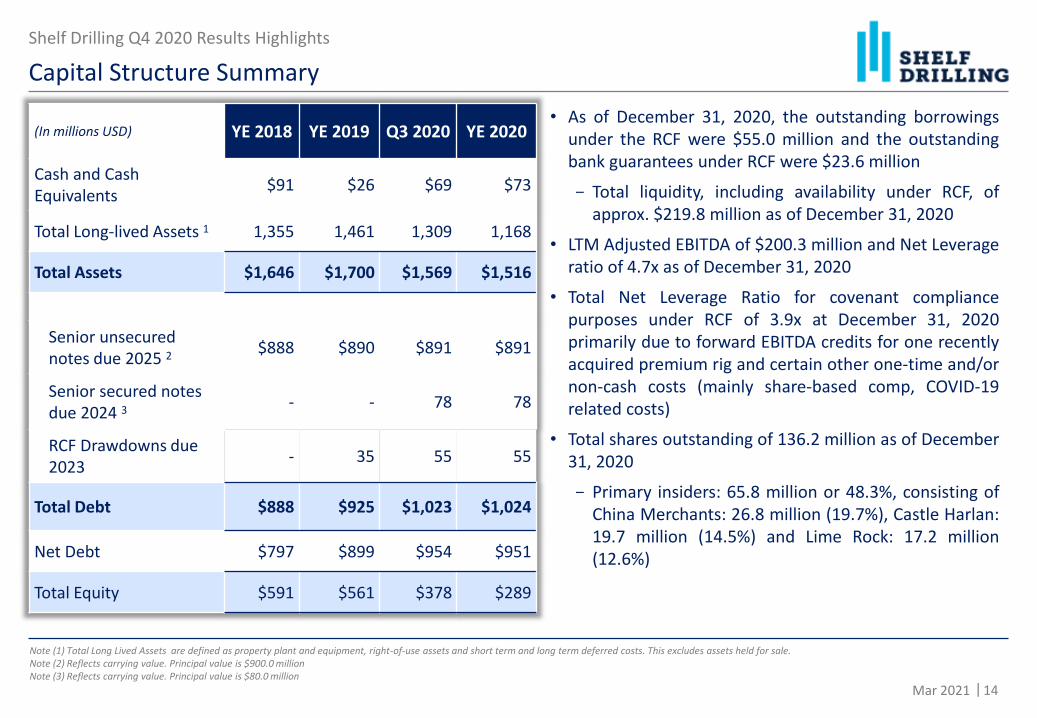
Note (1) Total Long Lived Assets are defined as property plant and equipment, right-of-use assets and short term and long term deferred costs. This excludes assets held for sale.Note (2) Reflects carrying value. Principal value is $900.0 millionNote (3) Reflects carrying value. Principal value is $80.0 million
Shelf Drilling Q4 2020 Results Highlights
Capital Structure Summary
(In millions USD) YE 2018 YE 2019 Q3 2020 YE 2020
Cash and Cash Equivalents
$91 $26 $69 $73
Total Long-lived Assets 1 1,355 1,461 1,309 1,168
Total Assets $1,646 $1,700 $1,569 $1,516
Senior unsecured notes due 2025 2
$888 $890 $891 $891
Senior secured notes due 2024 3
- - 78 78
RCF Drawdowns due 2023
- 35 55 55
Total Debt $888 $925 $1,023 $1,024
Net Debt $797 $899 $954 $951
Total Equity $591 $561 $378 $289
• As of December 31, 2020, the outstanding borrowingsunder the RCF were $55.0 million and the outstandingbank guarantees under RCF were $23.6 million
- Total liquidity, including availability under RCF, ofapprox. $219.8 million as of December 31, 2020
• LTM Adjusted EBITDA of $200.3 million and Net Leverageratio of 4.7x as of December 31, 2020
• Total Net Leverage Ratio for covenant compliancepurposes under RCF of 3.9x at December 31, 2020primarily due to forward EBITDA credits for one recentlyacquired premium rig and certain other one-time and/ornon-cash costs (mainly share-based comp, COVID-19related costs)
• Total shares outstanding of 136.2 million as of December31, 2020
- Primary insiders: 65.8 million or 48.3%, consisting ofChina Merchants: 26.8 million (19.7%), Castle Harlan:19.7 million (14.5%) and Lime Rock: 17.2 million(12.6%)
15Mar 2021 |
Shelf Drilling Q4 2020 Results Highlights
Free Cash Flow Summary
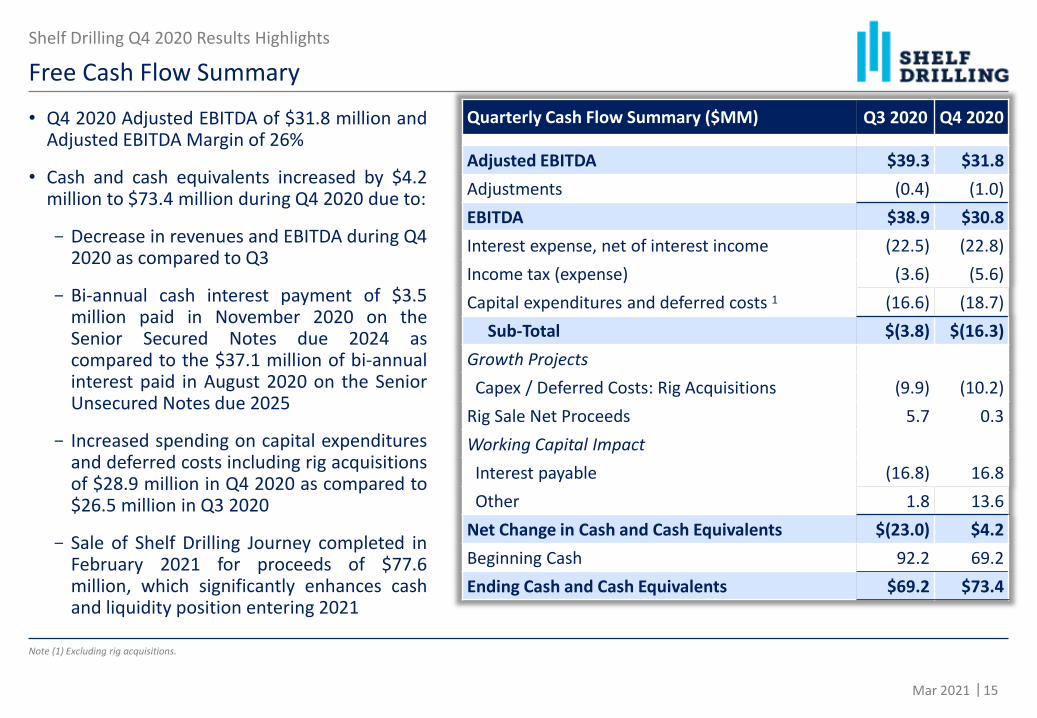
Quarterly Cash Flow Summary ($MM) Q3 2020 Q4 2020
Adjusted EBITDA $39.3 $31.8
Adjustments (0.4) (1.0)
EBITDA $38.9 $30.8
Interest expense, net of interest income (22.5) (22.8)
Income tax (expense) (3.6) (5.6)
Capital expenditures and deferred costs 1 (16.6) (18.7)
Sub-Total $(3.8) $(16.3)
Growth Projects
Capex / Deferred Costs: Rig Acquisitions (9.9) (10.2)
Rig Sale Net Proceeds 5.7 0.3
Working Capital Impact
Interest payable (16.8) 16.8
Other 1.8 13.6
Net Change in Cash and Cash Equivalents $(23.0) $4.2
Beginning Cash 92.2 69.2
Ending Cash and Cash Equivalents $69.2 $73.4
Note (1) Excluding rig acquisitions.
• Q4 2020 Adjusted EBITDA of $31.8 million andAdjusted EBITDA Margin of 26%
• Cash and cash equivalents increased by $4.2million to $73.4 million during Q4 2020 due to:
- Decrease in revenues and EBITDA during Q42020 as compared to Q3
- Bi-annual cash interest payment of $3.5million paid in November 2020 on theSenior Secured Notes due 2024 ascompared to the $37.1 million of bi-annualinterest paid in August 2020 on the SeniorUnsecured Notes due 2025
- Increased spending on capital expendituresand deferred costs including rig acquisitionsof $28.9 million in Q4 2020 as compared to$26.5 million in Q3 2020
- Sale of Shelf Drilling Journey completed inFebruary 2021 for proceeds of $77.6million, which significantly enhances cashand liquidity position entering 2021