Embed Size (px)
Citation preview
2Q14 RIG SECTOR PREVIEW
Prepared by analyst: Ivar Andreas Lemmechen Gjul, Fondsfinans AS, tel: +47 23113024, e-mail: [email protected]
Drilling deeper into trouble
10-Jul-2014
1
This report was prepared by an analyst engaged by Fondsfinans AS, the Norwegian affiliate of Fondsfinans Inc., who is not registered as a research analyst with FINRA or subject to FINRA rules governing research. See page 71 -74 of this report for Important Disclosure Information.
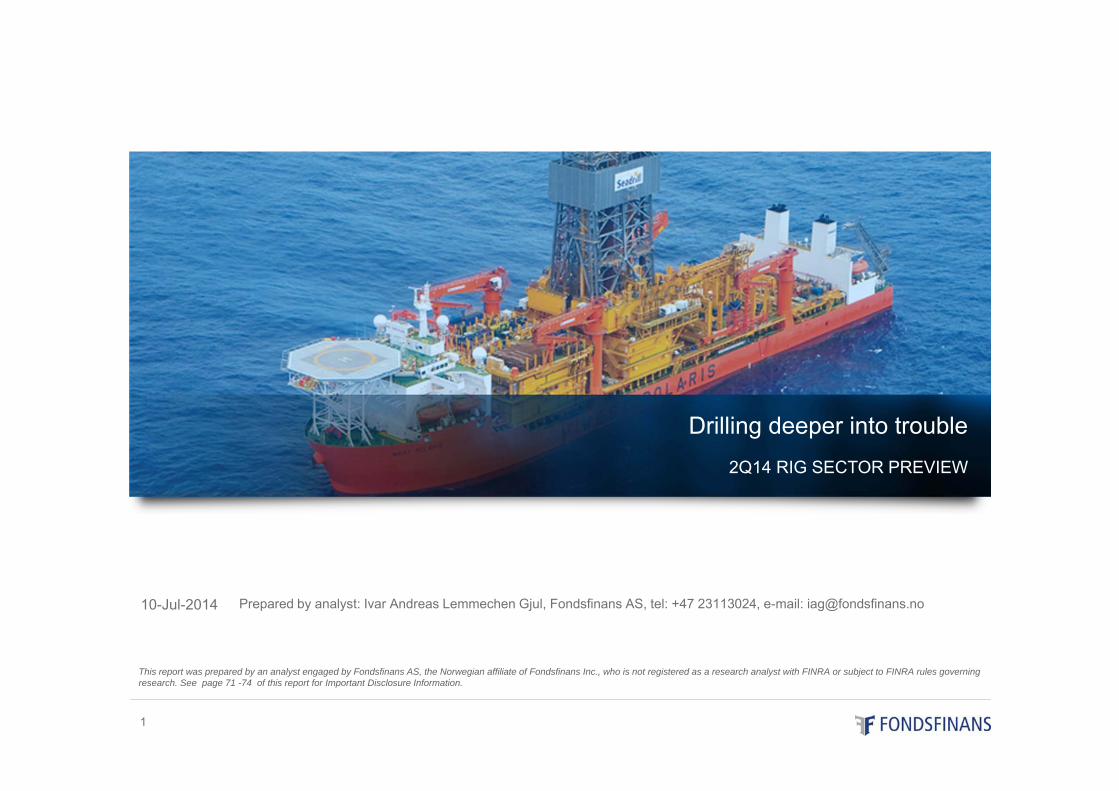
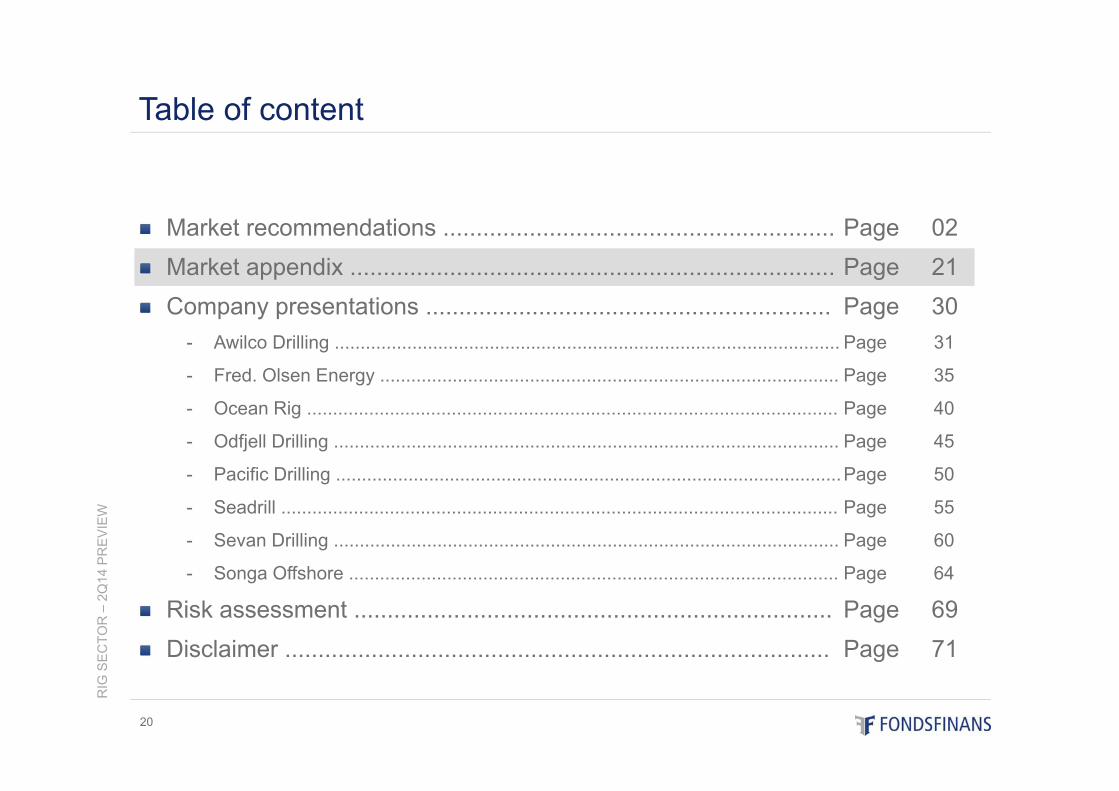
Market recommendations ........................................................... Page 02Market appendix ......................................................................... Page 21Company presentations ............................................................. Page 30
- Awilco Drilling .................................................................................................. Page 31
- Fred. Olsen Energy ......................................................................................... Page 35
- Ocean Rig ....................................................................................................... Page 40
- Odfjell Drilling .................................................................................................. Page 45
- Pacific Drilling ..................................................................................................Page 50
- Seadrill ............................................................................................................ Page 55
- Sevan Drilling .................................................................................................. Page 60
- Songa Offshore ............................................................................................... Page 64
Risk assessment ........................................................................ Page 69Disclaimer .................................................................................. Page 71
RIG
SE
CTO
R –
2Q14
PR
EV
IEW
2
Table of content
RIG
SE
CTO
R –
2Q14
PR
EV
IEW
3
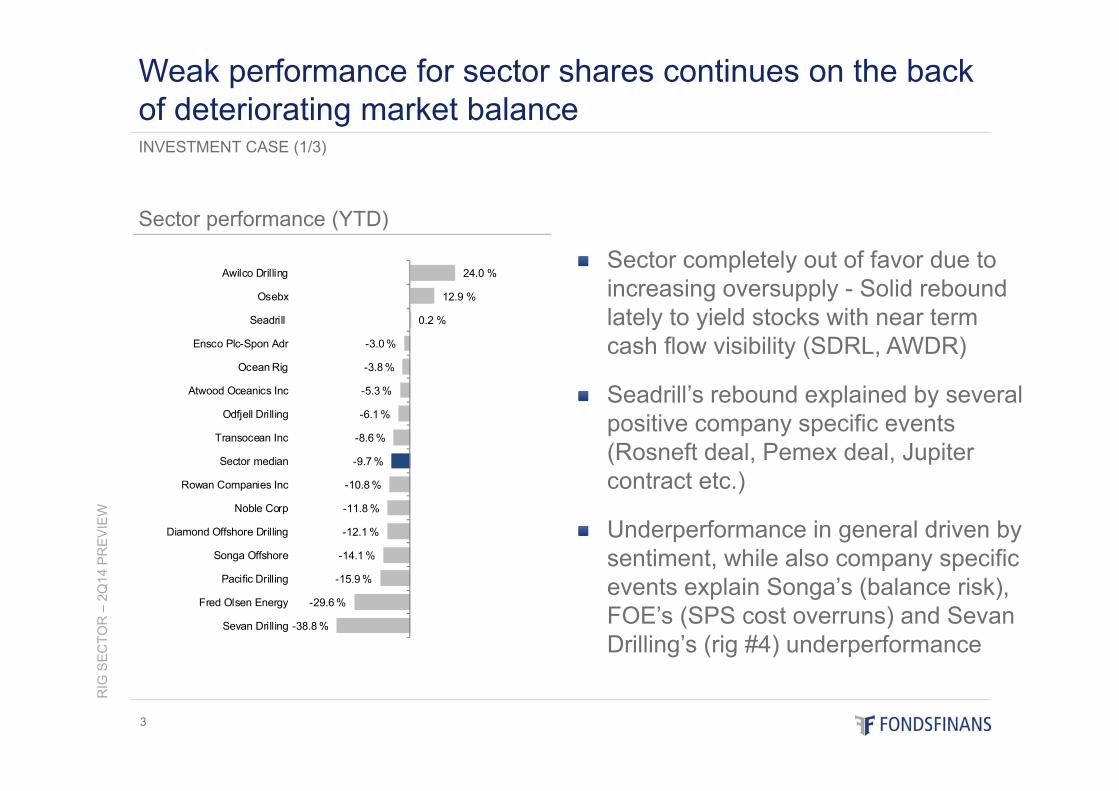
Sector completely out of favor due to increasing oversupply - Solid rebound lately to yield stocks with near term cash flow visibility (SDRL, AWDR)
Seadrill’s rebound explained by several positive company specific events (Rosneft deal, Pemex deal, Jupiter contract etc.)
Underperformance in general driven by sentiment, while also company specific events explain Songa’s (balance risk), FOE’s (SPS cost overruns) and SevanDrilling’s (rig #4) underperformance
INVESTMENT CASE (1/3)
Weak performance for sector shares continues on the back of deteriorating market balance
Sector performance (YTD)
24.0 %
12.9 %
0.2 %
-3.0 %
-3.8 %
-5.3 %
-6.1 %
-8.6 %
-9.7 %
-10.8 %
-11.8 %
-12.1 %
-14.1 %
-15.9 %
-29.6 %
-38.8 %
Awilco Drilling
Osebx
Seadrill
Ensco Plc-Spon Adr
Ocean Rig
Atwood Oceanics Inc
Odfjell Drilling
Transocean Inc
Sector median
Rowan Companies Inc
Noble Corp
Diamond Offshore Drilling
Songa Offshore
Pacific Drilling
Fred Olsen Energy
Sevan Drilling
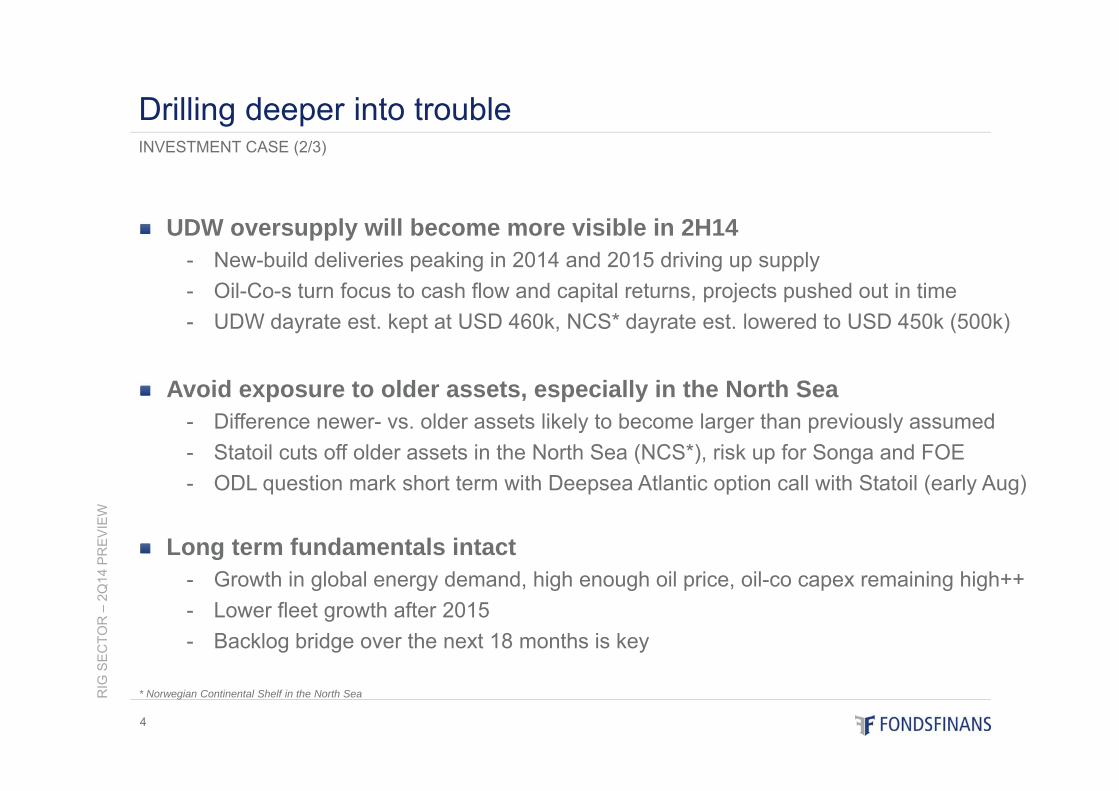
UDW oversupply will become more visible in 2H14- New-build deliveries peaking in 2014 and 2015 driving up supply - Oil-Co-s turn focus to cash flow and capital returns, projects pushed out in time- UDW dayrate est. kept at USD 460k, NCS* dayrate est. lowered to USD 450k (500k)
Avoid exposure to older assets, especially in the North Sea- Difference newer- vs. older assets likely to become larger than previously assumed- Statoil cuts off older assets in the North Sea (NCS*), risk up for Songa and FOE- ODL question mark short term with Deepsea Atlantic option call with Statoil (early Aug)
Long term fundamentals intact- Growth in global energy demand, high enough oil price, oil-co capex remaining high++- Lower fleet growth after 2015- Backlog bridge over the next 18 months is key
RIG
SE
CTO
R –
2Q14
PR
EV
IEW
4
INVESTMENT CASE (2/3)
Drilling deeper into trouble
* Norwegian Continental Shelf in the North Sea
RIG
SE
CTO
R –
2Q14
PR
EV
IEW
5
INVESTMENT CASE (3/3)
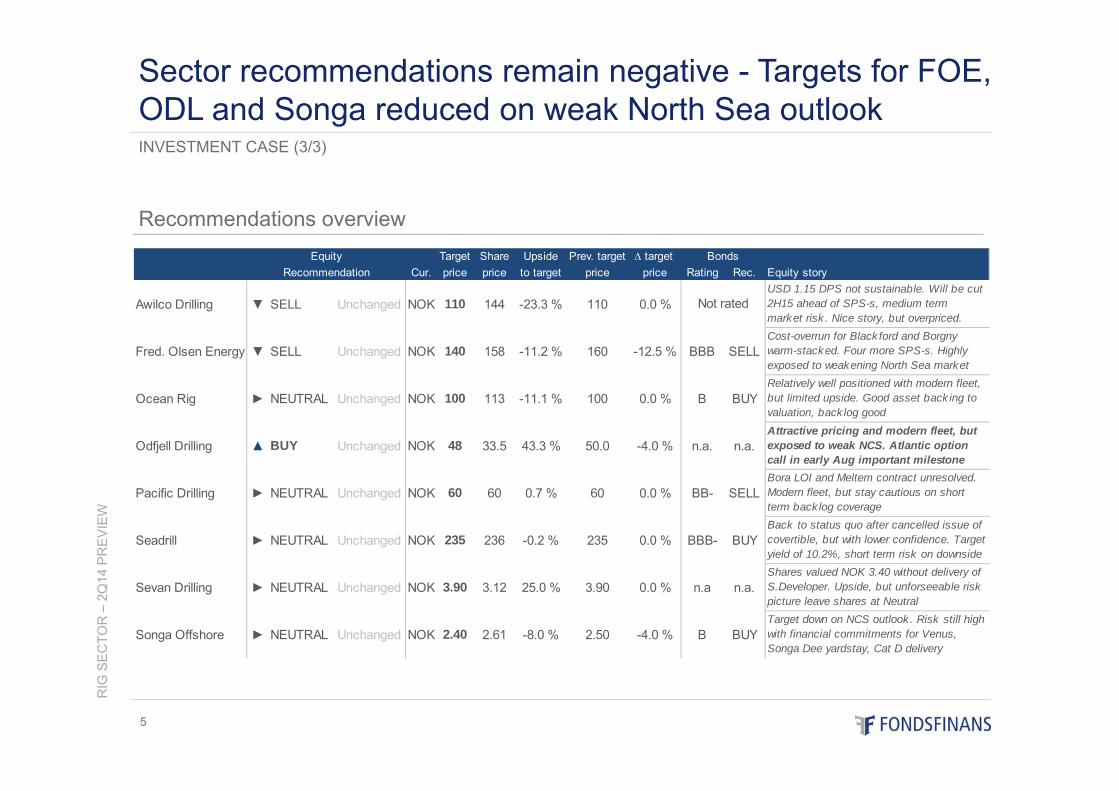
Sector recommendations remain negative - Targets for FOE, ODL and Songa reduced on weak North Sea outlook
Recommendations overviewTarget Share Upside Prev. target ∆ target
Cur. price price to target price price Rating Rec. Equity story
Awilco Drilling ▼ SELL Unchanged NOK 110 144 -23.3 % 110 0.0 %USD 1.15 DPS not sustainable. Will be cut 2H15 ahead of SPS-s, medium term market risk . Nice story, but overpriced.
Fred. Olsen Energy ▼ SELL Unchanged NOK 140 158 -11.2 % 160 -12.5 % BBB SELLCost-overrun for Black ford and Borgny warm-stacked. Four more SPS-s. Highly exposed to weakening North Sea market
Ocean Rig ► NEUTRAL Unchanged NOK 100 113 -11.1 % 100 0.0 % B BUYRelatively well positioned with modern fleet, but limited upside. Good asset back ing to valuation, back log good
Odfjell Drilling ▲ BUY Unchanged NOK 48 33.5 43.3 % 50.0 -4.0 % n.a. n.a.Attractive pricing and modern fleet, but exposed to weak NCS. Atlantic option call in early Aug important milestone
Pacific Drilling ► NEUTRAL Unchanged NOK 60 60 0.7 % 60 0.0 % BB- SELLBora LOI and Meltem contract unresolved. Modern fleet, but stay cautious on short term back log coverage
Seadrill ► NEUTRAL Unchanged NOK 235 236 -0.2 % 235 0.0 % BBB- BUYBack to status quo after cancelled issue of covertible, but with lower confidence. Target yield of 10.2%, short term risk on downside
Sevan Drilling ► NEUTRAL Unchanged NOK 3.90 3.12 25.0 % 3.90 0.0 % n.a n.a.Shares valued NOK 3.40 without delivery of S.Developer. Upside, but unforseeable risk picture leave shares at Neutral
Songa Offshore ► NEUTRAL Unchanged NOK 2.40 2.61 -8.0 % 2.50 -4.0 % B BUYTarget down on NCS outlook. Risk still high with financial commitments for Venus, Songa Dee yardstay, Cat D delivery
RecommendationEquity Bonds
Not rated
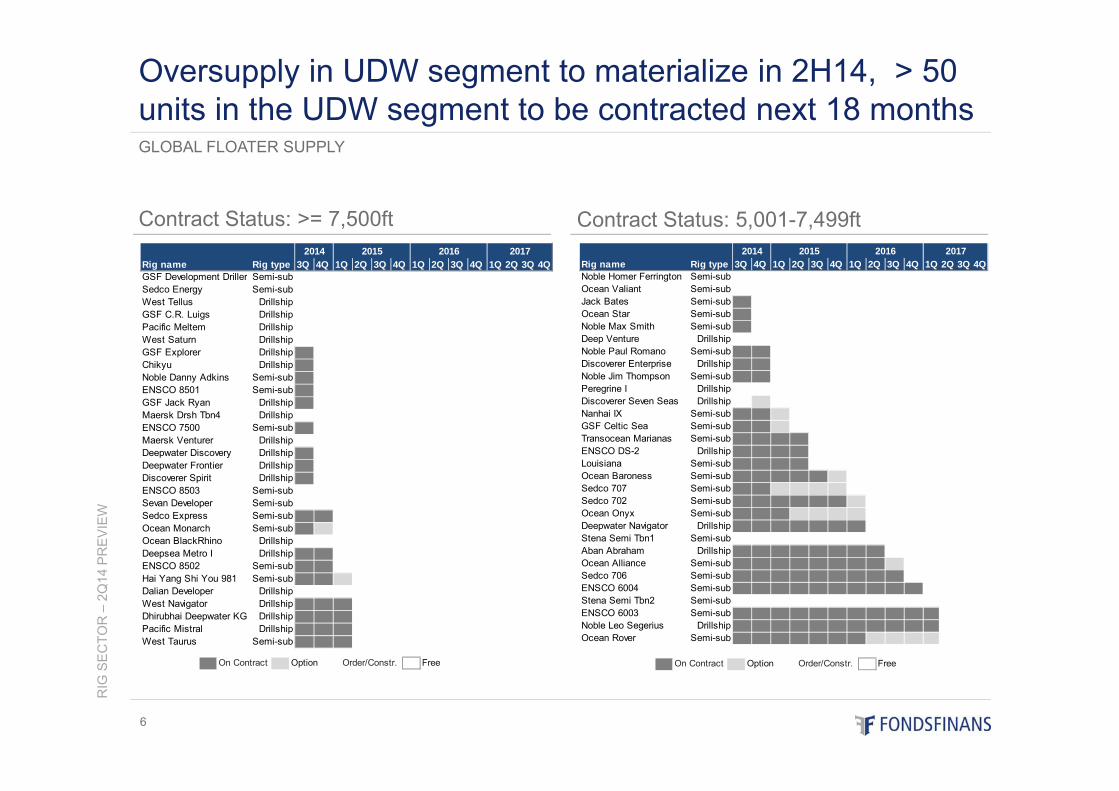
Rig name Rig type 3Q 4Q 1Q 2Q 3Q 4Q 1Q 2Q 3Q 4Q 1Q 2Q 3Q 4QNoble Homer Ferrington Semi-sub 0 0 0 0 0 0 0 0 0 0 0 0 0 0Ocean Valiant Semi-sub 0 0 0 0 0 0 0 0 0 0 0 0 0 0Jack Bates Semi-sub 1 0 0 0 0 0 0 0 0 0 0 0 0 0Ocean Star Semi-sub 1 0 0 0 0 0 0 0 0 0 0 0 0 0Noble Max Smith Semi-sub 1 0 0 0 0 0 0 0 0 0 0 0 0 0Deep Venture Drillship 0 0 0 0 0 0 0 0 0 0 0 0 0Noble Paul Romano Semi-sub 1 1 0 0 0 0 0 0 0 0 0 0 0 0Discoverer Enterprise Drillship 1 1 0 0 0 0 0 0 0 0 0 0 0 0Noble Jim Thompson Semi-sub 1 1 0 0 0 0 0 0 0 0 0 0 0 0Peregrine I Drillship 0 0 0 0 0 0 0 0 0 0 0 0Discoverer Seven Seas Drillship 12 0 0 0 0 0 0 0 0 0 0 0 0Nanhai IX Semi-sub 1 1 10 0 0 0 0 0 0 0 0 0 0 0GSF Celtic Sea Semi-sub 1 1 10 0 0 0 0 0 0 0 0 0 0 0Transocean Marianas Semi-sub 1 1 1 1 0 0 0 0 0 0 0 0 0 0ENSCO DS-2 Drillship 1 1 1 1 0 0 0 0 0 0 0 0 0 0Louisiana Semi-sub 1 1 1 1 0 0 0 0 0 0 0 0 0 0Ocean Baroness Semi-sub 1 1 1 1 1 10 0 0 0 0 0 0 0 0Sedco 707 Semi-sub 1 1 10 10 10 10 0 0 0 0 0 0 0 0Sedco 702 Semi-sub 1 1 1 1 1 1 10 0 0 0 0 0 0 0Ocean Onyx Semi-sub 1 1 1 10 10 10 10 0 0 0 0 0 0 0Deepwater Navigator Drillship 1 1 1 1 1 1 1 0 0 0 0 0 0 0Stena Semi Tbn1 Semi-sub 0 0 0 0 0 0Aban Abraham Drillship 1 1 1 1 1 1 1 1 0 0 0 0 0 0Ocean Alliance Semi-sub 1 1 1 1 1 1 1 1 10 0 0 0 0 0Sedco 706 Semi-sub 1 1 1 1 1 1 1 1 1 0 0 0 0 0ENSCO 6004 Semi-sub 1 1 1 1 1 1 1 1 1 1 0 0 0 0Stena Semi Tbn2 Semi-sub 0 0 0 0ENSCO 6003 Semi-sub 1 1 1 1 1 1 1 1 1 1 1 0 0 0Noble Leo Segerius Drillship 1 1 1 1 1 1 1 1 1 1 1 0 0 0Ocean Rover Semi-sub 1 1 1 1 1 1 1 10 10 10 10 0 0 0
2014 2015 2016 2017
Contract Status: >= 7,500ft
RIG
SE
CTO
R –
2Q14
PR
EV
IEW
6
Contract Status: 5,001-7,499ft
GLOBAL FLOATER SUPPLY
Oversupply in UDW segment to materialize in 2H14, > 50 units in the UDW segment to be contracted next 18 months
On Contract Option Order/Constr. Free On Contract Option Order/Constr. Free
Rig name Rig type 3Q 4Q 1Q 2Q 3Q 4Q 1Q 2Q 3Q 4Q 1Q 2Q 3Q 4QGSF Development Driller Semi-sub 0 0 0 0 0 0 0 0 0 0 0 0 0 0Sedco Energy Semi-sub 0 0 0 0 0 0 0 0 0 0 0 0 0 0West Tellus Drillship 0 0 0 0 0 0 0 0 0 0 0 0 0 0GSF C.R. Luigs Drillship 0 0 0 0 0 0 0 0 0 0 0 0 0 0Pacific Meltem Drillship 0 0 0 0 0 0 0 0 0 0 0 0 0West Saturn Drillship 0 0 0 0 0 0 0 0 0 0 0 0 0GSF Explorer Drillship 1 0 0 0 0 0 0 0 0 0 0 0 0 0Chikyu Drillship 1 0 0 0 0 0 0 0 0 0 0 0 0 0Noble Danny Adkins Semi-sub 1 0 0 0 0 0 0 0 0 0 0 0 0 0ENSCO 8501 Semi-sub 1 0 0 0 0 0 0 0 0 0 0 0 0 0GSF Jack Ryan Drillship 1 0 0 0 0 0 0 0 0 0 0 0 0 0Maersk Drsh Tbn4 Drillship 0 0 0 0 0 0 0 0 0 0 0 0 0ENSCO 7500 Semi-sub 1 0 0 0 0 0 0 0 0 0 0 0 0 0Maersk Venturer Drillship 0 0 0 0 0 0 0 0 0 0 0 0 0Deepwater Discovery Drillship 1 0 0 0 0 0 0 0 0 0 0 0 0 0Deepwater Frontier Drillship 1 0 0 0 0 0 0 0 0 0 0 0 0 0Discoverer Spirit Drillship 1 0 0 0 0 0 0 0 0 0 0 0 0 0ENSCO 8503 Semi-sub 0 0 0 0 0 0 0 0 0 0 0 0 0Sevan Developer Semi-sub 0 0 0 0 0 0 0 0 0 0 0 0Sedco Express Semi-sub 1 1 0 0 0 0 0 0 0 0 0 0 0 0Ocean Monarch Semi-sub 1 10 0 0 0 0 0 0 0 0 0 0 0 0Ocean BlackRhino Drillship 0 0 0 0 0 0 0 0 0 0 0 0Deepsea Metro I Drillship 1 1 0 0 0 0 0 0 0 0 0 0 0 0ENSCO 8502 Semi-sub 1 1 0 0 0 0 0 0 0 0 0 0 0 0Hai Yang Shi You 981 Semi-sub 1 1 10 0 0 0 0 0 0 0 0 0 0 0Dalian Developer Drillship 0 0 0 0 0 0 0 0 0 0 0West Navigator Drillship 1 1 1 0 0 0 0 0 0 0 0 0 0 0Dhirubhai Deepwater KG Drillship 1 1 1 0 0 0 0 0 0 0 0 0 0 0Pacific Mistral Drillship 1 1 1 0 0 0 0 0 0 0 0 0 0 0West Taurus Semi-sub 1 1 1 0 0 0 0 0 0 0 0 0 0 0
2014 2015 2016 2017
Contract Status: 3,001-5,000ft
RIG
SE
CTO
R –
2Q14
PR
EV
IEW
7
Contract Status: ≤3,000ft
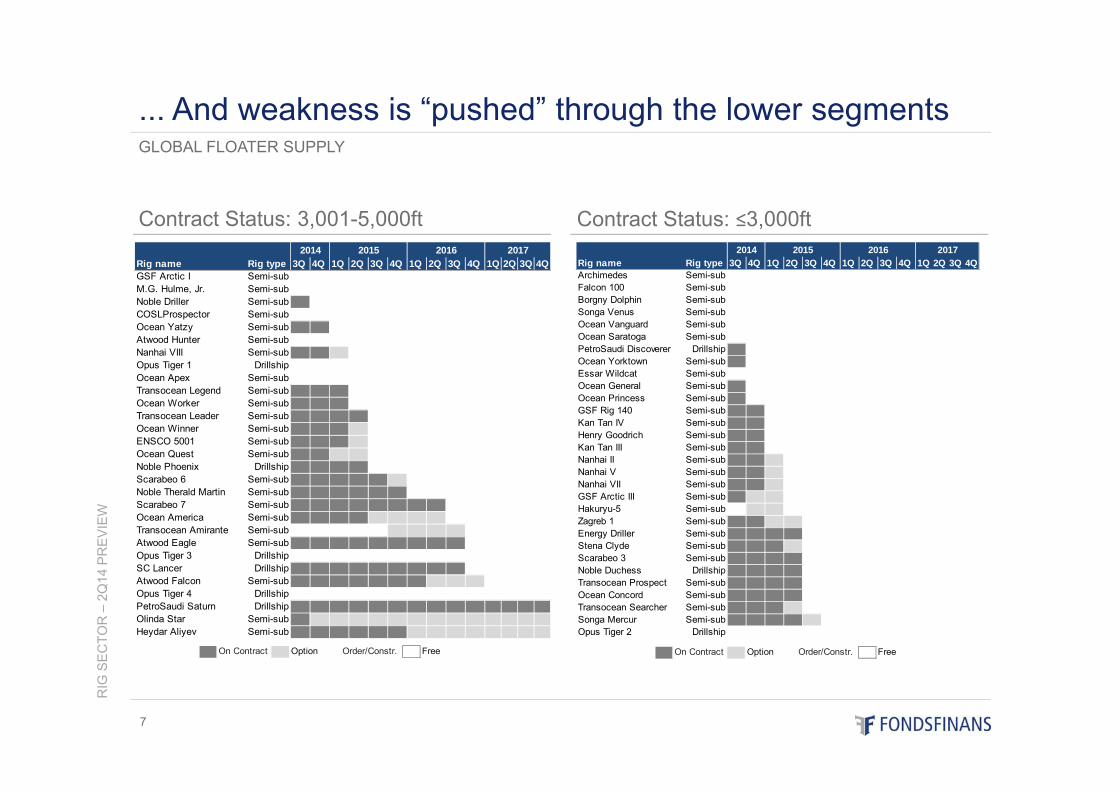
GLOBAL FLOATER SUPPLY
... And weakness is “pushed” through the lower segments
On Contract Option Order/Constr. Free On Contract Option Order/Constr. Free
Rig name Rig type 3Q 4Q 1Q 2Q 3Q 4Q 1Q 2Q 3Q 4Q 1Q 2Q 3Q 4QGSF Arctic I Semi-sub 0 0 0 0 0 0 0 0 0 0 0 0 0 0M.G. Hulme, Jr. Semi-sub 0 0 0 0 0 0 0 0 0 0 0 0 0Noble Driller Semi-sub 1 0 0 0 0 0 0 0 0 0 0 0 0 0COSLProspector Semi-sub 0 0 0 0 0 0 0 0 0 0 0 0Ocean Yatzy Semi-sub 1 1 0 0 0 0 0 0 0 0 0 0 0 0Atwood Hunter Semi-sub 0 0 0 0 0 0 0 0 0 0 0 0Nanhai VIII Semi-sub 1 1 10 0 0 0 0 0 0 0 0 0 0 0Opus Tiger 1 Drillship 0 0 0 0 0 0 0 0 0 0 0Ocean Apex Semi-sub 0 0 0 0 0 0 0 0 0 0 0Transocean Legend Semi-sub 1 1 1 0 0 0 0 0 0 0 0 0 0 0Ocean Worker Semi-sub 1 1 1 0 0 0 0 0 0 0 0 0 0 0Transocean Leader Semi-sub 1 1 1 1 0 0 0 0 0 0 0 0 0 0Ocean Winner Semi-sub 1 1 1 10 0 0 0 0 0 0 0 0 0 0ENSCO 5001 Semi-sub 1 1 1 10 0 0 0 0 0 0 0 0 0 0Ocean Quest Semi-sub 1 1 10 10 0 0 0 0 0 0 0 0 0 0Noble Phoenix Drillship 1 1 1 1 0 0 0 0 0 0 0 0 0 0Scarabeo 6 Semi-sub 1 1 1 1 1 10 0 0 0 0 0 0 0 0Noble Therald Martin Semi-sub 1 1 1 1 1 1 0 0 0 0 0 0 0 0Scarabeo 7 Semi-sub 1 1 1 1 1 1 1 1 0 0 0 0 0 0Ocean America Semi-sub 1 1 1 1 10 10 10 10 0 0 0 0 0 0Transocean Amirante Semi-sub 12 12 12 12 0 0 0 0 0Atwood Eagle Semi-sub 1 1 1 1 1 1 1 1 1 0 0 0 0 0Opus Tiger 3 Drillship 0 0 0 0 0SC Lancer Drillship 1 1 1 1 1 1 1 1 1 0 0 0 0 0Atwood Falcon Semi-sub 1 1 1 1 1 1 1 10 10 10 0 0 0 0Opus Tiger 4 Drillship 0 0 0PetroSaudi Saturn Drillship 1 1 1 1 1 1 1 1 1 1 1 1 1 1Olinda Star Semi-sub 1 10 10 10 10 10 10 10 10 10 10 10 10 10Heydar Aliyev Semi-sub 1 1 1 1 1 1 10 10 10 10 10 10 10 10
2014 2015 2016 2017Rig name Rig type 3Q 4Q 1Q 2Q 3Q 4Q 1Q 2Q 3Q 4Q 1Q 2Q 3Q 4QArchimedes Semi-sub 0 0 0 0 0 0 0 0 0 0 0 0 0 0Falcon 100 Semi-sub 0 0 0 0 0 0 0 0 0 0 0 0 0 0Borgny Dolphin Semi-sub 0 0 0 0 0 0 0 0 0 0 0 0 0 0Songa Venus Semi-sub 0 0 0 0 0 0 0 0 0 0 0 0 0 0Ocean Vanguard Semi-sub 0 0 0 0 0 0 0 0 0 0 0 0 0 0Ocean Saratoga Semi-sub 0 0 0 0 0 0 0 0 0 0 0 0 0 0PetroSaudi Discoverer Drillship 1 0 0 0 0 0 0 0 0 0 0 0 0 0Ocean Yorktown Semi-sub 1 0 0 0 0 0 0 0 0 0 0 0 0 0Essar Wildcat Semi-sub 0 0 0 0 0 0 0 0 0 0 0 0 0Ocean General Semi-sub 1 0 0 0 0 0 0 0 0 0 0 0 0 0Ocean Princess Semi-sub 1 0 0 0 0 0 0 0 0 0 0 0 0 0GSF Rig 140 Semi-sub 1 1 0 0 0 0 0 0 0 0 0 0 0 0Kan Tan IV Semi-sub 1 1 0 0 0 0 0 0 0 0 0 0 0 0Henry Goodrich Semi-sub 1 1 0 0 0 0 0 0 0 0 0 0 0 0Kan Tan III Semi-sub 1 1 0 0 0 0 0 0 0 0 0 0 0 0Nanhai II Semi-sub 1 1 10 0 0 0 0 0 0 0 0 0 0 0Nanhai V Semi-sub 1 1 10 0 0 0 0 0 0 0 0 0 0 0Nanhai VII Semi-sub 1 1 10 0 0 0 0 0 0 0 0 0 0 0GSF Arctic III Semi-sub 1 10 10 0 0 0 0 0 0 0 0 0 0 0Hakuryu-5 Semi-sub 12 12 0 0 0 0 0 0 0 0 0 0 0Zagreb 1 Semi-sub 1 1 10 10 0 0 0 0 0 0 0 0 0 0Energy Driller Semi-sub 1 1 1 1 0 0 0 0 0 0 0 0 0 0Stena Clyde Semi-sub 1 1 1 10 0 0 0 0 0 0 0 0 0 0Scarabeo 3 Semi-sub 1 1 1 1 0 0 0 0 0 0 0 0 0 0Noble Duchess Drillship 1 1 1 1 0 0 0 0 0 0 0 0 0 0Transocean Prospect Semi-sub 1 1 1 1 0 0 0 0 0 0 0 0 0 0Ocean Concord Semi-sub 1 1 1 1 0 0 0 0 0 0 0 0 0 0Transocean Searcher Semi-sub 1 1 1 10 0 0 0 0 0 0 0 0 0 0Songa Mercur Semi-sub 1 1 1 1 10 0 0 0 0 0 0 0 0 0Opus Tiger 2 Drillship 0 0 0 0 0 0 0 0 0
2014 2015 2016 2017
Statoil NCS fleet overview
RIG
SE
CTO
R –
2Q14
PR
EV
IEW
8
Source: Fondsfinans Research / ODS Petrodata
Other NCS fleet overview
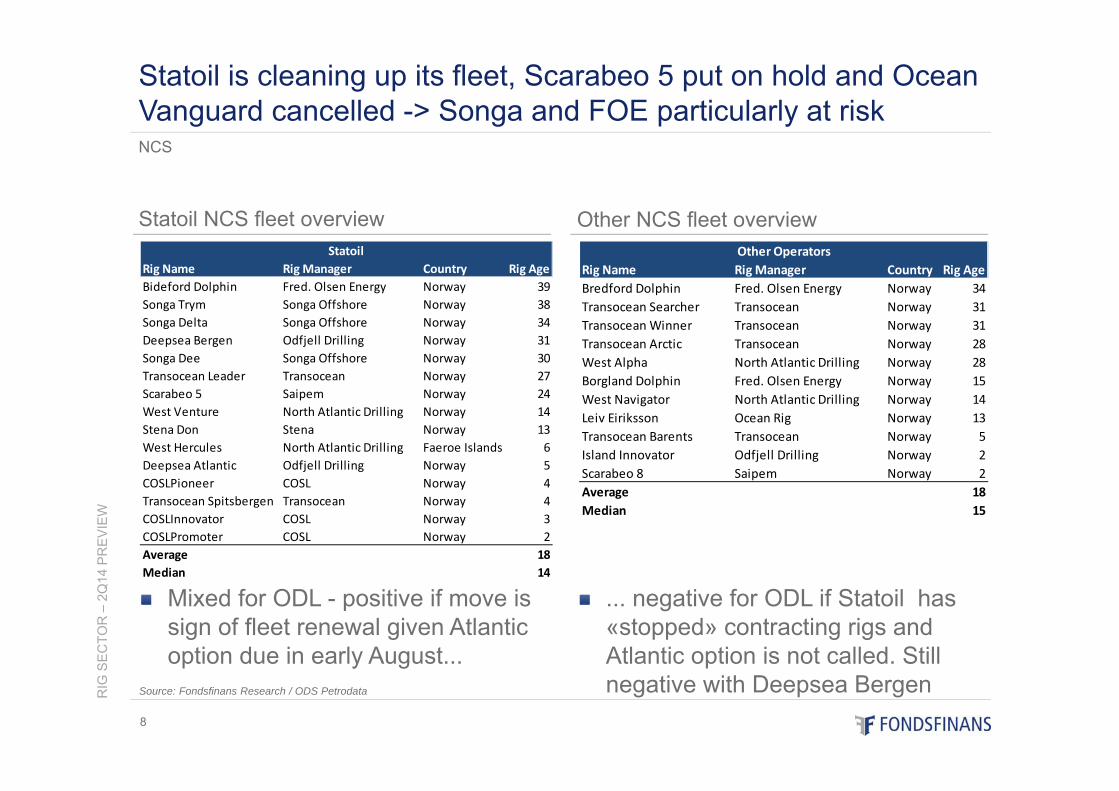
Mixed for ODL - positive if move is sign of fleet renewal given Atlantic option due in early August...
... negative for ODL if Statoil has «stopped» contracting rigs and Atlantic option is not called. Still negative with Deepsea Bergen
NCS
Statoil is cleaning up its fleet, Scarabeo 5 put on hold and Ocean Vanguard cancelled -> Songa and FOE particularly at risk
Rig Name Rig Manager Country Rig AgeBredford Dolphin Fred. Olsen Energy Norway 34Transocean Searcher Transocean Norway 31Transocean Winner Transocean Norway 31Transocean Arctic Transocean Norway 28West Alpha North Atlantic Drilling Norway 28Borgland Dolphin Fred. Olsen Energy Norway 15West Navigator North Atlantic Drilling Norway 14Leiv Eiriksson Ocean Rig Norway 13Transocean Barents Transocean Norway 5Island Innovator Odfjell Drilling Norway 2Scarabeo 8 Saipem Norway 2Average 18Median 15
Other OperatorsRig Name Rig Manager Country Rig AgeBideford Dolphin Fred. Olsen Energy Norway 39Songa Trym Songa Offshore Norway 38Songa Delta Songa Offshore Norway 34Deepsea Bergen Odfjell Drilling Norway 31Songa Dee Songa Offshore Norway 30Transocean Leader Transocean Norway 27Scarabeo 5 Saipem Norway 24West Venture North Atlantic Drilling Norway 14Stena Don Stena Norway 13West Hercules North Atlantic Drilling Faeroe Islands 6Deepsea Atlantic Odfjell Drilling Norway 5COSLPioneer COSL Norway 4Transocean Spitsbergen Transocean Norway 4COSLInnovator COSL Norway 3COSLPromoter COSL Norway 2Average 18Median 14
Statoil
RIG
SE
CTO
R –
2Q14
PR
EV
IEW
9
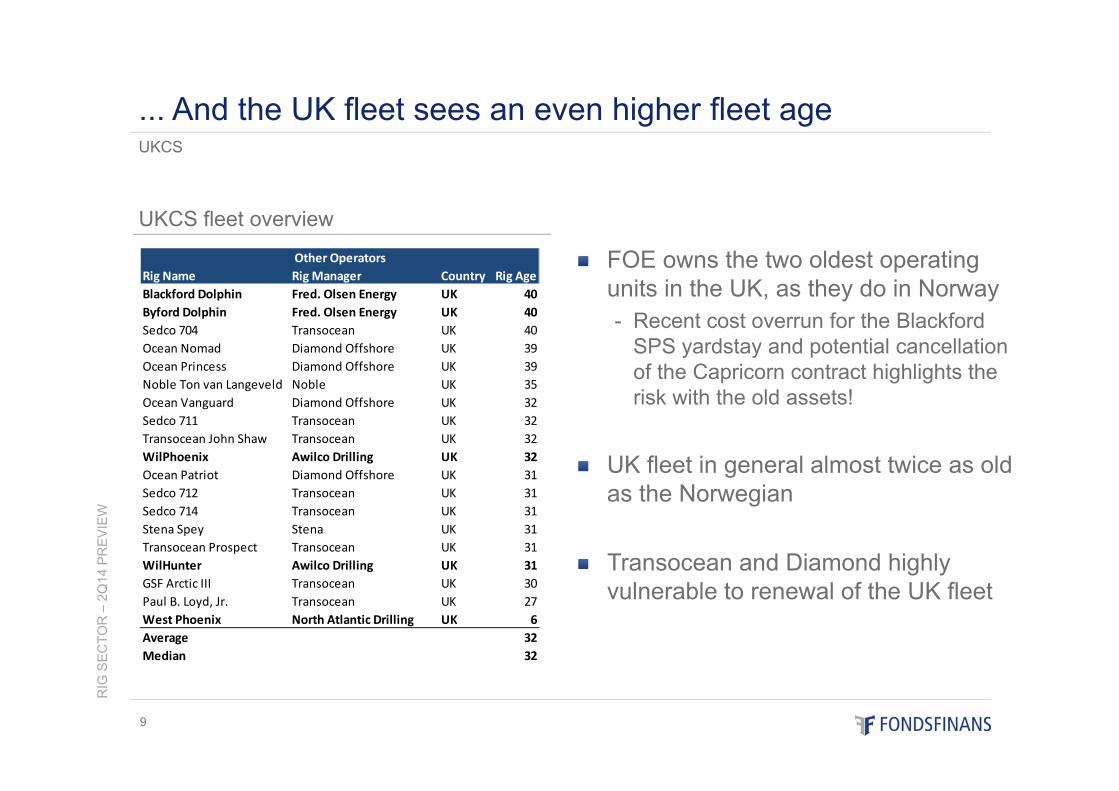
FOE owns the two oldest operating units in the UK, as they do in Norway- Recent cost overrun for the Blackford
SPS yardstay and potential cancellation of the Capricorn contract highlights the risk with the old assets!
UK fleet in general almost twice as old as the Norwegian
Transocean and Diamond highly vulnerable to renewal of the UK fleet
UKCS
... And the UK fleet sees an even higher fleet age
UKCS fleet overview
Rig Name Rig Manager Country Rig AgeBlackford Dolphin Fred. Olsen Energy UK 40Byford Dolphin Fred. Olsen Energy UK 40Sedco 704 Transocean UK 40Ocean Nomad Diamond Offshore UK 39Ocean Princess Diamond Offshore UK 39Noble Ton van Langeveld Noble UK 35Ocean Vanguard Diamond Offshore UK 32Sedco 711 Transocean UK 32Transocean John Shaw Transocean UK 32WilPhoenix Awilco Drilling UK 32Ocean Patriot Diamond Offshore UK 31Sedco 712 Transocean UK 31Sedco 714 Transocean UK 31Stena Spey Stena UK 31Transocean Prospect Transocean UK 31WilHunter Awilco Drilling UK 31GSF Arctic III Transocean UK 30Paul B. Loyd, Jr. Transocean UK 27West Phoenix North Atlantic Drilling UK 6Average 32Median 32
Other Operators
Global floater dayrates (USDk/day)
RIG
SE
CTO
R –
2Q14
PR
EV
IEW
10
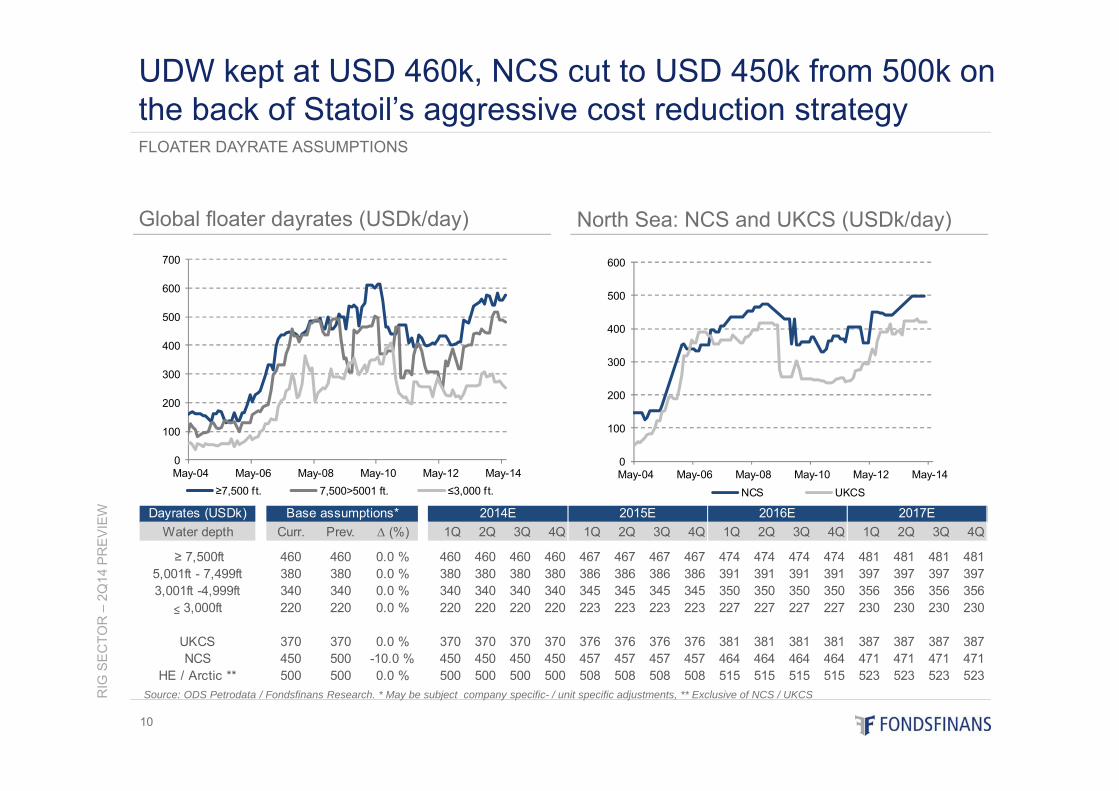
Source: ODS Petrodata / Fondsfinans Research. * May be subject company specific- / unit specific adjustments, ** Exclusive of NCS / UKCS
North Sea: NCS and UKCS (USDk/day)
FLOATER DAYRATE ASSUMPTIONS
UDW kept at USD 460k, NCS cut to USD 450k from 500k on the back of Statoil’s aggressive cost reduction strategy
0
100
200
300
400
500
600
700
May-04 May-06 May-08 May-10 May-12 May-14≥7,500 ft. 7,500>5001 ft. ≤3,000 ft.
0
100
200
300
400
500
600
May-04 May-06 May-08 May-10 May-12 May-14NCS UKCS
Dayrates (USDk)Water depth Curr. Prev. ∆ (%) 1Q 2Q 3Q 4Q 1Q 2Q 3Q 4Q 1Q 2Q 3Q 4Q 1Q 2Q 3Q 4Q
≥ 7,500ft 460 460 0.0 % 460 460 460 460 467 467 467 467 474 474 474 474 481 481 481 4815,001ft - 7,499ft 380 380 0.0 % 380 380 380 380 386 386 386 386 391 391 391 391 397 397 397 3973,001ft -4,999ft 340 340 0.0 % 340 340 340 340 345 345 345 345 350 350 350 350 356 356 356 356
≤ 3,000ft 220 220 0.0 % 220 220 220 220 223 223 223 223 227 227 227 227 230 230 230 230
UKCS 370 370 0.0 % 370 370 370 370 376 376 376 376 381 381 381 381 387 387 387 387NCS 450 500 -10.0 % 450 450 450 450 457 457 457 457 464 464 464 464 471 471 471 471
HE / Arctic ** 500 500 0.0 % 500 500 500 500 508 508 508 508 515 515 515 515 523 523 523 523
Base assumptions* 2017E2014E 2015E 2016E
RIG
SE
CTO
R –
2Q14
PR
EV
IEW
11
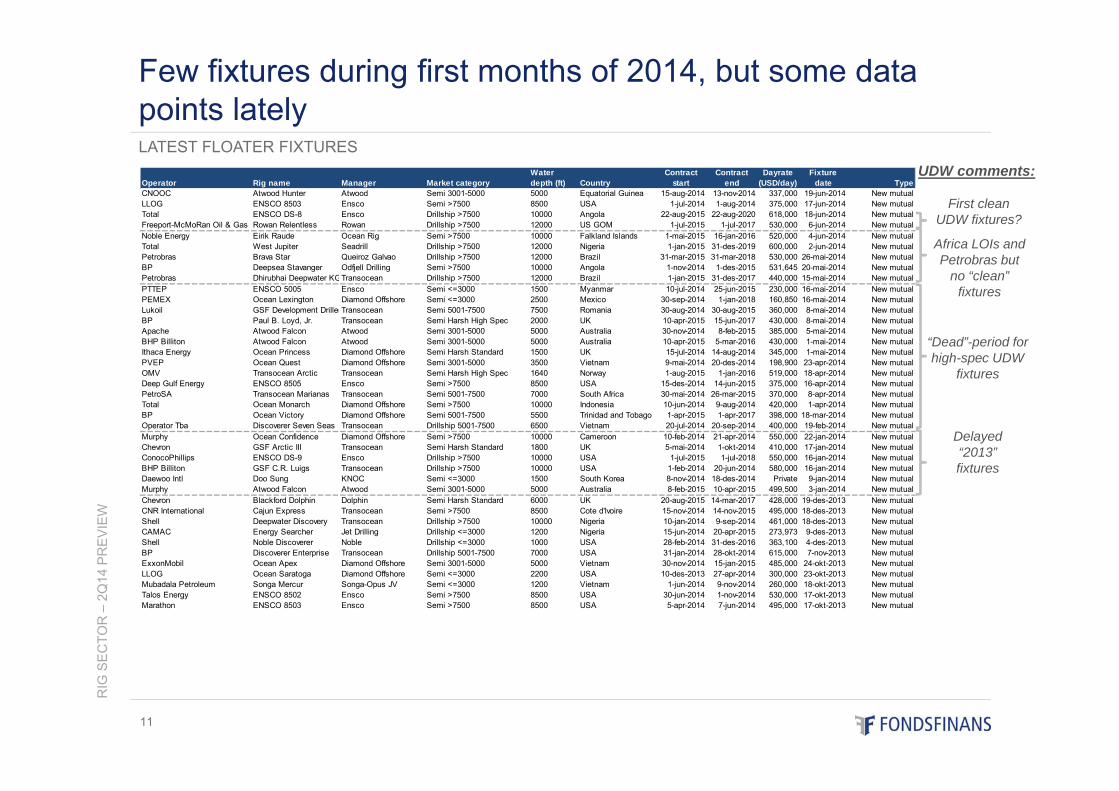
LATEST FLOATER FIXTURES
Few fixtures during first months of 2014, but some data points lately
Delayed “2013” fixtures
“Dead”-period for high-spec UDW
fixtures
Africa LOIs and Petrobras but
no “clean” fixtures
First clean UDW fixtures?
Operator Rig name Manager Market categoryWater depth (ft) Country
Contract start
Contract end
Dayrate (USD/day)
Fixture date Type
CNOOC Atwood Hunter Atwood Semi 3001-5000 5000 Equatorial Guinea 15-aug-2014 13-nov-2014 337,000 19-jun-2014 New mutualLLOG ENSCO 8503 Ensco Semi >7500 8500 USA 1-jul-2014 1-aug-2014 375,000 17-jun-2014 New mutualTotal ENSCO DS-8 Ensco Drillship >7500 10000 Angola 22-aug-2015 22-aug-2020 618,000 18-jun-2014 New mutualFreeport-McMoRan Oil & Gas Rowan Relentless Rowan Drillship >7500 12000 US GOM 1-jul-2015 1-jul-2017 530,000 6-jun-2014 New mutualNoble Energy Eirik Raude Ocean Rig Semi >7500 10000 Falkland Islands 1-mai-2015 16-jan-2016 520,000 4-jun-2014 New mutualTotal West Jupiter Seadrill Drillship >7500 12000 Nigeria 1-jan-2015 31-des-2019 600,000 2-jun-2014 New mutualPetrobras Brava Star Queiroz Galvao Drillship >7500 12000 Brazil 31-mar-2015 31-mar-2018 530,000 26-mai-2014 New mutualBP Deepsea Stavanger Odfjell Drilling Semi >7500 10000 Angola 1-nov-2014 1-des-2015 531,645 20-mai-2014 New mutualPetrobras Dhirubhai Deepwater KGTransocean Drillship >7500 12000 Brazil 1-jan-2015 31-des-2017 440,000 15-mai-2014 New mutualPTTEP ENSCO 5005 Ensco Semi <=3000 1500 Myanmar 10-jul-2014 25-jun-2015 230,000 16-mai-2014 New mutualPEMEX Ocean Lexington Diamond Offshore Semi <=3000 2500 Mexico 30-sep-2014 1-jan-2018 160,850 16-mai-2014 New mutualLukoil GSF Development DrillerTransocean Semi 5001-7500 7500 Romania 30-aug-2014 30-aug-2015 360,000 8-mai-2014 New mutualBP Paul B. Loyd, Jr. Transocean Semi Harsh High Spec 2000 UK 10-apr-2015 15-jun-2017 430,000 8-mai-2014 New mutualApache Atwood Falcon Atwood Semi 3001-5000 5000 Australia 30-nov-2014 8-feb-2015 385,000 5-mai-2014 New mutualBHP Billiton Atwood Falcon Atwood Semi 3001-5000 5000 Australia 10-apr-2015 5-mar-2016 430,000 1-mai-2014 New mutualIthaca Energy Ocean Princess Diamond Offshore Semi Harsh Standard 1500 UK 15-jul-2014 14-aug-2014 345,000 1-mai-2014 New mutualPVEP Ocean Quest Diamond Offshore Semi 3001-5000 3500 Vietnam 9-mai-2014 20-des-2014 198,900 23-apr-2014 New mutualOMV Transocean Arctic Transocean Semi Harsh High Spec 1640 Norway 1-aug-2015 1-jan-2016 519,000 18-apr-2014 New mutualDeep Gulf Energy ENSCO 8505 Ensco Semi >7500 8500 USA 15-des-2014 14-jun-2015 375,000 16-apr-2014 New mutualPetroSA Transocean Marianas Transocean Semi 5001-7500 7000 South Africa 30-mai-2014 26-mar-2015 370,000 8-apr-2014 New mutualTotal Ocean Monarch Diamond Offshore Semi >7500 10000 Indonesia 10-jun-2014 9-aug-2014 420,000 1-apr-2014 New mutualBP Ocean Victory Diamond Offshore Semi 5001-7500 5500 Trinidad and Tobago 1-apr-2015 1-apr-2017 398,000 18-mar-2014 New mutualOperator Tba Discoverer Seven Seas Transocean Drillship 5001-7500 6500 Vietnam 20-jul-2014 20-sep-2014 400,000 19-feb-2014 New mutualMurphy Ocean Confidence Diamond Offshore Semi >7500 10000 Cameroon 10-feb-2014 21-apr-2014 550,000 22-jan-2014 New mutualChevron GSF Arctic III Transocean Semi Harsh Standard 1800 UK 5-mai-2014 1-okt-2014 410,000 17-jan-2014 New mutualConocoPhillips ENSCO DS-9 Ensco Drillship >7500 10000 USA 1-jul-2015 1-jul-2018 550,000 16-jan-2014 New mutualBHP Billiton GSF C.R. Luigs Transocean Drillship >7500 10000 USA 1-feb-2014 20-jun-2014 580,000 16-jan-2014 New mutualDaewoo Intl Doo Sung KNOC Semi <=3000 1500 South Korea 8-nov-2014 18-des-2014 Private 9-jan-2014 New mutualMurphy Atwood Falcon Atwood Semi 3001-5000 5000 Australia 8-feb-2015 10-apr-2015 499,500 3-jan-2014 New mutualChevron Blackford Dolphin Dolphin Semi Harsh Standard 6000 UK 20-aug-2015 14-mar-2017 428,000 19-des-2013 New mutualCNR International Cajun Express Transocean Semi >7500 8500 Cote d'Ivoire 15-nov-2014 14-nov-2015 495,000 18-des-2013 New mutualShell Deepwater Discovery Transocean Drillship >7500 10000 Nigeria 10-jan-2014 9-sep-2014 461,000 18-des-2013 New mutualCAMAC Energy Searcher Jet Drilling Drillship <=3000 1200 Nigeria 15-jun-2014 20-apr-2015 273,973 9-des-2013 New mutualShell Noble Discoverer Noble Drillship <=3000 1000 USA 28-feb-2014 31-des-2016 363,100 4-des-2013 New mutualBP Discoverer Enterprise Transocean Drillship 5001-7500 7000 USA 31-jan-2014 28-okt-2014 615,000 7-nov-2013 New mutualExxonMobil Ocean Apex Diamond Offshore Semi 3001-5000 5000 Vietnam 30-nov-2014 15-jan-2015 485,000 24-okt-2013 New mutualLLOG Ocean Saratoga Diamond Offshore Semi <=3000 2200 USA 10-des-2013 27-apr-2014 300,000 23-okt-2013 New mutualMubadala Petroleum Songa Mercur Songa-Opus JV Semi <=3000 1200 Vietnam 1-jun-2014 9-nov-2014 260,000 18-okt-2013 New mutualTalos Energy ENSCO 8502 Ensco Semi >7500 8500 USA 30-jun-2014 1-nov-2014 530,000 17-okt-2013 New mutualMarathon ENSCO 8503 Ensco Semi >7500 8500 USA 5-apr-2014 7-jun-2014 495,000 17-okt-2013 New mutual
UDW comments:
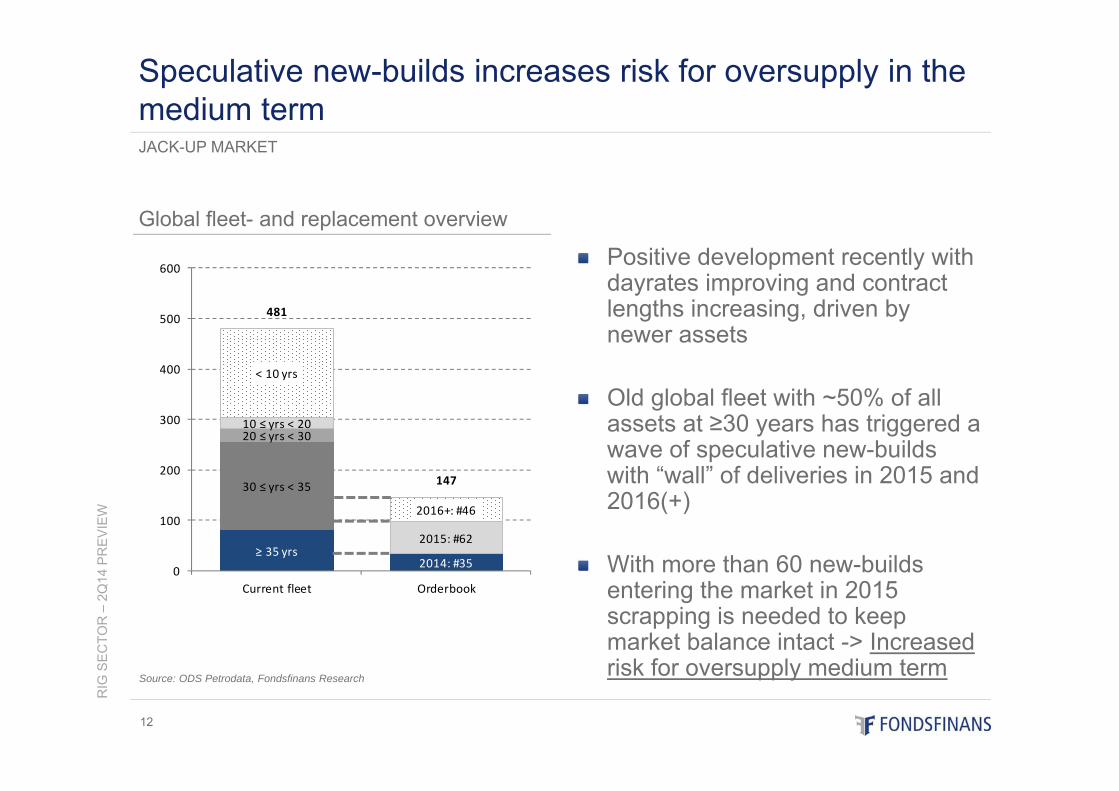
≥ 35 yrs2014: #35
30 ≤ yrs ˂ 35
20 ≤ yrs ˂ 3010 ≤ yrs ˂ 20
2015: #62
˂10 yrs
2016+: #46
481
147
0
100
200
300
400
500
600
Current fleet Orderbook
RIG
SE
CTO
R –
2Q14
PR
EV
IEW
12
Source: ODS Petrodata, Fondsfinans Research
Positive development recently with dayrates improving and contract lengths increasing, driven by newer assets
Old global fleet with ~50% of all assets at ≥30 years has triggered a wave of speculative new-builds with “wall” of deliveries in 2015 and 2016(+)
With more than 60 new-builds entering the market in 2015 scrapping is needed to keep market balance intact -> Increased risk for oversupply medium term
JACK-UP MARKET
Speculative new-builds increases risk for oversupply in the medium term
Global fleet- and replacement overview
Rig class (USDk/day)
RIG
SE
CTO
R –
2Q14
PR
EV
IEW
13
Source: ODS Petrodata / Fondsfinans Research. * May be subject company specific- / unit specific adjustments
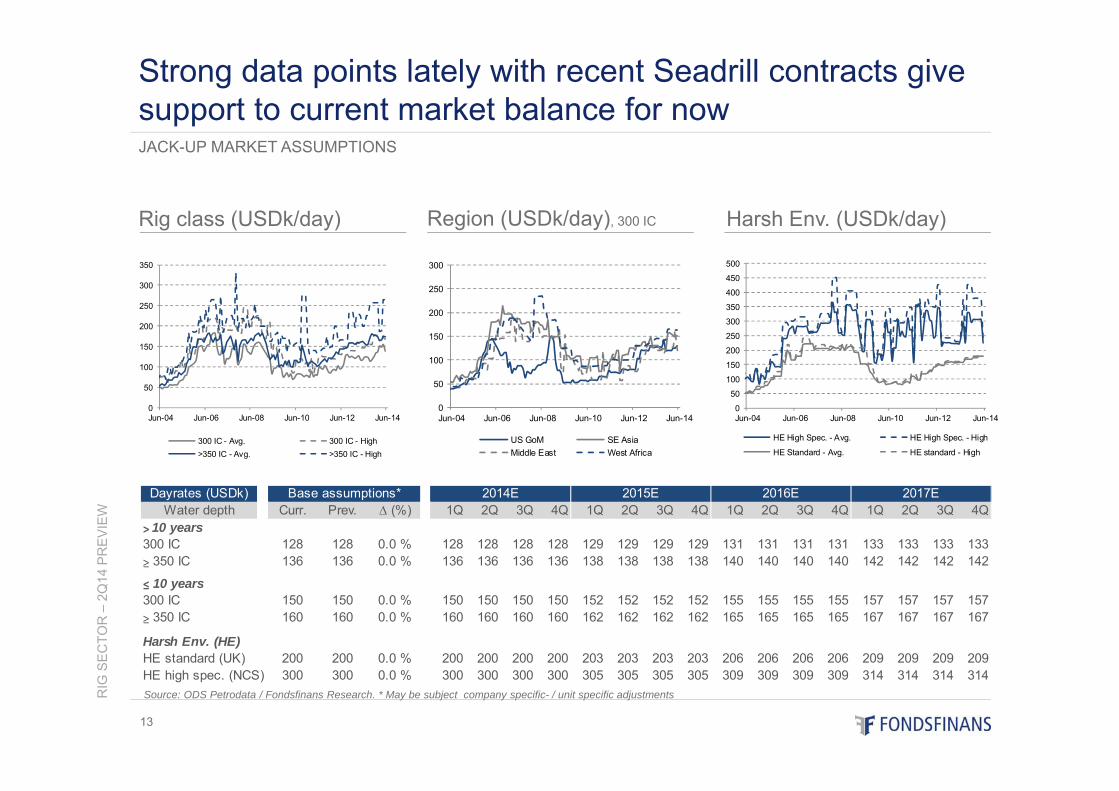
JACK-UP MARKET ASSUMPTIONS
Strong data points lately with recent Seadrill contracts give support to current market balance for now
Region (USDk/day), 300 IC Harsh Env. (USDk/day)
Dayrates (USDk)Water depth Curr. Prev. ∆ (%) 1Q 2Q 3Q 4Q 1Q 2Q 3Q 4Q 1Q 2Q 3Q 4Q 1Q 2Q 3Q 4Q
> 10 years300 IC 128 128 0.0 % 128 128 128 128 129 129 129 129 131 131 131 131 133 133 133 133≥ 350 IC 136 136 0.0 % 136 136 136 136 138 138 138 138 140 140 140 140 142 142 142 142
≤ 10 years300 IC 150 150 0.0 % 150 150 150 150 152 152 152 152 155 155 155 155 157 157 157 157≥ 350 IC 160 160 0.0 % 160 160 160 160 162 162 162 162 165 165 165 165 167 167 167 167
Harsh Env. (HE)HE standard (UK) 200 200 0.0 % 200 200 200 200 203 203 203 203 206 206 206 206 209 209 209 209HE high spec. (NCS) 300 300 0.0 % 300 300 300 300 305 305 305 305 309 309 309 309 314 314 314 314
2017E2016E2015E2014EBase assumptions*
0
50
100
150
200
250
300
350
Jun-04 Jun-06 Jun-08 Jun-10 Jun-12 Jun-14
300 IC - Avg. 300 IC - High>350 IC - Avg. >350 IC - High
0
50
100
150
200
250
300
Jun-04 Jun-06 Jun-08 Jun-10 Jun-12 Jun-14
US GoM SE AsiaMiddle East West Africa
0
50
100
150
200
250
300
350
400
450
500
Jun-04 Jun-06 Jun-08 Jun-10 Jun-12 Jun-14
HE High Spec. - Avg. HE High Spec. - High
HE Standard - Avg. HE standard - High
RIG
SE
CTO
R –
2Q14
PR
EV
IEW
14
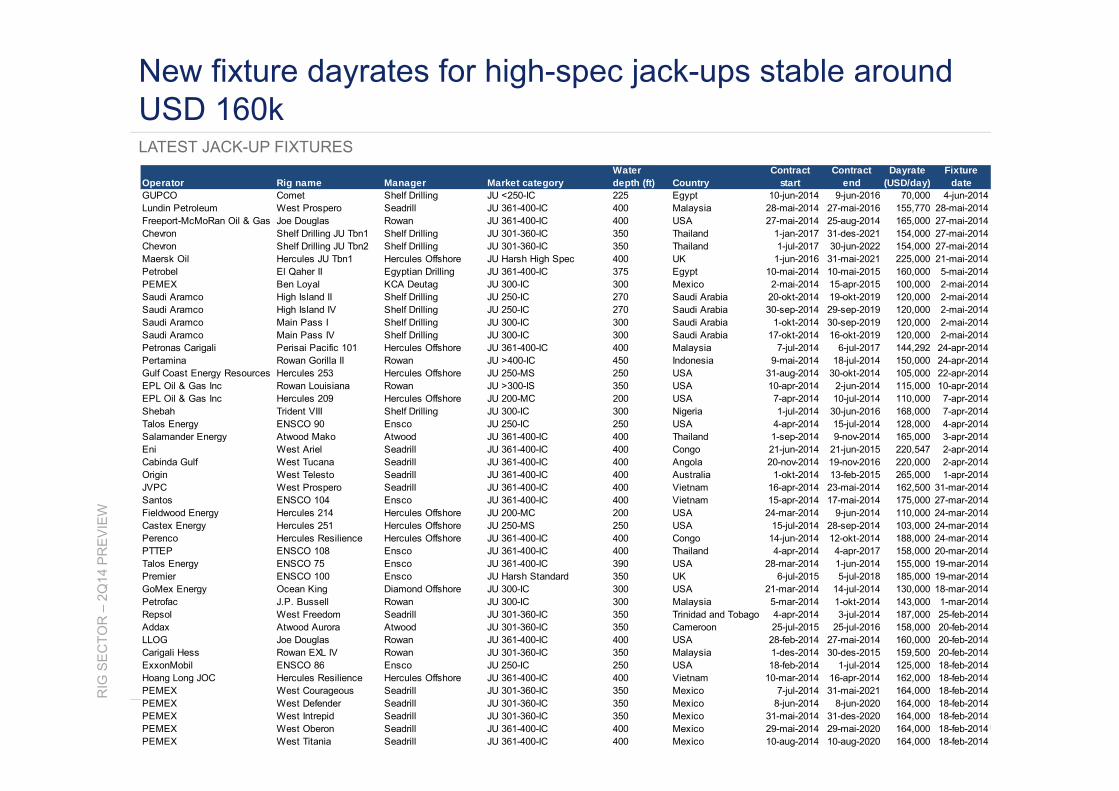
LATEST JACK-UP FIXTURES
New fixture dayrates for high-spec jack-ups stable around USD 160k
Operator Rig name Manager Market categoryWater depth (ft) Country
Contract start
Contract end
Dayrate (USD/day)
Fixture date
GUPCO Comet Shelf Drilling JU <250-IC 225 Egypt 10-jun-2014 9-jun-2016 70,000 4-jun-2014Lundin Petroleum West Prospero Seadrill JU 361-400-IC 400 Malaysia 28-mai-2014 27-mai-2016 155,770 28-mai-2014Freeport-McMoRan Oil & Gas Joe Douglas Rowan JU 361-400-IC 400 USA 27-mai-2014 25-aug-2014 165,000 27-mai-2014Chevron Shelf Drilling JU Tbn1 Shelf Drilling JU 301-360-IC 350 Thailand 1-jan-2017 31-des-2021 154,000 27-mai-2014Chevron Shelf Drilling JU Tbn2 Shelf Drilling JU 301-360-IC 350 Thailand 1-jul-2017 30-jun-2022 154,000 27-mai-2014Maersk Oil Hercules JU Tbn1 Hercules Offshore JU Harsh High Spec 400 UK 1-jun-2016 31-mai-2021 225,000 21-mai-2014Petrobel El Qaher II Egyptian Drilling JU 361-400-IC 375 Egypt 10-mai-2014 10-mai-2015 160,000 5-mai-2014PEMEX Ben Loyal KCA Deutag JU 300-IC 300 Mexico 2-mai-2014 15-apr-2015 100,000 2-mai-2014Saudi Aramco High Island II Shelf Drilling JU 250-IC 270 Saudi Arabia 20-okt-2014 19-okt-2019 120,000 2-mai-2014Saudi Aramco High Island IV Shelf Drilling JU 250-IC 270 Saudi Arabia 30-sep-2014 29-sep-2019 120,000 2-mai-2014Saudi Aramco Main Pass I Shelf Drilling JU 300-IC 300 Saudi Arabia 1-okt-2014 30-sep-2019 120,000 2-mai-2014Saudi Aramco Main Pass IV Shelf Drilling JU 300-IC 300 Saudi Arabia 17-okt-2014 16-okt-2019 120,000 2-mai-2014Petronas Carigali Perisai Pacific 101 Hercules Offshore JU 361-400-IC 400 Malaysia 7-jul-2014 6-jul-2017 144,292 24-apr-2014Pertamina Rowan Gorilla II Rowan JU >400-IC 450 Indonesia 9-mai-2014 18-jul-2014 150,000 24-apr-2014Gulf Coast Energy Resources Hercules 253 Hercules Offshore JU 250-MS 250 USA 31-aug-2014 30-okt-2014 105,000 22-apr-2014EPL Oil & Gas Inc Rowan Louisiana Rowan JU >300-IS 350 USA 10-apr-2014 2-jun-2014 115,000 10-apr-2014EPL Oil & Gas Inc Hercules 209 Hercules Offshore JU 200-MC 200 USA 7-apr-2014 10-jul-2014 110,000 7-apr-2014Shebah Trident VIII Shelf Drilling JU 300-IC 300 Nigeria 1-jul-2014 30-jun-2016 168,000 7-apr-2014Talos Energy ENSCO 90 Ensco JU 250-IC 250 USA 4-apr-2014 15-jul-2014 128,000 4-apr-2014Salamander Energy Atwood Mako Atwood JU 361-400-IC 400 Thailand 1-sep-2014 9-nov-2014 165,000 3-apr-2014Eni West Ariel Seadrill JU 361-400-IC 400 Congo 21-jun-2014 21-jun-2015 220,547 2-apr-2014Cabinda Gulf West Tucana Seadrill JU 361-400-IC 400 Angola 20-nov-2014 19-nov-2016 220,000 2-apr-2014Origin West Telesto Seadrill JU 361-400-IC 400 Australia 1-okt-2014 13-feb-2015 265,000 1-apr-2014JVPC West Prospero Seadrill JU 361-400-IC 400 Vietnam 16-apr-2014 23-mai-2014 162,500 31-mar-2014Santos ENSCO 104 Ensco JU 361-400-IC 400 Vietnam 15-apr-2014 17-mai-2014 175,000 27-mar-2014Fieldwood Energy Hercules 214 Hercules Offshore JU 200-MC 200 USA 24-mar-2014 9-jun-2014 110,000 24-mar-2014Castex Energy Hercules 251 Hercules Offshore JU 250-MS 250 USA 15-jul-2014 28-sep-2014 103,000 24-mar-2014Perenco Hercules Resilience Hercules Offshore JU 361-400-IC 400 Congo 14-jun-2014 12-okt-2014 188,000 24-mar-2014PTTEP ENSCO 108 Ensco JU 361-400-IC 400 Thailand 4-apr-2014 4-apr-2017 158,000 20-mar-2014Talos Energy ENSCO 75 Ensco JU 361-400-IC 390 USA 28-mar-2014 1-jun-2014 155,000 19-mar-2014Premier ENSCO 100 Ensco JU Harsh Standard 350 UK 6-jul-2015 5-jul-2018 185,000 19-mar-2014GoMex Energy Ocean King Diamond Offshore JU 300-IC 300 USA 21-mar-2014 14-jul-2014 130,000 18-mar-2014Petrofac J.P. Bussell Rowan JU 300-IC 300 Malaysia 5-mar-2014 1-okt-2014 143,000 1-mar-2014Repsol West Freedom Seadrill JU 301-360-IC 350 Trinidad and Tobago 4-apr-2014 3-jul-2014 187,000 25-feb-2014Addax Atwood Aurora Atwood JU 301-360-IC 350 Cameroon 25-jul-2015 25-jul-2016 158,000 20-feb-2014LLOG Joe Douglas Rowan JU 361-400-IC 400 USA 28-feb-2014 27-mai-2014 160,000 20-feb-2014Carigali Hess Rowan EXL IV Rowan JU 301-360-IC 350 Malaysia 1-des-2014 30-des-2015 159,500 20-feb-2014ExxonMobil ENSCO 86 Ensco JU 250-IC 250 USA 18-feb-2014 1-jul-2014 125,000 18-feb-2014Hoang Long JOC Hercules Resilience Hercules Offshore JU 361-400-IC 400 Vietnam 10-mar-2014 16-apr-2014 162,000 18-feb-2014PEMEX West Courageous Seadrill JU 301-360-IC 350 Mexico 7-jul-2014 31-mai-2021 164,000 18-feb-2014PEMEX West Defender Seadrill JU 301-360-IC 350 Mexico 8-jun-2014 8-jun-2020 164,000 18-feb-2014PEMEX West Intrepid Seadrill JU 301-360-IC 350 Mexico 31-mai-2014 31-des-2020 164,000 18-feb-2014PEMEX West Oberon Seadrill JU 361-400-IC 400 Mexico 29-mai-2014 29-mai-2020 164,000 18-feb-2014PEMEX West Titania Seadrill JU 361-400-IC 400 Mexico 10-aug-2014 10-aug-2020 164,000 18-feb-2014
Full year estimates
RIG
SE
CTO
R –
2Q14
PR
EV
IEW
15
2Q14 estimates
ESTIMATES & CHANGES
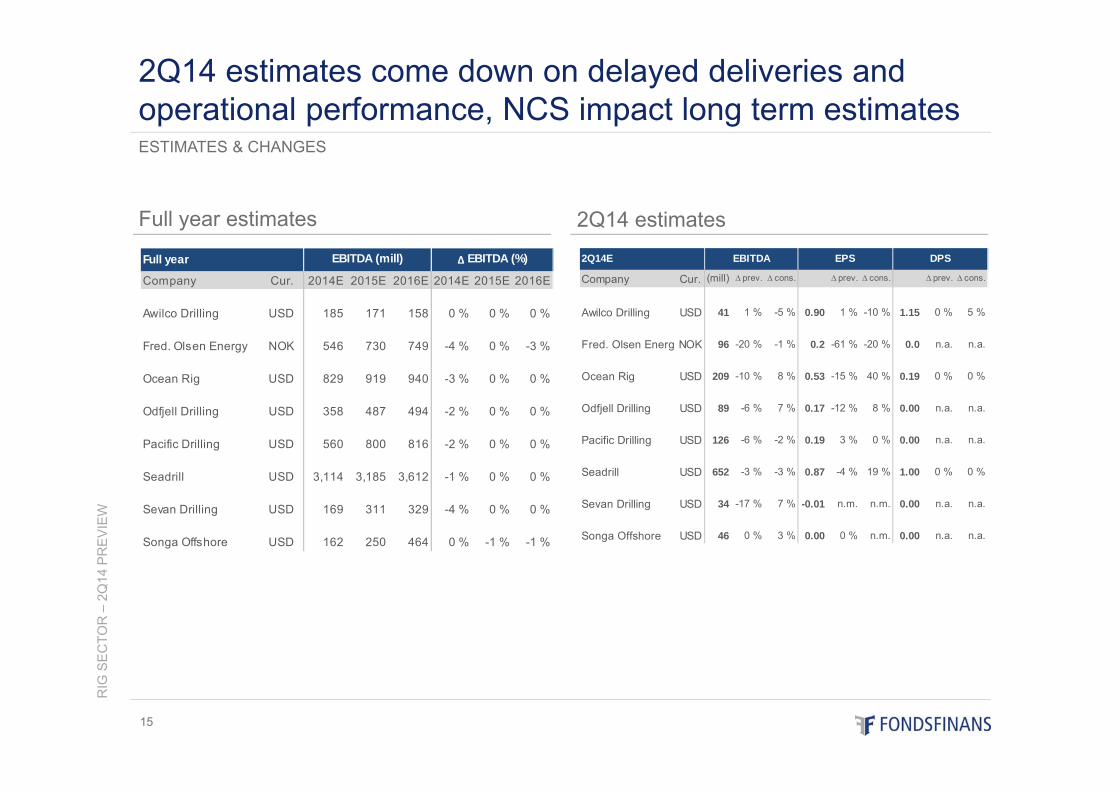
2Q14 estimates come down on delayed deliveries and operational performance, NCS impact long term estimates
Full year
Company Cur. 2014E 2015E 2016E 2014E 2015E 2016E
Awilco Drilling USD 185 171 158 0 % 0 % 0 %
Fred. Olsen Energy NOK 546 730 749 -4 % 0 % -3 %
Ocean Rig USD 829 919 940 -3 % 0 % 0 %
Odfjell Drilling USD 358 487 494 -2 % 0 % 0 %
Pacific Drilling USD 560 800 816 -2 % 0 % 0 %
Seadrill USD 3,114 3,185 3,612 -1 % 0 % 0 %
Sevan Drilling USD 169 311 329 -4 % 0 % 0 %
Songa Offshore USD 162 250 464 0 % -1 % -1 %
∆ EBITDA (%)EBITDA (mill) 2Q14E
Company Cur. (mill) ∆ prev. ∆ cons. ∆ prev. ∆ cons. ∆ prev. ∆ cons.
Awilco Drilling USD 41 1 % -5 % 0.90 1 % -10 % 1.15 0 % 5 %
Fred. Olsen EnergyNOK 96 -20 % -1 % 0.2 -61 % -20 % 0.0 n.a. n.a.
Ocean Rig USD 209 -10 % 8 % 0.53 -15 % 40 % 0.19 0 % 0 %
Odfjell Drilling USD 89 -6 % 7 % 0.17 -12 % 8 % 0.00 n.a. n.a.
Pacific Drilling USD 126 -6 % -2 % 0.19 3 % 0 % 0.00 n.a. n.a.
Seadrill USD 652 -3 % -3 % 0.87 -4 % 19 % 1.00 0 % 0 %
Sevan Drilling USD 34 -17 % 7 % -0.01 n.m. n.m. 0.00 n.a. n.a.
Songa Offshore USD 46 0 % 3 % 0.00 0 % n.m. 0.00 n.a. n.a.
DPSEBITDA EPS
RIG
SE
CTO
R –
2Q14
PR
EV
IEW
16
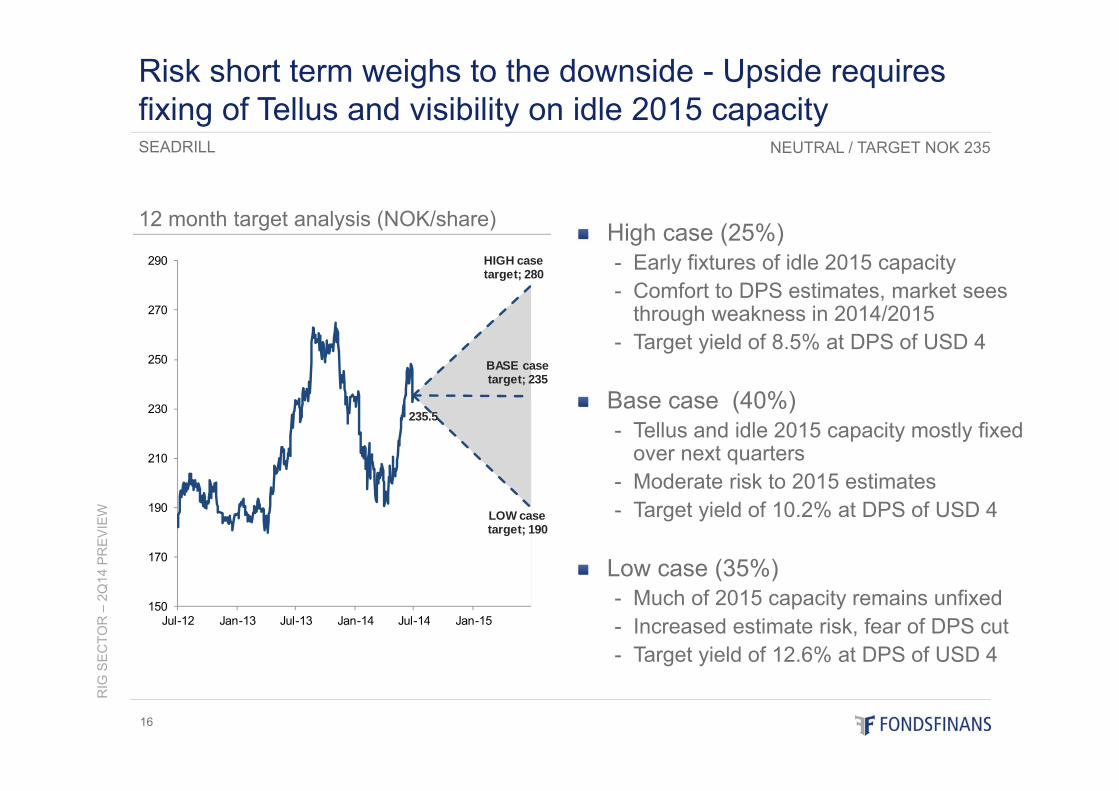
High case (25%)- Early fixtures of idle 2015 capacity- Comfort to DPS estimates, market sees
through weakness in 2014/2015- Target yield of 8.5% at DPS of USD 4
Base case (40%)- Tellus and idle 2015 capacity mostly fixed
over next quarters- Moderate risk to 2015 estimates- Target yield of 10.2% at DPS of USD 4
Low case (35%)- Much of 2015 capacity remains unfixed- Increased estimate risk, fear of DPS cut- Target yield of 12.6% at DPS of USD 4
Risk short term weighs to the downside - Upside requires fixing of Tellus and visibility on idle 2015 capacity
12 month target analysis (NOK/share)
HIGH case target; 280
BASE case target; 235
235.5
LOW case target; 190
150
170
190
210
230
250
270
290
Jul-12 Jan-13 Jul-13 Jan-14 Jul-14 Jan-15
SEADRILL NEUTRAL / TARGET NOK 235
RIG
SE
CTO
R –
2Q14
PR
EV
IEW
17
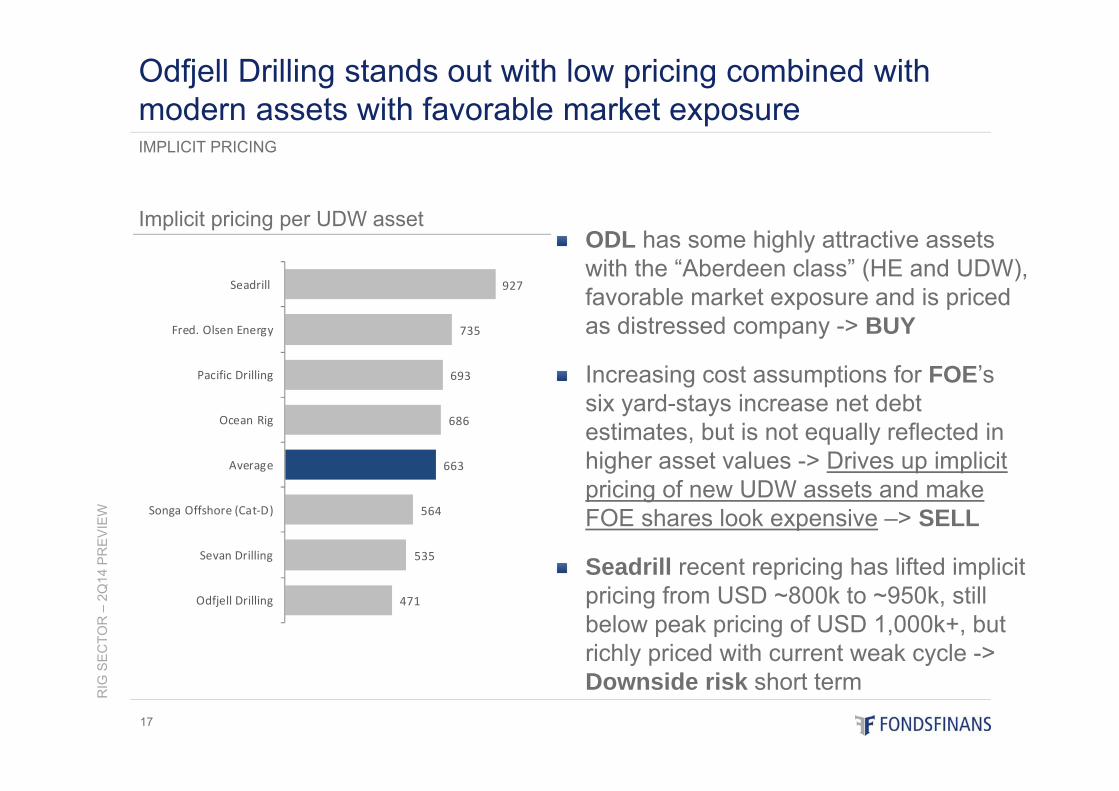
ODL has some highly attractive assets with the “Aberdeen class” (HE and UDW), favorable market exposure and is priced as distressed company -> BUY
Increasing cost assumptions for FOE’s six yard-stays increase net debt estimates, but is not equally reflected in higher asset values -> Drives up implicit pricing of new UDW assets and make FOE shares look expensive –> SELL
Seadrill recent repricing has lifted implicit pricing from USD ~800k to ~950k, still below peak pricing of USD 1,000k+, but richly priced with current weak cycle -> Downside risk short term
IMPLICIT PRICING
Odfjell Drilling stands out with low pricing combined with modern assets with favorable market exposure
Implicit pricing per UDW asset
471
535
564
663
686
693
735
927
Odfjell Drilling
Sevan Drilling
Songa Offshore (Cat‐D)
Average
Ocean Rig
Pacific Drilling
Fred. Olsen Energy
Seadrill
RIG
SE
CTO
R –
2Q14
PR
EV
IEW
18
PEER PRICING
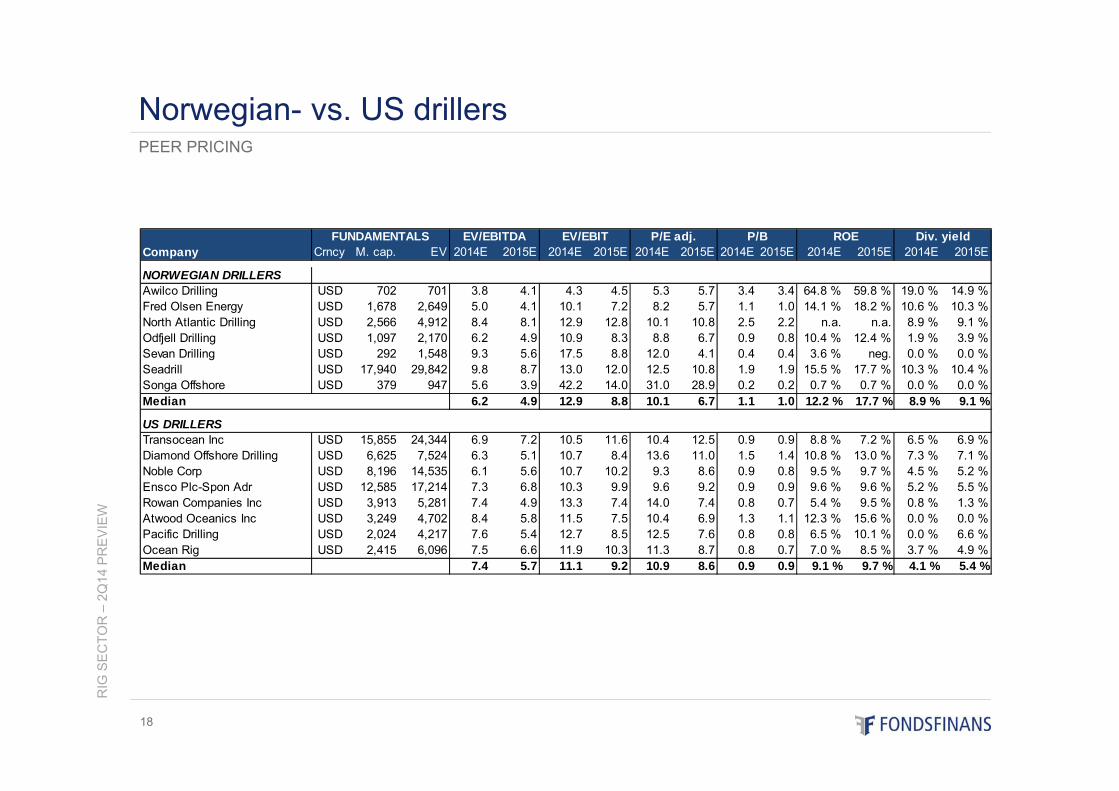
Norwegian- vs. US drillers
Company Crncy M. cap. EV 2014E 2015E 2014E 2015E 2014E 2015E 2014E 2015E 2014E 2015E 2014E 2015E
NORWEGIAN DRILLERSAwilco Drilling USD 702 701 3.8 4.1 4.3 4.5 5.3 5.7 3.4 3.4 64.8 % 59.8 % 19.0 % 14.9 %Fred Olsen Energy USD 1,678 2,649 5.0 4.1 10.1 7.2 8.2 5.7 1.1 1.0 14.1 % 18.2 % 10.6 % 10.3 %North Atlantic Drilling USD 2,566 4,912 8.4 8.1 12.9 12.8 10.1 10.8 2.5 2.2 n.a. n.a. 8.9 % 9.1 %Odfjell Drilling USD 1,097 2,170 6.2 4.9 10.9 8.3 8.8 6.7 0.9 0.8 10.4 % 12.4 % 1.9 % 3.9 %Sevan Drilling USD 292 1,548 9.3 5.6 17.5 8.8 12.0 4.1 0.4 0.4 3.6 % neg. 0.0 % 0.0 %Seadrill USD 17,940 29,842 9.8 8.7 13.0 12.0 12.5 10.8 1.9 1.9 15.5 % 17.7 % 10.3 % 10.4 %Songa Offshore USD 379 947 5.6 3.9 42.2 14.0 31.0 28.9 0.2 0.2 0.7 % 0.7 % 0.0 % 0.0 %Median 6.2 4.9 12.9 8.8 10.1 6.7 1.1 1.0 12.2 % 17.7 % 8.9 % 9.1 %
US DRILLERSTransocean Inc USD 15,855 24,344 6.9 7.2 10.5 11.6 10.4 12.5 0.9 0.9 8.8 % 7.2 % 6.5 % 6.9 %Diamond Offshore Drilling USD 6,625 7,524 6.3 5.1 10.7 8.4 13.6 11.0 1.5 1.4 10.8 % 13.0 % 7.3 % 7.1 %Noble Corp USD 8,196 14,535 6.1 5.6 10.7 10.2 9.3 8.6 0.9 0.8 9.5 % 9.7 % 4.5 % 5.2 %Ensco Plc-Spon Adr USD 12,585 17,214 7.3 6.8 10.3 9.9 9.6 9.2 0.9 0.9 9.6 % 9.6 % 5.2 % 5.5 %Rowan Companies Inc USD 3,913 5,281 7.4 4.9 13.3 7.4 14.0 7.4 0.8 0.7 5.4 % 9.5 % 0.8 % 1.3 %Atwood Oceanics Inc USD 3,249 4,702 8.4 5.8 11.5 7.5 10.4 6.9 1.3 1.1 12.3 % 15.6 % 0.0 % 0.0 %Pacific Drilling USD 2,024 4,217 7.6 5.4 12.7 8.5 12.5 7.6 0.8 0.8 6.5 % 10.1 % 0.0 % 6.6 %Ocean Rig USD 2,415 6,096 7.5 6.6 11.9 10.3 11.3 8.7 0.8 0.7 7.0 % 8.5 % 3.7 % 4.9 %Median 7.4 5.7 11.1 9.2 10.9 8.6 0.9 0.9 9.1 % 9.7 % 4.1 % 5.4 %
FUNDAMENTALS EV/EBITDA EV/EBIT P/E adj. P/B ROE Div. yield
RIG
SE
CTO
R –
2Q14
PR
EV
IEW
19
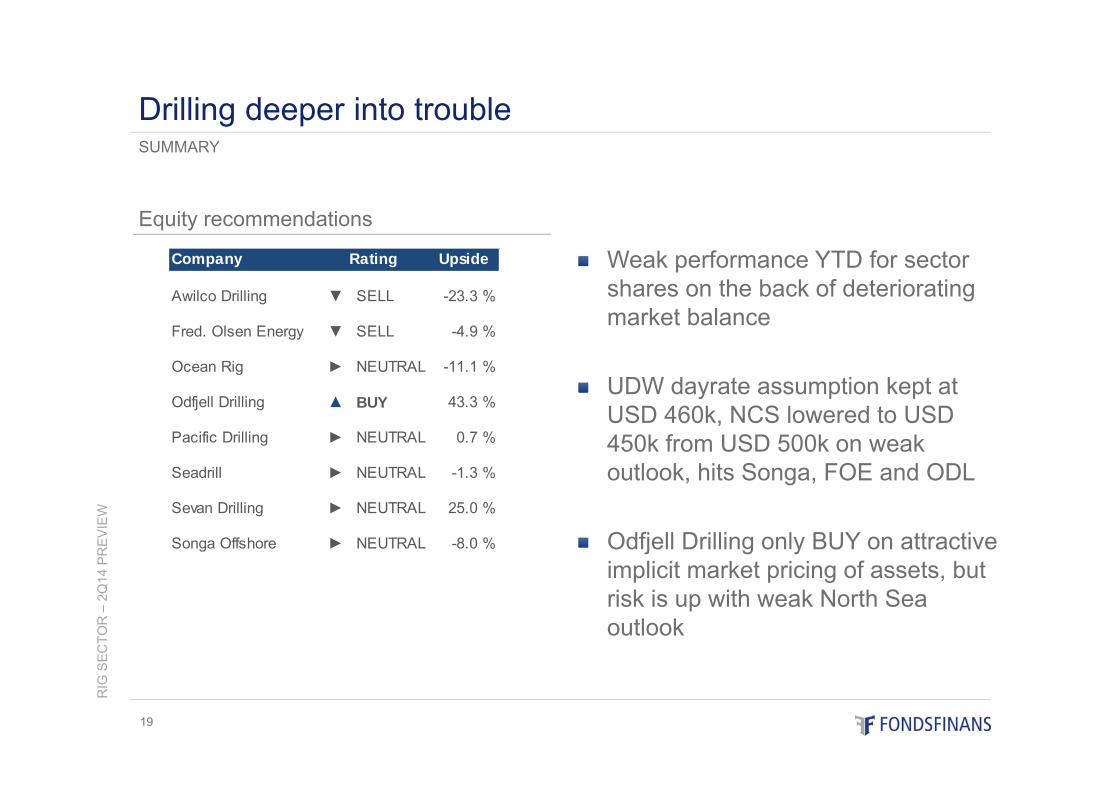
Weak performance YTD for sector shares on the back of deteriorating market balance
UDW dayrate assumption kept at USD 460k, NCS lowered to USD 450k from USD 500k on weak outlook, hits Songa, FOE and ODL
Odfjell Drilling only BUY on attractive implicit market pricing of assets, but risk is up with weak North Sea outlook
SUMMARY
Drilling deeper into trouble
Equity recommendations
Company Upside
Awilco Drilling ▼ SELL -23.3 %
Fred. Olsen Energy ▼ SELL -4.9 %
Ocean Rig ► NEUTRAL -11.1 %
Odfjell Drilling ▲ BUY 43.3 %
Pacific Drilling ► NEUTRAL 0.7 %
Seadrill ► NEUTRAL -1.3 %
Sevan Drilling ► NEUTRAL 25.0 %
Songa Offshore ► NEUTRAL -8.0 %
Rating
Market recommendations ........................................................... Page 02Market appendix ......................................................................... Page 21Company presentations ............................................................. Page 30
- Awilco Drilling .................................................................................................. Page 31
- Fred. Olsen Energy ......................................................................................... Page 35
- Ocean Rig ....................................................................................................... Page 40
- Odfjell Drilling .................................................................................................. Page 45
- Pacific Drilling ..................................................................................................Page 50
- Seadrill ............................................................................................................ Page 55
- Sevan Drilling .................................................................................................. Page 60
- Songa Offshore ............................................................................................... Page 64
Risk assessment ........................................................................ Page 69Disclaimer .................................................................................. Page 71
RIG
SE
CTO
R –
2Q14
PR
EV
IEW
20
Table of content
RIG
SE
CTO
R –
2Q14
PR
EV
IEW
21
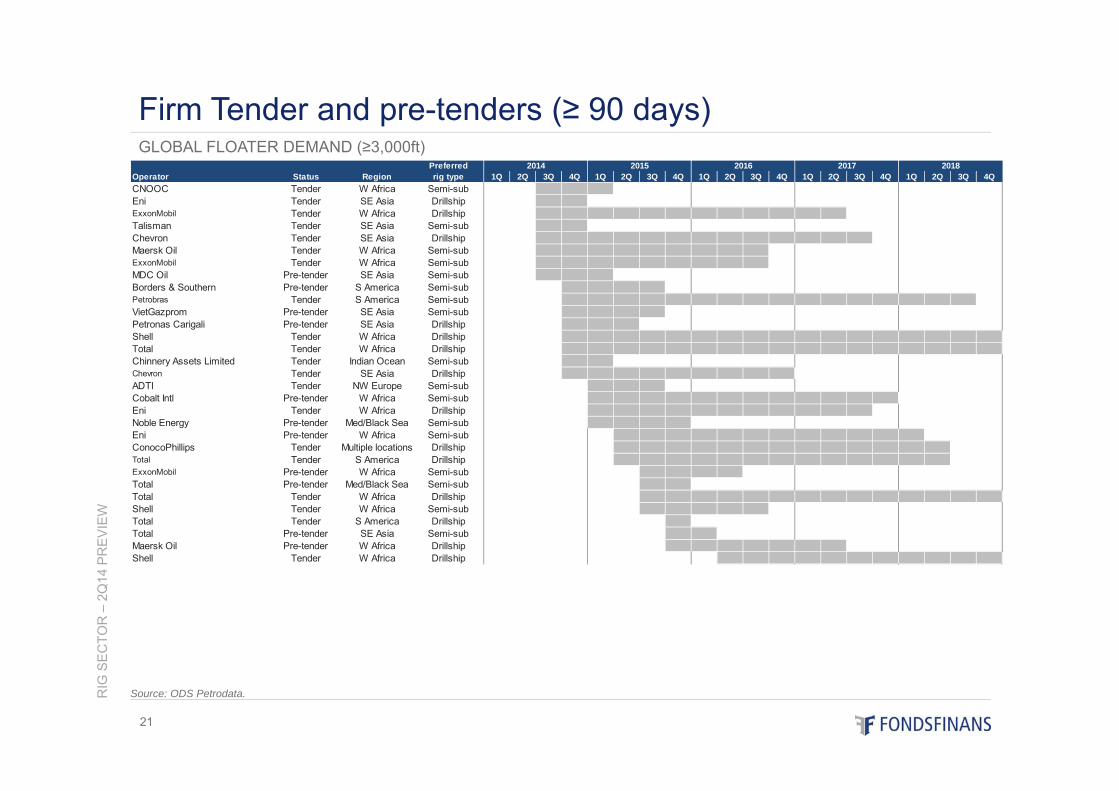
GLOBAL FLOATER DEMAND (≥3,000ft)
Firm Tender and pre-tenders (≥ 90 days)
Source: ODS Petrodata.
PreferredOperator Status Region rig type 1Q 2Q 3Q 4Q 1Q 2Q 3Q 4Q 1Q 2Q 3Q 4Q 1Q 2Q 3Q 4Q 1Q 2Q 3Q 4QCNOOC Tender W Africa Semi-sub 2 2 4 4 4 2 2 2 2 2 2 2 2 2 2 2 2 2 2 2Eni Tender SE Asia Drillship 2 2 4 4 2 2 2 2 2 2 2 2 2 2 2 2 2 2 2 2ExxonMobil Tender W Africa Drillship 2 2 4 4 4 4 4 4 4 4 4 4 4 4 2 2 2 2 2 2Talisman Tender SE Asia Semi-sub 2 2 4 4 2 2 2 2 2 2 2 2 2 2 2 2 2 2 2 2Chevron Tender SE Asia Drillship 2 2 4 4 4 4 4 4 4 4 4 4 4 4 4 2 2 2 2 2Maersk Oil Tender W Africa Semi-sub 2 2 4 4 4 4 4 4 4 4 4 2 2 2 2 2 2 2 2 2ExxonMobil Tender W Africa Semi-sub 2 2 4 4 4 4 4 4 4 4 4 2 2 2 2 2 2 2 2 2MDC Oil Pre-tender SE Asia Semi-sub 2 2 4 4 4 2 2 2 2 2 2 2 2 2 2 2 2 2 2 2Borders & Southern Pre-tender S America Semi-sub 2 2 2 4 4 4 4 2 2 2 2 2 2 2 2 2 2 2 2 2Petrobras Tender S America Semi-sub 2 2 2 4 4 4 4 4 4 4 4 4 4 4 4 4 4 4 4 2VietGazprom Pre-tender SE Asia Semi-sub 2 2 2 4 4 4 4 2 2 2 2 2 2 2 2 2 2 2 2 2Petronas Carigali Pre-tender SE Asia Drillship 2 2 2 4 4 4 2 2 2 2 2 2 2 2 2 2 2 2 2 2Shell Tender W Africa Drillship 2 2 2 4 4 4 4 4 4 4 4 4 4 4 4 4 4 4 4 4Total Tender W Africa Drillship 2 2 2 4 4 4 4 4 4 4 4 4 4 4 4 4 4 4 4 4Chinnery Assets Limited Tender Indian Ocean Semi-sub 2 2 2 4 4 2 2 2 2 2 2 2 2 2 2 2 2 2 2 2Chevron Tender SE Asia Drillship 2 2 2 4 4 4 4 4 4 4 4 4 2 2 2 2 2 2 2 2ADTI Tender NW Europe Semi-sub 2 2 2 2 4 4 4 2 2 2 2 2 2 2 2 2 2 2 2 2Cobalt Intl Pre-tender W Africa Semi-sub 2 2 2 2 4 4 4 4 4 4 4 4 4 4 4 4 2 2 2 2Eni Tender W Africa Drillship 2 2 2 2 4 4 4 4 4 4 4 4 4 4 4 2 2 2 2 2Noble Energy Pre-tender Med/Black Sea Semi-sub 2 2 2 2 4 4 4 4 2 2 2 2 2 2 2 2 2 2 2 2Eni Pre-tender W Africa Semi-sub 2 2 2 2 2 4 4 4 4 4 4 4 4 4 4 4 4 2 2 2ConocoPhillips Tender Multiple locations Drillship 2 2 2 2 2 4 4 4 4 4 4 4 4 4 4 4 4 4 2 2Total Tender S America Drillship 2 2 2 2 2 4 4 4 4 4 4 4 4 4 4 4 4 4 2 2ExxonMobil Pre-tender W Africa Semi-sub 2 2 2 2 2 2 4 4 4 4 2 2 2 2 2 2 2 2 2 2Total Pre-tender Med/Black Sea Semi-sub 2 2 2 2 2 2 4 4 2 2 2 2 2 2 2 2 2 2 2 2Total Tender W Africa Drillship 2 2 2 2 2 2 4 4 4 4 4 4 4 4 4 4 4 4 4 4Shell Tender W Africa Semi-sub 2 2 2 2 2 2 4 4 4 4 4 2 2 2 2 2 2 2 2 2Total Tender S America Drillship 2 2 2 2 2 2 2 4 2 2 2 2 2 2 2 2 2 2 2 2Total Pre-tender SE Asia Semi-sub 2 2 2 2 2 2 2 4 4 2 2 2 2 2 2 2 2 2 2 2Maersk Oil Pre-tender W Africa Drillship 2 2 2 2 2 2 2 4 4 4 4 4 4 4 2 2 2 2 2 2Shell Tender W Africa Drillship 2 2 2 2 2 2 2 2 2 4 4 4 4 4 4 4 4 4 4 4
2014 2015 2016 2017 2018
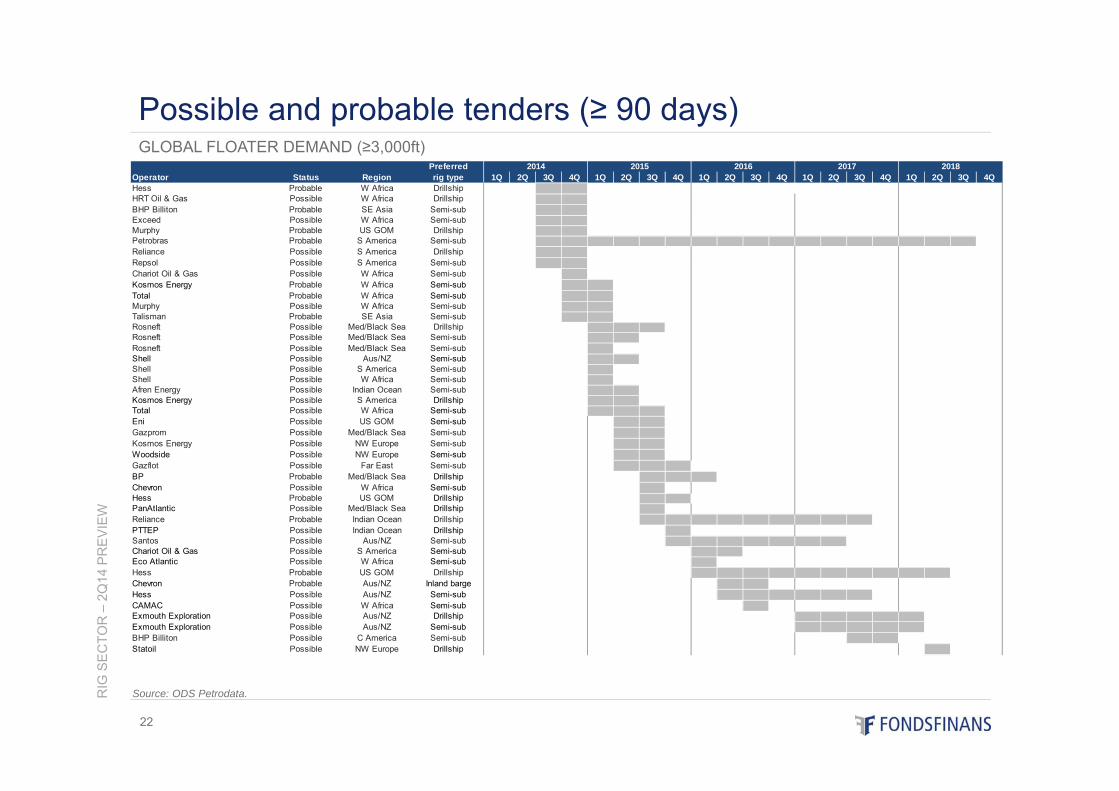
PreferredOperator Status Region rig type 1Q 2Q 3Q 4Q 1Q 2Q 3Q 4Q 1Q 2Q 3Q 4Q 1Q 2Q 3Q 4Q 1Q 2Q 3Q 4QHess Probable W Africa Drillship 2 2 4 4 2 2 2 2 2 2 2 2 2 2 2 2 2 2 2 2HRT Oil & Gas Possible W Africa Drillship 2 2 4 4 2 2 2 2 2 2 2 2 2 2 2 2 2 2 2 2BHP Billiton Probable SE Asia Semi-sub 2 2 4 4 2 2 2 2 2 2 2 2 2 2 2 2 2 2 2 2Exceed Possible W Africa Semi-sub 2 2 4 4 2 2 2 2 2 2 2 2 2 2 2 2 2 2 2 2Murphy Probable US GOM Drillship 2 2 4 4 2 2 2 2 2 2 2 2 2 2 2 2 2 2 2 2Petrobras Probable S America Semi-sub 2 2 4 4 4 4 4 4 4 4 4 4 4 4 4 4 4 4 4 2Reliance Possible S America Drillship 2 2 4 4 2 2 2 2 2 2 2 2 2 2 2 2 2 2 2 2Repsol Possible S America Semi-sub 2 2 4 4 2 2 2 2 2 2 2 2 2 2 2 2 2 2 2 2Chariot Oil & Gas Possible W Africa Semi-sub 2 2 2 4 2 2 2 2 2 2 2 2 2 2 2 2 2 2 2 2Kosmos Energy Probable W Africa Semi-sub 2 2 2 4 4 2 2 2 2 2 2 2 2 2 2 2 2 2Total Probable W Africa Semi-sub 2 2 2 4 4 2 2 2 2 2 2 2 2 2 2 2 2 2Murphy Possible W Africa Semi-sub 2 2 2 4 4 2 2 2 2 2 2 2 2 2 2 2 2 2Talisman Probable SE Asia Semi-sub 2 2 2 4 4 2 2 2 2 2 2 2 2 2 2 2 2 2Rosneft Possible Med/Black Sea Drillship 2 2 2 2 4 4 4 2 2 2 2 2 2 2 2 2 2 2Rosneft Possible Med/Black Sea Semi-sub 2 2 2 2 4 4 2 2 2 2 2 2 2 2 2 2 2 2Rosneft Possible Med/Black Sea Semi-sub 2 2 2 2 4 2 2 2 2 2 2 2 2 2 2 2 2 2Shell Possible Aus/NZ Semi-sub 2 2 2 2 4 4 2 2 2 2 2 2 2 2 2 2 2 2Shell Possible S America Semi-sub 2 2 2 2 4 2 2 2 2 2 2 2 2 2 2 2 2 2Shell Possible W Africa Semi-sub 2 2 2 2 4 2 2 2 2 2 2 2 2 2 2 2 2 2Afren Energy Possible Indian Ocean Semi-sub 2 2 2 2 4 4 2 2 2 2 2 2 2 2 2 2 2 2Kosmos Energy Possible S America Drillship 2 2 2 2 4 4 2 2 2 2 2 2 2 2 2 2 2 2Total Possible W Africa Semi-sub 2 2 2 2 4 4 4 2 2 2 2 2 2 2 2 2 2 2Eni Possible US GOM Semi-sub 2 2 2 2 2 4 4 2 2 2 2 2 2 2 2 2 2 2Gazprom Possible Med/Black Sea Semi-sub 2 2 2 2 2 4 4 2 2 2 2 2 2 2 2 2 2 2Kosmos Energy Possible NW Europe Semi-sub 2 2 2 2 2 4 4 2 2 2 2 2 2 2 2 2 2 2Woodside Possible NW Europe Semi-sub 2 2 2 2 2 4 4 2 2 2 2 2 2 2 2 2 2 2Gazflot Possible Far East Semi-sub 2 2 2 2 2 4 4 4 2 2 2 2 2 2 2 2 2 2BP Probable Med/Black Sea Drillship 2 2 2 2 2 2 4 4 4 2 2 2 2 2 2 2 2 2Chevron Possible W Africa Semi-sub 2 2 2 2 2 2 4 2 2 2 2 2 2 2 2 2 2 2Hess Probable US GOM Drillship 2 2 2 2 2 2 4 4 2 2 2 2 2 2 2 2 2 2PanAtlantic Possible Med/Black Sea Drillship 2 2 2 2 2 2 4 2 2 2 2 2 2 2 2 2 2 2Reliance Probable Indian Ocean Drillship 2 2 2 2 2 2 4 4 4 4 4 4 4 4 4 2 2 2PTTEP Possible Indian Ocean Drillship 2 2 2 2 2 2 2 4 2 2 2 2 2 2 2 2 2 2Santos Possible Aus/NZ Semi-sub 2 2 2 2 2 2 2 4 4 4 4 4 4 4 2 2 2 2Chariot Oil & Gas Possible S America Semi-sub 2 2 2 2 2 2 2 2 4 4 2 2 2 2 2 2 2 2Eco Atlantic Possible W Africa Semi-sub 2 2 2 2 2 2 2 2 4 2 2 2 2 2 2 2 2 2Hess Probable US GOM Drillship 2 2 2 2 2 2 2 2 4 4 4 4 4 4 4 4 4 4Chevron Probable Aus/NZ Inland barge 2 2 2 2 2 2 2 2 2 4 4 2 2 2 2 2 2 2Hess Possible Aus/NZ Semi-sub 2 2 2 2 2 2 2 2 2 4 4 4 4 4 4 2 2 2CAMAC Possible W Africa Semi-sub 2 2 2 2 2 2 2 2 2 2 4 2 2 2 2 2 2 2Exmouth Exploration Possible Aus/NZ Drillship 2 2 2 2 2 2 2 2 2 2 2 2 4 4 4 4 4 2Exmouth Exploration Possible Aus/NZ Semi-sub 2 2 2 2 2 2 2 2 2 2 2 2 4 4 4 4 4 2BHP Billiton Possible C America Semi-sub 2 2 2 2 2 2 2 2 2 2 2 2 2 2 4 4 2 2Statoil Possible NW Europe Drillship 2 2 2 2 2 2 2 2 2 2 2 2 2 2 2 2 2 4
2014 2015 2016 2017 2018
RIG
SE
CTO
R –
2Q14
PR
EV
IEW
22
GLOBAL FLOATER DEMAND (≥3,000ft)
Possible and probable tenders (≥ 90 days)
Source: ODS Petrodata.
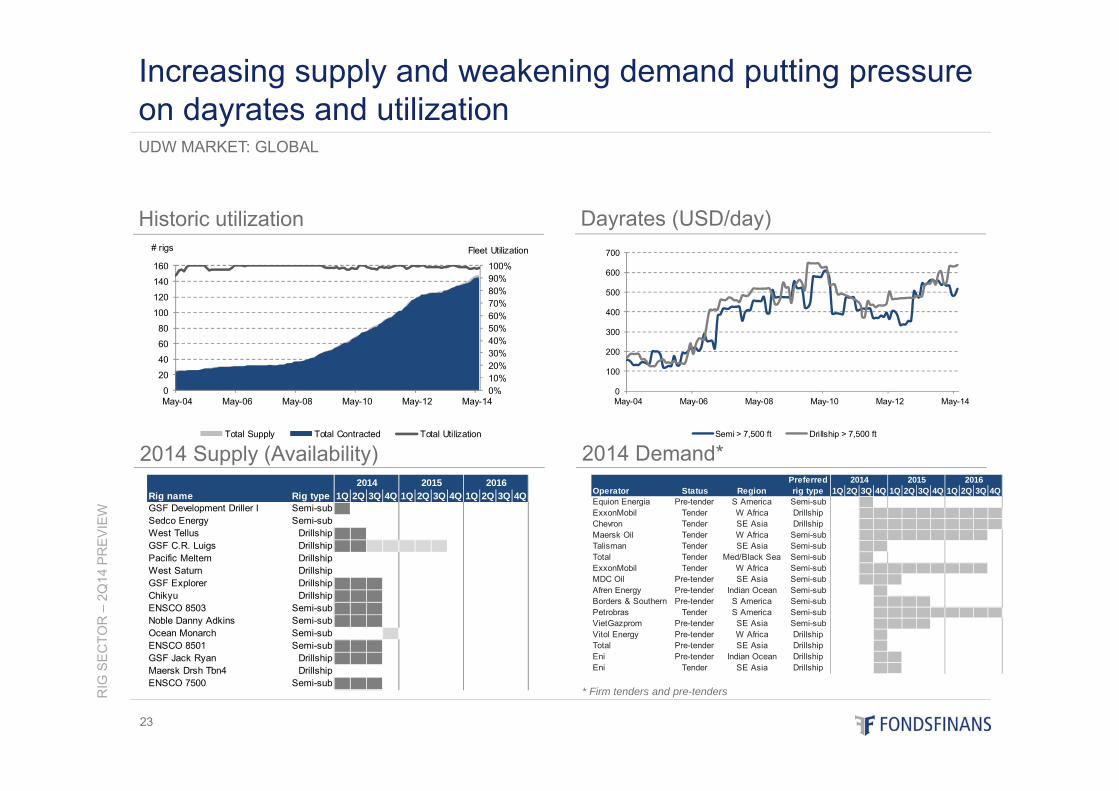
Rig name Rig type 1Q 2Q 3Q 4Q 1Q 2Q 3Q 4Q 1Q 2Q 3Q 4QGSF Development Driller I Semi-sub 1 0 0 0 0 0 0 0 0 0 0 0Sedco Energy Semi-sub 0 0 0 0 0 0 0 0 0 0 0West Tellus Drillship 1 1 0 0 0 0 0 0 0 0 0 0GSF C.R. Luigs Drillship 1 1 10 10 10 10 10 0 0 0 0 0Pacific Meltem Drillship 0 0 0 0 0 0 0 0 0West Saturn Drillship 0 0 0 0 0 0 0 0 0GSF Explorer Drillship 1 1 1 0 0 0 0 0 0 0 0 0Chikyu Drillship 1 1 1 0 0 0 0 0 0 0 0 0ENSCO 8503 Semi-sub 1 1 1 0 0 0 0 0 0 0 0 0Noble Danny Adkins Semi-sub 1 1 1 0 0 0 0 0 0 0 0 0Ocean Monarch Semi-sub 12 0 0 0 0 0 0 0 0ENSCO 8501 Semi-sub 1 1 1 0 0 0 0 0 0 0 0 0GSF Jack Ryan Drillship 1 1 1 0 0 0 0 0 0 0 0 0Maersk Drsh Tbn4 Drillship 0 0 0 0 0 0 0 0 0ENSCO 7500 Semi-sub 1 1 1 0 0 0 0 0 0 0 0 0
2014 2015 2016
0
100
200
300
400
500
600
700
May-04 May-06 May-08 May-10 May-12 May-14
Semi > 7,500 ft Drillship > 7,500 ft
0%10%20%30%40%50%60%70%80%90%100%
0
20
40
60
80
100
120
140
160
May-04 May-06 May-08 May-10 May-12 May-14
Fleet Utilization# rigs
Total Supply Total Contracted Total Utilization
RIG
SE
CTO
R –
2Q14
PR
EV
IEW
23
2014 Supply (Availability)
UDW MARKET: GLOBAL
Increasing supply and weakening demand putting pressure on dayrates and utilization
Historic utilization
2014 Demand*
Dayrates (USD/day)
* Firm tenders and pre-tenders
PreferredOperator Status Region rig type 1Q 2Q 3Q 4Q 1Q 2Q 3Q 4Q 1Q 2Q 3Q 4QEquion Energia Pre-tender S America Semi-sub 2 2 4 2 2 2 2 2 2 2 2 2ExxonMobil Tender W Africa Drillship 2 2 4 4 4 4 4 4 4 4 4 4Chevron Tender SE Asia Drillship 2 2 4 4 4 4 4 4 4 4 4 4Maersk Oil Tender W Africa Semi-sub 2 2 4 4 4 4 4 4 4 4 4 2Talisman Tender SE Asia Semi-sub 2 2 4 4 2 2 2 2 2 2 2 2Total Tender Med/Black Sea Semi-sub 2 2 4 2 2 2 2 2 2 2 2 2ExxonMobil Tender W Africa Semi-sub 2 2 4 4 4 4 4 4 4 4 4 2MDC Oil Pre-tender SE Asia Semi-sub 2 2 4 4 4 2 2 2 2 2 2 2Afren Energy Pre-tender Indian Ocean Semi-sub 2 2 2 4 2 2 2 2 2 2 2 2Borders & Southern Pre-tender S America Semi-sub 2 2 2 4 4 4 4 2 2 2 2 2Petrobras Tender S America Semi-sub 2 2 2 4 4 4 4 4 4 4 4 4VietGazprom Pre-tender SE Asia Semi-sub 2 2 2 4 4 4 4 2 2 2 2 2Vitol Energy Pre-tender W Africa Drillship 2 2 2 4 2 2 2 2 2 2 2 2Total Pre-tender SE Asia Drillship 2 2 2 4 2 2 2 2 2 2 2 2Eni Pre-tender Indian Ocean Drillship 2 2 2 4 4 2 2 2 2 2 2 2Eni Tender SE Asia Drillship 2 2 2 4 4 2 2 2 2 2 2 2
2014 2015 2016
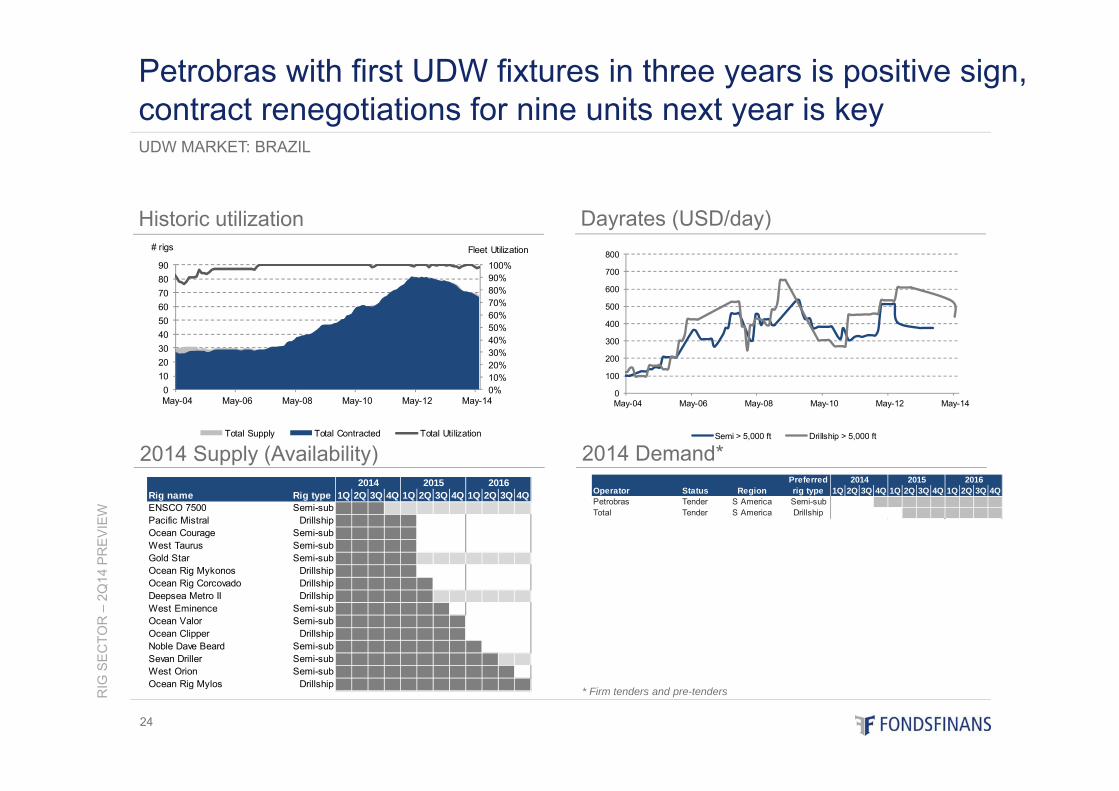
Rig name Rig type 1Q 2Q 3Q 4Q 1Q 2Q 3Q 4Q 1Q 2Q 3Q 4QENSCO 7500 Semi-sub 1 1 1 10 10 10 10 10 10 10 10 10Pacific Mistral Drillship 1 1 1 1 1 0 0 0 0 0 0 0Ocean Courage Semi-sub 1 1 1 1 1 0 0 0 0 0 0 0West Taurus Semi-sub 1 1 1 1 1 0 0 0 0 0 0 0Gold Star Semi-sub 1 1 1 1 1 10 10 10 10 10 10 10Ocean Rig Mykonos Drillship 1 1 1 1 1 0 0 0 0 0 0 0Ocean Rig Corcovado Drillship 1 1 1 1 1 1 0 0 0 0 0 0Deepsea Metro II Drillship 1 1 1 1 1 1 10 10 10 10 10 10West Eminence Semi-sub 1 1 1 1 1 1 1 0 0 0 0 0Ocean Valor Semi-sub 1 1 1 1 1 1 1 1 0 0 0 0Ocean Clipper Drillship 1 1 1 1 1 1 1 1 0 0 0 0Noble Dave Beard Semi-sub 1 1 1 1 1 1 1 1 1 0 0 0Sevan Driller Semi-sub 1 1 1 1 1 1 1 1 1 1 10 10West Orion Semi-sub 1 1 1 1 1 1 1 1 1 1 1 0Ocean Rig Mylos Drillship 1 1 1 1 1 1 1 1 1 1 1 1
2014 2015 2016
0
100
200
300
400
500
600
700
800
May-04 May-06 May-08 May-10 May-12 May-14
Semi > 5,000 ft Drillship > 5,000 ft
0%10%20%30%40%50%60%70%80%90%100%
0102030405060708090
May-04 May-06 May-08 May-10 May-12 May-14
Fleet Utilization# rigs
Total Supply Total Contracted Total Utilization
RIG
SE
CTO
R –
2Q14
PR
EV
IEW
24
2014 Supply (Availability)
UDW MARKET: BRAZIL
Petrobras with first UDW fixtures in three years is positive sign, contract renegotiations for nine units next year is key
Historic utilization
2014 Demand*
Dayrates (USD/day)
* Firm tenders and pre-tenders
PreferredOperator Status Region rig type 1Q 2Q 3Q 4Q 1Q 2Q 3Q 4Q 1Q 2Q 3Q 4QPetrobras Tender S America Semi-sub 2 2 2 4 4 4 4 4 4 4 4 4Total Tender S America Drillship 2 2 2 2 2 4 4 4 4 4 4 4
2014 2015 2016
PreferredOperator Status Region rig type 1Q 2Q 3Q 4Q 1Q 2Q 3Q 4Q 1Q 2Q 3Q 4Q
2014 2015 2016
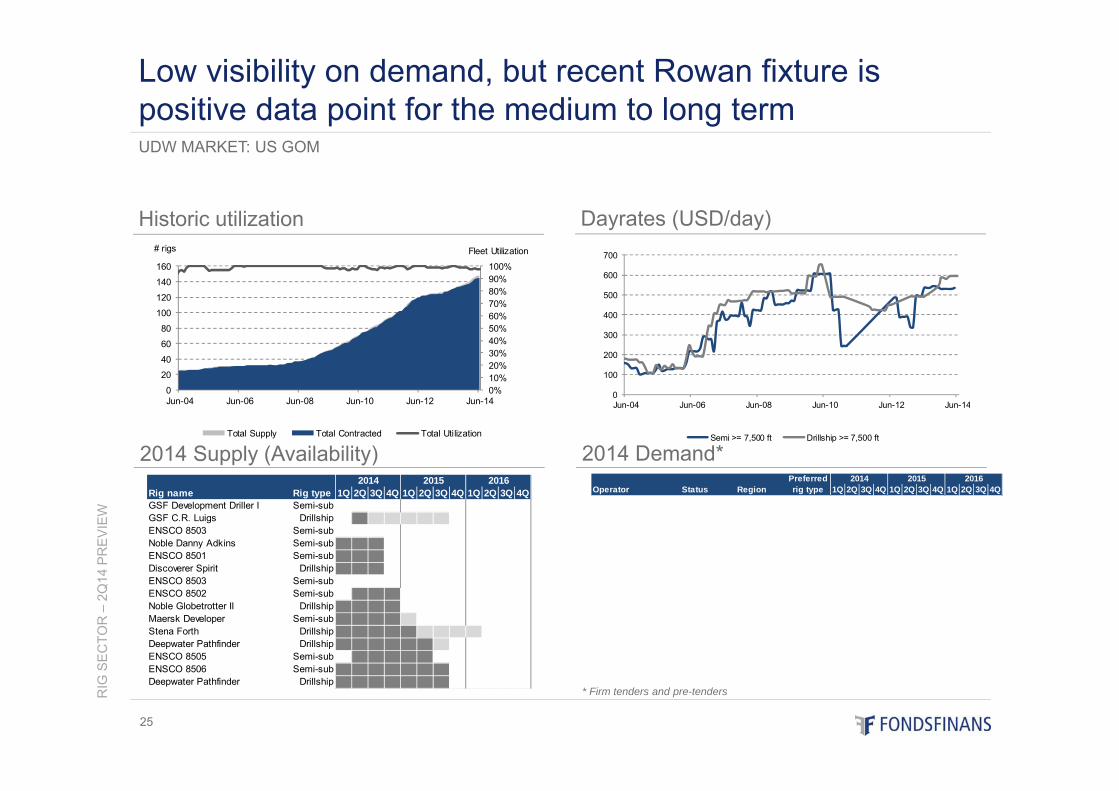
Rig name Rig type 1Q 2Q 3Q 4Q 1Q 2Q 3Q 4Q 1Q 2Q 3Q 4QGSF Development Driller I Semi-sub 0 0 0 0 0 0 0 0 0 0 0GSF C.R. Luigs Drillship 1 10 10 10 10 10 0 0 0 0 0ENSCO 8503 Semi-sub 0 0 0 0 0 0 0 0 0Noble Danny Adkins Semi-sub 1 1 1 0 0 0 0 0 0 0 0 0ENSCO 8501 Semi-sub 1 1 1 0 0 0 0 0 0 0 0 0Discoverer Spirit Drillship 1 1 1 0 0 0 0 0 0 0 0 0ENSCO 8503 Semi-sub 0 0 0 0 0 0 0 0 0ENSCO 8502 Semi-sub 1 1 1 0 0 0 0 0 0 0 0Noble Globetrotter II Drillship 1 1 1 1 0 0 0 0 0 0 0 0Maersk Developer Semi-sub 1 1 1 1 10 0 0 0 0 0 0 0Stena Forth Drillship 1 1 1 1 1 10 10 10 10 0 0 0Deepwater Pathfinder Drillship 1 1 1 1 1 1 10 0 0 0 0 0ENSCO 8505 Semi-sub 1 1 1 1 1 0 0 0 0 0 0ENSCO 8506 Semi-sub 1 1 1 1 1 1 1 0 0 0 0 0Deepwater Pathfinder Drillship 1 1 1 1 1 1 1 0 0 0 0 0
2014 2015 2016
0%10%20%30%40%50%60%70%80%90%100%
0
20
40
60
80
100
120
140
160
Jun-04 Jun-06 Jun-08 Jun-10 Jun-12 Jun-14
Fleet Utilization# rigs
Total Supply Total Contracted Total Utilization
0
100
200
300
400
500
600
700
Jun-04 Jun-06 Jun-08 Jun-10 Jun-12 Jun-14
Semi >= 7,500 ft Drillship >= 7,500 ft
RIG
SE
CTO
R –
2Q14
PR
EV
IEW
25
2014 Supply (Availability)
UDW MARKET: US GOM
Low visibility on demand, but recent Rowan fixture is positive data point for the medium to long term
Historic utilization
2014 Demand*
Dayrates (USD/day)
* Firm tenders and pre-tenders
0%10%20%30%40%50%60%70%80%90%100%
0
20
40
60
80
100
120
140
160
Jun-04 Jun-06 Jun-08 Jun-10 Jun-12 Jun-14
Fleet Utilization# rigs
Total Supply Total Contracted Total Utilization
0
100
200
300
400
500
600
700
Jun-04 Jun-06 Jun-08 Jun-10 Jun-12 Jun-14
Semi > 5,000 ft Drillship > 5,000 ft
RIG
SE
CTO
R –
2Q14
PR
EV
IEW
26
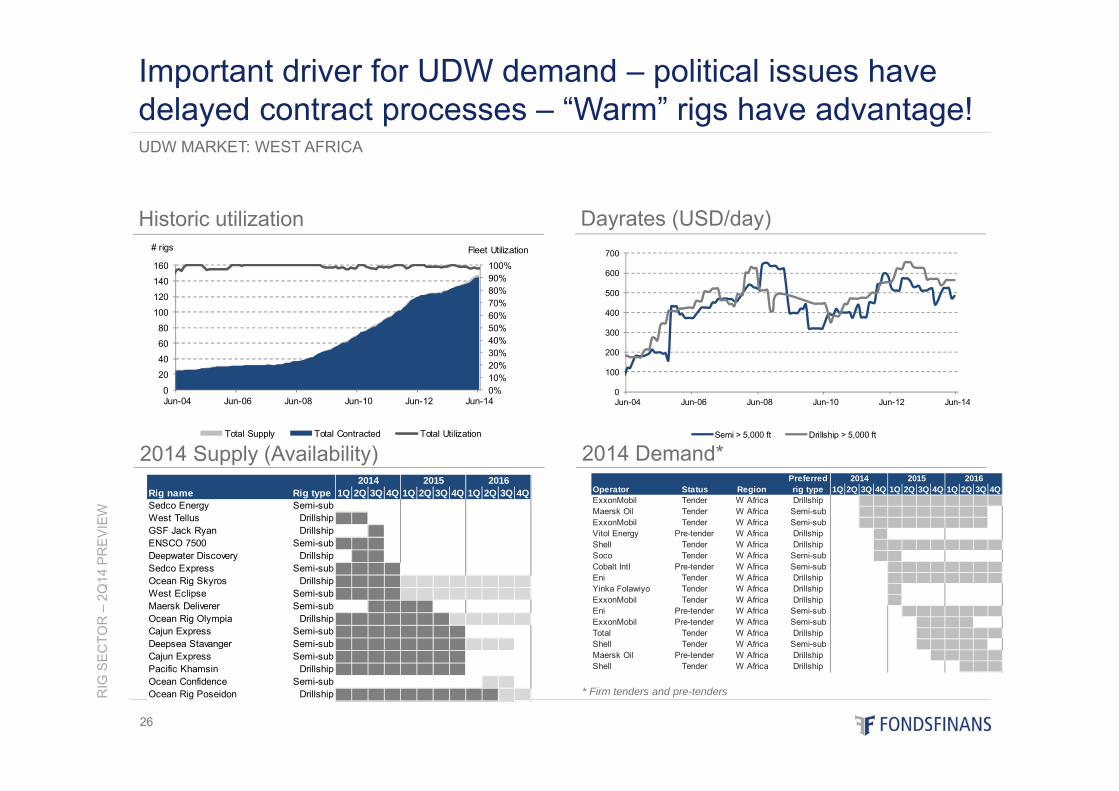
2014 Supply (Availability)
UDW MARKET: WEST AFRICA
Important driver for UDW demand – political issues have delayed contract processes – “Warm” rigs have advantage!
Historic utilization
2014 Demand*
Dayrates (USD/day)
* Firm tenders and pre-tenders
Rig name Rig type 1Q 2Q 3Q 4Q 1Q 2Q 3Q 4Q 1Q 2Q 3Q 4QSedco Energy Semi-sub 0 0 0 0 0 0 0 0 0 0 0West Tellus Drillship 1 1 0 0 0 0 0 0 0 0 0 0GSF Jack Ryan Drillship 1 0 0 0 0 0 0 0 0 0ENSCO 7500 Semi-sub 1 1 1 0 0 0 0 0 0 0 0 0Deepwater Discovery Drillship 1 1 0 0 0 0 0 0 0 0 0Sedco Express Semi-sub 1 1 1 1 0 0 0 0 0 0 0 0Ocean Rig Skyros Drillship 1 1 1 1 10 10 10 10 10 10 10 10West Eclipse Semi-sub 1 1 1 1 10 10 10 10 10 10 10 10Maersk Deliverer Semi-sub 1 1 1 1 0 0 0 0 0 0Ocean Rig Olympia Drillship 1 1 1 1 1 1 1 10 10 10 10 10Cajun Express Semi-sub 1 1 1 1 1 1 1 1 0 0 0 0Deepsea Stavanger Semi-sub 1 1 1 1 1 1 1 1 10 10 10 0Cajun Express Semi-sub 1 1 1 1 1 1 1 1 0 0 0 0Pacific Khamsin Drillship 1 1 1 1 1 1 1 1 0 0 0 0Ocean Confidence Semi-sub 12 12 0Ocean Rig Poseidon Drillship 1 1 1 1 1 1 1 1 1 1 10 10
2014 2015 2016 PreferredOperator Status Region rig type 1Q 2Q 3Q 4Q 1Q 2Q 3Q 4Q 1Q 2Q 3Q 4QExxonMobil Tender W Africa Drillship 2 2 4 4 4 4 4 4 4 4 4 4Maersk Oil Tender W Africa Semi-sub 2 2 4 4 4 4 4 4 4 4 4 2ExxonMobil Tender W Africa Semi-sub 2 2 4 4 4 4 4 4 4 4 4 2Vitol Energy Pre-tender W Africa Drillship 2 2 2 4 2 2 2 2 2 2 2 2Shell Tender W Africa Drillship 2 2 2 4 4 4 4 4 4 4 4 4Soco Tender W Africa Semi-sub 2 2 2 4 4 2 2 2 2 2 2 2Cobalt Intl Pre-tender W Africa Semi-sub 2 2 2 2 4 4 4 4 4 4 4 4Eni Tender W Africa Drillship 2 2 2 2 4 4 4 4 4 4 4 4Yinka Folawiyo Tender W Africa Drillship 2 2 2 2 4 2 2 2 2 2 2 2ExxonMobil Tender W Africa Drillship 2 2 2 2 4 2 2 2 2 2 2 2Eni Pre-tender W Africa Semi-sub 2 2 2 2 2 4 4 4 4 4 4 4ExxonMobil Pre-tender W Africa Semi-sub 2 2 2 2 2 2 4 4 4 4 2 2Total Tender W Africa Drillship 2 2 2 2 2 2 4 4 4 4 4 4Shell Tender W Africa Semi-sub 2 2 2 2 2 2 4 4 4 4 4 2Maersk Oil Pre-tender W Africa Drillship 2 2 2 2 2 2 2 4 4 4 4 4Shell Tender W Africa Drillship 2 2 2 2 2 2 2 2 2 4 4 4
2014 2015 2016
Rig name Rig type 1Q 2Q 3Q 4Q 1Q 2Q 3Q 4Q 1Q 2Q 3Q 4QWest Navigator Drillship 1 1 1 1 1 0 0 0 0 0 0 0Transocean Leader Semi-sub 1 1 1 1 1 1 0 0 0 0 0 0Transocean Searcher Semi-sub 1 1 1 1 1 1 0 0 0 0 0 0Transocean Spitsbergen Semi-sub 1 1 1 1 1 1 10 0 0 0 0 0West Venture Semi-sub 1 1 1 1 1 1 1 0 0 0 0 0Deepsea Atlantic Semi-sub 1 1 1 1 1 1 1 10 10 10 10 10Transocean Barents Semi-sub 1 1 1 1 1 1 1 0 0 0 0 0Island Innovator Semi-sub 1 1 1 1 1 1 1 1 10 10 10 10Bredford Dolphin Semi-sub 1 1 1 1 1 1 1 1 10 10 0 0Transocean Arctic Semi-sub 1 1 1 1 1 1 1 1 10 0 0 0Songa Trym Semi-sub 1 1 1 1 1 1 1 1 1 10 10 10Leiv Eiriksson Semi-sub 1 1 1 1 1 1 1 1 1 10 10 10West Alpha Semi-sub 12Transocean Winner Semi-sub 1 1 1 1 1 1 1 1 1 1 0COSLPioneer Semi-sub 1 1 1 1 1 1 1 1 1 1 1 0Songa Delta Semi-sub 1 1 1 1 1 1 1 1 1 1 1 10
2014 2015 2016
0
100
200
300
400
500
600
Jun-04 Jun-06 Jun-08 Jun-10 Jun-12 Jun-14
Semi Harsh Environment
0%10%20%30%40%50%60%70%80%90%100%
0
20
40
60
80
100
120
140
160
Jun-04 Jun-06 Jun-08 Jun-10 Jun-12 Jun-14
Fleet Utilization# rigs
Total Supply Total Contracted Total Utilization
RIG
SE
CTO
R –
2Q14
PR
EV
IEW
27
2014 Supply (Availability)
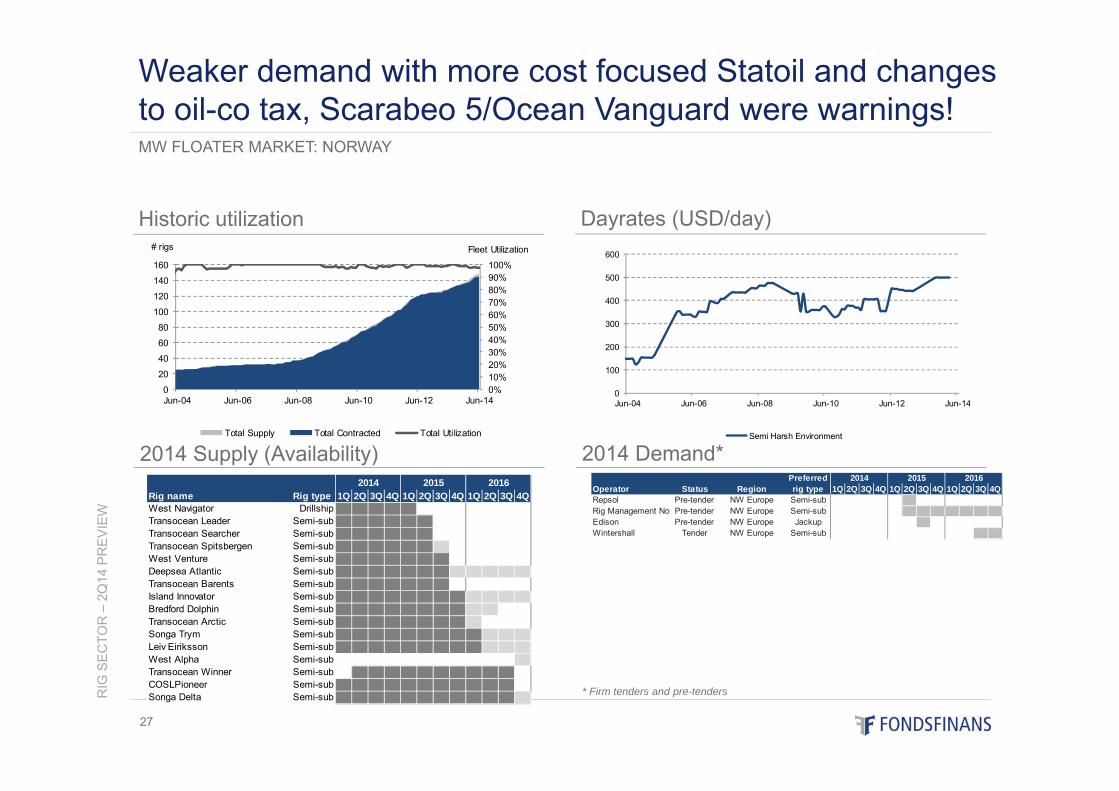
MW FLOATER MARKET: NORWAY
Weaker demand with more cost focused Statoil and changes to oil-co tax, Scarabeo 5/Ocean Vanguard were warnings!
Historic utilization
2014 Demand*
Dayrates (USD/day)
* Firm tenders and pre-tenders
PreferredOperator Status Region rig type 1Q 2Q 3Q 4Q 1Q 2Q 3Q 4Q 1Q 2Q 3Q 4QRepsol Pre-tender NW Europe Semi-sub 2 2 2 2 2 4 2 2 2 2 2 2Rig Management Nor Pre-tender NW Europe Semi-sub 2 2 2 2 2 4 4 4 4 4 4 4Edison Pre-tender NW Europe Jackup 2 2 2 2 2 2 4 2 2 2 2 2Wintershall Tender NW Europe Semi-sub 2 2 2 2 2 2 2 2 2 2 4 4
2014 2015 2016
Rig name Rig type 1Q 2Q 3Q 4Q 1Q 2Q 3Q 4Q 1Q 2Q 3Q 4QJ.W. McLean Semi-sub 0 0 0 0 0 0 0 0 0 0 0 0Ocean Vanguard Semi-sub 1 1 0 0 0 0 0 0 0 0 0 0Ocean Princess Semi-sub 1 1 1 0 0 0 0 0 0 0 0 0GSF Arctic III Semi-sub 1 1 1 1 1 0 0 0 0 0 0 0Transocean Prospect Semi-sub 1 1 1 1 1 1 0 0 0 0 0 0Noble Ton van Langeveld Semi-sub 1 1 1 1 1 1 10 10 10 10 0 0Ocean Guardian Semi-sub 1 1 1 1 1 1 1 10 10 10 10 10Ocean Nomad Semi-sub 1 1 1 1 1 1 1 10 10 10 10 0West Phoenix Semi-sub 1 1 1 1 1 1 1 10 0 0 0 0WilHunter Semi-sub 1 1 1 1 1 1 1 1 10 10 10 10Sedco 711 Semi-sub 1 1 1 1 1 1 1 1 0 0 0Sedco 704 Semi-sub 1 1 1 1 1 1 1 1 1 0 0 0Stena Spey Semi-sub 1 1 1 1 1 1 1 1 1 0 0 0Sedco 714 Semi-sub 1 1 1 1 1 1 1 1 1 0 0 0Byford Dolphin Semi-sub 1 1 1 1 1 1 1 1 1 1 10 10Transocean John Shaw Semi-sub 0 0
2014 2015 2016
0%10%20%30%40%50%60%70%80%90%100%
0
20
40
60
80
100
120
140
160
Jun-04 Jun-06 Jun-08 Jun-10 Jun-12 Jun-14
Fleet Utilization# rigs
Total Supply Total Contracted Total Utilization
0
50
100
150
200
250
300
350
400
450
Jun-04 Jun-06 Jun-08 Jun-10 Jun-12 Jun-14
Semi Harsh Environment
RIG
SE
CTO
R –
2Q14
PR
EV
IEW
28
2014 Supply (Availability)
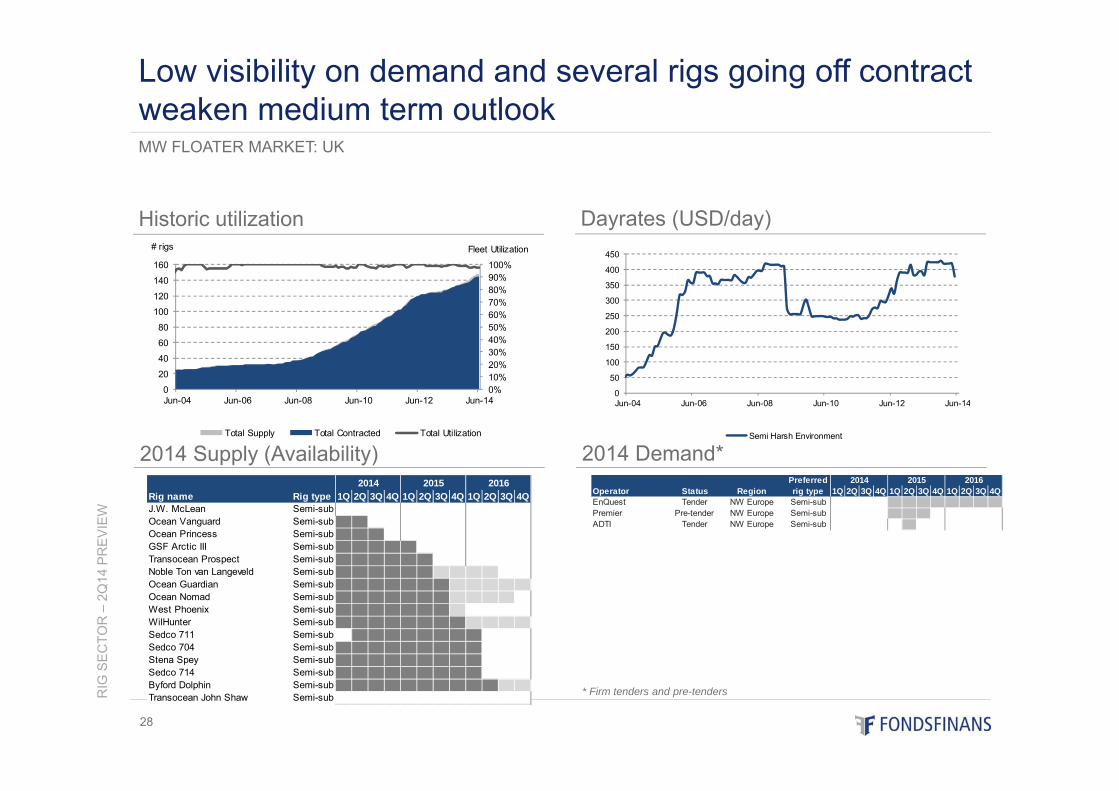
MW FLOATER MARKET: UK
Low visibility on demand and several rigs going off contract weaken medium term outlook
Historic utilization
2014 Demand*
Dayrates (USD/day)
* Firm tenders and pre-tenders
PreferredOperator Status Region rig type 1Q 2Q 3Q 4Q 1Q 2Q 3Q 4Q 1Q 2Q 3Q 4QEnQuest Tender NW Europe Semi-sub 2 2 2 2 4 4 4 4 4 4 4 4Premier Pre-tender NW Europe Semi-sub 2 2 2 2 4 4 4 2 2 2 2 2ADTI Tender NW Europe Semi-sub 2 2 2 2 2 4 2 2 2 2 2 2
2014 2015 2016
Market recommendations ........................................................... Page 02Market appendix ......................................................................... Page 21Company presentations ............................................................. Page 30
- Awilco Drilling .................................................................................................. Page 31
- Fred. Olsen Energy ......................................................................................... Page 35
- Ocean Rig ....................................................................................................... Page 40
- Odfjell Drilling .................................................................................................. Page 45
- Pacific Drilling ..................................................................................................Page 50
- Seadrill ............................................................................................................ Page 55
- Sevan Drilling .................................................................................................. Page 60
- Songa Offshore ............................................................................................... Page 64
Risk assessment ........................................................................ Page 69Disclaimer .................................................................................. Page 71
RIG
SE
CTO
R –
2Q14
PR
EV
IEW
29
Table of content
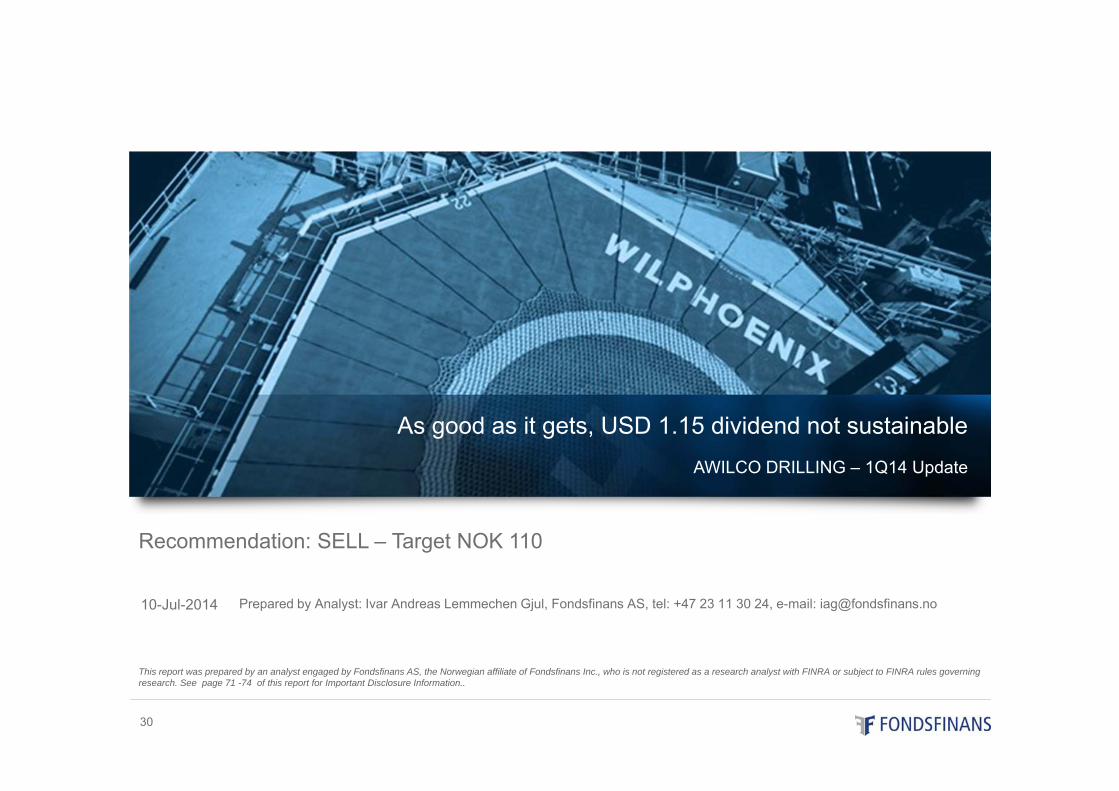
AWILCO DRILLING – 1Q14 Update
Recommendation: SELL – Target NOK 110
Prepared by Analyst: Ivar Andreas Lemmechen Gjul, Fondsfinans AS, tel: +47 23 11 30 24, e-mail: [email protected]
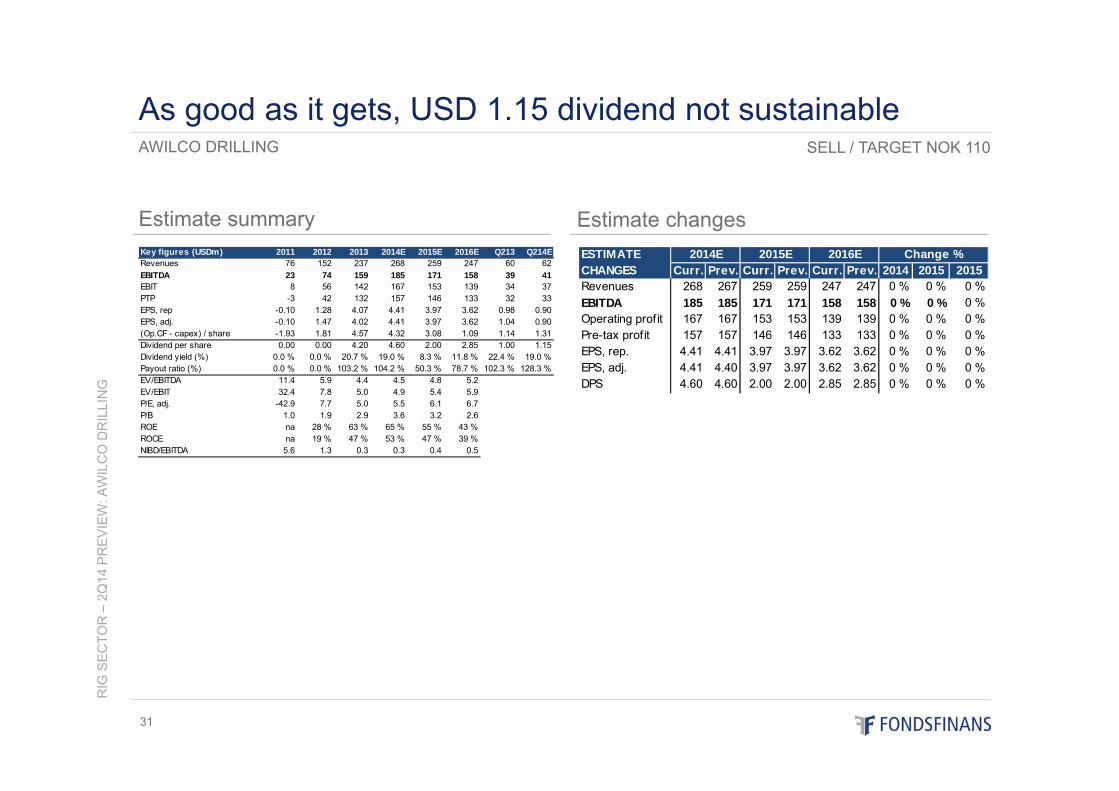
As good as it gets, USD 1.15 dividend not sustainable
10-Jul-2014
30
This report was prepared by an analyst engaged by Fondsfinans AS, the Norwegian affiliate of Fondsfinans Inc., who is not registered as a research analyst with FINRA or subject to FINRA rules governing research. See page 71 -74 of this report for Important Disclosure Information..
Estimate summary
RIG
SE
CTO
R –
2Q14
PR
EV
IEW
: AW
ILC
O D
RIL
LIN
G
31
Estimate changes
AWILCO DRILLING
As good as it gets, USD 1.15 dividend not sustainableSELL / TARGET NOK 110
Key figures (USDm) 2011 2012 2013 2014E 2015E 2016E Q213 Q214ERevenues 76 152 237 268 259 247 60 62EBITDA 23 74 159 185 171 158 39 41EBIT 8 56 142 167 153 139 34 37PTP -3 42 132 157 146 133 32 33EPS, rep -0.10 1.28 4.07 4.41 3.97 3.62 0.98 0.90EPS, adj. -0.10 1.47 4.02 4.41 3.97 3.62 1.04 0.90(Op.CF - capex) / share -1.93 1.81 4.57 4.32 3.08 1.09 1.14 1.31Dividend per share 0.00 0.00 4.20 4.60 2.00 2.85 1.00 1.15Dividend yield (%) 0.0 % 0.0 % 20.7 % 19.0 % 8.3 % 11.8 % 22.4 % 19.0 %Payout ratio (%) 0.0 % 0.0 % 103.2 % 104.2 % 50.3 % 78.7 % 102.3 % 128.3 %EV/EBITDA 11.4 5.9 4.4 4.5 4.8 5.2EV/EBIT 32.4 7.8 5.0 4.9 5.4 5.9P/E, adj. -42.9 7.7 5.0 5.5 6.1 6.7P/B 1.0 1.9 2.9 3.6 3.2 2.6ROE na 28 % 63 % 65 % 55 % 43 %ROCE na 19 % 47 % 53 % 47 % 39 %NIBD/EBITDA 5.6 1.3 0.3 0.3 0.4 0.5
ESTIMATECHANGES Curr. Prev. Curr. Prev. Curr. Prev. 2014 2015 2015Revenues 268 267 259 259 247 247 0 % 0 % 0 %EBITDA 185 185 171 171 158 158 0 % 0 % 0 %Operating prof it 167 167 153 153 139 139 0 % 0 % 0 %Pre-tax prof it 157 157 146 146 133 133 0 % 0 % 0 %EPS, rep. 4.41 4.41 3.97 3.97 3.62 3.62 0 % 0 % 0 %EPS, adj. 4.41 4.40 3.97 3.97 3.62 3.62 0 % 0 % 0 %DPS 4.60 4.60 2.00 2.00 2.85 2.85 0 % 0 % 0 %
2014E 2015E 2016E Change %
RIG
SE
CTO
R –
2Q14
PR
EV
IEW
: AW
ILC
O D
RIL
LIN
G
32
ESTIMATES
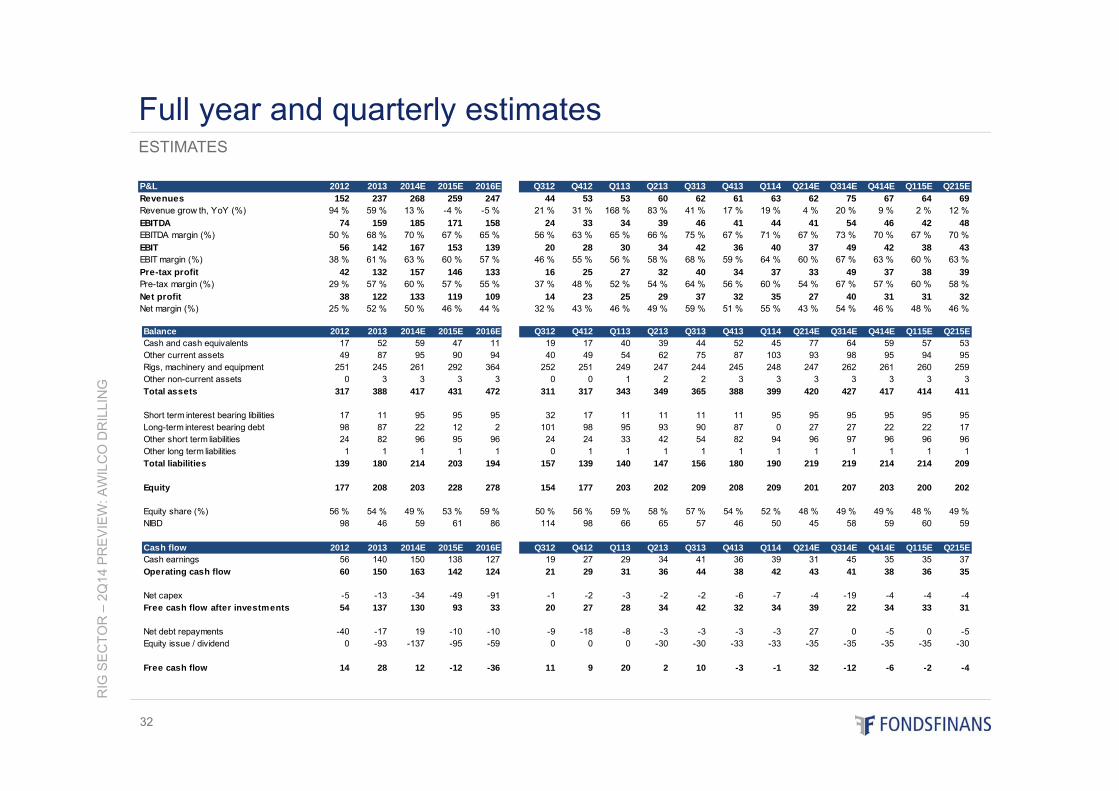
Full year and quarterly estimates
P&L 2012 2013 2014E 2015E 2016E Q312 Q412 Q113 Q213 Q313 Q413 Q114 Q214E Q314E Q414E Q115E Q215ERevenues 152 237 268 259 247 44 53 53 60 62 61 63 62 75 67 64 69Revenue grow th, YoY (%) 94 % 59 % 13 % -4 % -5 % 21 % 31 % 168 % 83 % 41 % 17 % 19 % 4 % 20 % 9 % 2 % 12 %EBITDA 74 159 185 171 158 24 33 34 39 46 41 44 41 54 46 42 48EBITDA margin (%) 50 % 68 % 70 % 67 % 65 % 56 % 63 % 65 % 66 % 75 % 67 % 71 % 67 % 73 % 70 % 67 % 70 %EBIT 56 142 167 153 139 20 28 30 34 42 36 40 37 49 42 38 43EBIT margin (%) 38 % 61 % 63 % 60 % 57 % 46 % 55 % 56 % 58 % 68 % 59 % 64 % 60 % 67 % 63 % 60 % 63 %Pre-tax profit 42 132 157 146 133 16 25 27 32 40 34 37 33 49 37 38 39Pre-tax margin (%) 29 % 57 % 60 % 57 % 55 % 37 % 48 % 52 % 54 % 64 % 56 % 60 % 54 % 67 % 57 % 60 % 58 %Net profit 38 122 133 119 109 14 23 25 29 37 32 35 27 40 31 31 32Net margin (%) 25 % 52 % 50 % 46 % 44 % 32 % 43 % 46 % 49 % 59 % 51 % 55 % 43 % 54 % 46 % 48 % 46 %
Balance 2012 2013 2014E 2015E 2016E Q312 Q412 Q113 Q213 Q313 Q413 Q114 Q214E Q314E Q414E Q115E Q215ECash and cash equivalents 17 52 59 47 11 19 17 40 39 44 52 45 77 64 59 57 53Other current assets 49 87 95 90 94 40 49 54 62 75 87 103 93 98 95 94 95Rigs, machinery and equipment 251 245 261 292 364 252 251 249 247 244 245 248 247 262 261 260 259Other non-current assets 0 3 3 3 3 0 0 1 2 2 3 3 3 3 3 3 3Total assets 317 388 417 431 472 311 317 343 349 365 388 399 420 427 417 414 411
Short term interest bearing libilities 17 11 95 95 95 32 17 11 11 11 11 95 95 95 95 95 95Long-term interest bearing debt 98 87 22 12 2 101 98 95 93 90 87 0 27 27 22 22 17Other short term liabilities 24 82 96 95 96 24 24 33 42 54 82 94 96 97 96 96 96Other long term liabilities 1 1 1 1 1 0 1 1 1 1 1 1 1 1 1 1 1Total liabilities 139 180 214 203 194 157 139 140 147 156 180 190 219 219 214 214 209
Equity 177 208 203 228 278 154 177 203 202 209 208 209 201 207 203 200 202
Equity share (%) 56 % 54 % 49 % 53 % 59 % 50 % 56 % 59 % 58 % 57 % 54 % 52 % 48 % 49 % 49 % 48 % 49 %NIBD 98 46 59 61 86 114 98 66 65 57 46 50 45 58 59 60 59
Cash flow 2012 2013 2014E 2015E 2016E Q312 Q412 Q113 Q213 Q313 Q413 Q114 Q214E Q314E Q414E Q115E Q215ECash earnings 56 140 150 138 127 19 27 29 34 41 36 39 31 45 35 35 37Operating cash flow 60 150 163 142 124 21 29 31 36 44 38 42 43 41 38 36 35
Net capex -5 -13 -34 -49 -91 -1 -2 -3 -2 -2 -6 -7 -4 -19 -4 -4 -4Free cash flow after investments 54 137 130 93 33 20 27 28 34 42 32 34 39 22 34 33 31
Net debt repayments -40 -17 19 -10 -10 -9 -18 -8 -3 -3 -3 -3 27 0 -5 0 -5Equity issue / dividend 0 -93 -137 -95 -59 0 0 0 -30 -30 -33 -33 -35 -35 -35 -35 -30
Free cash flow 14 28 12 -12 -36 11 9 20 2 10 -3 -1 32 -12 -6 -2 -4
RIG
SE
CTO
R –
2Q14
PR
EV
IEW
: AW
ILC
O D
RIL
LIN
G
33
ESTIMATES
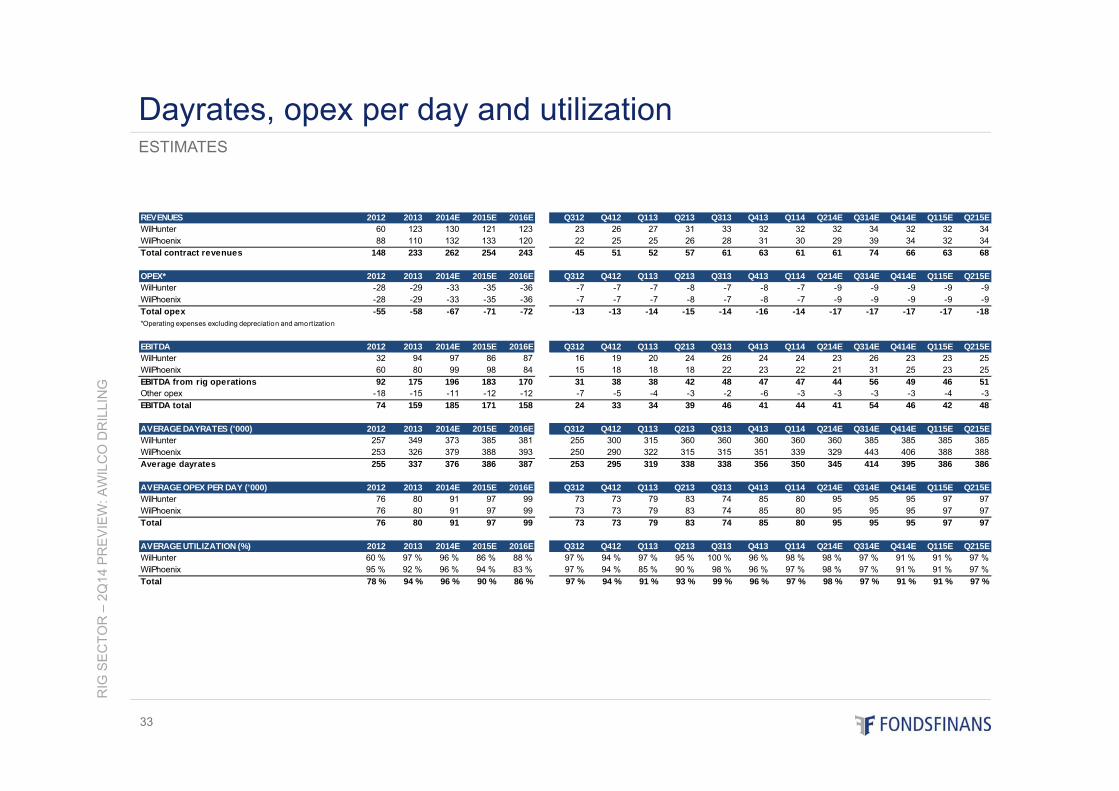
Dayrates, opex per day and utilization
REVENUES 2012 2013 2014E 2015E 2016E Q312 Q412 Q113 Q213 Q313 Q413 Q114 Q214E Q314E Q414E Q115E Q215EWilHunter 60 123 130 121 123 23 26 27 31 33 32 32 32 34 32 32 34WilPhoenix 88 110 132 133 120 22 25 25 26 28 31 30 29 39 34 32 34Total contract revenues 148 233 262 254 243 45 51 52 57 61 63 61 61 74 66 63 68
OPEX* 2012 2013 2014E 2015E 2016E Q312 Q412 Q113 Q213 Q313 Q413 Q114 Q214E Q314E Q414E Q115E Q215EWilHunter -28 -29 -33 -35 -36 -7 -7 -7 -8 -7 -8 -7 -9 -9 -9 -9 -9WilPhoenix -28 -29 -33 -35 -36 -7 -7 -7 -8 -7 -8 -7 -9 -9 -9 -9 -9Total opex -55 -58 -67 -71 -72 -13 -13 -14 -15 -14 -16 -14 -17 -17 -17 -17 -18*Operating expenses excluding depreciation and amortization
EBITDA 2012 2013 2014E 2015E 2016E Q312 Q412 Q113 Q213 Q313 Q413 Q114 Q214E Q314E Q414E Q115E Q215EWilHunter 32 94 97 86 87 16 19 20 24 26 24 24 23 26 23 23 25WilPhoenix 60 80 99 98 84 15 18 18 18 22 23 22 21 31 25 23 25EBITDA from rig operations 92 175 196 183 170 31 38 38 42 48 47 47 44 56 49 46 51Other opex -18 -15 -11 -12 -12 -7 -5 -4 -3 -2 -6 -3 -3 -3 -3 -4 -3EBITDA total 74 159 185 171 158 24 33 34 39 46 41 44 41 54 46 42 48
AVERAGE DAYRATES ('000) 2012 2013 2014E 2015E 2016E Q312 Q412 Q113 Q213 Q313 Q413 Q114 Q214E Q314E Q414E Q115E Q215EWilHunter 257 349 373 385 381 255 300 315 360 360 360 360 360 385 385 385 385WilPhoenix 253 326 379 388 393 250 290 322 315 315 351 339 329 443 406 388 388Average dayrates 255 337 376 386 387 253 295 319 338 338 356 350 345 414 395 386 386
AVERAGE OPEX PER DAY ('000) 2012 2013 2014E 2015E 2016E Q312 Q412 Q113 Q213 Q313 Q413 Q114 Q214E Q314E Q414E Q115E Q215EWilHunter 76 80 91 97 99 73 73 79 83 74 85 80 95 95 95 97 97WilPhoenix 76 80 91 97 99 73 73 79 83 74 85 80 95 95 95 97 97Total 76 80 91 97 99 73 73 79 83 74 85 80 95 95 95 97 97
AVERAGE UTILIZATION (%) 2012 2013 2014E 2015E 2016E Q312 Q412 Q113 Q213 Q313 Q413 Q114 Q214E Q314E Q414E Q115E Q215EWilHunter 60 % 97 % 96 % 86 % 88 % 97 % 94 % 97 % 95 % 100 % 96 % 98 % 98 % 97 % 91 % 91 % 97 %WilPhoenix 95 % 92 % 96 % 94 % 83 % 97 % 94 % 85 % 90 % 98 % 96 % 97 % 98 % 97 % 91 % 91 % 97 %Total 78 % 94 % 96 % 90 % 86 % 97 % 94 % 91 % 93 % 99 % 96 % 97 % 98 % 97 % 91 % 91 % 97 %
FRED. OLSEN ENERGY – 1Q14 UPDATE
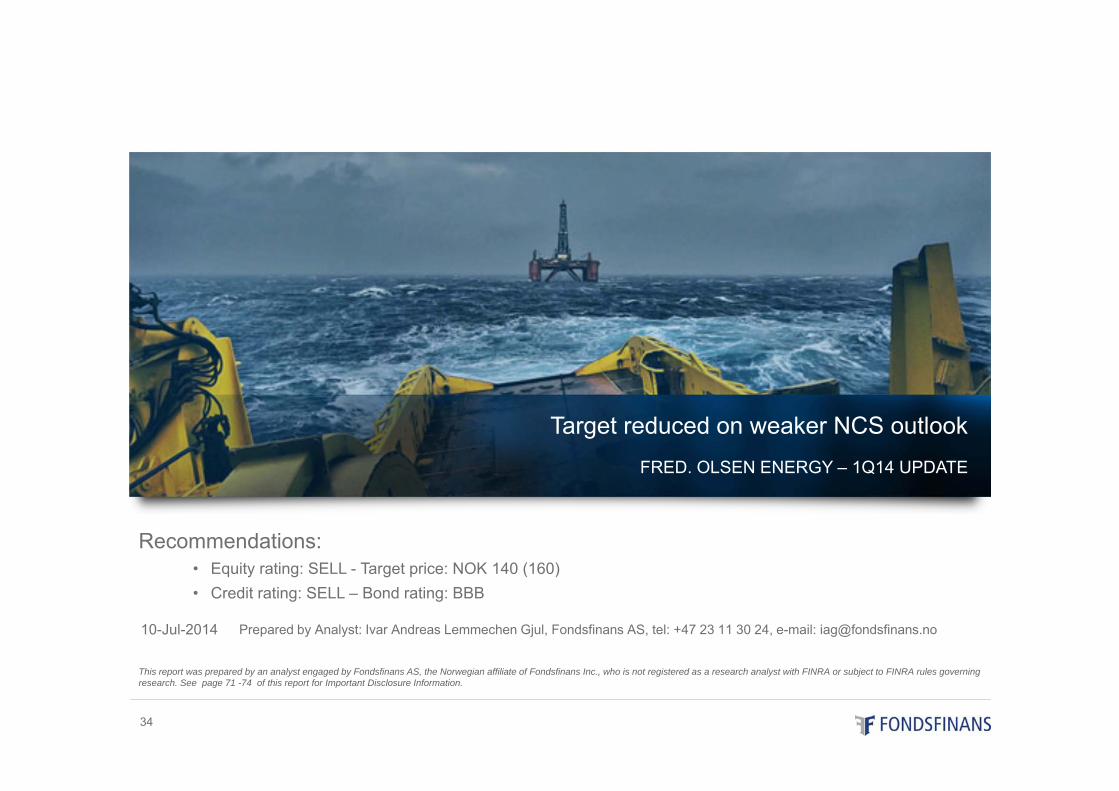
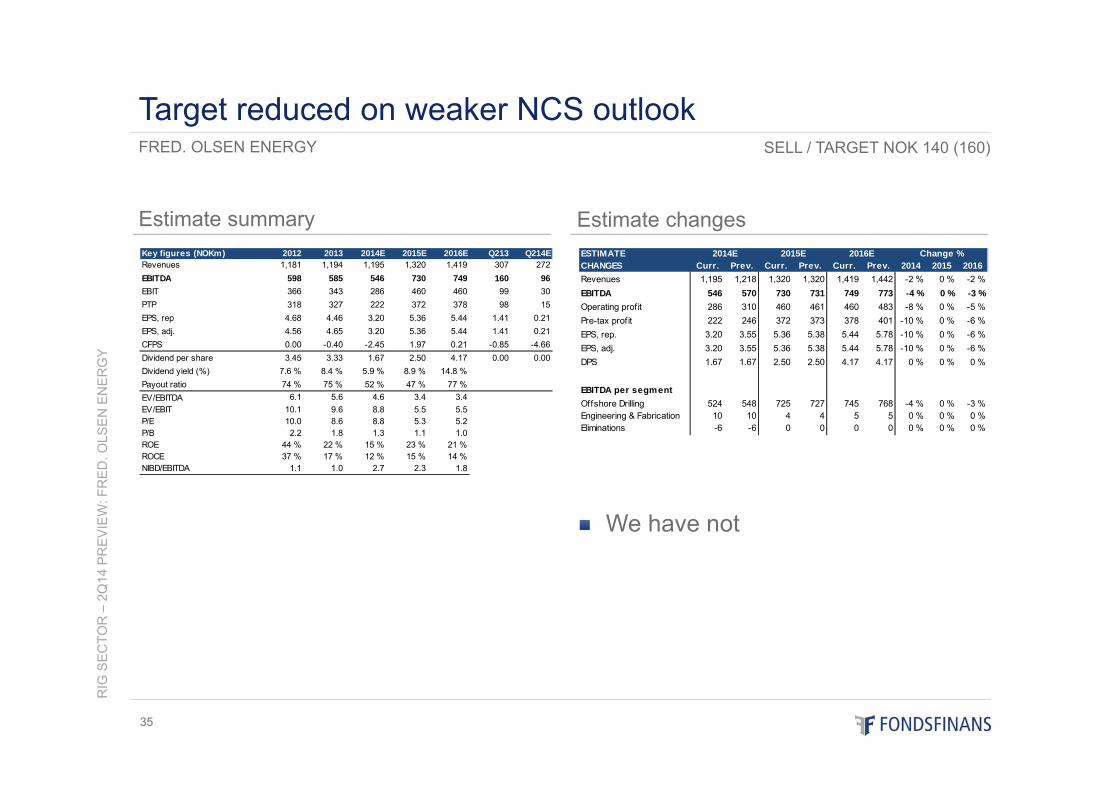
Target reduced on weaker NCS outlook
10-Jul-2014
34
Recommendations:• Equity rating: SELL - Target price: NOK 140 (160)• Credit rating: SELL – Bond rating: BBB
Prepared by Analyst: Ivar Andreas Lemmechen Gjul, Fondsfinans AS, tel: +47 23 11 30 24, e-mail: [email protected]
This report was prepared by an analyst engaged by Fondsfinans AS, the Norwegian affiliate of Fondsfinans Inc., who is not registered as a research analyst with FINRA or subject to FINRA rules governing research. See page 71 -74 of this report for Important Disclosure Information.
Estimate summary
RIG
SE
CTO
R –
2Q14
PR
EV
IEW
: FR
ED
. OLS
EN
EN
ER
GY
35
Estimate changes
We have not
FRED. OLSEN ENERGY
Target reduced on weaker NCS outlookSELL / TARGET NOK 140 (160)
Key figures (NOKm) 2012 2013 2014E 2015E 2016E Q213 Q214ERevenues 1,181 1,194 1,195 1,320 1,419 307 272EBITDA 598 585 546 730 749 160 96EBIT 366 343 286 460 460 99 30PTP 318 327 222 372 378 98 15EPS, rep 4.68 4.46 3.20 5.36 5.44 1.41 0.21EPS, adj. 4.56 4.65 3.20 5.36 5.44 1.41 0.21CFPS 0.00 -0.40 -2.45 1.97 0.21 -0.85 -4.66Dividend per share 3.45 3.33 1.67 2.50 4.17 0.00 0.00Dividend yield (%) 7.6 % 8.4 % 5.9 % 8.9 % 14.8 %Payout ratio 74 % 75 % 52 % 47 % 77 %EV/EBITDA 6.1 5.6 4.6 3.4 3.4EV/EBIT 10.1 9.6 8.8 5.5 5.5P/E 10.0 8.6 8.8 5.3 5.2P/B 2.2 1.8 1.3 1.1 1.0ROE 44 % 22 % 15 % 23 % 21 %ROCE 37 % 17 % 12 % 15 % 14 %NIBD/EBITDA 1.1 1.0 2.7 2.3 1.8
ESTIMATECHANGES Curr. Prev. Curr. Prev. Curr. Prev. 2014 2015 2016Revenues 1,195 1,218 1,320 1,320 1,419 1,442 -2 % 0 % -2 %EBITDA 546 570 730 731 749 773 -4 % 0 % -3 %Operating profit 286 310 460 461 460 483 -8 % 0 % -5 %Pre-tax profit 222 246 372 373 378 401 -10 % 0 % -6 %EPS, rep. 3.20 3.55 5.36 5.38 5.44 5.78 -10 % 0 % -6 %EPS, adj. 3.20 3.55 5.36 5.38 5.44 5.78 -10 % 0 % -6 %DPS 1.67 1.67 2.50 2.50 4.17 4.17 0 % 0 % 0 %
EBITDA per segmentOffshore Drilling 524 548 725 727 745 768 -4 % 0 % -3 %Engineering & Fabrication 10 10 4 4 5 5 0 % 0 % 0 %Eliminations -6 -6 0 0 0 0 0 % 0 % 0 %
Change %2014E 2015E 2016E
RIG
SE
CTO
R –
2Q14
PR
EV
IEW
: FR
ED
. OLS
EN
EN
ER
GY
36
ESTIMATES
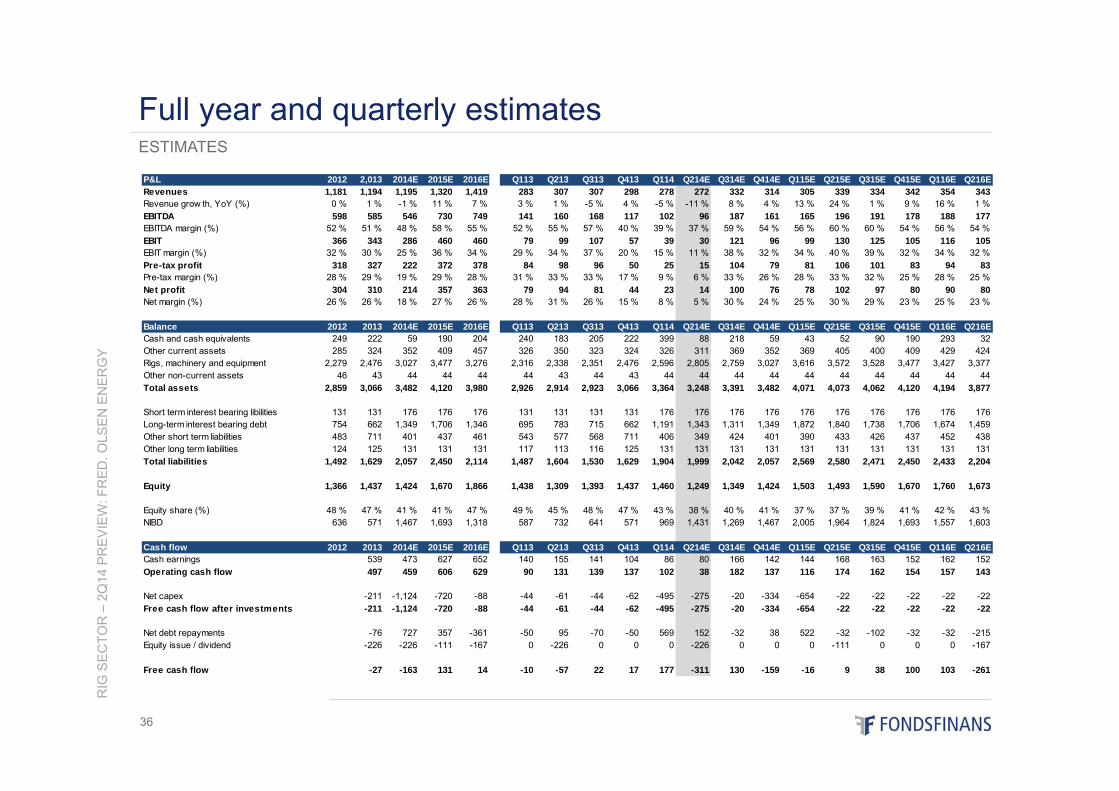
Full year and quarterly estimates
P&L 2012 2,013 2014E 2015E 2016E Q113 Q213 Q313 Q413 Q114 Q214E Q314E Q414E Q115E Q215E Q315E Q415E Q116E Q216ERevenues 1,181 1,194 1,195 1,320 1,419 283 307 307 298 278 272 332 314 305 339 334 342 354 343Revenue grow th, YoY (%) 0 % 1 % -1 % 11 % 7 % 3 % 1 % -5 % 4 % -5 % -11 % 8 % 4 % 13 % 24 % 1 % 9 % 16 % 1 %EBITDA 598 585 546 730 749 141 160 168 117 102 96 187 161 165 196 191 178 188 177EBITDA margin (%) 52 % 51 % 48 % 58 % 55 % 52 % 55 % 57 % 40 % 39 % 37 % 59 % 54 % 56 % 60 % 60 % 54 % 56 % 54 %EBIT 366 343 286 460 460 79 99 107 57 39 30 121 96 99 130 125 105 116 105EBIT margin (%) 32 % 30 % 25 % 36 % 34 % 29 % 34 % 37 % 20 % 15 % 11 % 38 % 32 % 34 % 40 % 39 % 32 % 34 % 32 %Pre-tax profit 318 327 222 372 378 84 98 96 50 25 15 104 79 81 106 101 83 94 83Pre-tax margin (%) 28 % 29 % 19 % 29 % 28 % 31 % 33 % 33 % 17 % 9 % 6 % 33 % 26 % 28 % 33 % 32 % 25 % 28 % 25 %Net profit 304 310 214 357 363 79 94 81 44 23 14 100 76 78 102 97 80 90 80Net margin (%) 26 % 26 % 18 % 27 % 26 % 28 % 31 % 26 % 15 % 8 % 5 % 30 % 24 % 25 % 30 % 29 % 23 % 25 % 23 %
Balance 2012 2013 2014E 2015E 2016E Q113 Q213 Q313 Q413 Q114 Q214E Q314E Q414E Q115E Q215E Q315E Q415E Q116E Q216ECash and cash equivalents 249 222 59 190 204 240 183 205 222 399 88 218 59 43 52 90 190 293 32Other current assets 285 324 352 409 457 326 350 323 324 326 311 369 352 369 405 400 409 429 424Rigs, machinery and equipment 2,279 2,476 3,027 3,477 3,276 2,316 2,338 2,351 2,476 2,596 2,805 2,759 3,027 3,616 3,572 3,528 3,477 3,427 3,377Other non-current assets 46 43 44 44 44 44 43 44 43 44 44 44 44 44 44 44 44 44 44Total assets 2,859 3,066 3,482 4,120 3,980 2,926 2,914 2,923 3,066 3,364 3,248 3,391 3,482 4,071 4,073 4,062 4,120 4,194 3,877
Short term interest bearing libilities 131 131 176 176 176 131 131 131 131 176 176 176 176 176 176 176 176 176 176Long-term interest bearing debt 754 662 1,349 1,706 1,346 695 783 715 662 1,191 1,343 1,311 1,349 1,872 1,840 1,738 1,706 1,674 1,459Other short term liabilities 483 711 401 437 461 543 577 568 711 406 349 424 401 390 433 426 437 452 438Other long term liabilities 124 125 131 131 131 117 113 116 125 131 131 131 131 131 131 131 131 131 131Total liabilities 1,492 1,629 2,057 2,450 2,114 1,487 1,604 1,530 1,629 1,904 1,999 2,042 2,057 2,569 2,580 2,471 2,450 2,433 2,204
Equity 1,366 1,437 1,424 1,670 1,866 1,438 1,309 1,393 1,437 1,460 1,249 1,349 1,424 1,503 1,493 1,590 1,670 1,760 1,673
Equity share (%) 48 % 47 % 41 % 41 % 47 % 49 % 45 % 48 % 47 % 43 % 38 % 40 % 41 % 37 % 37 % 39 % 41 % 42 % 43 %NIBD 636 571 1,467 1,693 1,318 587 732 641 571 969 1,431 1,269 1,467 2,005 1,964 1,824 1,693 1,557 1,603
Cash flow 2012 2013 2014E 2015E 2016E Q113 Q213 Q313 Q413 Q114 Q214E Q314E Q414E Q115E Q215E Q315E Q415E Q116E Q216ECash earnings 539 473 627 652 140 155 141 104 86 80 166 142 144 168 163 152 162 152Operating cash flow 497 459 606 629 90 131 139 137 102 38 182 137 116 174 162 154 157 143
Net capex -211 -1,124 -720 -88 -44 -61 -44 -62 -495 -275 -20 -334 -654 -22 -22 -22 -22 -22Free cash flow after investments -211 -1,124 -720 -88 -44 -61 -44 -62 -495 -275 -20 -334 -654 -22 -22 -22 -22 -22
Net debt repayments -76 727 357 -361 -50 95 -70 -50 569 152 -32 38 522 -32 -102 -32 -32 -215Equity issue / dividend -226 -226 -111 -167 0 -226 0 0 0 -226 0 0 0 -111 0 0 0 -167
Free cash flow -27 -163 131 14 -10 -57 22 17 177 -311 130 -159 -16 9 38 100 103 -261
RIG
SE
CTO
R –
2Q14
PR
EV
IEW
: FR
ED
. OLS
EN
EN
ER
GY
37
ESTIMATES
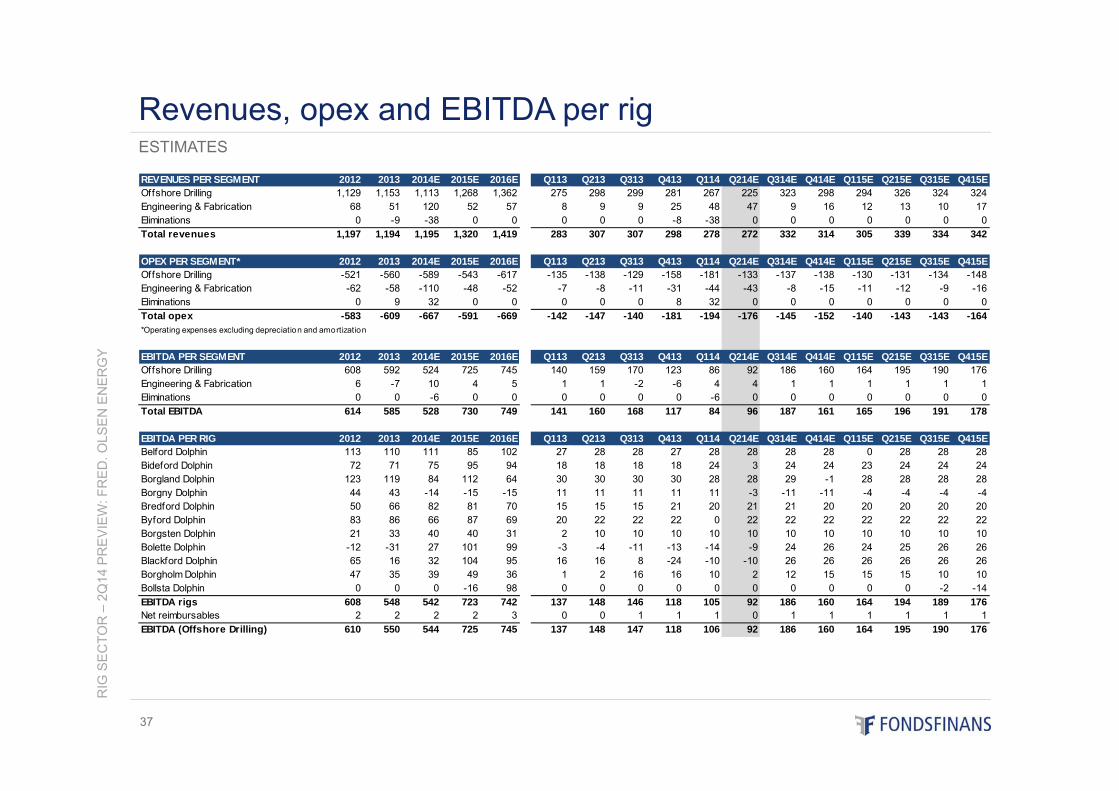
Revenues, opex and EBITDA per rig
REVENUES PER SEGMENT 2012 2013 2014E 2015E 2016E Q113 Q213 Q313 Q413 Q114 Q214E Q314E Q414E Q115E Q215E Q315E Q415EOffshore Drilling 1,129 1,153 1,113 1,268 1,362 275 298 299 281 267 225 323 298 294 326 324 324Engineering & Fabrication 68 51 120 52 57 8 9 9 25 48 47 9 16 12 13 10 17Eliminations 0 -9 -38 0 0 0 0 0 -8 -38 0 0 0 0 0 0 0Total revenues 1,197 1,194 1,195 1,320 1,419 283 307 307 298 278 272 332 314 305 339 334 342
OPEX PER SEGMENT* 2012 2013 2014E 2015E 2016E Q113 Q213 Q313 Q413 Q114 Q214E Q314E Q414E Q115E Q215E Q315E Q415EOffshore Drilling -521 -560 -589 -543 -617 -135 -138 -129 -158 -181 -133 -137 -138 -130 -131 -134 -148Engineering & Fabrication -62 -58 -110 -48 -52 -7 -8 -11 -31 -44 -43 -8 -15 -11 -12 -9 -16Eliminations 0 9 32 0 0 0 0 0 8 32 0 0 0 0 0 0 0Total opex -583 -609 -667 -591 -669 -142 -147 -140 -181 -194 -176 -145 -152 -140 -143 -143 -164*Operating expenses excluding depreciation and amortization
EBITDA PER SEGMENT 2012 2013 2014E 2015E 2016E Q113 Q213 Q313 Q413 Q114 Q214E Q314E Q414E Q115E Q215E Q315E Q415EOffshore Drilling 608 592 524 725 745 140 159 170 123 86 92 186 160 164 195 190 176Engineering & Fabrication 6 -7 10 4 5 1 1 -2 -6 4 4 1 1 1 1 1 1Eliminations 0 0 -6 0 0 0 0 0 0 -6 0 0 0 0 0 0 0Total EBITDA 614 585 528 730 749 141 160 168 117 84 96 187 161 165 196 191 178
EBITDA PER RIG 2012 2013 2014E 2015E 2016E Q113 Q213 Q313 Q413 Q114 Q214E Q314E Q414E Q115E Q215E Q315E Q415EBelford Dolphin 113 110 111 85 102 27 28 28 27 28 28 28 28 0 28 28 28Bideford Dolphin 72 71 75 95 94 18 18 18 18 24 3 24 24 23 24 24 24Borgland Dolphin 123 119 84 112 64 30 30 30 30 28 28 29 -1 28 28 28 28Borgny Dolphin 44 43 -14 -15 -15 11 11 11 11 11 -3 -11 -11 -4 -4 -4 -4Bredford Dolphin 50 66 82 81 70 15 15 15 21 20 21 21 20 20 20 20 20Byford Dolphin 83 86 66 87 69 20 22 22 22 0 22 22 22 22 22 22 22Borgsten Dolphin 21 33 40 40 31 2 10 10 10 10 10 10 10 10 10 10 10Bolette Dolphin -12 -31 27 101 99 -3 -4 -11 -13 -14 -9 24 26 24 25 26 26Blackford Dolphin 65 16 32 104 95 16 16 8 -24 -10 -10 26 26 26 26 26 26Borgholm Dolphin 47 35 39 49 36 1 2 16 16 10 2 12 15 15 15 10 10Bollsta Dolphin 0 0 0 -16 98 0 0 0 0 0 0 0 0 0 0 -2 -14EBITDA rigs 608 548 542 723 742 137 148 146 118 105 92 186 160 164 194 189 176Net reimbursables 2 2 2 2 3 0 0 1 1 1 0 1 1 1 1 1 1EBITDA (Offshore Drilling) 610 550 544 725 745 137 148 147 118 106 92 186 160 164 195 190 176
RIG
SE
CTO
R –
2Q14
PR
EV
IEW
: FR
ED
. OLS
EN
EN
ER
GY
38
ESTIMATES
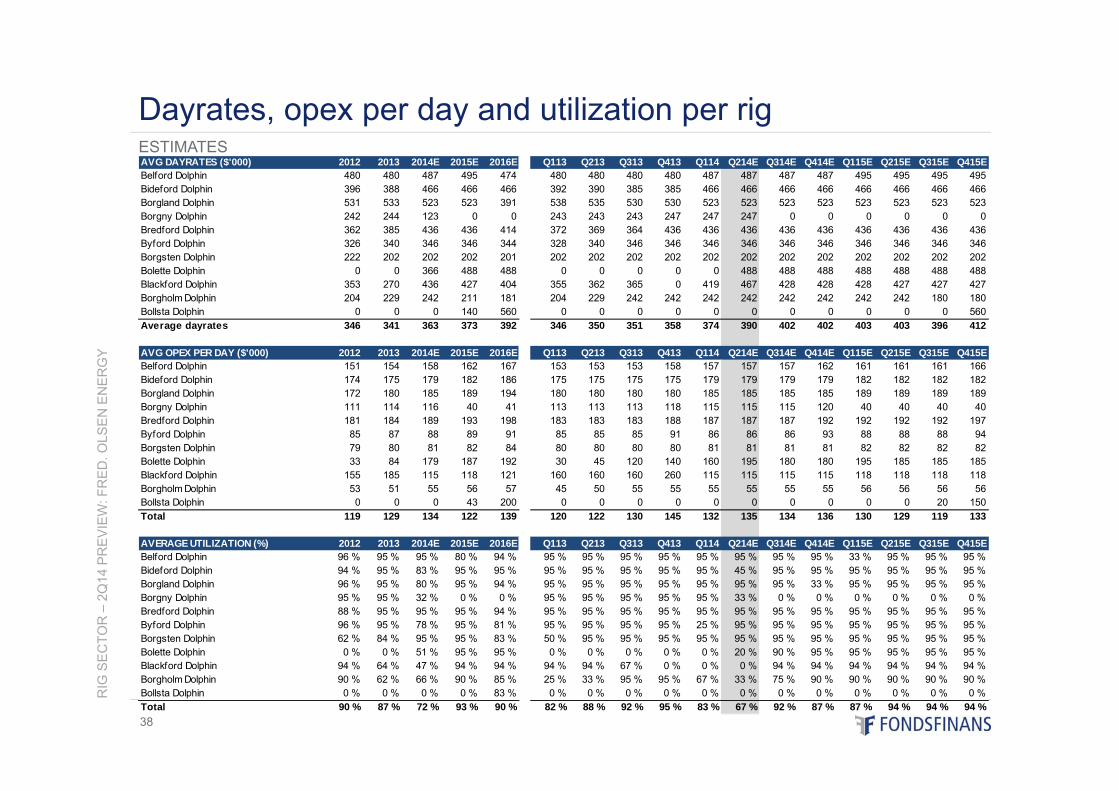
Dayrates, opex per day and utilization per rigAVG DAYRATES ($'000) 2012 2013 2014E 2015E 2016E Q113 Q213 Q313 Q413 Q114 Q214E Q314E Q414E Q115E Q215E Q315E Q415EBelford Dolphin 480 480 487 495 474 480 480 480 480 487 487 487 487 495 495 495 495Bideford Dolphin 396 388 466 466 466 392 390 385 385 466 466 466 466 466 466 466 466Borgland Dolphin 531 533 523 523 391 538 535 530 530 523 523 523 523 523 523 523 523Borgny Dolphin 242 244 123 0 0 243 243 243 247 247 247 0 0 0 0 0 0Bredford Dolphin 362 385 436 436 414 372 369 364 436 436 436 436 436 436 436 436 436Byford Dolphin 326 340 346 346 344 328 340 346 346 346 346 346 346 346 346 346 346Borgsten Dolphin 222 202 202 202 201 202 202 202 202 202 202 202 202 202 202 202 202Bolette Dolphin 0 0 366 488 488 0 0 0 0 0 488 488 488 488 488 488 488Blackford Dolphin 353 270 436 427 404 355 362 365 0 419 467 428 428 428 427 427 427Borgholm Dolphin 204 229 242 211 181 204 229 242 242 242 242 242 242 242 242 180 180Bollsta Dolphin 0 0 0 140 560 0 0 0 0 0 0 0 0 0 0 0 560Average dayrates 346 341 363 373 392 346 350 351 358 374 390 402 402 403 403 396 412
AVG OPEX PER DAY ($'000) 2012 2013 2014E 2015E 2016E Q113 Q213 Q313 Q413 Q114 Q214E Q314E Q414E Q115E Q215E Q315E Q415EBelford Dolphin 151 154 158 162 167 153 153 153 158 157 157 157 162 161 161 161 166Bideford Dolphin 174 175 179 182 186 175 175 175 175 179 179 179 179 182 182 182 182Borgland Dolphin 172 180 185 189 194 180 180 180 180 185 185 185 185 189 189 189 189Borgny Dolphin 111 114 116 40 41 113 113 113 118 115 115 115 120 40 40 40 40Bredford Dolphin 181 184 189 193 198 183 183 183 188 187 187 187 192 192 192 192 197Byford Dolphin 85 87 88 89 91 85 85 85 91 86 86 86 93 88 88 88 94Borgsten Dolphin 79 80 81 82 84 80 80 80 80 81 81 81 81 82 82 82 82Bolette Dolphin 33 84 179 187 192 30 45 120 140 160 195 180 180 195 185 185 185Blackford Dolphin 155 185 115 118 121 160 160 160 260 115 115 115 115 118 118 118 118Borgholm Dolphin 53 51 55 56 57 45 50 55 55 55 55 55 55 56 56 56 56Bollsta Dolphin 0 0 0 43 200 0 0 0 0 0 0 0 0 0 0 20 150Total 119 129 134 122 139 120 122 130 145 132 135 134 136 130 129 119 133
AVERAGE UTILIZATION (%) 2012 2013 2014E 2015E 2016E Q113 Q213 Q313 Q413 Q114 Q214E Q314E Q414E Q115E Q215E Q315E Q415EBelford Dolphin 96 % 95 % 95 % 80 % 94 % 95 % 95 % 95 % 95 % 95 % 95 % 95 % 95 % 33 % 95 % 95 % 95 %Bideford Dolphin 94 % 95 % 83 % 95 % 95 % 95 % 95 % 95 % 95 % 95 % 45 % 95 % 95 % 95 % 95 % 95 % 95 %Borgland Dolphin 96 % 95 % 80 % 95 % 94 % 95 % 95 % 95 % 95 % 95 % 95 % 95 % 33 % 95 % 95 % 95 % 95 %Borgny Dolphin 95 % 95 % 32 % 0 % 0 % 95 % 95 % 95 % 95 % 95 % 33 % 0 % 0 % 0 % 0 % 0 % 0 %Bredford Dolphin 88 % 95 % 95 % 95 % 94 % 95 % 95 % 95 % 95 % 95 % 95 % 95 % 95 % 95 % 95 % 95 % 95 %Byford Dolphin 96 % 95 % 78 % 95 % 81 % 95 % 95 % 95 % 95 % 25 % 95 % 95 % 95 % 95 % 95 % 95 % 95 %Borgsten Dolphin 62 % 84 % 95 % 95 % 83 % 50 % 95 % 95 % 95 % 95 % 95 % 95 % 95 % 95 % 95 % 95 % 95 %Bolette Dolphin 0 % 0 % 51 % 95 % 95 % 0 % 0 % 0 % 0 % 0 % 20 % 90 % 95 % 95 % 95 % 95 % 95 %Blackford Dolphin 94 % 64 % 47 % 94 % 94 % 94 % 94 % 67 % 0 % 0 % 0 % 94 % 94 % 94 % 94 % 94 % 94 %Borgholm Dolphin 90 % 62 % 66 % 90 % 85 % 25 % 33 % 95 % 95 % 67 % 33 % 75 % 90 % 90 % 90 % 90 % 90 %Bollsta Dolphin 0 % 0 % 0 % 0 % 83 % 0 % 0 % 0 % 0 % 0 % 0 % 0 % 0 % 0 % 0 % 0 % 0 %Total 90 % 87 % 72 % 93 % 90 % 82 % 88 % 92 % 95 % 83 % 67 % 92 % 87 % 87 % 94 % 94 % 94 %
OCEAN RIG – 1Q14 Update
Recommendations:• Equity rating: NEUTRAL–Target price: NOK 100 / USD 17.0• Credit rating: BUY – Bond rating: B
Prepared by Analyst: Ivar Andreas Lemmechen Gjul, Fondsfinans AS, tel: +47 23 11 30 24, e-mail: [email protected]
Well positioned, but limited upside
10-Jul-2014
39
This report was prepared by an analyst engaged by Fondsfinans AS, the Norwegian affiliate of Fondsfinans Inc., who is not registered as a research analyst with FINRA or subject to FINRA rules governing research. See page 71 -74 of this report for Important Disclosure Information.
Estimate summary
RIG
SE
CTO
R –
2Q14
PR
EV
IEW
: OC
EA
N R
IG
40
Estimate changes
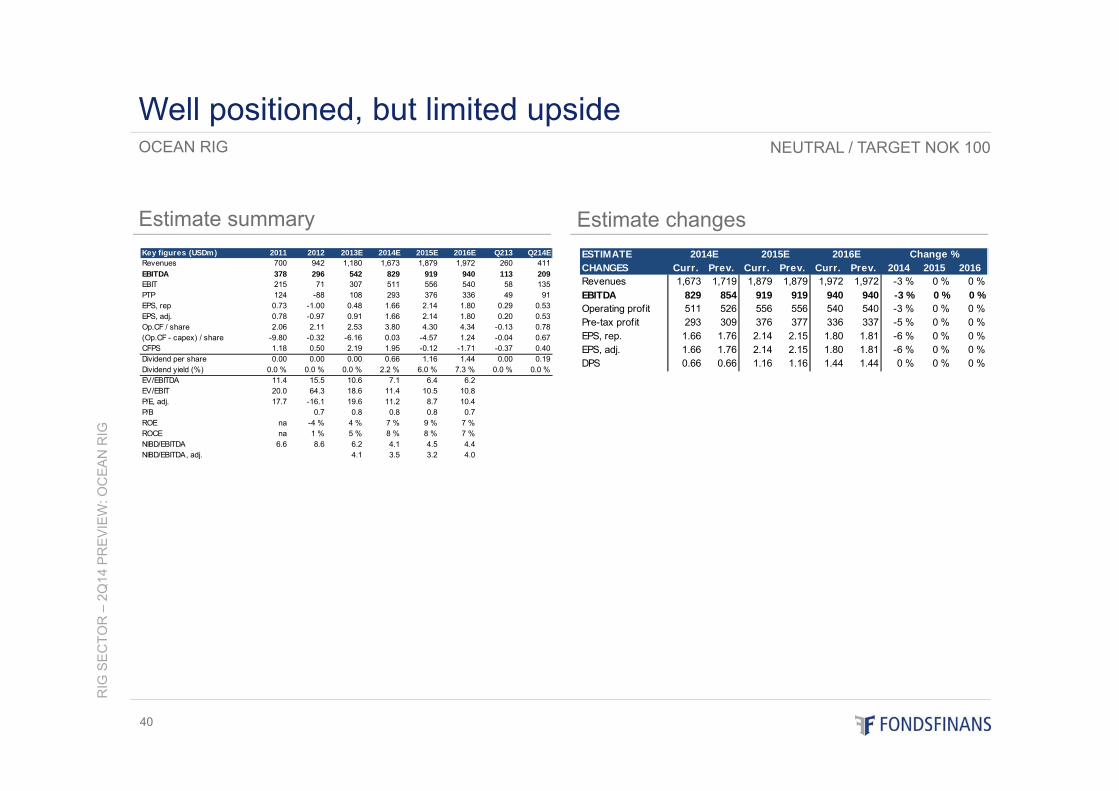
OCEAN RIG
Well positioned, but limited upsideNEUTRAL / TARGET NOK 100
Key figures (USDm) 2011 2012 2013E 2014E 2015E 2016E Q213 Q214ERevenues 700 942 1,180 1,673 1,879 1,972 260 411EBITDA 378 296 542 829 919 940 113 209EBIT 215 71 307 511 556 540 58 135PTP 124 -88 108 293 376 336 49 91EPS, rep 0.73 -1.00 0.48 1.66 2.14 1.80 0.29 0.53EPS, adj. 0.78 -0.97 0.91 1.66 2.14 1.80 0.20 0.53Op.CF / share 2.06 2.11 2.53 3.80 4.30 4.34 -0.13 0.78(Op.CF - capex) / share -9.80 -0.32 -6.16 0.03 -4.57 1.24 -0.04 0.67CFPS 1.18 0.50 2.19 1.95 -0.12 -1.71 -0.37 0.40Dividend per share 0.00 0.00 0.00 0.66 1.16 1.44 0.00 0.19Dividend yield (%) 0.0 % 0.0 % 0.0 % 2.2 % 6.0 % 7.3 % 0.0 % 0.0 %EV/EBITDA 11.4 15.5 10.6 7.1 6.4 6.2EV/EBIT 20.0 64.3 18.6 11.4 10.5 10.8P/E, adj. 17.7 -16.1 19.6 11.2 8.7 10.4P/B 0.7 0.8 0.8 0.8 0.7ROE na -4 % 4 % 7 % 9 % 7 %ROCE na 1 % 5 % 8 % 8 % 7 %NIBD/EBITDA 6.6 8.6 6.2 4.1 4.5 4.4NIBD/EBITDA, adj. 4.1 3.5 3.2 4.0
ESTIMATECHANGES Curr. Prev. Curr. Prev. Curr. Prev. 2014 2015 2016Revenues 1,673 1,719 1,879 1,879 1,972 1,972 -3 % 0 % 0 %EBITDA 829 854 919 919 940 940 -3 % 0 % 0 %Operating profit 511 526 556 556 540 540 -3 % 0 % 0 %Pre-tax profit 293 309 376 377 336 337 -5 % 0 % 0 %EPS, rep. 1.66 1.76 2.14 2.15 1.80 1.81 -6 % 0 % 0 %EPS, adj. 1.66 1.76 2.14 2.15 1.80 1.81 -6 % 0 % 0 %DPS 0.66 0.66 1.16 1.16 1.44 1.44 0 % 0 % 0 %
2014E 2015E 2016E Change %
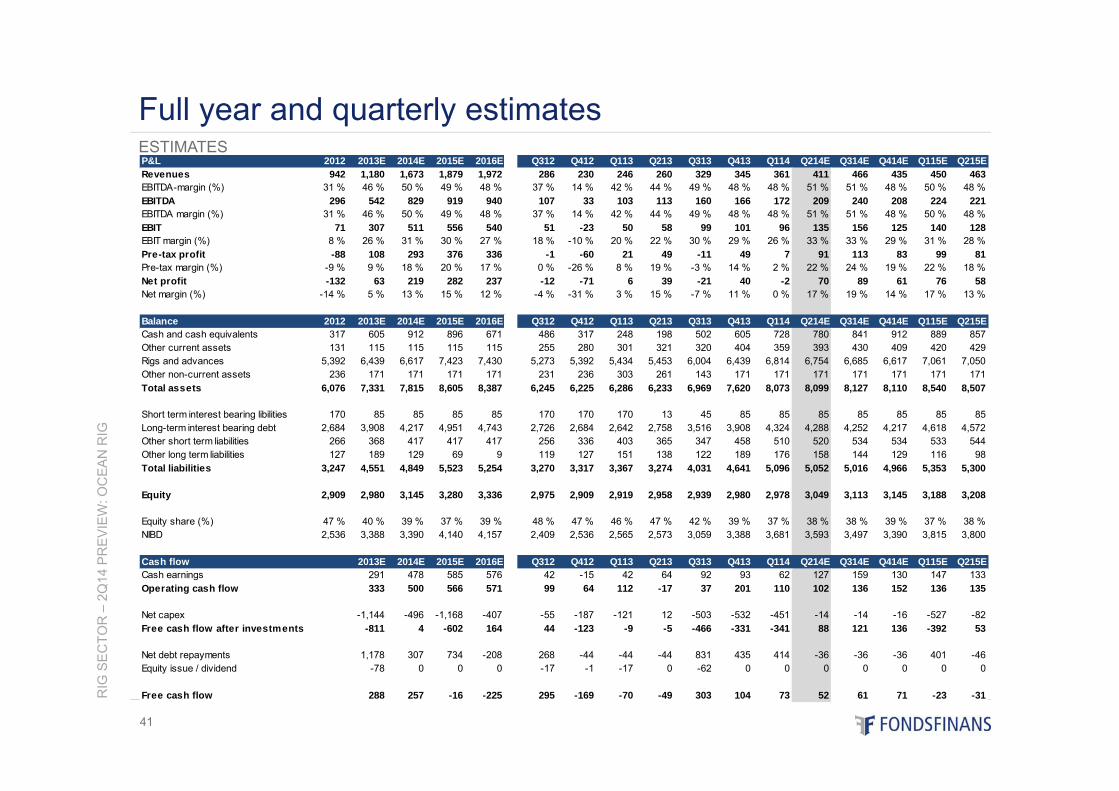
RIG
SE
CTO
R –
2Q14
PR
EV
IEW
: OC
EA
N R
IG
41
ESTIMATES
Full year and quarterly estimatesP&L 2012 2013E 2014E 2015E 2016E Q312 Q412 Q113 Q213 Q313 Q413 Q114 Q214E Q314E Q414E Q115E Q215ERevenues 942 1,180 1,673 1,879 1,972 286 230 246 260 329 345 361 411 466 435 450 463EBITDA-margin (%) 31 % 46 % 50 % 49 % 48 % 37 % 14 % 42 % 44 % 49 % 48 % 48 % 51 % 51 % 48 % 50 % 48 %EBITDA 296 542 829 919 940 107 33 103 113 160 166 172 209 240 208 224 221EBITDA margin (%) 31 % 46 % 50 % 49 % 48 % 37 % 14 % 42 % 44 % 49 % 48 % 48 % 51 % 51 % 48 % 50 % 48 %EBIT 71 307 511 556 540 51 -23 50 58 99 101 96 135 156 125 140 128EBIT margin (%) 8 % 26 % 31 % 30 % 27 % 18 % -10 % 20 % 22 % 30 % 29 % 26 % 33 % 33 % 29 % 31 % 28 %Pre-tax profit -88 108 293 376 336 -1 -60 21 49 -11 49 7 91 113 83 99 81Pre-tax margin (%) -9 % 9 % 18 % 20 % 17 % 0 % -26 % 8 % 19 % -3 % 14 % 2 % 22 % 24 % 19 % 22 % 18 %Net profit -132 63 219 282 237 -12 -71 6 39 -21 40 -2 70 89 61 76 58Net margin (%) -14 % 5 % 13 % 15 % 12 % -4 % -31 % 3 % 15 % -7 % 11 % 0 % 17 % 19 % 14 % 17 % 13 %
Balance 2012 2013E 2014E 2015E 2016E Q312 Q412 Q113 Q213 Q313 Q413 Q114 Q214E Q314E Q414E Q115E Q215ECash and cash equivalents 317 605 912 896 671 486 317 248 198 502 605 728 780 841 912 889 857Other current assets 131 115 115 115 115 255 280 301 321 320 404 359 393 430 409 420 429Rigs and advances 5,392 6,439 6,617 7,423 7,430 5,273 5,392 5,434 5,453 6,004 6,439 6,814 6,754 6,685 6,617 7,061 7,050Other non-current assets 236 171 171 171 171 231 236 303 261 143 171 171 171 171 171 171 171Total assets 6,076 7,331 7,815 8,605 8,387 6,245 6,225 6,286 6,233 6,969 7,620 8,073 8,099 8,127 8,110 8,540 8,507
Short term interest bearing libilities 170 85 85 85 85 170 170 170 13 45 85 85 85 85 85 85 85Long-term interest bearing debt 2,684 3,908 4,217 4,951 4,743 2,726 2,684 2,642 2,758 3,516 3,908 4,324 4,288 4,252 4,217 4,618 4,572Other short term liabilities 266 368 417 417 417 256 336 403 365 347 458 510 520 534 534 533 544Other long term liabilities 127 189 129 69 9 119 127 151 138 122 189 176 158 144 129 116 98Total liabilities 3,247 4,551 4,849 5,523 5,254 3,270 3,317 3,367 3,274 4,031 4,641 5,096 5,052 5,016 4,966 5,353 5,300
Equity 2,909 2,980 3,145 3,280 3,336 2,975 2,909 2,919 2,958 2,939 2,980 2,978 3,049 3,113 3,145 3,188 3,208
Equity share (%) 47 % 40 % 39 % 37 % 39 % 48 % 47 % 46 % 47 % 42 % 39 % 37 % 38 % 38 % 39 % 37 % 38 %NIBD 2,536 3,388 3,390 4,140 4,157 2,409 2,536 2,565 2,573 3,059 3,388 3,681 3,593 3,497 3,390 3,815 3,800
Cash flow 2013E 2014E 2015E 2016E Q312 Q412 Q113 Q213 Q313 Q413 Q114 Q214E Q314E Q414E Q115E Q215ECash earnings 291 478 585 576 42 -15 42 64 92 93 62 127 159 130 147 133Operating cash flow 333 500 566 571 99 64 112 -17 37 201 110 102 136 152 136 135
Net capex -1,144 -496 -1,168 -407 -55 -187 -121 12 -503 -532 -451 -14 -14 -16 -527 -82Free cash flow after investments -811 4 -602 164 44 -123 -9 -5 -466 -331 -341 88 121 136 -392 53
Net debt repayments 1,178 307 734 -208 268 -44 -44 -44 831 435 414 -36 -36 -36 401 -46Equity issue / dividend -78 0 0 0 -17 -1 -17 0 -62 0 0 0 0 0 0 0
Free cash flow 288 257 -16 -225 295 -169 -70 -49 303 104 73 52 61 71 -23 -31
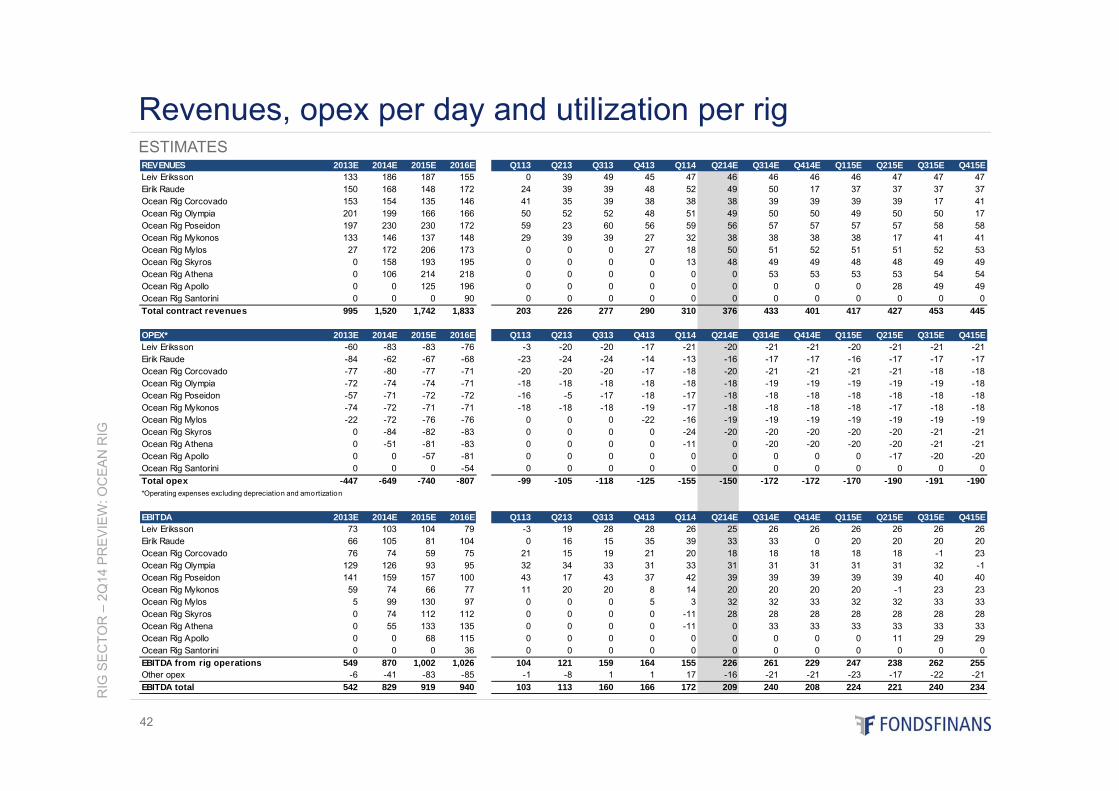
RIG
SE
CTO
R –
2Q14
PR
EV
IEW
: OC
EA
N R
IG
42
ESTIMATES
Revenues, opex per day and utilization per rigREVENUES 2013E 2014E 2015E 2016E Q113 Q213 Q313 Q413 Q114 Q214E Q314E Q414E Q115E Q215E Q315E Q415ELeiv Eriksson 133 186 187 155 0 39 49 45 47 46 46 46 46 47 47 47Eirik Raude 150 168 148 172 24 39 39 48 52 49 50 17 37 37 37 37Ocean Rig Corcovado 153 154 135 146 41 35 39 38 38 38 39 39 39 39 17 41Ocean Rig Olympia 201 199 166 166 50 52 52 48 51 49 50 50 49 50 50 17Ocean Rig Poseidon 197 230 230 172 59 23 60 56 59 56 57 57 57 57 58 58Ocean Rig Mykonos 133 146 137 148 29 39 39 27 32 38 38 38 38 17 41 41Ocean Rig Mylos 27 172 206 173 0 0 0 27 18 50 51 52 51 51 52 53Ocean Rig Skyros 0 158 193 195 0 0 0 0 13 48 49 49 48 48 49 49Ocean Rig Athena 0 106 214 218 0 0 0 0 0 0 53 53 53 53 54 54Ocean Rig Apollo 0 0 125 196 0 0 0 0 0 0 0 0 0 28 49 49Ocean Rig Santorini 0 0 0 90 0 0 0 0 0 0 0 0 0 0 0 0Total contract revenues 995 1,520 1,742 1,833 203 226 277 290 310 376 433 401 417 427 453 445
OPEX* 2013E 2014E 2015E 2016E Q113 Q213 Q313 Q413 Q114 Q214E Q314E Q414E Q115E Q215E Q315E Q415ELeiv Eriksson -60 -83 -83 -76 -3 -20 -20 -17 -21 -20 -21 -21 -20 -21 -21 -21Eirik Raude -84 -62 -67 -68 -23 -24 -24 -14 -13 -16 -17 -17 -16 -17 -17 -17Ocean Rig Corcovado -77 -80 -77 -71 -20 -20 -20 -17 -18 -20 -21 -21 -21 -21 -18 -18Ocean Rig Olympia -72 -74 -74 -71 -18 -18 -18 -18 -18 -18 -19 -19 -19 -19 -19 -18Ocean Rig Poseidon -57 -71 -72 -72 -16 -5 -17 -18 -17 -18 -18 -18 -18 -18 -18 -18Ocean Rig Mykonos -74 -72 -71 -71 -18 -18 -18 -19 -17 -18 -18 -18 -18 -17 -18 -18Ocean Rig Mylos -22 -72 -76 -76 0 0 0 -22 -16 -19 -19 -19 -19 -19 -19 -19Ocean Rig Skyros 0 -84 -82 -83 0 0 0 0 -24 -20 -20 -20 -20 -20 -21 -21Ocean Rig Athena 0 -51 -81 -83 0 0 0 0 -11 0 -20 -20 -20 -20 -21 -21Ocean Rig Apollo 0 0 -57 -81 0 0 0 0 0 0 0 0 0 -17 -20 -20Ocean Rig Santorini 0 0 0 -54 0 0 0 0 0 0 0 0 0 0 0 0Total opex -447 -649 -740 -807 -99 -105 -118 -125 -155 -150 -172 -172 -170 -190 -191 -190*Operating expenses excluding depreciation and amortization
EBITDA 2013E 2014E 2015E 2016E Q113 Q213 Q313 Q413 Q114 Q214E Q314E Q414E Q115E Q215E Q315E Q415ELeiv Eriksson 73 103 104 79 -3 19 28 28 26 25 26 26 26 26 26 26Eirik Raude 66 105 81 104 0 16 15 35 39 33 33 0 20 20 20 20Ocean Rig Corcovado 76 74 59 75 21 15 19 21 20 18 18 18 18 18 -1 23Ocean Rig Olympia 129 126 93 95 32 34 33 31 33 31 31 31 31 31 32 -1Ocean Rig Poseidon 141 159 157 100 43 17 43 37 42 39 39 39 39 39 40 40Ocean Rig Mykonos 59 74 66 77 11 20 20 8 14 20 20 20 20 -1 23 23Ocean Rig Mylos 5 99 130 97 0 0 0 5 3 32 32 33 32 32 33 33Ocean Rig Skyros 0 74 112 112 0 0 0 0 -11 28 28 28 28 28 28 28Ocean Rig Athena 0 55 133 135 0 0 0 0 -11 0 33 33 33 33 33 33Ocean Rig Apollo 0 0 68 115 0 0 0 0 0 0 0 0 0 11 29 29Ocean Rig Santorini 0 0 0 36 0 0 0 0 0 0 0 0 0 0 0 0EBITDA from rig operations 549 870 1,002 1,026 104 121 159 164 155 226 261 229 247 238 262 255Other opex -6 -41 -83 -85 -1 -8 1 1 17 -16 -21 -21 -23 -17 -22 -21EBITDA total 542 829 919 940 103 113 160 166 172 209 240 208 224 221 240 234
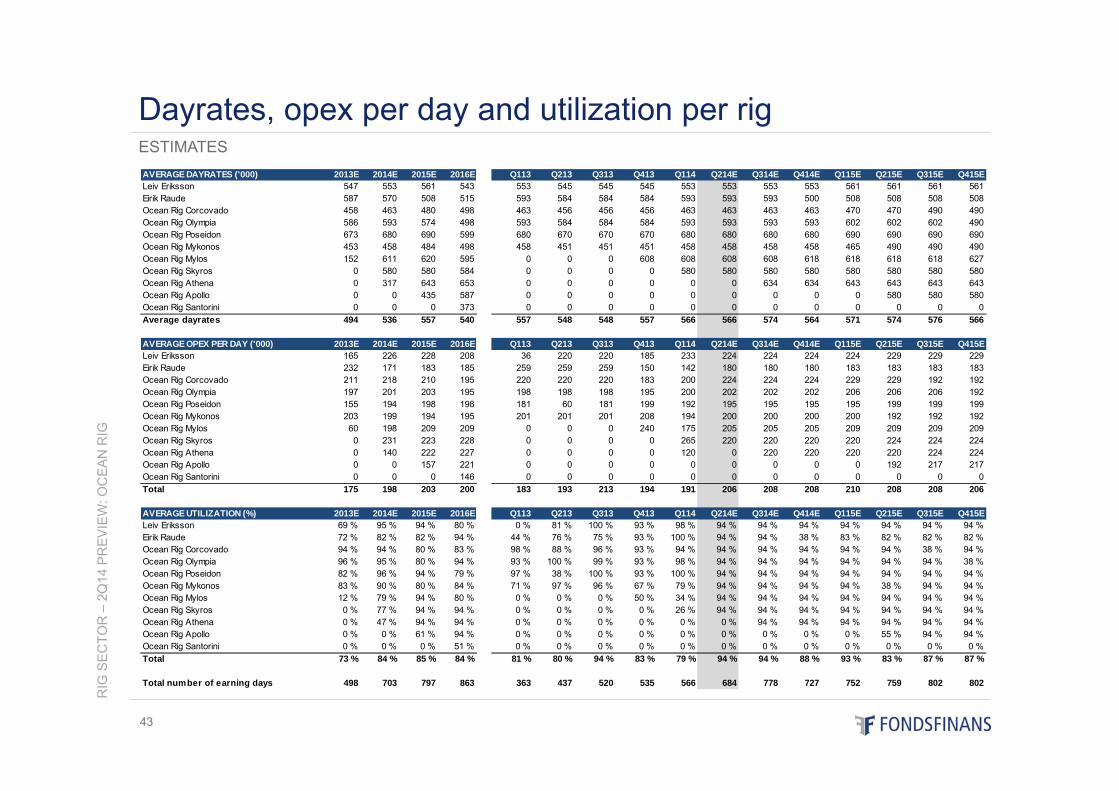
RIG
SE
CTO
R –
2Q14
PR
EV
IEW
: OC
EA
N R
IG
43
ESTIMATES
Dayrates, opex per day and utilization per rig
AVERAGE DAYRATES ('000) 2013E 2014E 2015E 2016E Q113 Q213 Q313 Q413 Q114 Q214E Q314E Q414E Q115E Q215E Q315E Q415ELeiv Eriksson 547 553 561 543 553 545 545 545 553 553 553 553 561 561 561 561Eirik Raude 587 570 508 515 593 584 584 584 593 593 593 500 508 508 508 508Ocean Rig Corcovado 458 463 480 498 463 456 456 456 463 463 463 463 470 470 490 490Ocean Rig Olympia 586 593 574 498 593 584 584 584 593 593 593 593 602 602 602 490Ocean Rig Poseidon 673 680 690 599 680 670 670 670 680 680 680 680 690 690 690 690Ocean Rig Mykonos 453 458 484 498 458 451 451 451 458 458 458 458 465 490 490 490Ocean Rig Mylos 152 611 620 595 0 0 0 608 608 608 608 618 618 618 618 627Ocean Rig Skyros 0 580 580 584 0 0 0 0 580 580 580 580 580 580 580 580Ocean Rig Athena 0 317 643 653 0 0 0 0 0 0 634 634 643 643 643 643Ocean Rig Apollo 0 0 435 587 0 0 0 0 0 0 0 0 0 580 580 580Ocean Rig Santorini 0 0 0 373 0 0 0 0 0 0 0 0 0 0 0 0Average dayrates 494 536 557 540 557 548 548 557 566 566 574 564 571 574 576 566
AVERAGE OPEX PER DAY ('000) 2013E 2014E 2015E 2016E Q113 Q213 Q313 Q413 Q114 Q214E Q314E Q414E Q115E Q215E Q315E Q415ELeiv Eriksson 165 226 228 208 36 220 220 185 233 224 224 224 224 229 229 229Eirik Raude 232 171 183 185 259 259 259 150 142 180 180 180 183 183 183 183Ocean Rig Corcovado 211 218 210 195 220 220 220 183 200 224 224 224 229 229 192 192Ocean Rig Olympia 197 201 203 195 198 198 198 195 200 202 202 202 206 206 206 192Ocean Rig Poseidon 155 194 198 198 181 60 181 199 192 195 195 195 195 199 199 199Ocean Rig Mykonos 203 199 194 195 201 201 201 208 194 200 200 200 200 192 192 192Ocean Rig Mylos 60 198 209 209 0 0 0 240 175 205 205 205 209 209 209 209Ocean Rig Skyros 0 231 223 228 0 0 0 0 265 220 220 220 220 224 224 224Ocean Rig Athena 0 140 222 227 0 0 0 0 120 0 220 220 220 220 224 224Ocean Rig Apollo 0 0 157 221 0 0 0 0 0 0 0 0 0 192 217 217Ocean Rig Santorini 0 0 0 146 0 0 0 0 0 0 0 0 0 0 0 0Total 175 198 203 200 183 193 213 194 191 206 208 208 210 208 208 206
AVERAGE UTILIZATION (%) 2013E 2014E 2015E 2016E Q113 Q213 Q313 Q413 Q114 Q214E Q314E Q414E Q115E Q215E Q315E Q415ELeiv Eriksson 69 % 95 % 94 % 80 % 0 % 81 % 100 % 93 % 98 % 94 % 94 % 94 % 94 % 94 % 94 % 94 %Eirik Raude 72 % 82 % 82 % 94 % 44 % 76 % 75 % 93 % 100 % 94 % 94 % 38 % 83 % 82 % 82 % 82 %Ocean Rig Corcovado 94 % 94 % 80 % 83 % 98 % 88 % 96 % 93 % 94 % 94 % 94 % 94 % 94 % 94 % 38 % 94 %Ocean Rig Olympia 96 % 95 % 80 % 94 % 93 % 100 % 99 % 93 % 98 % 94 % 94 % 94 % 94 % 94 % 94 % 38 %Ocean Rig Poseidon 82 % 96 % 94 % 79 % 97 % 38 % 100 % 93 % 100 % 94 % 94 % 94 % 94 % 94 % 94 % 94 %Ocean Rig Mykonos 83 % 90 % 80 % 84 % 71 % 97 % 96 % 67 % 79 % 94 % 94 % 94 % 94 % 38 % 94 % 94 %Ocean Rig Mylos 12 % 79 % 94 % 80 % 0 % 0 % 0 % 50 % 34 % 94 % 94 % 94 % 94 % 94 % 94 % 94 %Ocean Rig Skyros 0 % 77 % 94 % 94 % 0 % 0 % 0 % 0 % 26 % 94 % 94 % 94 % 94 % 94 % 94 % 94 %Ocean Rig Athena 0 % 47 % 94 % 94 % 0 % 0 % 0 % 0 % 0 % 0 % 94 % 94 % 94 % 94 % 94 % 94 %Ocean Rig Apollo 0 % 0 % 61 % 94 % 0 % 0 % 0 % 0 % 0 % 0 % 0 % 0 % 0 % 55 % 94 % 94 %Ocean Rig Santorini 0 % 0 % 0 % 51 % 0 % 0 % 0 % 0 % 0 % 0 % 0 % 0 % 0 % 0 % 0 % 0 %Total 73 % 84 % 85 % 84 % 81 % 80 % 94 % 83 % 79 % 94 % 94 % 88 % 93 % 83 % 87 % 87 %
Total number of earning days 498 703 797 863 363 437 520 535 566 684 778 727 752 759 802 802
ODFJELL DRILLING – 1Q14 UPDATE
Prepared by Analyst: Ivar Andreas Lemmechen Gjul, Fondsfinans AS, tel: +47 23 11 30 24, e-mail: [email protected]
44
This report was prepared by an analyst engaged by Fondsfinans AS, the Norwegian affiliate of Fondsfinans Inc., who is not registered as a research analyst with FINRA or subject to FINRA rules governing research. See page 71 -74 of this report for Important Disclosure Information.
Cold winds from the North Sea, but still attractive
Recommendation: BUY – Target: NOK 48 (50)
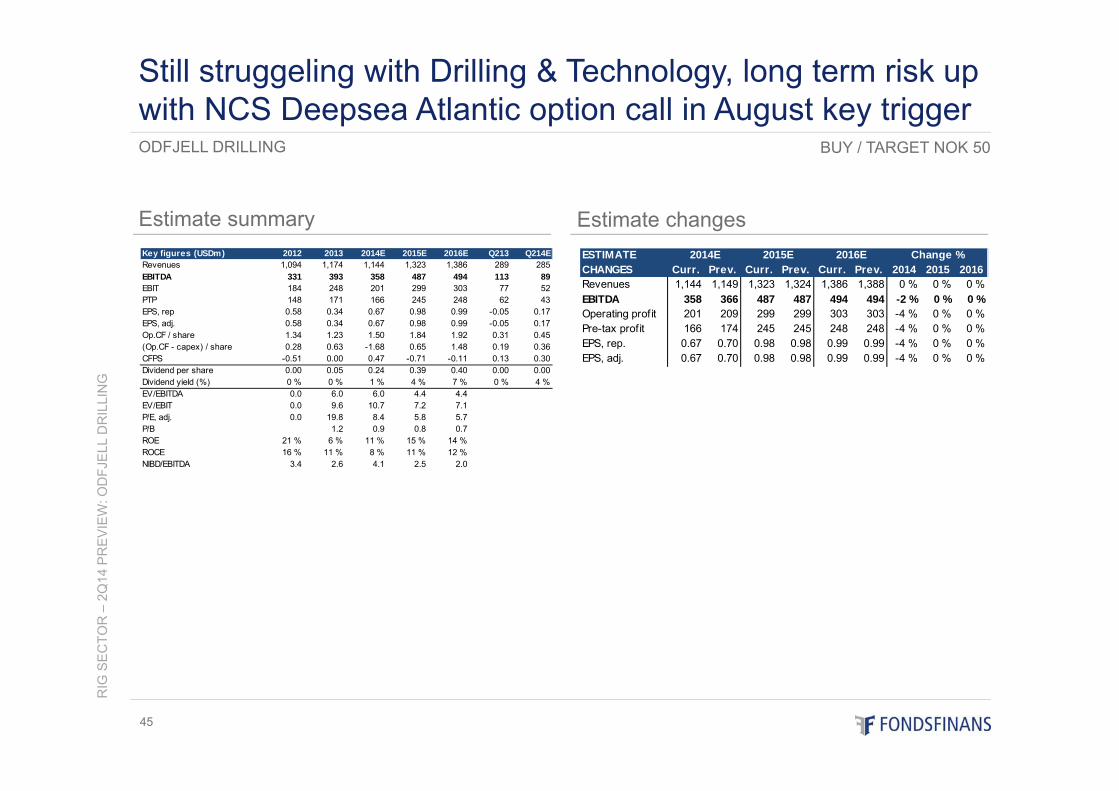
Estimate summary
RIG
SE
CTO
R –
2Q14
PR
EV
IEW
: OD
FJE
LL D
RIL
LIN
G
45
Estimate changes
ODFJELL DRILLING
Still struggeling with Drilling & Technology, long term risk up with NCS Deepsea Atlantic option call in August key trigger
BUY / TARGET NOK 50
Key figures (USDm) 2012 2013 2014E 2015E 2016E Q213 Q214ERevenues 1,094 1,174 1,144 1,323 1,386 289 285EBITDA 331 393 358 487 494 113 89EBIT 184 248 201 299 303 77 52PTP 148 171 166 245 248 62 43EPS, rep 0.58 0.34 0.67 0.98 0.99 -0.05 0.17EPS, adj. 0.58 0.34 0.67 0.98 0.99 -0.05 0.17Op.CF / share 1.34 1.23 1.50 1.84 1.92 0.31 0.45(Op.CF - capex) / share 0.28 0.63 -1.68 0.65 1.48 0.19 0.36CFPS -0.51 0.00 0.47 -0.71 -0.11 0.13 0.30Dividend per share 0.00 0.05 0.24 0.39 0.40 0.00 0.00Dividend yield (%) 0 % 0 % 1 % 4 % 7 % 0 % 4 %EV/EBITDA 0.0 6.0 6.0 4.4 4.4EV/EBIT 0.0 9.6 10.7 7.2 7.1P/E, adj. 0.0 19.8 8.4 5.8 5.7P/B 1.2 0.9 0.8 0.7ROE 21 % 6 % 11 % 15 % 14 %ROCE 16 % 11 % 8 % 11 % 12 %NIBD/EBITDA 3.4 2.6 4.1 2.5 2.0
ESTIMATECHANGES Curr. Prev. Curr. Prev. Curr. Prev. 2014 2015 2016Revenues 1,144 1,149 1,323 1,324 1,386 1,388 0 % 0 % 0 %EBITDA 358 366 487 487 494 494 -2 % 0 % 0 %Operating profit 201 209 299 299 303 303 -4 % 0 % 0 %Pre-tax profit 166 174 245 245 248 248 -4 % 0 % 0 %EPS, rep. 0.67 0.70 0.98 0.98 0.99 0.99 -4 % 0 % 0 %EPS, adj. 0.67 0.70 0.98 0.98 0.99 0.99 -4 % 0 % 0 %
2014E 2015E 2016E Change %
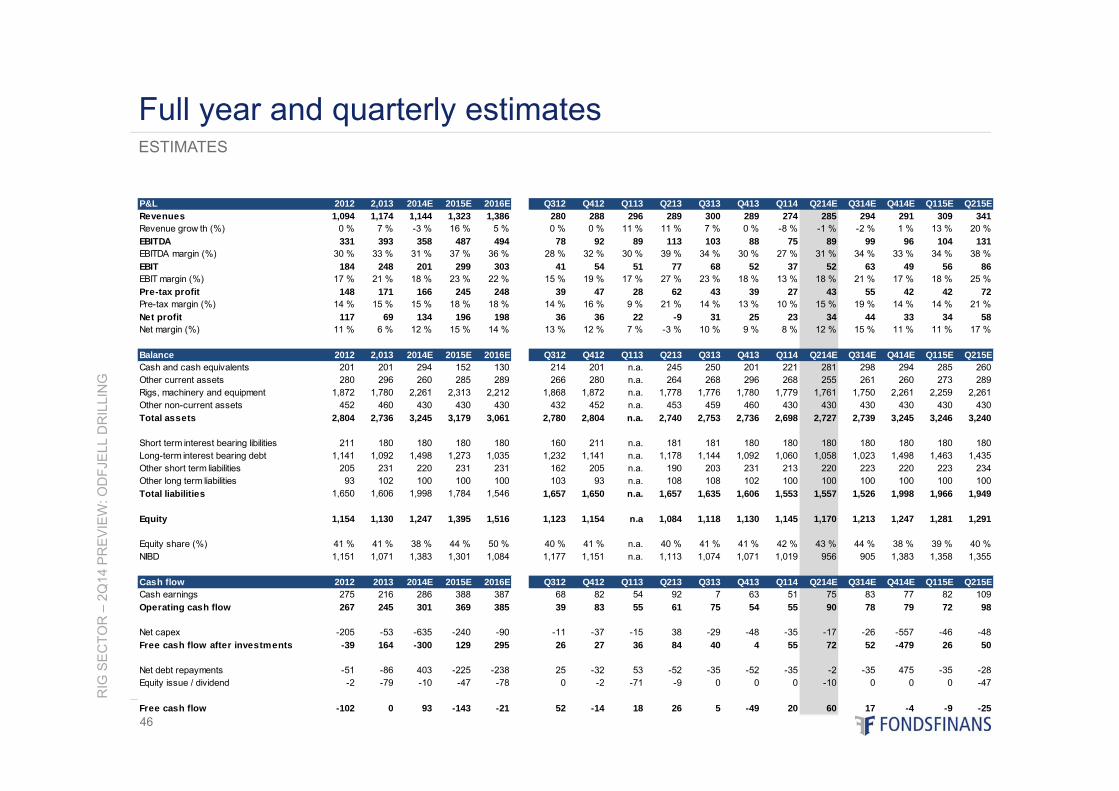
RIG
SE
CTO
R –
2Q14
PR
EV
IEW
: OD
FJE
LL D
RIL
LIN
G
46
ESTIMATES
Full year and quarterly estimates
Source: Fondsfinans Research / ODL
P&L 2012 2,013 2014E 2015E 2016E Q312 Q412 Q113 Q213 Q313 Q413 Q114 Q214E Q314E Q414E Q115E Q215ERevenues 1,094 1,174 1,144 1,323 1,386 280 288 296 289 300 289 274 285 294 291 309 341Revenue grow th (%) 0 % 7 % -3 % 16 % 5 % 0 % 0 % 11 % 11 % 7 % 0 % -8 % -1 % -2 % 1 % 13 % 20 %EBITDA 331 393 358 487 494 78 92 89 113 103 88 75 89 99 96 104 131EBITDA margin (%) 30 % 33 % 31 % 37 % 36 % 28 % 32 % 30 % 39 % 34 % 30 % 27 % 31 % 34 % 33 % 34 % 38 %EBIT 184 248 201 299 303 41 54 51 77 68 52 37 52 63 49 56 86EBIT margin (%) 17 % 21 % 18 % 23 % 22 % 15 % 19 % 17 % 27 % 23 % 18 % 13 % 18 % 21 % 17 % 18 % 25 %Pre-tax profit 148 171 166 245 248 39 47 28 62 43 39 27 43 55 42 42 72Pre-tax margin (%) 14 % 15 % 15 % 18 % 18 % 14 % 16 % 9 % 21 % 14 % 13 % 10 % 15 % 19 % 14 % 14 % 21 %Net profit 117 69 134 196 198 36 36 22 -9 31 25 23 34 44 33 34 58Net margin (%) 11 % 6 % 12 % 15 % 14 % 13 % 12 % 7 % -3 % 10 % 9 % 8 % 12 % 15 % 11 % 11 % 17 %
Balance 2012 2,013 2014E 2015E 2016E Q312 Q412 Q113 Q213 Q313 Q413 Q114 Q214E Q314E Q414E Q115E Q215ECash and cash equivalents 201 201 294 152 130 214 201 n.a. 245 250 201 221 281 298 294 285 260Other current assets 280 296 260 285 289 266 280 n.a. 264 268 296 268 255 261 260 273 289Rigs, machinery and equipment 1,872 1,780 2,261 2,313 2,212 1,868 1,872 n.a. 1,778 1,776 1,780 1,779 1,761 1,750 2,261 2,259 2,261Other non-current assets 452 460 430 430 430 432 452 n.a. 453 459 460 430 430 430 430 430 430Total assets 2,804 2,736 3,245 3,179 3,061 2,780 2,804 n.a. 2,740 2,753 2,736 2,698 2,727 2,739 3,245 3,246 3,240
Short term interest bearing libilities 211 180 180 180 180 160 211 n.a. 181 181 180 180 180 180 180 180 180Long-term interest bearing debt 1,141 1,092 1,498 1,273 1,035 1,232 1,141 n.a. 1,178 1,144 1,092 1,060 1,058 1,023 1,498 1,463 1,435Other short term liabilities 205 231 220 231 231 162 205 n.a. 190 203 231 213 220 223 220 223 234Other long term liabilities 93 102 100 100 100 103 93 n.a. 108 108 102 100 100 100 100 100 100Total liabilities 1,650 1,606 1,998 1,784 1,546 1,657 1,650 n.a. 1,657 1,635 1,606 1,553 1,557 1,526 1,998 1,966 1,949
Equity 1,154 1,130 1,247 1,395 1,516 1,123 1,154 n.a 1,084 1,118 1,130 1,145 1,170 1,213 1,247 1,281 1,291
Equity share (%) 41 % 41 % 38 % 44 % 50 % 40 % 41 % n.a. 40 % 41 % 41 % 42 % 43 % 44 % 38 % 39 % 40 %NIBD 1,151 1,071 1,383 1,301 1,084 1,177 1,151 n.a. 1,113 1,074 1,071 1,019 956 905 1,383 1,358 1,355
Cash flow 2012 2013 2014E 2015E 2016E Q312 Q412 Q113 Q213 Q313 Q413 Q114 Q214E Q314E Q414E Q115E Q215ECash earnings 275 216 286 388 387 68 82 54 92 7 63 51 75 83 77 82 109Operating cash flow 267 245 301 369 385 39 83 55 61 75 54 55 90 78 79 72 98
Net capex -205 -53 -635 -240 -90 -11 -37 -15 38 -29 -48 -35 -17 -26 -557 -46 -48Free cash flow after investments -39 164 -300 129 295 26 27 36 84 40 4 55 72 52 -479 26 50
Net debt repayments -51 -86 403 -225 -238 25 -32 53 -52 -35 -52 -35 -2 -35 475 -35 -28Equity issue / dividend -2 -79 -10 -47 -78 0 -2 -71 -9 0 0 0 -10 0 0 0 -47
Free cash flow -102 0 93 -143 -21 52 -14 18 26 5 -49 20 60 17 -4 -9 -25
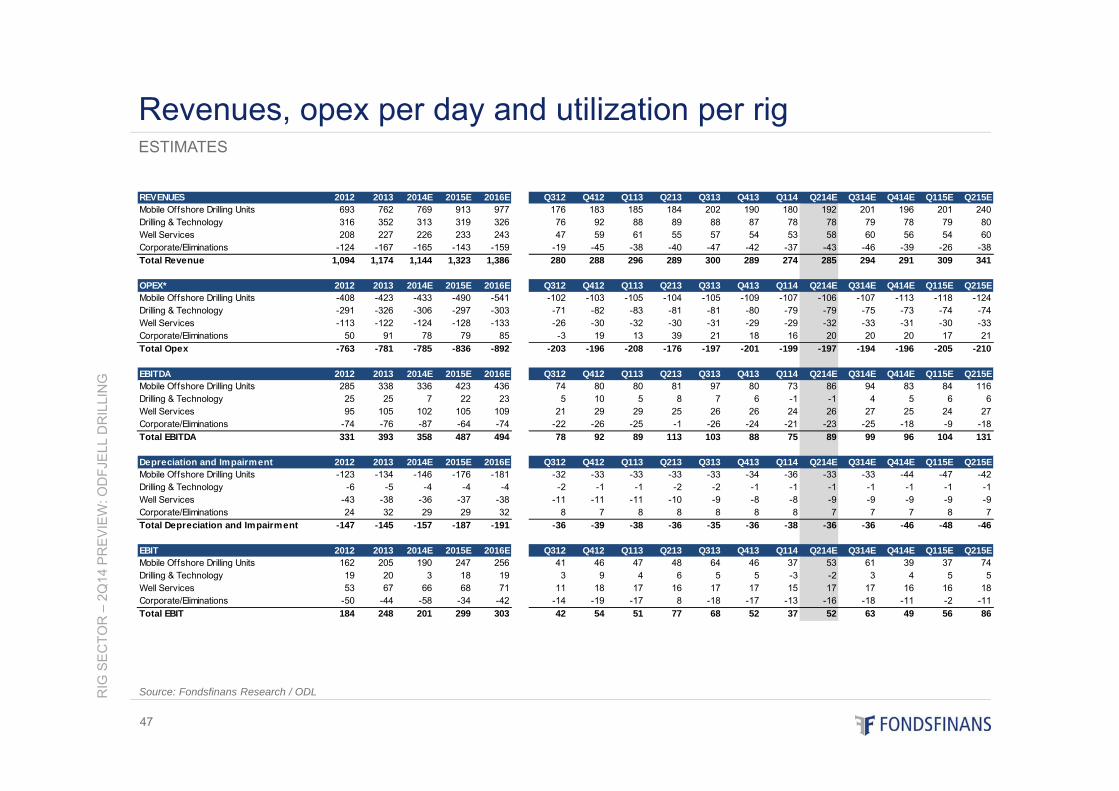
RIG
SE
CTO
R –
2Q14
PR
EV
IEW
: OD
FJE
LL D
RIL
LIN
G
47
ESTIMATES
Revenues, opex per day and utilization per rig
Source: Fondsfinans Research / ODL
REVENUES 2012 2013 2014E 2015E 2016E Q312 Q412 Q113 Q213 Q313 Q413 Q114 Q214E Q314E Q414E Q115E Q215EMobile Offshore Drilling Units 693 762 769 913 977 176 183 185 184 202 190 180 192 201 196 201 240Drilling & Technology 316 352 313 319 326 76 92 88 89 88 87 78 78 79 78 79 80Well Services 208 227 226 233 243 47 59 61 55 57 54 53 58 60 56 54 60Corporate/Eliminations -124 -167 -165 -143 -159 -19 -45 -38 -40 -47 -42 -37 -43 -46 -39 -26 -38Total Revenue 1,094 1,174 1,144 1,323 1,386 280 288 296 289 300 289 274 285 294 291 309 341
OPEX* 2012 2013 2014E 2015E 2016E Q312 Q412 Q113 Q213 Q313 Q413 Q114 Q214E Q314E Q414E Q115E Q215EMobile Offshore Drilling Units -408 -423 -433 -490 -541 -102 -103 -105 -104 -105 -109 -107 -106 -107 -113 -118 -124Drilling & Technology -291 -326 -306 -297 -303 -71 -82 -83 -81 -81 -80 -79 -79 -75 -73 -74 -74Well Services -113 -122 -124 -128 -133 -26 -30 -32 -30 -31 -29 -29 -32 -33 -31 -30 -33Corporate/Eliminations 50 91 78 79 85 -3 19 13 39 21 18 16 20 20 20 17 21Total Opex -763 -781 -785 -836 -892 -203 -196 -208 -176 -197 -201 -199 -197 -194 -196 -205 -210
EBITDA 2012 2013 2014E 2015E 2016E Q312 Q412 Q113 Q213 Q313 Q413 Q114 Q214E Q314E Q414E Q115E Q215EMobile Offshore Drilling Units 285 338 336 423 436 74 80 80 81 97 80 73 86 94 83 84 116Drilling & Technology 25 25 7 22 23 5 10 5 8 7 6 -1 -1 4 5 6 6Well Services 95 105 102 105 109 21 29 29 25 26 26 24 26 27 25 24 27Corporate/Eliminations -74 -76 -87 -64 -74 -22 -26 -25 -1 -26 -24 -21 -23 -25 -18 -9 -18Total EBITDA 331 393 358 487 494 78 92 89 113 103 88 75 89 99 96 104 131
Depreciation and Impairment 2012 2013 2014E 2015E 2016E Q312 Q412 Q113 Q213 Q313 Q413 Q114 Q214E Q314E Q414E Q115E Q215EMobile Offshore Drilling Units -123 -134 -146 -176 -181 -32 -33 -33 -33 -33 -34 -36 -33 -33 -44 -47 -42Drilling & Technology -6 -5 -4 -4 -4 -2 -1 -1 -2 -2 -1 -1 -1 -1 -1 -1 -1Well Services -43 -38 -36 -37 -38 -11 -11 -11 -10 -9 -8 -8 -9 -9 -9 -9 -9Corporate/Eliminations 24 32 29 29 32 8 7 8 8 8 8 8 7 7 7 8 7Total Depreciation and Impairment -147 -145 -157 -187 -191 -36 -39 -38 -36 -35 -36 -38 -36 -36 -46 -48 -46
EBIT 2012 2013 2014E 2015E 2016E Q312 Q412 Q113 Q213 Q313 Q413 Q114 Q214E Q314E Q414E Q115E Q215EMobile Offshore Drilling Units 162 205 190 247 256 41 46 47 48 64 46 37 53 61 39 37 74Drilling & Technology 19 20 3 18 19 3 9 4 6 5 5 -3 -2 3 4 5 5Well Services 53 67 66 68 71 11 18 17 16 17 17 15 17 17 16 16 18Corporate/Eliminations -50 -44 -58 -34 -42 -14 -19 -17 8 -18 -17 -13 -16 -18 -11 -2 -11Total EBIT 184 248 201 299 303 42 54 51 77 68 52 37 52 63 49 56 86
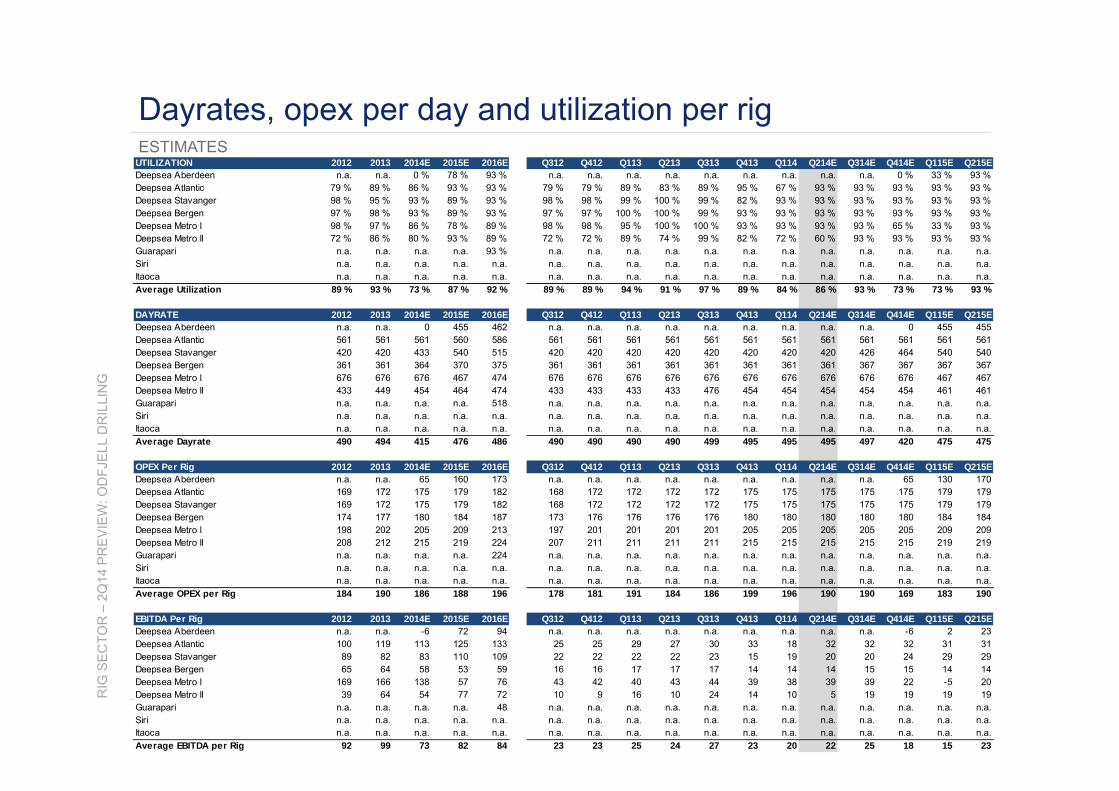
RIG
SE
CTO
R –
2Q14
PR
EV
IEW
: OD
FJE
LL D
RIL
LIN
G
48
ESTIMATES
Dayrates, opex per day and utilization per rigUTILIZATION 2012 2013 2014E 2015E 2016E Q312 Q412 Q113 Q213 Q313 Q413 Q114 Q214E Q314E Q414E Q115E Q215EDeepsea Aberdeen n.a. n.a. 0 % 78 % 93 % n.a. n.a. n.a. n.a. n.a. n.a. n.a. n.a. n.a. 0 % 33 % 93 %Deepsea Atlantic 79 % 89 % 86 % 93 % 93 % 79 % 79 % 89 % 83 % 89 % 95 % 67 % 93 % 93 % 93 % 93 % 93 %Deepsea Stavanger 98 % 95 % 93 % 89 % 93 % 98 % 98 % 99 % 100 % 99 % 82 % 93 % 93 % 93 % 93 % 93 % 93 %Deepsea Bergen 97 % 98 % 93 % 89 % 93 % 97 % 97 % 100 % 100 % 99 % 93 % 93 % 93 % 93 % 93 % 93 % 93 %Deepsea Metro I 98 % 97 % 86 % 78 % 89 % 98 % 98 % 95 % 100 % 100 % 93 % 93 % 93 % 93 % 65 % 33 % 93 %Deepsea Metro II 72 % 86 % 80 % 93 % 89 % 72 % 72 % 89 % 74 % 99 % 82 % 72 % 60 % 93 % 93 % 93 % 93 %Guarapari n.a. n.a. n.a. n.a. 93 % n.a. n.a. n.a. n.a. n.a. n.a. n.a. n.a. n.a. n.a. n.a. n.a.Siri n.a. n.a. n.a. n.a. n.a. n.a. n.a. n.a. n.a. n.a. n.a. n.a. n.a. n.a. n.a. n.a. n.a.Itaoca n.a. n.a. n.a. n.a. n.a. n.a. n.a. n.a. n.a. n.a. n.a. n.a. n.a. n.a. n.a. n.a. n.a.Average Utilization 89 % 93 % 73 % 87 % 92 % 89 % 89 % 94 % 91 % 97 % 89 % 84 % 86 % 93 % 73 % 73 % 93 %
DAYRATE 2012 2013 2014E 2015E 2016E Q312 Q412 Q113 Q213 Q313 Q413 Q114 Q214E Q314E Q414E Q115E Q215EDeepsea Aberdeen n.a. n.a. 0 455 462 n.a. n.a. n.a. n.a. n.a. n.a. n.a. n.a. n.a. 0 455 455Deepsea Atlantic 561 561 561 560 586 561 561 561 561 561 561 561 561 561 561 561 561Deepsea Stavanger 420 420 433 540 515 420 420 420 420 420 420 420 420 426 464 540 540Deepsea Bergen 361 361 364 370 375 361 361 361 361 361 361 361 361 367 367 367 367Deepsea Metro I 676 676 676 467 474 676 676 676 676 676 676 676 676 676 676 467 467Deepsea Metro II 433 449 454 464 474 433 433 433 433 476 454 454 454 454 454 461 461Guarapari n.a. n.a. n.a. n.a. 518 n.a. n.a. n.a. n.a. n.a. n.a. n.a. n.a. n.a. n.a. n.a. n.a.Siri n.a. n.a. n.a. n.a. n.a. n.a. n.a. n.a. n.a. n.a. n.a. n.a. n.a. n.a. n.a. n.a. n.a.Itaoca n.a. n.a. n.a. n.a. n.a. n.a. n.a. n.a. n.a. n.a. n.a. n.a. n.a. n.a. n.a. n.a. n.a.Average Dayrate 490 494 415 476 486 490 490 490 490 499 495 495 495 497 420 475 475
OPEX Per Rig 2012 2013 2014E 2015E 2016E Q312 Q412 Q113 Q213 Q313 Q413 Q114 Q214E Q314E Q414E Q115E Q215EDeepsea Aberdeen n.a. n.a. 65 160 173 n.a. n.a. n.a. n.a. n.a. n.a. n.a. n.a. n.a. 65 130 170Deepsea Atlantic 169 172 175 179 182 168 172 172 172 172 175 175 175 175 175 179 179Deepsea Stavanger 169 172 175 179 182 168 172 172 172 172 175 175 175 175 175 179 179Deepsea Bergen 174 177 180 184 187 173 176 176 176 176 180 180 180 180 180 184 184Deepsea Metro I 198 202 205 209 213 197 201 201 201 201 205 205 205 205 205 209 209Deepsea Metro II 208 212 215 219 224 207 211 211 211 211 215 215 215 215 215 219 219Guarapari n.a. n.a. n.a. n.a. 224 n.a. n.a. n.a. n.a. n.a. n.a. n.a. n.a. n.a. n.a. n.a. n.a.Siri n.a. n.a. n.a. n.a. n.a. n.a. n.a. n.a. n.a. n.a. n.a. n.a. n.a. n.a. n.a. n.a. n.a.Itaoca n.a. n.a. n.a. n.a. n.a. n.a. n.a. n.a. n.a. n.a. n.a. n.a. n.a. n.a. n.a. n.a. n.a.Average OPEX per Rig 184 190 186 188 196 178 181 191 184 186 199 196 190 190 169 183 190
EBITDA Per Rig 2012 2013 2014E 2015E 2016E Q312 Q412 Q113 Q213 Q313 Q413 Q114 Q214E Q314E Q414E Q115E Q215EDeepsea Aberdeen n.a. n.a. -6 72 94 n.a. n.a. n.a. n.a. n.a. n.a. n.a. n.a. n.a. -6 2 23Deepsea Atlantic 100 119 113 125 133 25 25 29 27 30 33 18 32 32 32 31 31Deepsea Stavanger 89 82 83 110 109 22 22 22 22 23 15 19 20 20 24 29 29Deepsea Bergen 65 64 58 53 59 16 16 17 17 17 14 14 14 15 15 14 14Deepsea Metro I 169 166 138 57 76 43 42 40 43 44 39 38 39 39 22 -5 20Deepsea Metro II 39 64 54 77 72 10 9 16 10 24 14 10 5 19 19 19 19Guarapari n.a. n.a. n.a. n.a. 48 n.a. n.a. n.a. n.a. n.a. n.a. n.a. n.a. n.a. n.a. n.a. n.a.Siri n.a. n.a. n.a. n.a. n.a. n.a. n.a. n.a. n.a. n.a. n.a. n.a. n.a. n.a. n.a. n.a. n.a.Itaoca n.a. n.a. n.a. n.a. n.a. n.a. n.a. n.a. n.a. n.a. n.a. n.a. n.a. n.a. n.a. n.a. n.a.Average EBITDA per Rig 92 99 73 82 84 23 23 25 24 27 23 20 22 25 18 15 23
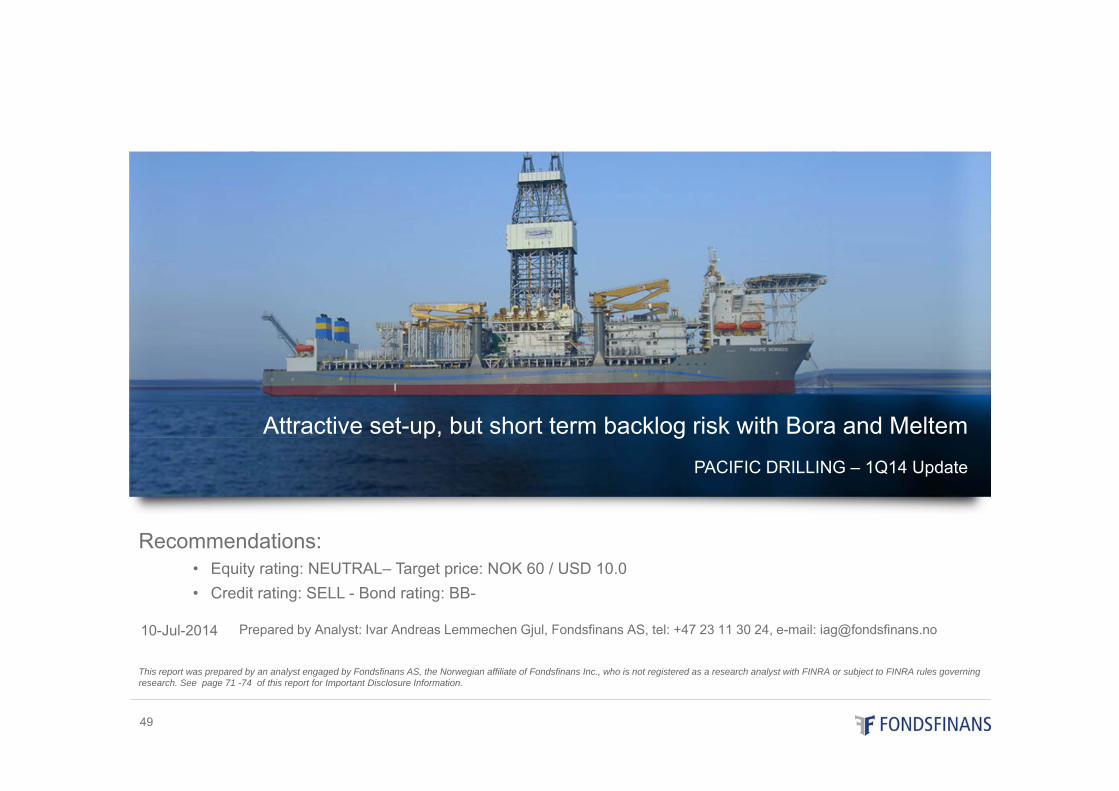
PACIFIC DRILLING – 1Q14 Update
Recommendations:• Equity rating: NEUTRAL– Target price: NOK 60 / USD 10.0• Credit rating: SELL - Bond rating: BB-
Prepared by Analyst: Ivar Andreas Lemmechen Gjul, Fondsfinans AS, tel: +47 23 11 30 24, e-mail: [email protected]
Attractive set-up, but short term backlog risk with Bora and Meltem
10-Jul-2014
49
This report was prepared by an analyst engaged by Fondsfinans AS, the Norwegian affiliate of Fondsfinans Inc., who is not registered as a research analyst with FINRA or subject to FINRA rules governing research. See page 71 -74 of this report for Important Disclosure Information.
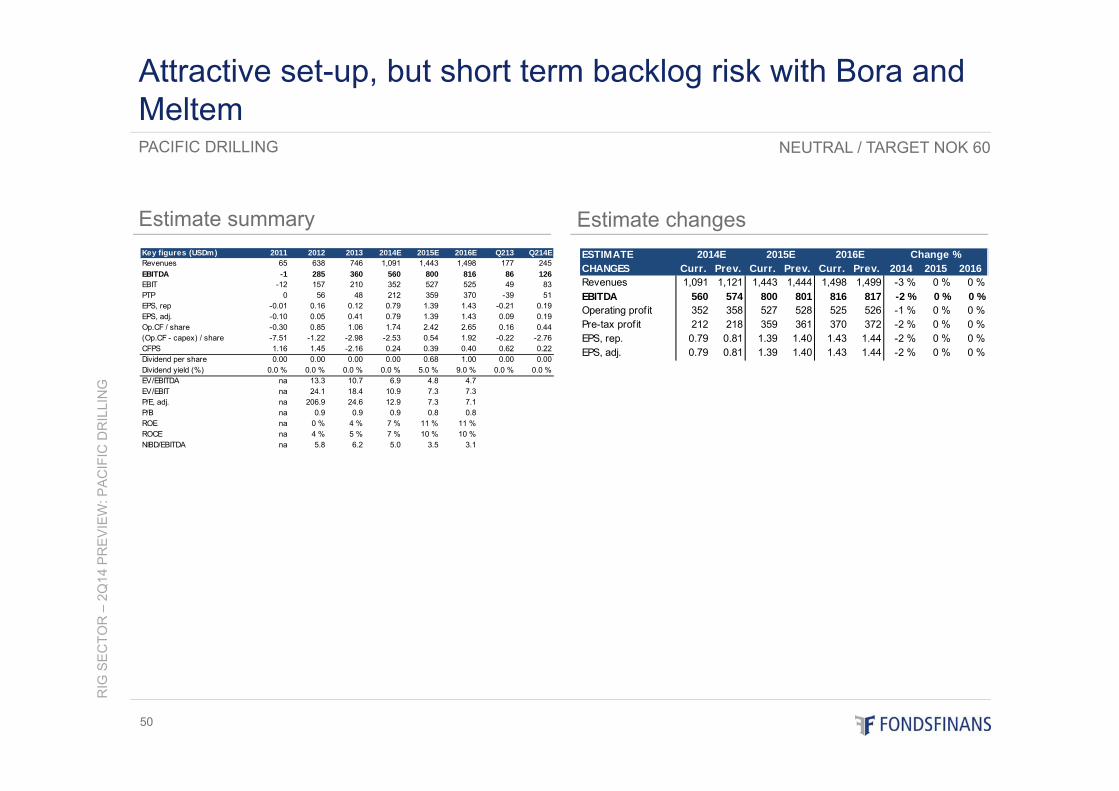
Estimate summary
RIG
SE
CTO
R –
2Q14
PR
EV
IEW
: PA
CIF
IC D
RIL
LIN
G
50
Estimate changes
PACIFIC DRILLING
Attractive set-up, but short term backlog risk with Bora and Meltem
NEUTRAL / TARGET NOK 60
Key figures (USDm) 2011 2012 2013 2014E 2015E 2016E Q213 Q214ERevenues 65 638 746 1,091 1,443 1,498 177 245EBITDA -1 285 360 560 800 816 86 126EBIT -12 157 210 352 527 525 49 83PTP 0 56 48 212 359 370 -39 51EPS, rep -0.01 0.16 0.12 0.79 1.39 1.43 -0.21 0.19EPS, adj. -0.10 0.05 0.41 0.79 1.39 1.43 0.09 0.19Op.CF / share -0.30 0.85 1.06 1.74 2.42 2.65 0.16 0.44(Op.CF - capex) / share -7.51 -1.22 -2.98 -2.53 0.54 1.92 -0.22 -2.76CFPS 1.16 1.45 -2.16 0.24 0.39 0.40 0.62 0.22Dividend per share 0.00 0.00 0.00 0.00 0.68 1.00 0.00 0.00Dividend yield (%) 0.0 % 0.0 % 0.0 % 0.0 % 5.0 % 9.0 % 0.0 % 0.0 %EV/EBITDA na 13.3 10.7 6.9 4.8 4.7EV/EBIT na 24.1 18.4 10.9 7.3 7.3P/E, adj. na 206.9 24.6 12.9 7.3 7.1P/B na 0.9 0.9 0.9 0.8 0.8ROE na 0 % 4 % 7 % 11 % 11 %ROCE na 4 % 5 % 7 % 10 % 10 %NIBD/EBITDA na 5.8 6.2 5.0 3.5 3.1
ESTIMATECHANGES Curr. Prev. Curr. Prev. Curr. Prev. 2014 2015 2016Revenues 1,091 1,121 1,443 1,444 1,498 1,499 -3 % 0 % 0 %EBITDA 560 574 800 801 816 817 -2 % 0 % 0 %Operating profit 352 358 527 528 525 526 -1 % 0 % 0 %Pre-tax profit 212 218 359 361 370 372 -2 % 0 % 0 %EPS, rep. 0.79 0.81 1.39 1.40 1.43 1.44 -2 % 0 % 0 %EPS, adj. 0.79 0.81 1.39 1.40 1.43 1.44 -2 % 0 % 0 %
2014E 2015E 2016E Change %
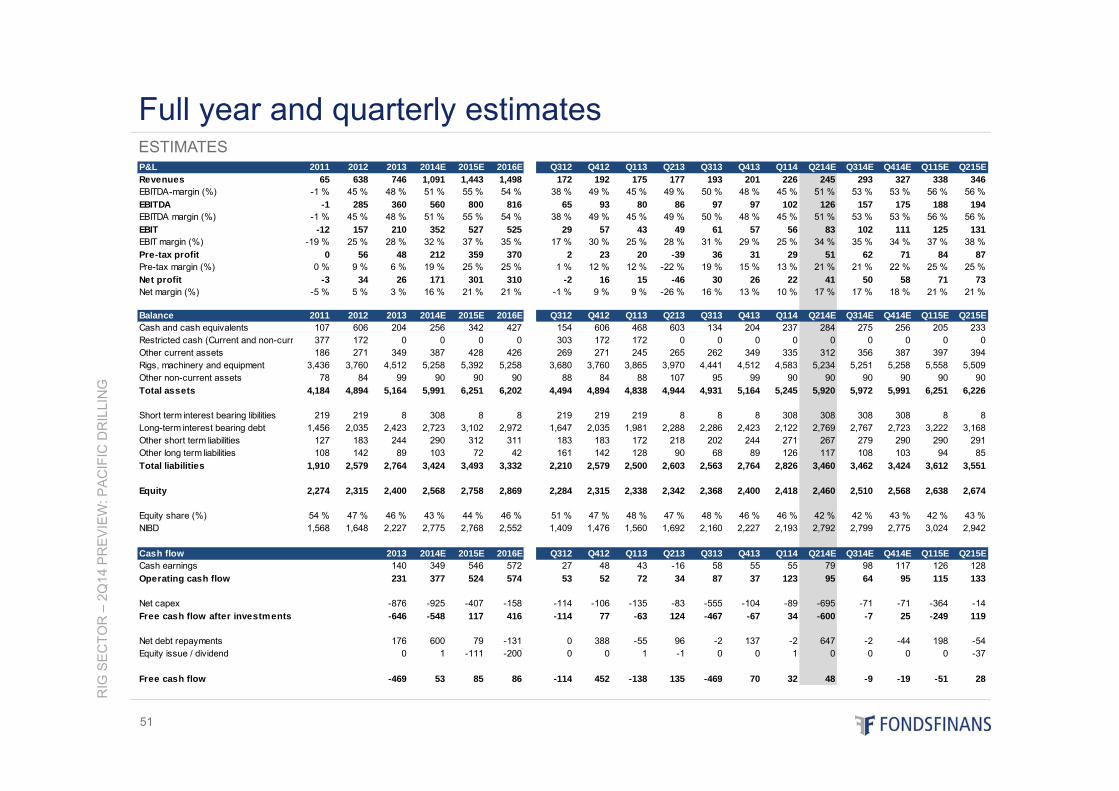
RIG
SE
CTO
R –
2Q14
PR
EV
IEW
: PA
CIF
IC D
RIL
LIN
G
51
ESTIMATES
Full year and quarterly estimatesP&L 2011 2012 2013 2014E 2015E 2016E Q312 Q412 Q113 Q213 Q313 Q413 Q114 Q214E Q314E Q414E Q115E Q215ERevenues 65 638 746 1,091 1,443 1,498 172 192 175 177 193 201 226 245 293 327 338 346EBITDA-margin (%) -1 % 45 % 48 % 51 % 55 % 54 % 38 % 49 % 45 % 49 % 50 % 48 % 45 % 51 % 53 % 53 % 56 % 56 %EBITDA -1 285 360 560 800 816 65 93 80 86 97 97 102 126 157 175 188 194EBITDA margin (%) -1 % 45 % 48 % 51 % 55 % 54 % 38 % 49 % 45 % 49 % 50 % 48 % 45 % 51 % 53 % 53 % 56 % 56 %EBIT -12 157 210 352 527 525 29 57 43 49 61 57 56 83 102 111 125 131EBIT margin (%) -19 % 25 % 28 % 32 % 37 % 35 % 17 % 30 % 25 % 28 % 31 % 29 % 25 % 34 % 35 % 34 % 37 % 38 %Pre-tax profit 0 56 48 212 359 370 2 23 20 -39 36 31 29 51 62 71 84 87Pre-tax margin (%) 0 % 9 % 6 % 19 % 25 % 25 % 1 % 12 % 12 % -22 % 19 % 15 % 13 % 21 % 21 % 22 % 25 % 25 %Net profit -3 34 26 171 301 310 -2 16 15 -46 30 26 22 41 50 58 71 73Net margin (%) -5 % 5 % 3 % 16 % 21 % 21 % -1 % 9 % 9 % -26 % 16 % 13 % 10 % 17 % 17 % 18 % 21 % 21 %
Balance 2011 2012 2013 2014E 2015E 2016E Q312 Q412 Q113 Q213 Q313 Q413 Q114 Q214E Q314E Q414E Q115E Q215ECash and cash equivalents 107 606 204 256 342 427 154 606 468 603 134 204 237 284 275 256 205 233Restricted cash (Current and non-curr 377 172 0 0 0 0 303 172 172 0 0 0 0 0 0 0 0 0Other current assets 186 271 349 387 428 426 269 271 245 265 262 349 335 312 356 387 397 394Rigs, machinery and equipment 3,436 3,760 4,512 5,258 5,392 5,258 3,680 3,760 3,865 3,970 4,441 4,512 4,583 5,234 5,251 5,258 5,558 5,509Other non-current assets 78 84 99 90 90 90 88 84 88 107 95 99 90 90 90 90 90 90Total assets 4,184 4,894 5,164 5,991 6,251 6,202 4,494 4,894 4,838 4,944 4,931 5,164 5,245 5,920 5,972 5,991 6,251 6,226
Short term interest bearing libilities 219 219 8 308 8 8 219 219 219 8 8 8 308 308 308 308 8 8Long-term interest bearing debt 1,456 2,035 2,423 2,723 3,102 2,972 1,647 2,035 1,981 2,288 2,286 2,423 2,122 2,769 2,767 2,723 3,222 3,168Other short term liabilities 127 183 244 290 312 311 183 183 172 218 202 244 271 267 279 290 290 291Other long term liabilities 108 142 89 103 72 42 161 142 128 90 68 89 126 117 108 103 94 85Total liabilities 1,910 2,579 2,764 3,424 3,493 3,332 2,210 2,579 2,500 2,603 2,563 2,764 2,826 3,460 3,462 3,424 3,612 3,551
Equity 2,274 2,315 2,400 2,568 2,758 2,869 2,284 2,315 2,338 2,342 2,368 2,400 2,418 2,460 2,510 2,568 2,638 2,674
Equity share (%) 54 % 47 % 46 % 43 % 44 % 46 % 51 % 47 % 48 % 47 % 48 % 46 % 46 % 42 % 42 % 43 % 42 % 43 %NIBD 1,568 1,648 2,227 2,775 2,768 2,552 1,409 1,476 1,560 1,692 2,160 2,227 2,193 2,792 2,799 2,775 3,024 2,942
Cash flow 2013 2014E 2015E 2016E Q312 Q412 Q113 Q213 Q313 Q413 Q114 Q214E Q314E Q414E Q115E Q215ECash earnings 140 349 546 572 27 48 43 -16 58 55 55 79 98 117 126 128Operating cash flow 231 377 524 574 53 52 72 34 87 37 123 95 64 95 115 133
Net capex -876 -925 -407 -158 -114 -106 -135 -83 -555 -104 -89 -695 -71 -71 -364 -14Free cash flow after investments -646 -548 117 416 -114 77 -63 124 -467 -67 34 -600 -7 25 -249 119
Net debt repayments 176 600 79 -131 0 388 -55 96 -2 137 -2 647 -2 -44 198 -54Equity issue / dividend 0 1 -111 -200 0 0 1 -1 0 0 1 0 0 0 0 -37
Free cash flow -469 53 85 86 -114 452 -138 135 -469 70 32 48 -9 -19 -51 28
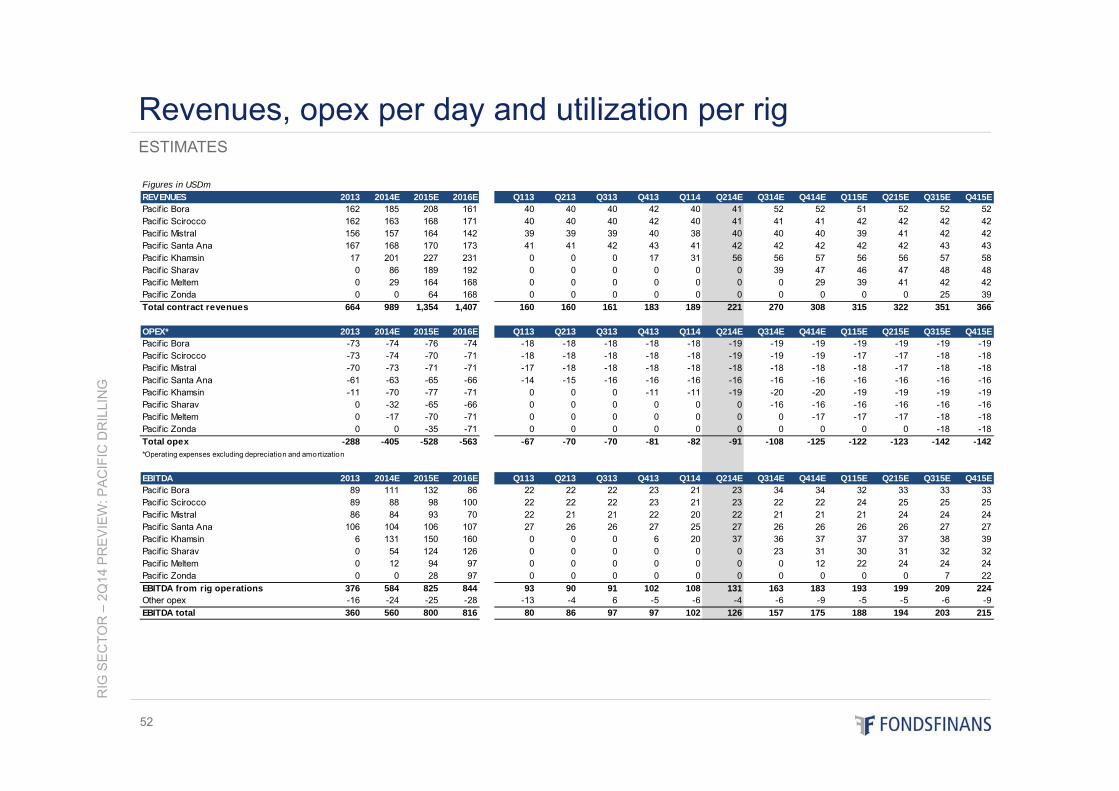
RIG
SE
CTO
R –
2Q14
PR
EV
IEW
: PA
CIF
IC D
RIL
LIN
G
52
ESTIMATES
Revenues, opex per day and utilization per rig
Figures in USDmREVENUES 2013 2014E 2015E 2016E Q113 Q213 Q313 Q413 Q114 Q214E Q314E Q414E Q115E Q215E Q315E Q415EPacif ic Bora 162 185 208 161 40 40 40 42 40 41 52 52 51 52 52 52Pacif ic Scirocco 162 163 168 171 40 40 40 42 40 41 41 41 42 42 42 42Pacif ic Mistral 156 157 164 142 39 39 39 40 38 40 40 40 39 41 42 42Pacif ic Santa Ana 167 168 170 173 41 41 42 43 41 42 42 42 42 42 43 43Pacif ic Khamsin 17 201 227 231 0 0 0 17 31 56 56 57 56 56 57 58Pacif ic Sharav 0 86 189 192 0 0 0 0 0 0 39 47 46 47 48 48Pacif ic Meltem 0 29 164 168 0 0 0 0 0 0 0 29 39 41 42 42Pacif ic Zonda 0 0 64 168 0 0 0 0 0 0 0 0 0 0 25 39Total contract revenues 664 989 1,354 1,407 160 160 161 183 189 221 270 308 315 322 351 366
OPEX* 2013 2014E 2015E 2016E Q113 Q213 Q313 Q413 Q114 Q214E Q314E Q414E Q115E Q215E Q315E Q415EPacif ic Bora -73 -74 -76 -74 -18 -18 -18 -18 -18 -19 -19 -19 -19 -19 -19 -19Pacif ic Scirocco -73 -74 -70 -71 -18 -18 -18 -18 -18 -19 -19 -19 -17 -17 -18 -18Pacif ic Mistral -70 -73 -71 -71 -17 -18 -18 -18 -18 -18 -18 -18 -18 -17 -18 -18Pacif ic Santa Ana -61 -63 -65 -66 -14 -15 -16 -16 -16 -16 -16 -16 -16 -16 -16 -16Pacif ic Khamsin -11 -70 -77 -71 0 0 0 -11 -11 -19 -20 -20 -19 -19 -19 -19Pacif ic Sharav 0 -32 -65 -66 0 0 0 0 0 0 -16 -16 -16 -16 -16 -16Pacif ic Meltem 0 -17 -70 -71 0 0 0 0 0 0 0 -17 -17 -17 -18 -18Pacif ic Zonda 0 0 -35 -71 0 0 0 0 0 0 0 0 0 0 -18 -18Total opex -288 -405 -528 -563 -67 -70 -70 -81 -82 -91 -108 -125 -122 -123 -142 -142*Operating expenses excluding depreciation and amortization
EBITDA 2013 2014E 2015E 2016E Q113 Q213 Q313 Q413 Q114 Q214E Q314E Q414E Q115E Q215E Q315E Q415EPacif ic Bora 89 111 132 86 22 22 22 23 21 23 34 34 32 33 33 33Pacif ic Scirocco 89 88 98 100 22 22 22 23 21 23 22 22 24 25 25 25Pacif ic Mistral 86 84 93 70 22 21 21 22 20 22 21 21 21 24 24 24Pacif ic Santa Ana 106 104 106 107 27 26 26 27 25 27 26 26 26 26 27 27Pacif ic Khamsin 6 131 150 160 0 0 0 6 20 37 36 37 37 37 38 39Pacif ic Sharav 0 54 124 126 0 0 0 0 0 0 23 31 30 31 32 32Pacif ic Meltem 0 12 94 97 0 0 0 0 0 0 0 12 22 24 24 24Pacif ic Zonda 0 0 28 97 0 0 0 0 0 0 0 0 0 0 7 22EBITDA from rig operations 376 584 825 844 93 90 91 102 108 131 163 183 193 199 209 224Other opex -16 -24 -25 -28 -13 -4 6 -5 -6 -4 -6 -9 -5 -5 -6 -9EBITDA total 360 560 800 816 80 86 97 97 102 126 157 175 188 194 203 215
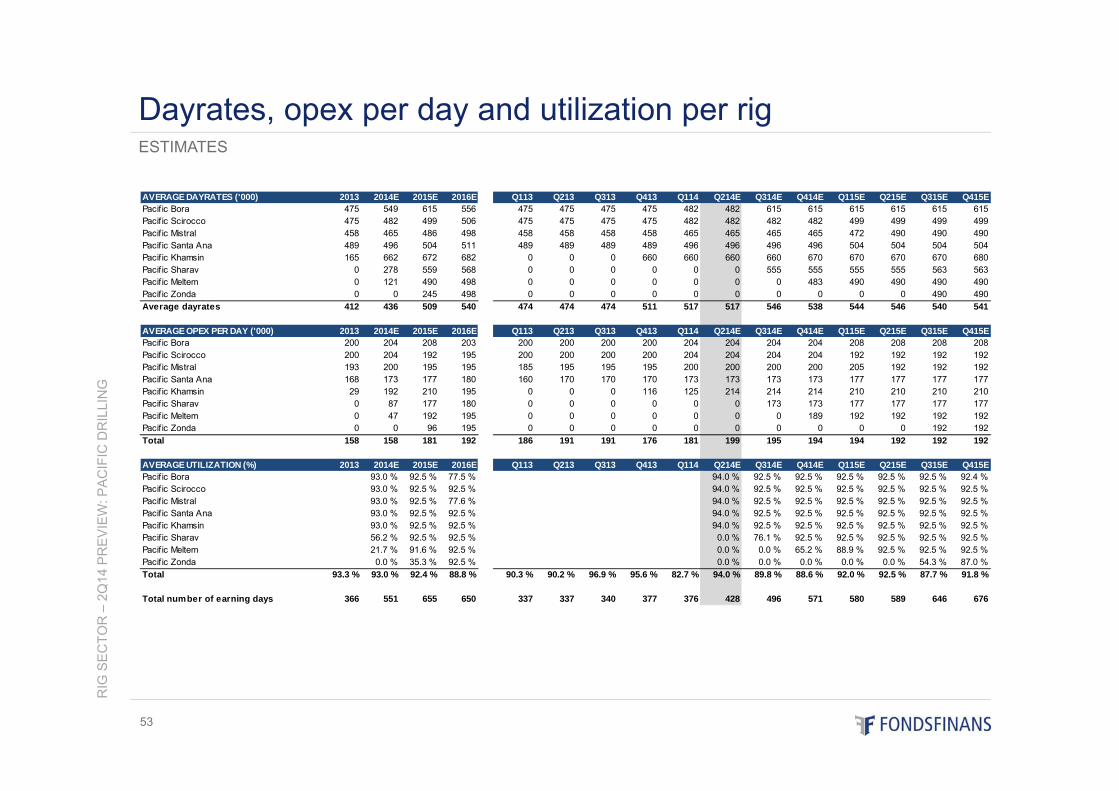
RIG
SE
CTO
R –
2Q14
PR
EV
IEW
: PA
CIF
IC D
RIL
LIN
G
53
ESTIMATES
Dayrates, opex per day and utilization per rig
AVERAGE DAYRATES ('000) 2013 2014E 2015E 2016E Q113 Q213 Q313 Q413 Q114 Q214E Q314E Q414E Q115E Q215E Q315E Q415EPacif ic Bora 475 549 615 556 475 475 475 475 482 482 615 615 615 615 615 615Pacif ic Scirocco 475 482 499 506 475 475 475 475 482 482 482 482 499 499 499 499Pacif ic Mistral 458 465 486 498 458 458 458 458 465 465 465 465 472 490 490 490Pacif ic Santa Ana 489 496 504 511 489 489 489 489 496 496 496 496 504 504 504 504Pacif ic Khamsin 165 662 672 682 0 0 0 660 660 660 660 670 670 670 670 680Pacif ic Sharav 0 278 559 568 0 0 0 0 0 0 555 555 555 555 563 563Pacif ic Meltem 0 121 490 498 0 0 0 0 0 0 0 483 490 490 490 490Pacif ic Zonda 0 0 245 498 0 0 0 0 0 0 0 0 0 0 490 490Average dayrates 412 436 509 540 474 474 474 511 517 517 546 538 544 546 540 541
AVERAGE OPEX PER DAY ('000) 2013 2014E 2015E 2016E Q113 Q213 Q313 Q413 Q114 Q214E Q314E Q414E Q115E Q215E Q315E Q415EPacif ic Bora 200 204 208 203 200 200 200 200 204 204 204 204 208 208 208 208Pacif ic Scirocco 200 204 192 195 200 200 200 200 204 204 204 204 192 192 192 192Pacif ic Mistral 193 200 195 195 185 195 195 195 200 200 200 200 205 192 192 192Pacif ic Santa Ana 168 173 177 180 160 170 170 170 173 173 173 173 177 177 177 177Pacif ic Khamsin 29 192 210 195 0 0 0 116 125 214 214 214 210 210 210 210Pacif ic Sharav 0 87 177 180 0 0 0 0 0 0 173 173 177 177 177 177Pacif ic Meltem 0 47 192 195 0 0 0 0 0 0 0 189 192 192 192 192Pacif ic Zonda 0 0 96 195 0 0 0 0 0 0 0 0 0 0 192 192Total 158 158 181 192 186 191 191 176 181 199 195 194 194 192 192 192
AVERAGE UTILIZATION (%) 2013 2014E 2015E 2016E Q113 Q213 Q313 Q413 Q114 Q214E Q314E Q414E Q115E Q215E Q315E Q415EPacif ic Bora 93.0 % 92.5 % 77.5 % 94.0 % 92.5 % 92.5 % 92.5 % 92.5 % 92.5 % 92.4 %Pacif ic Scirocco 93.0 % 92.5 % 92.5 % 94.0 % 92.5 % 92.5 % 92.5 % 92.5 % 92.5 % 92.5 %Pacif ic Mistral 93.0 % 92.5 % 77.6 % 94.0 % 92.5 % 92.5 % 92.5 % 92.5 % 92.5 % 92.5 %Pacif ic Santa Ana 93.0 % 92.5 % 92.5 % 94.0 % 92.5 % 92.5 % 92.5 % 92.5 % 92.5 % 92.5 %Pacif ic Khamsin 93.0 % 92.5 % 92.5 % 94.0 % 92.5 % 92.5 % 92.5 % 92.5 % 92.5 % 92.5 %Pacif ic Sharav 56.2 % 92.5 % 92.5 % 0.0 % 76.1 % 92.5 % 92.5 % 92.5 % 92.5 % 92.5 %Pacif ic Meltem 21.7 % 91.6 % 92.5 % 0.0 % 0.0 % 65.2 % 88.9 % 92.5 % 92.5 % 92.5 %Pacif ic Zonda 0.0 % 35.3 % 92.5 % 0.0 % 0.0 % 0.0 % 0.0 % 0.0 % 54.3 % 87.0 %Total 93.3 % 93.0 % 92.4 % 88.8 % 90.3 % 90.2 % 96.9 % 95.6 % 82.7 % 94.0 % 89.8 % 88.6 % 92.0 % 92.5 % 87.7 % 91.8 %
Total number of earning days 366 551 655 650 337 337 340 377 376 428 496 571 580 589 646 676
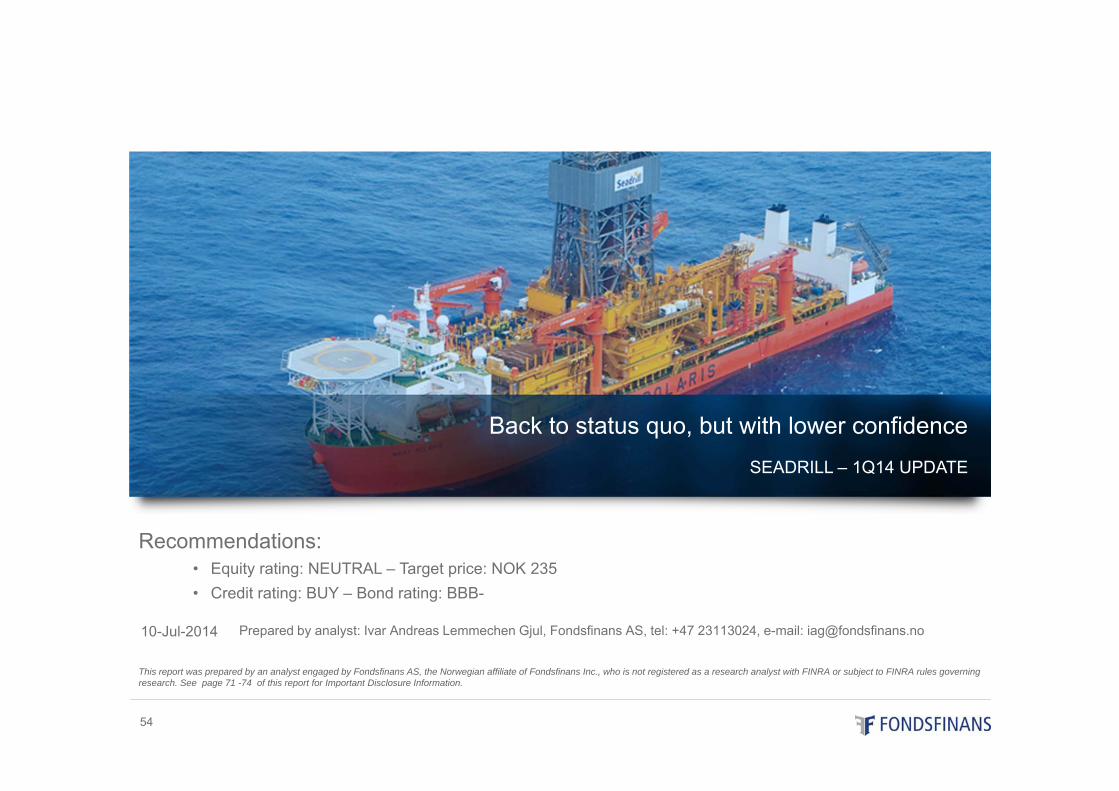
SEADRILL – 1Q14 UPDATE
Recommendations:• Equity rating: NEUTRAL – Target price: NOK 235• Credit rating: BUY – Bond rating: BBB-• Credit rating: BUY – Bond rating: BBB-
Prepared by analyst: Ivar Andreas Lemmechen Gjul, Fondsfinans AS, tel: +47 23113024, e-mail: [email protected]
Back to status quo, but with lower confidence
10-Jul-2014
54
This report was prepared by an analyst engaged by Fondsfinans AS, the Norwegian affiliate of Fondsfinans Inc., who is not registered as a research analyst with FINRA or subject to FINRA rules governing research. See page 71 -74 of this report for Important Disclosure Information.
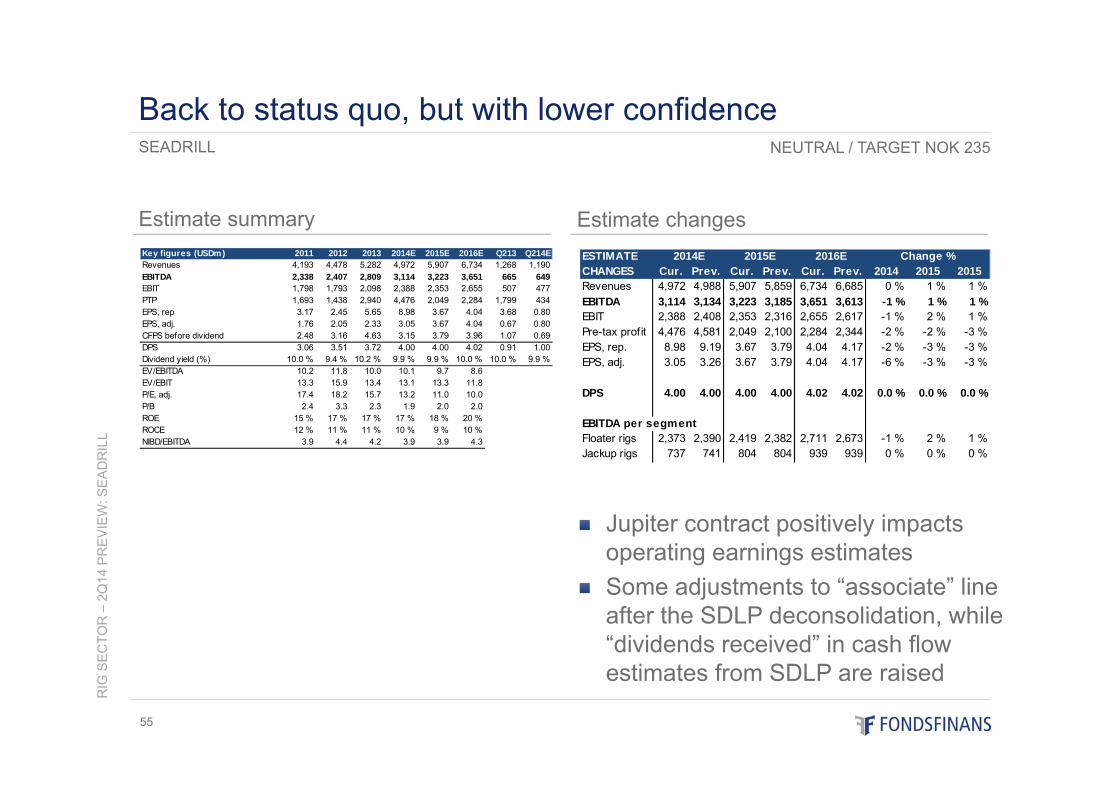
Estimate summary
RIG
SE
CTO
R –
2Q14
PR
EV
IEW
: SE
AD
RIL
L
55
Estimate changes
Jupiter contract positively impacts operating earnings estimatesSome adjustments to “associate” line after the SDLP deconsolidation, while “dividends received” in cash flow estimates from SDLP are raised
SEADRILL
Back to status quo, but with lower confidenceNEUTRAL / TARGET NOK 235
Key figures (USDm) 2011 2012 2013 2014E 2015E 2016E Q213 Q214ERevenues 4,193 4,478 5,282 4,972 5,907 6,734 1,268 1,190EBITDA 2,338 2,407 2,809 3,114 3,223 3,651 665 649EBIT 1,798 1,793 2,098 2,388 2,353 2,655 507 477PTP 1,693 1,438 2,940 4,476 2,049 2,284 1,799 434EPS, rep 3.17 2.45 5.65 8.98 3.67 4.04 3.68 0.80EPS, adj. 1.76 2.05 2.33 3.05 3.67 4.04 0.67 0.80CFPS before dividend 2.48 3.16 4.63 3.15 3.79 3.96 1.07 0.69DPS 3.06 3.51 3.72 4.00 4.00 4.02 0.91 1.00Dividend yield (%) 10.0 % 9.4 % 10.2 % 9.9 % 9.9 % 10.0 % 10.0 % 9.9 %EV/EBITDA 10.2 11.8 10.0 10.1 9.7 8.6EV/EBIT 13.3 15.9 13.4 13.1 13.3 11.8P/E, adj. 17.4 18.2 15.7 13.2 11.0 10.0P/B 2.4 3.3 2.3 1.9 2.0 2.0ROE 15 % 17 % 17 % 17 % 18 % 20 %ROCE 12 % 11 % 11 % 10 % 9 % 10 %NIBD/EBITDA 3.9 4.4 4.2 3.9 3.9 4.3
ESTIMATECHANGES Cur. Prev. Cur. Prev. Cur. Prev. 2014 2015 2015Revenues 4,972 4,988 5,907 5,859 6,734 6,685 0 % 1 % 1 %EBITDA 3,114 3,134 3,223 3,185 3,651 3,613 -1 % 1 % 1 %EBIT 2,388 2,408 2,353 2,316 2,655 2,617 -1 % 2 % 1 %Pre-tax profit 4,476 4,581 2,049 2,100 2,284 2,344 -2 % -2 % -3 %EPS, rep. 8.98 9.19 3.67 3.79 4.04 4.17 -2 % -3 % -3 %EPS, adj. 3.05 3.26 3.67 3.79 4.04 4.17 -6 % -3 % -3 %
DPS 4.00 4.00 4.00 4.00 4.02 4.02 0.0 % 0.0 % 0.0 %
EBITDA per segmentFloater rigs 2,373 2,390 2,419 2,382 2,711 2,673 -1 % 2 % 1 %Jackup rigs 737 741 804 804 939 939 0 % 0 % 0 %
Change %2014E 2015E 2016E
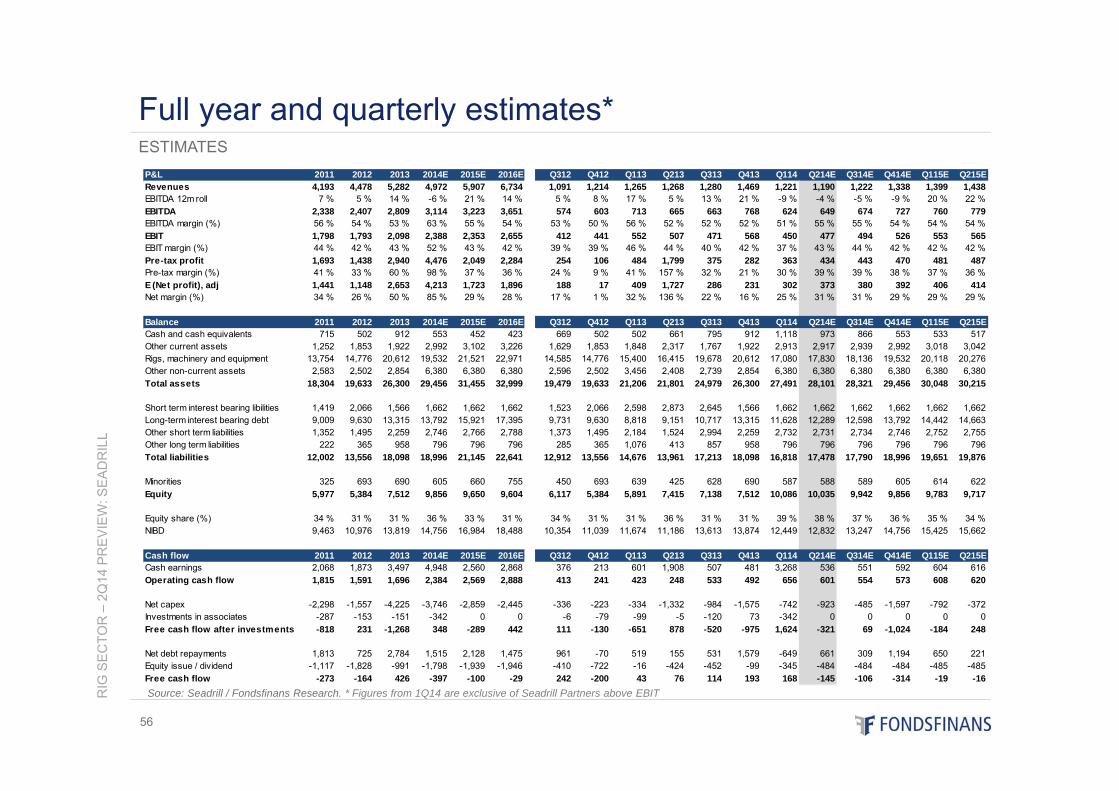
RIG
SE
CTO
R –
2Q14
PR
EV
IEW
: SE
AD
RIL
L
56
ESTIMATES
Full year and quarterly estimates*
P&L 2011 2012 2013 2014E 2015E 2016E Q312 Q412 Q113 Q213 Q313 Q413 Q114 Q214E Q314E Q414E Q115E Q215ERevenues 4,193 4,478 5,282 4,972 5,907 6,734 1,091 1,214 1,265 1,268 1,280 1,469 1,221 1,190 1,222 1,338 1,399 1,438EBITDA 12m roll 7 % 5 % 14 % -6 % 21 % 14 % 5 % 8 % 17 % 5 % 13 % 21 % -9 % -4 % -5 % -9 % 20 % 22 %EBITDA 2,338 2,407 2,809 3,114 3,223 3,651 574 603 713 665 663 768 624 649 674 727 760 779EBITDA margin (%) 56 % 54 % 53 % 63 % 55 % 54 % 53 % 50 % 56 % 52 % 52 % 52 % 51 % 55 % 55 % 54 % 54 % 54 %EBIT 1,798 1,793 2,098 2,388 2,353 2,655 412 441 552 507 471 568 450 477 494 526 553 565EBIT margin (%) 44 % 42 % 43 % 52 % 43 % 42 % 39 % 39 % 46 % 44 % 40 % 42 % 37 % 43 % 44 % 42 % 42 % 42 %Pre-tax profit 1,693 1,438 2,940 4,476 2,049 2,284 254 106 484 1,799 375 282 363 434 443 470 481 487Pre-tax margin (%) 41 % 33 % 60 % 98 % 37 % 36 % 24 % 9 % 41 % 157 % 32 % 21 % 30 % 39 % 39 % 38 % 37 % 36 %E (Net profit), adj 1,441 1,148 2,653 4,213 1,723 1,896 188 17 409 1,727 286 231 302 373 380 392 406 414Net margin (%) 34 % 26 % 50 % 85 % 29 % 28 % 17 % 1 % 32 % 136 % 22 % 16 % 25 % 31 % 31 % 29 % 29 % 29 %
Balance 2011 2012 2013 2014E 2015E 2016E Q312 Q412 Q113 Q213 Q313 Q413 Q114 Q214E Q314E Q414E Q115E Q215ECash and cash equivalents 715 502 912 553 452 423 669 502 502 661 795 912 1,118 973 866 553 533 517Other current assets 1,252 1,853 1,922 2,992 3,102 3,226 1,629 1,853 1,848 2,317 1,767 1,922 2,913 2,917 2,939 2,992 3,018 3,042Rigs, machinery and equipment 13,754 14,776 20,612 19,532 21,521 22,971 14,585 14,776 15,400 16,415 19,678 20,612 17,080 17,830 18,136 19,532 20,118 20,276Other non-current assets 2,583 2,502 2,854 6,380 6,380 6,380 2,596 2,502 3,456 2,408 2,739 2,854 6,380 6,380 6,380 6,380 6,380 6,380Total assets 18,304 19,633 26,300 29,456 31,455 32,999 19,479 19,633 21,206 21,801 24,979 26,300 27,491 28,101 28,321 29,456 30,048 30,215
Short term interest bearing libilities 1,419 2,066 1,566 1,662 1,662 1,662 1,523 2,066 2,598 2,873 2,645 1,566 1,662 1,662 1,662 1,662 1,662 1,662Long-term interest bearing debt 9,009 9,630 13,315 13,792 15,921 17,395 9,731 9,630 8,818 9,151 10,717 13,315 11,628 12,289 12,598 13,792 14,442 14,663Other short term liabilities 1,352 1,495 2,259 2,746 2,766 2,788 1,373 1,495 2,184 1,524 2,994 2,259 2,732 2,731 2,734 2,746 2,752 2,755Other long term liabilities 222 365 958 796 796 796 285 365 1,076 413 857 958 796 796 796 796 796 796Total liabilities 12,002 13,556 18,098 18,996 21,145 22,641 12,912 13,556 14,676 13,961 17,213 18,098 16,818 17,478 17,790 18,996 19,651 19,876
Minorities 325 693 690 605 660 755 450 693 639 425 628 690 587 588 589 605 614 622Equity 5,977 5,384 7,512 9,856 9,650 9,604 6,117 5,384 5,891 7,415 7,138 7,512 10,086 10,035 9,942 9,856 9,783 9,717
Equity share (%) 34 % 31 % 31 % 36 % 33 % 31 % 34 % 31 % 31 % 36 % 31 % 31 % 39 % 38 % 37 % 36 % 35 % 34 %NIBD 9,463 10,976 13,819 14,756 16,984 18,488 10,354 11,039 11,674 11,186 13,613 13,874 12,449 12,832 13,247 14,756 15,425 15,662
Cash flow 2011 2012 2013 2014E 2015E 2016E Q312 Q412 Q113 Q213 Q313 Q413 Q114 Q214E Q314E Q414E Q115E Q215ECash earnings 2,068 1,873 3,497 4,948 2,560 2,868 376 213 601 1,908 507 481 3,268 536 551 592 604 616Operating cash flow 1,815 1,591 1,696 2,384 2,569 2,888 413 241 423 248 533 492 656 601 554 573 608 620
Net capex -2,298 -1,557 -4,225 -3,746 -2,859 -2,445 -336 -223 -334 -1,332 -984 -1,575 -742 -923 -485 -1,597 -792 -372Investments in associates -287 -153 -151 -342 0 0 -6 -79 -99 -5 -120 73 -342 0 0 0 0 0Free cash flow after investments -818 231 -1,268 348 -289 442 111 -130 -651 878 -520 -975 1,624 -321 69 -1,024 -184 248
Net debt repayments 1,813 725 2,784 1,515 2,128 1,475 961 -70 519 155 531 1,579 -649 661 309 1,194 650 221Equity issue / dividend -1,117 -1,828 -991 -1,798 -1,939 -1,946 -410 -722 -16 -424 -452 -99 -345 -484 -484 -484 -485 -485Free cash flow -273 -164 426 -397 -100 -29 242 -200 43 76 114 193 168 -145 -106 -314 -19 -16Source: Seadrill / Fondsfinans Research. * Figures from 1Q14 are exclusive of Seadrill Partners above EBIT
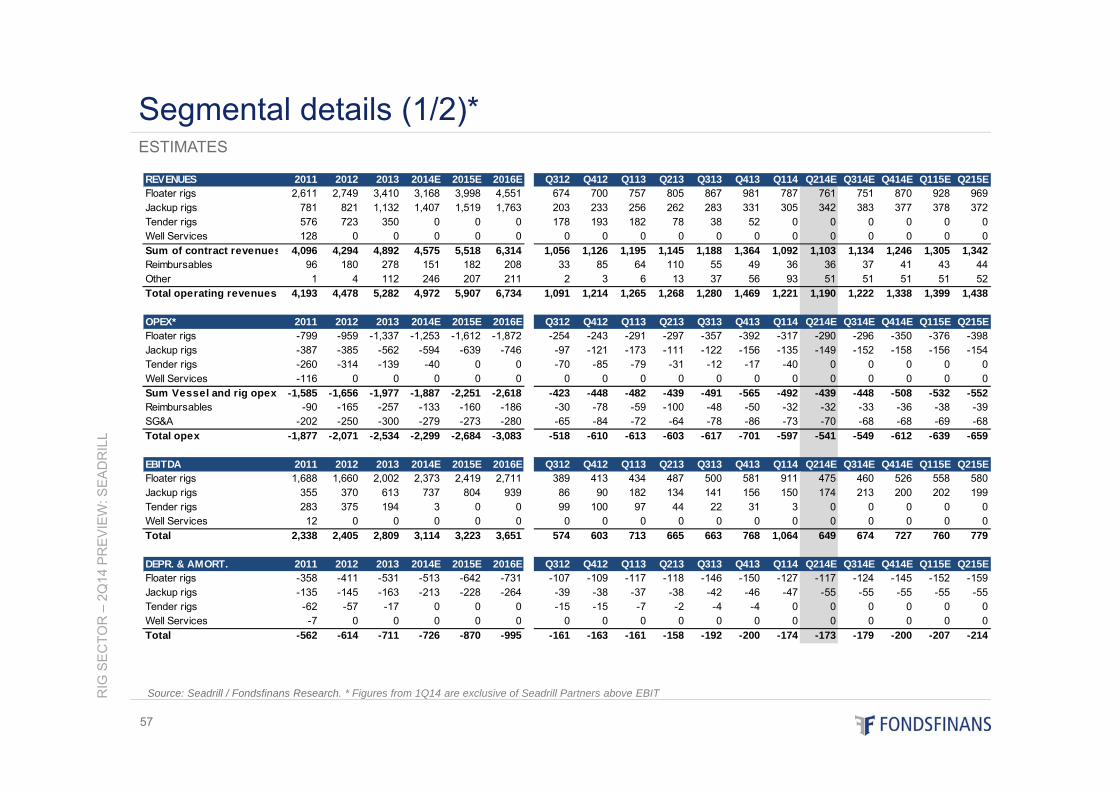
RIG
SE
CTO
R –
2Q14
PR
EV
IEW
: SE
AD
RIL
L
57
ESTIMATES
Segmental details (1/2)*
REVENUES 2011 2012 2013 2014E 2015E 2016E Q312 Q412 Q113 Q213 Q313 Q413 Q114 Q214E Q314E Q414E Q115E Q215EFloater rigs 2,611 2,749 3,410 3,168 3,998 4,551 674 700 757 805 867 981 787 761 751 870 928 969Jackup rigs 781 821 1,132 1,407 1,519 1,763 203 233 256 262 283 331 305 342 383 377 378 372Tender rigs 576 723 350 0 0 0 178 193 182 78 38 52 0 0 0 0 0 0Well Services 128 0 0 0 0 0 0 0 0 0 0 0 0 0 0 0 0 0Sum of contract revenues 4,096 4,294 4,892 4,575 5,518 6,314 1,056 1,126 1,195 1,145 1,188 1,364 1,092 1,103 1,134 1,246 1,305 1,342Reimbursables 96 180 278 151 182 208 33 85 64 110 55 49 36 36 37 41 43 44Other 1 4 112 246 207 211 2 3 6 13 37 56 93 51 51 51 51 52Total operating revenues 4,193 4,478 5,282 4,972 5,907 6,734 1,091 1,214 1,265 1,268 1,280 1,469 1,221 1,190 1,222 1,338 1,399 1,438
OPEX* 2011 2012 2013 2014E 2015E 2016E Q312 Q412 Q113 Q213 Q313 Q413 Q114 Q214E Q314E Q414E Q115E Q215EFloater rigs -799 -959 -1,337 -1,253 -1,612 -1,872 -254 -243 -291 -297 -357 -392 -317 -290 -296 -350 -376 -398Jackup rigs -387 -385 -562 -594 -639 -746 -97 -121 -173 -111 -122 -156 -135 -149 -152 -158 -156 -154Tender rigs -260 -314 -139 -40 0 0 -70 -85 -79 -31 -12 -17 -40 0 0 0 0 0Well Services -116 0 0 0 0 0 0 0 0 0 0 0 0 0 0 0 0 0Sum Vessel and rig opex -1,585 -1,656 -1,977 -1,887 -2,251 -2,618 -423 -448 -482 -439 -491 -565 -492 -439 -448 -508 -532 -552Reimbursables -90 -165 -257 -133 -160 -186 -30 -78 -59 -100 -48 -50 -32 -32 -33 -36 -38 -39SG&A -202 -250 -300 -279 -273 -280 -65 -84 -72 -64 -78 -86 -73 -70 -68 -68 -69 -68Total opex -1,877 -2,071 -2,534 -2,299 -2,684 -3,083 -518 -610 -613 -603 -617 -701 -597 -541 -549 -612 -639 -659
EBITDA 2011 2012 2013 2014E 2015E 2016E Q312 Q412 Q113 Q213 Q313 Q413 Q114 Q214E Q314E Q414E Q115E Q215EFloater rigs 1,688 1,660 2,002 2,373 2,419 2,711 389 413 434 487 500 581 911 475 460 526 558 580Jackup rigs 355 370 613 737 804 939 86 90 182 134 141 156 150 174 213 200 202 199Tender rigs 283 375 194 3 0 0 99 100 97 44 22 31 3 0 0 0 0 0Well Services 12 0 0 0 0 0 0 0 0 0 0 0 0 0 0 0 0 0Total 2,338 2,405 2,809 3,114 3,223 3,651 574 603 713 665 663 768 1,064 649 674 727 760 779
DEPR. & AMORT. 2011 2012 2013 2014E 2015E 2016E Q312 Q412 Q113 Q213 Q313 Q413 Q114 Q214E Q314E Q414E Q115E Q215EFloater rigs -358 -411 -531 -513 -642 -731 -107 -109 -117 -118 -146 -150 -127 -117 -124 -145 -152 -159Jackup rigs -135 -145 -163 -213 -228 -264 -39 -38 -37 -38 -42 -46 -47 -55 -55 -55 -55 -55Tender rigs -62 -57 -17 0 0 0 -15 -15 -7 -2 -4 -4 0 0 0 0 0 0Well Services -7 0 0 0 0 0 0 0 0 0 0 0 0 0 0 0 0 0Total -562 -614 -711 -726 -870 -995 -161 -163 -161 -158 -192 -200 -174 -173 -179 -200 -207 -214
Source: Seadrill / Fondsfinans Research. * Figures from 1Q14 are exclusive of Seadrill Partners above EBIT
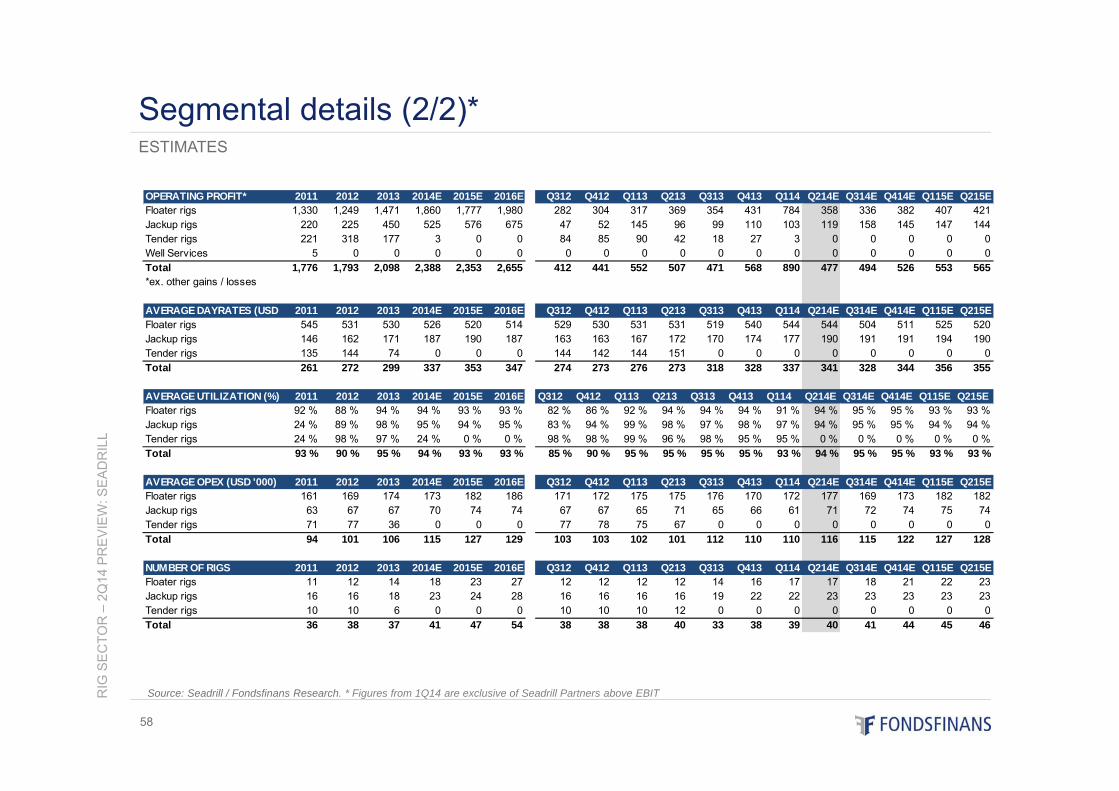
RIG
SE
CTO
R –
2Q14
PR
EV
IEW
: SE
AD
RIL
L
58
ESTIMATES
Segmental details (2/2)*
OPERATING PROFIT* 2011 2012 2013 2014E 2015E 2016E Q312 Q412 Q113 Q213 Q313 Q413 Q114 Q214E Q314E Q414E Q115E Q215EFloater rigs 1,330 1,249 1,471 1,860 1,777 1,980 282 304 317 369 354 431 784 358 336 382 407 421Jackup rigs 220 225 450 525 576 675 47 52 145 96 99 110 103 119 158 145 147 144Tender rigs 221 318 177 3 0 0 84 85 90 42 18 27 3 0 0 0 0 0Well Services 5 0 0 0 0 0 0 0 0 0 0 0 0 0 0 0 0 0Total 1,776 1,793 2,098 2,388 2,353 2,655 412 441 552 507 471 568 890 477 494 526 553 565*ex. other gains / losses
AVERAGE DAYRATES (USD 2011 2012 2013 2014E 2015E 2016E Q312 Q412 Q113 Q213 Q313 Q413 Q114 Q214E Q314E Q414E Q115E Q215EFloater rigs 545 531 530 526 520 514 529 530 531 531 519 540 544 544 504 511 525 520Jackup rigs 146 162 171 187 190 187 163 163 167 172 170 174 177 190 191 191 194 190Tender rigs 135 144 74 0 0 0 144 142 144 151 0 0 0 0 0 0 0 0Total 261 272 299 337 353 347 274 273 276 273 318 328 337 341 328 344 356 355
AVERAGE UTILIZATION (%) 2011 2012 2013 2014E 2015E 2016E Q312 Q412 Q113 Q213 Q313 Q413 Q114 Q214E Q314E Q414E Q115E Q215EFloater rigs 92 % 88 % 94 % 94 % 93 % 93 % 82 % 86 % 92 % 94 % 94 % 94 % 91 % 94 % 95 % 95 % 93 % 93 %Jackup rigs 24 % 89 % 98 % 95 % 94 % 95 % 83 % 94 % 99 % 98 % 97 % 98 % 97 % 94 % 95 % 95 % 94 % 94 %Tender rigs 24 % 98 % 97 % 24 % 0 % 0 % 98 % 98 % 99 % 96 % 98 % 95 % 95 % 0 % 0 % 0 % 0 % 0 %Total 93 % 90 % 95 % 94 % 93 % 93 % 85 % 90 % 95 % 95 % 95 % 95 % 93 % 94 % 95 % 95 % 93 % 93 %
AVERAGE OPEX (USD '000) 2011 2012 2013 2014E 2015E 2016E Q312 Q412 Q113 Q213 Q313 Q413 Q114 Q214E Q314E Q414E Q115E Q215EFloater rigs 161 169 174 173 182 186 171 172 175 175 176 170 172 177 169 173 182 182Jackup rigs 63 67 67 70 74 74 67 67 65 71 65 66 61 71 72 74 75 74Tender rigs 71 77 36 0 0 0 77 78 75 67 0 0 0 0 0 0 0 0Total 94 101 106 115 127 129 103 103 102 101 112 110 110 116 115 122 127 128
NUMBER OF RIGS 2011 2012 2013 2014E 2015E 2016E Q312 Q412 Q113 Q213 Q313 Q413 Q114 Q214E Q314E Q414E Q115E Q215EFloater rigs 11 12 14 18 23 27 12 12 12 12 14 16 17 17 18 21 22 23Jackup rigs 16 16 18 23 24 28 16 16 16 16 19 22 22 23 23 23 23 23Tender rigs 10 10 6 0 0 0 10 10 10 12 0 0 0 0 0 0 0 0Total 36 38 37 41 47 54 38 38 38 40 33 38 39 40 41 44 45 46
Source: Seadrill / Fondsfinans Research. * Figures from 1Q14 are exclusive of Seadrill Partners above EBIT
Sevan Drilling – 1Q14 Update
Recommendation: NEUTRAL – Target: NOK 3.90
Prepared by analyst: Ivar Andreas Lemmechen Gjul, Fondsfinans AS, tel: +47 23113024, e-mail: [email protected]
Synergies materializing, contract for Sevan Developer key value enabler
10-Jul-2014
59
This report was prepared by an analyst engaged by Fondsfinans AS, the Norwegian affiliate of Fondsfinans Inc., who is not registered as a research analyst with FINRA or subject to FINRA rules governing research. See page 71 -74 of this report for Important Disclosure Information.
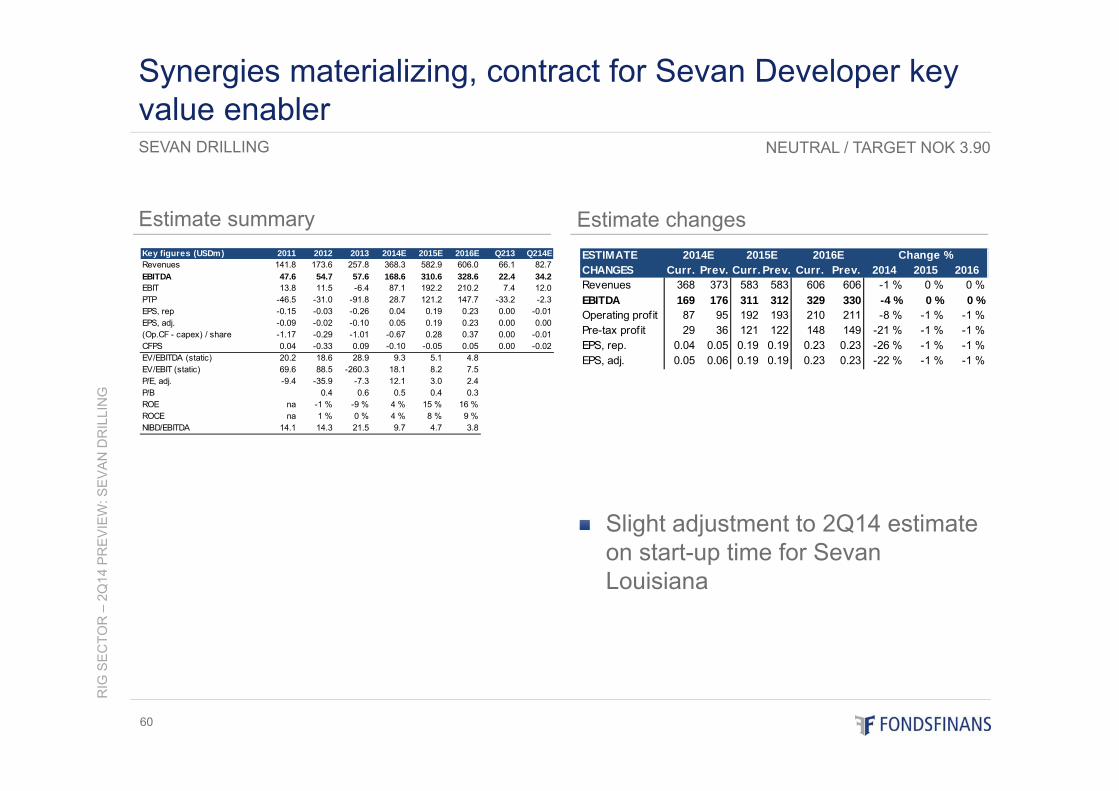
Estimate summary
RIG
SE
CTO
R –
2Q14
PR
EV
IEW
: SE
VA
N D
RIL
LIN
G
60
Estimate changes
Slight adjustment to 2Q14 estimate on start-up time for SevanLouisiana
SEVAN DRILLING
Synergies materializing, contract for Sevan Developer key value enabler
NEUTRAL / TARGET NOK 3.90
Key figures (USDm) 2011 2012 2013 2014E 2015E 2016E Q213 Q214ERevenues 141.8 173.6 257.8 368.3 582.9 606.0 66.1 82.7EBITDA 47.6 54.7 57.6 168.6 310.6 328.6 22.4 34.2EBIT 13.8 11.5 -6.4 87.1 192.2 210.2 7.4 12.0PTP -46.5 -31.0 -91.8 28.7 121.2 147.7 -33.2 -2.3EPS, rep -0.15 -0.03 -0.26 0.04 0.19 0.23 0.00 -0.01EPS, adj. -0.09 -0.02 -0.10 0.05 0.19 0.23 0.00 0.00(Op.CF - capex) / share -1.17 -0.29 -1.01 -0.67 0.28 0.37 0.00 -0.01CFPS 0.04 -0.33 0.09 -0.10 -0.05 0.05 0.00 -0.02EV/EBITDA (static) 20.2 18.6 28.9 9.3 5.1 4.8EV/EBIT (static) 69.6 88.5 -260.3 18.1 8.2 7.5P/E, adj. -9.4 -35.9 -7.3 12.1 3.0 2.4P/B 0.4 0.6 0.5 0.4 0.3ROE na -1 % -9 % 4 % 15 % 16 %ROCE na 1 % 0 % 4 % 8 % 9 %NIBD/EBITDA 14.1 14.3 21.5 9.7 4.7 3.8
ESTIMATECHANGES Curr. Prev. Curr. Prev. Curr. Prev. 2014 2015 2016Revenues 368 373 583 583 606 606 -1 % 0 % 0 %EBITDA 169 176 311 312 329 330 -4 % 0 % 0 %Operating profit 87 95 192 193 210 211 -8 % -1 % -1 %Pre-tax profit 29 36 121 122 148 149 -21 % -1 % -1 %EPS, rep. 0.04 0.05 0.19 0.19 0.23 0.23 -26 % -1 % -1 %EPS, adj. 0.05 0.06 0.19 0.19 0.23 0.23 -22 % -1 % -1 %
2014E 2015E 2016E Change %
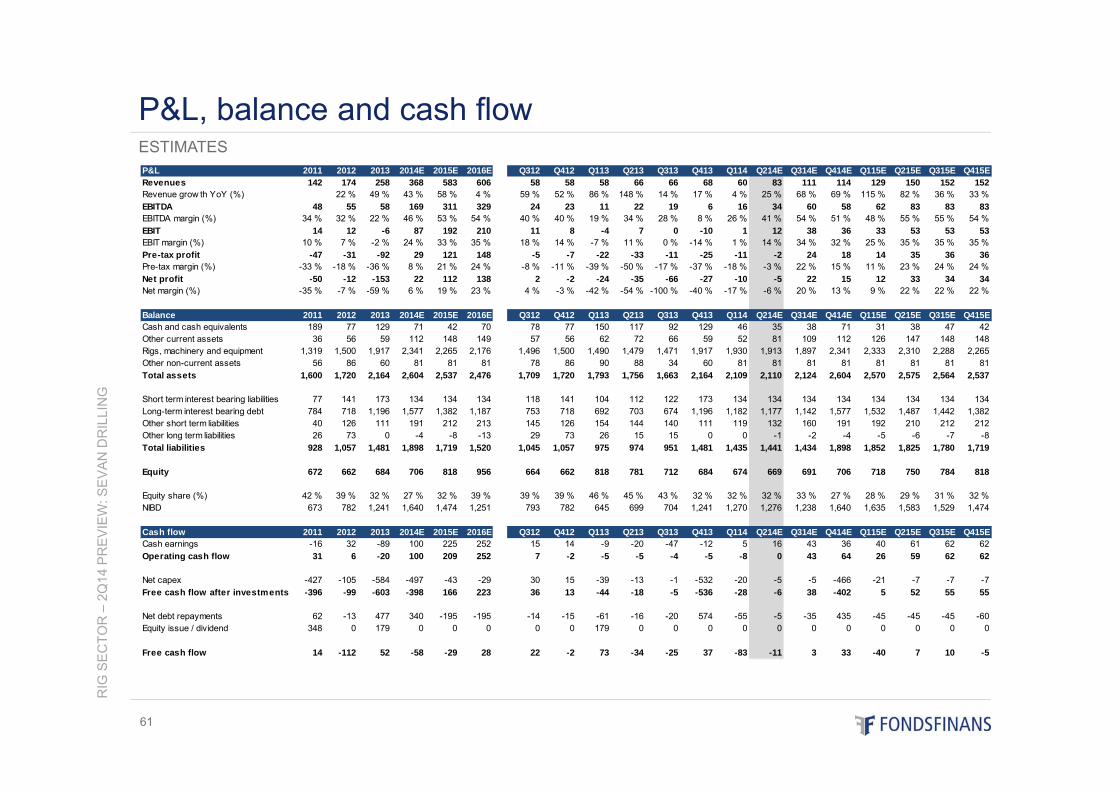
RIG
SE
CTO
R –
2Q14
PR
EV
IEW
: SE
VA
N D
RIL
LIN
G
61
ESTIMATES
P&L, balance and cash flow
P&L 2011 2012 2013 2014E 2015E 2016E Q312 Q412 Q113 Q213 Q313 Q413 Q114 Q214E Q314E Q414E Q115E Q215E Q315E Q415ERevenues 142 174 258 368 583 606 58 58 58 66 66 68 60 83 111 114 129 150 152 152Revenue grow th YoY (%) 22 % 49 % 43 % 58 % 4 % 59 % 52 % 86 % 148 % 14 % 17 % 4 % 25 % 68 % 69 % 115 % 82 % 36 % 33 %EBITDA 48 55 58 169 311 329 24 23 11 22 19 6 16 34 60 58 62 83 83 83EBITDA margin (%) 34 % 32 % 22 % 46 % 53 % 54 % 40 % 40 % 19 % 34 % 28 % 8 % 26 % 41 % 54 % 51 % 48 % 55 % 55 % 54 %EBIT 14 12 -6 87 192 210 11 8 -4 7 0 -10 1 12 38 36 33 53 53 53EBIT margin (%) 10 % 7 % -2 % 24 % 33 % 35 % 18 % 14 % -7 % 11 % 0 % -14 % 1 % 14 % 34 % 32 % 25 % 35 % 35 % 35 %Pre-tax profit -47 -31 -92 29 121 148 -5 -7 -22 -33 -11 -25 -11 -2 24 18 14 35 36 36Pre-tax margin (%) -33 % -18 % -36 % 8 % 21 % 24 % -8 % -11 % -39 % -50 % -17 % -37 % -18 % -3 % 22 % 15 % 11 % 23 % 24 % 24 %Net profit -50 -12 -153 22 112 138 2 -2 -24 -35 -66 -27 -10 -5 22 15 12 33 34 34Net margin (%) -35 % -7 % -59 % 6 % 19 % 23 % 4 % -3 % -42 % -54 % -100 % -40 % -17 % -6 % 20 % 13 % 9 % 22 % 22 % 22 %
Balance 2011 2012 2013 2014E 2015E 2016E Q312 Q412 Q113 Q213 Q313 Q413 Q114 Q214E Q314E Q414E Q115E Q215E Q315E Q415ECash and cash equivalents 189 77 129 71 42 70 78 77 150 117 92 129 46 35 38 71 31 38 47 42Other current assets 36 56 59 112 148 149 57 56 62 72 66 59 52 81 109 112 126 147 148 148Rigs, machinery and equipment 1,319 1,500 1,917 2,341 2,265 2,176 1,496 1,500 1,490 1,479 1,471 1,917 1,930 1,913 1,897 2,341 2,333 2,310 2,288 2,265Other non-current assets 56 86 60 81 81 81 78 86 90 88 34 60 81 81 81 81 81 81 81 81Total assets 1,600 1,720 2,164 2,604 2,537 2,476 1,709 1,720 1,793 1,756 1,663 2,164 2,109 2,110 2,124 2,604 2,570 2,575 2,564 2,537
Short term interest bearing liabilities 77 141 173 134 134 134 118 141 104 112 122 173 134 134 134 134 134 134 134 134Long-term interest bearing debt 784 718 1,196 1,577 1,382 1,187 753 718 692 703 674 1,196 1,182 1,177 1,142 1,577 1,532 1,487 1,442 1,382Other short term liabilities 40 126 111 191 212 213 145 126 154 144 140 111 119 132 160 191 192 210 212 212Other long term liabilities 26 73 0 -4 -8 -13 29 73 26 15 15 0 0 -1 -2 -4 -5 -6 -7 -8Total liabilities 928 1,057 1,481 1,898 1,719 1,520 1,045 1,057 975 974 951 1,481 1,435 1,441 1,434 1,898 1,852 1,825 1,780 1,719
Equity 672 662 684 706 818 956 664 662 818 781 712 684 674 669 691 706 718 750 784 818
Equity share (%) 42 % 39 % 32 % 27 % 32 % 39 % 39 % 39 % 46 % 45 % 43 % 32 % 32 % 32 % 33 % 27 % 28 % 29 % 31 % 32 %NIBD 673 782 1,241 1,640 1,474 1,251 793 782 645 699 704 1,241 1,270 1,276 1,238 1,640 1,635 1,583 1,529 1,474
Cash flow 2011 2012 2013 2014E 2015E 2016E Q312 Q412 Q113 Q213 Q313 Q413 Q114 Q214E Q314E Q414E Q115E Q215E Q315E Q415ECash earnings -16 32 -89 100 225 252 15 14 -9 -20 -47 -12 5 16 43 36 40 61 62 62Operating cash flow 31 6 -20 100 209 252 7 -2 -5 -5 -4 -5 -8 0 43 64 26 59 62 62
Net capex -427 -105 -584 -497 -43 -29 30 15 -39 -13 -1 -532 -20 -5 -5 -466 -21 -7 -7 -7Free cash flow after investments -396 -99 -603 -398 166 223 36 13 -44 -18 -5 -536 -28 -6 38 -402 5 52 55 55
Net debt repayments 62 -13 477 340 -195 -195 -14 -15 -61 -16 -20 574 -55 -5 -35 435 -45 -45 -45 -60Equity issue / dividend 348 0 179 0 0 0 0 0 179 0 0 0 0 0 0 0 0 0 0 0
Free cash flow 14 -112 52 -58 -29 28 22 -2 73 -34 -25 37 -83 -11 3 33 -40 7 10 -5
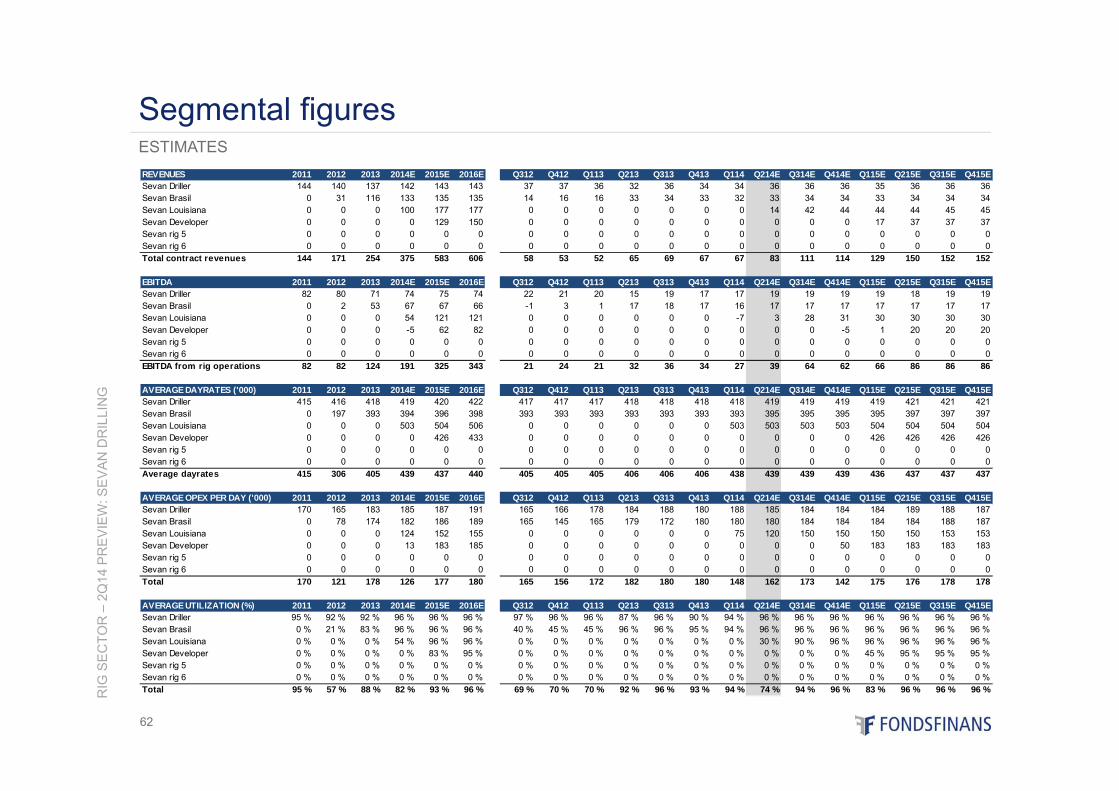
RIG
SE
CTO
R –
2Q14
PR
EV
IEW
: SE
VA
N D
RIL
LIN
G
62
ESTIMATES
Segmental figures
REVENUES 2011 2012 2013 2014E 2015E 2016E Q312 Q412 Q113 Q213 Q313 Q413 Q114 Q214E Q314E Q414E Q115E Q215E Q315E Q415ESevan Driller 144 140 137 142 143 143 37 37 36 32 36 34 34 36 36 36 35 36 36 36Sevan Brasil 0 31 116 133 135 135 14 16 16 33 34 33 32 33 34 34 33 34 34 34Sevan Louisiana 0 0 0 100 177 177 0 0 0 0 0 0 0 14 42 44 44 44 45 45Sevan Developer 0 0 0 0 129 150 0 0 0 0 0 0 0 0 0 0 17 37 37 37Sevan rig 5 0 0 0 0 0 0 0 0 0 0 0 0 0 0 0 0 0 0 0 0Sevan rig 6 0 0 0 0 0 0 0 0 0 0 0 0 0 0 0 0 0 0 0 0Total contract revenues 144 171 254 375 583 606 58 53 52 65 69 67 67 83 111 114 129 150 152 152
EBITDA 2011 2012 2013 2014E 2015E 2016E Q312 Q412 Q113 Q213 Q313 Q413 Q114 Q214E Q314E Q414E Q115E Q215E Q315E Q415ESevan Driller 82 80 71 74 75 74 22 21 20 15 19 17 17 19 19 19 19 18 19 19Sevan Brasil 0 2 53 67 67 66 -1 3 1 17 18 17 16 17 17 17 17 17 17 17Sevan Louisiana 0 0 0 54 121 121 0 0 0 0 0 0 -7 3 28 31 30 30 30 30Sevan Developer 0 0 0 -5 62 82 0 0 0 0 0 0 0 0 0 -5 1 20 20 20Sevan rig 5 0 0 0 0 0 0 0 0 0 0 0 0 0 0 0 0 0 0 0 0Sevan rig 6 0 0 0 0 0 0 0 0 0 0 0 0 0 0 0 0 0 0 0 0EBITDA from rig operations 82 82 124 191 325 343 21 24 21 32 36 34 27 39 64 62 66 86 86 86
AVERAGE DAYRATES ('000) 2011 2012 2013 2014E 2015E 2016E Q312 Q412 Q113 Q213 Q313 Q413 Q114 Q214E Q314E Q414E Q115E Q215E Q315E Q415ESevan Driller 415 416 418 419 420 422 417 417 417 418 418 418 418 419 419 419 419 421 421 421Sevan Brasil 0 197 393 394 396 398 393 393 393 393 393 393 393 395 395 395 395 397 397 397Sevan Louisiana 0 0 0 503 504 506 0 0 0 0 0 0 503 503 503 503 504 504 504 504Sevan Developer 0 0 0 0 426 433 0 0 0 0 0 0 0 0 0 0 426 426 426 426Sevan rig 5 0 0 0 0 0 0 0 0 0 0 0 0 0 0 0 0 0 0 0 0Sevan rig 6 0 0 0 0 0 0 0 0 0 0 0 0 0 0 0 0 0 0 0 0Average dayrates 415 306 405 439 437 440 405 405 405 406 406 406 438 439 439 439 436 437 437 437
AVERAGE OPEX PER DAY ('000) 2011 2012 2013 2014E 2015E 2016E Q312 Q412 Q113 Q213 Q313 Q413 Q114 Q214E Q314E Q414E Q115E Q215E Q315E Q415ESevan Driller 170 165 183 185 187 191 165 166 178 184 188 180 188 185 184 184 184 189 188 187Sevan Brasil 0 78 174 182 186 189 165 145 165 179 172 180 180 180 184 184 184 184 188 187Sevan Louisiana 0 0 0 124 152 155 0 0 0 0 0 0 75 120 150 150 150 150 153 153Sevan Developer 0 0 0 13 183 185 0 0 0 0 0 0 0 0 0 50 183 183 183 183Sevan rig 5 0 0 0 0 0 0 0 0 0 0 0 0 0 0 0 0 0 0 0 0Sevan rig 6 0 0 0 0 0 0 0 0 0 0 0 0 0 0 0 0 0 0 0 0Total 170 121 178 126 177 180 165 156 172 182 180 180 148 162 173 142 175 176 178 178
AVERAGE UTILIZATION (%) 2011 2012 2013 2014E 2015E 2016E Q312 Q412 Q113 Q213 Q313 Q413 Q114 Q214E Q314E Q414E Q115E Q215E Q315E Q415ESevan Driller 95 % 92 % 92 % 96 % 96 % 96 % 97 % 96 % 96 % 87 % 96 % 90 % 94 % 96 % 96 % 96 % 96 % 96 % 96 % 96 %Sevan Brasil 0 % 21 % 83 % 96 % 96 % 96 % 40 % 45 % 45 % 96 % 96 % 95 % 94 % 96 % 96 % 96 % 96 % 96 % 96 % 96 %Sevan Louisiana 0 % 0 % 0 % 54 % 96 % 96 % 0 % 0 % 0 % 0 % 0 % 0 % 0 % 30 % 90 % 96 % 96 % 96 % 96 % 96 %Sevan Developer 0 % 0 % 0 % 0 % 83 % 95 % 0 % 0 % 0 % 0 % 0 % 0 % 0 % 0 % 0 % 0 % 45 % 95 % 95 % 95 %Sevan rig 5 0 % 0 % 0 % 0 % 0 % 0 % 0 % 0 % 0 % 0 % 0 % 0 % 0 % 0 % 0 % 0 % 0 % 0 % 0 % 0 %Sevan rig 6 0 % 0 % 0 % 0 % 0 % 0 % 0 % 0 % 0 % 0 % 0 % 0 % 0 % 0 % 0 % 0 % 0 % 0 % 0 % 0 %Total 95 % 57 % 88 % 82 % 93 % 96 % 69 % 70 % 70 % 92 % 96 % 93 % 94 % 74 % 94 % 96 % 83 % 96 % 96 % 96 %
Recommendations: • Equity rating: NEUTRAL – Target price: NOK 2.40 (2.50)• Credit rating: BUY – Bond rating: B
SONGA – 1Q14 Update
Prepared by analyst: Ivar Andreas Lemmechen Gjul, Fondsfinans AS, tel: +47 23113024, e-mail: [email protected]
Valuation impacted by weaker NCS outlook
10-Jul-2014
63
This report was prepared by an analyst engaged by Fondsfinans AS, the Norwegian affiliate of Fondsfinans Inc., who is not registered as a research analyst with FINRA or subject to FINRA rules governing research. See page 71 -74 of this report for Important Disclosure Information.
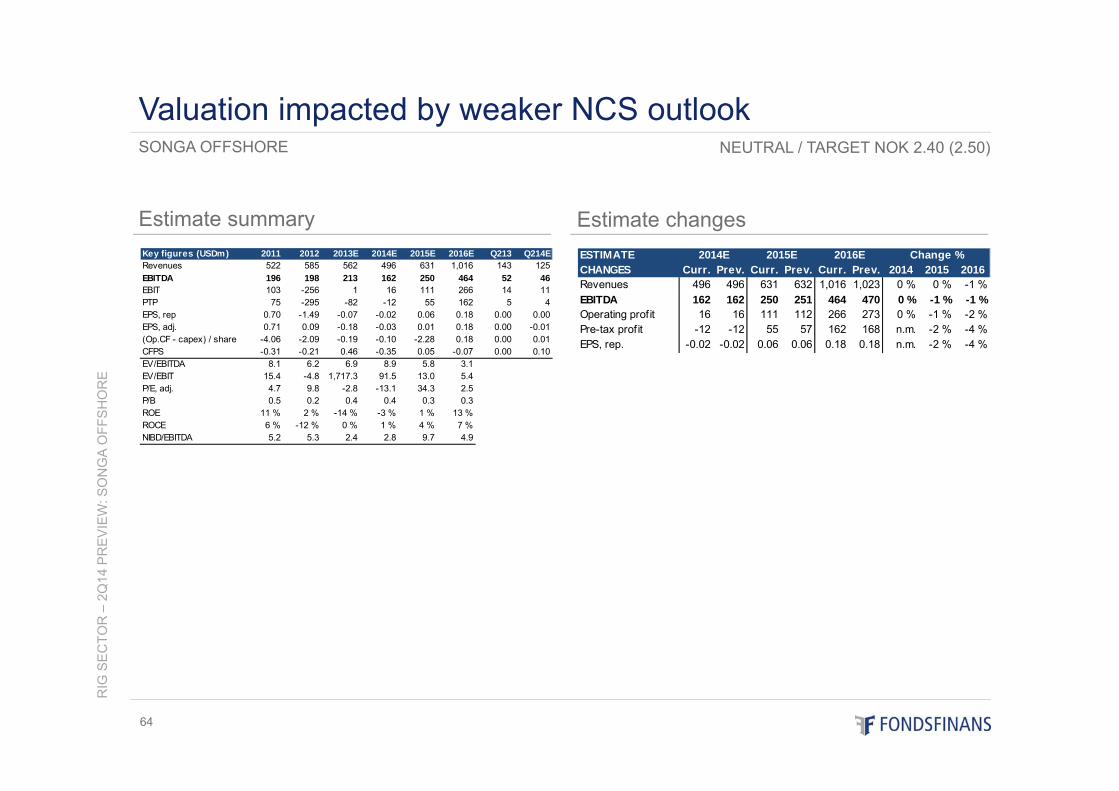
Estimate summary
RIG
SE
CTO
R –
2Q14
PR
EV
IEW
: SO
NG
A O
FFS
HO
RE
64
Estimate changes
SONGA OFFSHORE
Valuation impacted by weaker NCS outlookNEUTRAL / TARGET NOK 2.40 (2.50)
Key figures (USDm) 2011 2012 2013E 2014E 2015E 2016E Q213 Q214ERevenues 522 585 562 496 631 1,016 143 125EBITDA 196 198 213 162 250 464 52 46EBIT 103 -256 1 16 111 266 14 11PTP 75 -295 -82 -12 55 162 5 4EPS, rep 0.70 -1.49 -0.07 -0.02 0.06 0.18 0.00 0.00EPS, adj. 0.71 0.09 -0.18 -0.03 0.01 0.18 0.00 -0.01(Op.CF - capex) / share -4.06 -2.09 -0.19 -0.10 -2.28 0.18 0.00 0.01CFPS -0.31 -0.21 0.46 -0.35 0.05 -0.07 0.00 0.10EV/EBITDA 8.1 6.2 6.9 8.9 5.8 3.1EV/EBIT 15.4 -4.8 1,717.3 91.5 13.0 5.4P/E, adj. 4.7 9.8 -2.8 -13.1 34.3 2.5P/B 0.5 0.2 0.4 0.4 0.3 0.3ROE 11 % 2 % -14 % -3 % 1 % 13 %ROCE 6 % -12 % 0 % 1 % 4 % 7 %NIBD/EBITDA 5.2 5.3 2.4 2.8 9.7 4.9
ESTIMATECHANGES Curr. Prev. Curr. Prev. Curr. Prev. 2014 2015 2016Revenues 496 496 631 632 1,016 1,023 0 % 0 % -1 %EBITDA 162 162 250 251 464 470 0 % -1 % -1 %Operating profit 16 16 111 112 266 273 0 % -1 % -2 %Pre-tax profit -12 -12 55 57 162 168 n.m. -2 % -4 %EPS, rep. -0.02 -0.02 0.06 0.06 0.18 0.18 n.m. -2 % -4 %
2014E 2015E 2016E Change %
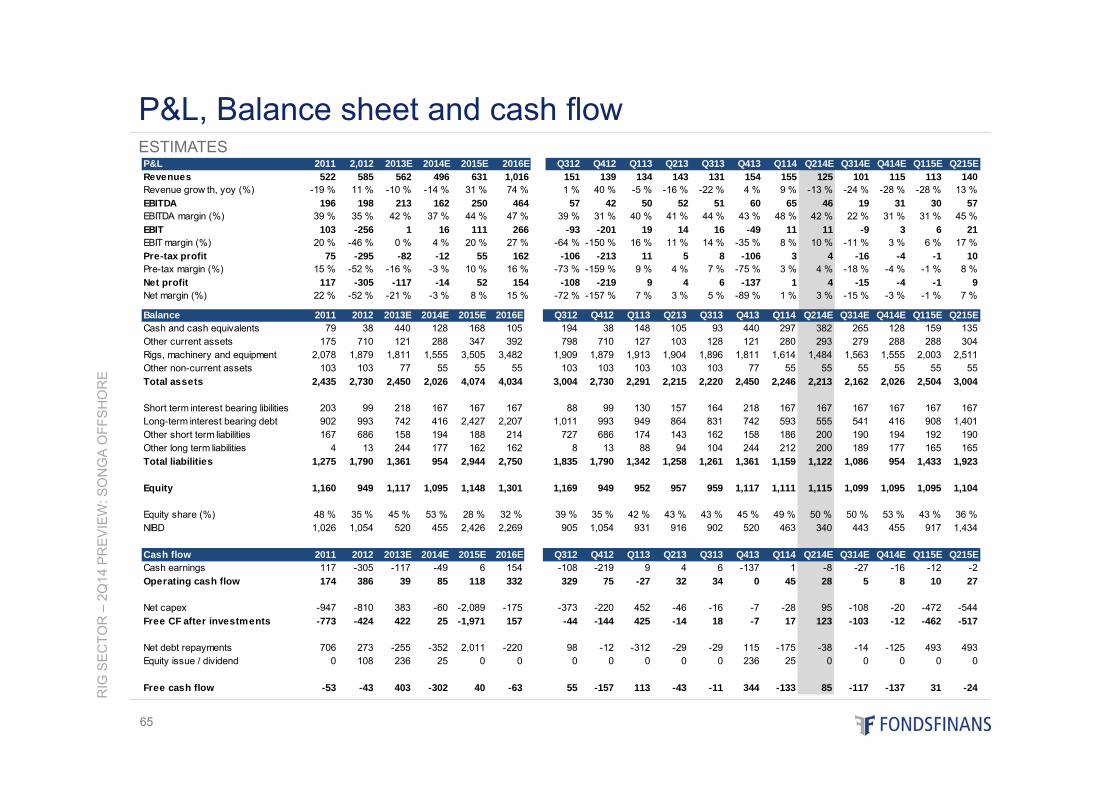
RIG
SE
CTO
R –
2Q14
PR
EV
IEW
: SO
NG
A O
FFS
HO
RE
65
ESTIMATES
P&L, Balance sheet and cash flowP&L 2011 2,012 2013E 2014E 2015E 2016E Q312 Q412 Q113 Q213 Q313 Q413 Q114 Q214E Q314E Q414E Q115E Q215ERevenues 522 585 562 496 631 1,016 151 139 134 143 131 154 155 125 101 115 113 140Revenue grow th, yoy (%) -19 % 11 % -10 % -14 % 31 % 74 % 1 % 40 % -5 % -16 % -22 % 4 % 9 % -13 % -24 % -28 % -28 % 13 %EBITDA 196 198 213 162 250 464 57 42 50 52 51 60 65 46 19 31 30 57EBITDA margin (%) 39 % 35 % 42 % 37 % 44 % 47 % 39 % 31 % 40 % 41 % 44 % 43 % 48 % 42 % 22 % 31 % 31 % 45 %EBIT 103 -256 1 16 111 266 -93 -201 19 14 16 -49 11 11 -9 3 6 21EBIT margin (%) 20 % -46 % 0 % 4 % 20 % 27 % -64 % -150 % 16 % 11 % 14 % -35 % 8 % 10 % -11 % 3 % 6 % 17 %Pre-tax profit 75 -295 -82 -12 55 162 -106 -213 11 5 8 -106 3 4 -16 -4 -1 10Pre-tax margin (%) 15 % -52 % -16 % -3 % 10 % 16 % -73 % -159 % 9 % 4 % 7 % -75 % 3 % 4 % -18 % -4 % -1 % 8 %Net profit 117 -305 -117 -14 52 154 -108 -219 9 4 6 -137 1 4 -15 -4 -1 9Net margin (%) 22 % -52 % -21 % -3 % 8 % 15 % -72 % -157 % 7 % 3 % 5 % -89 % 1 % 3 % -15 % -3 % -1 % 7 %
Balance 2011 2012 2013E 2014E 2015E 2016E Q312 Q412 Q113 Q213 Q313 Q413 Q114 Q214E Q314E Q414E Q115E Q215ECash and cash equivalents 79 38 440 128 168 105 194 38 148 105 93 440 297 382 265 128 159 135Other current assets 175 710 121 288 347 392 798 710 127 103 128 121 280 293 279 288 288 304Rigs, machinery and equipment 2,078 1,879 1,811 1,555 3,505 3,482 1,909 1,879 1,913 1,904 1,896 1,811 1,614 1,484 1,563 1,555 2,003 2,511Other non-current assets 103 103 77 55 55 55 103 103 103 103 103 77 55 55 55 55 55 55Total assets 2,435 2,730 2,450 2,026 4,074 4,034 3,004 2,730 2,291 2,215 2,220 2,450 2,246 2,213 2,162 2,026 2,504 3,004
Short term interest bearing libilities 203 99 218 167 167 167 88 99 130 157 164 218 167 167 167 167 167 167Long-term interest bearing debt 902 993 742 416 2,427 2,207 1,011 993 949 864 831 742 593 555 541 416 908 1,401Other short term liabilities 167 686 158 194 188 214 727 686 174 143 162 158 186 200 190 194 192 190Other long term liabilities 4 13 244 177 162 162 8 13 88 94 104 244 212 200 189 177 165 165Total liabilities 1,275 1,790 1,361 954 2,944 2,750 1,835 1,790 1,342 1,258 1,261 1,361 1,159 1,122 1,086 954 1,433 1,923
Equity 1,160 949 1,117 1,095 1,148 1,301 1,169 949 952 957 959 1,117 1,111 1,115 1,099 1,095 1,095 1,104
Equity share (%) 48 % 35 % 45 % 53 % 28 % 32 % 39 % 35 % 42 % 43 % 43 % 45 % 49 % 50 % 50 % 53 % 43 % 36 %NIBD 1,026 1,054 520 455 2,426 2,269 905 1,054 931 916 902 520 463 340 443 455 917 1,434
Cash flow 2011 2012 2013E 2014E 2015E 2016E Q312 Q412 Q113 Q213 Q313 Q413 Q114 Q214E Q314E Q414E Q115E Q215ECash earnings 117 -305 -117 -49 6 154 -108 -219 9 4 6 -137 1 -8 -27 -16 -12 -2Operating cash flow 174 386 39 85 118 332 329 75 -27 32 34 0 45 28 5 8 10 27
Net capex -947 -810 383 -60 -2,089 -175 -373 -220 452 -46 -16 -7 -28 95 -108 -20 -472 -544Free CF after investments -773 -424 422 25 -1,971 157 -44 -144 425 -14 18 -7 17 123 -103 -12 -462 -517
Net debt repayments 706 273 -255 -352 2,011 -220 98 -12 -312 -29 -29 115 -175 -38 -14 -125 493 493Equity issue / dividend 0 108 236 25 0 0 0 0 0 0 0 236 25 0 0 0 0 0
Free cash flow -53 -43 403 -302 40 -63 55 -157 113 -43 -11 344 -133 85 -117 -137 31 -24
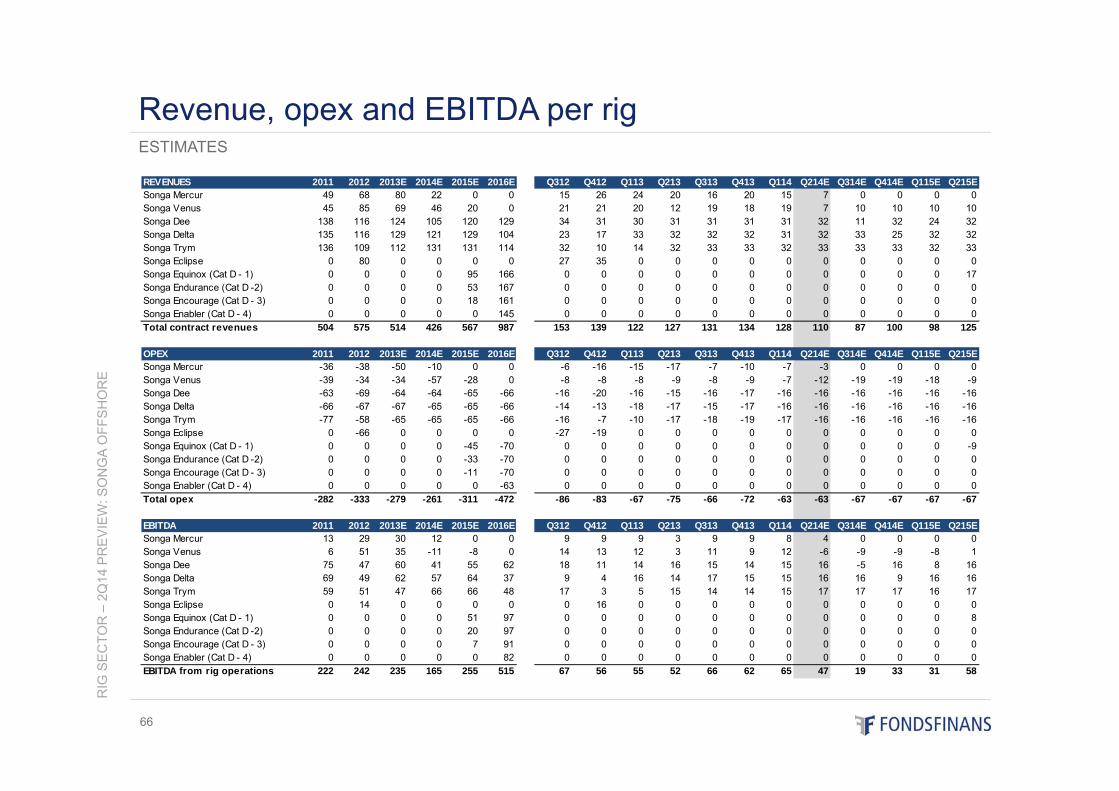
RIG
SE
CTO
R –
2Q14
PR
EV
IEW
: SO
NG
A O
FFS
HO
RE
66
Revenue, opex and EBITDA per rigESTIMATES
REVENUES 2011 2012 2013E 2014E 2015E 2016E Q312 Q412 Q113 Q213 Q313 Q413 Q114 Q214E Q314E Q414E Q115E Q215ESonga Mercur 49 68 80 22 0 0 15 26 24 20 16 20 15 7 0 0 0 0Songa Venus 45 85 69 46 20 0 21 21 20 12 19 18 19 7 10 10 10 10Songa Dee 138 116 124 105 120 129 34 31 30 31 31 31 31 32 11 32 24 32Songa Delta 135 116 129 121 129 104 23 17 33 32 32 32 31 32 33 25 32 32Songa Trym 136 109 112 131 131 114 32 10 14 32 33 33 32 33 33 33 32 33Songa Eclipse 0 80 0 0 0 0 27 35 0 0 0 0 0 0 0 0 0 0Songa Equinox (Cat D - 1) 0 0 0 0 95 166 0 0 0 0 0 0 0 0 0 0 0 17Songa Endurance (Cat D -2) 0 0 0 0 53 167 0 0 0 0 0 0 0 0 0 0 0 0Songa Encourage (Cat D - 3) 0 0 0 0 18 161 0 0 0 0 0 0 0 0 0 0 0 0Songa Enabler (Cat D - 4) 0 0 0 0 0 145 0 0 0 0 0 0 0 0 0 0 0 0Total contract revenues 504 575 514 426 567 987 153 139 122 127 131 134 128 110 87 100 98 125
OPEX 2011 2012 2013E 2014E 2015E 2016E Q312 Q412 Q113 Q213 Q313 Q413 Q114 Q214E Q314E Q414E Q115E Q215ESonga Mercur -36 -38 -50 -10 0 0 -6 -16 -15 -17 -7 -10 -7 -3 0 0 0 0Songa Venus -39 -34 -34 -57 -28 0 -8 -8 -8 -9 -8 -9 -7 -12 -19 -19 -18 -9Songa Dee -63 -69 -64 -64 -65 -66 -16 -20 -16 -15 -16 -17 -16 -16 -16 -16 -16 -16Songa Delta -66 -67 -67 -65 -65 -66 -14 -13 -18 -17 -15 -17 -16 -16 -16 -16 -16 -16Songa Trym -77 -58 -65 -65 -65 -66 -16 -7 -10 -17 -18 -19 -17 -16 -16 -16 -16 -16Songa Eclipse 0 -66 0 0 0 0 -27 -19 0 0 0 0 0 0 0 0 0 0Songa Equinox (Cat D - 1) 0 0 0 0 -45 -70 0 0 0 0 0 0 0 0 0 0 0 -9Songa Endurance (Cat D -2) 0 0 0 0 -33 -70 0 0 0 0 0 0 0 0 0 0 0 0Songa Encourage (Cat D - 3) 0 0 0 0 -11 -70 0 0 0 0 0 0 0 0 0 0 0 0Songa Enabler (Cat D - 4) 0 0 0 0 0 -63 0 0 0 0 0 0 0 0 0 0 0 0Total opex -282 -333 -279 -261 -311 -472 -86 -83 -67 -75 -66 -72 -63 -63 -67 -67 -67 -67
EBITDA 2011 2012 2013E 2014E 2015E 2016E Q312 Q412 Q113 Q213 Q313 Q413 Q114 Q214E Q314E Q414E Q115E Q215ESonga Mercur 13 29 30 12 0 0 9 9 9 3 9 9 8 4 0 0 0 0Songa Venus 6 51 35 -11 -8 0 14 13 12 3 11 9 12 -6 -9 -9 -8 1Songa Dee 75 47 60 41 55 62 18 11 14 16 15 14 15 16 -5 16 8 16Songa Delta 69 49 62 57 64 37 9 4 16 14 17 15 15 16 16 9 16 16Songa Trym 59 51 47 66 66 48 17 3 5 15 14 14 15 17 17 17 16 17Songa Eclipse 0 14 0 0 0 0 0 16 0 0 0 0 0 0 0 0 0 0Songa Equinox (Cat D - 1) 0 0 0 0 51 97 0 0 0 0 0 0 0 0 0 0 0 8Songa Endurance (Cat D -2) 0 0 0 0 20 97 0 0 0 0 0 0 0 0 0 0 0 0Songa Encourage (Cat D - 3) 0 0 0 0 7 91 0 0 0 0 0 0 0 0 0 0 0 0Songa Enabler (Cat D - 4) 0 0 0 0 0 82 0 0 0 0 0 0 0 0 0 0 0 0EBITDA from rig operations 222 242 235 165 255 515 67 56 55 52 66 62 65 47 19 33 31 58
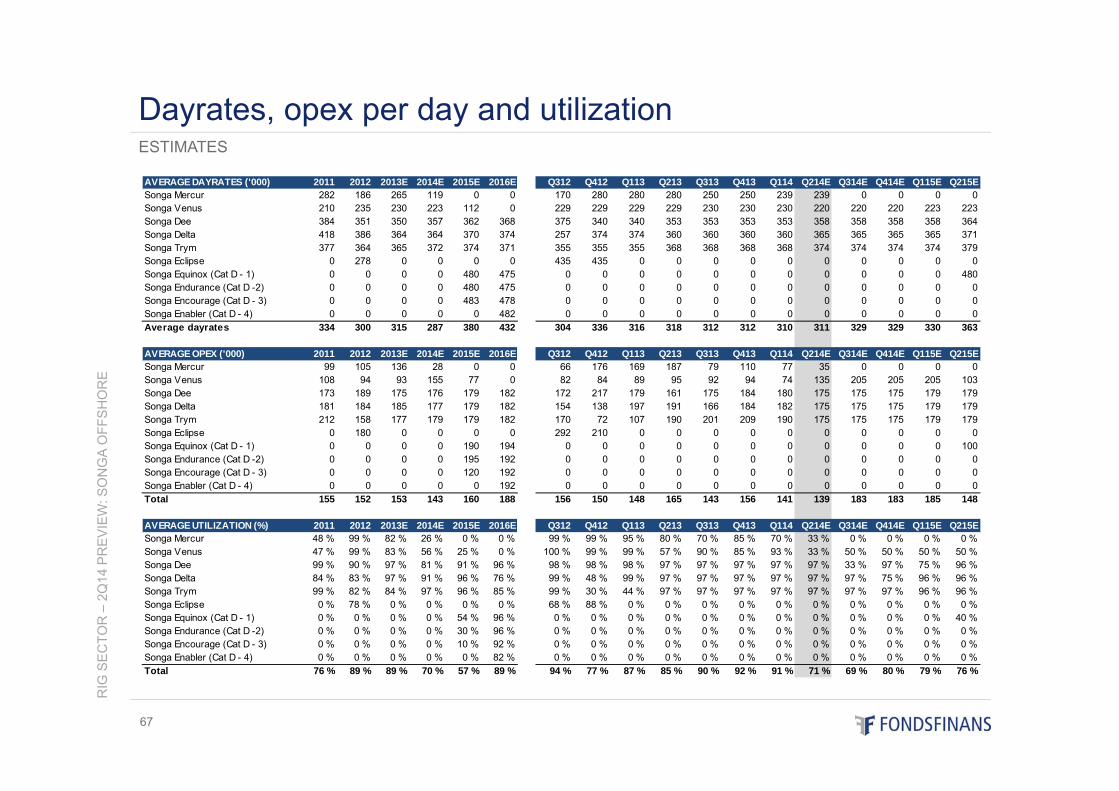
RIG
SE
CTO
R –
2Q14
PR
EV
IEW
: SO
NG
A O
FFS
HO
RE
67
ESTIMATES
Dayrates, opex per day and utilization
AVERAGE DAYRATES ('000) 2011 2012 2013E 2014E 2015E 2016E Q312 Q412 Q113 Q213 Q313 Q413 Q114 Q214E Q314E Q414E Q115E Q215ESonga Mercur 282 186 265 119 0 0 170 280 280 280 250 250 239 239 0 0 0 0Songa Venus 210 235 230 223 112 0 229 229 229 229 230 230 230 220 220 220 223 223Songa Dee 384 351 350 357 362 368 375 340 340 353 353 353 353 358 358 358 358 364Songa Delta 418 386 364 364 370 374 257 374 374 360 360 360 360 365 365 365 365 371Songa Trym 377 364 365 372 374 371 355 355 355 368 368 368 368 374 374 374 374 379Songa Eclipse 0 278 0 0 0 0 435 435 0 0 0 0 0 0 0 0 0 0Songa Equinox (Cat D - 1) 0 0 0 0 480 475 0 0 0 0 0 0 0 0 0 0 0 480Songa Endurance (Cat D -2) 0 0 0 0 480 475 0 0 0 0 0 0 0 0 0 0 0 0Songa Encourage (Cat D - 3) 0 0 0 0 483 478 0 0 0 0 0 0 0 0 0 0 0 0Songa Enabler (Cat D - 4) 0 0 0 0 0 482 0 0 0 0 0 0 0 0 0 0 0 0Average dayrates 334 300 315 287 380 432 304 336 316 318 312 312 310 311 329 329 330 363
AVERAGE OPEX ('000) 2011 2012 2013E 2014E 2015E 2016E Q312 Q412 Q113 Q213 Q313 Q413 Q114 Q214E Q314E Q414E Q115E Q215ESonga Mercur 99 105 136 28 0 0 66 176 169 187 79 110 77 35 0 0 0 0Songa Venus 108 94 93 155 77 0 82 84 89 95 92 94 74 135 205 205 205 103Songa Dee 173 189 175 176 179 182 172 217 179 161 175 184 180 175 175 175 179 179Songa Delta 181 184 185 177 179 182 154 138 197 191 166 184 182 175 175 175 179 179Songa Trym 212 158 177 179 179 182 170 72 107 190 201 209 190 175 175 175 179 179Songa Eclipse 0 180 0 0 0 0 292 210 0 0 0 0 0 0 0 0 0 0Songa Equinox (Cat D - 1) 0 0 0 0 190 194 0 0 0 0 0 0 0 0 0 0 0 100Songa Endurance (Cat D -2) 0 0 0 0 195 192 0 0 0 0 0 0 0 0 0 0 0 0Songa Encourage (Cat D - 3) 0 0 0 0 120 192 0 0 0 0 0 0 0 0 0 0 0 0Songa Enabler (Cat D - 4) 0 0 0 0 0 192 0 0 0 0 0 0 0 0 0 0 0 0Total 155 152 153 143 160 188 156 150 148 165 143 156 141 139 183 183 185 148
AVERAGE UTILIZATION (%) 2011 2012 2013E 2014E 2015E 2016E Q312 Q412 Q113 Q213 Q313 Q413 Q114 Q214E Q314E Q414E Q115E Q215ESonga Mercur 48 % 99 % 82 % 26 % 0 % 0 % 99 % 99 % 95 % 80 % 70 % 85 % 70 % 33 % 0 % 0 % 0 % 0 %Songa Venus 47 % 99 % 83 % 56 % 25 % 0 % 100 % 99 % 99 % 57 % 90 % 85 % 93 % 33 % 50 % 50 % 50 % 50 %Songa Dee 99 % 90 % 97 % 81 % 91 % 96 % 98 % 98 % 98 % 97 % 97 % 97 % 97 % 97 % 33 % 97 % 75 % 96 %Songa Delta 84 % 83 % 97 % 91 % 96 % 76 % 99 % 48 % 99 % 97 % 97 % 97 % 97 % 97 % 97 % 75 % 96 % 96 %Songa Trym 99 % 82 % 84 % 97 % 96 % 85 % 99 % 30 % 44 % 97 % 97 % 97 % 97 % 97 % 97 % 97 % 96 % 96 %Songa Eclipse 0 % 78 % 0 % 0 % 0 % 0 % 68 % 88 % 0 % 0 % 0 % 0 % 0 % 0 % 0 % 0 % 0 % 0 %Songa Equinox (Cat D - 1) 0 % 0 % 0 % 0 % 54 % 96 % 0 % 0 % 0 % 0 % 0 % 0 % 0 % 0 % 0 % 0 % 0 % 40 %Songa Endurance (Cat D -2) 0 % 0 % 0 % 0 % 30 % 96 % 0 % 0 % 0 % 0 % 0 % 0 % 0 % 0 % 0 % 0 % 0 % 0 %Songa Encourage (Cat D - 3) 0 % 0 % 0 % 0 % 10 % 92 % 0 % 0 % 0 % 0 % 0 % 0 % 0 % 0 % 0 % 0 % 0 % 0 %Songa Enabler (Cat D - 4) 0 % 0 % 0 % 0 % 0 % 82 % 0 % 0 % 0 % 0 % 0 % 0 % 0 % 0 % 0 % 0 % 0 % 0 %Total 76 % 89 % 89 % 70 % 57 % 89 % 94 % 77 % 87 % 85 % 90 % 92 % 91 % 71 % 69 % 80 % 79 % 76 %
Market recommendations ........................................................... Page 02Market appendix ......................................................................... Page 21Company presentations ............................................................. Page 30
- Awilco Drilling .................................................................................................. Page 31
- Fred. Olsen Energy ......................................................................................... Page 35
- Ocean Rig ....................................................................................................... Page 40
- Odfjell Drilling .................................................................................................. Page 45
- Pacific Drilling ..................................................................................................Page 50
- Seadrill ............................................................................................................ Page 55
- Sevan Drilling .................................................................................................. Page 60
- Songa Offshore ............................................................................................... Page 64
Risk assessment ........................................................................ Page 69Disclaimer .................................................................................. Page 71
RIG
SE
CTO
R –
2Q14
PR
EV
IEW
68
Table of content
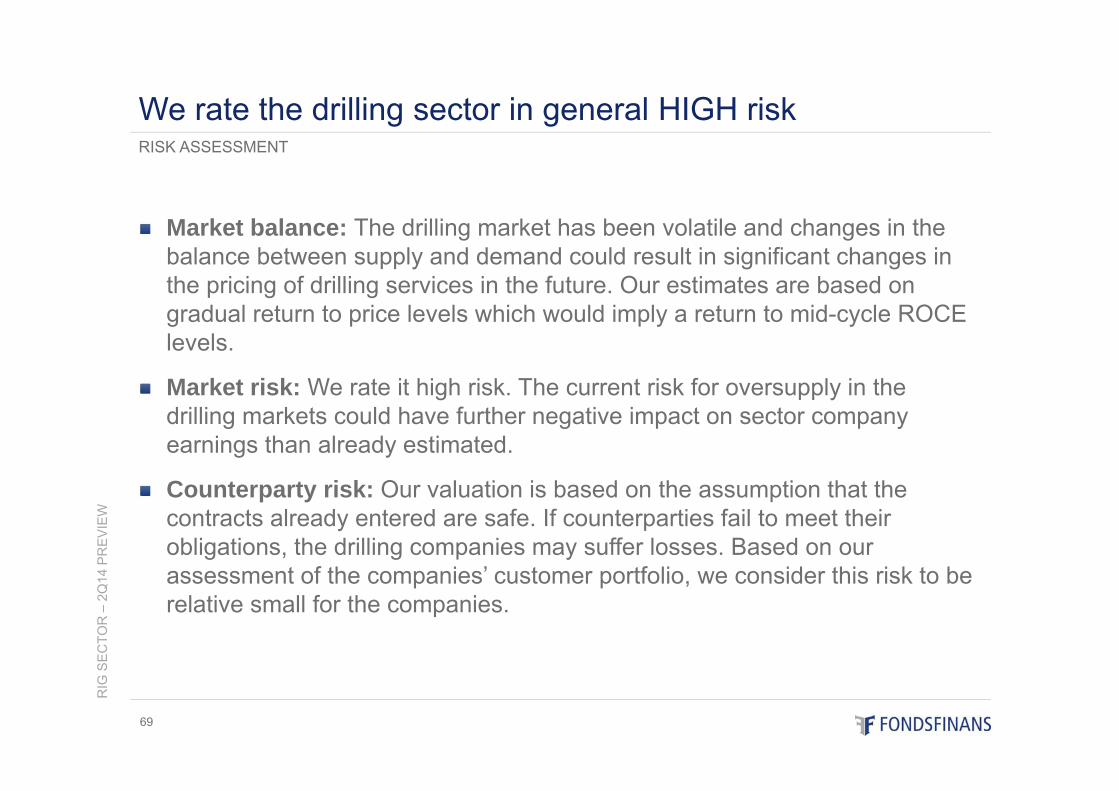
RIG
SE
CTO
R –
2Q14
PR
EV
IEW
69
RISK ASSESSMENT
We rate the drilling sector in general HIGH risk
Market balance: The drilling market has been volatile and changes in the balance between supply and demand could result in significant changes in the pricing of drilling services in the future. Our estimates are based on gradual return to price levels which would imply a return to mid-cycle ROCE levels.
Market risk: We rate it high risk. The current risk for oversupply in the drilling markets could have further negative impact on sector company earnings than already estimated.
Counterparty risk: Our valuation is based on the assumption that the contracts already entered are safe. If counterparties fail to meet their obligations, the drilling companies may suffer losses. Based on our assessment of the companies’ customer portfolio, we consider this risk to be relative small for the companies.
Market recommendations ........................................................... Page 02Market appendix ......................................................................... Page 21Company presentations ............................................................. Page 30
- Awilco Drilling .................................................................................................. Page 31
- Fred. Olsen Energy ......................................................................................... Page 35
- Ocean Rig ....................................................................................................... Page 40
- Odfjell Drilling .................................................................................................. Page 45
- Pacific Drilling ..................................................................................................Page 50
- Seadrill ............................................................................................................ Page 55
- Sevan Drilling .................................................................................................. Page 60
- Songa Offshore ............................................................................................... Page 64
Risk assessment ........................................................................ Page 69Disclaimer .................................................................................. Page 71
RIG
SE
CTO
R –
2Q14
PR
EV
IEW
70
Table of content
DisclaimerOur research and general presentations, also available at our websitewww.fondsfinans.no, are provided for information purposes only. They shouldnot be used or considered as an offer to sell or a solicitation of an offer to buyany financial instruments. Any opinion expressed are subject to change withoutprior notice. Our research and presentations are based on information fromvarious sources believed to be reliable. Although all reasonable care has beentaken to ensure that the information herein is not misleading Fondsfinans ASmakes no representation or warranty expressed or implied as to its accuracy orcompleteness.
Neither Fondsfinans AS, its partners and employees, nor any other personconnected with our research and presentations, accept any liability whatsoeverfor any direct or consequential loss of any kind arising out of the use or relianceon the information given. They do not take into account the specific investmentobjectives and financial situation of any recipient. Investors seeking to buy orsell any financial instruments discussed or recommended in our research or inseparate presentations, should seek independent financial advice relatingthereto. Our research and materials from separate presentations may not bedistributed, quoted from or reproduced for any purpose without written approvalby Fondsfinans AS.
Disclosure of interestsFondsfinans AS is constantly seeking investment-banking mandates, and mayat any time perform investment banking or other services or solicit investmentbanking or other mandates from companies covered in our analysis andpresentations. Fondsfinans AS may from time to time as part of its investmentservices hold positions in securities covered in our research and presentations.In order to avoid any conflict of interests Fondsfinans AS and its employees willalways follow very strictly all internal regulations , recommendations from theNorwegian securities dealers association and relevant legislation andregulations from the supervisory official authorities. Internal holdings will bespecified as part of shareholder information.
Distribution in the United StatesResearch reports are prepared by Fondsfinans AS for information purposesonly. Fondsfinans AS and its employees are not subject to the rules of theFinancial Industry Regulatory Authority (FINRA) governing research analystconflicts. The research reports are intended for distribution in the United Statessolely to “major U.S. institutional investors” as defined in rule 15a-6 under theUnited States securities exchange act of 1934, as amended and may not befurnished to any other person in the United States. Each major U.S. institutionalinvestor that receives a copy of a Fondsfinans AS research report by itsacceptance thereof represents and agrees that it shall not distribute or providecopies to any other person. Reports are prepared by Fondsfinans AS anddistributed to major U.S. institutional investors under rule 15a-6(a)(2). Theseresearch reports are prepared by Fondsfinans AS and distributed in the UnitedStates by Fondsfinans Inc. Under rule 15a-6(a)(2). any U.S. Person receivingthese reports that desires to effect transactions in any securities discussedwithin the report should call or write Fondsfinans Inc., a member of FINRA.
71
Our intention is to issue preview and update research on a quarterly basis.Our investment recommendation is elaborated in accordance with “The NorwegianSecurities Dealers Associations” standards.This report has not been sent to the company for correction of any factual errors.Fondsfinans is organized with Chinese walls between the Corporate Department andthe Research/Broking Department. In addition, Fondsfinans has internal instructionsand guidelines for handling sensitive information.
The analyst receives compensation that is impacted by overall firm profitability, includinginvestment banking activities.
Fondsfinans is under supervision of The Financial Supervisory Authority of Norway.
Ownership per 09.07.2014 in Awilco Driling:Analyst (including his/her closely related persons or companies):0, corresponding to 0% of the company share capitalEmployees (including their respective closely related persons or companies):0, corresponding to 0% of the company share capitalGroup Fondsfinans (including the holdings of its Chairman, his spouse and their closelyrelated companies, Erik Must AS and its 100% controlled subsidiaries):0, corresponding to 0% of the company share capitalFondsfinans is not acting as market maker in Awilco Drilling. Fondsfinans has not actedas corporate adviser, lead manager in IPO etc. during the past 12 months.The recommendation has not been changed (SELL). The previous recommendationwas issued 15.05.2014.
Definitions of ratingsBuy Low risk: with a potential of min 5%. Medium risk: with a potential of min 10%.
High risk: with a potential of min 20%.Neutral Low risk: -5% to +5%. Medium risk: -10% to +10%. High risk: -20% to +20%.Sell Low risk: min 5%. Medium risk: min 10%. High risk: min 20%.Risk ratings are based on price volatility, fundamental criteria and perceived risk. Ratingsare: Low (L), Medium (M) and High (H).Target: Our valuation as of today.Time frame of target: Target is what we value the share as of today.Recommendation distribution as of 09.07.14:
Recommendation No Percent Recommendation No PercentBuy 44 67 % Buy 1 2 %Neutral 18 27 % Neutral 1 6 %Sell 4 6 % Sell 0 0 %Total 66 100 % Total 2
Companies in each recommendation category that have been investment banking clients over the past 12 months:
DisclaimerOur research and general presentations, also available at our websitewww.fondsfinans.no, are provided for information purposes only. They shouldnot be used or considered as an offer to sell or a solicitation of an offer to buyany financial instruments. Any opinion expressed are subject to change withoutprior notice. Our research and presentations are based on information fromvarious sources believed to be reliable. Although all reasonable care has beentaken to ensure that the information herein is not misleading Fondsfinans ASmakes no representation or warranty expressed or implied as to its accuracy orcompleteness.
Neither Fondsfinans AS, its partners and employees, nor any other personconnected with our research and presentations, accept any liability whatsoeverfor any direct or consequential loss of any kind arising out of the use or relianceon the information given. They do not take into account the specific investmentobjectives and financial situation of any recipient. Investors seeking to buy orsell any financial instruments discussed or recommended in our research or inseparate presentations, should seek independent financial advice relatingthereto. Our research and materials from separate presentations may not bedistributed, quoted from or reproduced for any purpose without written approvalby Fondsfinans AS.
Disclosure of interestsFondsfinans AS is constantly seeking investment-banking mandates, and mayat any time perform investment banking or other services or solicit investmentbanking or other mandates from companies covered in our analysis andpresentations. Fondsfinans AS may from time to time as part of its investmentservices hold positions in securities covered in our research and presentations.In order to avoid any conflict of interests Fondsfinans AS and its employees willalways follow very strictly all internal regulations , recommendations from theNorwegian securities dealers association and relevant legislation andregulations from the supervisory official authorities. Internal holdings will bespecified as part of shareholder information.
Distribution in the United StatesResearch reports are prepared by Fondsfinans AS for information purposesonly. Fondsfinans AS and its employees are not subject to the rules of theFinancial Industry Regulatory Authority (FINRA) governing research analystconflicts. The research reports are intended for distribution in the United Statessolely to “major U.S. institutional investors” as defined in rule 15a-6 under theUnited States securities exchange act of 1934, as amended and may not befurnished to any other person in the United States. Each major U.S. institutionalinvestor that receives a copy of a Fondsfinans AS research report by itsacceptance thereof represents and agrees that it shall not distribute or providecopies to any other person. Reports are prepared by Fondsfinans AS anddistributed to major U.S. institutional investors under rule 15a-6(a)(2). Theseresearch reports are prepared by Fondsfinans AS and distributed in the UnitedStates by Fondsfinans Inc. Under rule 15a-6(a)(2). any U.S. Person receivingthese reports that desires to effect transactions in any securities discussedwithin the report should call or write Fondsfinans Inc., a member of FINRA.
72
Ownership per 09.07.14 in Odfjell Drilling:Analyst (including his/her closely related persons or companies):0, corresponding to 0% of the company share capitalEmployees (including their respective closely related persons or companies):0, corresponding to 0% of the company share capitalGroup Fondsfinans (including the holdings of its Chairman, his spouse and their closelyrelated companies, Erik Must AS and its 100% controlled subsidiaries):0, corresponding to 0% of the company share capital.Fondsfinans is not acting as market maker in Odfjell Drilling.Fondsfinans has not acted as corporate adviser, lead manager in IPO etc. during thepast 12 months.The recommendation has not been changed (BUY). The previous recommendation wasissued 26.05.2014.
Ownership per 09.07.14 in Fred. Olsen Energy:Analyst (including his/her closely related persons or companies):0, corresponding to 0% of the company share capitalEmployees (including their respective closely related persons or companies):0, corresponding to 0% of the company share capitalGroup Fondsfinans (including the holdings of its Chairman, his spouse and their closelyrelated companies, Erik Must AS and its 100% controlled subsidiaries):0, corresponding to 0% of the company share capitalFondsfinans is not acting as market maker in Fred. Olsen Energy.Fondsfinans has not acted as corporate adviser, lead manager in IPO etc. during thepast 12 months.The recommendation has not been changed (SELL). The previous recommendationwas issued 08.05.2014.
Ownership per 09.07.14 in Ocean Rig:Analyst (including his/her closely related persons or companies):0, corresponding to 0% of the company share capitalEmployees (including their respective closely related persons or companies):0, corresponding to 0% of the company share capitalGroup Fondsfinans (including the holdings of its Chairman, his spouse and theirclosely related companies, Erik Must AS and its 100% controlled subsidiaries):0, corresponding to 0% of the company share capital.Fondsfinans is not acting as market maker in Ocean Rig.Fondsfinans has not acted as corporate adviser, lead manager in IPO etc. during thepast 12 months.The recommendation has not been changed (NEUTRAL). The previousrecommendation was issued 28.05.2014.
DisclaimerOur research and general presentations, also available at our websitewww.fondsfinans.no, are provided for information purposes only. They shouldnot be used or considered as an offer to sell or a solicitation of an offer to buyany financial instruments. Any opinion expressed are subject to change withoutprior notice. Our research and presentations are based on information fromvarious sources believed to be reliable. Although all reasonable care has beentaken to ensure that the information herein is not misleading Fondsfinans ASmakes no representation or warranty expressed or implied as to its accuracy orcompleteness.
Neither Fondsfinans AS, its partners and employees, nor any other personconnected with our research and presentations, accept any liability whatsoeverfor any direct or consequential loss of any kind arising out of the use or relianceon the information given. They do not take into account the specific investmentobjectives and financial situation of any recipient. Investors seeking to buy orsell any financial instruments discussed or recommended in our research or inseparate presentations, should seek independent financial advice relatingthereto. Our research and materials from separate presentations may not bedistributed, quoted from or reproduced for any purpose without written approvalby Fondsfinans AS.
Disclosure of interestsFondsfinans AS is constantly seeking investment-banking mandates, and mayat any time perform investment banking or other services or solicit investmentbanking or other mandates from companies covered in our analysis andpresentations. Fondsfinans AS may from time to time as part of its investmentservices hold positions in securities covered in our research and presentations.In order to avoid any conflict of interests Fondsfinans AS and its employees willalways follow very strictly all internal regulations , recommendations from theNorwegian securities dealers association and relevant legislation andregulations from the supervisory official authorities. Internal holdings will bespecified as part of shareholder information.
Distribution in the United StatesResearch reports are prepared by Fondsfinans AS for information purposesonly. Fondsfinans AS and its employees are not subject to the rules of theFinancial Industry Regulatory Authority (FINRA) governing research analystconflicts. The research reports are intended for distribution in the United Statessolely to “major U.S. institutional investors” as defined in rule 15a-6 under theUnited States securities exchange act of 1934, as amended and may not befurnished to any other person in the United States. Each major U.S. institutionalinvestor that receives a copy of a Fondsfinans AS research report by itsacceptance thereof represents and agrees that it shall not distribute or providecopies to any other person. Reports are prepared by Fondsfinans AS anddistributed to major U.S. institutional investors under rule 15a-6(a)(2). Theseresearch reports are prepared by Fondsfinans AS and distributed in the UnitedStates by Fondsfinans Inc. Under rule 15a-6(a)(2). any U.S. Person receivingthese reports that desires to effect transactions in any securities discussedwithin the report should call or write Fondsfinans Inc., a member of FINRA.
73
Ownership per 09.07.14 in Pacific Drilling:Analyst (including his/her closely related persons or companies):0, corresponding to 0% of the company share capitalEmployees (including their respective closely related persons or companies):0, corresponding to 0% of the company share capitalGroup Fondsfinans (including the holdings of its Chairman, his spouse and theirclosely related companies, Erik Must AS and its 100% controlled subsidiaries):0, corresponding to 0% of the company share capitalFondsfinans is not acting as market maker in Pacific Drilling.Fondsfinans has not acted as corporate adviser, lead manager in IPO etc. duringthe past 12 months.The recommendation has not been changed (NEUTRAL). The previousrecommendation was issued 07.05.2014.
Ownership per 09.07.14 in SeadrillAnalyst (including his/her closely related persons or companies):0, corresponding to 0% of the company share capitalEmployees (including their respective closely related persons or companies):0, corresponding to 0% of the company share capitalGroup Fondsfinans (including the holdings of its Chairman, his spouse and theirclosely related companies, Erik Must AS and its 100% controlled subsidiaries):0, corresponding to 0% of the company share capitalFondsfinans is not acting as market maker in Seadrill.Fondsfinans has not acted as corporate adviser, lead manager in IPO etc. duringthe past 12 monthsThe recommendation has been changed to NEUTRAL from BUY. The previousrecommendation was issued 30.05.2014.
Ownership per 09.07.14 in Sevan Drilling:Analyst (including his/her closely related persons or companies):0, corresponding to 0% of the company share capitalEmployees (including their respective closely related persons or companies):0, corresponding to 0% of the company share capitalGroup Fondsfinans (including the holdings of its Chairman, his spouse and theirclosely related companies, Erik Must AS and its 100% controlled subsidiaries):0, corresponding to 0% of the company share capitalFondsfinans is not acting as market maker in Sevan Drilling.Fondsfinans has acted as corporate adviser, lead manager in IPO etc. during thepast 12 months.The recommendation has not been changed (NEUTRAL). The previousrecommendation was issued 30.05.2014..
DisclaimerOur research and general presentations, also available at our websitewww.fondsfinans.no, are provided for information purposes only. They shouldnot be used or considered as an offer to sell or a solicitation of an offer to buyany financial instruments. Any opinion expressed are subject to change withoutprior notice. Our research and presentations are based on information fromvarious sources believed to be reliable. Although all reasonable care has beentaken to ensure that the information herein is not misleading Fondsfinans ASmakes no representation or warranty expressed or implied as to its accuracy orcompleteness.
Neither Fondsfinans AS, its partners and employees, nor any other personconnected with our research and presentations, accept any liability whatsoeverfor any direct or consequential loss of any kind arising out of the use or relianceon the information given. They do not take into account the specific investmentobjectives and financial situation of any recipient. Investors seeking to buy orsell any financial instruments discussed or recommended in our research or inseparate presentations, should seek independent financial advice relatingthereto. Our research and materials from separate presentations may not bedistributed, quoted from or reproduced for any purpose without written approvalby Fondsfinans AS.
Disclosure of interestsFondsfinans AS is constantly seeking investment-banking mandates, and mayat any time perform investment banking or other services or solicit investmentbanking or other mandates from companies covered in our analysis andpresentations. Fondsfinans AS may from time to time as part of its investmentservices hold positions in securities covered in our research and presentations.In order to avoid any conflict of interests Fondsfinans AS and its employees willalways follow very strictly all internal regulations , recommendations from theNorwegian securities dealers association and relevant legislation andregulations from the supervisory official authorities. Internal holdings will bespecified as part of shareholder information.
Distribution in the United StatesResearch reports are prepared by Fondsfinans AS for information purposesonly. Fondsfinans AS and its employees are not subject to the rules of theFinancial Industry Regulatory Authority (FINRA) governing research analystconflicts. The research reports are intended for distribution in the United Statessolely to “major U.S. institutional investors” as defined in rule 15a-6 under theUnited States securities exchange act of 1934, as amended and may not befurnished to any other person in the United States. Each major U.S. institutionalinvestor that receives a copy of a Fondsfinans AS research report by itsacceptance thereof represents and agrees that it shall not distribute or providecopies to any other person. Reports are prepared by Fondsfinans AS anddistributed to major U.S. institutional investors under rule 15a-6(a)(2). Theseresearch reports are prepared by Fondsfinans AS and distributed in the UnitedStates by Fondsfinans Inc. Under rule 15a-6(a)(2). any U.S. Person receivingthese reports that desires to effect transactions in any securities discussedwithin the report should call or write Fondsfinans Inc., a member of FINRA.
74
Ownership per 09.07.14 in Songa Offshore:Analyst (including his/her closely related persons or companies):0, corresponding to 0% of the company share capitalEmployees (including their respective closely related persons or companies):0, corresponding to 0% of the company share capitalGroup Fondsfinans (including the holdings of its Chairman, his spouse and theirclosely related companies, Erik Must AS and its 100% controlled subsidiaries):0, corresponding to 0% of the company share capital.Fondsfinans is not acting as market maker in Songa Offshore.Fondsfinans has not acted as corporate adviser, lead manager in IPO etc. duringthe past 12 months.The recommendation has not been changed (NEUTRAL). The previousrecommendation was issued 18.02.2014.
Fondsfinans may hold shares in this companies as a result of daily trading/marketmaking. Information on such holdings is not given when of non-significant value.
This report was issued and distributed 09.07.14.


![Drilling Deeper: Charting Upwards · 2017. 7. 6. · Drilling Deeper: Charting Upwards 7/6/2017 2:58:41 PM] will link the Hobbs-to-China Draw line to the](https://img.pdfslide.us/doc/110x75/604efb6544ccfc563c756e54/drilling-deeper-charting-2017-7-6-drilling-deeper-charting-upwards-762017.jpg)