Embed Size (px)
Citation preview
Shelf Drilling Investor PresentationJanuary 2020
2Jan 2020 |
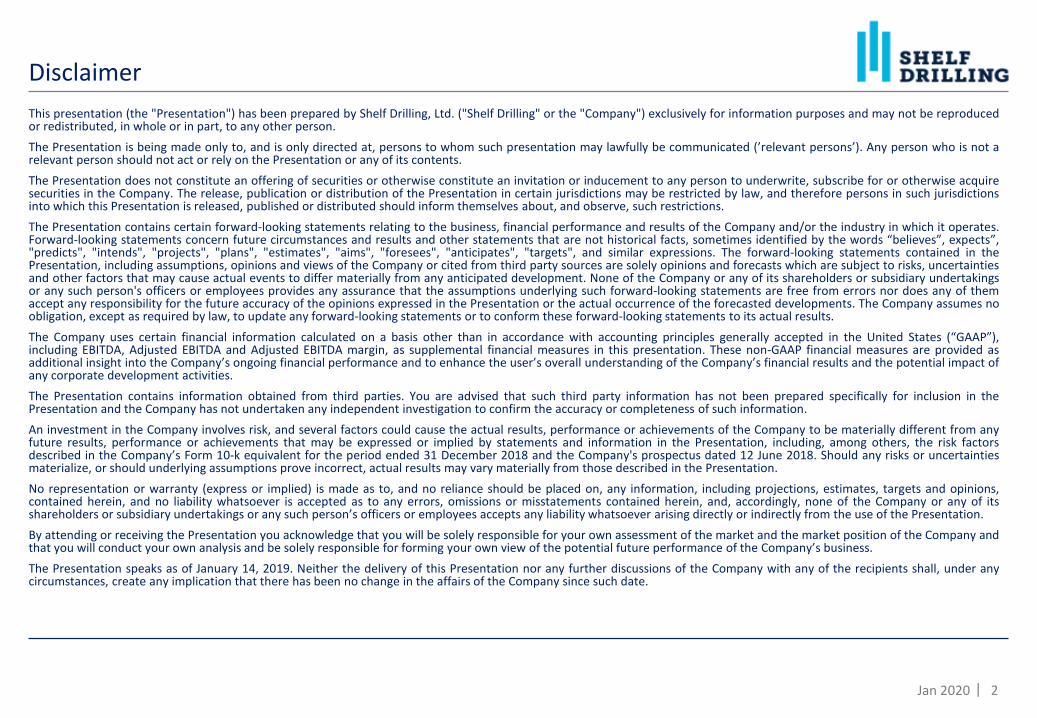
Disclaimer
This presentation (the "Presentation") has been prepared by Shelf Drilling, Ltd. ("Shelf Drilling" or the "Company") exclusively for information purposes and may not be reproducedor redistributed, in whole or in part, to any other person.
The Presentation is being made only to, and is only directed at, persons to whom such presentation may lawfully be communicated (’relevant persons’). Any person who is not arelevant person should not act or rely on the Presentation or any of its contents.
The Presentation does not constitute an offering of securities or otherwise constitute an invitation or inducement to any person to underwrite, subscribe for or otherwise acquiresecurities in the Company. The release, publication or distribution of the Presentation in certain jurisdictions may be restricted by law, and therefore persons in such jurisdictionsinto which this Presentation is released, published or distributed should inform themselves about, and observe, such restrictions.
The Presentation contains certain forward-looking statements relating to the business, financial performance and results of the Company and/or the industry in which it operates.Forward-looking statements concern future circumstances and results and other statements that are not historical facts, sometimes identified by the words “believes”, expects”,"predicts", "intends", "projects", "plans", "estimates", "aims", "foresees", "anticipates", "targets", and similar expressions. The forward-looking statements contained in thePresentation, including assumptions, opinions and views of the Company or cited from third party sources are solely opinions and forecasts which are subject to risks, uncertaintiesand other factors that may cause actual events to differ materially from any anticipated development. None of the Company or any of its shareholders or subsidiary undertakingsor any such person's officers or employees provides any assurance that the assumptions underlying such forward-looking statements are free from errors nor does any of themaccept any responsibility for the future accuracy of the opinions expressed in the Presentation or the actual occurrence of the forecasted developments. The Company assumes noobligation, except as required by law, to update any forward-looking statements or to conform these forward-looking statements to its actual results.
The Company uses certain financial information calculated on a basis other than in accordance with accounting principles generally accepted in the United States (“GAAP”),including EBITDA, Adjusted EBITDA and Adjusted EBITDA margin, as supplemental financial measures in this presentation. These non-GAAP financial measures are provided asadditional insight into the Company’s ongoing financial performance and to enhance the user’s overall understanding of the Company’s financial results and the potential impact ofany corporate development activities.
The Presentation contains information obtained from third parties. You are advised that such third party information has not been prepared specifically for inclusion in thePresentation and the Company has not undertaken any independent investigation to confirm the accuracy or completeness of such information.
An investment in the Company involves risk, and several factors could cause the actual results, performance or achievements of the Company to be materially different from anyfuture results, performance or achievements that may be expressed or implied by statements and information in the Presentation, including, among others, the risk factorsdescribed in the Company’s Form 10-k equivalent for the period ended 31 December 2018 and the Company's prospectus dated 12 June 2018. Should any risks or uncertaintiesmaterialize, or should underlying assumptions prove incorrect, actual results may vary materially from those described in the Presentation.
No representation or warranty (express or implied) is made as to, and no reliance should be placed on, any information, including projections, estimates, targets and opinions,contained herein, and no liability whatsoever is accepted as to any errors, omissions or misstatements contained herein, and, accordingly, none of the Company or any of itsshareholders or subsidiary undertakings or any such person’s officers or employees accepts any liability whatsoever arising directly or indirectly from the use of the Presentation.
By attending or receiving the Presentation you acknowledge that you will be solely responsible for your own assessment of the market and the market position of the Company andthat you will conduct your own analysis and be solely responsible for forming your own view of the potential future performance of the Company’s business.
The Presentation speaks as of January 14, 2019. Neither the delivery of this Presentation nor any further discussions of the Company with any of the recipients shall, under anycircumstances, create any implication that there has been no change in the affairs of the Company since such date.
3Jan 2020 |
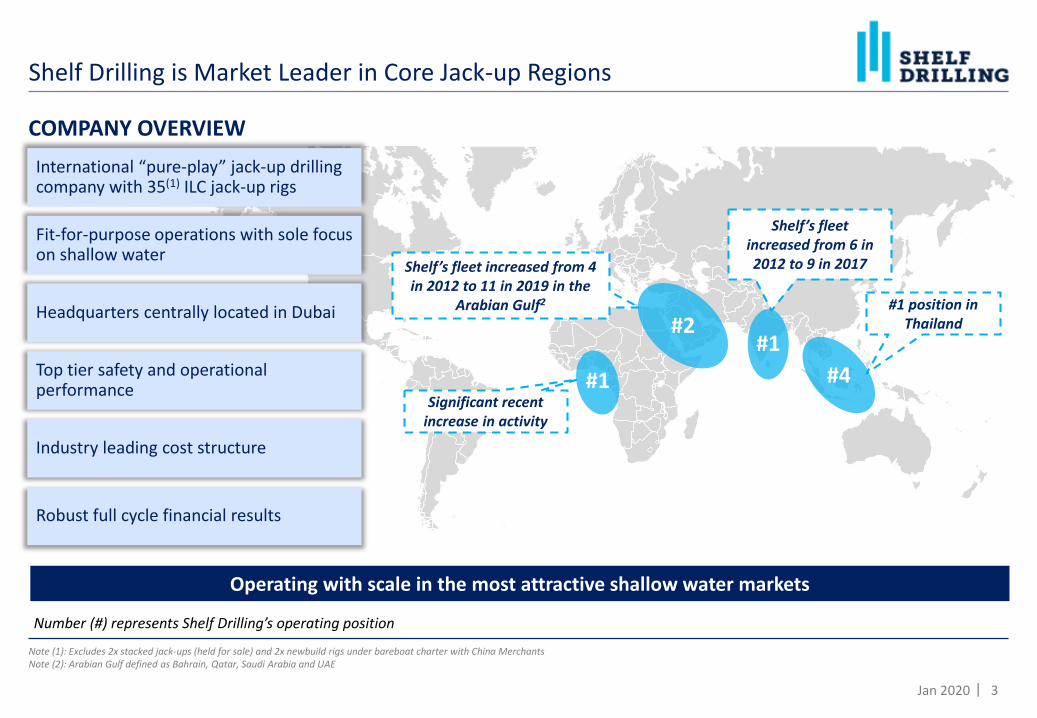
Shelf Drilling is Market Leader in Core Jack-up Regions
Note (1): Excludes 2x stacked jack-ups (held for sale) and 2x newbuild rigs under bareboat charter with China MerchantsNote (2): Arabian Gulf defined as Bahrain, Qatar, Saudi Arabia and UAE
Shelf’s fleet increased from 6 in 2012 to 9 in 2017Shelf’s fleet increased from 4
in 2012 to 11 in 2019 in the Arabian Gulf2
#2#1
#4#1Significant recent
increase in activity
#1 position in Thailand
Number (#) represents Shelf Drilling’s operating position
Operating with scale in the most attractive shallow water markets
International “pure-play” jack-up drilling company with 35(1) ILC jack-up rigs
Fit-for-purpose operations with sole focus on shallow water
Headquarters centrally located in Dubai
Top tier safety and operational performance
Industry leading cost structure
Robust full cycle financial results
COMPANY OVERVIEW
4Jan 2020 |
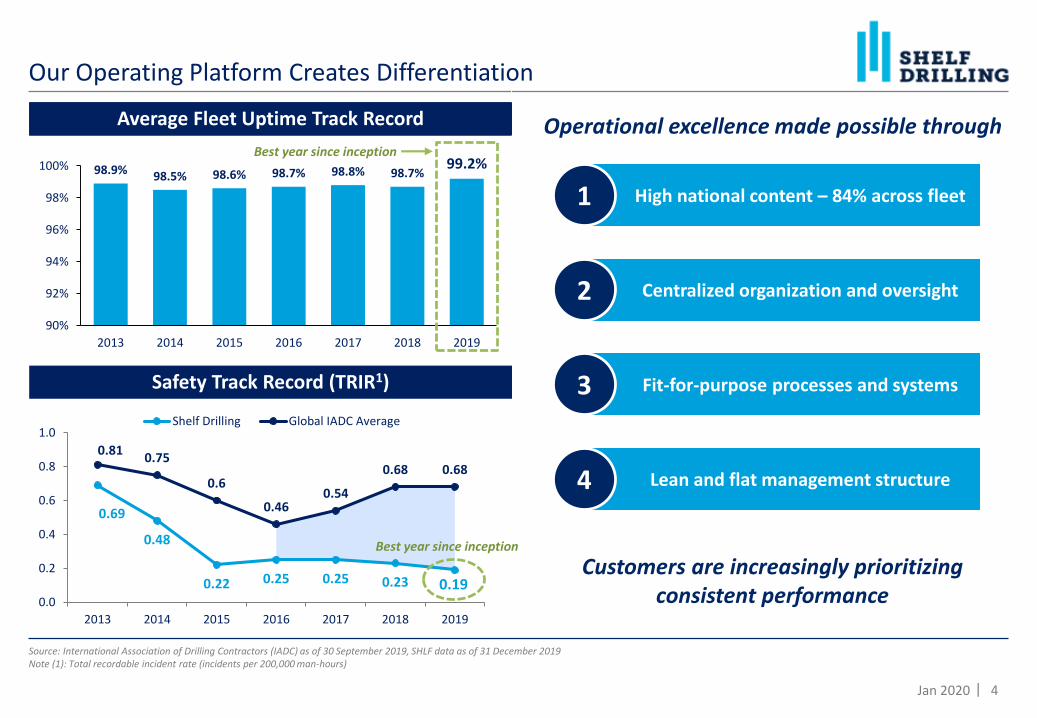
Our Operating Platform Creates Differentiation
Average Fleet Uptime Track Record
Safety Track Record (TRIR1)
Source: International Association of Drilling Contractors (IADC) as of 30 September 2019, SHLF data as of 31 December 2019Note (1): Total recordable incident rate (incidents per 200,000 man-hours)
Operational excellence made possible throughAverage Fleet Uptime Track Record
High national content – 84% across fleet1
Centralized organization and oversight2
Fit-for-purpose processes and systems3
Lean and flat management structure 4
98.9% 98.5% 98.6% 98.7% 98.8% 98.7%99.2%
90%
92%
94%
96%
98%
100%
2013 2014 2015 2016 2017 2018 2019
0.69
0.48
0.22 0.25 0.25 0.23 0.19
0.810.75
0.6
0.460.54
0.68 0.68
0.0
0.2
0.4
0.6
0.8
1.0
2013 2014 2015 2016 2017 2018 2019
Shelf Drilling Global IADC Average
Best year since inception
Best year since inception
Customers are increasingly prioritizing consistent performance
5Jan 2020 |
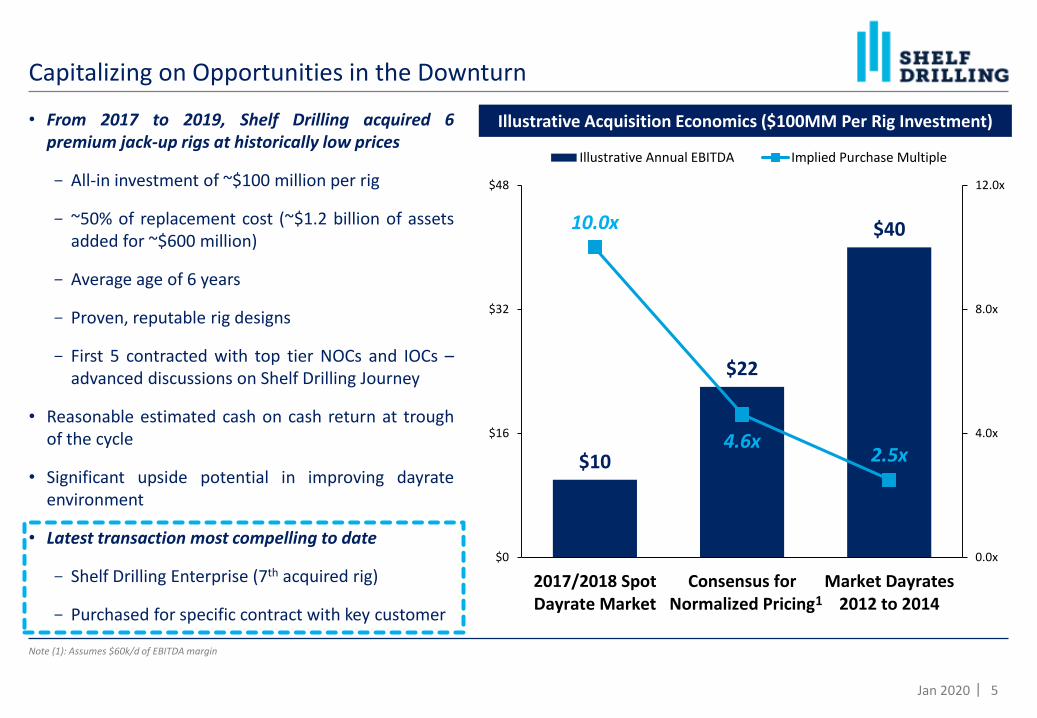
$10
$22
$4010.0x
4.6x2.5x
0.0x
4.0x
8.0x
12.0x
$0
$16
$32
$48
2017/2018 SpotDayrate Market
Consensus forNormalized Pricing
Market Dayrates2012 to 2014
Illustrative Annual EBITDA Implied Purchase Multiple
• From 2017 to 2019, Shelf Drilling acquired 6premium jack-up rigs at historically low prices
- All-in investment of ~$100 million per rig
- ~50% of replacement cost (~$1.2 billion of assetsadded for ~$600 million)
- Average age of 6 years
- Proven, reputable rig designs
- First 5 contracted with top tier NOCs and IOCs –advanced discussions on Shelf Drilling Journey
• Reasonable estimated cash on cash return at troughof the cycle
• Significant upside potential in improving dayrateenvironment
• Latest transaction most compelling to date
- Shelf Drilling Enterprise (7th acquired rig)
- Purchased for specific contract with key customer
Capitalizing on Opportunities in the Downturn
Note (1): Assumes $60k/d of EBITDA margin
Illustrative Acquisition Economics ($100MM Per Rig Investment)
1
6Jan 2020 |
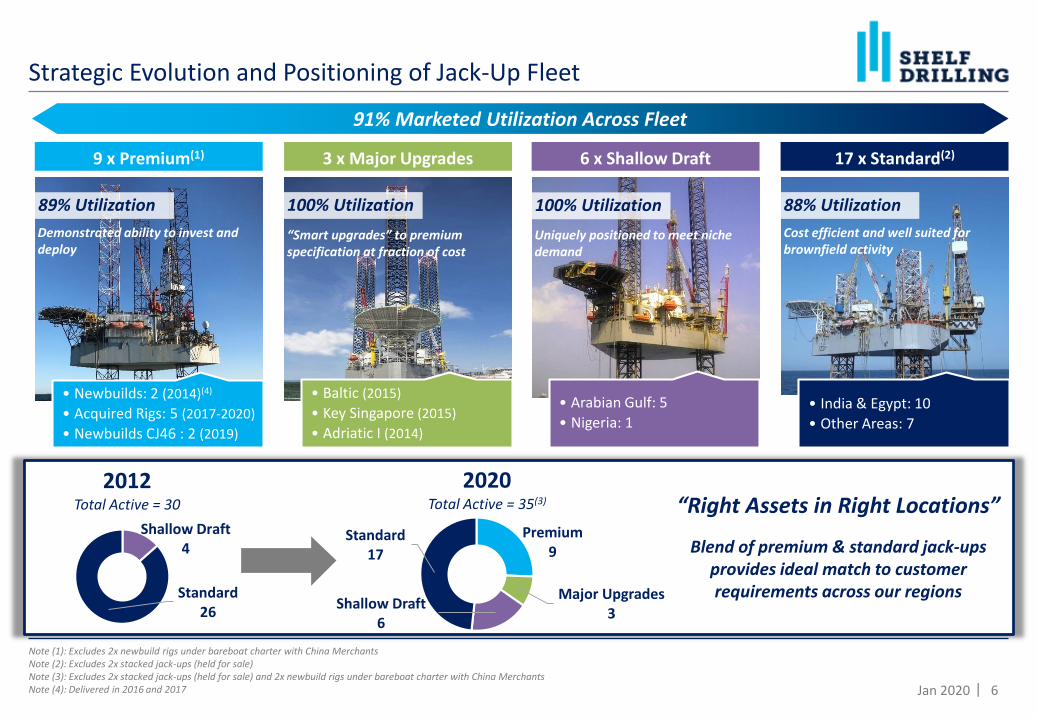
6 x Shallow Draft
• Arabian Gulf: 5
• Nigeria: 1
Uniquely positioned to meet niche demand
100% Utilization
Strategic Evolution and Positioning of Jack-Up Fleet
Note (1): Excludes 2x newbuild rigs under bareboat charter with China MerchantsNote (2): Excludes 2x stacked jack-ups (held for sale)Note (3): Excludes 2x stacked jack-ups (held for sale) and 2x newbuild rigs under bareboat charter with China MerchantsNote (4): Delivered in 2016 and 2017
Premium9
Major Upgrades3
Shallow Draft6
Standard17
2020Total Active = 35(3)
Shallow Draft4
Standard26
2012Total Active = 30 “Right Assets in Right Locations”
Blend of premium & standard jack-ups provides ideal match to customer requirements across our regions
9 x Premium(1)
• Newbuilds: 2 (2014)(4)
• Acquired Rigs: 5 (2017-2020)
• Newbuilds CJ46 : 2 (2019)
89% Utilization
Demonstrated ability to invest and deploy
100% Utilization
3 x Major Upgrades
• Baltic (2015)
• Key Singapore (2015)
• Adriatic I (2014)
“Smart upgrades” to premium specification at fraction of cost
88% Utilization
17 x Standard(2)
• India & Egypt: 10
• Other Areas: 7
Cost efficient and well suited for brownfield activity
91% Marketed Utilization Across Fleet
7Jan 2020 |
$0
$10
$20
$30
$40
$50
$60
$70
$80
$90
$100
Jan-16 Apr-16 Jul-16 Oct-16 Jan-17 Apr-17 Jul-17 Oct-17 Jan-18 Apr-18 Jul-18 Oct-18 Jan-19 Apr-19 Jul-19 Oct-19 Jan-20
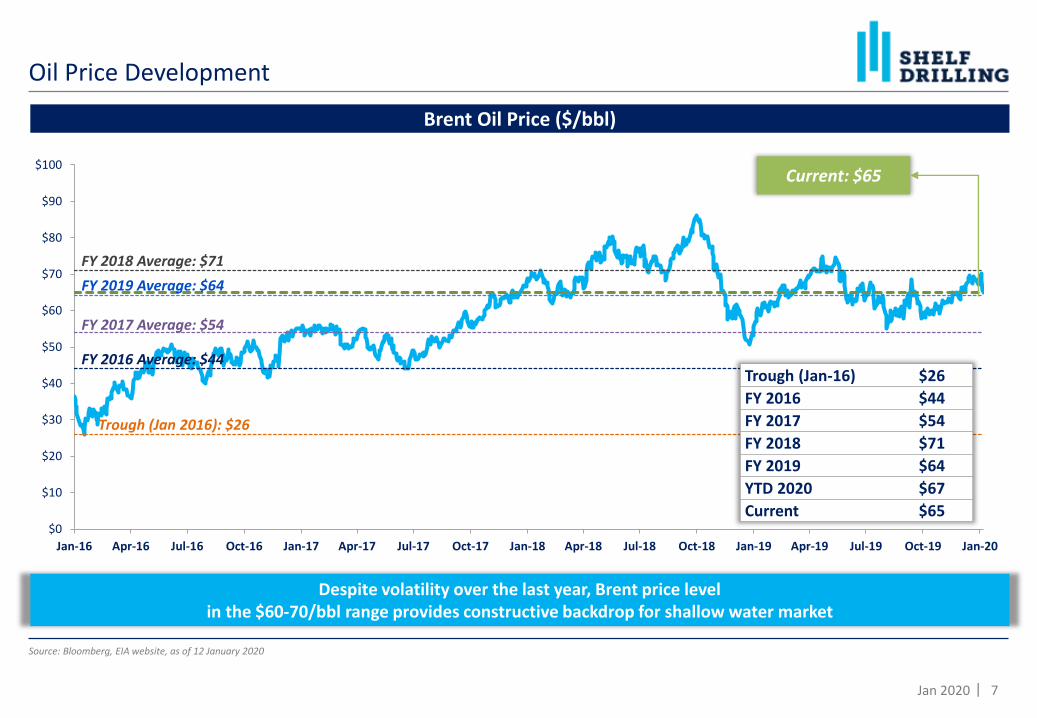
Oil Price Development
Source: Bloomberg, EIA website, as of 12 January 2020
Brent Oil Price ($/bbl)
Trough (Jan-16) $26
FY 2016 $44
FY 2017 $54
FY 2018 $71
FY 2019 $64
YTD 2020 $67
Current $65
Trough (Jan 2016): $26
FY 2018 Average: $71
FY 2016 Average: $44
FY 2017 Average: $54
Current: $65
Despite volatility over the last year, Brent price level in the $60-70/bbl range provides constructive backdrop for shallow water market
FY 2019 Average: $64
8Jan 2020 |
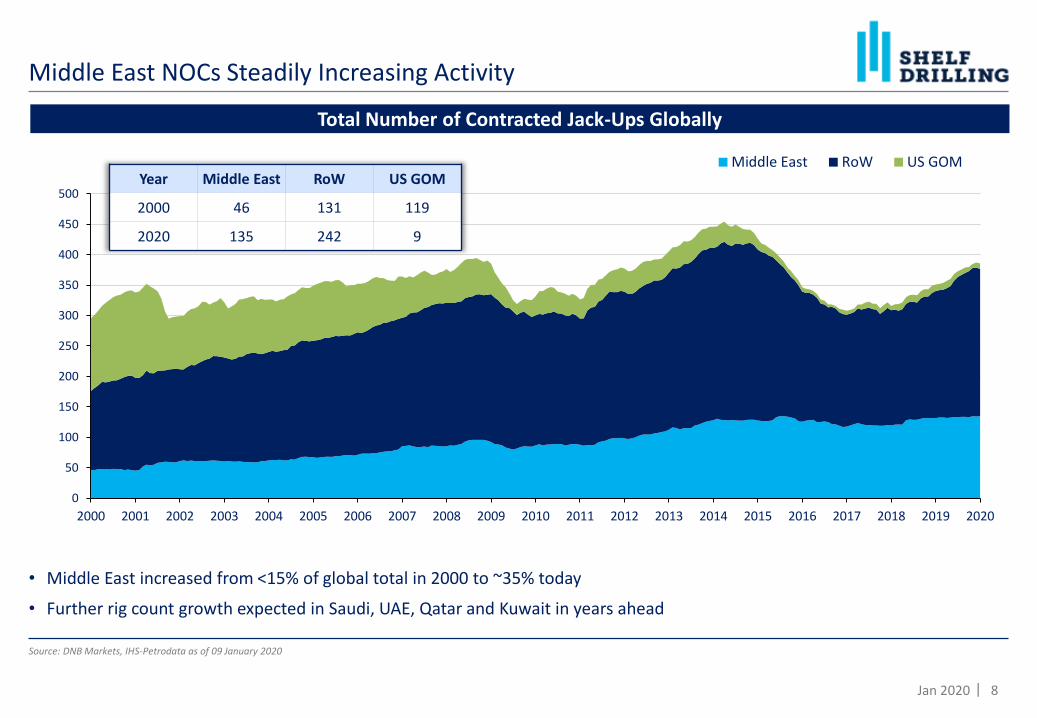
• Middle East increased from <15% of global total in 2000 to ~35% today
• Further rig count growth expected in Saudi, UAE, Qatar and Kuwait in years ahead
Middle East NOCs Steadily Increasing Activity
Source: DNB Markets, IHS-Petrodata as of 09 January 2020
Total Number of Contracted Jack-Ups Globally
0
50
100
150
200
250
300
350
400
450
500
2000 2001 2002 2003 2004 2005 2006 2007 2008 2009 2010 2011 2012 2013 2014 2015 2016 2017 2018 2019 2020
Middle East RoW US GOMYear Middle East RoW US GOM
2000 46 131 119
2020 135 242 9
9Jan 2020 |
60%
65%
70%
75%
80%
85%
90%
280
300
320
340
360
380
400
Jan-17 Jul-17 Jan-18 Jul-18 Jan-19 Jul-19 Jan-20
Hu
nd
red
sMarketed Contracted Marketed Util %
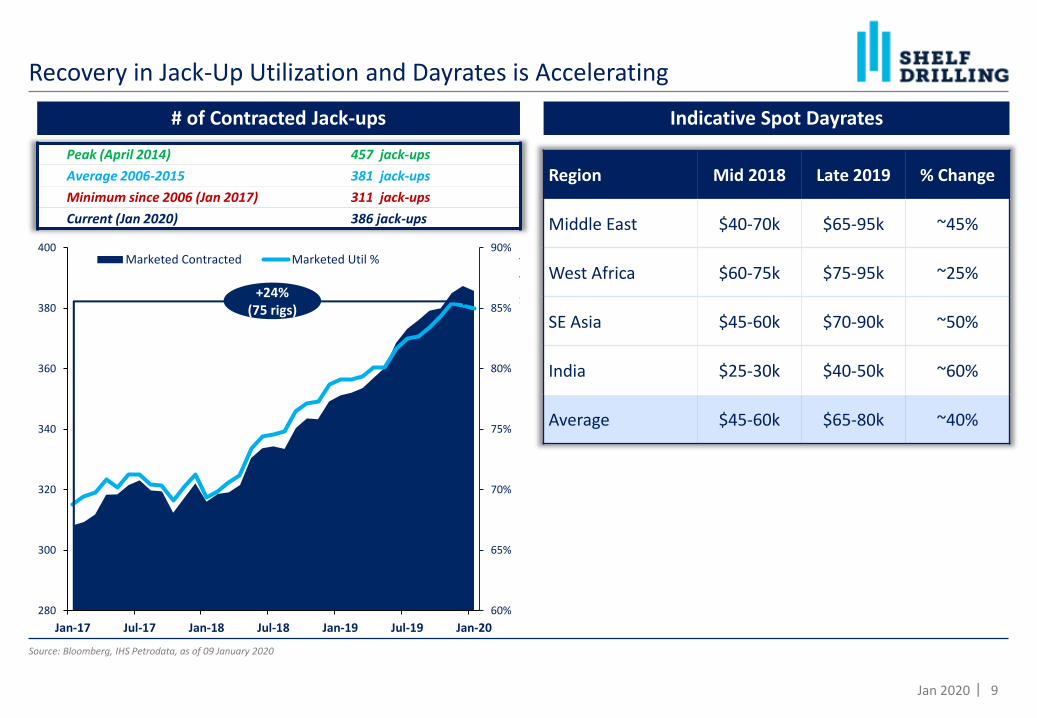
Recovery in Jack-Up Utilization and Dayrates is Accelerating
# of Contracted Jack-ups
Source: Bloomberg, IHS Petrodata, as of 09 January 2020
+24%(75 rigs)
Peak (April 2014) 457 jack-ups
Average 2006-2015 381 jack-ups
Minimum since 2006 (Jan 2017) 311 jack-ups
Current (Jan 2020) 386 jack-ups
Region Mid 2018 Late 2019 % Change
Middle East $40-70k $65-95k ~45%
West Africa $60-75k $75-95k ~25%
SE Asia $45-60k $70-90k ~50%
India $25-30k $40-50k ~60%
Average $45-60k $65-80k ~40%
Indicative Spot Dayrates
10Jan 2020 |
60.3
8.8
9.1
3.9
1.1
9.4
7.2
0.7
10.4
33.0
23.8
27.0
15.3
16.0
0.7
5.5
70.7
41.8
32.8
27.0
19.2
17.1
10.1
7.2
6.3
-5.0 5.0 15. 0 25. 0 35. 0 45. 0 55. 0 65. 0 75. 0
Shelf Drilling
COSL
Valaris
Seadrill
Borr Drilling
Saipem
Aban Offshore
Advanced Energy Systems
NoblePre-2000 Post-2000
CompanyJUs
Managed2 Util.
Shelf Drilling 35 91%
COSL 40 93%
Valaris 58 81%
Seadrill 20 65%
Borr Drilling 31 55%
Saipem 7 100%
Aban Offshore 14 71%
Advanced Energy Systems
13 100%
Noble 13 92%
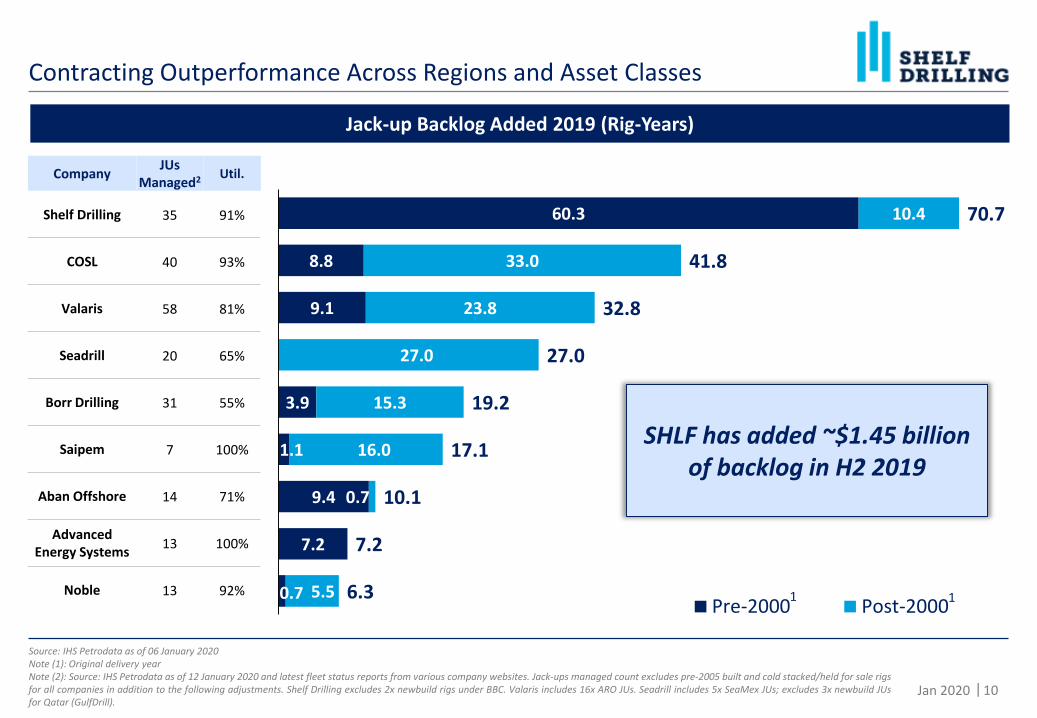
Contracting Outperformance Across Regions and Asset Classes
Source: IHS Petrodata as of 06 January 2020Note (1): Original delivery yearNote (2): Source: IHS Petrodata as of 12 January 2020 and latest fleet status reports from various company websites. Jack-ups managed count excludes pre-2005 built and cold stacked/held for sale rigsfor all companies in addition to the following adjustments. Shelf Drilling excludes 2x newbuild rigs under BBC. Valaris includes 16x ARO JUs. Seadrill includes 5x SeaMex JUs; excludes 3x newbuild JUsfor Qatar (GulfDrill).
Jack-up Backlog Added 2019 (Rig-Years)
SHLF has added ~$1.45 billion of backlog in H2 2019
1 1
11Jan 2020 |
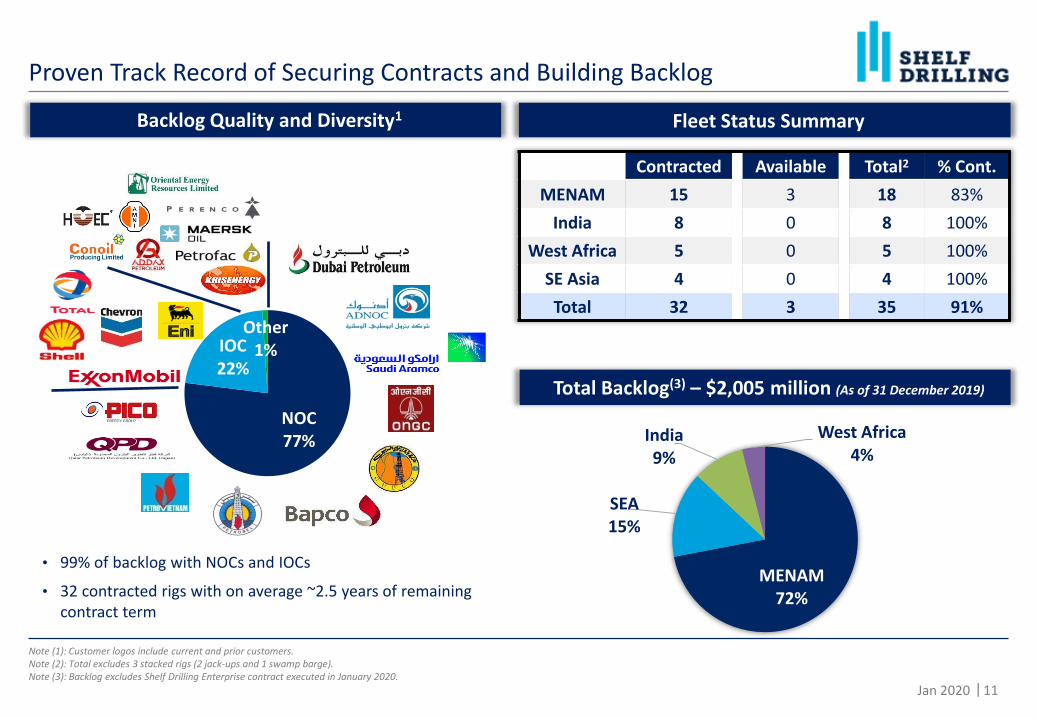
Proven Track Record of Securing Contracts and Building Backlog
•Backlog Quality and Diversity1
Note (1): Customer logos include current and prior customers.Note (2): Total excludes 3 stacked rigs (2 jack-ups and 1 swamp barge).Note (3): Backlog excludes Shelf Drilling Enterprise contract executed in January 2020.
NOC77%
IOC22%
Other1%
• 99% of backlog with NOCs and IOCs
• 32 contracted rigs with on average ~2.5 years of remaining contract term
•Total Backlog(3) – $2,005 million (As of 31 December 2019)
•Fleet Status Summary
Contracted Available Total2 % Cont.
MENAM 15 3 18 83%
India 8 0 8 100%
West Africa 5 0 5 100%
SE Asia 4 0 4 100%
Total 32 3 35 91%
MENAM72%
SEA15%
India9%
West Africa4%
12Jan 2020 |
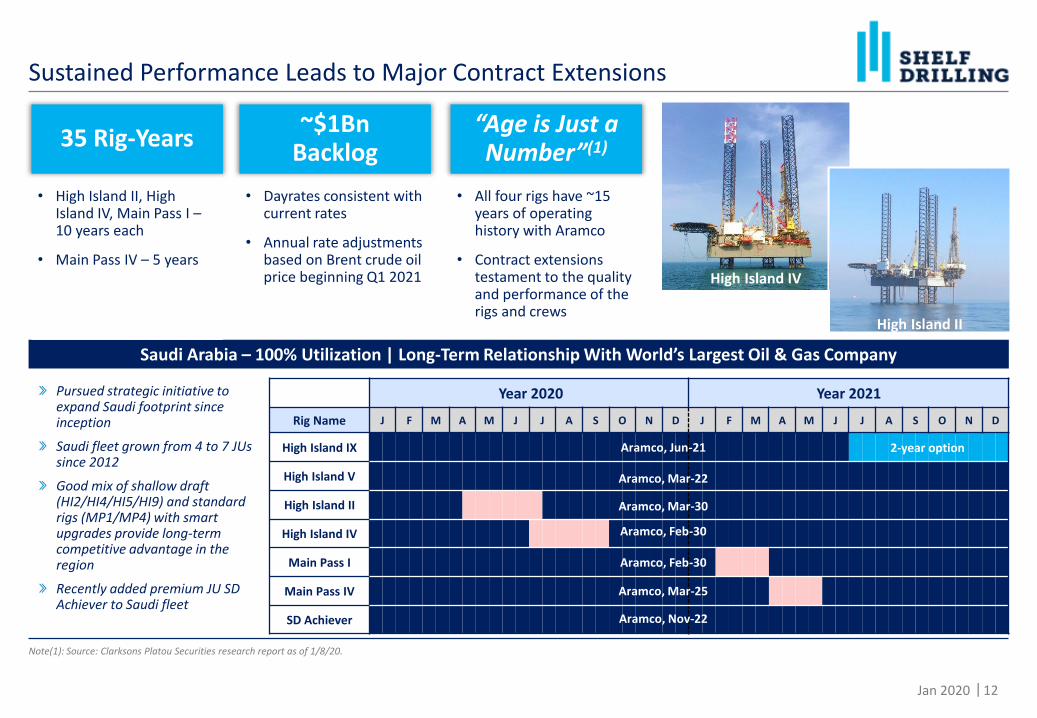
Sustained Performance Leads to Major Contract Extensions
Note(1): Source: Clarksons Platou Securities research report as of 1/8/20.
Saudi Arabia – 100% Utilization | Long-Term Relationship With World’s Largest Oil & Gas Company
Year 2020 Year 2021
Rig Name J F M A M J J A S O N D J F M A M J J A S O N D
High Island IX
High Island V
High Island II
High Island IV
Main Pass I
Main Pass IV
SD Achiever
Aramco, Mar-25
Aramco, Nov-22
Aramco, Feb-30
Aramco, Feb-30
Aramco, Jun-21
Aramco, Mar-22
Aramco, Mar-30
35 Rig-Years
• High Island II, High Island IV, Main Pass I –10 years each
• Main Pass IV – 5 years
~$1Bn Backlog
• Dayrates consistent with current rates
• Annual rate adjustments based on Brent crude oil price beginning Q1 2021
“Age is Just a Number”(1)
• All four rigs have ~15 years of operating history with Aramco
• Contract extensions testament to the quality and performance of the rigs and crews
Pursued strategic initiative to expand Saudi footprint since inception
Saudi fleet grown from 4 to 7 JUs since 2012
Good mix of shallow draft (HI2/HI4/HI5/HI9) and standard rigs (MP1/MP4) with smart upgrades provide long-term competitive advantage in the region
Recently added premium JU SD Achiever to Saudi fleet
High Island IV
High Island II
2-year option
13Jan 2020 |
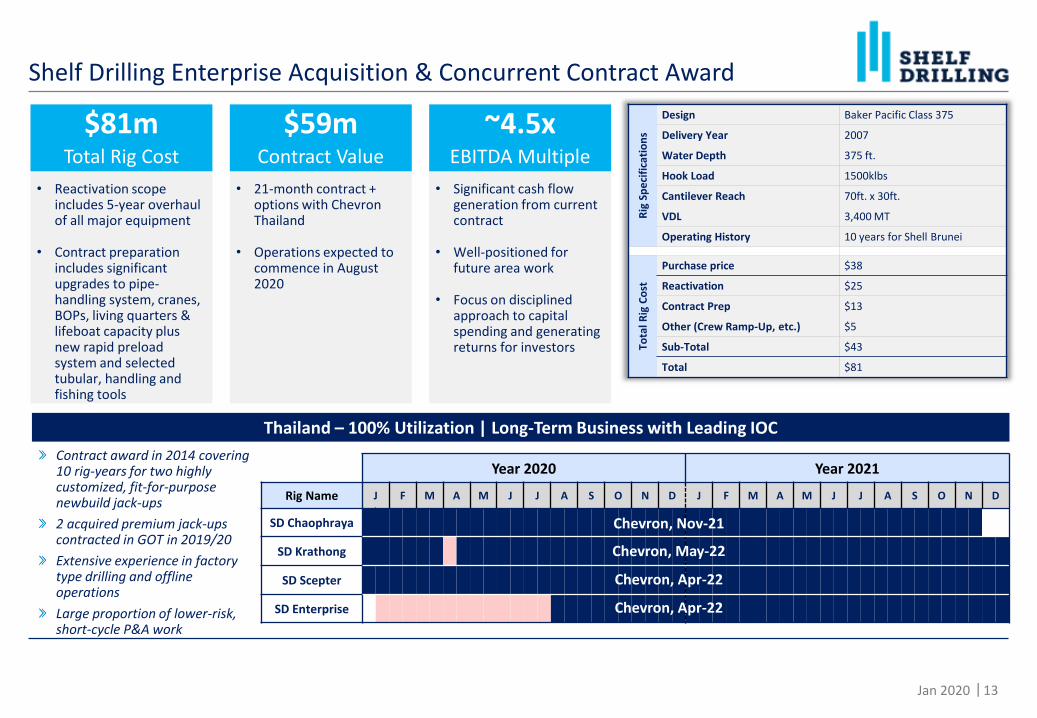
Shelf Drilling Enterprise Acquisition & Concurrent Contract Award
Year 2020 Year 2021
Rig Name J F M A M J J A S O N D J F M A M J J A S O N D
SD Chaophraya
SD Krathong
SD Scepter
SD Enterprise
Chevron, Nov-21
Chevron, May-22
Chevron, Apr-22
Thailand – 100% Utilization | Long-Term Business with Leading IOC
Chevron, Apr-22
$81mTotal Rig Cost
• Reactivation scope includes 5-year overhaul of all major equipment
• Contract preparation includes significant upgrades to pipe-handling system, cranes, BOPs, living quarters & lifeboat capacity plus new rapid preload system and selected tubular, handling and fishing tools
$59mContract Value
• 21-month contract + options with Chevron Thailand
• Operations expected to commence in August 2020
~4.5xEBITDA Multiple
• Significant cash flow generation from current contract
• Well-positioned for future area work
• Focus on disciplined approach to capital spending and generating returns for investors
Rig
Sp
eci
fica
tio
ns
Design Baker Pacific Class 375
Delivery Year 2007
Water Depth 375 ft.
Hook Load 1500klbs
Cantilever Reach 70ft. x 30ft.
VDL 3,400 MT
Operating History 10 years for Shell Brunei
Tota
l Rig
Co
st
Purchase price $38
Reactivation $25
Contract Prep $13
Other (Crew Ramp-Up, etc.) $5
Sub-Total $43
Total $81
Contract award in 2014 covering 10 rig-years for two highly customized, fit-for-purpose newbuild jack-ups
2 acquired premium jack-ups contracted in GOT in 2019/20
Extensive experience in factory type drilling and offline operations
Large proportion of lower-risk, short-cycle P&A work
14Jan 2020 |
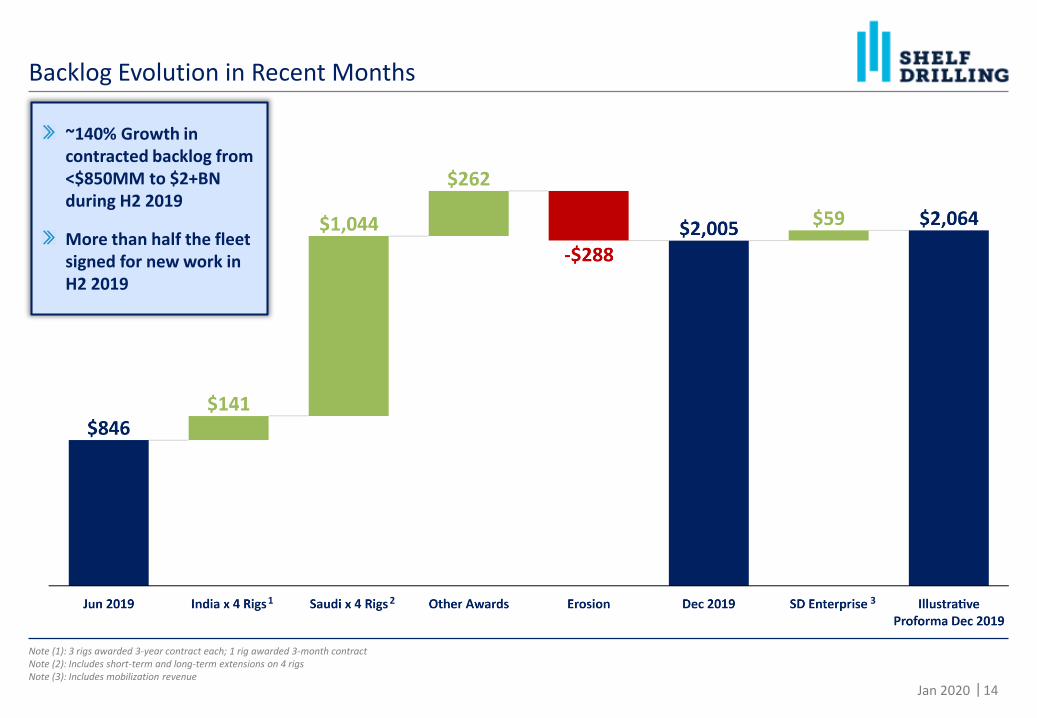
Backlog Evolution in Recent Months
Note (1): 3 rigs awarded 3-year contract each; 1 rig awarded 3-month contractNote (2): Includes short-term and long-term extensions on 4 rigs Note (3): Includes mobilization revenue
~140% Growth in contracted backlog from <$850MM to $2+BN during H2 2019
More than half the fleet signed for new work in H2 2019
1 2 3

15Jan 2020 |
Shelf Continues to have Peer Leading Corporate Credit Profile
Note: Debt maturities exclude amounts due under capital leases. SHLF reflects 12/31/2019 RCF balance of $35mm and pro forma for Maersk Completer (renamed Shelf Drilling Enterprise) acquisition and associated contemplated financing. RIG pro forma for $750mm notes offering. DRLCO pro forma for sale of Maersk Completer for $38mm. VAL pro forma for recent arbitration payment and excludes ARO.Note (1): Chart from Clarksons Platou Securities research report as of 1/8/20; Shelf not pro forma for Maersk Completer acquisition and associated contemplated financing.Note (2): LTM EBITDA as of 9/30/2019, for all companies other than DRLCO, which is LTM as of 6/30/19. Shelf Drilling LTM EBITDA adjusted to include $18mm of incremental expected annualized EBITDA associated with newly acquired rig and $27mm of annualized EBITDA associated with contracts for two other acquired rigs that recently commenced multi-year contracts.
Percentage of Total Debt Maturing Within the Next 5 Years
Net Debt / LTM EBITDA(2)
EBITDA-Backlog / EV(1)
2.1x 4.2x 4.6x 7.4x 10.9x 18.6x 19.8x
35.0x
75.8x
NM
DRLCO ODL SHLF RIG NE SDRL DO VAL PACD BDRILL
11.3% 12.5%
27.9%
41.4% 44.7%
67.0%
85.5%
100.0% 100.0% 100.0%
SHLF DO NE VAL RIG SDRL DRLCO BDRILL PACD ODL
0.68x
0.48x
0.28x 0.23x
0.16x 0.15x 0.14x 0.09x
0.05x 0.03x
0.00x
0.20x
0.40x
0.60x
0.80x
SHLF RIG ODL DRLCO NE DO SDRL VAL BDRILL PACD
EB
ITD
A-b
ackl
og / E
V

16Jan 2020 |
Positioned for Cash Flow
• ~140% growth since June 2019 to $2+ billion
• Significant revenue and free cash flow visibility in coming years
Industry Leading Backlog
• Scepter + Achiever/Journey – activation projects substantially complete by YE 2019
• Shelf Drilling Enterprise – multiple financing options ahead of Q3 2020 start
• No debt maturities before 2023
Well-Capitalized
• Guidance for Q4 2019 provided in November 2019 implies 20% sequential revenue growth
― 7 new contracts commenced during Q4 (average length ~2 years)
― Further step up in revenue expected in Q1 2020
Near-Term Momentum
17Jan 2020 |
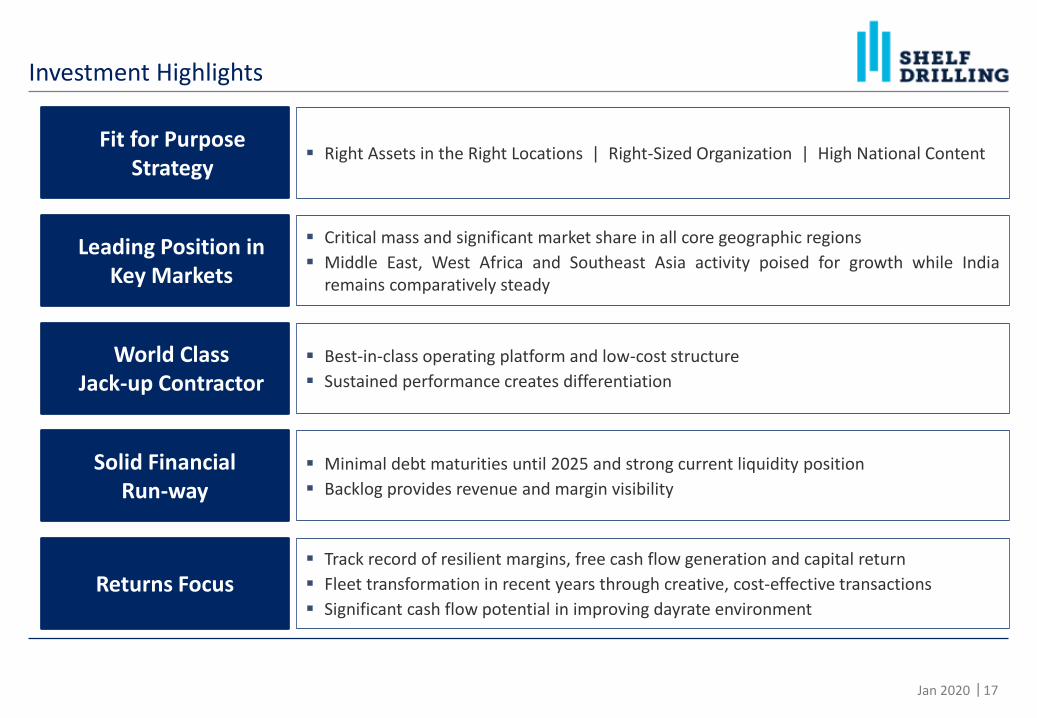
Investment Highlights
Fit for Purpose Strategy
▪ Right Assets in the Right Locations | Right-Sized Organization | High National Content
Leading Position in Key Markets
▪ Critical mass and significant market share in all core geographic regions
▪ Middle East, West Africa and Southeast Asia activity poised for growth while Indiaremains comparatively steady
World Class Jack-up Contractor
▪ Best-in-class operating platform and low-cost structure
▪ Sustained performance creates differentiation
Returns Focus▪ Track record of resilient margins, free cash flow generation and capital return
▪ Fleet transformation in recent years through creative, cost-effective transactions
▪ Significant cash flow potential in improving dayrate environment
Solid Financial Run-way
▪ Minimal debt maturities until 2025 and strong current liquidity position
▪ Backlog provides revenue and margin visibility

Shelf Drilling Investor Presentation (January 2020)
Appendix
19Jan 2020 |
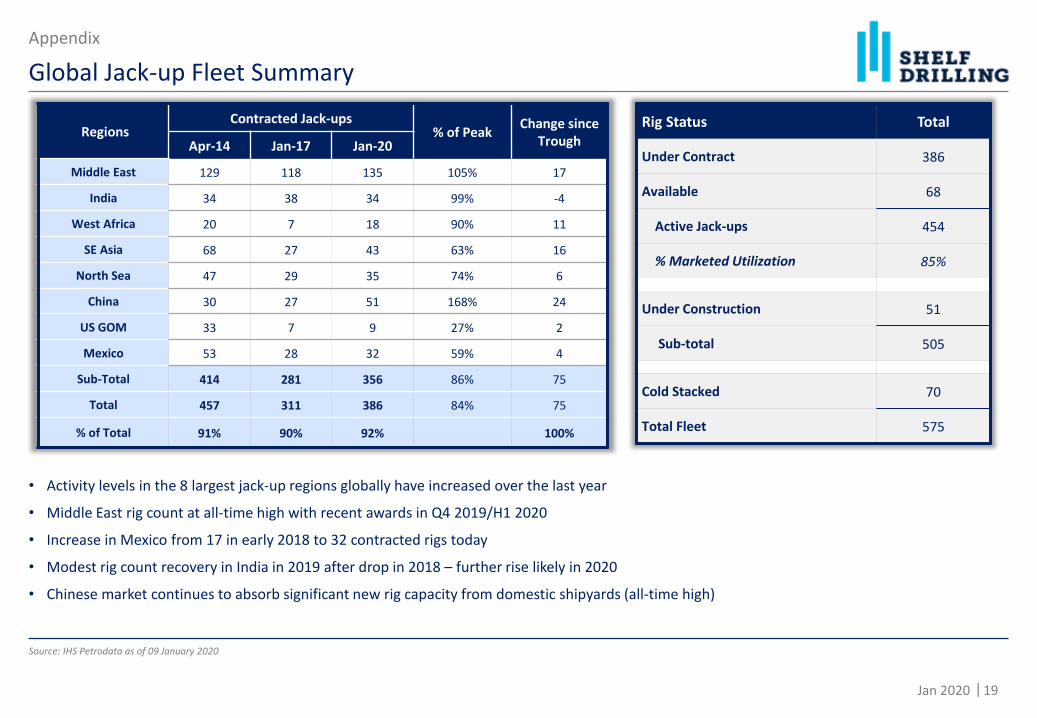
• Activity levels in the 8 largest jack-up regions globally have increased over the last year
• Middle East rig count at all-time high with recent awards in Q4 2019/H1 2020
• Increase in Mexico from 17 in early 2018 to 32 contracted rigs today
• Modest rig count recovery in India in 2019 after drop in 2018 – further rise likely in 2020
• Chinese market continues to absorb significant new rig capacity from domestic shipyards (all-time high)
Global Jack-up Fleet Summary
Source: IHS Petrodata as of 09 January 2020
RegionsContracted Jack-ups
% of PeakChange since
TroughApr-14 Jan-17 Jan-20
Middle East 129 118 135 105% 17
India 34 38 34 99% -4
West Africa 20 7 18 90% 11
SE Asia 68 27 43 63% 16
North Sea 47 29 35 74% 6
China 30 27 51 168% 24
US GOM 33 7 9 27% 2
Mexico 53 28 32 59% 4
Sub-Total 414 281 356 86% 75
Total 457 311 386 84% 75
% of Total 91% 90% 92% 100%
Rig Status Total
Under Contract 386
Available 68
Active Jack-ups 454
% Marketed Utilization 85%
Under Construction 51
Sub-total 505
Cold Stacked 70
Total Fleet 575
Appendix

20Jan 2020 |
Appendix
Capital Structure Summary
Note (1) Reflects carrying value. Principal value is $900.0 millionNote (2) TNLR for covenant compliance purposes under RCF of 3.9x at Sep 30, 2019
(In millions USD) YE 2017 YE 2018 Jun-19 Sep-19
Cash $84.6 $91.2 $71.3 $45.7
Total Long-lived Assets $1,405.9 $1,354.8 $1,465.9 $1,487.5
Total Assets 1,683.0 1,645.9 1,740.2 1,730.9
Senior secured notes due 2018/2020
526.7 - - -
Senior unsecured notes due 2025 1 - 887.8 888.7 889.1
RCF Drawdown 20.0
Obligations under sale and leaseback
313.9 - - -
Total Debt $840.6 $887.8 $888.7 $909.1
Net Debt $756.0 $796.6 $817.4 $863.4
Mezzanine Equity 166.0 - - -
Total Equity $509.2 $591.3 $669.4 $633.3
• Total liquidity, including availability under RCF, ofapproximately $241.8 million as of September 30,2019
• LTM Adjusted EBITDA of $171.3 million (Sep-19).Net Leverage of 5.0x (Sep-19) 2
• Total shares outstanding of 137.7 million as ofSeptember 30, 2019
o 285k shares repurchased in September 2019at average price of $2.45 per share
o Free float of 57.3 million or 41.6%
o Large shareholders with boardrepresentation: 80.3 million or 58.3%
• China Merchants: 26.8 million (19.4%)
• Lime Rock: 17.2 million (12.5%)
• Castle Harlan: 17.2 million (12.5%)
• CPE Capital (formerly CHAMP): 17.2million (12.5%)
21Jan 2020 |
Appendix
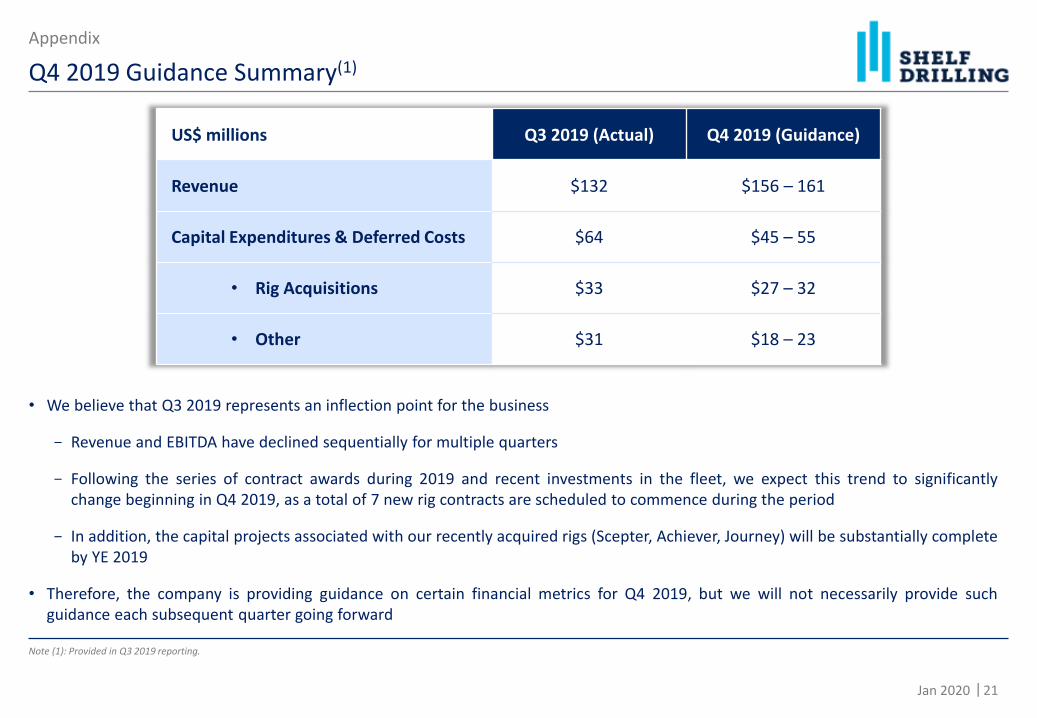
Q4 2019 Guidance Summary(1)
US$ millions Q3 2019 (Actual) Q4 2019 (Guidance)
Revenue $132 $156 – 161
Capital Expenditures & Deferred Costs $64 $45 – 55
• Rig Acquisitions $33 $27 – 32
• Other $31 $18 – 23
• We believe that Q3 2019 represents an inflection point for the business
- Revenue and EBITDA have declined sequentially for multiple quarters
- Following the series of contract awards during 2019 and recent investments in the fleet, we expect this trend to significantlychange beginning in Q4 2019, as a total of 7 new rig contracts are scheduled to commence during the period
- In addition, the capital projects associated with our recently acquired rigs (Scepter, Achiever, Journey) will be substantially completeby YE 2019
• Therefore, the company is providing guidance on certain financial metrics for Q4 2019, but we will not necessarily provide suchguidance each subsequent quarter going forward
Note (1): Provided in Q3 2019 reporting.