Embed Size (px)
Citation preview
Investor Presentation
West Coast Roadshow
August 26-27, 2015
Forward-looking statements and non-GAAP financial informationThis presentation includes “forward-looking” statements within the meaning of the federal securities laws. You can generally identify the company’s forward-looking statements by words such as “anticipate,” “believe,” “could,” “estimate,” “expect,” “forecast,” “outlook,” “intend,” “may,” “possible,” “potential,” “predict,” “project,” “seek,” “target,” “could,” “may,” “should” or “would” or other similar words, phrases or expressions that convey the uncertainty of future events or outcomes. The company cautions readers that actual results may differ materially from those expressed or implied in forward-looking statements made by or on behalf of the company due to a variety of factors, such as: the company’s ability to realize the expected benefits of the spinoff; the costs associated with being an independent public company, which may be higher than anticipated; deterioration in world economic conditions, or in economic conditions in any of the geographic regions in which the company conducts business, including additional adverse effects from global economic slowdown, terrorism or hostilities, including political risks associated with the potential instability of governments and legal systems in countries in which the company or its customers conduct business, and changes in currency valuations; the effects of fluctuations in customer demand on sales, product mix and prices in the industries in which the company operates, including the ability of the company to respond to rapid changes in customer demand, the effects of customer bankruptcies or liquidations, the impact of changes in industrial business cycles, and whether conditions of fair trade continue in U.S. markets; competitive factors, including changes in market penetration, increasing price competition by existing or new foreign and domestic competitors, the introduction of new products by existing and new competitors, and new technology that may impact the way the company’s products are sold or distributed; changes in operating costs, including the effect of changes in the company’s manufacturing processes, changes in costs associated with varying levels of operations and manufacturing capacity, availability of raw materials and energy, the company’s ability to mitigate the impact of fluctuations in raw materials and energy costs and the effectiveness of its surcharge mechanism, changes in the expected costs associated with product warranty claims, changes resulting from inventory management, cost reduction initiatives and different levels of customer demands, the effects of unplanned work stoppages, and changes in the cost of labor and benefits; the success of the company’s operating plans, announced programs, initiatives and capital investments (including the jumbo bloom vertical caster and advanced quench-and-temper facility), the ability to integrate acquired companies, the ability of acquired companies to achieve satisfactory operating results, including results being accretive to earnings, and the company’s ability to maintain appropriate relations with unions that represent its associates in certain locations in order to avoid disruptions of business; and changes in worldwide financial markets, including availability of financing and interest rates, which affect the company’s cost of funds and/or ability to raise capital, the company’s pension obligations and investment performance, and/or customer demand and the ability of customers to obtain financing to purchase the company’s products or equipment that contain its products, and the amount of any dividend declared by the company’s board of directors on its common shares. Additional risks relating to the company’s business, the industries in which the company operates or the company’s common shares may be described from time to time in the company’s filings with the SEC. All of these risk factors are difficult to predict, are subject to material uncertainties that may affect actual results and may be beyond the company’s control. Readers are cautioned that it is not possible to predict or identify all of the risks, uncertainties and other factors that may affect future results and that the above list should not be considered to be a complete list. Except as required by the federal securities laws, the company undertakes no obligation to publicly update or revise any forward-looking statement, whether as a result of new information, future events or otherwise.
The unaudited pro forma consolidated financial data in this presentation is subject to assumptions and adjustments described in the company’s registration statement on Form 10. TimkenSteel Corporation’s (“TimkenSteel”) management believes these assumptions and adjustments are reasonable under the circumstances . The unaudited pro forma consolidated financial data does not purport to represent what TimkenSteel’s financial position and results of operations actually would have been had the spinoff occurred on the dates indicated, or to project TimkenSteel’s financial performance for any future period following the spinoff.
This presentation also includes certain non-GAAP financial measures as defined by SEC rules. A reconciliation of those measures to the most directly comparable GAAP equivalent is contained in the Appendix. Please see discussion of non-GAAP financial measures in the Appendix.
2

Today’s presenters
3
Chris HoldingExecutive Vice President & Chief Financial Officer
Tina BeskidDirector, Investor Relations
Business overview
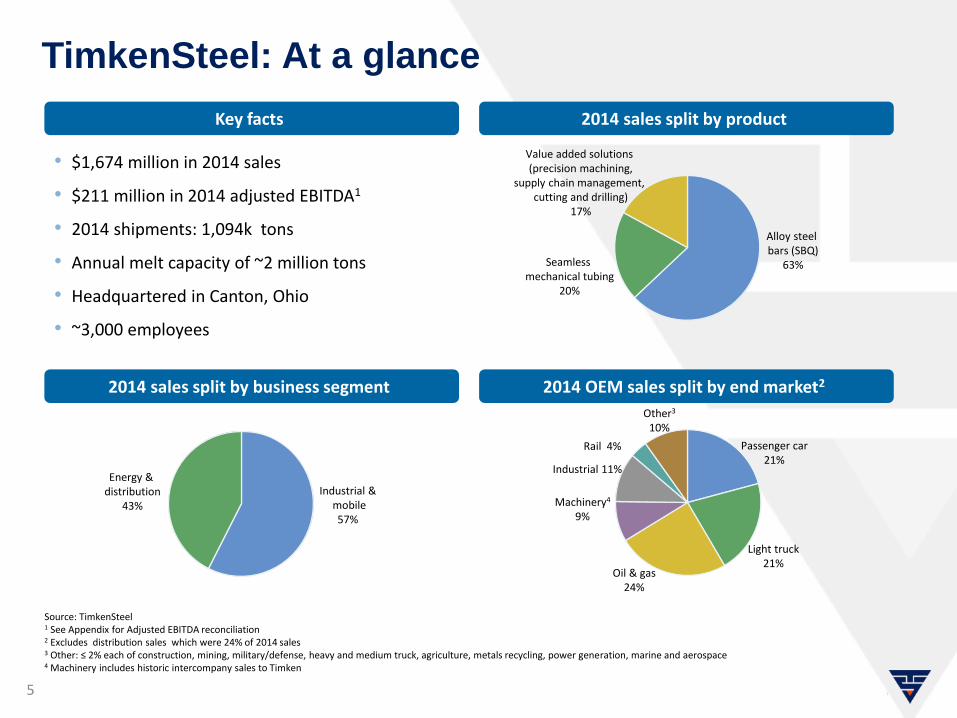
TimkenSteel: At a glance
• $1,674 million in 2014 sales
• $211 million in 2014 adjusted EBITDA1
• 2014 shipments: 1,094k tons
• Annual melt capacity of ~2 million tons
• Headquartered in Canton, Ohio
• ~3,000 employees
5
Key facts
2014 sales split by business segment 2014 OEM sales split by end market2
2014 sales split by product
Alloy steel bars (SBQ)
63%Seamless mechanical tubing
20%
Value added solutions (precision machining,
supply chain management, cutting and drilling)
17%
Industrial &mobile57%
Energy & distribution
43%
Passenger car21%
Light truck21%
Oil & gas24%
Machinery4
9%
Industrial 11%
Rail 4%
Other3
10%
Source: TimkenSteel1 See Appendix for Adjusted EBITDA reconciliation2 Excludes distribution sales which were 24% of 2014 sales3 Other: ≤ 2% each of construction, mining, military/defense, heavy and medium truck, agriculture, metals recycling, power generation, marine and aerospace4 Machinery includes historic intercompany sales to Timken
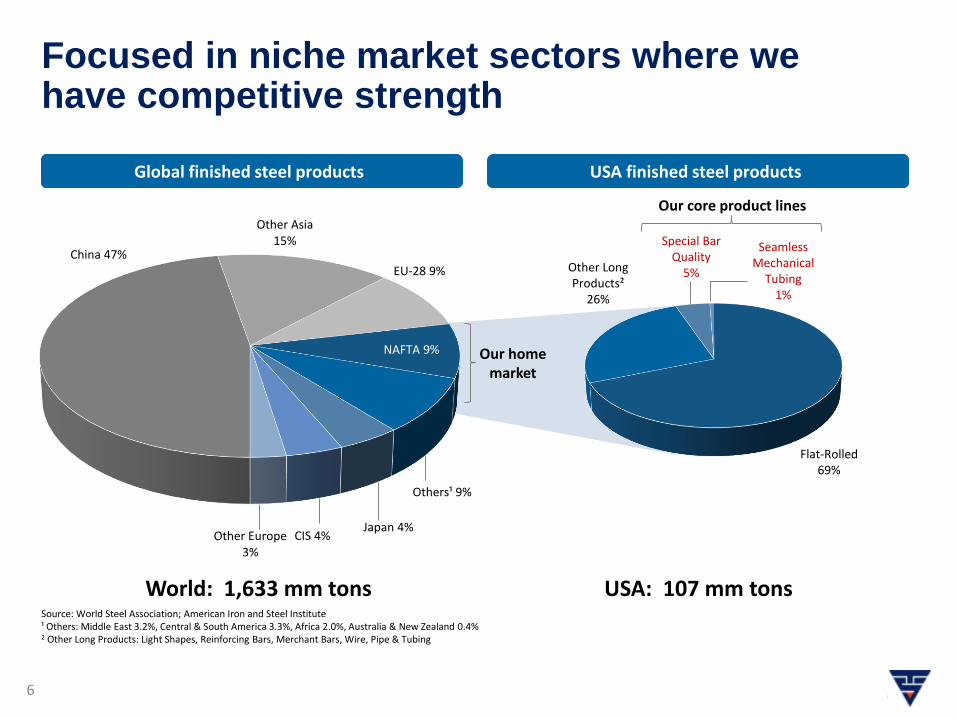
Flat-Rolled69%
Other Long Products²
26%
Special Bar Quality
5%
Seamless Mechanical
Tubing1%
Focused in niche market sectors where we have competitive strength
6
World: 1,633 mm tons USA: 107 mm tonsSource: World Steel Association; American Iron and Steel Institute¹ Others: Middle East 3.2%, Central & South America 3.3%, Africa 2.0%, Australia & New Zealand 0.4% 2 Other Long Products: Light Shapes, Reinforcing Bars, Merchant Bars, Wire, Pipe & Tubing
Our core product lines
Our home market
Global finished steel products USA finished steel products
China 47%
Other Asia 15%
EU-28 9%
NAFTA 9%
Others¹ 9%
Japan 4%CIS 4%Other Europe
3%
7
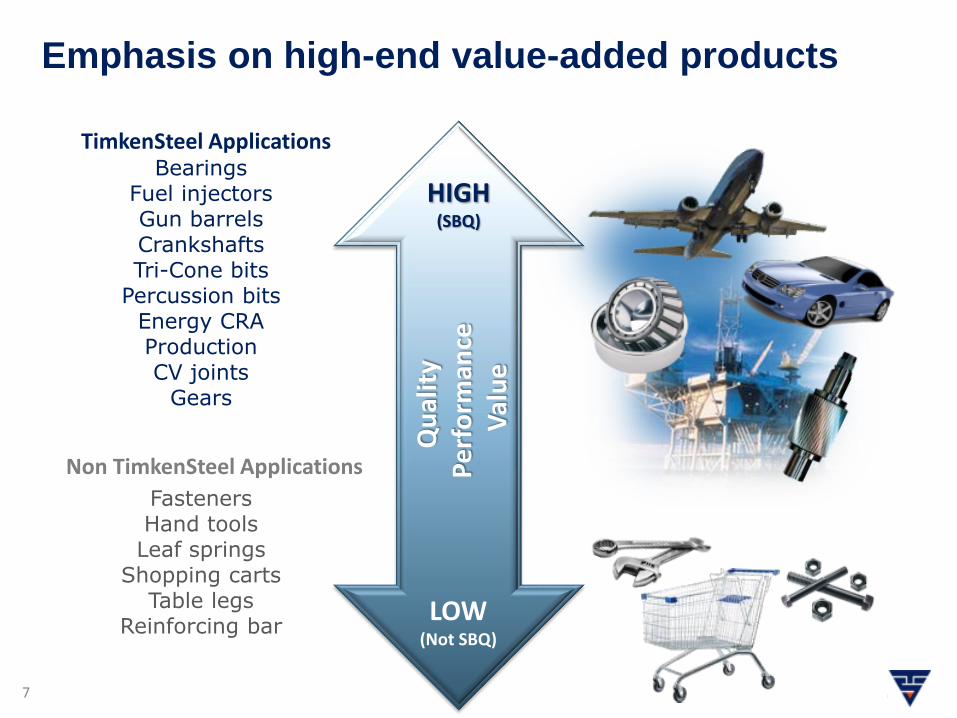
BearingsFuel injectorsGun barrelsCrankshaftsTri-Cone bits
Percussion bitsEnergy CRA ProductionCV joints
Gears
FastenersHand tools
Leaf springsShopping carts
Table legsReinforcing bar
LOW(Not SBQ)
Qu
alit
yP
erf
orm
ance
Val
ue
HIGH(SBQ)
TimkenSteel Applications
Non TimkenSteel Applications
capabilities
Emphasis on high-end value-added products
8
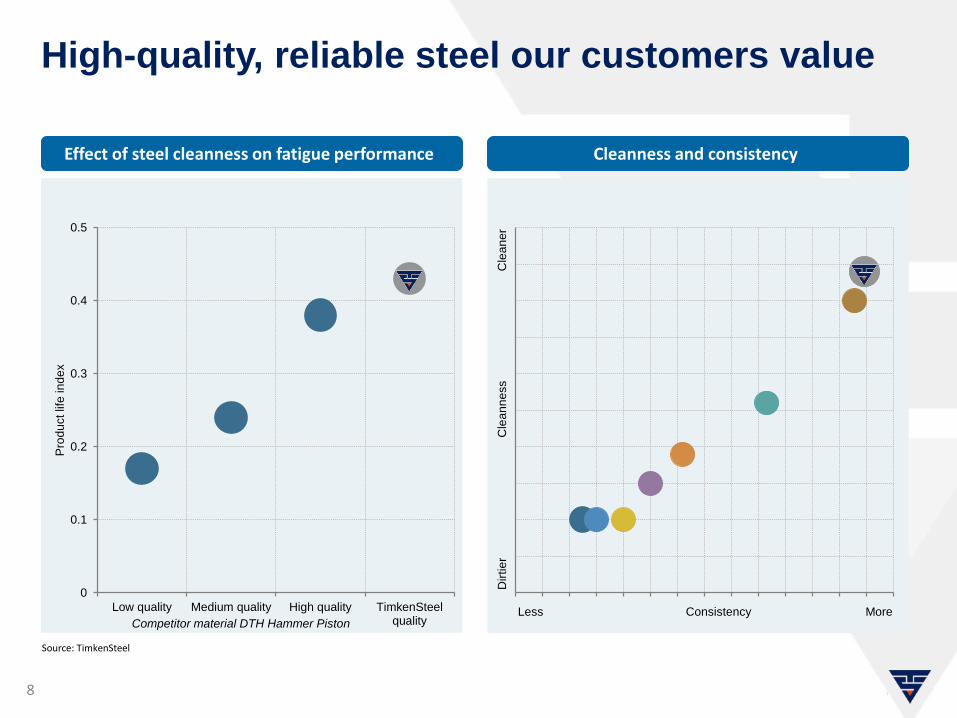
High-quality, reliable steel our customers value
Source: TimkenSteel
Dir
tie
rC
lea
nn
ess
Cle
an
er
Less Consistency More
0
0.1
0.2
0.3
0.4
0.5
Low quality Medium quality High quality TimkenSteelquality
Pro
du
ct lif
e in
de
x
Competitor material DTH Hammer Piston
Effect of steel cleanness on fatigue performance Cleanness and consistency
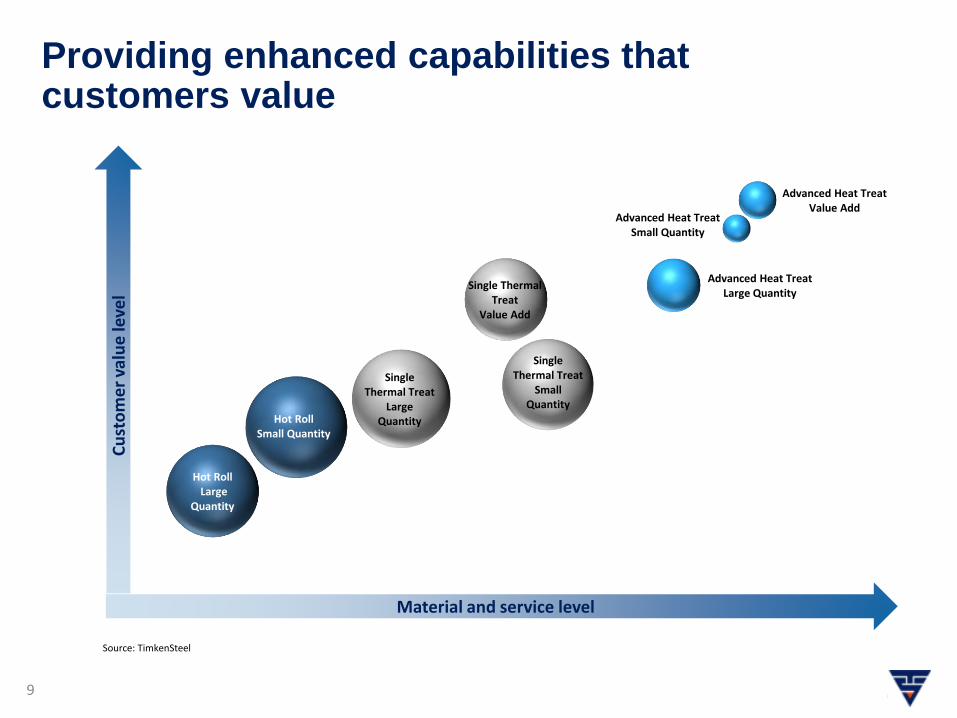
Providing enhanced capabilities that customers value
9
Hot RollLarge
Quantity
Hot RollSmall Quantity
SingleThermal Treat
LargeQuantity
Single ThermalTreat
Value Add
SingleThermal Treat
SmallQuantity
Advanced Heat TreatLarge Quantity
Advanced Heat TreatSmall Quantity
Advanced Heat TreatValue Add
Material and service level
Cu
sto
me
r va
lue
leve
l
Source: TimkenSteel
10
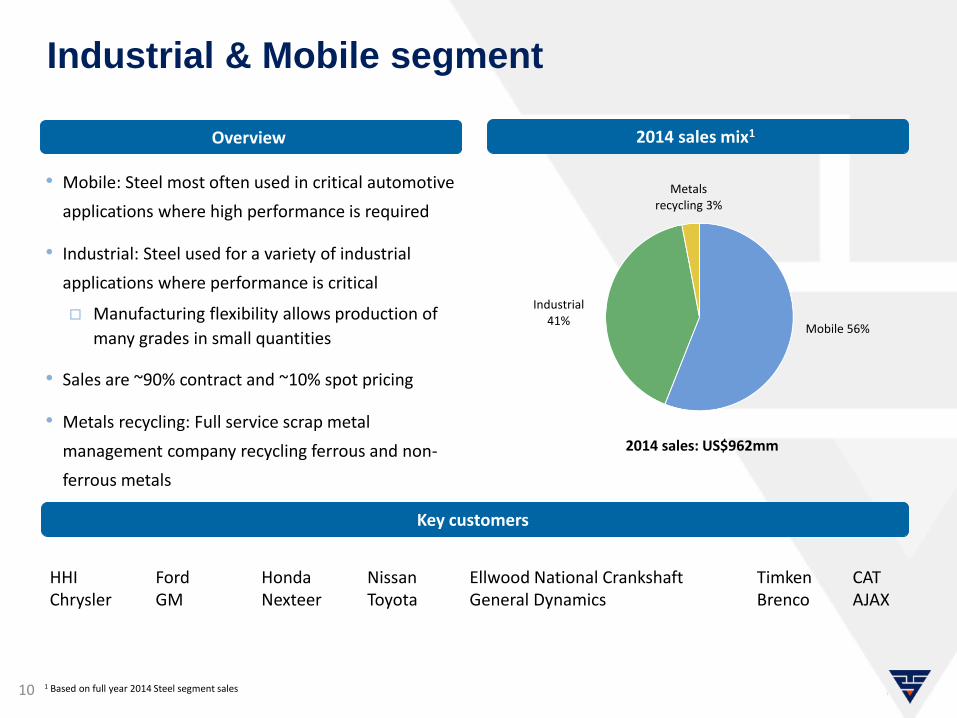
Industrial & Mobile segment
Overview
Key customers
• Mobile: Steel most often used in critical automotive
applications where high performance is required
• Industrial: Steel used for a variety of industrial
applications where performance is critical
Manufacturing flexibility allows production of
many grades in small quantities
• Sales are ~90% contract and ~10% spot pricing
• Metals recycling: Full service scrap metal
management company recycling ferrous and non-
ferrous metals
Mobile 56%
Industrial 41%
Metals recycling 3%
2014 sales: US$962mm
1 Based on full year 2014 Steel segment sales
2014 sales mix1
HHIChrysler
FordGM
HondaNexteer
NissanToyota
Ellwood National Crankshaft Timken CATGeneral Dynamics Brenco AJAX
11
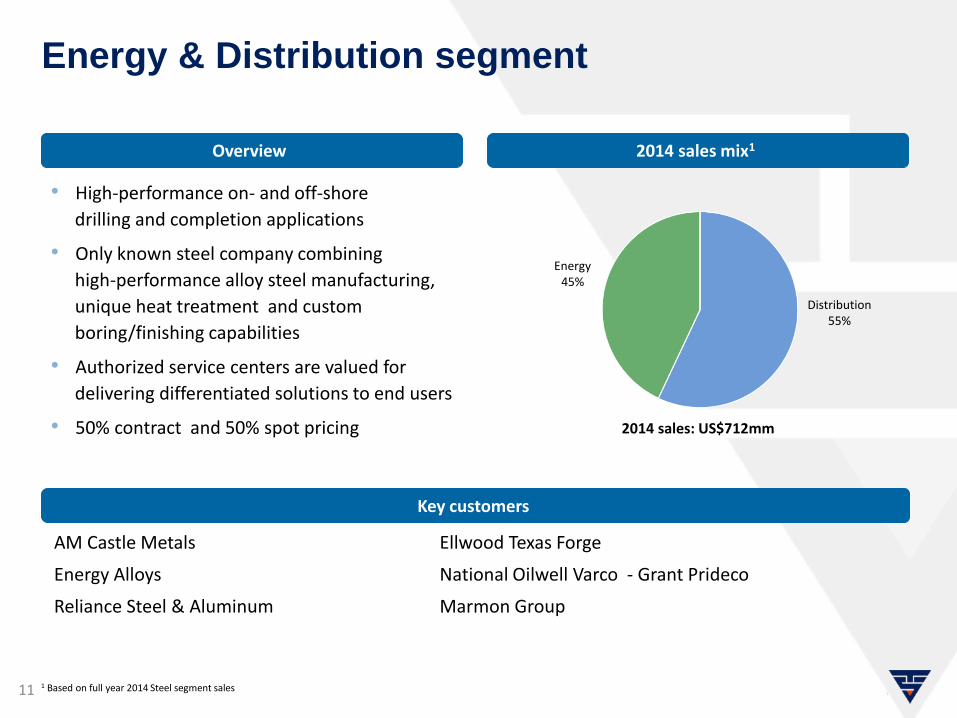
Energy & Distribution segment
Overview 2014 sales mix1
• High-performance on- and off-shore
drilling and completion applications
• Only known steel company combining
high-performance alloy steel manufacturing,
unique heat treatment and custom
boring/finishing capabilities
• Authorized service centers are valued for
delivering differentiated solutions to end users
• 50% contract and 50% spot pricing
Energy 45%
Distribution55%
2014 sales: US$712mm
Key customers
1 Based on full year 2014 Steel segment sales
Ellwood Texas Forge
National Oilwell Varco - Grant Prideco
Marmon Group
AM Castle Metals
Energy Alloys
Reliance Steel & Aluminum
90
100
110
120
130
140
150
160
170
180
0 1 2 3 4 5 6 7 8
Stra
tegi
c sc
op
ing
Stage
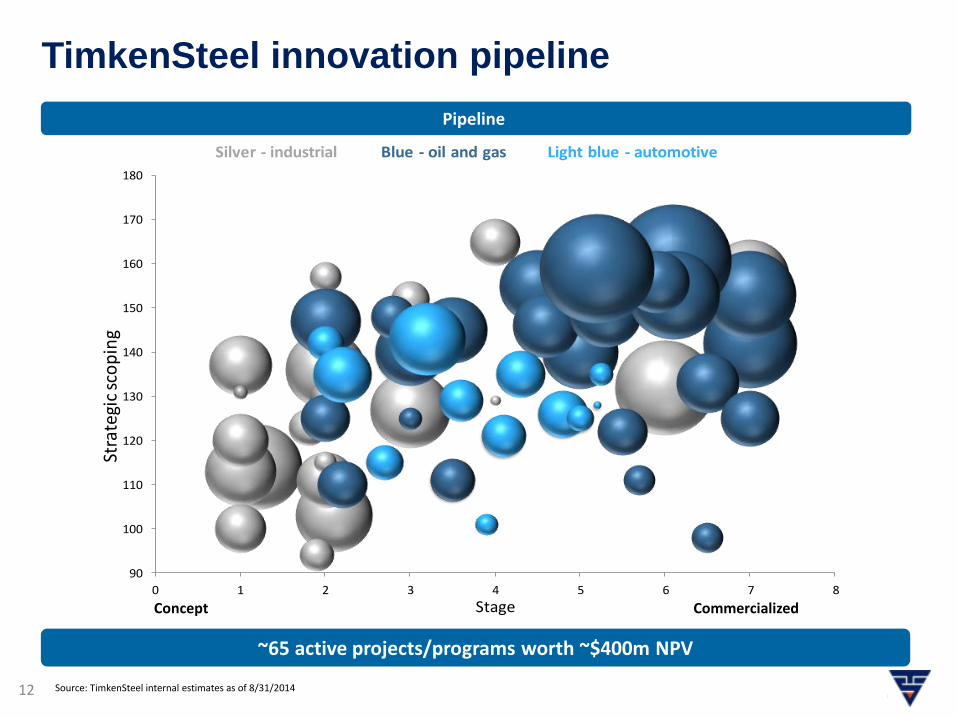
Silver - industrial Blue - oil and gas Light blue - automotive
TimkenSteel innovation pipeline
12
Source: TimkenSteel ~65 active projects/programs worth ~$400m NPV
Pipeline
Source: TimkenSteel internal estimates as of 8/31/2014
Concept Commercialized
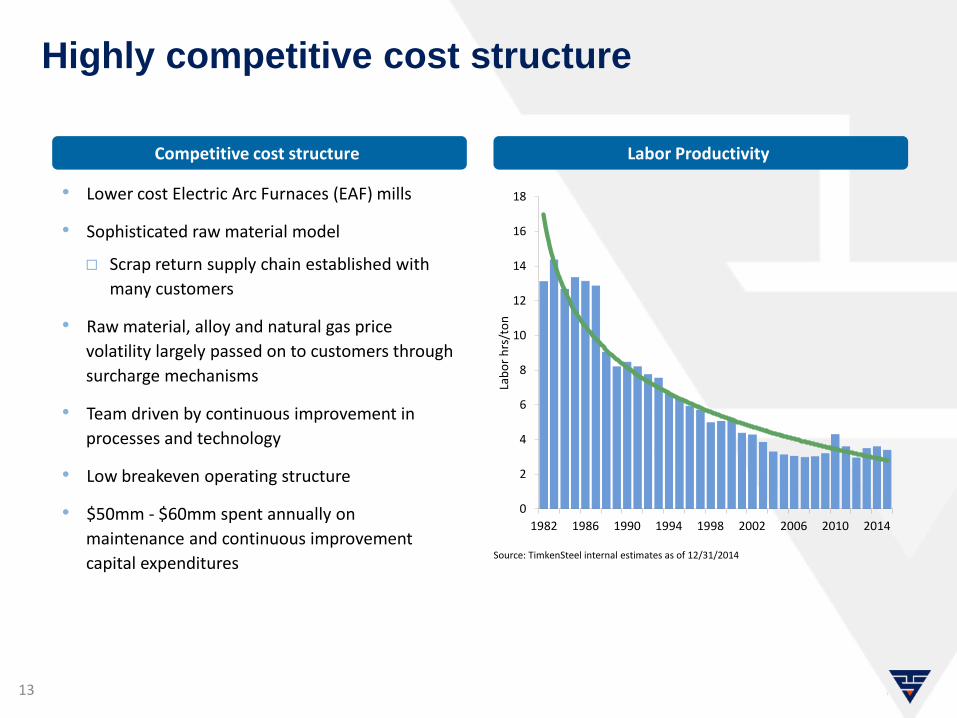
Highly competitive cost structure
13
• Lower cost Electric Arc Furnaces (EAF) mills
• Sophisticated raw material model
Scrap return supply chain established with
many customers
• Raw material, alloy and natural gas price
volatility largely passed on to customers through
surcharge mechanisms
• Team driven by continuous improvement in
processes and technology
• Low breakeven operating structure
• $50mm - $60mm spent annually on
maintenance and continuous improvement
capital expenditures
0
2
4
6
8
10
12
14
16
18
1982 1986 1990 1994 1998 2002 2006 2010 2014
Lab
or
hrs
/to
n
Labor ProductivityCompetitive cost structure
Source: TimkenSteel internal estimates as of 12/31/2014
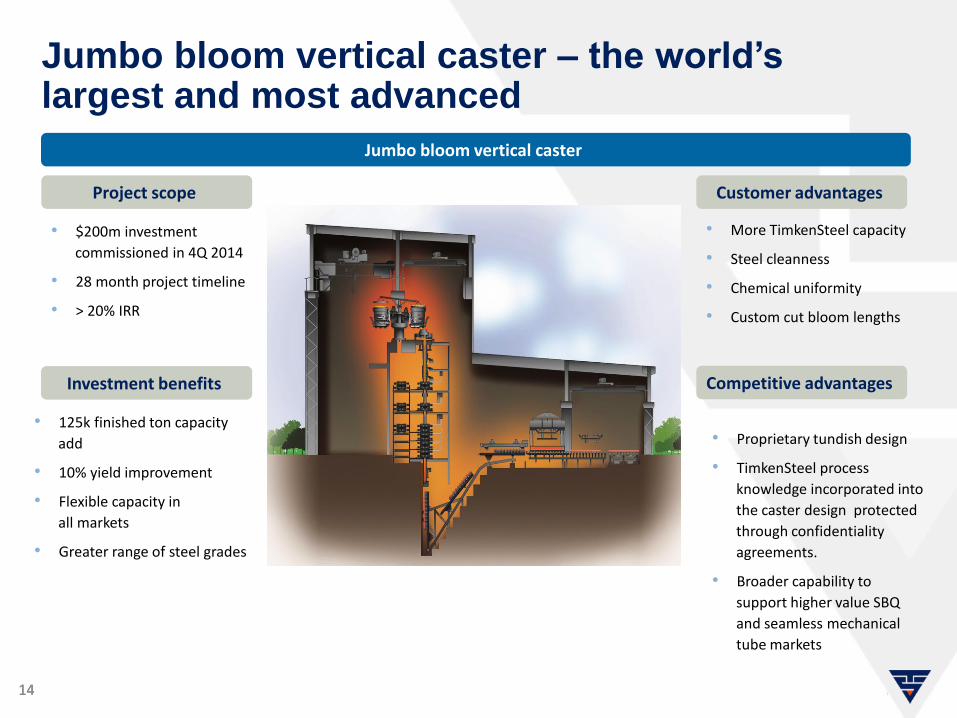
Jumbo bloom vertical caster – the world’s largest and most advanced
Project scope Customer advantages
Investment benefits Competitive advantages
• $200m investment
commissioned in 4Q 2014
• 28 month project timeline
• > 20% IRR
• 125k finished ton capacity
add
• 10% yield improvement
• Flexible capacity in
all markets
• Greater range of steel grades
Jumbo bloom vertical caster
14
• More TimkenSteel capacity
• Steel cleanness
• Chemical uniformity
• Custom cut bloom lengths
• Proprietary tundish design
• TimkenSteel process
knowledge incorporated into
the caster design protected
through confidentiality
agreements.
• Broader capability to
support higher value SBQ
and seamless mechanical
tube markets
14
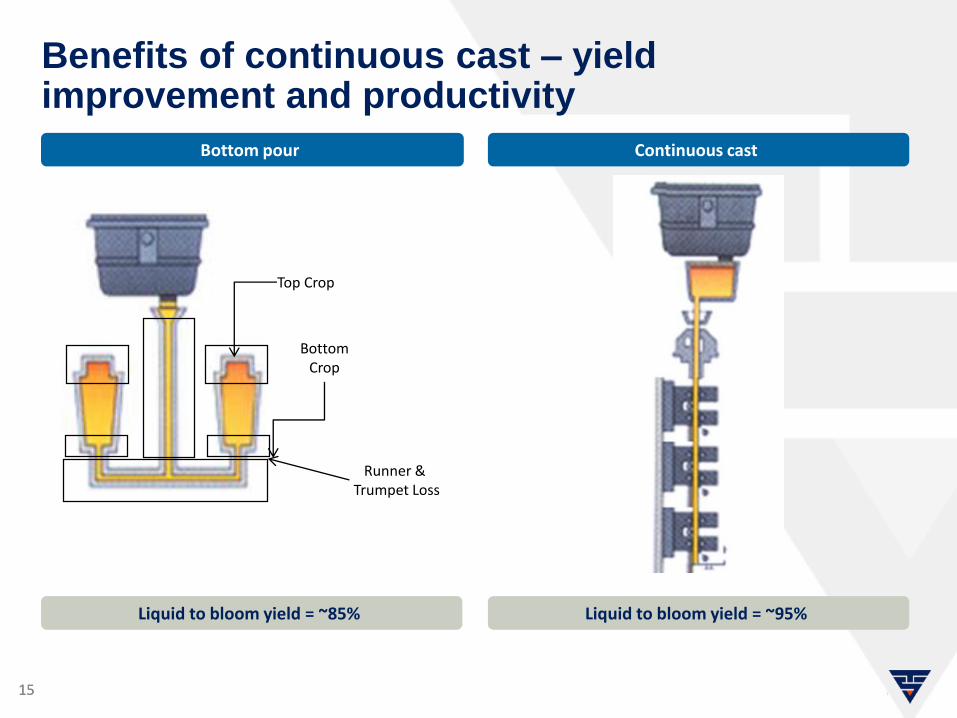
Benefits of continuous cast – yield improvement and productivity
Runner &Trumpet Loss
Top Crop
BottomCrop
Bottom pour
Liquid to bloom yield = ~85%
Continuous cast
Liquid to bloom yield = ~95%
1515
16
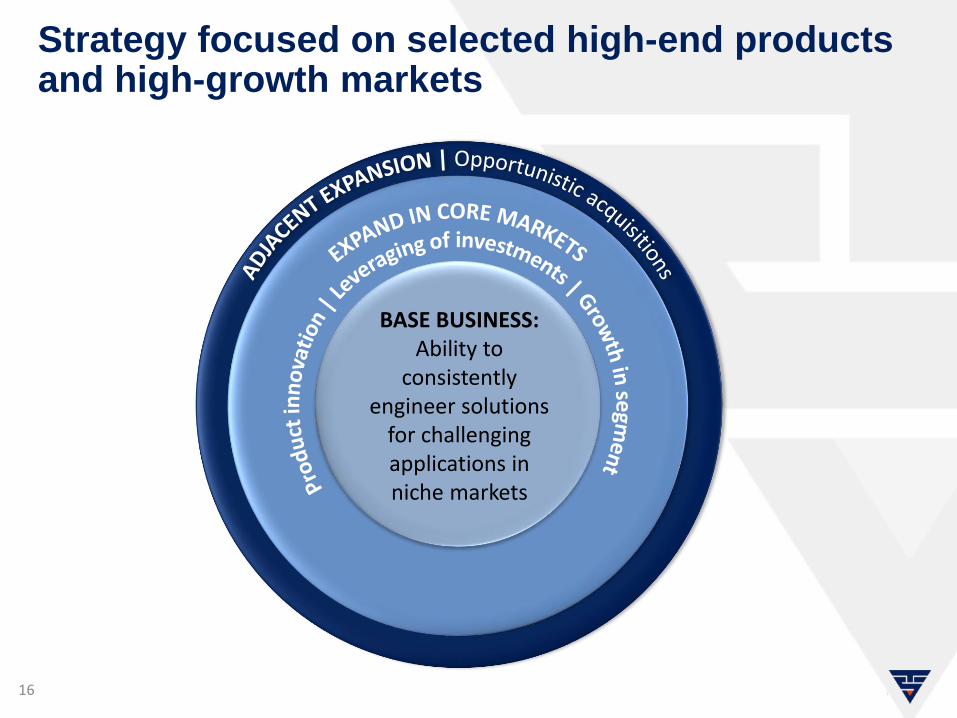
Strategy focused on selected high-end products and high-growth markets
BASE BUSINESS:Ability to
consistently engineer solutions
for challenging applications in niche markets
17
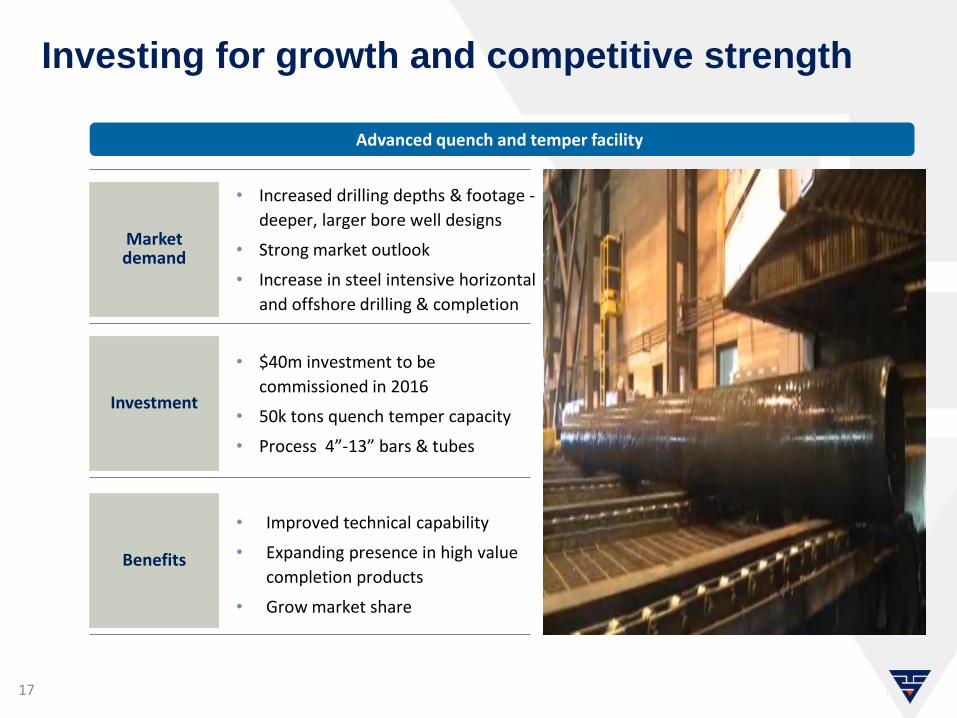
• Improved technical capability
• Expanding presence in high value
completion products
• Grow market share
• Increased drilling depths & footage -
deeper, larger bore well designs
• Strong market outlook
• Increase in steel intensive horizontal
and offshore drilling & completion
• $40m investment to be
commissioned in 2016
• 50k tons quench temper capacity
• Process 4”-13” bars & tubes
Market demand
Investment
Benefits
Advanced quench and temper facility
Investing for growth and competitive strength

• A leading manufacturer of high-quality, high-performance engineered steel
products and value-added services
• Industry leading customer service delivering customized engineering and
innovative design solutions for the most demanding applications
• Niche position in attractive Energy, Industrial and Automotive end market
sectors
• Leading industry margins driven by value-added products and competitive
operating cost structure
• Strong capital structure with good liquidity position to drive growth
18
TimkenSteel: A compelling investment
Financial performance
review and guidance
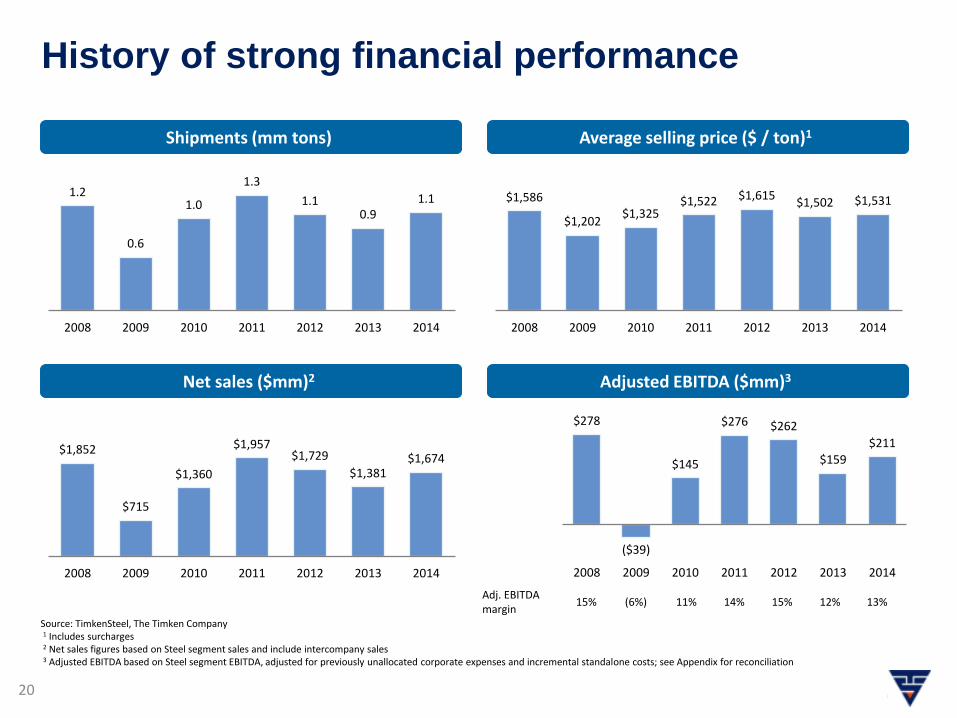
History of strong financial performance
20
Shipments (mm tons) Average selling price ($ / ton)1
1.2
0.6
1.0
1.3
1.10.9
1.1
2008 2009 2010 2011 2012 2013 2014
$1,586
$1,202$1,325
$1,522 $1,615$1,502 $1,531
2008 2009 2010 2011 2012 2013 2014
Net sales ($mm)2 Adjusted EBITDA ($mm)3
Source: TimkenSteel, The Timken Company1 Includes surcharges2 Net sales figures based on Steel segment sales and include intercompany sales3 Adjusted EBITDA based on Steel segment EBITDA, adjusted for previously unallocated corporate expenses and incremental standalone costs; see Appendix for reconciliation
$1,852
$715
$1,360
$1,957$1,729
$1,381$1,674
2008 2009 2010 2011 2012 2013 2014
$278
($39)
$145
$276 $262
$159 $211
2008 2009 2010 2011 2012 2013 2014
Adj. EBITDA margin
15% (6%) 11% 14% 15% 12% 13%
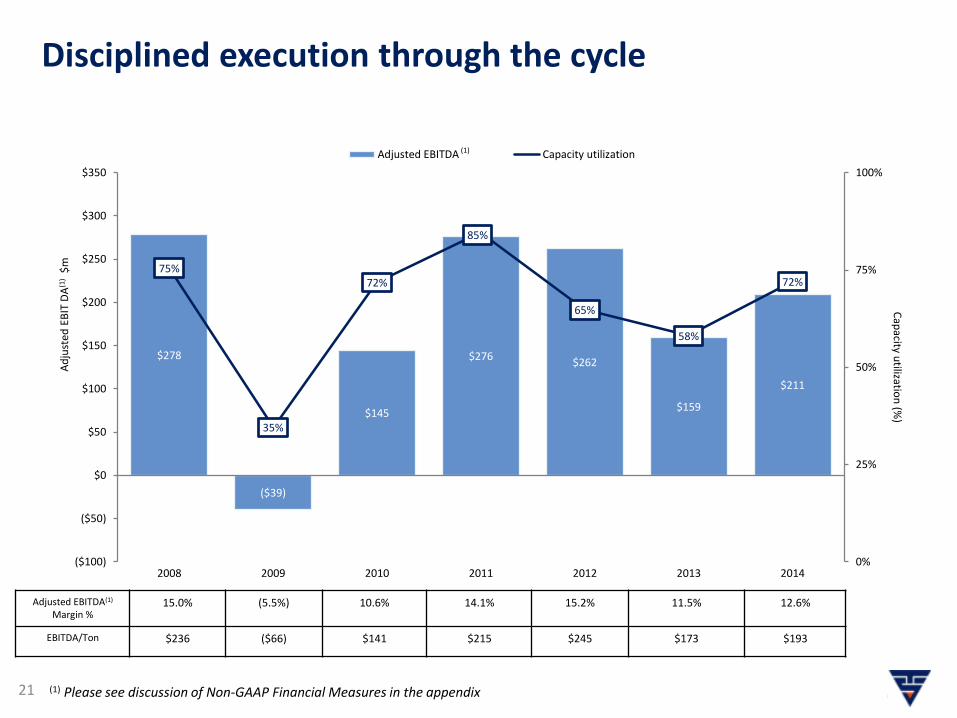
Disciplined execution through the cycle
$278
($39)
$145
$276 $262
$159
$211
75%
35%
72%
85%
65%
58%
72%
0%
25%
50%
75%
100%
($100)
($50)
$0
$50
$100
$150
$200
$250
$300
$350
2008 2009 2010 2011 2012 2013 2014
Cap
acity utilizatio
n (%
)A
dju
sted
EB
IT D
A(1
)$
m
Adjusted EBITDA Capacity utilization(1)
21
Adjusted EBITDA(1)
Margin %15.0% (5.5%) 10.6% 14.1% 15.2% 11.5% 12.6%
EBITDA/Ton $236 ($66) $141 $215 $245 $173 $193
(1) Please see discussion of Non-GAAP Financial Measures in the appendix
22
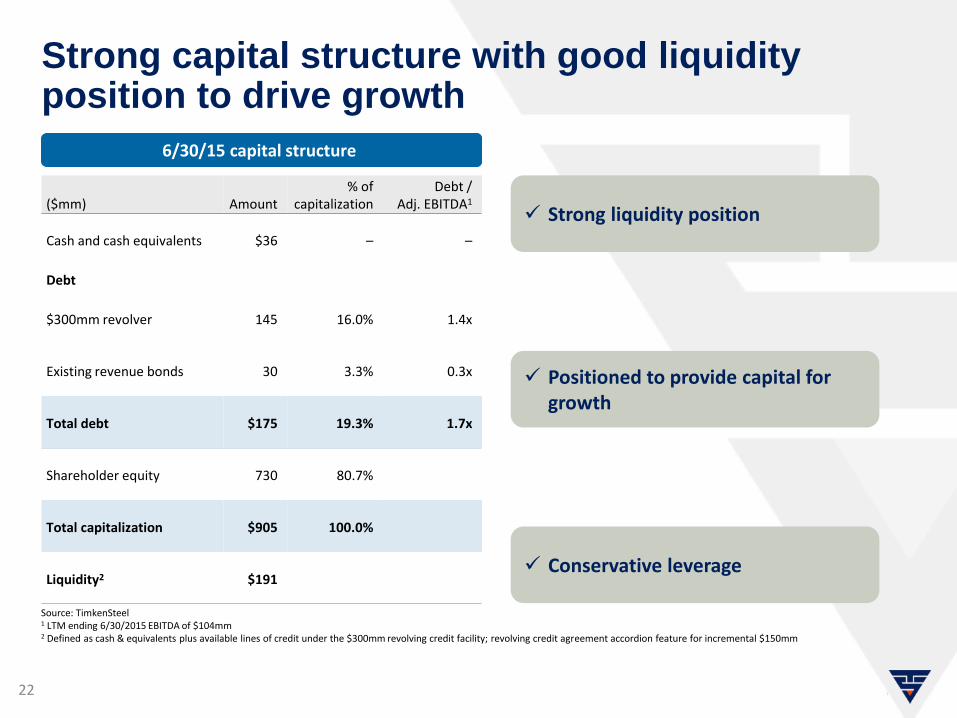
Strong capital structure with good liquidity position to drive growth
6/30/15 capital structure
Source: TimkenSteel1 LTM ending 6/30/2015 EBITDA of $104mm2 Defined as cash & equivalents plus available lines of credit under the $300mm revolving credit facility; revolving credit agreement accordion feature for incremental $150mm
Conservative leverage
Positioned to provide capital for growth
Strong liquidity position($mm) Amount
% ofcapitalization
Debt / Adj. EBITDA1
Cash and cash equivalents $36 – –
Debt
$300mm revolver 145 16.0% 1.4x
Existing revenue bonds 30 3.3% 0.3x
Total debt $175 19.3% 1.7x
Shareholder equity 730 80.7%
Total capitalization $905 100.0%
Liquidity2 $191
23
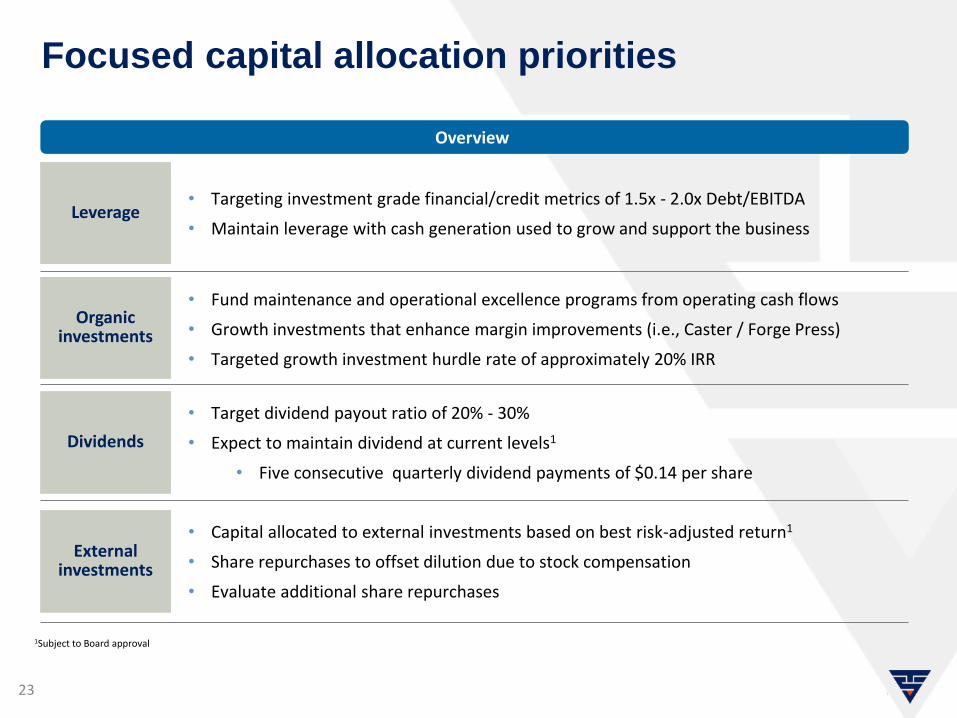
Focused capital allocation priorities
• Target dividend payout ratio of 20% - 30%
• Expect to maintain dividend at current levels1
• Five consecutive quarterly dividend payments of $0.14 per share
• Capital allocated to external investments based on best risk-adjusted return1
• Share repurchases to offset dilution due to stock compensation
• Evaluate additional share repurchases
• Targeting investment grade financial/credit metrics of 1.5x - 2.0x Debt/EBITDA
• Maintain leverage with cash generation used to grow and support the business
Organic investments
Dividends
External investments
Leverage
• Fund maintenance and operational excellence programs from operating cash flows
• Growth investments that enhance margin improvements (i.e., Caster / Forge Press)
• Targeted growth investment hurdle rate of approximately 20% IRR
Overview
1Subject to Board approval
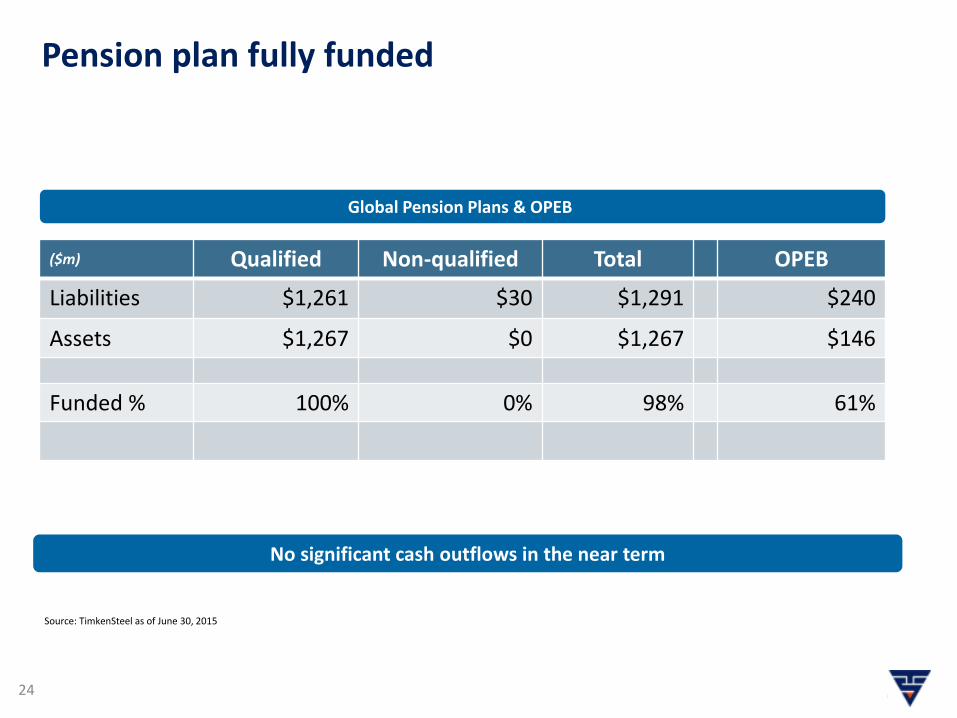
Pension plan fully funded
24
Global Pension Plans & OPEB
Source: TimkenSteel as of June 30, 2015
($m) Qualified Non-qualified Total OPEB
Liabilities $1,261 $30 $1,291 $240
Assets $1,267 $0 $1,267 $146
Funded % 100% 0% 98% 61%
No significant cash outflows in the near term
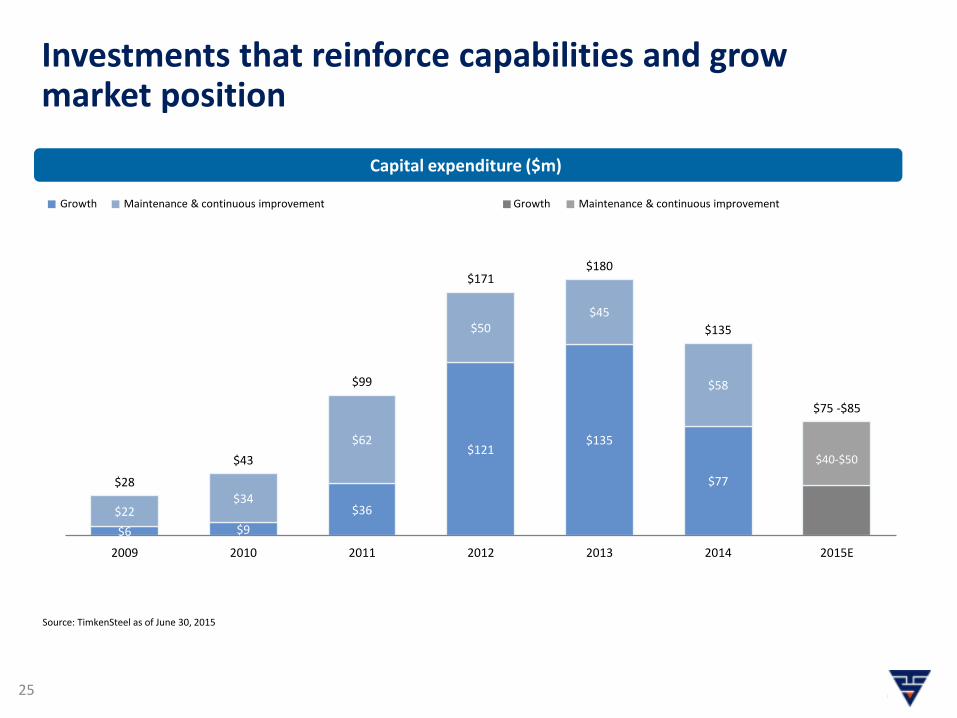
Investments that reinforce capabilities and grow market position
25
$6 $9
$36
$121$135
$77
$22$34
$62
$50$45
$58
$28
$43
$99
$171$180
$135
$75 -$85
2009 2010 2011 2012 2013 2014 2015E
$40-$50
Capital expenditure ($m)
Source: TimkenSteel as of June 30, 2015
Growth Maintenance & continuous improvement Growth Maintenance & continuous improvement
$426
$485
$429
$388$401
$409$420
$440
$415 $421
$397
$335
$250$250
$300
$350
$400
$450
$500
2010 2011 2012 1Q2013
2Q2013
3Q2013
4Q2013
1Q2014
2Q2014
3Q2014
4Q2014
1Q2015
2Q2015
#1 Busheling Index (3 city avg) Linear (#1 Busheling Index (3 city avg))
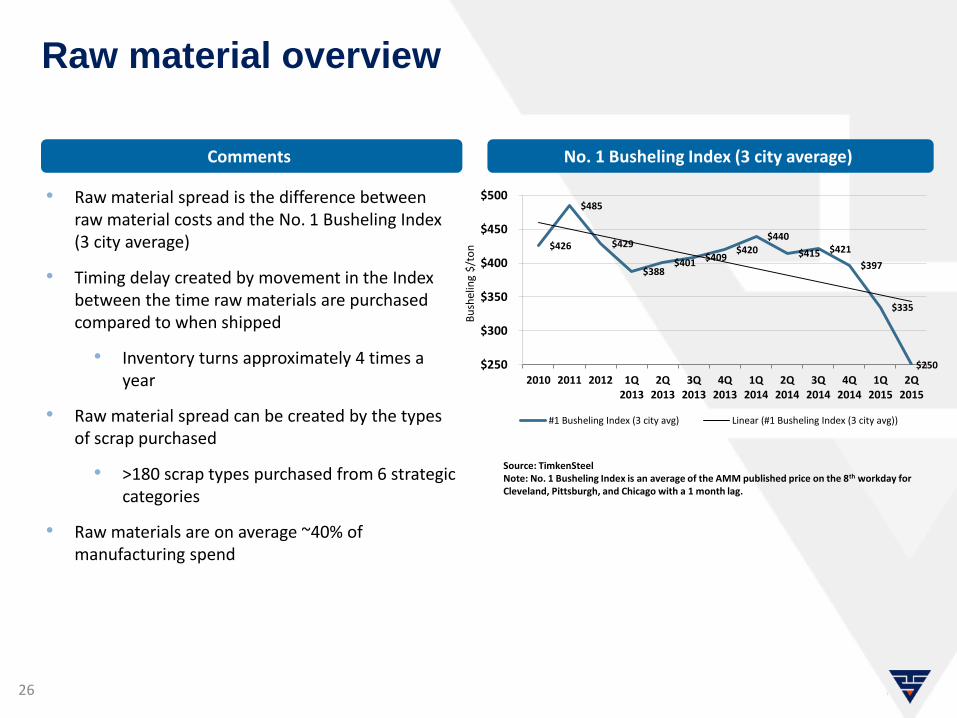
26
Raw material overview
Comments No. 1 Busheling Index (3 city average)
• Raw material spread is the difference between raw material costs and the No. 1 Busheling Index (3 city average)
• Timing delay created by movement in the Index between the time raw materials are purchased compared to when shipped
• Inventory turns approximately 4 times a year
• Raw material spread can be created by the types of scrap purchased
• >180 scrap types purchased from 6 strategic categories
• Raw materials are on average ~40% of manufacturing spend
Source: TimkenSteel Note: No. 1 Busheling Index is an average of the AMM published price on the 8th workday for Cleveland, Pittsburgh, and Chicago with a 1 month lag.
Bu
shel
ing
$/t
on
27
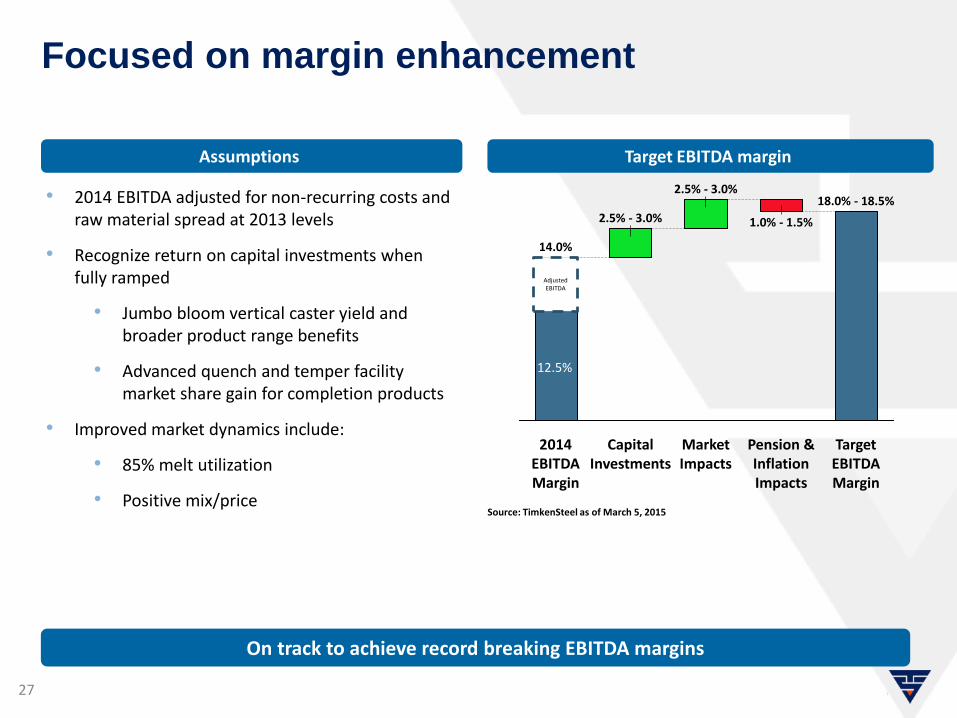
Focused on margin enhancement
Assumptions Target EBITDA margin
• 2014 EBITDA adjusted for non-recurring costs and raw material spread at 2013 levels
• Recognize return on capital investments when fully ramped
• Jumbo bloom vertical caster yield and broader product range benefits
• Advanced quench and temper facility market share gain for completion products
• Improved market dynamics include:
• 85% melt utilization
• Positive mix/price Source: TimkenSteel as of March 5, 2015
On track to achieve record breaking EBITDA margins
14.0%
2.5% - 3.0%
2014 EBITDA Margin
Capital Investments
2.5% - 3.0%
Market Impacts
1.0% - 1.5%
Target EBITDA Margin
Pension & Inflation Impacts
18.0% - 18.5%
Adjusted EBITDA
12.5%
Appendix
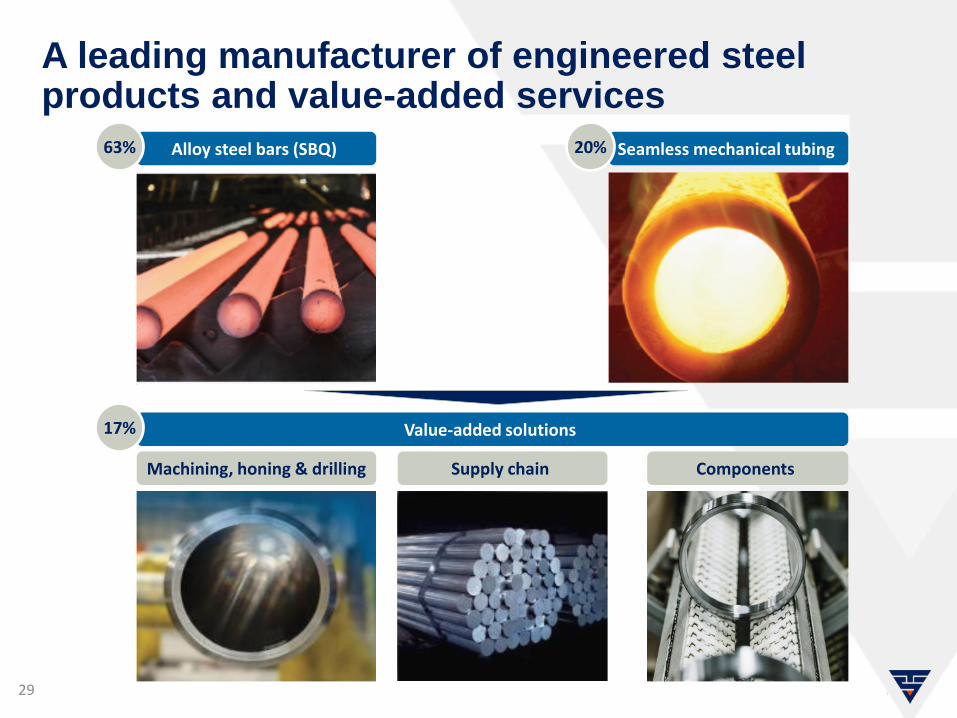
A leading manufacturer of engineered steel products and value-added services
29
Alloy steel bars (SBQ) Seamless mechanical tubing
Value-added solutions
63% 20%
17%
Machining, honing & drilling Supply chain Components

30
Broad size range strengthens our competitive position
6:1 Reduction – Machining
0 1 2 3 4 5 6 7 8 9 10 11 12 13 14 15 16
Gerdau MacSteel
Republic Steel
Steel Dynamics -Pittsboro
Nucor - Memphis
TimkenSteel
Bar Diameter (Inches)
Source: TimkenSteel internal estimates as of 12/31/2014
3.5mm tonsApprox. market sector size 1.8mm tons 0.8mm tons 0.4mm tons
31
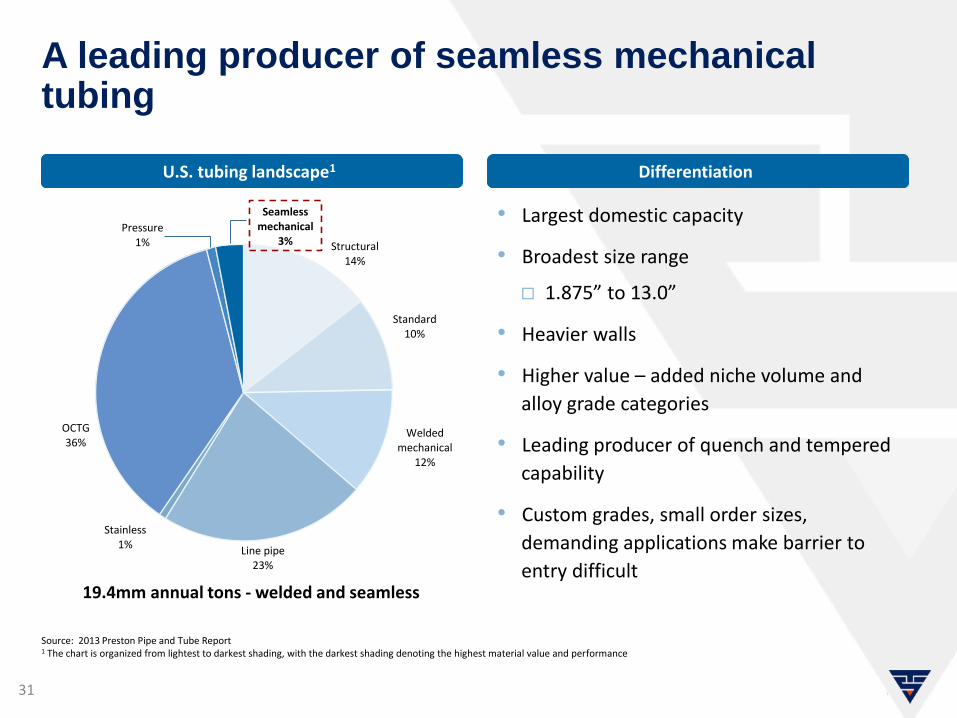
A leading producer of seamless mechanical tubing
U.S. tubing landscape1 Differentiation
Structural14%
Standard10%
Welded mechanical
12%
Line pipe23%
Stainless1%
OCTG36%
Pressure1%
Seamless mechanical
3%
• Largest domestic capacity
• Broadest size range
1.875” to 13.0”
• Heavier walls
• Higher value – added niche volume and
alloy grade categories
• Leading producer of quench and tempered
capability
• Custom grades, small order sizes,
demanding applications make barrier to
entry difficult
Source: 2013 Preston Pipe and Tube Report1 The chart is organized from lightest to darkest shading, with the darkest shading denoting the highest material value and performance
19.4mm annual tons - welded and seamless

TimkenSteel applications in autos
32
Engine ~35%• Crankshafts
• Connecting rods
• Fuel components
Driveline ~25%• Bearing hubs
• Ring gear
• Drive pinion
• Axle tubing
• Side gears
• Steering knuckle
• CV Joint housing & cages
• Ring gears
Transmission ~40%• Shafts
• Hubs
• CVT pulley
• Sun, ring, pinion gears
• Drive gears
33
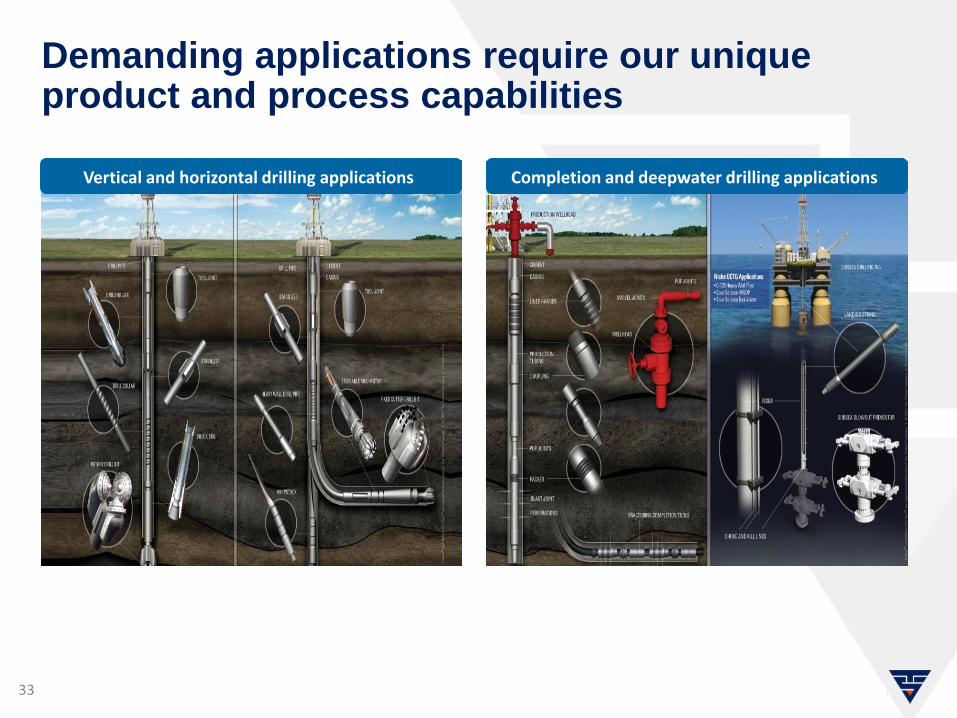
Demanding applications require our unique product and process capabilities
Vertical and horizontal drilling applications Completion and deepwater drilling applications
34
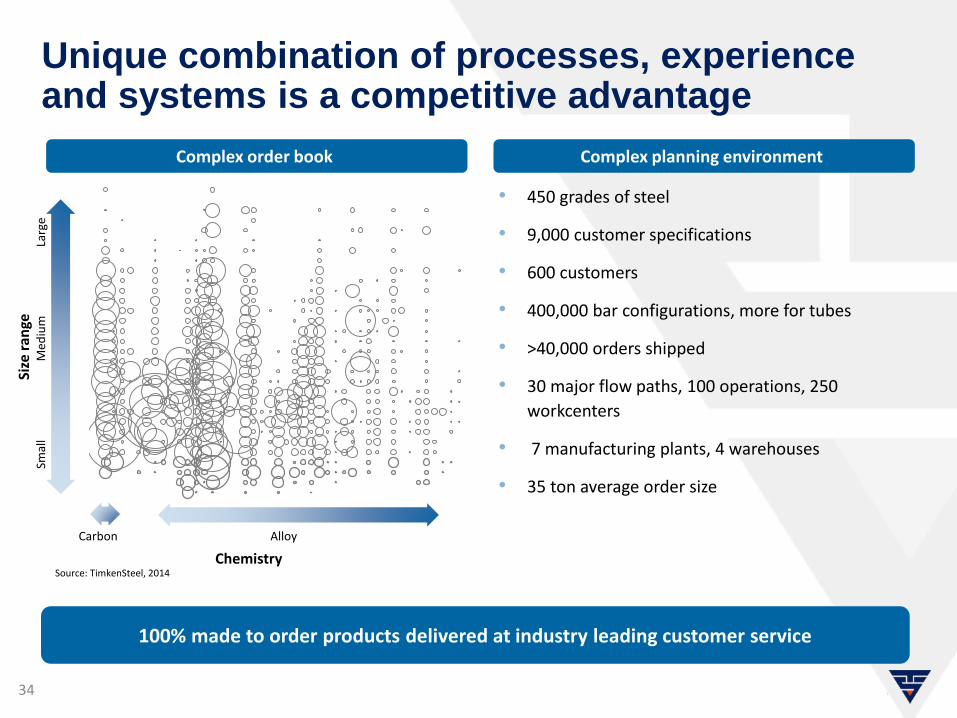
Unique combination of processes, experience and systems is a competitive advantage
Complex order book Complex planning environment
• 450 grades of steel
• 9,000 customer specifications
• 600 customers
• 400,000 bar configurations, more for tubes
• >40,000 orders shipped
• 30 major flow paths, 100 operations, 250
workcenters
• 7 manufacturing plants, 4 warehouses
• 35 ton average order size
100% made to order products delivered at industry leading customer service
Smal
lM
ediu
mLa
rge
Size
ran
ge
Carbon Alloy
ChemistrySource: TimkenSteel, 2014
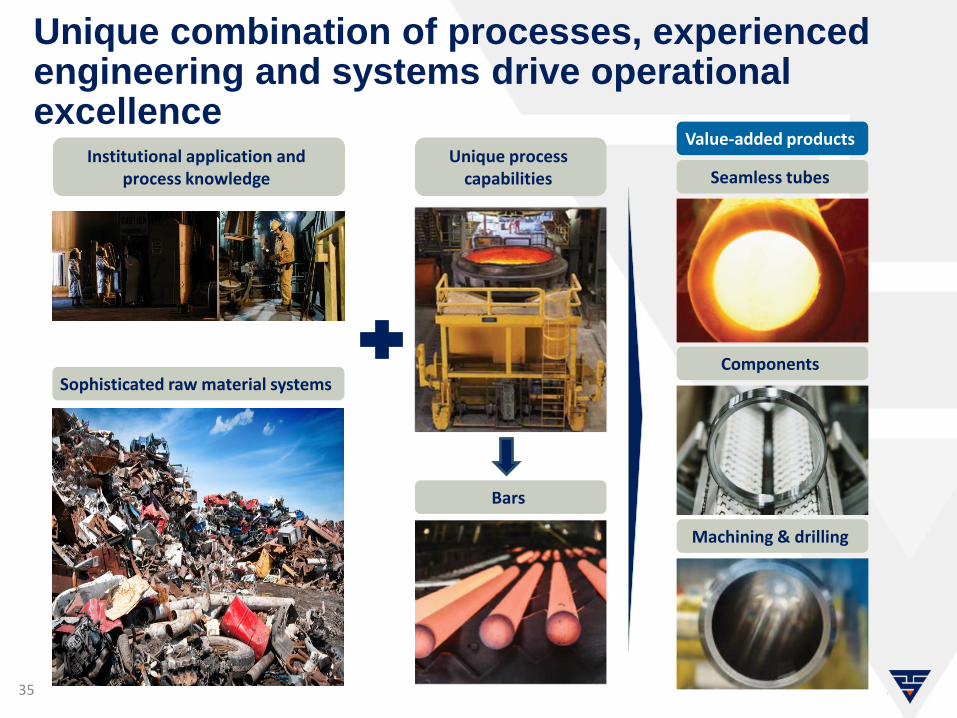
Unique combination of processes, experienced engineering and systems drive operational excellence
35
Institutional application and process knowledge
Unique process capabilities
Sophisticated raw material systems
Value-added products
Seamless tubes
Components
Bars
Machining & drilling
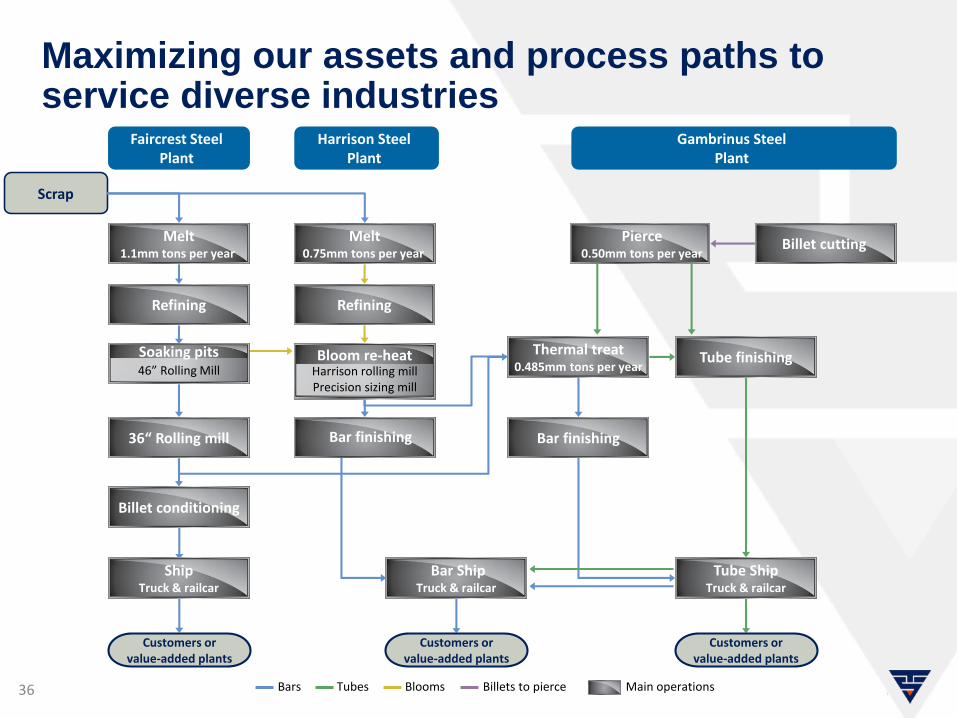
Maximizing our assets and process paths to service diverse industries
36 Main operationsBars Tubes Blooms Billets to pierce
RefiningRefining
Melt1.1mm tons per year
Pierce0.50mm tons per year
Thermal treat0.485mm tons per year
Tube finishing
Bar finishing Bar finishing
ShipTruck & railcar
Billet conditioning
Billet cutting
Bloom re-heatHarrison rolling millPrecision sizing mill
Faircrest Steel Plant
Harrison Steel Plant
Gambrinus Steel Plant
Melt0.75mm tons per year
Bar ShipTruck & railcar
Tube ShipTruck & railcar
Customers or value-added plants
36“ Rolling mill
Scrap
Soaking pits46” Rolling Mill
Customers or value-added plants
Customers or value-added plants
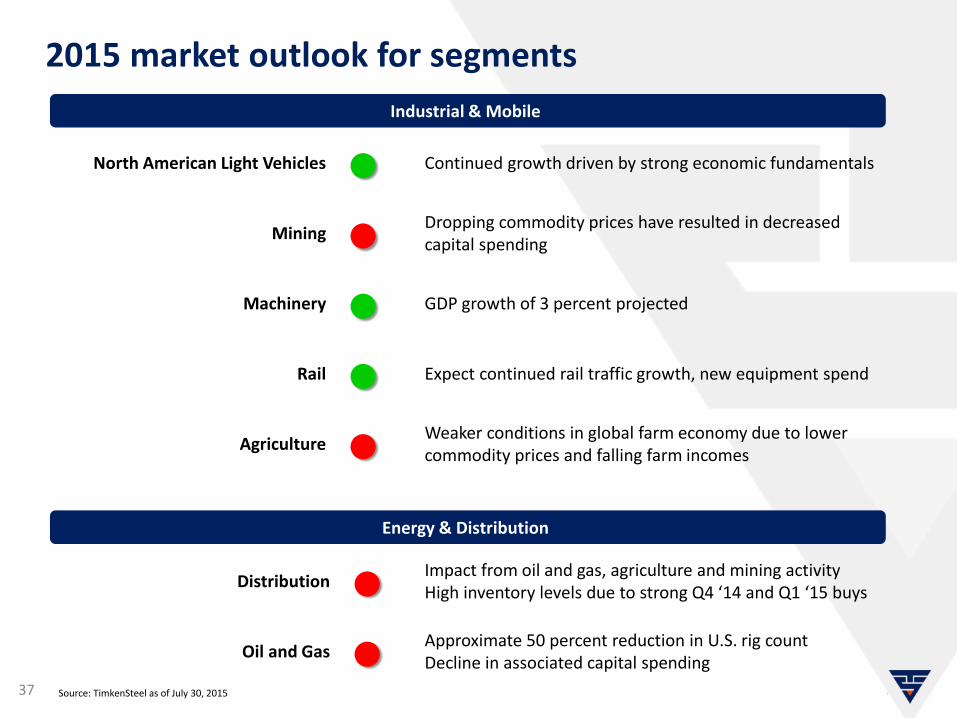
2015 market outlook for segments
37
Industrial & Mobile
North American Light Vehicles ● Continued growth driven by strong economic fundamentals
Mining ● Dropping commodity prices have resulted in decreased capital spending
Machinery ● GDP growth of 3 percent projected
Rail ● Expect continued rail traffic growth, new equipment spend
Agriculture ● Weaker conditions in global farm economy due to lower commodity prices and falling farm incomes
Energy & Distribution
Distribution ● Impact from oil and gas, agriculture and mining activity High inventory levels due to strong Q4 ‘14 and Q1 ‘15 buys
Oil and Gas ● Approximate 50 percent reduction in U.S. rig countDecline in associated capital spending
Source: TimkenSteel as of July 30, 2015
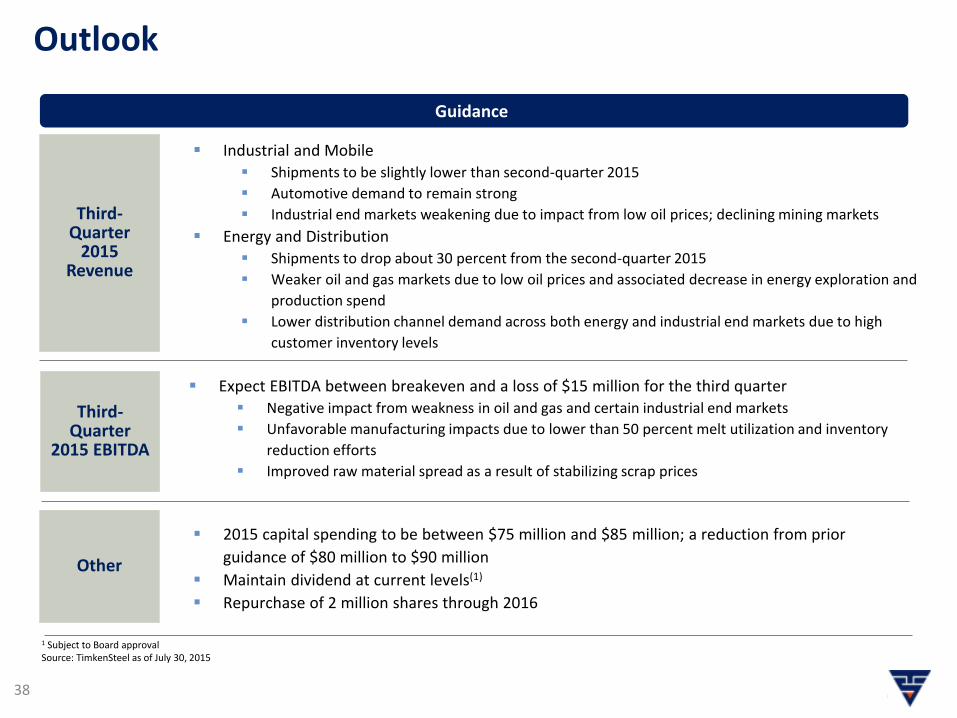
Outlook
38
Guidance
Third-Quarter
2015 Revenue
Third-Quarter
2015 EBITDA
Expect EBITDA between breakeven and a loss of $15 million for the third quarter
Negative impact from weakness in oil and gas and certain industrial end markets
Unfavorable manufacturing impacts due to lower than 50 percent melt utilization and inventory
reduction efforts
Improved raw material spread as a result of stabilizing scrap prices
Industrial and Mobile
Shipments to be slightly lower than second-quarter 2015
Automotive demand to remain strong
Industrial end markets weakening due to impact from low oil prices; declining mining markets
Energy and Distribution Shipments to drop about 30 percent from the second-quarter 2015
Weaker oil and gas markets due to low oil prices and associated decrease in energy exploration and
production spend
Lower distribution channel demand across both energy and industrial end markets due to high
customer inventory levels
1 Subject to Board approvalSource: TimkenSteel as of July 30, 2015
Other
2015 capital spending to be between $75 million and $85 million; a reduction from prior
guidance of $80 million to $90 million
Maintain dividend at current levels(1)
Repurchase of 2 million shares through 2016
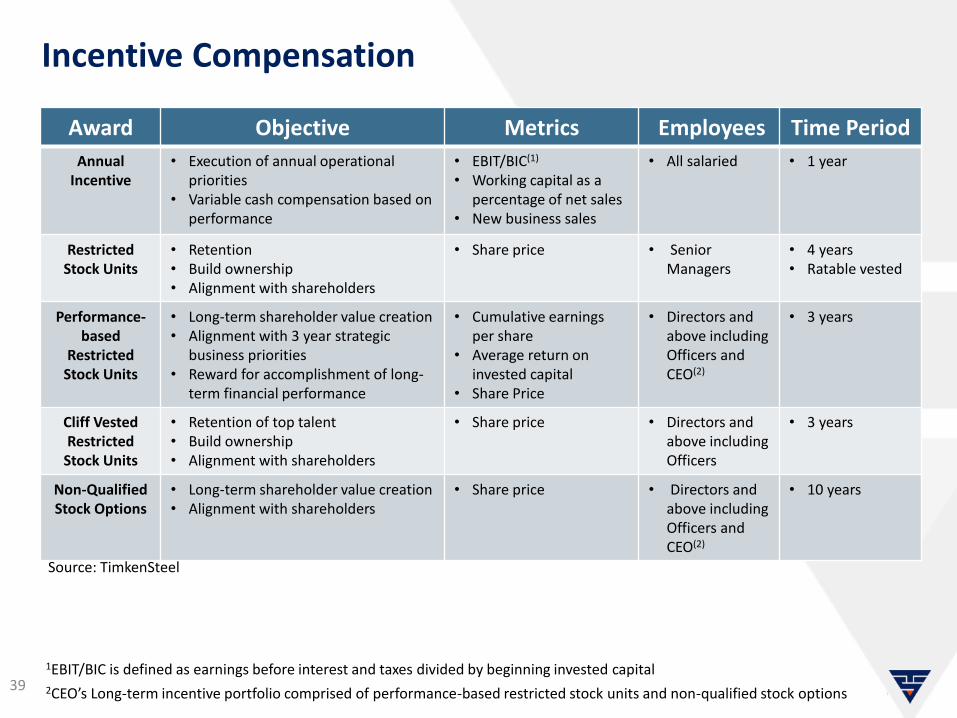
Incentive Compensation
Award Objective Metrics Employees Time Period
AnnualIncentive
• Execution of annual operational priorities
• Variable cash compensation based on performance
• EBIT/BIC(1)
• Working capital as a percentage of net sales
• New business sales
• All salaried • 1 year
Restricted Stock Units
• Retention• Build ownership• Alignment with shareholders
• Share price • Senior Managers
• 4 years • Ratable vested
Performance-based
RestrictedStock Units
• Long-term shareholder value creation• Alignment with 3 year strategic
business priorities• Reward for accomplishment of long-
term financial performance
• Cumulative earningsper share
• Average return on invested capital
• Share Price
• Directors and above including Officers and CEO(2)
• 3 years
Cliff Vested Restricted
Stock Units
• Retention of top talent• Build ownership• Alignment with shareholders
• Share price • Directors and above including Officers
• 3 years
Non-QualifiedStock Options
• Long-term shareholder value creation• Alignment with shareholders
• Share price • Directors and above including Officers and CEO(2)
• 10 years
Source: TimkenSteel
1EBIT/BIC is defined as earnings before interest and taxes divided by beginning invested capital2CEO’s Long-term incentive portfolio comprised of performance-based restricted stock units and non-qualified stock options
39
(1)Non-GAAP financial measures TimkenSteel reports its financial results in accordance with accounting principles generally accepted in the United States (“GAAP”) and corresponding metrics as non-GAAP financial measures. EBIT is defined as net income before interest expense and income taxes. EBIT is an important financial measure used in the management of the business, including decisions concerning the allocation of resources and assessment of performance. Management believes that reporting EBIT is useful to investors as this measure isrepresentative of the company's performance. It also is a useful reflection of the underlying growth from the ongoing activities of the business and provides improved comparability of results.
For the periods prior to the spinoff, the consolidated financial statements have been prepared on a stand-alone basis and are derived from the consolidated financial statements and accounting records of TimkenSteel’s former parent company, The Timken Company. TimkenSteel’s consolidated financial statements include certain expenses of its former parent that were allocated to the steel business for certain functions, including general corporate expenses related to finance, legal, information technology, human resources, compliance, shared services, insurance, employee benefits and incentives and stock-based compensation. TimkenSteel considers the expense allocation methodology and results to be reasonable for all periods presented. However, these allocations may not be indicative of the actual expenses TimkenSteel would have incurred as an independent public company or of the costs itwill incur in the future. Adjusted EPS is defined as net income reduced for stand-alone costs reflected at a normal run rate divided by the weighted average shares outstanding including the dilutive effect of stock-based awards. Adjusted EBIT is defined as EBIT reduced for stand-alone costs reflected at a normal run-rate. Adjusted EBIT margin is defined as adjusted EBIT as a percentage of net sales. Management believes that reporting adjusted EPS, adjusted EBIT and adjusted EBIT margin is useful to investors as these measures are representative of the company's performance. They also better reflect the underlying growth from the ongoing activities of the business and provide an indication of the company’s performance as an independent public company.
See the attached schedules for supplemental financial data and corresponding reconciliations of the non-GAAP financial measures referred to above to the most comparable GAAP financial measures for the three and six months ended June 30, 2015. Non-GAAP financial measures should be viewed in addition to, and not as an alternative for, TimkenSteel's results prepared in accordance with GAAP. In addition, the non-GAAP measures TimkenSteel uses may differ from non-GAAP measures used by other companies, and other companies may not define the non-GAAP measures TimkenSteel uses in the same way.
40
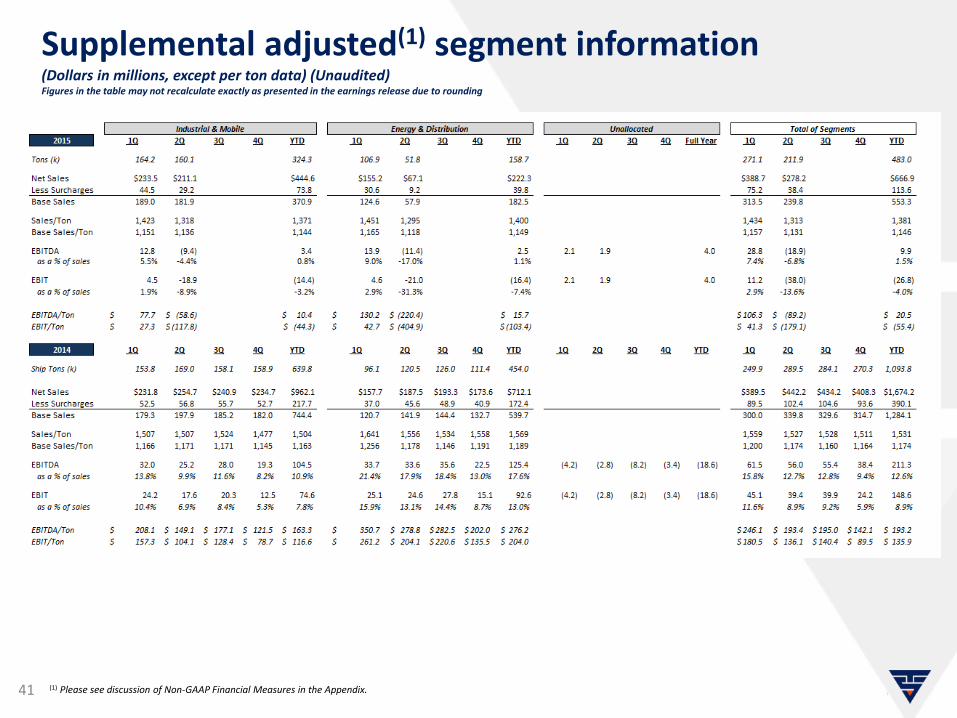
Supplemental adjusted(1) segment information(Dollars in millions, except per ton data) (Unaudited)Figures in the table may not recalculate exactly as presented in the earnings release due to rounding
(1) Please see discussion of Non-GAAP Financial Measures in the Appendix.41
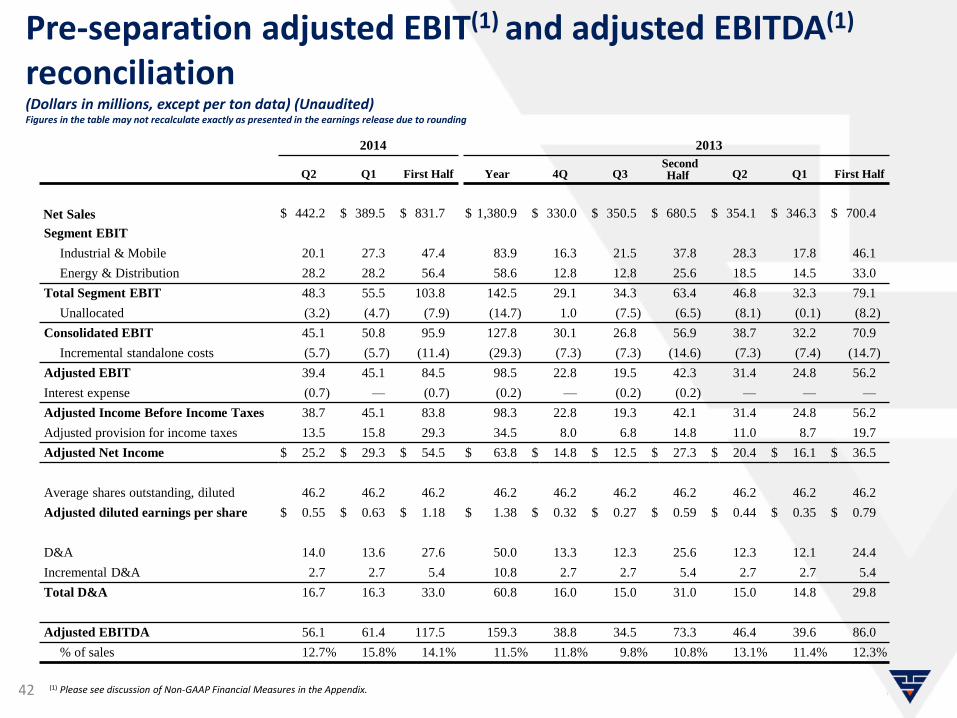
2014 2013
Q2 Q1 First Half Year 4Q Q3Second Half Q2 Q1 First Half
Net Sales $ 442.2 $ 389.5 $ 831.7 $ 1,380.9 $ 330.0 $ 350.5 $ 680.5 $ 354.1 $ 346.3 $ 700.4
Segment EBIT
Industrial & Mobile 20.1 27.3 47.4 83.9 16.3 21.5 37.8 28.3 17.8 46.1
Energy & Distribution 28.2 28.2 56.4 58.6 12.8 12.8 25.6 18.5 14.5 33.0
Total Segment EBIT 48.3 55.5 103.8 142.5 29.1 34.3 63.4 46.8 32.3 79.1
Unallocated (3.2) (4.7) (7.9) (14.7) 1.0 (7.5) (6.5) (8.1) (0.1) (8.2)
Consolidated EBIT 45.1 50.8 95.9 127.8 30.1 26.8 56.9 38.7 32.2 70.9
Incremental standalone costs (5.7) (5.7) (11.4) (29.3) (7.3) (7.3) (14.6) (7.3) (7.4) (14.7)
Adjusted EBIT 39.4 45.1 84.5 98.5 22.8 19.5 42.3 31.4 24.8 56.2
Interest expense (0.7) — (0.7) (0.2) — (0.2) (0.2) — — —
Adjusted Income Before Income Taxes 38.7 45.1 83.8 98.3 22.8 19.3 42.1 31.4 24.8 56.2
Adjusted provision for income taxes 13.5 15.8 29.3 34.5 8.0 6.8 14.8 11.0 8.7 19.7
Adjusted Net Income $ 25.2 $ 29.3 $ 54.5 $ 63.8 $ 14.8 $ 12.5 $ 27.3 $ 20.4 $ 16.1 $ 36.5
Average shares outstanding, diluted 46.2 46.2 46.2 46.2 46.2 46.2 46.2 46.2 46.2 46.2
Adjusted diluted earnings per share $ 0.55 $ 0.63 $ 1.18 $ 1.38 $ 0.32 $ 0.27 $ 0.59 $ 0.44 $ 0.35 $ 0.79
D&A 14.0 13.6 27.6 50.0 13.3 12.3 25.6 12.3 12.1 24.4
Incremental D&A 2.7 2.7 5.4 10.8 2.7 2.7 5.4 2.7 2.7 5.4
Total D&A 16.7 16.3 33.0 60.8 16.0 15.0 31.0 15.0 14.8 29.8
Adjusted EBITDA 56.1 61.4 117.5 159.3 38.8 34.5 73.3 46.4 39.6 86.0
% of sales 12.7% 15.8% 14.1% 11.5% 11.8% 9.8% 10.8% 13.1% 11.4% 12.3%
(1) Please see discussion of Non-GAAP Financial Measures in the Appendix.42
Pre-separation adjusted EBIT(1) and adjusted EBITDA(1)
reconciliation(Dollars in millions, except per ton data) (Unaudited)Figures in the table may not recalculate exactly as presented in the earnings release due to rounding
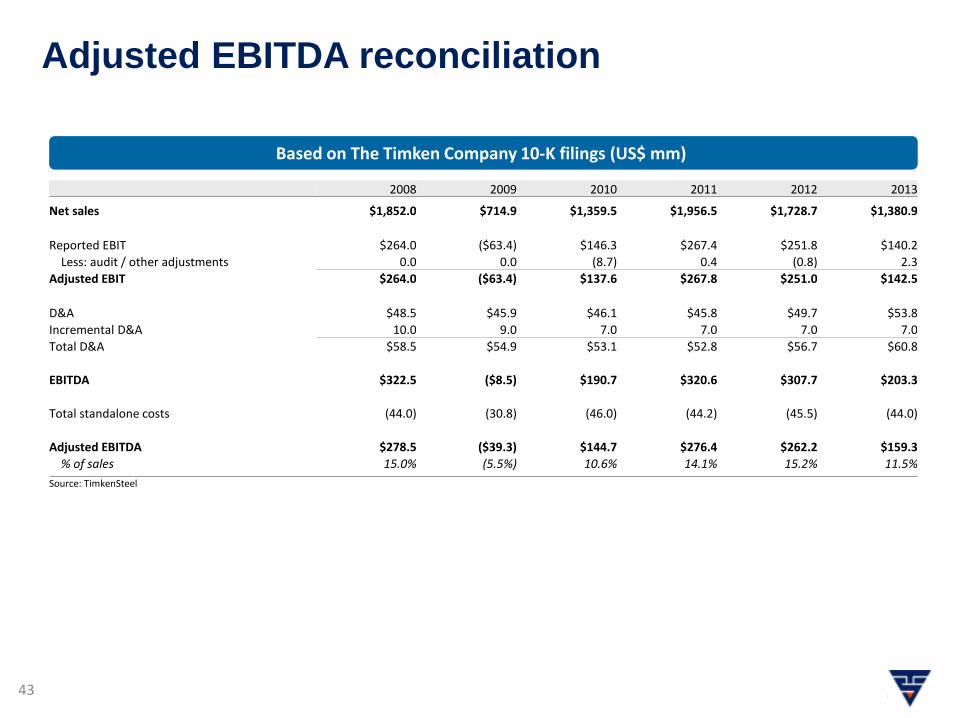
Adjusted EBITDA reconciliation
43
Based on The Timken Company 10-K filings (US$ mm)
Source: TimkenSteel
2008 2009 2010 2011 2012 2013
Net sales $1,852.0 $714.9 $1,359.5 $1,956.5 $1,728.7 $1,380.9
Reported EBIT $264.0 ($63.4) $146.3 $267.4 $251.8 $140.2
Less: audit / other adjustments 0.0 0.0 (8.7) 0.4 (0.8) 2.3
Adjusted EBIT $264.0 ($63.4) $137.6 $267.8 $251.0 $142.5
D&A $48.5 $45.9 $46.1 $45.8 $49.7 $53.8
Incremental D&A 10.0 9.0 7.0 7.0 7.0 7.0
Total D&A $58.5 $54.9 $53.1 $52.8 $56.7 $60.8
EBITDA $322.5 ($8.5) $190.7 $320.6 $307.7 $203.3
Total standalone costs (44.0) (30.8) (46.0) (44.2) (45.5) (44.0)
Adjusted EBITDA $278.5 ($39.3) $144.7 $276.4 $262.2 $159.3
% of sales 15.0% (5.5%) 10.6% 14.1% 15.2% 11.5%
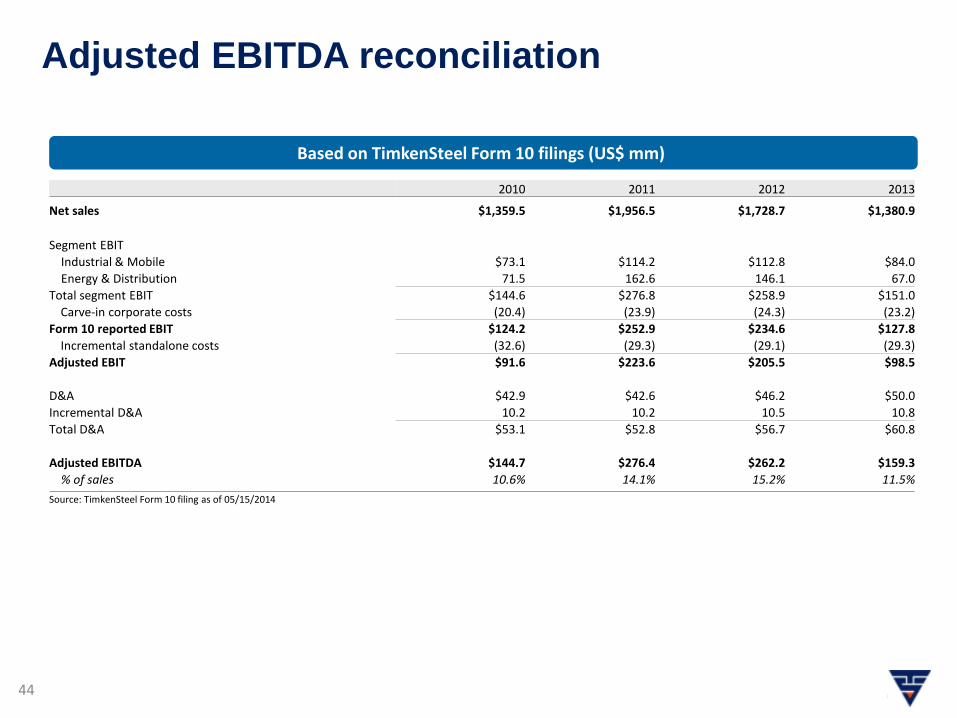
Adjusted EBITDA reconciliation
44
Based on TimkenSteel Form 10 filings (US$ mm)
Source: TimkenSteel Form 10 filing as of 05/15/2014
2010 2011 2012 2013
Net sales $1,359.5 $1,956.5 $1,728.7 $1,380.9
Segment EBIT
Industrial & Mobile $73.1 $114.2 $112.8 $84.0
Energy & Distribution 71.5 162.6 146.1 67.0
Total segment EBIT $144.6 $276.8 $258.9 $151.0
Carve-in corporate costs (20.4) (23.9) (24.3) (23.2)
Form 10 reported EBIT $124.2 $252.9 $234.6 $127.8
Incremental standalone costs (32.6) (29.3) (29.1) (29.3)
Adjusted EBIT $91.6 $223.6 $205.5 $98.5
D&A $42.9 $42.6 $46.2 $50.0
Incremental D&A 10.2 10.2 10.5 10.8
Total D&A $53.1 $52.8 $56.7 $60.8
Adjusted EBITDA $144.7 $276.4 $262.2 $159.3
% of sales 10.6% 14.1% 15.2% 11.5%
45