Embed Size (px)
Citation preview

Shale Frac Sequential Flowback Analyses and Reuse
Implications
EPA Technical Workshop, March 30, 2011
Matt Blauch
Superior Well Services

The Ideal Engineered Reuse Solution Should Be…
• Able to Reduce Environmental Risk
• Effective for Fracturing
• Practical & Economic
• Able to Provide microbiological Control
• Non-Damaging to Production

What is needed for reuse?Sequential Flowback Analyses
0.0
10.0
20.0
30.0
40.0
50.0
60.0
70.0
80.0
0 5,000 10,000 15,000
Co
nst
itu
en
t (p
pm
)
Flowback (barrels)
Iron Trend
2500 bbls 5000 bbls 14000 bbls
Multiple Ion Trend

Flowback and Frac Waters Data Set
• 235 Frac Water Sources
• 524 Flowback Samples
• 25 Sequential Flowback Studies

R² = 0.9954
0
10,000
20,000
30,000
40,000
50,000
60,000
0 20,000 40,000 60,000 80,000 100,000
Ch
lori
de
(m
g/L
)
TDS (mg/L)
Chloride Content vs Total Dissolved Solids
In Marcellus Formation

0
100
200
300
400
500
600
700
800
900
0 5,000 10,000 15,000 20,000
Co
nst
itu
en
t (m
g/L
)
Flowback (bbls)
Barium Sulfate
Barium & Sulfate Trend
In Marcellus Formation

Distribution of Marcellus Sequential Flowback Studies
SusquehannaPotter
Jefferson
Armstrong
Allegheny
Butler
Westmoreland
FayetteWashington

0
25,000
50,000
75,000
100,000
125,000
150,000
0 2,000 4,000 6,000 8,000 10,000
Tota
l Dis
solv
ed
So
lids
(mg
/L)
Flowback (bbls)
Susquehanna Jefferson
Armstrong Fayette
TDS Content vs. Marcellus Flowback

0
5,000
10,000
15,000
20,000
25,000
30,000
0 2,000 4,000 6,000 8,000 10,000
Tota
l Har
dn
ess
(mg
/L a
s C
aCO
3)
Flowback (bbls)
Susquehanna Jefferson
Armstrong Fayette
Hardness vs Marcellus Flowback Volume by Region

0
200
400
600
800
1,000
1,200
1,400
1,600
1,800
2,000
0 2,000 4,000 6,000 8,000 10,000
Bar
ium
(m
g/L
)
Flowback (bbls)
Armstrong Fayette
Barium Content vs Marcellus Flowback
Susquehanna Jefferson

Calcium Content of Flowback @ 7,500bbl
EastWest
0
10,000
20,000
30,000
40,000
50,000
60,000
70,000
80,000
90,000
100,000
-100.0 -80.0 -60.0 -40.0 -20.0 0.0 20.0
Cal
ciu
m C
on
ten
t (m
g/L
)
GPS (Longitude)

Marcellus Well Sites – Load Recovery(%)
0.00%
10.00%
20.00%
30.00%
40.00%
50.00%
60.00%
417 418 419 421 422 423 425 426 427 428 219 225 287 304 340 352
Pe
rce
nt
Flu
id R
eco
very
(b
bls
)
Project Number (well site)
0
25,000
50,000
75,000
100,000
125,000
150,000
0 2,000 4,000 6,000 8,000 10,000
Tota
l Dis
solv
ed
So
lids
(mg
/L)
Flowback (bbls)
Susquehanna Jefferson Armstrong Fayette Texas(1) Texas(2)
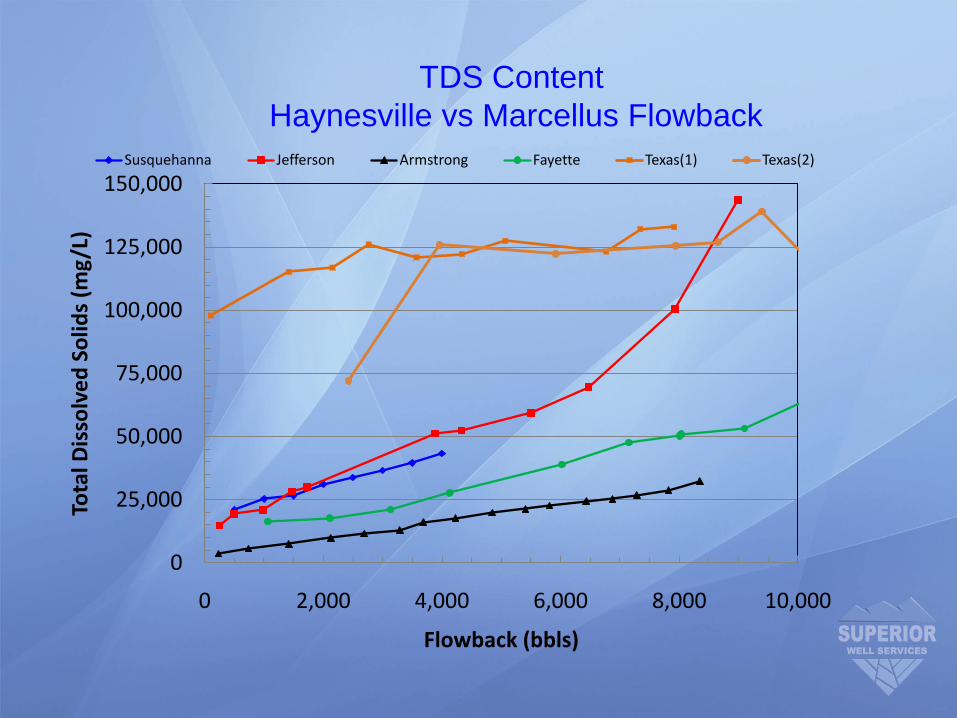
TDS Content
Haynesville vs Marcellus Flowback

What is needed for reuse?Geochemical Controls
• Sophisticated Geochemical Scale Modeling Simulator
• Specific to Downhole Conditions
DownHole SAT Rx
INJECTION WATER CHEMISTRY INPUT

Geologic Hypotheses for Flowback ChemistryMarcellus Paleogeography
Figure after Lash, 2009
Ref: SPE 125740, Blauch, et.al. 2009

Ref: SPE 125740, Blauch, et.al. 2009
Deep Basinal Hypersaline Fluids
Oriskany Waters Across Pennsylvania

Hypothesis Testing – Drilled Cuttings Analysis

Hypothesis Testing –Core Analysis
Cation Bulk Core Salt Scraping
Ba 1% 2%
Ca 40% 42%
Fe 46% 5%
K 4% 7%
Mg 6% 3%
Na 2% 40%
Sr 1% 1%
Total 100% 100%
Ref: SPE 125740, Blauch, et.al. 2009

Hypothesis Testing Diagnostic Tool –Piper Analysis
Ca2+
Mg2+
Na+ + K
+CO3
2- + HCO3
-
SO4
2-
Cl-
SO
42- +
Cl
- Ca 2+
+ M
g 2+
EXPLANATION
Marcellus Flowback Water
Dead Sea Geochemistry
Oriskany Geochemistry
5638.1
341586.6
Early Flowback
Late Flowback
Typical
Freshwater
Mix
ing
line
Reused
Frac Water
Mixing line
Ref: SPE 125740, Blauch, et.al. 2009

Conclusions
• Shale Frac Sequential Flowback Analysis have become important to HVHR fracturing in the Marcellus shale
• Variations in flowback geochemistry are observed both spatially and volumetrically
• Understanding the origin of dissolved salts is important to future water reuse and water management strategies
• Predictive analysis tools such as Piper analysis and geochemical simulation play an important role in water reuse and treatment design
• Functional performance testing of flowback water for reuse is recommended

Acknowledgements
• Thanks to:
– USEPA for the opportunity to present
– Superior Well Services and Nabors
– Kroff Well Services
• Paul Rey, Dave Grottenthaler
– Session chair, Tom Hayes

63
Shale Frac Sequential Flowback Analysis and Reuse Implications Matt Blauch
Superior Well Services, a Nabors Company
The statements made during the workshop do not represent the views or opinions of EPA. The claims made by participants have not been verified or endorsed by EPA.
Water re-use challenges and solutions have direct and indirect influences in the design of hydraulic fracturing fluid systems and products used in High Volume, High Rate (HVHR) hydraulic fracturing of shale wells (1,2). In general, effectively engineered water reuse solutions should: provide effective fracture development, allow practical application and economic performance, be non-damaging to well production, extend microbiological control, minimize environmental impact and reduce environmental risk. Until relatively recently, HVHR fracturing required the use of fresh water as the base fluid due to the sensitivity of polymeric friction reducers to high TDS waters and concerns that the interaction of the frac fluid constituents with the formation would result in adverse precipitation of geochemical mineral species often referred to as “scale”(3). Significant lessons learned from early HVHR fracturing and flowback analysis from the Marcellus shale has led to the development of products that have a higher degree of compatibility with the inorganic constituents in flowback waters as well as better understanding of the impacts of recycled flowback water on well performance (1). In general, much higher salinity fluids are now used than during initial development. However, much still remains to be learned from geospatial variations both within the Marcellus and other shale plays (2). Exploration into the geochemical variations and implications of high TDS flowback fluids for recycling and re-use in closed system fracturing applications is provided through ongoing flowback water analysis. To date, over 500 flowback samples obtained following HVHR fracturing operations have been catalogued. Sequential flowback studies involve time and volume dependent analysis of the flowback samples. The study presented includes results obtained from 25 sequential flowback studies representing discrete well site locations throughout the Marcellus shale play. In this case study, flowback analysis locations trend from the northeast to the southwest. A number of significant trends are observed.
TDS and Chloride Content
There is an exceptionally good correlation between chlorides and total dissolved solids (TDS) (i.e., R2 = 0.995). This would be expected since chlorides are the predominant anion in flowback waters. TDS levels range from approximately 200 mg/L to nearly 145,000 mg/L and concentration increases with time and flowback volume. Regional distribution of the TDS levels

64
appear to vary significantly. Well sites representing a cross section of Marcellus region were from the following counties; 1) Susquehanna; 2) Jefferson; 3) Armstrong and 4) Fayette. The highest salinity (TDS) content appears in the Jefferson data with TDS approaching 145,000 mg/L. The lowest TDS levels were observed in Armstrong County with values reaching approximately 30,000 mg/L.
Hardness vs. Marcellus Flowback Volume by Region
Total hardness, represented as CaCO3 shows a similar trend to the TDS on a distribution basis for each of the four regions. The significance of total hardness relates to both compatibility of the fracturing fluid chemical package and the geochemical propensity to precipitate potential production impairing minerals (3). The highest level of total hardness is represented in the Jefferson data set with values exceeding 30,000 mg/L in the late stage flowback.
Barium Content vs. Marcellus Flowback Volume by Region
Barium content is of particular interest during reuse due to the susceptibility of barium to form barium scales such as barium sulfate. Barium trends in the sequential flowback data show three primary geospatial signatures. In the Fayette and Armstrong signatures, very little barium is observed. In the Jefferson trend, barium levels are relatively low (approximately 50 to 400 mg/L) up to approximately 7,000 bbls recovered after which the levels rise to approximately 1,700 mg/L. The Susquehanna trend curve shows a relatively constant linear trend showing higher early uptake.
Geospatial Variation of Flowback Geochemistry
Correlation of water geochemistry to physical location (both latitude and longitude) provides insight into the potential to predict key water chemistry values for geochemical simulation purposes. One example is illustrated in the calcium trend versus longitude and latitude. With the exception of one anomalous point, when compared on a fixed volume basis, it appears that calcium content increases from west to east. However, there appears to be some very high brine content wells in the mid-state region. Such information can be utilized as a predictive tool in planning development of future well sites, with improved water management strategies, better scale prediction and more convergent reuse strategy.
Post-Frac Water Load Recovery
Load recovery following fracturing operations is a key aspect of any water reuse program since the load recovery volumes may vary across operating locations and the amount of water that can be recycled is dependent upon the final water chemistry. In many cases, significant dilution of flowback water with fresh water is applied to new completions. However, reuse consisting of 100% flowback water with no fresh water dilution is possible when augmented with treatment4
to remove all or a portion of the detrimental constituents. The load recovery from selected well sites indicates a range from less than 10% to nearly 60%. The dataset includes both vertical and horizontal wells. Geospatial variation shows weak, but positive correlation to latitude and longitude with the higher load recovery percentages occurring in the southern operating regions.
65
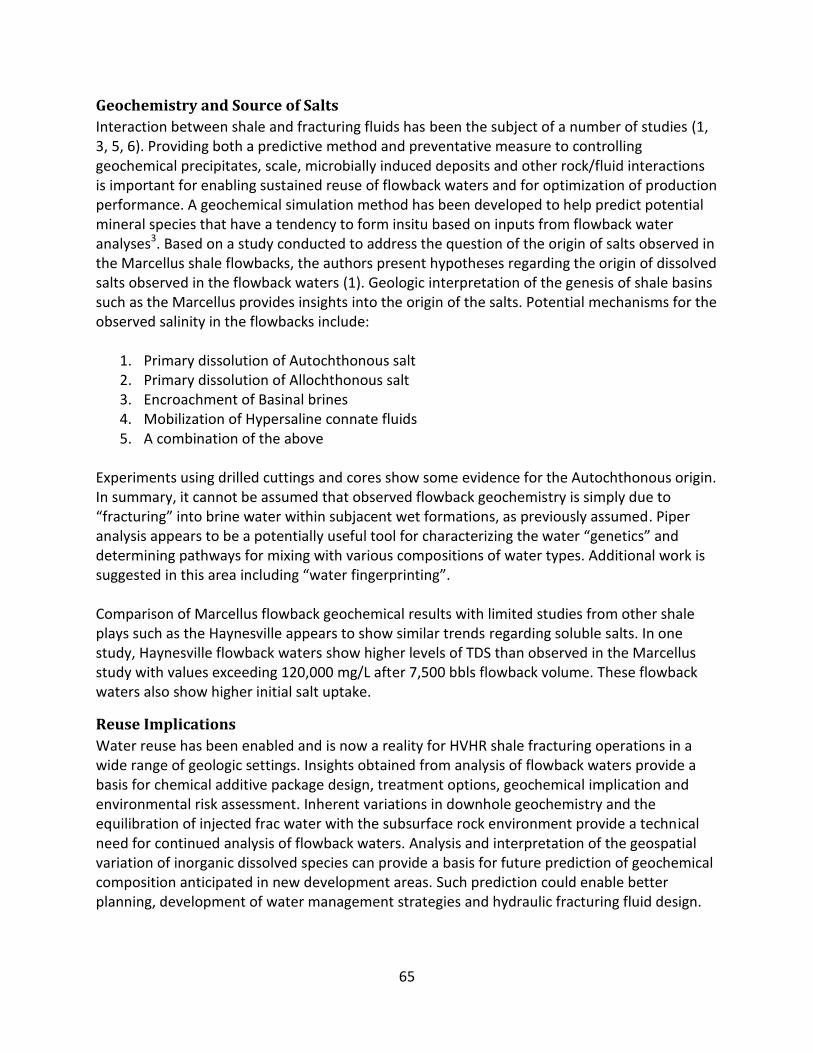
Geochemistry and Source of Salts
Interaction between shale and fracturing fluids has been the subject of a number of studies (1, 3, 5, 6). Providing both a predictive method and preventative measure to controlling geochemical precipitates, scale, microbially induced deposits and other rock/fluid interactions is important for enabling sustained reuse of flowback waters and for optimization of production performance. A geochemical simulation method has been developed to help predict potential mineral species that have a tendency to form insitu based on inputs from flowback water analyses3. Based on a study conducted to address the question of the origin of salts observed in the Marcellus shale flowbacks, the authors present hypotheses regarding the origin of dissolved salts observed in the flowback waters (1). Geologic interpretation of the genesis of shale basins such as the Marcellus provides insights into the origin of the salts. Potential mechanisms for the observed salinity in the flowbacks include:
1. Primary dissolution of Autochthonous salt 2. Primary dissolution of Allochthonous salt 3. Encroachment of Basinal brines 4. Mobilization of Hypersaline connate fluids 5. A combination of the above
Experiments using drilled cuttings and cores show some evidence for the Autochthonous origin. In summary, it cannot be assumed that observed flowback geochemistry is simply due to “fracturing” into brine water within subjacent wet formations, as previously assumed. Piper analysis appears to be a potentially useful tool for characterizing the water “genetics” and determining pathways for mixing with various compositions of water types. Additional work is suggested in this area including “water fingerprinting”. Comparison of Marcellus flowback geochemical results with limited studies from other shale plays such as the Haynesville appears to show similar trends regarding soluble salts. In one study, Haynesville flowback waters show higher levels of TDS than observed in the Marcellus study with values exceeding 120,000 mg/L after 7,500 bbls flowback volume. These flowback waters also show higher initial salt uptake.
Reuse Implications
Water reuse has been enabled and is now a reality for HVHR shale fracturing operations in a wide range of geologic settings. Insights obtained from analysis of flowback waters provide a basis for chemical additive package design, treatment options, geochemical implication and environmental risk assessment. Inherent variations in downhole geochemistry and the equilibration of injected frac water with the subsurface rock environment provide a technical need for continued analysis of flowback waters. Analysis and interpretation of the geospatial variation of inorganic dissolved species can provide a basis for future prediction of geochemical composition anticipated in new development areas. Such prediction could enable better planning, development of water management strategies and hydraulic fracturing fluid design.

66
References
1. Blauch, et. Al., 2009. Marcellus Shale Post-frac Flowback Waters – Where is All the Salt Coming from and What are the Implications?. Presented at the SPE Eastern Regional Meeting held in Charleston, West Virginia, USA, 23-25 September, 2009.
2. Houston, et. Al., “Fracture-stimulation in the Marcellus Shale: Lessons learned in fluid selection and execution,” SPE 125987 presented at the SPE Eastern Regional Meeting, Charleston, W.V., Sept. 23-25, 2009.
3. Blauch, 2010. Geochemical fixes boost shale completion efficiency. World Oil, July 2010, pp. D121-D124.
4. Papso, J., et. Al., 2010. Gas Well Treated with 100% reused Frac Fluid. August 2010, Harts E&P.
5. Lash, Gary G. 2009. Overview of the Tectonic and Eustatic Framework of Yager, Kappel, and Plummer. Devonian Black Shale, Appalachian Basin. Presented at the SPE Cooperstown Applied Technology Workshop, Cooperstown, New York.
6. Dresel, P.E. 1985. The Geochemistry of Oilfield Brines From Western Pennsylvania. MS Thesis, The Pennsylvania State University Department of Geochemistry and Mineralogy.