Embed Size (px)
Citation preview

Setting the SceneMonitoring Micro Reform
Report 95/1
December 1995
Australian Government Publishing Service
Canberra

Commonwealth of Australia 1995
ISBN
This work is copyright. Apart from any use as permitted under the Copyright Act 1968, no part maybe reproduced by any process without written permission from the Australian GovernmentPublishing Service. Requests and inquiries concerning reproduction and rights should be directed tothe Manager, AGPS Press, Australian Government Publishing Service, GPO Box 84, CanberraACT 2601.
The Bureau of Industry Economics, a centre for research into the manufacturing andservice sectors, is formally attached to the Department of Industry, Science andTechnology. It has professional independence in the conduct and reporting of itsresearch.
Inquiries regarding this and other BIE publications should be directed to:
The Publications OfficerBureau of Industry EconomicsGPO Box 9839Canberra ACT 2601Phone: (06) 276 2347Fax: (06) 276 1846Email: [email protected]
Produced by the Australian Government Publishing Service
BUREAU OF INDUSTRY ECONOMICS
v
ContentsPage
Foreword iii
Executive summary xi
1 Introduction 1
1.1 Purpose and scope of the project 1
1.2 What is microeconomic reform? 2
1.2.1 Reform initiatives covered by the project 3
1.3 Structure of the report 3
2 The evolution of microeconomic reform in Australia 5
2.1 Background 5
2.2 Financial deregulation — the catalyst for reform? 7
2.3 Responding to a changing environment 8
2.4 Banana Republic 9
2.5 Microeconomic reform — firmly on the agenda 10
2.6 May 1988 Economic Statement 13
2.7 A broader agenda for reform 14
2.8 March 1991 Statement 15
2.9 Microeconomic reform — an ongoing process 16
2.10 Co-operative federalism 17
2.11 A national competition policy 18
2.12 Recent developments 20
3 Trade liberalisation and industry assistance 22
3.1 An historical context 22
3.1.1 Some chinks in the protective armour 24
3.1.2 Acceptance of the need for a change in direction 26
3.1.3 Industry plans: a move to more selective assistance? 28
3.1.4 Prime Minister Hawke’s Address to the Nation 29

vi MONITORING MICRO REFORM — SETTING THE SCENE
3.2 Increased momentum towards reform 30
3.2.1 May 1988 Economic Statement 31
3.2.2 Statutory Marketing Arrangements reform continued 32
3.2.3 Garnaut report 33
3.2.4 Building a Competitive Australia 34
3.2.5 Industry policy in the future 37
3.3 Trade liberalisation beyond Australia’s shores 37
3.4 Concluding comments 38
4 Reforms to infrastructure and related industries 40
4.1 Significance of infrastructure industries in the economy 40
4.2 Main drivers for infrastructure reform 43
4.3 Approaches to infrastructure reform 45
4.3.1 Reforms in response to specific problems 46
4.3.2 Administrative reforms 47
4.3.3 Pricing reforms 49
4.3.4 Reforms aimed at increasing competition 51
4.3.5 Privatisation 54
4.4 Impact of infrastructure reform 55
4.4.1 Dividend payments 56
4.4.2 Prices and quality of infrastructure services 58
4.5 Concluding comments 60
5 Industrial relations and workplace reform 62
5.1 Australia’s industrial relations system 63
5.2 Industrial relations reforms 66
5.2.1 Two tier system 66
5.2.2 Award restructuring and the structural efficiency principle 68
5.2.3 Key developments in enterprise bargaining 70
5.2.4 Industrial relations reform: what of the future? 78
5.3 Some other workplace and labour market reforms 81
5.3.1 Training reforms 82
5.3.2 Labour market assistance programs 85
BUREAU OF INDUSTRY ECONOMICS
vii
5.4 Managing for a new workplace culture 86
5.4.1 Best practice and Australian firms 87
5.4.2 A new paradigm for management? 88
5.5 Concluding comments 89
6 Structural change — a broad overview 91
6.1 Changes in the composition of Australia’s output and employment 91
6.2 Measuring the extent of structural change 94
6.3 Increased internationalisation of the economy 97
6.4 Isolating the factors contributing to structural change 98
6.5 Concluding comments 99
7 Microeconomic reform: some potential impacts 101
7.1 General equilibrium analysis 101
7.1.1 Where can we expect to see gains? 103
7.1.2 General equilibrium modelling: some limitations 104
7.2 How microeconomic reform might affect firms 105
7.2.1 Assistance reductions and assisted firms 108
7.2.2 Microeconomic reform and prices 112
7.2.3 Microeconomic reform and productivity 114
7.3 Concluding comments 118
8 Future directions: the work program 120
8.1 Case study approach 120
8.2 Choice of case studies 123
8.2.1 Agri-food industries case study 123
8.2.2 Automotive industry case study 125
8.2.3 Other case studies 126
8.3 Future work program 126
Appendix 1 Chronology of key microeconomic reforms in Australia 128
Appendix 2 Infrastructure prices and quality 133
Appendix 3 Enterprise agreements in practice 154
Appendix 4 Economy-wide impacts of microeconomic reform 162

viii MONITORING MICRO REFORM — SETTING THE SCENE
Abbreviations 183
References 185
List of FiguresNo. Title Page3.1 Average effective rates of manufacturing assistance, 1968-69 to 2000-01 27
3.2 Australia’s exchange rate and terms of trade, 1970 to 1994 29
4.1 Cost shares of infrastructure inputs to selected industries, 1993-94 42
4.2 GBEs real dividend payments to governments, 1987-88 to 1993-94 57
4.3 Real aggregate GBE prices, 1987-88 to 1993-94 59
5.1 Industrial disputation in Australia, 1967 to 1994 — working dayslost per thousand employees 64
6.1 Share of national output by broad sector and industry group 92
6.2 Sector and broad industry shares of total employment 93
6.3 Employment and share of total manufacturing turnover: Footwear,PMV and components industries 94
6.4 Australia’s trade intensity, 1973-74 to 1993-94 97
7.1 Forces determining industry competition 107
A2.1 Average real electricity prices, 1987-88 to 1993-94 134
A2.2 Sydney Electricity — cost recovery levels, 1992-93 to 1995-96 136
A2.3 Percentage change in real gas prices, 1987-88 to 1993-94 137
A2.4 Average real gas prices by customer classes, 1987-88 to 1992-93 138
A2.5 Real water prices, 1987-88 to 1993-94 139
A2.6 Average real telecommunications prices, 1990-1994 140
A2.7 Crane rates by major Australian ports, June 1990 to June 1995 143
A2.8 Selected container terminals delays, 1994: P&O a case study 145
A2.9 Dry bulk vessel costs, selected countries, June 1994 andpercentage change on June 1992 147
A2.10 Average air fares and number of passengers carried, 1991 to 1995 149
A2.11 Average real rail charges — all services, 1987-88 to 1993-94 151
A3.1 Federal enterprise agreements ratified since October 1991,employee and sector coverage 154
A3.2 Australian non-farm market sector productivity trends,1979-80 to 1993-94 158

BUREAU OF INDUSTRY ECONOMICS
ix
List of Tables
No. Title Page
3.1 May 1988 Economic Statement: proposed tariff phasing 31
3.2 Tariff phasing arrangements arising from the March 1991 Statement 34
4.1 Significance of infrastructure and other services in the Australianeconomy, 1993-94 41
6.1 Structural change in Australia, 1973-74 to 1993-94 95
7.1 Some general equilibrium models projected effects ofmicroeconomic reforms 104
8.1 Microeconomic reforms 121
A1.1 Some key events in the evolution of microeconomic reform in Australia 128
A2.1 Real electricity prices by states, 1987-88 to 1993-94 135
A2.2 Comparison of changes in real telecommunication prices, 1990 to 1994 137
A2.3 Australian ship days lost due to crew disputes, 1987 to 1994 148
A2.4 Percentage of flights arriving and departing on time, September quarters,1990 to 1992 149
A2.5 On-time running of freight trains, 1989-90 to 1993-94 152
A2.6 International comparison of road freight timeliness, reliability,loss and damage rates, 1992 152
A3.1 Federal enterprise agreements, 1992 to 1994 156
A3.2 Part VIB 1994 agreements, employment conditions 159
A4.1 Microeconomic reforms assessed in different studies 163
A4.2 Projected effects of microeconomic reforms 165
A4.3 EPAC study — longer run industry output implications ofmicroeconomic reform 168
A4.4 Sectoral effects — BCA scenarios (GDP growth per annum, per cent) 170
A4.5 A summary of gains from reforms 171
A4.6 Projected increase in GDP resulting from specified group of reforms 172
A4.7 HILORANI results by industry 179
x MONITORING MICRO REFORM — SETTING THE SCENE
List of Boxes
No. Title Page
3.1 Longer term assistance arrangements for the dairy, sugar and tobaccoindustries 35
5.1 The accords, 1983 to 1995 65
5.2 Award restructuring in action: the metal industry 69
5.3 Union amalgamations 71
5.4 The states’ approach to enterprise bargaining 72
6.1 Measuring structural change 95
6.2 Manufacturing sector change at a more disaggregated level 96
7.1 The effects of removing a tariff 109
7.2 Product differentiation: the case of Australian orange juice 111
7.3 Reform, input costs and the coal industry’s competitiveness 115
7.4 An early enterprise agreement — the SPC case 117
A3.1 Workplace bargaining — evidence from the first 1 000 agreements 160

BUREAU OF INDUSTRY ECONOMICS
xi
Executive summary
This is the first in a series of BIE reports designed to monitor the impact ofmicroeconomic reform on firms and industries. This report aims to set the scene aswell as outline the BIE’s thoughts about future work in the area. It takes stock of somekey elements of the microeconomic reform process. It also discusses, at a conceptuallevel, the way in which microeconomic reform is likely to impact on Australian firmsand industries. Finally, it identifies how the BIE’s future monitoring work will addvalue to our existing stock of knowledge.
Prior to the 1980s, the term ‘microeconomic reform’ was virtually unheard of inAustralia and macroeconomic policies featured predominantly on governments’agendas. Since the mid 1980s, however, microeconomic reform has become a priorityfor all tiers of government.
The microeconomic reform process is not an end in itself. The process aims toincrease Australia’s standard of living by getting the economy’s incentive structureright at the grass roots level. Key elements of Australia’s microeconomic reformagenda include: trade liberalisation and other rationalisations of industry assistance;infrastructure reform; industrial relations and workplace reform; and regulatoryreform, including reforms to competition policy.
The major conclusion emerging from economy-wide modelling studies ofmicroeconomic reform is that the estimated effects are positive, widespread and on-going. However, the reform process is not costless. In contrast to the benefits, theadjustment costs of reform such as redundancies, firm closures and unemployment,are typically experienced early in the reform process and are relatively concentrated.At the same time, many firms will be able to take advantage of cost reductions andopportunities that arise as a result of the reform process. Hence the overall impact ofmicroeconomic reform on particular industries and firms is not always clear. TheBIE’s monitoring microeconomic reform project will help shed light on the effect ofreform on individual firms (managers and workers) and industries. Case studies willbe a key analytical tool for this purpose.
Developments in three key areas
This report looks at how the process of microeconomic reform evolved in Australia. Ithighlights some of the more significant events in the reform process. To varyingdegrees reforms have taken place in all sectors of the economy agriculture, mining,manufacturing, private sector services and public sector services. They haveinfluenced capital formation, human resources and training, industry development,regulation and taxation. The report reviews reforms in three key areas tradeliberalisation, infrastructure, and industrial relations and workplace reform.

xii MONITORING MICRO REFORM — SETTING THE SCENE
Trade liberalisation and the associated process of rationalising assistance toAustralian industries have progressed well. Indeed, Australia will be one of the mostopen economies in the world by the turn of the century. Nevertheless, somemanufacturing and agricultural industries receive rates of assistance above the relevantsectoral averages.
Reforms in this area have highlighted the need for, and importance of, progressingmicroeconomic reforms in other areas. Governments have recognised that broaderreforms are an essential element of the task of building an economy which cancompete successfully at an international level.
Infrastructure reform has lifted the performance of government business enterprises(GBEs). However, performance varies considerably between industries and betweenGBEs within industries. In some instances, the reform process has led to substantialreductions in prices and improvements in the quality of infrastructure services.Electricity and telecommunications fall into this category. In other instances, forexample water supply, reforms to remove cross subsidies or the under-recovery ofefficient costs has sometimes led to price increases, for all or some customer classes.In yet other instances, progress towards greater efficiency and lower costs has beenuneven. Some areas of the waterfront fall into this category.
The experience so far suggests that reform of infrastructure is a complicated process.In some cases, it involves the letting loose of potential monopolies. If not adequatelycontrolled, this can lead to infrastructure owners reaping all the benefits of reform asmonopoly dividends. The incentive for infrastructure owners to monopoly price can beeven more of a concern if the owners, in many cases state governments, have limitedalternative avenues to raise revenue. Although many infrastructure service providersperformance in terms of price, quality and productivity has improved, many stillfall short of achievable world best practice. Australia’s process of infrastructurereform is not being undertaken in isolation, prices elsewhere in the world have alsotrended downwards, in some cases at a faster rate. In a number of areas (e.g.waterfront charges for coal handling and road freight rates) Australia’s prices are at ornear world best practice. As the costs and quality of infrastructure services impact onthe competitiveness of Australian industry, it is essential that the momentum towardsefficient pricing and delivery is maintained. Vigorous implementation of the NationalCompetition Policy will be important in achieving that aim.
There have been important and substantial reforms to industrial relations andworkplaces over the last decade or so. The centralised industrial relations system isprogressively developing a more decentralised focus with the growth of enterprisebargaining. Firms — managers and workers — now have greater autonomy andflexibility in organising, training and rewarding their efforts at the enterprise level.There is some firm-level evidence to indicate that enterprise agreements may becontributing to increases in productivity. For example, the first 1 000 enterpriseagreements ratified by the Australian Industrial Relations Commission contained a

BUREAU OF INDUSTRY ECONOMICS
EXECUTIVE SUMMARY xiii
wide range of initiatives which will enhance productivity. Agreements formalisedsince the introduction of the Reform Act amendments have continued this trend. Thepotential for enterprise agreements to enhance productivity is supported by surveydata which indicates that managers in workplaces with enterprise agreements weremore likely to report an increase in productivity than managers in workplaces withoutenterprise agreements (DIR 1995a).
There are, however, still critics of the current system. For example, concerns havebeen expressed that the decentralisation of the industrial relations system is leading toan erosion of equitable pay and conditions for particular groups who are industriallyweak. Concerns have also been expressed about the centralised framework’s influencein the development of enterprise agreements, the appropriate role of unions, and theappropriate form of safety net protection.
A number of studies have revealed that many Australian firms have not implementedworkplace related techniques to achieve best practice. Considerable gaps existbetween world best practice workplace environments and those of many Australianfirms. The ability of management and the workforce to address this gap will be criticalto Australia’s future international competitiveness.
Impact of microeconomic reforms on firms and industries
Government initiatives, including microeconomic reform measures, combine withchanging market conditions to shape the pace and extent of structural change in theeconomy. At a broad level, the extent of structural change as measured by changesin the composition of activity and employment in the 1980s does not seem verydifferent to that experienced in the 1970s. However, at a more disaggregated level,there is some evidence pointing to greater structural change in the 1980s.
Only a relatively small number of studies have examined the impact ofmicroeconomic reform at the industry/firm level. Reflecting the diversity of reforminitiatives, some reforms have positive impacts, while for others, the impacts arenegative. In consequence, the net effect of reforms on individual firms and industriesvaries and is often not clear cut.
Some firms in assisted industries downsize or even go out of business as a result ofreductions in assistance. However, at the same time, some firms will take advantage ofreductions in their costs and other opportunities that arise as a result of changesinduced by microeconomic reform. Export oriented industries, in particular, can beexpected to gain from the reform process. Firms in export industries bear little of thecost of the reform process and have the potential to take advantage of cost reductionsand other benefits flowing from many reforms.
The impact of microeconomic reform at the firm level reflects the responses that firmsmake to the changed environment. These responses are, by their nature, firm specific.Firms facing the same set of pressures may take very different restructuring paths.

xiv MONITORING MICRO REFORM — SETTING THE SCENE
While economic theory and general equilibrium studies can shed some light on thepotential impact of microeconomic reform on firms and industries, little hard evidenceis available.
The monitoring micro reform project
In May 1994, the government commissioned the BIE to undertake a Monitoring MicroReform project over four years to help fill this information gap. In September 1994,the BIE released an issues paper setting out its preliminary views on the scope andcoverage of the project. Feedback on the paper, which was circulated to over 30industry groups and government agencies, indicated wide support for a case studyapproach. Work is already well advanced on the BIE’s first case study examining theagri-food industries. The BIE has just commenced a second case study involving theautomotive industry. Other areas are currently being evaluated as potential casestudies.
Overall, the case study approach is expected to provide valuable insights at severaldifferent levels covering:
• the main impacts of microeconomic reform on the activities, operations andperformance of firms;
• the significance of micro-economic reforms relative to other influences shapingchanges to firms’ operations over time;
• key drivers of differences in the experiences of firms within particular industries;
• the nature and extent of the dynamic effects of microeconomic reform on firms;
• firms’ assessments of the relative importance of different reforms to theiroperations; and
• firms’ views on the need, if any, for additional reforms having regard for thenature of their operating environment.

BUREAU OF INDUSTRY ECONOMICS
1
1 Introduction
Since the mid to late 1980s Australian governments have introduced profound changesinto many spheres of our economy under the broad banner of ‘microeconomicreform’. The term is now commonplace in political and business reporting. Yet,despite much discussion and an extensive range of research and analysis, we knowsurprisingly little about the effects microeconomic reform has actually had on manyAustralian industries and firms.
This information gap may contribute to the frequent disagreement in the communityover the merits or otherwise of microeconomic reform. Other factors are also relevant.For example, attention in the first instance tends, understandably, to focus onaggregate or economy-wide outcomes whether the bottom line is positive ratherthan the differing effects of reform across the economy. Yet for individual businesses,workers and consumers, the focus invariably is on whether there are net benefits attheir level. Beyond this, it is not always possible to differentiate the changes producedby specific micro policy reforms from those due to macroeconomic phenomena, orsecular changes in tastes and technology. In fact, some of the initial impetus formicroeconomic reform within Australia has come from a series of adversemacroeconomic developments.
1.1 Purpose and scope of the projectIn Working Nation (Keating 1994a) the federal government initiated a four-year BIEproject to monitor the impact of microeconomic reform on firms and industries. Thisis the first BIE report in the monitoring microeconomic reform series. It aims to setthe scene and outline the BIE’s thoughts about future work in the area.
The main aims of the project are: to increase the community’s understanding of theeffects of microeconomic reform on individual firms and industries; and identify themain factors giving rise to different experiences. Monitoring will also ensure thatgovernment, industry and the general public are aware of the progress ofmicroeconomic reform and its main effects on particular industries and firms. Theproject will also assist in highlighting aspects of the reform program which areprogressing well and those areas in need of further attention.
The BIE has actively sought industry, union and government advice in designing anddeveloping the project. In September 1994, the BIE released an issues paper settingout its preliminary views on the scope and coverage of the Monitoring Micro Reformproject. This was followed by a series of discussions and consultations. Most of theparties consulted agreed that a case study approach, supplemented by an initial scene

2 MONITORING MICRO REFORM — SETTING THE SCENE
setting report, would provide valuable insights into the impact of the microeconomicreform process. Ultimately, the value of the BIE’s research depends on the quality andquantity of information assembled firm analysis requires firm level data.
The BIE has identified two areas for its initial case study work the agri-foodindustries and the automotive industry. The agri-food case study is well advanced andwill be completed by early 1996. Work on the automotive study commenced inSeptember 1995 and, at this stage, should be completed by September 1996. The BIEplans to initiate two further case studies during 1996. Industries currently beingconsidered as potential case studies include: mineral processing; tourism; textiles;clothing and footwear; chemicals; and financial services.
1.2 What is microeconomic reform?In a nutshell, microeconomic reform is about improving our lot as a nation. Australiaduring the 1980s was falling behind it no longer ranked amongst those countrieswith high national incomes. Governments faced the prospect of increasing levels ofunemployment, price and wage inflation, and deteriorating productivity and terms oftrade. They came to the conclusion that many past policies had been too inwardlooking and interventionist. These policies had distorted product prices and returns tocapital, labour and other resources, sending out the wrong signals to investors,producers, workers and consumers.
Microeconomic reform is about getting the incentives structure in the economy right atthe grass roots (micro) level, so that Australians can achieve high and sustainablestandards of living. Increasing our productivity, that is getting more from theresources we use, is a way of achieving this goal.
Increasing competition in the Australian economy is a basic tool in the microeconomicreform process. In general, competitive pressures provide the incentive to improveproductivity. They direct resources into those areas where we can achieve the most.They ensure costs are minimised, consumers are satisfied and entrepreneurs arerewarded. Many of Australian governments’ past policies, such as tariffs, statutoryinfrastructure monopolies and regulation stifled the competitive process.
From the perspective of individual firms, microeconomic reform gives rise to newpressures as well as opportunities and, in the process, offers rewards to productive andpro-active managers and workers alike.
Microeconomic reform involves governments changing and adapting regulations andother measures to promote the more efficient and flexible operation of product andfactor (land, labour and capital) markets. This includes the provision of goods andservices by the public sector itself. Until comparatively recently, Australiangovernments have pursued reforms within their own jurisdictions with littlecoordination between jurisdictions. However, since the early 1990s it became

BUREAU OF INDUSTRY ECONOMICS
INTRODUCTION 3
increasingly clear that Commonwealth and state governments need to collaborate inorder to progress the microeconomic reform agenda in key areas such as infrastructureand regulation. This was reflected in moves toward a ‘co-operative federalism’framework, through mechanisms such as the Special Premiers Conferences and theCouncil of Australian Governments.
In this report we make little mention of local government reforms, mainly because ofthe patchy quality of available information. Inclusion of the available information inthis area would have produced a distorted and inconsistent picture when surveyingchange across industries and regions. We should not underestimate these omissions.For some firms the effects of local reforms to policies on land use and rates, forexample, can overwhelm the cost savings achieved by, say, reforms to state energynetworks.
1.2.1 Reform initiatives covered by the project
As a result of the BIE’s wide consultations we decided microeconomic reform shouldbe defined broadly for the purposes of this project. However, the initiatives coveredhave been limited to those that are within the direct control of Australiangovernments. The ambit of the project will therefore include microeconomic reforminitiatives in the following broad categories:
• reductions in assistance;
• labour market reforms;
• infrastructure reforms;
• regulatory reforms;
• public administration reform; and
• reforms to business taxation.
1.3 Structure of the reportThis initial report seeks to place microeconomic reform in perspective. It takes stockof some key elements of the microeconomic reform process and surveys what hasbeen accomplished so far. The report also summarises the findings of some previouswork on the impact of microeconomic reform. Beyond this, it identifies some keyfactors underlying differences in the way in which microeconomic reform affectsdifferent firms and industries and outlines the BIE’s current and future work programfor the project.
Chapter 2 examines, in broad terms, how the process of microeconomic reformevolved in Australia. It highlights, by way of a chronology, some of the more

4 MONITORING MICRO REFORM — SETTING THE SCENE
significant events in the reform process. The following three chapters examine keyreforms undertaken in three specific areas trade liberalisation and industryassistance (chapter 3), infrastructure reform (chapter 4) and industrial relations andworkplace reform (chapter 5). Each of these areas has attracted considerable analysisand discussion as part of the wider debate about reforming Australia’s economy.Chapter 6 provides a broad overview of the extent of structural change that hasoccurred in Australia since the early 1970s, to put recent microeconomic reforms intocontext. Chapter 7 briefly reviews the findings of some of the general equilibriumstudies used to assess the impact of microeconomic reform. It also highlights somekey factors likely to influence how firms and industries respond to microeconomicreforms. Chapter 8 provides details of the case study approach being used by the BIEto analyse firm level impacts of microeconomic reform for particular industries. It alsosets out the time frame for the future work program. Appendix 1 contains achronology of key events in Australia’s microeconomic reform process. Appendix 2documents some of the impacts of microeconomic reform in the infrastructureindustries on prices and quality of service. Appendix 3 examines the nature andprogress of enterprise agreements in Australia. Appendix 4 provides an overview ofvarious general equilibrium modelling studies that have examined the impact ofmicroeconomic reform at the economy wide level.

BUREAU OF INDUSTRY ECONOMICS
5
2 The evolution of microeconomicreform in Australia
Prior to the 1980s, the term ‘microeconomic reform’ was virtually unheard of inAustralia and macroeconomic policies featured predominantly on governments’agendas. Since the mid 1980s, however, the microeconomic performance of theAustralian economy and subsequently microeconomic reform has received increasingattention. In 1989, the then-Treasurer, claimed that ‘if you go into a pet shop everyparrot is screeching microeconomic reform, microeconomic reform’ (in Clark, D.1989, p. 97).
The following sections look at how the process of microeconomic reform evolved inAustralia and highlight some of the more significant events in the reform process. Achronology of the key events is presented in appendix 1. The discussion primarilyfocuses on reforms undertaken at the federal level. This focus should not, however, beinterpreted as indicating little reform has taken place at the initiative of the other twotiers of government. The BIE recognises that state, territory and local governmentshave also undertaken a substantial program of reform.
2.1 BackgroundDuring the post World War II period up to the early 1980s, the regulatory structure ofthe Australian economy remained relatively stable. There were some examples ofmicro reforms over that period, such as the deregulation of interstate freight in the1950s and the 25 per cent tariff cut in 1973. However, the reforms were ad hoc anddid not form part of any systematic approach to reform (Forsyth 1992, pp. 7-8).Indeed, to some extent the policy approach could be regarded as reactionary. Forexample, the 25 per cent tariff cut was itself a response to the problems of coping witha strong macroeconomic upswing. Further, it was swiftly followed by the introductionof import quotas, in response to balance of payments problems.
For the first three post-war decades, macroeconomic policies, including peggedexchange rates and control of international capital flows, were a primary focus ofAustralia’s economic policy. Under the pegged exchange rate regime, variations in thelevel of official foreign reserves absorbed any swings in the overall balance ofpayments. In the case of a severe imbalance on the external account, the exchange ratewas adjusted to bring about the appropriate adjustments to the balance of payments.The Government also sought to influence the size of import flows by adjusting tariffsand other protection measures (see chapter 3).
6 MONITORING MICRO REFORM — SETTING THE SCENE
During the 1960s and early 1970s, Australia experienced steady economic growth,while maintaining unemployment and inflation at relatively low levels. This changedin the early 1970s, when Australia was affected by a number of external influencesincluding a world economy boom, a commodity price boom and external inflationarypressures. These shocks significantly affected the workings of the Australian economyand contributed to Australia experiencing high rates of inflation and unemployment,relatively weak economic growth and increased public sector borrowing. The highrates of inflation and excessive real wage increases eroded the price competitivenessof Australia’s export and import competing sectors, which in turn led to a contractionin profitability and employment.
The developments of the 1970s led the federal government to realise that the industrialstructure, which had developed under the made-to-measure system of tariff protection,was increasingly unable to support economic growth and employment. The significantchanges in the pattern of world trade and international competitiveness reinforced thisrealisation. The high tariff levels in Australia were recognised as having contributed toan inward-looking manufacturing sector which was increasingly becominguncompetitive on international markets.
In the light of the realisation that past policies were inadequate for sustainingeconomic growth and employment, the Government formulated the long termobjective of encouraging the development of an internationally competitivemanufacturing sector. In its 1977 White Paper on Manufacturing Industry, thegovernment formalised its commitment to reducing protection:
There is now a growing recognition in Australia of the adverse effects on economic growth thatcan result from pressing import-substitution beyond levels justified in changing economiccircumstances. An important adverse consequence of pursuing import-substitution is that it canresult in the forgoing of opportunities for specialisation in areas in which Australia has thegreatest advantages. Tariff reductions to induce changes in industry structure and encouragegreater specialisation in industry therefore have a role to play in the process of encouraging amore efficient manufacturing industry in Australia (Commonwealth of Australia 1977, p. 22).
Despite the government’s commitment to reducing protection at that time, it did notact on it. As the goal of achieving a more specialised and competitive manufacturingsector ‘would not be best served by proceeding at present with a program of furtherreductions in protection’ (Fraser 1982, p. 947). While there was recognition thatgovernment assistance to industry was a major impediment to efficient microeconomicoutcomes, macroeconomic considerations continued to dominate policy attention.
Commenting on the interventionist policies of the post war period, the governmentlater claimed that:
In the end, no amount of manipulation of the instruments of macroeconomic control (could)transform a non-competitive, inflexible and sluggish economy into one which can generatestrong economic growth (Commonwealth of Australia 1984, p. 64).

BUREAU OF INDUSTRY ECONOMICS
THE EVOLUTION OF MICROECONOMIC REFORM IN AUSTRALIA 7
2.2 Financial deregulation — the catalyst for reform?By the late 1970s, economic commentators and the Commonwealth Government hadbegun to express concerns that the regulations imposed on the Australian financialsystem were having a negative impact on the effectiveness of monetary policy. Anumber of factors were constraining the effective management of the Australianfinancial system through traditional instruments of regulation. These included thepersistence of relatively high inflation and large budget deficits during the 1970s,coupled with the development of stronger links between domestic and internationalfinancial markets.
The growth of non-bank financial institutions operating beyond the direct influence of theReserve Bank, the development of new financing techniques by banks and the increasingintegration of domestic and overseas financial markets all contributed to the steady erosion ofthe effectiveness of monetary policy. Existing methods of marketing government securitieswere increasingly ineffective in the face of the need to market more securities and the impact ofinflation on rates of return fixed in nominal terms (Harper 1985, p. 16).
and
prior to financial deregulation the capacity to use fiscal and/or monetary policies to ‘manage’domestic economies was constrained (Moore 1995, p. 4).
These concerns resulted in the Commonwealth Government establishing a Committeeof Inquiry into the Australian Financial System (the Campbell Committee). The mainrecommendations of the committee were for a more open and less regulated financialsystem (AFSI 1981).
In the early 1980s, the government took the first steps towards removing controls onbanks. These included: reducing restrictions on the assets and liabilities which bankscould hold; the development of the treasury note; and the introduction of the tendersystem for selling government securities. With the change of government in 1983, thenew Labor Government set up the Martin Committee to review the previousCommittee’s recommendations. This committee supported the Campbell Committee’srecommendations and, as a result, the process of deregulating the financial systemgained momentum. In 1983, the government floated the Australian dollar andabolished most of Australia’s exchange controls.
Deregulation of the financial system in Australia occurred mainly as a result ofmacroeconomic concerns, such as inflation and large budget deficits, rather thanmicroeconomic considerations.
Improving the microeconomic efficiency of the financial system was not the primary goal offinancial deregulation. This is not to say that the authorities were unaware of the costs tomicroeconomic efficiency inherent in the elaborate structure of prescriptive regulations thatexisted prior to 1980.

8 MONITORING MICRO REFORM — SETTING THE SCENE
Rather it is simply to point out that the undoubted microeconomic efficiency costs were notinstrumental in bringing about the dismantling of a regulatory structure which had remainedvirtually intact since World War II.
Macroeconomic considerations were uppermost in the minds of the authorities. In particular, bythe end of the decade of the 1970s, it was obvious that regulations imposed on financialmarkets were impeding rather than facilitating the implementation of monetary policy (Acklandand Harper 1992, p. 46).
Although financial deregulation was primarily undertaken in response tomacroeconomic considerations, many commentators see it as a catalyst for the currentprogram of microeconomic reform in Australia. Forsyth (1992) claims that theCampbell Committee Report and its subsequent implementation was the watershed forthe current program of microeconomic reform. He suggests that at the time offinancial deregulation the Commonwealth ‘did not have many other specific reformproposals, but it was open to consider them’ (Forsyth 1992, p. 8). Ackland and Harper(1992, p. 45) also claim that it was largely the experience policy makers had withfinancial deregulation that prompted then to push for further reforms in other keysectors of the economy.
The government’s decision to deregulate the financial market, float the Australiandollar and remove exchange controls represented a significant step towardsmicroeconomic reform. These initiatives exposed the Australian economy to increasedinternational pressures — pressures from which Australian governments hadpreviously sought to keep the economy insulated.
2.3 Responding to a changing environmentIn 1983 Australia emerged from a recession with historically high levels ofunemployment coupled with relatively high price and wage inflation. In response, thenewly elected government adopted policies aimed at reducing inflation andunemployment, including instituting an accord with the Australian Council of TradeUnions (ACTU). This accord provided a macroeconomic policy framework, withACTU members agreeing to restrain their pursuit of wage increases to levelsconsistent with the government’s macro targets. In exchange, the government gavecommitments to equitable economic policies, including underwriting a ‘social wage’through measures such as taxation, superannuation and health insurance. Othergovernment initiatives at this time included the establishment of the EconomicPlanning Advisory Council (EPAC) to examine medium-term policy options.
As mentioned previously, the events of the 1970s (and early 1980s) led thegovernment to recognise that reductions in protection could play an important role inencouraging more efficient industry structures. However, the government was also ofthe view that measures designed to make industry more efficient and internationallycompetitive would need to be supplemented with industry specific plans. From 1983

BUREAU OF INDUSTRY ECONOMICS
THE EVOLUTION OF MICROECONOMIC REFORM IN AUSTRALIA 9
onwards, the government announced a number of industry plans, including plans forthe steel, passenger motor vehicle, ship building, heavy engineering, and the textiles,clothing and footwear industries (see chapter 3). These plans were, amongst otherthings, designed:
...to provide short-term assistance to the industry to help it face up to the process of orderlyadjustment with a view to attaining greater efficiency and stability (Button 1984, p. 2).
The Commonwealth and state governments also became increasingly aware thatregulation was imposing significant and often unnecessary costs on industry.Regulatory overlap between Commonwealth and state/territory jurisdictions amplifiedthese costs. With this in mind, the Victorian Government set up the VictorianRegulation Review Unit in 1985. The Commonwealth Government established theBusiness Regulation Review Unit (BRRU) in the same year. The BRRU’s tasksincluded assessing the impact of existing regulations on business and establishing areview procedure for all new and amended Commonwealth regulation (BRRU 1986).Other state governments also implemented similar initiatives.
Widespread concerns about inefficiencies within the taxation system resulted in aNational Tax Summit in 1985 where the government proposed three broad options fortaxation reform. However, business and community groups attending the summitrejected each of these options. Despite this setback the government, in September1985, announced a less ambitious tax reform package. Some of the more importantinitiatives in this package included the introduction of: a fringe benefits tax; a capitalgains tax; a new foreign tax credit system; and a full dividend imputation scheme forcompany taxation (Benge 1992).
The mid 1980s saw further adverse macroeconomic developments in Australia,including a sharp deterioration in Australia’s terms of trade and current accountdeficit, and continued inflationary pressures. The decline in world commodity pricescaused a sharp depreciation of Australia’s currency, which led to an increase in importprices. This in turn placed pressure on the real purchasing power of wages. Inresponse to the potential for a price and wage spiral, the government and the ACTUagreed to only partial wage indexation in 1985, trading off wage increases forsuperannuation benefits and tax cuts. This represented a significant first step towardsattempting to break the nexus between inflation and wage demands based on the costof living.
2.4 Banana RepublicConcern about the rapid deterioration in Australia’s international and domesticeconomic performance was graphically highlighted in May 1986 when the Treasurer,in a radio interview, stated:

10 MONITORING MICRO REFORM — SETTING THE SCENE
We must let Australians know truthfully, honestly, earnestly — just what sort of aninternational hole Australia is in... once you slow the growth under 3 per cent unemploymentstarts to rise again...then you’re gone...then you’re a banana republic (ABC Television 1993).
This very public statement and its aftermath played an important role in galvanisinggovernment policy responses. It ultimately led to the recognition that reforms to makethe economy more flexible and better able to respond to external shocks and changedmarket conditions were necessary. According to EPAC:
the case for microeconomic reform assumed special urgency because of the recurring inabilityof domestic supply to match the growth in domestic demand, with consequently high currentaccount deficits and a rising external debt (EPAC 1990a, p. 3).
Although the macroeconomy was still the primary focus of the Commonwealthgovernment’s concerns it was becoming increasingly obvious that manymacroeconomic problems had underlying microeconomic causes. In an Address to theNation in 1986 (shortly after the ‘banana republic’ statement), the Prime Ministerstated that:
The now accelerated decline in the terms of trade is a dramatic manifestation of a problem thathas been developing for decades. Such long-term problems require long-term solutions. Theeconomy needs to diversify, on a competitive basis, to supplement traditional export activities.This would allow a wider range of products to compete on export markets, making us lesssusceptible to adverse world price movements in a few commodities (Hawke 1986, p. 953).
The government’s response at this time was to introduce measures to improve theinternational competitiveness of Australia’s exports. This included examining factorsaffecting the cost of producing and exporting Australian products. In response toconcerns that inefficiencies within transport and handling industries were imposingcost penalties on exporters, the Prime Minister, also announced a number of studies(Hawke 1986). These studies included the previously announced royal commissioninto grain handling, transport and storage and new studies into liner shipping services,international air freight policy and shore based shipping costs. The results of thestudies were to be assessed ‘to determine whether any additional action could be takento remove impediments to trade’. Also announced at this time was a review ofagricultural pricing and marketing arrangements to examine whether thesearrangements were constraining the international competitiveness of domesticprocessing industries (Hawke 1986).
2.5 Microeconomic reform — firmly on the agendaBy 1987, the term ‘microeconomic reform’ had started to appear regularly on thegovernment’s economic policy agenda. Although macroeconomic policies continuedto dominate the economic policy debate, the government began to recognise theimportance of microeconomic reform as a tool for improving the efficiency and
BUREAU OF INDUSTRY ECONOMICS
THE EVOLUTION OF MICROECONOMIC REFORM IN AUSTRALIA 11
competitiveness of Australian industry. In a press statement in November 1987, theTreasurer stated that:
The economic restructuring on which Australia has embarked will inevitably be a lengthyprocess. While the continuation of appropriate macroeconomic settings remain central to theadjustment task, microeconomic reform also has an essential role in improving the efficiencyand competitiveness of Australian industry (Keating 1987, p. 5).
Reforms occurring elsewhere in the world also provided an impetus for the process ofmicroeconomic reform in Australia. The 1980s saw a growing interest in structuralreform throughout the world and many countries began to embark on programs toreduce impediments to efficiency. In a 1987 publication, Structural Adjustment andEconomic Performance, the OECD commented that:
Many countries have, in recent years, sought systematically to review microeconomic policiesand reduce distortions to the functioning of markets. Yet the progress to date is uneven, and ifthe prospects for growth are to be durably improved, further action is needed (OECD 1987 p.34).
As other governments around the world began introducing measures to improve theireconomies’ performance, the Australian government realised that it could not afford tobe complacent, if Australia was to maintain its trade shares and standard of living.
The Commonwealth Government made moves towards reforming governmentbusiness enterprises (GBEs) in November 1987 with the tabling of Guidelines onCommonwealth Statutory Authorities and Government Business Enterprises. Theguidelines aimed at establishing processes for better defining the objectives whichGBEs served and against which their performance could be assessed. They also aimedto reduce the extent of government control over their operations. The Minister forFinance, in the tabling statement, commented that:
The reforms indicate the Government’s commitment to achieving the highest levels ofoperations and financial efficiency in Commonwealth business enterprises. This commitmentflows from recognition that as a group these enterprises constitute an important business sectorproviding a significant proportion of the infrastructure on which the rest of the Australianeconomy depends (Walsh 1987, p. 1).
In 1987, the Commonwealth Government through the Australian Industrial RelationsCommission (AIRC), acted to introduce more flexibility into the process ofdetermining wages when it implemented a two-tier wages system. Under this system,the first tier provided for generally available wage increases while, under the secondtier, wage increases were available at the enterprise or industry level in return forproductivity improvements.
The government underpinned its commitment to microeconomic reform when theTreasurer announced a forward work program for the Industries AssistanceCommission (IAC) in January 1988. The IAC was initially established by theCommonwealth Government to ‘advise on assistance to industry.’ The forwardinquiry program extended the Commission’s traditional inquiry areas of

12 MONITORING MICRO REFORM — SETTING THE SCENE
manufacturing and agricultural assistance to broader ranging inquiries directedtowards advising on the removal of impediments to improved efficiency andinternational competitiveness across the whole spectrum of industry. The broad-ranging references forwarded to the IAC around this time included inquiries into:government (non-tax) charges which imposed the greatest obstacles to efficiency andinternational competitiveness of Australian industry; the effects of domestic barriersand impediments to international trade in services; and impediments tocompetitiveness and efficiency in the development of the Australian travel andtourism industries.
The IAC’s report on government (non-tax) charges found that the impact ofgovernment charges on the competitiveness of Australian businesses was largelydependent on how well public enterprises were performing. The report also found thatpoor performance by public enterprises was usually a result of unclear and conflictingobjectives, the absence of effective competition and reliance on ineffective control andperformance monitoring mechanisms. The report recommended that:
Governments at all levels could initiate further action to improve performance. While thiscould (and should) include continued administrative reforms, the benefits available fromimproved public enterprise performance are unlikely to be fully realised unless broaderapproaches are adopted — in particular, dismantling barriers which presently shield manymajor public enterprises from competition (IAC 1989a, p. xxvi).
The report also recognised that there would be complex issues of relevance to anumber of governments and that governments at all levels would need to jointlyconsider implementing the reforms.
The government subsequently drew on this report when considering its agenda ofmicroeconomic reform and in evaluating structural reforms (IC 1990, p. 252).
Reform of GBEs was not confined to the federal arena. For example, in 1988, the NewSouth Wales Government commissioned a report on the state’s finances. The reportrecommended, amongst other things:
an immediate move to corporatisation of government business undertakings in order to improvereturns from these operations and prepare the way for later possible privatisation of someoperations (NSW Commission of Audit 1988, p. vi).
In response to the report, the government commissioned a further study (NSWSteering Committee on Government Trading Enterprises 1988) which alsorecommended that the state’s GBEs be corporatised. The New South WalesGovernment accepted the recommendation and the State Owned Corporations Act1989 was enacted. The state government then began to corporatise some of its GBEs,as well as pursuing other polices to improve GBE performance.
Other state and territory governments also pursued policies to improve theperformance of their GBEs. For example, in 1992 the Queensland government

BUREAU OF INDUSTRY ECONOMICS
THE EVOLUTION OF MICROECONOMIC REFORM IN AUSTRALIA 13
endorsed a white paper which set out principles for corporatisation. In the same year,the Victorian Government enacted legislation to facilitate the corporatisation and insome cases privatisation of its GBEs.
2.6 May 1988 Economic StatementThe Commonwealth Government’s May 1988 Economic Statement was a landmarkfor the process of microeconomic reform in Australia. The initiatives announcedrepresented a significant move away from the piecemeal approach to reform of thepast to a much more broadly based agenda.
A major focus of the measures announced by the government in this statement werefurther reductions in border protection. Under the announced phased tariff reductionprogram, tariffs above 15 per cent were to be phased in annual steps to 15 per cent by1992, while rates of 15 per cent or less were to be reduced to 10 per cent over thesame period. For some industries these announced reductions meant tariff ratesdeclining from 40 per cent to 15 or 10 per cent (Keating 1988, p. 123). Additionally,high levels of government assistance provided to some agricultural industries werereduced, and the 2 per cent revenue duty on imports was abolished. The governmentalso announced accelerated phasing down of the assistance arrangements to thetextiles, clothing and footwear industry. Reductions in assistance were easier tointroduce at this time because of the substantial impact of the depreciation of theAustralian dollar on the international competitiveness of Australian industries. Indelivering the statement, the Treasurer commented that:
The way forward for Australia is not to be closeted and sheltered, but to be open and dynamic,trading aggressively in the world. Only this kind of economy can provide the employment andrising living standards that Australians aspire to. This is the very point of the measurescontained in this economic statement (Keating 1988, p. 16).
Although the major focus of the statement was on reducing tariffs and other assistancemeasures it also initiated a number of other important reforms. Many of theadministrative constraints on government business enterprises were removed to allowthem to operate on a more commercial footing. Other initiatives included thegovernment’s decision to terminate the two-airline agreement and the removal ofcertain barriers to competition in telecommunications. These initiatives signalled thatthe government recognised the importance of removing or modifying regulations thatimpeded efficiency as well as the importance of promoting competition for improvingperformance (see for example, Keating 1988, p.119-120).
The statement also introduced a number of significant taxation reforms. Theseincluded: extending the dividend imputation system of company tax to all Australianinvestors; removing the gold mining industry’s unique exemption from income tax;and introducing effective-life depreciation in place of accelerated depreciationprovisions.

14 MONITORING MICRO REFORM — SETTING THE SCENE
Commenting on the initiatives announced in the 1988 statement, the IAC stated:
These developments reflect a recognition that the community has not been well served bypolicies of industry preferment and regulatory measures which have impeded the economy’scapacity to adjust. The reforms collectively constitute a major departure from past approachesand, if consistently pursued, will facilitate greater efficiency and competitiveness in Australianindustry (IAC 1988, p. iii).
2.7 A broader agenda for reformAlso during 1988, the parliament passed the Industrial Relations Act 1988. This newlegislation retained the existing system of conciliation and arbitration but introducedprovision for certified agreements. Under the Act the Australian Industrial RelationsCommission (AIRC) could, under certain conditions, certify an enterprise agreementbetween disputing parties, even if the agreement was inconsistent with AIRCprinciples. Although certified agreements under the 1988 legislation were rare, theyrepresented an important early step towards increasing flexibility in a centralisedindustrial relations system (see chapter 5).
The 1988 national wage case hearing also saw moves to improve flexibility throughthe introduction of the AIRC’s structural efficiency principle. This principle madewage increases available to unions that committed to a fundamental review of theirindustrial awards. Reflecting on these changes, particularly the implementation ofaward restructuring, the Treasurer noted:
The challenge being faced in Australia is that of a highly competitive, increasingly integratedand rapidly changing international economy. This requires that all markets - labour, financialand product - become more flexible, efficient and competitive in order to ensure that theAustralian economy can pay its way in such an international environment.
A necessary ingredient is a wages system which will reduce the scope for leap frogging andwhich builds a broader base for skill development (Keating 1989, p.63).
The establishment of the Industry Commission (IC) in 1990, as the CommonwealthGovernment’s major review and inquiry body on structural reform reflected thebroader approach to microeconomic reform. The Treasurer, in his statementannouncing the establishment of the IC, stated that:
by analysing structural issues across a wider spectrum than tariff reform, the IndustryCommission will be an important stimulus for reform (Keating 1989).
Absorbing the functions previously undertaken by the IAC, the Inter-StateCommission and the BRRU, the IC was given a broader charter which includedreporting on actions at any level of government affecting any industry. Thegovernment’s policy guidelines for the Commission were ‘cast in terms ofencouraging the development of internationally competitive industries, facilitatingstructural adjustment, and reducing unnecessary industry regulation’ (IC 1990, p. 2).The Commission’s work program was broadened to encompass a wider range of

BUREAU OF INDUSTRY ECONOMICS
THE EVOLUTION OF MICROECONOMIC REFORM IN AUSTRALIA 15
issues affecting the productivity and competitiveness of the overall economy. Therevised charter indicated that Commonwealth, state and territory governmentsrecognised the importance of co-operation in implementing broad-basedmicroeconomic reforms. Commenting on the inclusion of the states in the broadercharter, the IC stated that:
Given the pervasive influence of the States in determining the institutional and regulatoryframework for industry, their co-operation in broad-based microeconomic reform is crucial (IC1990, p. 2).
The IC’s broader charter was reflected in the range of inquiries sent to theCommission at this time, including inquiries into statutory marketing authorities,energy generation and distribution, rail transport, intrastate aviation, port authorities,urban transport, mining and minerals processing in Australia, public housing andwater resources. Key areas in each of these inquiries came under state or territoryjurisdictions or required joint action with the Commonwealth.
Many recommendations arising from these inquiries were subsequently adopted byCommonwealth, state and territory governments or provided the impetus for furtherdeliberations and subsequent reform. For example:
• the Joint Coal Board, a New South Wales and Commonwealth Governmentauthority, was abolished;
• initiatives were put in place to establish a national electricity grid; and
• initiatives were put in place to make airport charges better reflect costs.
2.8 March 1991 StatementThe Commonwealth Government’s program of reducing tariff protection was givenrenewed momentum in its industry statement, Building a Competitive Australia,released in March 1991. The statement announced the continuation of the tariffreductions contained in the May 1988 statement, with most tariffs phasing down to 5per cent by 1996, and further reductions in assistance to the passenger motor vehicleand textiles, clothing and footwear industries. The government’s commitment toliberalising international trade and an across-the-board approach to reducing assistancewas further confirmed by this statement. Commenting on the initiatives announced inthe statement, the Treasurer declared that:
The package of measures announced today ends forever Australia’s sorry association with thetariff as a device for industrial development. ...By turning our backs on tariffs, Australia will befurther propelled in its quest for international trade and efficiency, a search begun with theopening of the economy in 1983 when we floated the dollar and abolished exchange controls(DPM&C 1991, p. 2.1).

16 MONITORING MICRO REFORM — SETTING THE SCENE
Although the focus of this statement, like the 1988 statement, was on reducing tariffs,there were also a number of other key initiatives aimed at achieving greater efficiencywithin Australia. The Prime Minister, in delivering the statement, said:
...with further tariff cuts, we are dismantling the barriers to competitiveness and efficiency thatstand at the borders of Australia. This Government is also set on dismantling the barriers thatexist within Australia (DPM&C 1991, p. 1.10).
Some of the other initiatives included widening exemptions from sales tax for businessinputs and changes to depreciation provisions ‘to bring them more in line withbusiness realities’(DPM&C 1991, p. 1.15).
The statement also directed the BIE to undertake research on internationalperformance benchmarking of infrastructure services used as business inputs. Thisbenchmarking work is significant because it identifies the importance of infrastructureservices to industry costs and develops measures for international performancecomparisons. By comparing the performance of Australia’s infrastructure servicesagainst world best practice, benchmarking provides a useful tool for promotingyardstick competition. Such competition can improve efficiency in markets notdirectly subject to competitive pressures. It also provides a means for assessing theimpact of infrastructure services on the competitiveness of user industries. Thisinitiative, by indirectly introducing competitive pressures, represented a significantstep towards encouraging Australia’s infrastructure industries to be more efficient.
2.9 Microeconomic reform — an ongoing processA feature of the process of microeconomic reform in Australia during the 1980s andearly 1990s has been that as reforms in one area have advanced they have revealed theneed for further reform in other areas. The IC suggested that:
A striking feature of the reform process to date is that, as one reform has been undertaken, ithas revealed further rigidities that, when tackled, hold the prospect of further productivity gains(IC 1993a, p. 11).
The trade policy reforms initiated in both the 1988 economic statement and the March1991 statement increasingly exposed many industries to international competition.However, a number of other industries, including GBEs, some agricultural goods andsome of the professions, remained heavily insulated from competitive pressures. In theearly 1990s, there was an increasing realisation that inefficiencies in these sectorsultimately reduced the competitiveness of traded industries.
In addition to these competitiveness concerns, state governments’ budgetary stressprovided further pressure for measures designed to improve the performance of GBEs.Responding to these concerns, all participants at the Special Premiers’ Conference inJuly 1991 agreed to establish a steering committee to monitor the performance ofgovernment trading enterprises. The work of the steering committee underpins the

BUREAU OF INDUSTRY ECONOMICS
THE EVOLUTION OF MICROECONOMIC REFORM IN AUSTRALIA 17
process of GBE reform by monitoring and publishing annual details of theperformance of many of the GBEs in Australia. (The New South Wales Governmenthad implemented a similar performance monitoring task for its GBEs two yearsearlier.) The BIE’s benchmarking work complements the steering committee’s workby addressing the international dimension. It establishes world best practice ratherthan Australian best practice as the relevant performance standard for a tradingeconomy.
The importance of the performance monitoring work is that it acts as a driver forfurther reform. It provides benchmarks for evaluating performance and encourages theadoption of best practice techniques. On release of its first report on governmententerprise performance, the steering committee stated that:
This so-called ‘yardstick competition’ represents an important check on GTEs [GovernmentTrading Enterprises] which operate in largely uncompetitive markets. Lifting the veil on theirperformance should provide important signals and incentives to management on how they canimprove, with benefits to users through lower real prices and/or higher quality and togovernments through higher returns or smaller drains on their budgets (SCNPMGTE, 1993).
Progress in GBE reform was only one of many streams of administrative andregulatory change underway in 1991. In January 1991 a national companies andsecurities regime replaced the separate Commonwealth and state laws. The regimesimplified Australia’s law dealing with companies and securities which facilitatesinformation flows on commercial organisations financial position and prospects.
Australia’s system of industrial relations was also undergoing substantial change. Thenational wage case decision in October 1991 represented a further step towards thedecentralisation of industrial arrangements and wage determination. The AIRCintroduced the enterprise bargaining principle. This principle allowed unions andemployers to negotiate wage increases, reflecting productivity gains achieved byimplementing efficiency measures. The 1992 amendments to the Industrial RelationsAct introduced even greater flexibility into the determination of agreements and led toa substantial increase in their use. Commonwealth and state governments,subsequently, implemented legislation to facilitate the greater of use of enterpriseagreements in the workplace. Most states adopted systems similar to theCommonwealth model. However, Victoria and Western Australia adopted differentmodels (see chapter 5).
2.10 Co-operative federalismBy the late 1980s and early 1990s it was becoming increasingly obvious that to gainthe full benefits of microeconomic reform a truly national approach was needed. Inmany areas where large gains from microeconomic reform had been identified, suchas electricity and rail, reforms required commitments from all levels of government aswell as co-operation between them. The Commonwealth Government was

18 MONITORING MICRO REFORM — SETTING THE SCENE
increasingly coming up against resistance to reforms that depended on commitmentsfrom the states. In many instances, reforms that were in the interest of the overalleconomy often conflicted with the interests of state and local governments.
The 1991 Special Premiers’ Conference made progress towards removing inter-statetrade barriers. At that meeting the heads of state governments agreed, in principle, forthe mutual recognition of regulations and standards. This represented a major stepforward because, in the past, all attempts to unify regulations on a national basis hadbeen relatively unsuccessful. These arrangements came into effect in March 1993.They create a common market for goods sold in Australia and reduce barriers to entryinto occupations regulated at the state level.
Other important intergovernmental co-operative initiatives arising from the SpecialPremiers’ conference included agreement to:
• establish a National Grid Management Council to manage the eastern Australianelectricity grid; and
• introduce nationally consistent road regulations.
The increased level of intergovernmental co-operation also led to the establishment ofinstitutions, such as the National Food Authority and the National OccupationalHealth and Safety Commission, to develop national standards. These new standardsreplace the sometimes conflicting standards in place at the state and territory level.
The 1992 One Nation statement built on these co-operative initiatives. One Nationannounced proposals for developing integrated infrastructure networks, including aninterstate electricity grid and a national standard gauge rail freight highway. Theseinitiatives represented significant progress towards achieving intergovernmental co-operation and co-ordination for the implementation of reforms. The initiatives alsosignified a move towards reducing the duplication of services and administrationbetween governments. Commenting on the need for better co-operation betweengovernments, the Prime Minister stated that:
...the community and the economy must advance together; that all our efforts should gotowards uniting the country, not dividing it... This is the kind of Australia we seek, and which Ifirmly believe we can have. An Australia which is more truly one nation (Keating 1992 a, pp.15-16).
Other important initiatives announced in One Nation included: measures aimed atimproving competition in the supply of electricity; and measures designed to allowfurther entry of foreign banks. Changes to the Industrial Relations Act 1988 were alsoannounced. These changes aimed to facilitate enterprise bargaining at workplaces withlittle or no union coverage and, at the same time, provide safety net provisions throughthe award system.
The establishment of the Council of Australian Governments (COAG) in May 1992,was a significant step towards facilitating a national approach to microeconomic

BUREAU OF INDUSTRY ECONOMICS
THE EVOLUTION OF MICROECONOMIC REFORM IN AUSTRALIA 19
policies and reforms. COAG is now the main body for discussions between heads ofgovernment on issues of national importance.
2.11 A national competition policyAs Australia responded to the challenges of achieving a single, integrated market,governments started to realise that there were significant benefits associated withdeveloping a national competition policy. Following agreement by the various tiers ofgovernment on the need for such a policy, the Prime Minister, in October 1992,established an independent inquiry into a national competition policy headed byProfessor Fred Hilmer. Commenting on the establishment of the inquiry, the PrimeMinister stated:
Following this review, we — the States, Territories and Commonwealth — will have theopportunity to establish a national competition policy. ...That is a policy which should supportthe development of Australia as one competitive market for our industries, not a set ofdivergent regulatory regimes (Keating 1992b, p. 11).
The Hilmer review, released in August 1993, took a broad approach to competitionpolicy and recommended:• competition policy should be pursued on a national basis;• extending the Trade Practices Act to areas where it did not apply, including
GBEs, statutory marketing authorities and unincorporated associations;• new policy principles to regulate markets traditionally supplied by governments,
particularly where there are natural or mandated monopolies. These principlesincluded: reviews of regulatory restrictions to competition on a national level;
structural reforms of monopolies;
limits on monopolistic pricing;
the granting of access rights to essential facilities; and
ensuring that public and private enterprises compete on neutral terms.
• a National Competition Council, be established jointly by the Commonwealth,state and territory governments to assist in progressing co-operative reforms; and
• the creation of an Australian Competition Commission by merging the TradePractices Commission and the Prices Surveillance Authority (Hilmer 1993a).
The Hilmer review has been portrayed as ‘a watershed in the process ofmicroeconomic reform in Australia’ (IC 1994, p. 6).
At the February and August 1994 meetings of COAG, the Commonwealth, states andterritories agreed, in principle, to the competition policy principles outlined in the

20 MONITORING MICRO REFORM — SETTING THE SCENE
Hilmer review. COAG also agreed that the benefits of economic growth and revenuearising from the Hilmer and related reforms should be shared between allgovernments. The February meeting also reached agreement on the establishment of anational gas market. This was significant because it represented one of the first stepstowards implementing the principles of the national competition policy.
In Working Nation, the Commonwealth Government’s 1994 White Paper onEmployment and Growth, the Prime Minister, commenting on the COAG agreement,stated that:
Together, we have recently accomplished a landmark agreement to move towardsimplementing the recommendations of the Hilmer Report on competition policy. Competitionpolicy will be introduced to large parts of the economy that until now have been sheltered fromit, including utilities owned by Commonwealth and State governments.
In a number of other key infrastructure areas, including the ports, water, gas, electricity andrail, the Commonwealth is working with the States to develop international best practices andso a more efficient and competitive nation (Keating 1994b, p. 23).
The government also announced in Working Nation that the BIE would continue itswork on international benchmarking of key infrastructure industries through to1998-99. This work, which helps to promote international best practice outcomes, wasextended to cover water supply, an analysis of pricing issues in relation toinfrastructure service industries, and the benchmarking of key government businessrelated service activities. The government’s decision to continue and extend theinternational benchmarking work indicated the importance of this work in identifyingthe need for further reform to Australia’s infrastructure. It also highlighted the factthat international best practice is likely to be a moving target that requires continuousmonitoring and improvement. The broadening of the BIE’s work program to includegovernment services signified a perceived need for efficiency improvements in thisarea, encompassing activities such as environmental regulation, business licensing,quarantine and inspection services and customs.
2.12 Recent developmentsOn 12 April 1995, an historic agreement was reached. The Commonwealth, state andterritory governments agreed to a new national competition policy, based on therecommendations of the Hilmer review. The agreement included:• the extension of the Trade Practices Act to cover all businesses and state and
local government enterprises;• principles for reforming public monopolies, such as electricity and gas;
— access regimes allowing third party access to essential facilities, such aspower grids, gas pipelines and railways;

BUREAU OF INDUSTRY ECONOMICS
THE EVOLUTION OF MICROECONOMIC REFORM IN AUSTRALIA 21
— a schedule for reviewing existing anti-competitive laws and regulations. (Thestates and territories are required to develop a timetable for reviewing alllaws that restrict competition by June 1996);
• provisions for more neutral competition between public and private sectorenterprises. Governments are now required to publish statements detailing apolicy for competitive neutrality; and
• establishment of the Australian Competition and Consumer Commission (toreplace the Trade Practices Commission and the Prices Surveillance Authority)and the National Competition Council.
On 30 October 1995 the Assistant Treasurer announced that significant elements ofthe new competition policy would commence on 6 November 1995 (Gear 1995). Onthat date, a new regime allowing third party access to certain nationally significantfacilities became operative. In addition, the Australian Competition and ConsumerCommission commenced operations as the new watch dog of competition monitoring prices, costs and profitability of industries and businesses. The NationalCompetition Council also commenced its oversight of the national competition policyprocess. The Council will make recommendations to Ministers on third party access toinfrastructure and advise on the effectiveness of state and territory access legislationand prices oversight arrangements. The Council will also assist governments’implement their reform programs.
The Assistant Treasurer also announced the extension of prices surveillance to stateand territory GBEs (Gear 1995). The extension of the Trade Practices Act to areasbeyond the Commonwealth’s jurisdiction is expected to be finalised by 21 July 1996.
The broad-ranging nature of the national competition policy principles outlined above,are likely to provide the basis for the microeconomic reform agenda in the comingyears. A significant challenge now facing Australian governments is to vigorously andeffectively implement the main elements of national competition policy.
Commentators have applauded the decision to implement a national competitionpolicy. However, some concerns have been expressed about inconsistencies in theapplication of competition principles. For example, in its 1994-95 Annual Report, theIndustry Commission suggested:
The direction now set by the competition policy agreements should drive reforms elsewhere inthe economy. Other areas should not be sheltered from the same sort of competition principles.For example, Australia needs to continue to make labour markets more productive and flexibleso as to receive the full benefits of competitive pressures on enterprises.
.... The reversal of the Government’s One Nation commitment to the creation of a singleaviation market with New Zealand runs counter to the direction of competition policy.Similarly, coastal shipping policy continues to restrict the entry of foreign vessels toAustralia’s coastal trades. (IC 1995a, p. 17).

22 MONITORING MICRO REFORM — SETTING THE SCENE
While not seeking to comment on these specific issues, the basic reason forencouraging competition throughout the economy is to improve efficiency productive, allocative and dynamic. By generating increased income from theeconomy’s physical and human resources society can better afford to aim for highoutcomes against social, environmental and distributional objectives. However, wherethe range of policy instruments available to governments is constrained it may benecessary to weigh-up competing objectives. In such cases, governments must decidewhether the trade-offs associated with following one approach over another arejustified in terms of enhancing overall community welfare.

BUREAU OF INDUSTRY ECONOMICS
14
3 Trade liberalisation and industryassistance
For much of this century the Australian economy has operated with relatively highbarriers against imports, particularly for manufacturing industry. Some of thesebarriers were natural, arising from the cost of transport and the distance betweenAustralia and other industrialised countries. This ‘tyranny of distance’ hasprogressively declined, as transport and telecommunications have become moreadvanced and less costly and our Asian neighbours have become more industrialised.Other barriers were artificial. Initially they were put in place to raise revenue. Overtime successive Australian governments utilised these barriers as tools to build upAustralia’s industrial capabilities and generate employment. Increasingly, sheltering‘needy’ industry from international competition became their primary focus. In thelatter part of the last decade, Australian governments initiated a reform program whichwill make Australia one of the most open economies in the world by the turn of thecentury.
This chapter firstly puts the current reform process in context by briefly summarisingthe earlier protectionist policies of Australian governments.1 Section 3.2 reviews someof the major trade liberalisation and industry assistance reforms that have occurredsince 1988. The chapter also includes a brief discussion of Australia’s recentinvolvement with regional and global trade liberalisation (section 3.3) and presentssome concluding comments in section 3.4.
3.1 An historical contextSince federation in 1901, trade barriers and industry protection have played a centralrole in Australia’s economic development. This focus on assistance and trade barriersstemmed, in part, from the policies of a number of the colonies prior to federation. Atthat stage, tariffs were the main source of many colonies’ government revenue. Theywere also, to varying degrees, a mechanism for protecting industry. By federation, thestates' views on protection ranged from the free trade stance of New South Wales tothe overtly protectionist stance of Victoria. Eventually the protectionist arguments,coupled with the need for tax revenue, prevailed. The new federal government, via itsexclusive power to impose customs duties, put in place a system of tariffs for thenation. Following a review of the tariff system in 1908 the government of the day
1 A comprehensive review of Australia’s tariff history may be found in Capling and Galligan
(1992).
BUREAU OF INDUSTRY ECONOMICS
TRADE LIBERALISATION AND INDUSTRY ASSISTANCE 15
raised tariffs above the levels set at federation to an average of 20 per cent. Australia’sfirmly entrenched protectionist policy also became closely linked to other social andeconomic objectives, such as ‘fair wages’. Protection allowed assisted industry to earna higher return on their investments and the arbitration system ensured that workersreceived a ‘fair’ share of this return.
In the 1920s Australia’s protectionist policy became a vicious circle of tariff increasesfollowed by wages increases. The government’s concern about the circularity of tariffincreases and wage rises led to a review of Australia’s tariff arrangements by acommittee of eminent Australian economists. The Brigden Committee reported to thegovernment in 1929. It expressed concern about the escalation of the tariff butessentially endorsed its retention. The committee reached this conclusion on thegrounds that ‘the same average income for the same population could not have beenobtained without protection’ (Brigden report quoted by Capling and Galligan 1992,p. 93). The onset of the Great Depression and an ailing manufacturing sector saw thegovernment introducing even higher tariffs.
The protective tariff had become ‘the cornerstone of Australia’s manufacturingindustry policy’ (Capling and Galligan 1992, p. 78). Indeed, in 1930 Sir KeithHancock, a leading historian, noted:
Protection in Australia has been more than a policy, it has been a faith and dogma. Its criticsduring the second decade of the 20th century dwindled into a despised and detested sectsuspected of nursing an anti-national heresy (Hancock 1930, p. 89).
Although Australia had a tradition of high tariffs, it did provide preferential access toimports by way of lower tariffs for selected countries. The United Kingdom was theprincipal beneficiary of these preferences until the 1960s. The preference affordedUnited Kingdom imports had important consequences for the efficiency of Australianindustry.
The preferential arrangements had resulted in most capital equipment, component parts andmaterials for Australian manufacturing industries being obtained from the United Kingdom; ithad tended to tie the development of Australian industries to the rate and type of developmentoccurring in the United Kingdom and this had sometimes lagged far behind development inother industrialised countries (Rattigan 1986, p. 14).
Tariffs were not the sole form of trade barrier used by Australia. For example, afterWorld War II quantitative import restrictions (quotas) were also imposed on importsfrom the United States and other countries to protect the ‘sterling currency bloc’.Then, in 1952, to alleviate Australia’s deteriorating balance of payments position,quotas were introduced for imports from all sources. These quotas remained in placeuntil the balance of payments improved in 1960 (Rattigan 1986).
The manufacturing sector was by far the greatest beneficiary of the tariff. However,with the passage of time, the agricultural sector also received assistance to ensure‘orderly marketing’ and, where possible, protection from imports. In many cases stategovernments instigated this assistance which relied on compulsory marketing

MONITORING MICRO REFORM — SETTING THE SCENE16
arrangements supported by legislation.2 Price stabilisation was a common feature ofthese statutory marketing arrangements (SMAs). Over time, the federal governmentbecame more involved in providing assistance to agriculture. By the 1950s, it hadprovided statutory marketing or stabilisation support to the production and marketingof dried fruits, wheat, dairy and tobacco. These schemes, coupled with quarantineregulations, production and input subsidies and, later, taxation concessions for theagriculture sector led to an expansion of protection in the economy. ‘Protection allround’ or, at least, protection for two sectors of the economy, became the order of theday (Capling and Galligan 1992).
Australia’s involvement in the General Agreement on Tariffs and Trade (GATT)highlights the importance the government placed on protection. Australia was one theoriginal signatories to the GATT, which was established to achieve global tradeliberalisation. However, Australia took no part in the multilateral tariff reductionsnegotiated in the 1950s and the 1960s.
In part this was because successive Australian Governments had considered that offers by othercountries to reduce barriers to trade in agricultural products (which formed the major part ofAustralia’s exports) had not been good enough, but also because the Australian Governmenthad wanted to continue to use the Customs tariff to diversify the Australian economy (Rattigan1986, p. 10).
Capling and Galligan (1992 p. 107) point out that, as a result of these decisions,Australia by 1970 ‘had the dubious distinction of sharing with New Zealand thehighest manufacturing tariff rates in the industrialised world’.
3.1.1 Some chinks in the protective armour
‘Need’ was the basis of Australia’s tariff protection and more general industryassistance policy for over half a century. This assistance took many forms, includingtariffs, quotas, bounties and subsidies, local content schemes and statutory marketingarrangements. These instruments of industry assistance by their very nature imposed abarrier to trade with the rest of the world. They sheltered many Australian industriesso that, in many cases, there was little incentive for them to introduce new technologyor respond to disciplines associated with international competition. The higher costsand lack of product diversity arising from these assistance arrangements penalisedother Australian industries, exporting industries in particular, and consumers.
2 Under these arrangements a statutory authority is given power to acquire, market and set
domestic prices. Price stabilisation and income stabilisation was a common objective of thesearrangements. If a commodity is exported, domestic prices are generally set higher than exportprices. (However, in some instances the reverse situation has occurred.) In some cases, returnsfrom the export and domestic markets are pooled, to pay an average return to producers. Thesearrangements are designed to maximise growers returns and, in so doing, to raise prices paidby domestic consumers and producers who use the produce as an input. SMAs can operate inconjunction with tariffs or quotas.
BUREAU OF INDUSTRY ECONOMICS
TRADE LIBERALISATION AND INDUSTRY ASSISTANCE 17
In 1963 the federal government formed a committee chaired by Sir James Vernon,general manager of CSR, to inquire into the measures used to protect industry fromimports. The Vernon Committee’s 1965 report made a number of recommendationsthat were at odds with the protection ‘dogma’ of the day. It recommended that theTariff Board introduce the notions of economic and efficient industries and take intoaccount the economy wide consequences when considering protection. The VernonCommittee also stressed that an industry’s existence was not, of itself, sufficientgrounds to justify protection. The committee’s recommendations were neverimplemented by Government.
The Tariff Board’s 1969-70 annual report highlighted the extent of the assistanceprovided to industry, as well as the costs it imposed. In this report the Tariff Board forthe first time reported its estimates of the effective rate of assistance (ERA). Thissummary statistic facilitates comparisons of the relative incentive effects provided bythe assistance regime.3 The Tariff Board reported that:
the average rates of effective protection available to individual Australian manufacturingindustries in 1967-68 ranged from 0 to 120 per cent, and the average rate for manufacturingindustry as a whole was 46 per cent. This average rate of effective protection is equivalent toabout $2 700m per annum (Tariff Board 1969-70 Annual Report quoted by Rattigan (1986)p. 78).
This potential cost of the tariff was ‘about 20 per cent higher than the total expenditurethat year [1967-68] by all Australian governments — federal, state and local — oneducation, health, social security, welfare and defence’ (Rattigan 1986, p. 78). Thepress frequently quoted this figure and it gave ammunition to primary producers,lowly assisted or unassisted activities and consumer groups to increase pressure on thegovernment for a reduction in the level of protection.
In 1971 the federal government announced the Tariff Board was to undertake acomprehensive review of tariffs. The Tariff Board had foreshadowed such a reviewsome four years earlier. From Rattigan’s perspective, the review would eventuallyreduce assistance for those industries which could only survive with substantialprotection. This, he believed, would encourage a reallocation of resources to moreefficient industries and improve national welfare. However, at that stage, the federalgovernment still appeared to maintain a ‘needs’ based view of assistance. Forexample, it identified a number of considerations it might take into account when
3 The effective rate of assistance takes into account the assistance provided to an activity’s
output as well as any assistance, positive or negative, provided to intermediate inputs and land,labour and capital. More precisely, the ERA can be defined as the percentage increase inreturns to an activity’s value added per unit of output relative to the hypothetical situation of noassistance.ERA = (Assisted value added less Unassisted value added)/(Unassisted value added)x100.Wide disparities in ERAs indicate the potential for resources to be misallocated. That is,resources could be directed into activities which do not maximise the economy’s grossdomestic product.

MONITORING MICRO REFORM — SETTING THE SCENE18
reviewing an industry’s assistance. These included ‘reasonable and adequateprotection for worthwhile industries’ (Rattigan 1986, p. 98).
3.1.2 Acceptance of the need for a change in direction
The election of the Whitlam Government in 1972 led to a significant change inAustralia’s protectionist policy. In 1973, in the face of mounting inflationary pressure,the government cut all tariffs by 25 per cent. Macroeconomic considerations were thebasis of this decision; nevertheless, it led to a substantial reduction in the level ofmanufacturing assistance. The effective rate for the manufacturing sector fell from 35per cent in 1972-73 to 27 per cent in 1973-74.
For some manufacturing industries, this decline in assistance was short lived. In 1974,in response to a declining economy, high inflation and rising imports, the governmentintroduced quotas for a number of ‘sensitive’ industries. In many cases thegovernment quickly removed the quotas. However, for the passenger motor vehicles(PMV) and textiles, clothing and footwear (TCF) industries, they became a long termpart of their assistance arrangements.
Assistance to the manufacturing sector never returned to the heights estimated by theTariff Board in its 1969-70 Annual Report. This was largely due to the government’sdecision not to resort to tariff increases in 1974. By 1974-75 the manufacturingsector’s average ERA was 28 per cent, a small increase on the 1973-74 low. Thisestimate, however, masks the wide disparities in the assistance afforded manufacturingindustries. The quota assisted activities PMV, TCF received substantially higherassistance than the sectoral average (see figure 3.1).
The Whitlam Government, in its first year of office, also gave the Tariff Board a newmandate and changed its name to the Industries Assistance Commission (IAC). TheIAC’s charter was much broader than the Tariff Board’s. Its scope covered all sectorsof the economy, not just manufacturing. The IAC Act required that an economy wideview of benefits and costs be taken when making recommendations on industryassistance.
With its broader charter, the IAC commenced reviewing and estimating the assistanceprovided to the agricultural sector. It found the assistance provided to agriculturalactivities tended to fluctuate. This was due, in part, to the counter cyclical nature ofthe assistance provided. The IAC estimated that the average ERA for agriculturalactivities was 28 per cent for 1970-71. By 1974-75 this assistance had declined to 8per cent. The IAC also found substantial variations in the assistance affordedagricultural commodities. The ERA for some activities for example, fresh milk,eggs, citrus and tobacco growing was commonly above 100 per cent (IAC 1983).

BUREAU OF INDUSTRY ECONOMICS
TRADE LIBERALISATION AND INDUSTRY ASSISTANCE 19
Figure 3.1 Average effective rates of manufacturing assistance,1968-69 to 2000-01
(Per cent)
Clothing and Footwear (ASIC 24)
68-69 74-75 88-89 91-92 2000-01
25% Tariff reduction
Quotasintroduced
May 1988Statement
March 1991Industry PolicyStatement
Manufacturing Average (ASIC 21-34)
Motor Vehicles and Parts (ASIC 323)
Textiles (ASIC 23)
0
20
40
60
80
100
120
140
160
180
200
220
240
260
Source: Industry Commission 1995b
The IAC continued the tariff review instigated under the Tariff Board. This review ledto reductions in tariff assistance for some industries but increasing disparities in theassistance provided to the manufacturing sector.4 This was largely due to the moresensitive industries receiving higher assistance through quotas. The IAC estimated thatat a sectoral level the tariff reductions arising from the review were more than offsetby the increased protection arising from the quotas, which:
added some 9 percentage points to the sectoral average effective rate, thereby more thanoffsetting the impact of the tariff reductions made since the introduction of quotas in 1974(IAC 1987a, p. 14).
By the late 1970s, there was growing recognition that the high levels of tariffs andquotas had contributed to an inward looking manufacturing sector. And manufacturingindustry was increasingly becoming uncompetitive on international markets. In itsWhite Paper on Manufacturing Industry, the federal government formalised itscommitment to a general reduction in protective tariffs in order to encourage a more
4 The average variability or disparity in assistance can be estimated by a statistic known as the
standard deviation, the larger the estimate, the greater the disparities in effective assistance.The estimated standard deviation in effective rates for the manufacturing sector increased from23 percentage points in 1973-74 to 43 percentage points in 1983-84 (IC 1995a, p. 210).

MONITORING MICRO REFORM — SETTING THE SCENE20
efficient manufacturing sector. Although the government now accepted the need fortariff reductions, it was also of the view that:
A time of lower economic activity, such as the present, is generally not an appropriate time forreducing protection (Commonwealth of Australia 1977).
3.1.3 Industry plans: a move to more selective assistance?
From the early 1980s, industry plans became an important element of industryassistance policy. This change in the policy stance commenced under the FraserGovernment. It continued under the direction of John Button, the industry minister inthe Hawke Government which came to power in 1983.
Industry plans were put in place for a range of activities. Initially these plansaddressed specific problems. For example, PMV tariffs increased to 57.5 per cent in1978 in the face of the Australian industry's reduced competitiveness. And in thefollowing year the government introduced an export facilitation scheme to encourageexports of PMV and reduce input costs. Similarly, the government introduced a steelplan after BHP, Australia’s principal producer, threatened to withdraw from theindustry. This plan involved production bounties, a safety net mechanism for certainproducts and commitments from BHP to meet targets for production, investment andproductivity. In the later years, the plans were intended to provide a stableenvironment to allow restructuring and phasing of protection. The PMV and the TCFplans, for example, involved phased reductions in tariffs along with the progressiveremoval of quotas. On announcing the arrangements for the motor vehicle industry,the Minister for Industry and Commerce commented that:
They are designed to provide short-term assistance to the industry to help it face up to theprocess of orderly adjustment with a view to attaining greater efficiency and stability (Button1984, p. 2).
In other cases, plans were put in place because the government considered theindustries had potential for the future or had been impeded in their growth by somefailure in the market pharmaceutical products and information industries fall intothis category.
Some commentators expressed concern that these plans represented a shift away fromthe economy wide approach to assistance to more ad hoc industry specific measures(see, for example, Gregory 1984). However, others saw them as an important tool foreconomic development. Stanford (1992), for example, drew attention to the largereductions in assistance being achieved under the PMV and TCF plans. He argued thatthe TCF plan’s assistance reductions represented:
an enormous reduction in assistance to the industry in this decade, and an outcome that couldnot have been realistically contemplated even five years ago (Stanford 1992, p. 42).
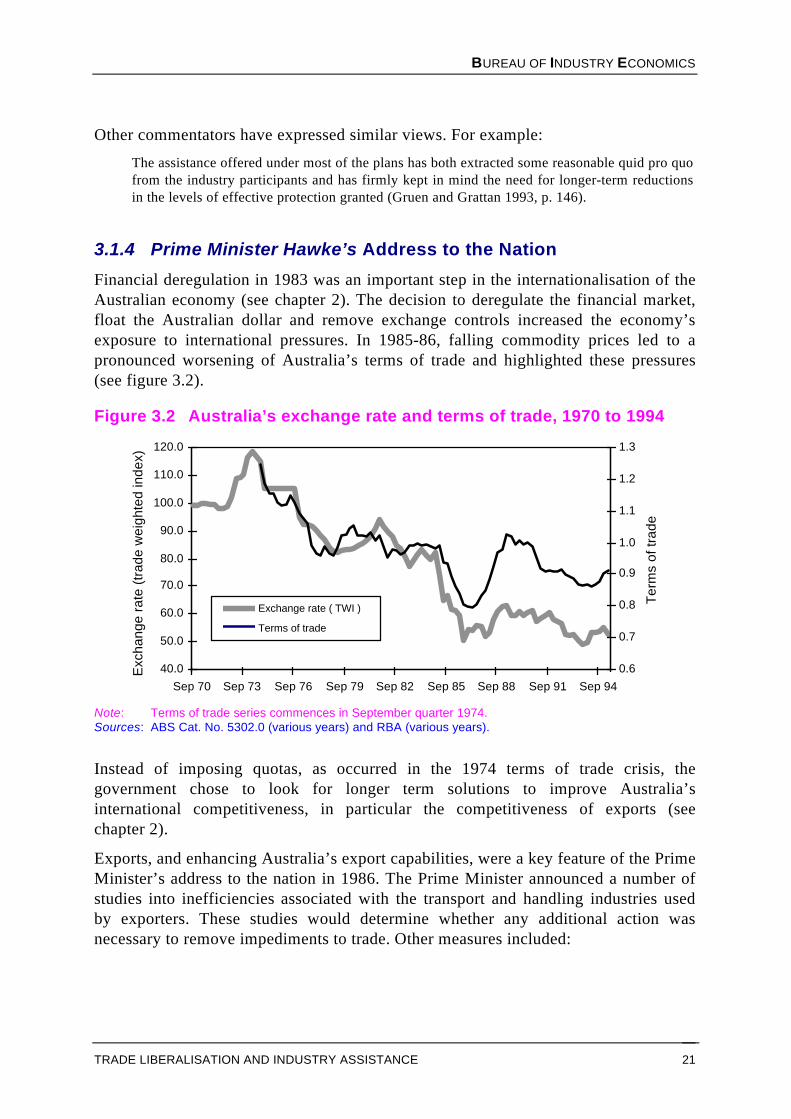
BUREAU OF INDUSTRY ECONOMICS
TRADE LIBERALISATION AND INDUSTRY ASSISTANCE 21
Other commentators have expressed similar views. For example:
The assistance offered under most of the plans has both extracted some reasonable quid pro quofrom the industry participants and has firmly kept in mind the need for longer-term reductionsin the levels of effective protection granted (Gruen and Grattan 1993, p. 146).
3.1.4 Prime Minister Hawke’s Address to the Nation
Financial deregulation in 1983 was an important step in the internationalisation of theAustralian economy (see chapter 2). The decision to deregulate the financial market,float the Australian dollar and remove exchange controls increased the economy’sexposure to international pressures. In 1985-86, falling commodity prices led to apronounced worsening of Australia’s terms of trade and highlighted these pressures(see figure 3.2).
Figure 3.2 Australia’s exchange rate and terms of trade, 1970 to 1994
40.0
50.0
60.0
70.0
80.0
90.0
100.0
110.0
120.0
Sep 70 Sep 73 Sep 76 Sep 79 Sep 82 Sep 85 Sep 88 Sep 91 Sep 940.6
0.7
0.8
0.9
1.0
1.1
1.2
1.3
Exchange rate ( TWI )
Terms of trade
Term
s of
trad
e
Exc
hang
e ra
te (t
rade
wei
ghte
d in
dex)
Note: Terms of trade series commences in September quarter 1974.Sources: ABS Cat. No. 5302.0 (various years) and RBA (various years).
Instead of imposing quotas, as occurred in the 1974 terms of trade crisis, thegovernment chose to look for longer term solutions to improve Australia’sinternational competitiveness, in particular the competitiveness of exports (seechapter 2).
Exports, and enhancing Australia’s export capabilities, were a key feature of the PrimeMinister’s address to the nation in 1986. The Prime Minister announced a number ofstudies into inefficiencies associated with the transport and handling industries usedby exporters. These studies would determine whether any additional action wasnecessary to remove impediments to trade. Other measures included:
MONITORING MICRO REFORM — SETTING THE SCENE22
• a review of agricultural pricing and marketing arrangements (by the Departmentof Primary Industry) to assess whether they were constraining the internationalcompetitiveness of domestic processing industries; and
• a larger role for Austrade in facilitating high technology exports and exports bynew small exporters. Austrade would also assist in developing export strategiesfor industries with export potential.
The Prime Minister also announced measures to assist the heavy engineering industry.These measures involved concessional interest rate loans to facilitate investments toimprove the efficiency of plant operations (Hawke 1986).
3.2 Increased momentum towards reformBy the mid 1980s, attitudes towards protection had changed appreciably. To varyingdegrees, most academic economists, many senior bureaucrats, the financial press andparticularly the exporting sectors’ industry associations expressed anti-protectionistviews. Reductions in assistance also became easier to introduce at this time. Theexchange rate had substantially depreciated since its float in 1983 the tradeweighted index fell from an average of 80.7 in the March quarter of 1983 to anaverage of 58.0 in the June quarter of 1988 (see figure 3.2). This depreciation had amajor, positive impact on the international competitiveness of Australian industries.
In response to this depreciation, the government, on the advice of the AutomotiveIndustry Authority, made a number of amendments to the 1985 PMV plan, commonlyknown as the Button plan. These changes were to ensure that the industry hadsufficient pressure to restructure. In 1988, the government abolished import quotas forPMV and reduced the tariff on PMV imports from 57.5 per cent to 45 per cent. Localcontent arrangements designed to assist component producers were also modified, sothat by 1989 component producers competed under a tariff only regime.
By 1987-88, the average ERA for manufacturing had fallen to 19 per cent, less thanhalf of the Tariff Board’s 1968-69 estimate (figure 3.1). During this period, assistanceto the sector had been influenced by the:• 25 per tariff cut in 1973, the introduction of quotas and industry specific plans;• further tariff reductions in 1977 following the devaluation of the dollar and
Australia’s multilateral trade negotiations;• tariff reductions and assistance rationalisations arising from IC inquiries
covering key industries, such as chemicals and plastics; and• the increased use of export incentives and bounties (IC 1995a, p. 32).

BUREAU OF INDUSTRY ECONOMICS
TRADE LIBERALISATION AND INDUSTRY ASSISTANCE 23
3.2.1 May 1988 Economic Statement
The depreciation of the dollar also provided the government with an excellentopportunity to undertake comprehensive reductions in tariffs and industry assistancemore generally. It took this opportunity in May 1988. Reducing tariff protection was amajor focus of the May 1988 economic statement. In announcing the phasedreductions in tariffs, the Treasurer said:
big cuts to industry protection through tariff reductions... will lower costs and furtherencourage our manufacturers to look beyond Australia for market opportunities (Keating 1988,p. 2).
A four year program of phased tariff reductions commenced on 1 July 1988. Tariffsabove 15 per cent were to be phased down in annual steps to 15 per cent by 1992.Tariff rates of 15 per cent or less were to be reduced to 10 per cent over the sameperiod. For many tariff items, the announced tariff phasing would amount toreductions substantially larger than those experienced in 1973. For example, importsof certain vegetable products would see a 75 per cent reduction in the tariff rate(table 3.1).
Table 3.1 May 1988 Economic Statement: proposed tariff phasing
Industry Maximum tariffrate applying
30 June 1988
Maximumtariff at end of
phasedreductions
End date Percentagereduction in
maximum tariffby end of
phasing period(per cent) (per cent) (per cent)
Chemicals & plastics 20 15 1 January 1992 25Communications 26 15 1 January 1992 42Glass & glassware 30 15 1 January 1989 50Luggage 20 15 1 January 1989 25Medical & scientificequipment 25 15 1 January 1990 40Passenger motorvehicles 45 35 1 January 1992 22Paper, pulp & printing 40 15 1 January 1990 62.5Textiles, clothing &footwear 205 a 55 a 1 July 1995 a 73 aVegetable products 40 10 1 January 1994 75
Note :aThis rate includes the base tariff rate, the tender premium paid on quota and the out-of-quota rate.Prior to the statement, TCF quotas were to be abolished in March 1996, the date of abolition wasbrought forward to July 1995.
Sources: Keating (1988) and BIE calculations.
The statement’s ‘tops down’ approach to reducing tariffs was an important steptowards reducing assistance. This approach, by applying a 15/10 tariff ceiling,targeted some of the most heavily protected industries and reduced the disparities inassistance between industries. Some notable exceptions to the 15/10 tariff ceiling weresectors that were the subject of industry specific plans. Nevertheless, the TCF and

MONITORING MICRO REFORM — SETTING THE SCENE24
PMV industries were also subject to phased reductions in tariffs. In the case of TCF,the government brought forward the abolition of quotas by 9 months to July 1995 (seetable 3.1). But these industries continued to receive substantially higher tariffprotection and industry assistance than other manufacturing industries.
A similar situation applied in the agricultural sector. Tariffs were not a major form ofassistance for many agricultural commodities, however, they did apply to somecommodities, for example, citrus, dried vine fruits and tobacco. In the case of sultanasand tobacco the tariffs worked in conjunction with a SMA and increased the level ofassistance available. In these cases, the tariff reductions imposed a reduced upper limiton the assistance available from the marketing arrangements.
The May 1988 economic statement also reduced the assistance available under theSMAs applying to sugar growing and raw sugar and milk directed into manufactureddairy products. For sugar, the statement announced the removal of the embargo onsugar imports and the introduction of a tariff. This tariff was to be phased down fromits initial rate of $115 per tonne to $70 per tonne in 1992.5 For dairy products, thestatement announced the acceleration of the phased removal of supplementary supportpayments. Despite these changes, sugar, tobacco and dairy production continued toreceive substantially higher assistance than the agricultural sector average.
Notwithstanding the continued disparities in assistance levels, the announced tariffreductions sent important signals to Australian industry about the government’sapproach to protection. The reductions represented a major move towards exposingAustralian industry to foreign market disciplines.
3.2.2 Statutory Marketing Arrangements reform continued
By 1988 the Commonwealth and state governments were increasingly questioning theappropriateness of using SMAs.6 The concerns related to the efficacy of thesearrangements in achieving their objectives and the costs imposed on the widereconomy, particularly the food processing sector. Governments instigated a number ofreviews of SMAs, which led to varying degrees of reform. For example:• a committee, at the request of the Minister for Primary Industry and Energy,
reviewed a number of administrative aspects of SMAs (Davis 1990). As a resultof this review, the government, amongst other things, made the authorities underits control more accountable and established performance indicators;
5 The May statement announced that the embargo was to be replaced by an ad valorem tariff.
However, this was later changed to a specific tariff. The ad valorem assistance provided by aspecific tariff is higher when world sugar prices are low and lower when world sugar prices arerelatively high.
6 In its review of Statutory Marketing Arrangements in 1991 the IC identified 98 SMAs ofwhich only ten were under the jurisdiction of the Commonwealth Government (IC 1991).

BUREAU OF INDUSTRY ECONOMICS
TRADE LIBERALISATION AND INDUSTRY ASSISTANCE 25
• the New South Wales government instituted a review of egg marketingarrangements and, subsequently, deregulated its egg industry in July 1989. Twoyears after deregulation, the average price received by New South Wales eggfarmers had declined from $1.45 per dozen to 89 cents per dozen and the averageretail price declined from $2.04 to $1.54 (NSW Agriculture and Fisheries 1991).As New South Wales was the largest producer of eggs, the decision to deregulatein that state had far reaching ramifications for the Australian industry. Over thenext few years inter-state trade in eggs from New South Wales forced thederegulation of the egg industries in South Australia and Victoria and partialderegulation in Queensland;
• a 1988 review of fresh milk marketing in Western Australia led to the removal ofstatutory controls over wholesale and retail prices of dairy products (IC 1991).Other states have also reviewed, and subsequently deregulated, their control over‘past the farm gate’ distribution and sale of fresh milk. For example, theVictorian government has progressively removed controls on milk pricingbeyond the farm gate; and
• in 1989 marketing arrangements for wheat were partially deregulated. Thisinvolved the removal of the Australian Wheat Board’s (AWB) forty yearmonopoly over domestic sales. However, the AWB maintained its compulsoryacquisition powers over wheat destined for export markets. Partial deregulationalso saw the replacement of the wheat underwriting scheme with a governmentguarantee on AWB borrowings. Wheat pooling arrangements were also modifiedto allow returns to growers to more closely reflect the wheat quality they grow.In accordance with the recommendations of the Royal Commission into GrainHandling, Storage and Transport, the amended legislation also required theAWB to use cost effective transport options for moving wheat to the point ofsale (Edwards 1992).
3.2.3 Garnaut report
Australia’s increasing openness and the increasing emphasis placed on export, ratherthan import competing industry, produced a greater awareness of the rapidly growingAsian economies. In his 1990 report to the Prime Minister entitled Australia and theNortheast Asian Ascendancy, Professor Ross Garnaut saw great potential forimproving Australia’s relationships with Asia. Garnaut argued that Australia’s andAsia’s resources and asset bases were in many respects complementary. Strengtheningdiplomatic and trade links and ensuring non-discriminatory market access would be ofmutual benefit. He also maintained that accelerating all aspects of the microeconomicreform process in Australia was critical if Australia was to achieve these benefits. Itwas particularly important that the government abolish ‘all official restrictions in tradeimposed at Australia’s borders by the end of the century’ (Garnaut 1990, p. 7).

MONITORING MICRO REFORM — SETTING THE SCENE26
3.2.4 Building a Competitive Australia
In March 1991, the Prime Minister, as part of his Building a Competitive Australiastatement, announced new initiatives to further reduce tariff protection. Whenannouncing the changes, Prime Minister Hawke said:
with these tariff cuts, we demonstrate once again our commitment to liberalising internationaltrade. The Government has been fortified in this approach by a number of recent reports, notleast Dr Ross Garnaut’s Australia and the Northeast Asian Ascendancy (DPM&C 1991, p. 1.7).
As a result of the statement, most tariffs will have declined to a maximum of 5 percent by July 1996 (see table 3.2). Other Commonwealth assistance to the
Table 3.2 Tariff phasing arrangements arising from the March 1991Statement (per cent)a
1990 1991 1992 1993 1994 1995 1996 1997 1998 1999 2000
PMV
Passenger motorvehicles & originalequipment 40 37.5 35 32.5 30 27.5 25 22.5 20 17.5 15PMV replacementparts 15 15 15 15 15 15 15 15 15TCFb
Apparel & certainfinished textiles 55 55 51 47 43 40 37 34 31 28 25Footwear 45 45 41 37 33 30 27 24 21 18 15Cotton sheeting &woven fabrics 40 40 37 33 31 28 25 22 19 17 15Other fabrics 35 35 32 29 27 25 23 21 19 17 15Footwear parts 35 35 32 29 26 23 20 17 14 12 10Non-quota TCF 25 25 23 21 19 17 15 13 12 11 10Other non-quotaTCF 15 15 12 10 8 5 5 5 5 5 5Sugar and certainvegetableproducts
Raw and refinedsugar (per tonne) $115 $76 $55 $55 $55 $55 $55 $55 c c c
Certain vegetableproductsd 30 25 20 15 10 9 8 7 5 5 5Other tariff items
General tariff rates(previously phasingto 15 per cent) 15 12 10 8 5 5 5 5 5 5General tariff rates(previously phasingto 10 per cent) 10 9 8 7 5 5 5 5 5 5
Notes: aAll rates are the ad valorem tariff applied to the free on board value except for sugar, where aspecific rate applies.bUntil 1993, these rates represent the base tariff rate. A tender premium, reflecting the quota, alsoapplied to imports. Quotas were phased out completely by 1 March 1993.cTo be determined. The sugar tariff will be reviewed in 1995-96.dCovers dried, dehydrated potatoes, flour, meal and flakes of potatoes and tomato products.
Source: DPM&C 1991.

BUREAU OF INDUSTRY ECONOMICS
TRADE LIBERALISATION AND INDUSTRY ASSISTANCE 27
manufacturing and agricultural sectors by way of bounties was to be reduced in linewith the pace of tariff reform.
The more highly assisted activities in the manufacturing sector PMV and TCF were subjected to different phasing arrangements (see table 3.2). The assistancearrangements which will apply to these industries post 2000 will be reviewed in 1996.Longer term assistance to some of the more highly assisted activities in theagricultural sector dairy, sugar and tobacco growing would be decided at a laterdate in response to IC inquiries which were either underway or foreshadowed (see box3.1). The assistance afforded these three agricultural activities raises prices paid bydomestic manufacturers and consumers above those that would apply under free trade.This is a common feature of assistance afforded by SMAs. These higher costs tend towork against adding value to Australia’s agricultural commodities for export.
Box 3.1 Longer term assistance arrangements for the dairy, sugar andtobacco industries
Dairy, sugar and tobacco growing have traditionally received high levels of industryassistance. In 1991-92, for example, the effective rates of assistance for these three activitieswere estimated at 73, 21, and greater than 200 per cent, respectively. At the time, theagricultural sector’s average ERA was 12 per cent (IC 1994).
Assistance to dairy farmers involves a complex set of arrangements at the Commonwealthand state government level. A Commonwealth imposed levy, paid on all milk produced, wasan important part of these arrangements. This levy funded market support payments forexported manufactured dairy products. The marketing arrangements also increased domesticprices for fresh milk and manufactured dairy products. These higher prices more thancompensated producers for the levy they paid.
Commonwealth assistance to the dairy industry has been rationalised and reduced since theintroduction of the Kerin Plan in 1986. The IC reviewed these assistance arrangements in1992. Following this review, new arrangements, known as the Crean Plan, were introduced.Under the Crean Plan market support payments were to be phased down in equal steps to 10per cent by 2000. Under the Kerin Plan, market support payments could not exceed 30 percent of the average export price. As a consequence of the successful completion of theUruguay Round of GATT, these assistance arrangements were considered as an exportsubsidy. The export subsidy terminated on 1 July 1995.
The new arrangements, which are GATT consistent, continue to support the domesticindustry by increasing the domestic price of dairy products. These new arrangements willphase out completely by 30 June 2000 (DPIE 1995).
Like dairy, assistance to sugar growing and milling involves a complex set of arrangements.The Queensland Government controls production, acquisition and returns to growers andmillers. The Commonwealth assists the industry through tariffs. Under these arrangements,the domestic price of sugar is higher than the price received on the export market approximately 80 per cent of Australian sugar production is exported as raw sugar.
MONITORING MICRO REFORM — SETTING THE SCENE28
Box 3.1 Longer term assistance arrangements for the dairy, sugar andtobacco industries (continued)
The May 1988 economic statement removed the embargo on sugar imports and introducedphased reductions in the new, specific tariff rate from $115 per tonne in 1990-91 to $55 pertonne in 1992-93. Following the IC review of the industry in 1992, and a further review byan industry task force, the Commonwealth Government, in February 1993, decided tomaintain the tariff at $55 per tonne until July 1997. Tariffs to apply post 1997 will besubject to a review in 1995-96.
For nearly three decades Australian tobacco product manufacturers operated underarrangements which gave them concessional (duty free) entry of imported leaf.Concessional entry of imports was conditional on producers having at least 50 per cent oftheir products content sourced from locally grown leaf. This local content scheme hadstifled competition in the growing industry and allowed growers to obtain higher prices fortheir product. In response to these arrangements, the industry developed an inefficientstructure, with too many growers and too much capacity to supply the demand for thedomestically produced tobacco leaf (IC 1994).
The Commonwealth Government announced a tobacco industry restructuring package inDecember 1994. This package was in response to the recommendations of an IC inquiry intothe industry, discussions with manufacturers and growers and the government’scommitments under the GATT Uruguay Round of trade negotiations. The package removedthe local content scheme and all tariffs on tobacco leaf, manufactured tobacco and tobaccoproducts by 1 January 1995. The package also included industry restructuring assistance,funded from a ‘one off’ contribution of $10.8 million by tobacco product manufacturers anda similar restructuring contribution from the three tobacco growing states (Collins et al1994).
The implementation of the March 1991 statement tariff reductions will reduce theERA for the manufacturing sector to 6 per cent by 1996-97. This is less than a third ofthe ERA applying prior to the implementation of the May 1988 Economic Statement.By 2000, with the completion of the announced reductions in assistance to PMV andTCF, the ERA will have declined to 5 per cent. At that stage, PMV and TCF tariffswill be significantly higher than the 5 per cent maximum tariff afforded othermanufacturing activities (see table 3.2).
Although the government had instigated another round of tariff reductions it was notprepared to allow Australian producers to be ‘seriously damaged by imports atdumped prices’ (DPM&C 1991, p.5.18). As a consequence, the governmentstrengthened Australia’s anti-dumping processes. The Prime Minister also stressedthat the government would maintain its vigorous campaign through the Cairns Groupto bring agriculture under the GATT’s international trade rules.

BUREAU OF INDUSTRY ECONOMICS
TRADE LIBERALISATION AND INDUSTRY ASSISTANCE 29
3.2.5 Industry policy in the future
Working Nation set down the Federal Government’s future directions for industry andtariff policy. It confirmed that the tariff reduction program announced in 1991 wouldremain on track. At the end of the current tariff reduction schedule, the general tariffrate would remain:
at a maximum of 5 per cent beyond 1996... Tariff and related arrangements for the passengermotor vehicle, and textiles, clothing and footwear industries will remain fixed through to theend of the decade. They will be reviewed in 1996, with a decision taken in 1997 onarrangements to apply beyond the year 2000. The sugar tariff will remain fixed until 1995-96,with a review conducted in 1995-96 to determine levels for 1996-97 and beyond (Keating1994a, pp. 43-44).
The Prime Minister also articulated his view of the government’s industry policy role:
The present objective of industry policy, adapted to the new environment facing firms, is toaccelerate the internationalisation of the Australian economy by focusing on the factors criticalto success in the global market place... The emphasis is not on industries, but on competitiveenterprises in any sector of the economy. In short, Government programs are designed to helpbuild competitive firms (Keating 1994a, p. 58).
3.3 Trade liberalisation beyond Australia’s shoresThe Closer Economic Relations Trade Agreement (CER) between Australia and NewZealand was an early step towards Australia’s trade liberalisation. The CERsuperseded the New Zealand-Australia Free Trade Agreement in 1983. The keydifference between the CER and the earlier agreement was that trade across theTasman was much more liberalised under CER. Under the New Zealand-AustraliaFree Trade Agreement, trade between Australian and New Zealand was to beprogressively liberalised for a limited number of specified goods. But, under CERtrade between the two countries is free of restrictions except for specific areas of tradewhich are set aside for later consideration.
The New Zealand-Australia Free Trade Agreement was a relatively inward lookingagreement and the conditions underlying it reflected the protectionist views of thetime. In contrast, the CER, particularly after the 1988 review, genuinely acceptedthere were benefits to both countries from creating a single, undifferentiated trans-Tasman market for goods and services.

MONITORING MICRO REFORM — SETTING THE SCENE30
The Australian government has also used international trade forums to press for worldwide trade reforms. Australia, through its involvement in the Cairns Group, played amajor role in the successful completion of the GATT’s Uruguay Round. This roundproduced agreement between member countries on the implementation of a number oftrade liberalisation reforms. These include the:• conversion of non-tariff barriers into tariffs which have been bound at a
maximum level;• inclusion of agriculture and services in the GATT framework;• reduction of tariff levels; and• phased reduction of agricultural assistance.
In response to the successful completion of the Uruguay Round, the FederalGovernment has undertaken a number of initiatives to ensure that Australia’sassistance to agricultural products meets the new GATT conditions (see box 3.1).
The government expects that the implementation of the Uruguay Round will lead to asubstantial growth in world trade and improved prospects for Australia. For example,a lower limit of the long term gains to Australia’s GDP from the liberalisation of tradein manufacturing, agriculture and resources could be in the order of $4.4 billion, in1992 dollars (IC 1994).
Recognising the importance of trade with our near neighbours and the potential forfuture trade, the Australian government has also pursued continuing liberalisation oftrade with Asia. The Asia Pacific Economic Cooperation (APEC) forum, of whichAustralia is a member, has put forward a program of trade liberalisation even broaderthan the GATT Uruguay Round of reforms.
In 1994 the leaders of the APEC group of economies met in Bogor, Indonesia. Themeeting discussed ways in which they might enhance the equitable growth anddevelopment of the Asia Pacific region, and the world as a whole. To this end, theAPEC leaders resolved to adopt the long-term goal of free and open trade andinvestment in the Asia Pacific region by 2020. The achievement of this goal will differbetween countries, taking into account the different degrees of member countries’economic development. The industrialised countries, including Australia, agreed toachieve free and open trade and investment by 2010. The less industrialised ordeveloping countries would achieve the free trade goal by 2020 (BIE 1995a).
The Osaka APEC summit meeting in November 1995 endorsed the earlier Bogorframework. At the next meeting of APEC, which is scheduled for 1996 in Manila,members will submit detailed action plans to reduce trade barriers.

BUREAU OF INDUSTRY ECONOMICS
TRADE LIBERALISATION AND INDUSTRY ASSISTANCE 31
3.4 Concluding commentsOver the last decade or so, there has been a significant move away from Australia’straditional, protectionist industry policy stance. The phased reductions in tariffs,quotas and other forms of industry assistance have been an integral part of Australia’smicroeconomic reform agenda. They have played a significant role in opening theAustralian economy to the disciplines of international competition. APEC’s movestoward free and open trade and investment in the Asia Pacific region, will complementAustralia’s new policy stance. The implementation of the Bogor resolution is alsolikely to have significant implications, over the period to 2010, for the assistancearrangements applying to Australia’s relatively highly assisted industries, such as TCFand PMV.
The changes to assistance arrangements outlined in this chapter can be expected tohave initiated substantial restructuring in the Australian economy. Undoubtedly thiswill involve some costs, but the expectation of the government is that the benefits ofthe reform process will substantially outweigh these costs. As highlighted in chapter 2,microeconomic reform is about much more than trade liberalisation and assistancereductions. The complex web of microeconomic reforms is likely to affect differentindustries in different ways. Focussing on the effects of individual reforms in thesecircumstances is likely to give rise to quite misleading assessments of the impact ofmicroeconomic reform in general. Two other key areas of the reform process infrastructure reform and industrial relations and work place reform are the subjectof the next two chapters.

BUREAU OF INDUSTRY ECONOMICS
40
4 Reforms to infrastructure andrelated industries
Since the mid to late 1980s, Australian governments have introduced a number ofreforms designed to improve the performance of infrastructure industries. Theperformance of these industries is recognised as having a significant influence on theinternational competitiveness of Australian firms.
Australia’s infrastructure industries have undergone a variety of reforms at the federal,state and local government level. It is beyond the scope of this study tocomprehensively document the full range of infrastructure reforms implemented bythe Commonwealth, state, territory and local governments. Instead we concentrate onthe various approaches to reform and the impact these reforms have had on dividendpayments to governments and the price and quality of infrastructure services.Operating efficiency measures are also important when assessing the impact ofreforms. However, in this report we focus on customer-oriented measures relevant tobusiness users. The BIE’s international benchmarking reports and the recent overviewreport (BIE 1995b) comprehensively discuss the operating efficiency of the variousinfrastructure industries.
In the first section of this chapter we look at the significance of infrastructureindustries in the economy. Section 4.2 briefly discusses the main drivers forinfrastructure reform in Australia. The various approaches to infrastructure reform areidentified in section 4.3, while section 4.4 looks at the impact of these reforms.Section 4.5 presents concluding comments.
4.1 Significance of infrastructure industries in theeconomy
Infrastructure and related industries are a significant part of the Australian economy(table 4.1). In 1993-94, they accounted for around 11 per cent of Australia’s grossdomestic product (GDP), or 17 per cent of the total production of service industries. Interms of employment, they employed well over half a million people, that is, around9.5 per cent of total services and 7.5 per cent of all sectors’ employment. The publicsector dominates the provision of infrastructure services contributing around85 per cent of the total. Total public and private investment in infrastructure servicesaccount for around 38 per cent of total investment by service industries (BIE 1994a).

BUREAU OF INDUSTRY ECONOMICS
REFORMS TO INFRASTRUCTURE AND RELATED INDUSTRIES 41
Table 4.1 Significance of infrastructure and other services in theAustralian economy, 1993-94
Industry Gross producta
($ billion)
Proportion of GDP
(per cent)
Personsemployed
(‘000)
Infrastructure services
Electricity 8.9 2.3
Gas 0.8 0.2
Water, sewerage and drainage 3.4 0.9 92.2 b
Rail transport 1.8 0.5
Water transport 1.8 0.5
Air and space transport 4.6 1.2
Road, other transport and services 11.3 2.9 366.4 c
Communication services 11.9 3.0 128.5
Total infrastructure services 44.6 11.4 587.1
Other services
Construction 26.4 6.7 559.6
Wholesale and retail trade 65.1 16.6 1 627.7
Accommodation and restaurants 7.1 1.8 347.4
Finance, property and business services 47.7 12.2 990.3
Government administration and defence 16.1 4.1 368.3
Education, health and communityservices
39.6 10.1 1 224.7
Other 14.5 3.7 469.3
Total services 261.1 66.6 6174.4
Mining 17.3 4.4 89.4
Manufacturing 61.4 15.6 1 082
Total all industries 392.0 100.0 7 755.1
Notes: aConstant 1989-90 prices. bPersons employed in electricity; gas and water; sewerage and drainageindustries. cPersons employed in rail transport; water transport, air and space transport; road, other transportand services industries.Sources : ABS (1995a, 1995b).
Although infrastructure services are, generally, not directly traded internationally, theycontribute to costs in all industries. They, consequently, influence the competitivenessof Australian firms and the productivity of the Australian economy. Costs ofinfrastructure services accrue in final products both directly and indirectly throughthe passing on of costs of infrastructure used in the production of intermediate inputs.Figure 4.1 shows the contribution of the direct and indirect costs of infrastructureservice inputs to final output costs in 1993-94. The contribution varies betweenindustries from around 7 to almost 27 per cent. Electricity, road transport and

42 MONITORING MICRO REFORM — SETTING THE SCENE
communications are the major infrastructure inputs used by all industry sectors(BIE 1994a).
Figure 4.1 Cost shares of infrastructure inputs to selected industries,1993-94
5 10 15 20 25 30%
Miscellaneous manufacturing
Transport equipment
Basic metal products
Petroleum and coal products
Paper, printing and publishing
Clothing and footwear
Beverages and tobacco
Milk and meat products
Agriculture
Machinery and equipment nec
Fabricated metal products
Non-metallic and mineral products
Chemicals
Wood and wood products
Textiles
Food processing nec
Mining
Source : COPS 1994.
The industries with the greatest input of infrastructure services are the mineralprocessing industries including basic metals and products (extraction of metalsfrom ores) and non-metallic mineral products (glass and clay manufactures).Petroleum and coal product industries are also large users of infrastructure services. Incontrast, agriculture has, on average, relatively low requirements for infrastructureinputs. However, many individual commodity groups within this broad industry groupare significant users of infrastructure inputs.
The provision of infrastructure in Australia has historically been dominated bygovernment owned and operated enterprises, commonly known as GBEs. Theperformance of these enterprises also affects government finances. If governments areto underwrite poor-performing or loss-making GBEs they need to either increase taxesor reduce spending in other areas. According to FitzGerald (1993, p. 33) theseenterprises have:
... traditionally been an absorber of national savings. However, recent initiatives, including thesale of some enterprises, are reducing the extent of this draining such that the sector is nowapproaching balance.
Many GBEs operate in industries with monopoly elements including regulatory andinstitutional barriers to competition. In many instances, the tendency to monopolyreflects the nature of the infrastructure network or scale economies associated withother aspects of service provision. A number of GBEs, or segments of GBEs, arenatural monopolies. A natural monopoly exists if a single firm, using cost minimising

BUREAU OF INDUSTRY ECONOMICS
REFORMS TO INFRASTRUCTURE AND RELATED INDUSTRIES 43
technology, can produce the industry’s total output cheaper than two or more firms. Inthe past, Australian governments, when faced with this situation, have generally optedfor public ownership. In other cases, monopoly status had been conferred bylegislation. In many instances, these government owned monopolies operated withsubsidies from general taxation revenue or were required to just recover operatingcosts.
Australian governments have often required infrastructure providers and other GBEsto supply services to certain sections of the community on a non-commercial basis.These services, commonly known as community service obligations (CSOs), relate togovernments’ broader policies or social goals. In order to meet CSO requirements,GBEs have often pursued inefficient pricing practices, such as cross-subsidisation.
The monopoly status granted to infrastructure providers, coupled with governmentownership and requirements to provide CSOs, has tended to substantially lessen theincentives for the sound commercial performance of GBEs in Australia. In the past,there has been little in the way of incentives for GBEs to minimise costs or earn acommercial rate of return.
4.2 Main drivers for infrastructure reformThe government’s decision in 1983 to deregulate the financial market, float theAustralian dollar and remove exchange rate controls increased Australia’s exposure tointernational pressures (chapter 2). Australia’s declining terms of trade in 1985-86,following a sharp fall in commodity prices, led the government to look for long-termsolutions to improve Australia’s international competitiveness. The Business Councilof Australia (BCA), discussing some of the reasons for Australia’s deteriorating tradeperformance during the 1980s stated that:
..... it is harder to compete successfully on world markets when, often, unnecessarily,Australian businesses have to pay uneconomic costs for some inputs (BCA 1990, p. 21).
In 1986, recognising that inefficient transport and handling industries were imposingunnecessary costs on exporting industries, the Prime Minister announced a number ofstudies into these industries. The results of the studies were to be assessed ‘todetermine whether any additional action can [could] be taken to remove impedimentsto trade’ (Hawke 1986).
In 1988, responding to continuing and widespread concerns about inefficiencies ininfrastructure industries, the Government forwarded a number of references to theIndustries Assistance Commission (IAC). Two key references covered inquiries intothose government (non-tax) charges which imposed the greatest obstacles tointernational competitiveness of Australian industry and the effects of domesticbarriers and impediments to international trade in services.

44 MONITORING MICRO REFORM — SETTING THE SCENE
These inquiries revealed widespread problems with the pricing and provision ofinfrastructure services. For example, the IAC’s report on government (non-tax)charges, found that the competitiveness of Australian businesses was being adverselyaffected by a number of inefficiencies across a range of public enterprises. The inquiryrevealed that the efficiency with which public enterprises produced and priced theiroutputs affected the competitiveness of Australian industry both directly through thecost of inputs and indirectly through competition for resources. The IAC also reportedthat the principal causes of poor performance by GBEs included: unclear andconflicting objectives, absence of competition and reliance on ineffective control andperformance monitoring mechanisms (IAC 1989, p. xvi-xviii).
The IAC’s inquiries into energy generation and distribution and rail transport alsofound that lack of competition in government provided infrastructure was a key sourceof inefficiency.
Other reviews came to similar conclusions. For example, the NSW Commission ofAudit (1988) found evidence of ‘massive operating inefficiencies’ in that state’sGBEs. They found that the Urban Transit Authority of NSW had costs per kilometrefor bus operations 50 per cent above benchmark levels. They also found that theMaritime Services Board was making a return on assets of less than 1 per cent(Domberger 1992). Similar reviews in a number of other states and territoriesidentified widespread performance weaknesses by their GBEs (EPAC 1990b). TheOECD also found that Australia’s performance in some public utilities fell well behindthe OECD average:
While open to large error, OECD comparison of productivity levels in the public utility sectorindicate that labour productivity in Australia is less than half the OECD average and capitalproductivity is a little more than half. Recent estimates of the transport sector suggest that thereare potential savings of 17 to 18 per cent of total business shipping and shore-based transportcosts, and the present airline policy is thought to have increased transport costs by 8 to 10 percent over comparable US airlines (OECD 1990, pp. 50-51).
As trade liberalisation exposed many industries to increased international competition,it became evident that inefficiently provided and priced infrastructure services wereadversely affecting the competitiveness of Australian industries. Trade liberalisationalso revealed the unbalanced nature of Australia’s reform process, non-tradedindustries, such as the infrastructure industries also needed attention. Australia’sgeographic isolation and the vast nature of the country, further reinforced theimportance of efficiently provided transport and communications facilities.
Budgetary concerns provided further pressure for infrastructure reform. Governmentsincreasingly became aware that public ownership and the prohibition of competitionfundamentally weakened the incentives for efficient provision of infrastructure.Further, inefficient infrastructure provision was imposing significant costs on theeconomy and pressure on government finances. Budgetary stress resulted ingovernments demanding better performance and greater returns from their public

BUREAU OF INDUSTRY ECONOMICS
REFORMS TO INFRASTRUCTURE AND RELATED INDUSTRIES 45
enterprises (see for example, NSW Commission of Audit (1988), Blandy and Walsh(1989) ).
By the late 1980s and early 1990s it became increasingly obvious that a nationalapproach, covering the different levels of government, was required if the full benefitsof infrastructure reform were to be achieved (see chapter 2). The Special PremiersConferences and later the Council of Australian Governments (COAG) have been theprincipal mechanisms by which this broader reform agenda has been progressed. Thesecond Special Premiers’ Conference in July 1991, for example, amongst other things,reached agreement on the establishment a National Grid Management Council tomanage eastern Australia’s electricity grid.
The establishment of the COAG in May 1992, was a significant step towardsfacilitating a national approach to microeconomic policies and reforms, particularlyinfrastructure reforms. COAG has become the main body for discussions betweenheads of government on issues of national importance. The introduction of a nationalcompetition policy has been a fundamental reform in this context. COAG plays acrucial role in establishing plans to facilitate national networks in Australia.
4.3 Approaches to infrastructure reformBudgetary stress as well as an increased understanding of the impact of poor GBEperformance on international competitiveness led governments to change the nature oftheir involvement with GBEs. Governments have pursued a variety of approaches toinfrastructure reform. Initially reforms were designed to overcome some specificproblem in a particular GBE or infrastructure industry. This approach has tended togive way to a more systematic approach to reform. Administrative reforms, includingstrategies such as commercialisation and corporatisation which aim to place GBEs ona more commercial footing, are common. Pricing reforms have also been pursued, butto a lesser extent. In recent years, governments have increasingly sought to lift theperformances of infrastructure industries by exposing them to greater competition.The agreement to implement national competition policy reforms represents anationally coordinated and wide-ranging application of this approach. Privatisations,involving the transfer of ownership to the private sector, have also been used.
All three levels of government in Australia have pursued reforms to infrastructureindustries and GBEs. The nature, extent and pace of the reforms have varied widelyacross jurisdictions, between infrastructure industries, as well as, between GBEswithin industries. Some common approaches to reform have, however, emerged.These approaches can be grouped under five main categories:
• reforms in response to specific problems;
• administrative reforms;

46 MONITORING MICRO REFORM — SETTING THE SCENE
• pricing reforms;
• reforms aimed at increasing competition; and
• privatisation.
In this section we discuss these five approaches to reform drawing on particularexamples to illustrate the types of changes that have been implemented.
4.3.1 Reforms in response to specific problems
Governments in Australia have, in some instances, pursued reforms in response tospecific problems, such as loss making activities, low productivity, overmanning, etc.These reforms generally involve one-off improvements in productivity. However, theydo not necessarily result in changes which will automatically lead to on-goingincreases in efficiency or even the maintenance of initial improvements. Examples ofthese types of reforms include:
• efficiency drives within an industry or enterprise;
• the closing of uneconomic services; and
• the reduction of staffing levels.
This approach often treats symptoms rather than the primary causes of poorperformance. A common feature of this approach is that, while it has the potential toincrease efficiency, it does not fundamentally change the underlying incentivestructure and so does not provide continued pressure for improvement.
Forsyth (1992, p. 12) has termed reforms of this type ‘non-structural’. He states thatthis type of reform has a tendency not be long lasting and that areas reformed over twodecades ago are again prime candidates for reform. While there are some importantexceptions, governments have tended to shift away from these piecemeal approachesto those which seek to attack the real underlying problems.
Some aspects of the reforms to Australia’s maritime industries are an example of thistype of reform. In 1989, the Commonwealth Government initiated a three-yearprogram of reform to the waterfront industry to improve its efficiency. This programincluded initiatives which might be termed ‘non-structural’. For example, redundancyand retirement packages were offered to reduce stevedoring labour levels. The reformprogram, also contained ‘structural’ elements, such as the replacement of the pooledemployment system with company based employment. The reforms did not, however,directly address the absence of a link between pay and labour productivity. The BTCEin its 1995 review of waterfront industry reform noted that while there have beenmany positive aspects to labour reform on the waterfront in terms of productivity,attitude, conditions and safety, negatives exist. These included:
• in some ports idle time is still too high and use of casual (supplementary) labour is too low;
BUREAU OF INDUSTRY ECONOMICS
REFORMS TO INFRASTRUCTURE AND RELATED INDUSTRIES 47
• the present generous shift and overtime allowances greatly reduce the effectiveness ofpresent incentive schemes (BTCE 1995a, p. 46).
The BIE’s recent international benchmarking report on the waterfront found, that sincelate 1993, there was evidence of backsliding in Australia’s performance in some areasof this industry (BIE 1995c). There has, however, been some improvement in theSeptember 1995 quarter (appendix 2).
4.3.2 Administrative reforms
Administrative reform aims to achieve performance improvements without changingownership or the market environment. Underlying this approach is a judgement thatcontinued public production of particular goods and services is appropriate. The aimof administrative reform is to create a more commercial environment for GBEs.
Some of the administrative reforms pursued by governments in Australia includecommercialisation, corporatisation, and the use of benchmarking and performancemonitoring.
Commercialisation and corporatisation
Commercialisation involves reforming administrative procedures within a GBE. It caninvolve: better specification of objectives; preparation of business plans; introductionof financial targets (eg rate of return) and non-financial targets (eg service quality,productivity); reduced government involvement in day-to-day decisions; upgradingaccount keeping methods to full accrual accounting; and improved reportingrequirements. It normally does not involve the appointment of a commercial board orthe application of commercial disciplines faced by private corporations (e.gcorporation law, Trade Practices Act, etc).
Corporatisation aims to replicate, more formally, many of the commercial and marketdisciplines faced by private firms, while retaining government ownership. The keyelements of corporatisation include: the removal of factors that advantage ordisadvantage GBEs compared with private sector companies; the separation of GBEsfrom the direct arm of government, including the removal of government day-to-daycontrol over operational aspects of the enterprise; and the appointment of anindependent board. The relationship between the GBE and government becomes oneof a commercial board and a dominant shareholder. Legislation clearly specifies thepowers and responsibilities of both parties. The board is usually held accountable forthe performance of the enterprise by reference to financial benchmarks commonlyused to assess the performance of private businesses, such as rates of return anddividend payments. Commercial disciplines are introduced either directly, or vialegislation that attempts to mirror relevant arrangements for private enterprises.
Commercialisation and corporatisation have been the most widely adopted approachesto infrastructure reform in Australia. In practice there is often little to differentiate one

48 MONITORING MICRO REFORM — SETTING THE SCENE
approach from the other and individual governments may not apply all the elements ofeach approach as described above. The timing, pace and rigour of these reforms alsovaries between governments. Examples of such reforms can be found in the electricityand gas industries, where many of the states have commercialised or corporatised theirutilities. State governments have also moved to corporatise their port authorities andmany of the state rail authorities have been given a more commercial focus.
Benchmarking and performance monitoring
A major part of the process of infrastructure reform has involved putting in placeincentives and monitoring mechanisms to assess the performance of GBEs.Mechanisms that monitor GBE performance need to accompany reforms which giveGBEs increased management responsibility and autonomy. In the absence ofcompetitive disciplines, performance monitoring is necessary to ensure that GBEs arenot abusing their market power by charging monopoly prices, restricting output orreducing the quality of their services.
Performance monitoring involves assessing the performance of GBEs against a rangeof both financial and non-financial targets and comparing them against their domesticand international counterparts. It also provides governments with a tool for promotingyardstick competition. Performance monitoring acts as a driver for further reform. Itprovides benchmarks which encourage the adoption of best practice techniques.
A key example of performance monitoring is the work being undertaken by the BIEon international performance benchmarking of business input services. The BIE’swork was commissioned by the federal government in 1991. It looks at theperformance of Australia’s infrastructure service industries from the perspective of thebusiness customer (e.g price and quality of service) as well as the service provider (e.goperating efficiency and productivity) relative to their international counterparts.Evidence of significant performance gaps relative to other countries makes it criticalthat performance monitoring is carried out relative to international best practice.Simply comparing performance domestically is not good enough. Internationalperformance monitoring keeps the focus on matching the performance of ourcompetitors and provides a means for assessing the impact infrastructure services arehaving on the competitiveness of user industries. Further, it provides an impetus forreform efforts directed at closing performance gaps.
In recognition of its value, the federal government in Working Nation (Keating 1994a)extended and broadened the BIE’s benchmarking work. Coverage of the BIE’sinfrastructure studies was expanded to include: water and core government servicesdirectly used by business. These services include workforce training, taxadministration, the customs service, quarantine, health and safety inspection systems,environmental regulations and corporate governance. The overall benchmarkingproject was extended through to June 1999 (Cook 1994).

BUREAU OF INDUSTRY ECONOMICS
REFORMS TO INFRASTRUCTURE AND RELATED INDUSTRIES 49
Many GBEs have also adopted benchmarking as a useful management tool followingthe impetus given by the work undertaken by the BIE. State governments also monitortheir GBEs as part of the commercialisation and corporatisation process. The NewSouth Wales government, for example, has published annual performance indicatorson a comparable basis for its major GBEs since 1989-90.
The Steering Committee on National Performance Monitoring of Government TradingEnterprises (SCNPMGTE) supplements the international benchmarking workundertaken by the BIE. The committee undertakes national performance monitoringand, since 1993, publishes annual details of the performance of GBEs in Australia.The focus of the SCNPMGTE benchmarking work is on time series analysis,involving comparisons of accounting, economic and non-financial measures ofperformance for GBEs operating in similar activities in different states or territories ofAustralia. Unlike the BIE’s work, the focus is a domestic one, essentially from theperspective of the owner of the GBEs the government.
4.3.3 Pricing reforms
The adoption of efficient pricing should be a central feature of infrastructure reform.However, the move to adopt more efficient infrastructure prices has been slow,compared to the pace of other infrastructure reforms (BIE 1995d). Although someprogress has been made in a number of areas of pricing reform, there are many keyareas which remain to be tackled (see appendix 2).
The relatively narrow tax bases available to states and territories can act as animpediment to pricing reform. Governments may resist moves towards charging priceswhich fully reflect productivity gains as this restricts their ability to use infrastructurecharges to raise revenue. For the same reason, governments’ may also avoid adoptingtransparent regulatory regimes which limit monopoly pricing. Business users haveexpressed some concern that, to date, a disproportionate share of productivity gainsfrom reform have been captured by governments, in the form of dividend paymentsrather than greater reductions in prices (Larkin and Dwyer 1995). Section 4.4.1discusses infrastructure dividends in more detail.
Pricing reforms will improve the way in which resources are used. They involvemoves towards ensuring that prices for infrastructure services more closely reflecttheir efficient cost of supply. For example, a number of water utilities throughoutAustralia have, in recent years, pursued pricing reforms which are moving pricescloser to the user-pays philosophy. These reforms have seen a reduction in reliance oncharges based on property values that have very little relationship to the amount ofwater used or the cost of its provision. In Victoria, for example, the adoption of a user-pays system has seen service provision charges based less on property values andmore on water usage.

50 MONITORING MICRO REFORM — SETTING THE SCENE
Pricing reforms aimed at achieving more efficient prices can delay the need for costlynew investment to expand existing capacity. In some cases, this may necessitate priceincreases to promote efficient investment decisions and patterns of usage. Forexample, the user-pays system adopted by the Hunter Water Board in 1982 resulted inmuch slower growth in the demand for water. The board’s next major dam, originallyplanned for 1985, has been deferred by more than thirty years (Broad 1991).
A central issue of pricing reform is the need to remove cross-subsidisation associatedwith funding community service obligations (CSOs). These cross-subsidies penalisesome users (commonly industrial and commercial users) relative to others. This formof cross-subsidisation can distort decisions to consume, produce and invest. If GBEsare to be placed on a more commercial footing, the identification and isolation ofCSOs becomes integral to achieving more efficient pricing structures. Pricing reformswill generally require that any CSOs are fully identified and costed. In some instances,governments decide to remove the CSO and its associated subsidy once it is madetransparent and its costs clarified. In other cases, governments elect for theircontinuation. There are a number of options for funding CSOs including explicitfunding through direct subsidies provided by governments. A discussion of theimplications of alternative funding methods for CSOs is presented in BIE (1995d).
An examination of infrastructure pricing shows that in some areas cross subsidies arebeing reduced. However, there is considerable evidence that much more needs to bedone in this area (see appendix 2).
Both New South Wales and Victoria have recently published policy statementsrelating to CSOs. In 1994, the New South Wales Government issued A SocialProgram Policy for NSW Government Trading Enterprises. The program sets downpolicy guidelines which will result in the effective separation of commercial and non-commercial activities of GBEs (NSW Government 1994). Under the newarrangements, CSOs are formally contracted between the GBE and the relevantministers. The policy provides for GBEs to identify and cost CSOs which will then befunded through the budget. All social programs in New South Wales are to be fundedfrom the budget within 2 to 3 years. The Victorian Government also announced itsCSO policy in 1994 (Office of State Owned Enterprises 1994). The policy aims toidentify and make accountable social and community programs undertaken by thestate’s GBEs.
In some instances, reforms aimed at encouraging GBEs to adopt a commercial focushave intensified pressures on enterprises to exploit their monopoly power by chargingrelatively high prices for their services. Some governments have established formalarrangements for monitoring and regulating GBE prices to help address this problem.For example, some Commonwealth-owned monopolies are subject to pricessurveillance by the Prices Surveillance Authority (PSA), while Austel is currentlyresponsible for administering price control arrangements applying to Telstra. TheAustralian Competition and Consumer Commission took over this surveillance role in

BUREAU OF INDUSTRY ECONOMICS
REFORMS TO INFRASTRUCTURE AND RELATED INDUSTRIES 51
November 1995. Some state governments have also introduced varying forms ofprices oversight or regulation. For example, the New South Wales Governmentestablished a Government Pricing Tribunal to review and determine maximum pricesfor the states’ GBEs. The Victorian Government has established the Office of theRegulator-General to perform the function of an economic regulator for nominatedindustries. These regulatory authorities may provide some discipline on monopolypricing. However, it is less clear that their policies, which often lack transparency, willlead to a set of efficient price structures or encourage GBEs to pursue efficientpractices (BIE 1995d).
Reforms aimed at moving GBEs towards cost recovery and removing of cross-subsidies, should provide an environment which will encourage more appropriatepricing policies. However, where possible, governments should introducecomplementary reforms designed to increase competition, such as removing barriersto entry, allowing access to essential facilities and vertical separation. Such reformswill help produce pricing structures which reflect efficient, rather than inflated costs ofsupply.
4.3.4 Reforms aimed at increasing competition
The focus of infrastructure reforms has increasingly turned towards promoting greatercompetition. Governments in Australia now widely recognise the benefits ofpromoting competition in the area of infrastructure. The key approaches to introducingor increasing competition include:• removing regulatory barriers to entry;• splitting GBEs into competing units;• allowing third party access to essential facilities;• integrating networks; and• contracting out through competitive tendering.
These approaches to increasing competition are discussed below.
Removing regulatory barriers to entry
One of the greatest impediments to effective competition in the provision ofinfrastructure services has been government imposed restrictions on market entry.Australian governments in the past have created separate statutory monopolies toprovide telecommunications, postal, water, rail, electricity and gas services. In recentyears, governments have started removing statutory monopoly provisions that restrictcompetition in some areas. For instance, in several telecommunications and postalmarkets statutory monopoly rights have been removed and competition has beenintroduced. Other examples include the Commonwealth’s decision to terminate the

52 MONITORING MICRO REFORM — SETTING THE SCENE
two-airline agreement and the decision of a number of state governments to remove orsubstantially modify regulations requiring certain goods to be transported by rail.
More recently, as part of COAG’s national competition policy, Commonwealth, stateand territory governments have agreed to develop a schedule for reviewing existinganti-competitive laws and regulations that restrict competition. The agreement requiresgovernments to amend all existing legislation which restricts competition by 2000.
Removing regulatory barriers to entry, however, may not always be sufficient topromote competition in an industry. In the case where a GBE is a natural monopoly(ie characterised by large sunk costs and significant economies of scale and scope)competitors are unlikely to enter the market. Also, if a GBE is vertically integrated,that is, owning and operating all elements of the production chain, it may restrictcompetition by charging higher than normal prices for competitors to access anessential facility (such as a transmission grid or railway track network.). This situationcan be improved by splitting GBEs into competing units and developing transparentaccess regimes. Such regimes should require charges to be based on efficient costs ofsupply rather than ‘padded’ charges and/or uncommercial restrictions on operatingflexibility. Reforms to overcome such impediments to competition are discussedbelow.
Splitting GBEs into competing units
Governments in Australia are currently splitting some monopoly GBEs along threelines.
The first approach involves separating regulatory responsibilities from the GBEs’commercial operations. The transfer of Telecom’s technical responsibilities to Austelprovides an example of this type of reform. Prior to 1989 Telecom (Telstra) wasresponsible for equipment and cabling specifications. The monopoly carrier restrictedthe scope for competition by only permitting its employees to install approvedequipment and cabling for customer premises and network services. The reformsremoved the technical responsibilities from Telecom and allowed new entrants to themarket for attaching equipment to existing networks.
The second approach involves forming potentially competitive functions within aGBE into a number of independent businesses. For example, in Western Australia, thegovernment has sought to introduce competition between electricity and gas bycreating two new corporate entities to replace the State Energy Commission ofWestern Australia. The publicly owned Alinta Gas Corporation now operates theWestern Australian gas transmission and distribution systems, while Western PowerCorporation has assumed responsibility for the state's electricity system.
The third approach involves introducing competition by separating out naturalmonopoly segments of industries from potentially competitive activities. Natural gasin Victoria is a good example. The gas reform program initiated by the Victorian

BUREAU OF INDUSTRY ECONOMICS
REFORMS TO INFRASTRUCTURE AND RELATED INDUSTRIES 53
government involves separating the Gas and Fuel Corporation of Victoria (GFCV) a previously vertically integrated monopoly across transmission and distribution into separate transmission (Gas Transmission Corporation) and distribution (Gascor)businesses.
Allowing access to essential facilities
Governments seeking to promote competition in infrastructure and related industrieshave recently given special attention to essential facility elements of infrastructurenetworks (e.g. gas and water pipelines, electricity transmission grids andtelecommunications networks). Essential facilities exhibit natural monopolycharacteristics. By allowing other operators to access an essential facility, the prospectof ‘uneconomic’ duplication of the network is reduced. Access to such facilities can,at the same time, promote competition in the provision of services reliant on using thenetwork. For instance, the Australian Telecommunications Act creates a right for acarrier to connect its facilities to the network of any other carrier and to have its callscarried over the network. As part of the new national competition policy, a new accessregime for certain infrastructure facilities commenced in November 1995.
Integrating networks
Recent inter-governmental initiatives have made moves towards establishingframeworks to integrate certain infrastructure networks. Examples of recent inter-governmental initiatives aimed at helping to integrate state and territory networksinclude:• the development of arrangements for the management of water resources across
jurisdictions;• the integration of state rail networks, the establishment of the National Rail
Corporation and the proposal to establish Track Australia as a national authority tomanage access to the inter-state rail network;
• the agreement to remove restrictions on inter-state trade in natural gas; and• the move towards integrating some state electricity networks with the aim of
forming an electricity market for south east Australia.
The benefits from such initiatives have been extensively canvassed for several years ormore. The integration of traditionally separate networks encourages competitionbetween GBEs within and across jurisdictions, by allowing users to choose betweeninfrastructure providers on the basis of least-cost sources of supply. Infrastructureproviders must also compete on the basis of efficient costs of supply to provide newcapacity.
To date, progress in advancing the development and operation of such networkswithin Australia has been relatively slow. In part, this undoubtedly reflects thechallenges of agreeing on appropriate frameworks and operating mechanisms.

54 MONITORING MICRO REFORM — SETTING THE SCENE
However, it also reflects in part the practical difficulties of dealing with inter-government rivalries and coming to grips with the associated competitive disciplines.The new national competition policy may help in this regard.
Contracting out through competitive tendering
Contracting out involves using a competitive tendering process to choose the mostappropriate supplier. The main aim of this type of reform is to achieve savings relatedto differences in the operating efficiency of potential suppliers. A number of studiesindicate that the use of contracting out can result in cost savings in the order of 20 percent. In some instances it can result in even higher cost savings. For example, thecompetitive tendering of cleaning services in Sydney hospitals has resulted in savingsof almost 30 per cent (Hilmer 1993a p. 194).
Moves to place GBEs on a more commercial footing have encouraged the use ofcontracting out. In these circumstances, in-house services have to demonstratesuperiority over external contractors for the service to remain in-house. For example,the Melbourne Water Corporation contracts out many activities including repairs andmaintenance, meter reading and inspections all of which were previously performedin-house.
Infrastructure providers, in some instances, have also contracted out the provision ofsubsidised services to improve their operating efficiencies. For example, the NewSouth Wales State Rail Authority contracts out coach services for country passengers.
Capturing the potential benefits from competitive tendering requires a disciplinedapproach to the process. It is heavily reliant on being able to effectively specify therequired services, efficiently assess competing bids relative to the alternative of in-house supply and monitoring delivery against contract requirements. In this context, itis important to fully account for the direct as well as the indirect costs in assessingpotential savings.
4.3.5 Privatisation
Privatisation involves the transfer of ownership from the public to the private sector.Privatisation can be complete or partial with government retaining some ownershiprights and management control. Typically, a privatised GBE becomes exposed tonormal commercial disciplines (e.g. conduct regulation such as the Trade PracticesAct and Corporations Law, accounting conventions, taxation requirements, etc.) andmarket disciplines such as the threat of takeover, bankruptcy, the profit motive andsharemarket monitoring.
Privatisation, as an approach to reform, is based on the belief that economicperformance will be improved by private rather than public ownership. This in turn isbased on the fact that privately owned enterprises are subject to disciplines that cannot

BUREAU OF INDUSTRY ECONOMICS
REFORMS TO INFRASTRUCTURE AND RELATED INDUSTRIES 55
apply to even fully corporatised public enterprises. Evidence from a number of studiesof the comparative performance of public and private enterprises suggests that wherethere is effective competition, private enterprises operate more efficiently. However,in situations where market power may be exercised, the results are inconclusive (for amore detailed discussion of these studies see IAC 1989). This implies that thepotential efficiency gains from transfer of ownership are likely to be seriously erodedif the GBE is transferred with existing market power.
Budgetary considerations may affect privatisation programs. For example, there maybe some conflict for governments between maximising their return by selling a GBEas a monopolist and allowing competition in the market. This is because the revenuefrom the sale of a GBE with restrictions on competition will be greater than from aGBE operating in a competitive market.
According to Larkin and Dwyer (1995, p. 62), privatisation of GBEs could also belocking in inappropriately high prices for infrastructure services:
Because infrastructure assets are seldom traded undertakings with large past investments, andbecause monopoly components will still remain under State or Commonwealth ownership, it isrelatively easy to determine a value of the cost of assets which justifies the pricing policydesigned to produce an ‘acceptable’ return. For example, the Victorian Regulator General isbound to have regard to the prices paid by new entrants into the industry for their utility assets.Thus there can emerge a chicken and egg situation whereby the more a bidder pays for afranchise licence, the greater the asset base which can be used to justify a pricing policynecessary to secure a return. Under such a scenario, governments could be said to be essentiallyselling monopoly rights to tax business and household consumers up to a point.
Until recently, moves towards privatisation in Australia have been relatively limited.The Commonwealth government has privatised some GBEs under its control, forexample, Qantas and the Moomba-Sydney Pipeline, and partially privatised others, forexample, the Commonwealth Bank. State governments to varying extents have alsoprivatised some of their GBEs. For example, the South Australian Government sold itsmajority shareholding in SAGASCO Holdings, the state’s gas utility in 1993. TheVictorian Government has sold a number of the state’s electricity businesses and is inthe process of organising an extensive privatisation program.
4.4 Impact of infrastructure reformWhile the motivations for infrastructure reform have varied, two stand out. First,reforms aim to improve the competitiveness of firms using infrastructure services.Second, reforms aim to reduce the budgetary stress that poorly performing GBEsplace on government finances. This section briefly examines recent trends in GBEs’dividend payments to their owner governments. It also examines changes in the pricesand quality of infrastructure services since the introduction of infrastructure reform.

56 MONITORING MICRO REFORM — SETTING THE SCENE
4.4.1 Dividend payments
Infrastructure reform in Australia has seen the performance of GBEs improve sincethe mid to late 1980s. However, performance has varied significantly betweenindustries and even between GBEs within industries (BIE 1994a, 1995b). Improvedperformance of GBEs is partly reflected in an overall increase in profitability of GBEsand an increase in dividend payments made to governments.
In aggregate, real dividend payments by GBEs have increased over the last sevenyears. The SCNPMGTE reported that dividends for the 59 GBEs it monitors morethan tripled between 1987-88 to 1993-94. Dividend payments to governmentsincreased in real terms (1987-88 dollars) from around $0.6 billion in 1987-88 to$2.2 billion in 1993-94 (figure 4.2).
The main contributors to this increase were the major Commonwealth GBEs (mainlyTelstra) and the electricity supply industry which is principally owned by stategovernments. Dividend payments by other state-owned enterprises such as gas andwater utilities and port authorities have also grown considerably although these stillcomprise a relatively small proportion of the total. Rail and urban transport make nocontribution to dividend payments and still require substantial subsidisation bygovernments.
The marked increase in real dividends paid by some GBEs is, in part, an outcome ofgovernments encouraging GBEs to act commercially. However, some commentatorshave expressed concerns regarding the size of some dividend payments togovernments. The largest increases in dividends have been evident for GBEs with thegreatest market power (Clare and Johnston 1993). Specific examples of dividendpayments by GBEs that exceed profits have also been cited in support of concernsabout overpricing. For instance, in 1987–88, 1990–91 and 1992–93 the Gas and FuelCorporation paid in excess of 100 per cent of their profit in dividends to the VictorianGovernment (SCNPMGTE 1995, p. 121).
While dividend payments have increased significantly, average real prices charged byGBEs have declined over the period (see Figure 4.3 below). This suggests that whilegovernments have required some GBEs to make increased dividend payments, theyhave not, in the main, been funded by increased prices. However, even where priceshave fallen, questions remain as to whether GBEs are producing efficiently andwhether price reductions have been as large as they could have been. Businessinterests, for example, have contrasted the significant productivity improvementsreported for GBEs with the relatively small declines in prices of their goods andservices. They have concluded that the lion’s share of productivity gains has not beenpassed on. Nevertheless, it should be recognised that it is entirely appropriate forGBEs to earn a commercial rate of return on their assets.

BUREAU OF INDUSTRY ECONOMICS
REFORMS TO INFRASTRUCTURE AND RELATED INDUSTRIES 57
Figure 4.2 GBEs real dividend payments to governments, 1987-88 to1993-94
1987
-88
dolla
rs ($
mill
)
87-88 88-89 89-90 90-91 91-92 92-93 93-940
200400
600
800
10001200
1400
1600
18002000
2200
2400
Source : SCNPMGTE 1994, 1995.
The relatively narrow tax bases available to states and territories coupled with theirsubstantial expenditure responsibilities can make their better performing GBEsparticularly attractive investments. This imbalance can create resistance to exposingGBE infrastructure providers to competition. It also increases the incentive forgovernments to use some infrastructure charges to raise revenue. This is compoundedby the nature of demand for infrastructure services. Generally, the demand forinfrastructure services is less responsive to price increases than the demand for lessessential and ‘luxury’ goods and services. These demand characteristics can temptgovernments, as infrastructure owners, to overprice without incurring a more thanproportional decrease in revenue. The lack of competition for many GBE-providedinfrastructure services has prevented consumers from switching to alternativesuppliers (BIE 1995d). Reforms such as those designed to break GBEs into competingunits and the introduction of third party access regimes should help reduce incentivesto price excessively.
State and territory governments may also view infrastructure pricing (e.g. of electricityand water services) as one of the few broadly based revenue raising instruments attheir disposal. As they are broadly based, the direct costs of raising revenue viainflated infrastructure prices can be spread widely across many users. While usinginfrastructure prices to raise revenue can be distortionary, the alternative —manipulating the existing narrow tax base — may be more inefficient. Broadeningstate and territory tax bases may reduce pressures to price infrastructure services toachieve fiscal goals. However, past High Court decisions have restricted the ability ofindividual state and territory governments to broaden their tax bases (BIE 1995d).

58 MONITORING MICRO REFORM — SETTING THE SCENE
A recent study undertaken for the BCA expressed a number of concerns about thetendency for dividends paid by GBEs to emerge as a new form of indirect taxation. Tothe extent that these dividends include such a tax element they are likely to adverselyimpact on international competitiveness. Amongst other things, the study observedthat:
Unlike indirect taxes, user charges cannot be rebated for exporters without breaching the GATTsubsidy code. Exporters would be better off if Treasuries raised revenue via explicit indirecttaxation which could be rebated, instead of disguised indirect taxation through user chargeswhich cannot be rebated. Given that most countries rebate their indirect taxes through VATrefund arrangements, it is a real concern if Australia adopts infrastructure pricing policieswhich undermine export competitiveness (Larkin and Dwyer 1995, p. 61).
Competition policy and related reforms applying to the provision of infrastructureservices are conducive to more efficient infrastructure pricing and, consequently, tocommercially justifiable dividends. The April 1995 COAG agreement on a nationalcompetition policy (see chapter 2), for example, should ensure scrutiny of proposals toshelter infrastructure providers from competitive pressures. However, while theCommonwealth, states and territories have reached agreement on the distribution ofthe benefits of the COAG reforms, the majority of the reforms are yet to occur.Indeed, it will be many years before the benefits of reform are realised, although someof the associated costs will accrue much earlier. It is therefore important that thereform process is closely monitored to ensure that benefits are actually delivered (BIE1995d).
4.4.2 Prices and quality of infrastructure services
During much of the 1980s, prices of many infrastructure services rose or remainedfairly constant in real terms. Postal and gas charges, for example, rose largely in linewith the consumer price index. However, electricity prices and urban transport chargesincreased at a faster rate than inflation. Telephone charges were the exception,increasing at a rate significantly below the rate of inflation (IAC 1989). With theintroduction of infrastructure reforms, the real prices for many infrastructure serviceshave declined. Aggregate GBE prices have fallen in real terms by around 10 per centbetween 1987-88 and 1993-94 (see figure 4.3).
The overall pattern of declining real prices, however, masks some wide variationswithin and across industries. Appendix 2 examines how the prices and the quality ofservice in individual areas of infrastructure has changed in recent years. Australia’sperformance, compared with world best practice, is also examined. The infrastructureindustries covered include: electricity, natural gas, water, telecommunications,waterfront, coastal shipping, aviation, rail and road freight.
In some industries, the reform process has been successful in reducing real prices. Forexample, aviation reform has led to real domestic airfares falling by more than 10 percent. Reforms underway in the electricity generation, transmission and distribution

BUREAU OF INDUSTRY ECONOMICS
REFORMS TO INFRASTRUCTURE AND RELATED INDUSTRIES 59
sector also appear to have provided real benefits (in the form of lower prices) toindustry. In other instances, the reform process has induced real price increases. In thewater industry, for example, reforms aimed at more closely aligning prices with thecost of supply have resulted in real price increases. Pricing reforms aimed at reducingcross-subsidies have also seen prices for some customer classes increase. Overall,reductions in non-commercial cross subsidies have seen residential or domestic userspay relatively more while business users have generally gained. However, there isevidence that much more can be achieved in this area (for example, see electricitydiscussion in appendix 2).
Figure 4.3 Real aggregate GBE prices, 1987-88 to 1993-94
84
86
88
90
92
94
96
98
100
87-88 88-89 89-90 90-91 91-92 92-93 93-94
Inde
x (1
987-
88=1
00)
Source : SCNPMGTE 1994, 1995.
There is also evidence that the quality of service of some infrastructure industries hasimproved in recent years. For example, the BIE (1995e) found that there has beensome improvement in the reliability of the telecommunications network since theintroduction of competition.
In a number of areas (e.g. waterfront charges for coal handling and road freight rates)Australia’s prices are at or near world best practice. Despite the evidence of somesuccess, the BIE's international benchmarking work suggests, for many infrastructureservices, more is required. As noted in the BIE’s most recent overview of theperformance of Australia’s infrastructure industries, large differences between manyof our infrastructure prices and the cheapest prices internationally continue to beobserved (BIE 1995b). A similar story emerges for quality of service indicators.Despite the evidence of improvements in some areas, there continues to remain asignificant gap between Australia’s performance and achievable world best practice inmany areas (see appendix 2).

60 MONITORING MICRO REFORM — SETTING THE SCENE
Unfortunately, for some infrastructure industries, the ‘success’ of some reforms hasbeen short lived. Waterfront reforms appear to fall into this category. The BIE hasfound that Australia’s performance on the waterfront in the recent past is mixed and,in some instances, backsliding is apparent (see appendix 2 and BIE 1995c). This resultis despite the high priority and substantial funds assigned waterfront reform byAustralian governments.
Aviation may be another area where the reform process has delivered benefits toindustry and then seen a deterioration in some aspects of service quality. Domesticairfares have declined substantially since the removal of the two airline policy and theintroduction of competition (see appendix 2). Nevertheless, to some extent these costsavings can be offset by the costs associated with waiting at airports for delayedflights. The BIE’s latest examination of Australia’s aviation performance (BIE 1994d)suggested that Australia’s performance had improved on earlier years, in terms ofprice and flights arriving and departing on time. There is, however, evidence tosuggest that performance in this sector then regressed for a period (appendix 2). TheBIE plans to update its international benchmarking work on aviation in 1997-98.
4.5 Concluding commentsInfrastructure and related industries are a significant part of the Australian economy.Their performance has significant implications for the economy as a whole. The costsand quality of infrastructure services, in part, determine the competitiveness ofAustralian business. It is therefore essential that infrastructure services are priced anddelivered as efficiently as possible.
In the mid to late 1980s there was widespread evidence of large performance gaps inthese industries and recognition of the need for reform. This need was made moreurgent by other micro-economic reforms which were opening the economy up tointernational competition.
Governments at all levels in Australia have made progress in improving theperformance of their infrastructure industries and GBEs since the late 1980s.However, the nature, extent, pace and success of these reforms have varied widelyacross governments and between sectors and GBEs.
Infrastructure reform has lifted the performance of GBEs, in some cases significantly.Overall real prices for services provided by these GBEs have fallen, and dividendpayments to governments have increased. However, the performance of GBEs hasvaried between industries and between GBEs within industries. In some instances, thereform process has been successful in reducing prices and improving quality ofinfrastructure services. Electricity and telecommunications fall into this category. Inother cases, for example water, infrastructure prices have increased, reflecting thereform process and the reduction of non-commercial cross subsidies. In other

BUREAU OF INDUSTRY ECONOMICS
REFORMS TO INFRASTRUCTURE AND RELATED INDUSTRIES 61
instances, the impact of the reform process has been positive but, appears to be shortlived, with some aspects of performance improving for a time before sliding back.Some elements of the waterfront appear to fall into this category.
The experience so far suggests that reform of infrastructure is a complicated process.In some cases, it involves the letting loose of potential monopolies. If not adequatelycontrolled, this can lead to infrastructure owners reaping all the benefits of reform asmonopoly dividends. The incentive for infrastructure owners to monopoly price can beeven more of a concern if the owners, in many cases state governments, have limitedalternative avenues to raise revenue.
In some cases infrastructure reforms may not go far enough. Reforms can sometimesfocus on the symptoms rather than the real problem. There is the real prospect ofbacksliding if reforms fail to create the incentives for continuous improvement in costefficiency and service provision.
While there is evidence of significant improvements in the performance of GBEs,much remains to be done. The BIE’s international benchmarking work has revealedthat in many infrastructure industries Australia is performing well below achievableinternational best practice. And, although prices in many of Australia’s infrastructureindustries have been falling in recent years, prices elsewhere in world have also beendeclining in some cases at a faster rate. Moreover, our record in lifting the qualityof infrastructure service, relative to achievable world best practice, has also beenmixed.
As the costs and quality of infrastructure services impact on the competitiveness ofAustralian industry, it is essential that the momentum towards efficient pricing anddelivery is maintained. Vigorous implementation of the National Competition Policywill be important in achieving that aim.

BUREAU OF INDUSTRY ECONOMICS
62
5 Industrial relations and workplacereform
Centralised institutional arrangements have traditionally exerted a significantinfluence over how Australian firms manage the pay and conditions of theirworkforce. By the mid 1980s this centralised award-based approach came increasinglyinto question. At that time, Australia’s challenge to improve its internationalcompetitiveness acquired new urgency. This gave momentum to a push for greater andfaster change throughout the domestic economy, including the labour market (seechapter 2). This reflected a recognition that:
The labour market directly or indirectly affects all other parts of the economy. It is therefore atthe centre of the microeconomic reform debate (Borland et al 1992, p. 122).
Growing interest in labour market reform was also fuelled by inter-dependenciesbetween different elements of microeconomic reform. As discussed in chapter 3,historically there has been a connection between Australia’s tariff system and ourapproach to wage fixation. The process of trade liberalisation during the 1980sstimulated debate about the need for a more market oriented industrial relations andworkplace environment.
Governments, industry groups and unions, to varying degrees, differed in theirproposals for reform. However, there was general agreement that any newarrangements should facilitate more flexible outcomes that is arrangements shouldbe less centralised and more work place relevant. This recognition led to greaterscrutiny of the institutionalised industrial relations process. The search for better waysof working has been an iterative process of experimentation, evaluation and furtherreform. Inevitably the pace of reform has not been acceptable to all too far reachingfor some, entirely appropriate for others, while some others consider it far too slow.
In this chapter we survey the main reforms affecting how firms use their humanresources. Section 5.1 provides a brief background to Australia’s industrial relationssystem. Section 5.2 examines some of the more significant federal reforms to thelabour market and notes some substantial differences in the approaches' states havetaken to industrial relations. It also includes a comment on issues relating to the futuredevelopment of the industrial relations system. Section 5.3 reviews some of thereforms to training and employment programs (particularly those contained in theCommonwealth Government’s 1994 Working Nation statement). In section 5.4 wediscuss some of the reforms aimed at lifting business management to best practicestandards. A concluding comment is presented in section 5.5.

BUREAU OF INDUSTRY ECONOMICS
INDUSTRIAL RELATIONS AND WORKPLACE REFORM 63
5.1 Australia’s industrial relations systemThe Constitution sets out the basic framework for much of Australia’s industrialrelations system. It gives the Commonwealth Government powers to legislate for theprevention and settlement of industrial disputes that extend beyond the borders of onestate. The formal system, historically, has been centralised and legalistic. By its nature,it has also been adversarial, revolving around compulsory conciliation and arbitrationof industrial disputes. In addition, an informal system has always operated in whichemployers, unions and employees negotiate and resolve disputes without theassistance or intervention of any industrial tribunal.
The Australian Industrial Relations Commission (AIRC) and its predecessors wereestablished as the vehicle for exercising these conciliation and arbitration powers.They have had a major role in determining specific awards and conditions ofemployment for a large proportion of the Australian work force. State tribunals alsoact on industrial relations matters within their borders. Generally, state tribunalsfollowed the AIRC’s wage fixing principles.
Australia’s wages system has centred around the decisions or ‘awards’ made by thesetribunals in the settlement of industrial disputes. Crafts and occupations wereoriginally the focus of these awards, rather than the enterprise or industry. This largelyreflected the historical origins and structure of Australia's unions. Consequently, thesame award can apply to a range of workers in different firms and across differentindustries. Over time there has, however, been a shift to a greater industry focus.
In 1985 over 5 000 awards existed, covering about 5 million employees or 85 per centof the workforce. Award coverage was comprehensive in the public sector (98 percent) compared with 78 per cent in the private sector. Of the total estimatedworkforce, federal awards covered 33 per cent, around 50 per cent were under stateawards and 15 per cent had no award coverage (ABS 1988). The latest data, for May1990, suggests little change occurred in the intervening period.
Because awards have a quasi-legal status as the outcome of a dispute, they tended tobecome entrenched and amenable to change only with further disputation.Historically, Australia’s level of industrial disputation has been relatively high (see,for example, Hancock 1985). Disputation, measured as working days lost per 1 000employees, peaked in 1974 (see figure 5.1). Australia’s management practices wereoften a factor behind this high level of disputation — managerial policy, along withwage issues, was a major cause of industrial disputes (ABS 1995c).
Some key elements of Australia’s centralised industrial relations system were thetarget of wide ranging criticisms, particularly from employers (see, for example, CAI1984, ACC 1984). Some specific criticisms of the system in the mid 1980s were that:
• the coverage of so many different awards had institutionalised restrictive workpractices and reduced enterprises flexibility to change in response to marketpressures;

64 MONITORING MICRO REFORM — SETTING THE SCENE
• a multiplicity of trade unions representing the firms’ different employeesincreased the costs of negotiation and encouraged demarcation disputes; and
• relative wages were rigid and compressed, making it difficult to linkremuneration to performance.
Figure 5.1 Industrial disputation in Australia, 1967 to 1994 — workingdays lost per thousand employees
0
200
400
600
800
1 000
1 200
1 400
1967 1969 1971 1973 1975 1977 1979 1981 1983 1985 1987 1989 1991 1993
Source: ABS (1995c).
None of these criticisms is uncontroversial. For example, the Organisation forEconomic Co-operation and Development (OECD) considered:
Compared to other OECD countries, Australian labour markets are in some respects alreadyreasonably flexible. Real wages have adjusted fairly rapidly to changes in unemploymentlevels. Labour mobility and turnover between firms appear to be high by internationalstandards ... [while] layoffs face no official constraints, periods of notice are relatively shortand overly generous termination or redundancy provisions are not widespread in awards(OECD 1990, pp. 57, 67-8).
Since March 1983, a series of eight Accords between the Federal Government and theAustralian Council of Trade Unions (ACTU) has supplemented the wage settingprocess (see box 5.1). These Accords have provided a policy framework, with ACTUmembers agreeing to restrain their pursuit of wage increases to levels consistent withthe Government’s macroeconomic targets, covering inflation and employment. Inexchange, the government has made commitments to equitable economic policieswhich underwrite a ‘social wage’. Examples of this have occurred in policies ontaxation, superannuation, health insurance and job creation. The Accord hasprogressively evolved since 1983 to accommodate a more decentralised approach,involving workplace bargaining (see, for example, ACTU 1993).

BUREAU OF INDUSTRY ECONOMICS
INDUSTRIAL RELATIONS AND WORKPLACE REFORM 65
Box 5.1 The Accords, 1983 to 1995
On assuming federal government in 1983, the Australian Labor Party instituted a policyaccord with the Australian Council of Trade Unions (ACTU). The parties haveprogressively modified and updated the Accord to meet the changing circumstances of theeconomy. Accord Mark I aimed at tackling the problems of inflation and unemploymentsimultaneously, while working to restore profit share to business. It provided for themaintenance of real wages through full wage indexation for cost-of-living (price) inflation.
In 1985-86 a sharp depreciation of Australia’s currency saw a change in the emphasis of theaccord in order to avoid higher import prices flowing through to wage settlements (seechapter 2). Under Accord Mark II, implemented in September 1985, the parties negotiated adeal which discounted full wage indexation through a wage-tax-superannuation packagedesigned to preserve real after-tax incomes. It stressed the importance of the governmentrestraining prices through the Prices Surveillance Authority.
Accord Mark III, implemented in March 1987, supported the AIRC’s two tier system forwages and abandoned full wage indexation. In addition to the first tier of generally availablewage increases, workers could negotiate a second tier of additional wage increases as atrade-off for productivity enhancing measures at the workplace.
Accord Mark IV, implemented in August 1988 supported the AIRC’s award restructuringprocess, which encouraged further measures to improve efficiency and provide workerswith access to more varied, fulfilling and better-paid jobs. The award restructuring processaimed to encourage multi-skilling and minimise demarcation disputes.
Accord Mark V, implemented in August 1989, aimed to secure wage restraint at a time ofoverheating in the macro economy. It combined moderate wage increases with substantialcuts in personal income tax and improvements in the social wage, thereby raising realdisposable income. It also included agreement on the need to continue the awardrestructuring process.
Support for award restructuring continued with Accord Mark VI (February 1990), whichrelied on a wage-tax-superannuation trade-off to maintain wage restraint. Building on theworkplace changes made through award restructuring, the Accord supported enterprisebargaining to enable more flexible and productive ways of working at the enterprise level.
Accord Mark VII (March 1993), titled Putting Jobs First, was the parties’ response torecession and worsening unemployment. The Accord aimed to create 500 000 new jobsduring the years 1993 to 1996. It continued to support a movement to decentralised wagefixation. A major feature of this Accord was the government’s commitment to an arbitratedsafety net for lower paid workers who did not derive any gains from enterprise bargaining.
Accord Mark VIII ( June 1995) re-affirms the parties’ commitment to a decentralised wagessystem. It provides for a set of four safety net adjustments for low wage earners over theduration of the Accord (1995-1999). The ACTU has committed to wage growth consistentwith the government’s target of an underlying inflation rate around 2 to 3 per cent over thecourse of the business cycle. The government, in turn, has raised its target for employmentgrowth to 600 000 over the next 3 years. A feature of the Accord’s social wage was thegovernment introducing a new means tested maternity allowance.

66 MONITORING MICRO REFORM — SETTING THE SCENE
Australia’s industrial relations climate has seen a substantial improvement in industrialdisputation since 1981. The number of working days lost through industrial disputesper thousand employees fell from almost 800 in 1981 to a record low of 76 in 1994(figure 5.1).
5.2 Industrial relations reformsThe Commonwealth, via legislation and AIRC decisions, has pioneered a sequence ofsignificant industrial relations reforms since 1987. These reforms have introducedmore flexibility into the process of determining wages and conditions. The initialapproach was to adopt a two tier wages system. However, a program of awardrestructuring and incentives to implement workplace reforms quickly replaced thissystem. Later, a decision to encourage further decentralisation, via enterprisebargaining, superseded these arrangements. Formalised enterprise agreements,underpinned by an award safety net are now the primary instruments for regulatingwages and conditions.
5.2.1 Two tier system
The shift away from centralised wage fixation began in March 1987 with the two tiersystem established by the AIRC. This experiment with productivity based wagesetting was supported by Accord mark III. The first tier involved provision for anacross-the-board wage increase (based on traditional equity and cost of livingconsiderations). A second tier offered the prospect of pay rises — up to a limit of 4per cent — in exchange for productivity improvements which met the AIRC’srestructuring and efficiency principle (REP). The REP emphasised (but did notconfine itself to) changing restrictive work practices. The resultant cost savings or‘offsets’ constituted the productivity gains basis for wage increases under the secondtier. State tribunals adopted substantially the same system.
To have such cost offsets ratified, employers and unions submitted agreed changes tothe AIRC for alteration of the relevant award provisions (commonly as an enterprisespecific annexe to the award). In a significant departure from the centralised tradition,‘most second tier agreements were settled at the enterprise level’ (McDonald andRimmer 1988, p. 482). Nevertheless, the AIRC played an extensive role in the two tierbargaining procedures:
• it provided a framework under which the parties bargained;
• it provided a conciliation and arbitration service to any parties who became deadlockedduring the bargaining process; and
• it imposed a penalty on any unions requiring arbitration by splitting the available increaseinto two phased instalments — to discourage the parties from relying on arbitralmechanisms (Romeyn 1994, p. 10).

BUREAU OF INDUSTRY ECONOMICS
INDUSTRIAL RELATIONS AND WORKPLACE REFORM 67
Hence, the two tier system, while providing some improvement in workplaceflexibility, remained firmly within the centralised and legalistic system of wagedetermination.
The spread of second tier wage increases varied considerably across awards, withemployees in small firms less able to negotiate increases because of their limitedbargaining resources. This may have reflected the ‘go-it-alone’ approach individualunions took to the process, rather than coordinating their negotiations (McDonald andRimmer 1988). Employers with few or no union members made little use of the REP(Romeyn 1994). Large, single union, single award enterprises, particularly in thepublic sector, were most successful in negotiating second tier rises.
The most frequent offsets achieved under the REP introduced greater flexibility intoworking hours. For example, they frequently extended the span of hours during whichemployees could work at ordinary time rates or changed overtime arrangements (DIR1990, Rimmer and Zappala 1988).
The second tier negotiations also allowed for the removal of a variety of restrictivework practices, for example, permitting greater job sharing and employment of casuallabour (Macken 1989). However, many offsets were once-off savings and thereforerepresented short term gains. Some firms reached agreements covering taskbroadening and the associated issues of training and demarcation disputes, but theextent varied considerably across industries (Rimmer and Zappala 1988, Frenkel andShaw 1989).
Just as significant as the productivity gains achieved through cost offsets was that thedesign of the REP successfully introduced some flexibility to previously establishedwage differentials. It did this by discouraging the automatic flow-on, from primary tosecondary awards, of wage increases across industries/unions (McDonald and Rimmer1988). But such disturbances to wage relativities — both between industries andbetween employees at the same workplace who were subject to different unioncoverage — may have come at the cost of some industrial disputation (McDonald andRimmer 1988).
There appear to have been real gains under the two tier system. However, a review bythe AIRC considered there had been a short-term focus on cost-cutting measureswhich prevented more far-sighted workplace reforms (Commonwealth of Australia1991). The AIRC also suggested that many firms may have exhausted the scope forfurther trade-offs under the REP (Macken 1989).
Insofar as it focused attention on productivity enhancing measures at the workplace,the two tier system initiated ‘genuine attitudinal change’ (Rimmer and Zappala 1988,p. 588). Despite the significant progress made under this system, McDonald andRimmer (1988) point out that the reforms highlighted substantial problems andconstraints to further flexibility in the award structure.

68 MONITORING MICRO REFORM — SETTING THE SCENE
5.2.2 Award restructuring and the structural efficiency principle
The AIRC examined the issue of the lack of flexibility in the structure of awards at theAugust 1988 national wage case. Building on the REP, it made the structuralefficiency principle (SEP) the basis for a second phase of reform.
The SEP made wage increases available to unions which committed themselves to afundamental review of their industrial awards, described as award restructuring. Thegovernment supported the SEP because it addressed ‘objectives of improving industryefficiency and providing workers with access to more varied, fulfilling and better paidjobs’ (DIR 1989, p. 19).
The AIRC expanded upon the SEP in the August 1989 national wage case decision.The Commission listed some specific workplace reforms for employers and unions toconsider in the award restructuring process. These included:• compensating overtime with time off;• flexibility in arrangements covering hours of work, including wider daily span of
ordinary pay hours and job sharing;• rationalising the taking of annual leave to maximise production; and• developing consultative procedures to deal with day to day matters of concern to
employers and workers.
A further key element of the award restructuring process was the minimum ratesadjustment exercise. This aimed to provide a safety net of consistent minimum wagerates across awards. It involved modernising classification structures and adjustingpay relativities within and between awards. The most common changes arising fromaward restructuring were: reductions in the number of job classifications;establishment of new skills-related career paths; and multi-skilling.
The extent of award restructuring varied across industries, with the pacesetter industrybeing the metals industry, where the Metal Trades Industry Association and unionsimplemented a number of important changes to work practices (box 5.2).
Still and Mortimer (1993) studied the relationship of award restructuring and trainingpolicy in large and medium firms in New South Wales. They found greaterorganisational change had followed award restructuring in large firms than in mediumsized firms. The authors attributed this difference to larger companies being ‘morepro-active and structured in terms of their identification of training needs’ (Still andMortimer 1993, p. 99). This may have been due to larger companies having their owntraining departments. Where award restructuring had taken place, they found the mostaffected groups in both firm categories were production personnel, clerical staff,technical staff and supervisors.
Given the structure of awards, negotiations necessarily took place at theindustry/union level rather than at the level of the firm. However, some commentators

BUREAU OF INDUSTRY ECONOMICS
INDUSTRIAL RELATIONS AND WORKPLACE REFORM 69
argue that this process was an important step in the move to enterprise bargaining. Forexample, Romeyn notes award restructuring:
laid the groundwork for a greater workplace focus, by making awards more flexible andrelevant, including through the use of facilitative provisions and the introduction of enterpriseflexibility clauses, and by encouraging consultative mechanisms to be established (Romeyn1994, pp. 10-11).
Box 5.2 Award restructuring in action: the metal industry
In 1989 the parties to the federal Metal Industry Award varied the award’s provisions underthe SEP to:
• incorporate a new 14 level, broadly based classification structure designed to increasethe skills base of the industry, provide an opportunity to redesign jobs and establishcareer paths;
• rationalise award wage relativities;
• require the establishment of enterprise-based consultative mechanisms and procedures;
• enable the employer to direct employees to perform any work within their skill,competence and training provided it does not lead to de-skilling or compromise safety.This was an important tool in eliminating demarcation based on union membership andjob function;
• require a training program to be developed having regard to the current and future skillneeds of the enterprise;
• allow for training to be undertaken on and off the job on the basis that any trainingundertaking during working hours shall be without loss of pay;
• introduce an “enterprise flexibility clause” designed to enable the parties at theenterprise to make an agreement on any measure designed to increase efficiency subjectto meeting certain conditions;
• enable a more flexible application of key award provisions relating to hours of work,shift work, meal breaks, annual leave and annual close-downs; and
• include a provision for adult apprentices (MTIA 1990, pp. 1-2).
Another important benefit from this process was the experience it gave employers andemployees in developing some of the expertise needed to progress later to workplacebargaining. Not all parties benefited, however, as many unions and (smaller) firmsfound they could not devote sufficient resources to managing what were oftenprotracted negotiations (Macken 1989).
Award restructuring highlighted the significant transaction costs associated withbargaining where small unions and employers are involved. There were also concerns

70 MONITORING MICRO REFORM — SETTING THE SCENE
that the multiplicity of unions in Australia led to increased disputation and couldhinder workplace bargaining. In response to these concerns, the government enactedlegislation to encourage union amalgamations (see box 5.3).
5.2.3 Key developments in enterprise bargaining
In March 1989 the Industrial Relations Act 1988 came into effect. As well as updatingthe federal industrial system’s institutions and streamlining its processes, it attemptedto provide a more effective framework for the achievement of industrial relationsreform. The Act provided for enterprises to reach fixed term certified agreements.These certified agreements did not necessarily have to conform to the AIRC’s wagefixing principles. However, the Act applied a public interest test to such agreements.The AIRC required that a number of conditions be met before it certified anagreement. These were that the agreement must:• be justified on its merits;
• relate to special and isolated circumstances; and
• not circumvent general wage fixing principles or threaten the orderly operation ofthe industrial relations system (Romeyn 1994).
In applying these conditions, the AIRC refused to approve a number of agreements.As a consequence, enterprise agreements were effectively restricted to a small rangeof short term agreements designed to supplement an award, rather than replace (forthat particular enterprise) the terms and conditions of an award (Plowman 1993).
The AIRC’s October 1991 decision opened the way to further steps towards thedecentralisation of industrial arrangements, particularly wage determination. In its1991 decision, the AIRC amended its wage fixing principles to allow for enterprisebargaining in the federal system. These agreements had to satisfy the AIRC’s newenterprise bargaining principle, which required:• enterprise agreements to be based on a broad agenda;• wage increases to be based on the ‘actual implementation of efficiency measures
designed to effect real gains in productivity’;• a ‘single bargaining unit’ to negotiate agreements at the enterprise level;• a commitment to no further pay increases, other than through any subsequent
national wage case decisions;• retention of basic award standards in relation to hours of work, annual leave etc;
and• fixed term agreements, not be subject to re-negotiation while still active.

BUREAU OF INDUSTRY ECONOMICS
INDUSTRIAL RELATIONS AND WORKPLACE REFORM 71
Box 5.3 Union amalgamations
The origins of Australian unions were typically in crafts or occupations, rather thanenterprises or industries. In June 1988 there were 308 state and federally registered unions.Many unions had less than 1 000 members, with the result that union representationgenerally increased with the number of employees in a firm. In 1989-90, workplaces withover 500 employees had an average of six unions (AWIRS 1991).
Drago et al (1992) have suggested this spread of representation fragmented workplacebargaining efforts, contributed to demarcation disputes and lower productivity comparedwith single union workplaces. It may also have retarded skill development by confiningworkers to a relatively narrow range of tasks.
The Commonwealth’s 1990 (Section 118) amendments to the Industrial Relations Act 1988encouraged a greater industry orientation by unions. By raising the minimum membershiplevel for unions from 1 000 to 10 000, the changes sought to reduce the number of federallyregistered unions. Unions also received financial assistance to progress the costly transitionto amalgamation. The new provisions encouraged and hastened voluntary amalgamation byexisting unions, while retaining their community of interest. The single bargaining unitrequirement of the enterprise bargaining principle (discussed in section 5.2.3) re-enforcedthe incentive. These Commonwealth initiatives supported a drive for union rationalisationwhich came from within the union movement, led by the ACTU.
Through voluntary amalgamations the number of federally registered unions fell from 148in June 1988 to 47 unions at 30 June 1995. The ACTU estimates that 20 of these unionscover over 95 per cent of federal registered union employees. While this resulted in theamalgamation of many smaller unions, it did not have an immediately pronounced effect atlarge workplaces. A Business Council of Australia survey of its members indicated that theaverage number of unions had fallen from 4.8 in 1988 to 3.6 in 1992 (Hilmer 1993). Theoverall number of state and federally registered unions fell to 157 in June 1994. Recentdecisions by the AIRC which require the insertion of majority clauses, enterprise flexibilityclauses and facilitative provisions to access safety net adjustments may help mitigate theeffects of multiple union and award coverage.
While the number of federally registered unions has fallen significantly, the impact of unionamalgamations in increasing the flexibility of the labour market remains unclear. Accordingto the Industry Commission:
Union amalgamations may contribute, at one level, to a more flexible and adaptive workforceby increasing the range of tasks that employees can perform and reducing demarcationdisputes. But amalgamations could also lead to greater centralisation of negotiations andstandardisations of settlements — a direction that would tend to thwart enterprise flexibility(IC 1990, p. 13).
Time will tell whether the centralisation benefits from amalgamated unions outweigh thesepotential costs to enterprise flexibility.

72 MONITORING MICRO REFORM — SETTING THE SCENE
All state industrial tribunals introduced arrangements reflecting the key elements ofthe AIRC’s enterprise bargaining principle (box 5.4 discusses the main thrust of stateindustrial relations reform).
Box 5.4 The states’ approach to enterprise bargaining
All states have followed the Commonwealth’s example in legislating to encourageenterprise bargaining. Most states have adopted similar systems to the Commonwealth butVictoria and Western Australia have diverged. The Australian Capital Territory and theNorthern Territory come under the Commonwealth’s legislation. For a more detaileddescription of state workplace bargaining legislation, see Commonwealth of Australia(1994a).
Under Victoria’s Employee Relations Act 1992, all state awards expired on 1 March 1993.The government replaced these awards with a system of contractual employmentagreements (either collective or individual). However, if the employee and employermutually agree for their relationship to remain subject to an award, then ‘opting in’ to theaward system is still possible. The Victorian Government also abolished compulsoryarbitration and outlawed most forms of industrial action. It invested general conciliation andarbitration powers in the new Employee Relations Commission. The commission may onlyexercise its powers with the consent of all parties. Contractual agreements under this systemappear to have achieved only limited coverage to date. DIR (1995b) has estimated that,since about 1991, 373 000 Victorian workers have exited the state system and moved tofederal awards. Revisions to the Commonwealth legislation assisted this exodus. TheVictorian Government responded in October 1994 by introducing a process for minimumwage setting, in order to stem the outflow of state workers to the federal jurisdiction(Reitano 1995). However, the government has also encountered difficulties in implementingthe streamlined minimum wage system it envisaged. Thus, in June 1995 the EmployeeRelations Commission decided to reinstate the thousands of old state award pay rates inorder to allow time for employer submissions before settling the issue (Davis 1995).
Western Australian legislation, since 1 December 1993, has allowed ‘opting out’ of the stateaward system to a ‘workplace agreement’ stream. It suspends the relevant award for theduration of an agreement, but revives the award on expiry or cancellation of the agreement.As in Victoria, agreements are contractual and may be collective or individual. The decisionto move to the alternative workplace agreements stream requires the mutual agreement ofemployers and employees and the existing award system remains in place. The newlegislation constrains the role of unions in the negotiation or ratification of workplaceagreements and diminishes their previous rights of employee representation (Keirath 1995).During 1995, the WA government has encountered difficulties in implementing its so-called‘second wave’ of reforms, through which it has attempted to reduce the influence of unionsand their role in WA’s system.

BUREAU OF INDUSTRY ECONOMICS
INDUSTRIAL RELATIONS AND WORKPLACE REFORM 73
Both the certified agreement route and the AIRC’s enterprise bargaining principleroute focused on awards and required the involvement of unions. Hence, non-unionenterprises were effectively excluded from the federal enterprise bargaining process.The Commonwealth Government, concerned with the slow take up of enterpriseagreements, under the Industrial Relations Act’s certification process and the AIRC’snew enterprise bargaining principle, amended the legislation. The 1992 amendmentscreated a new division, Division 3A, to further facilitate enterprise agreements. Theamendments removed the public interest test for certified agreements and replaced itwith a ‘no disadvantage’ test. The amendments also added a number of other statutorytests relating to consultation, dispute settling provisions and the use of singlebargaining units. The AIRC, when certifying an agreement, could not scrutinise theagreement’s productivity measures or wage increases. The amendments introducedgreater flexibility in the determination of agreements at the workplace, increased thebargaining parties’ responsibilities and limited the scope of the AIRC to intervene inthe bargaining process.
Regarding the 1992 amendments, the Commonwealth Government, in a 1993submission to the AIRC, said:
The intent was to ensure that certified agreements were available as a real alternative to themainstream award system and not reserved for exceptional circumstances (Commonwealth ofAustralia 1994b, p.18).
The new legislation required the AIRC to apply the following criteria whenconsidering an agreement’s certification:
• are the employees who are party to the agreement disadvantaged compared to theterms and conditions applying under their relevant award?
• if employees are disadvantaged, is such a reduction, in context of their terms andconditions considered as a whole, contrary to the public interest (the nodisadvantage test)?
• dispute settling procedures must be included;• unions involved in the agreement must, where practical, consult with members; and• the operational period of the agreement must be specified.
The 1992 amendments, while devolving responsibility to the bargaining parties,continued to rely on awards (as the benchmark for the no disadvantage test) and unionparticipation in the bargaining process. While the amendments limited the AIRC’sscope to intervene, it continued to play an important role in deciding whetherenterprise agreements put up for certification satisfied the statutory tests, including theno disadvantage test. Hence, like the 1988 arrangements, non-union enterprises wereeffectively excluded from the AIRC enterprise agreement process.
The number of enterprise agreements approved by the AIRC increased once the July1992 amendments became effective (see appendix 3). Most parties to these

74 MONITORING MICRO REFORM — SETTING THE SCENE
agreements chose the amended certified agreements route, rather than the AIRC’senterprise bargaining principle.
In October 1993, the AIRC replaced its enterprise bargaining principle with theenterprise awards principle. This new principle allowed parties to formalise enterpriseagreements as consent awards. It also provided scope for the AIRC to facilitate themaking of these agreements by arbitrating as a last resort.
The Industrial Relations Reform Act 1993 came into force in March 1994. Itintroduced new objectives for the Act. These new objectives focus on:
... the facilitation of enterprise bargaining;
the protection of wages and conditions of workers through awards and by ensuring that labourstandards meet Australia’s international obligations; and
the provision of a framework of rights and responsibilities consistent with the move towards amore decentralised system (Brereton 1993, p.2780).
The amended legislation places the onus for resolution of disputes, over single-business certified agreements, directly on the affected parties. Consequently, the roleof the AIRC, in relation to agreement making, has changed, placing a greateremphasis on conciliation while diminishing its role in arbitration. The legislation alsostipulates that enterprise agreements should contain a procedure for renegotiation atthe expiry of their term.
The Reform Act, also made provision for certified agreements in unionisedworkplaces. In order to accelerate the spread of enterprise bargaining to workplaceswith little or no union coverage, the Act also introduced enterprise flexibilityagreements. Enterprise flexibility agreements are available to constitutionalcorporations (that is, organisations covered by the corporations power in theConstitution) whose terms and conditions of employment are covered by a federalaward. If the negotiating workplace has one or more employees who are members ofan eligible union, the union must be informed and may become involved in thenegotiations. However, if no employees at the negotiating workplace are members of arelevant union it ‘.. is not necessary for a union to be party to an enterprise flexibilityagreement, but any union that is party to an award binding the employer in respect ofwork done at the enterprise is entitled to be heard upon the application for approval ofthe agreement (Naughton 1994, p. 158). While the union has a right to be heard by theAIRC it has no right to veto an enterprise agreement.
The Reform Act, like the earlier amendments, includes a no disadvantage test whichallows the AIRC in certain circumstances to refuse to ratify an enterprise agreement.This test helps reinforce one of Act’s new objectives (that is the protection of wagesand conditions through awards). The Minister for Industrial Relations during thesecond reading speech on the Reform Bill observed:
The no disadvantage test has been an important innovation. Applying as it does to the overallpackage of employee entitlements, it allows for a wide range of variations to award conditions.
BUREAU OF INDUSTRY ECONOMICS
INDUSTRIAL RELATIONS AND WORKPLACE REFORM 75
It also allows for agreed reductions if these are judged not to be against the public interest, forexample, as part of a strategy for dealing with a short term business crisis and revival.However, as the government has consistently stressed, the [no disadvantage test] provision isintended to protect well established and accepted standards which apply across the community,standards such as maternity leave, hours of work, parental leave, minimum rates of pay,termination change and redundancy provisions and superannuation (Brereton 1993, p. 2781).
The full bench of the AIRC reiterated this intent in its October 1995 Tweed ValleyFruit Processors decision (AIRC 1995a). The AIRC noted that, while a reduction in a‘community standard’ was not prohibited by the Act, substantial weight should begiven to such a reduction when applying the no disadvantage test.
There are differing views on the appropriateness of the no disadvantage test, in thecontext of increasing flexibility at the workplace. Some would argue that the nodisadvantage test constructs a minimum which allows for greater flexibility at theworkplace, so long as management and, if applicable, unions have the willingness andforesight to utilise it. Others, have argued that the test only allows enterpriseagreements to be add-ons to awards, with the underpinning award system maintainingcertain inflexibilities. Only time will tell whether the flexibility expected to beachieved from recent reforms will be constrained by the application of the nodisadvantage test.
A total of 5 000 agreements have been ratified by the AIRC since the introduction ofthe no disadvantage test in mid 1992. Of these ratified agreements, an unknownnumber were adjusted to conform with the test. For example, the NCI Plastics (NSW)Pty Ltd enterprise flexibility agreement was only approved after the provision to cashin sick leave was amended. During this period the AIRC rejected 4 agreements, on thegrounds that they did not maintain a community standard employment condition.Some may argue that this small number of amended and rejected agreements suggeststhat the no-disadvantage test has not been a constraint. However, this view fails toacknowledge that the existence of the test may have modified behaviour and hence thenature of the agreements put forward for ratification.
Notwithstanding any constraints which may arise from the no disadvantage test’sapplication, enterprise bargains ratified by the AIRC have included changes to theconditions set down in awards and, in some cases, reductions in award conditions(Long 1995). For example, in approving the Rockwell/Collins enterprise flexibilityagreement the AIRC found that the agreement would result in a reduction in awardentitlements and protections. However, when the AIRC considered the agreement as awhole the reductions were not deemed to be contrary to the public interest. Appendix3 details some of the broad areas covered in the first 1 000 agreements ratified by theAIRC. These include: changes to the contract of employment for casual, part-time andcontract labour and rationalisation of penalty rates.
The Reform Act also refocused the award system as a ‘safety net’ to underpin theenterprise bargaining system. Workers unable to negotiate wage rises through

76 MONITORING MICRO REFORM — SETTING THE SCENE
enterprise agreements can receive safety net wage adjustments through the awardsystem.1 The legislation requires the AIRC to review awards every three years todelete obsolete provisions and to ensure that awards remain ‘secure, consistent andrelevant’. The Act also provided for minimum entitlements for workers who did notalready have access to them through awards or legislation. These entitlements giveeffect to conventions of the International Labour Organisation and the United Nationswhich Australia has signed.2 The Act also provides a framework of rights andresponsibilities for the industrial parties and requires the removal of specified forms ofdiscrimination from awards.
According to the president of the AIRC, the reforms, and particularly the features foraddressing equity in the workplace, involve ‘the most fundamental change to theindustrial relations system in Australia since the Conciliation and Arbitration Act1904’ (O’Connor 1995, p. 63). There was not, however, universal acceptance of thisview, particularly in regard to the Act’s provision on employee rights on terminationof employment (see for example ACCI 1995). This aspect of the legislation wassubsequently amended.
After the Reform Act became effective there were three main avenues open toformalise an enterprise agreement in the federal system. These were certifiedagreements and enterprise flexibility agreements, as set down under the Act, andconsent awards under the AIRC’s principles. In August 1994, the AIRC indicated itwould give priority to approving enterprise agreements as either a certified agreementor an enterprise flexibility agreement. However, the Commission recognised that, forsome parties to an agreement, there may be a strong preference to formalise theiragreements in an award. To accommodate this, the AIRC restructured its bargainingprinciple. The AIRC, as under its previous principle, requires enterprise bargainingaward wage increases to be productivity based. However, it now applies other tests toreflect requirements under the Act’s certified agreement provisions.
In October 1995 the AIRC handed down its decision on its review of the third awardlevel safety net adjustment and the Reform Act’s award review requirement. TheAIRC emphasised the importance of safety net adjustments in the industrial relationsaward system. It indicated that this adjustment, like the earlier adjustments, wouldapply to federal awards, ‘even where all relevant award employees are covered by anenterprise agreement’ (AIRC 1995b). To avoid double counting, the adjustmentwould, however, be offset against any wage increases paid under bargaining
1 The AIRC first provided for a safety net wage adjustment in its October 1993 decision. By
October 1995 the AIRC had arbitrated three $8 per week safety net adjustments, so that allemployees covered by a federal award receive a wage increase of at least $24 per week overthe period from 1 November 1991 to 30 June 1996.
2 These entitlements cover minimum wages, parental leave, equal remuneration for work ofequal value without discrimination based on sex and certain rights in cases of termination ofemployment.

BUREAU OF INDUSTRY ECONOMICS
INDUSTRIAL RELATIONS AND WORKPLACE REFORM 77
agreements ratified by the AIRC. Hence if the parties to a formal bargainingagreement had agreed to a pay rise less than the safety net adjustment, the pay risewould be topped up. The AIRC also made the payment of this third adjustment subjectto the award parties complying with certain requirements. These included reporting onthe outcome of discussions to review the award as required by the Reform Act.
In regard to the award review, the Commission indicated it would take a proactiveapproach, using its arbitral powers if there is no likelihood of conciliation. It indicatedthat awards once reviewed would remove identified deficiencies. They would alsobecome: easier to understand; easier to adapt to the needs of the enterprise; and non-discriminatory in their operation. The vehicles for enhancing the relevance of awardsto business include the insertion in awards of enterprise flexibility clauses, facilitativeprovisions and majority clauses.3 The AIRC requires that all existing federal awardsmust be reviewed by 22 June 1997 (AIRC 1995b).
The Reform Act and the subsequent AIRC decisions have clearly extended theapplication of enterprise bargaining. As a result, the federal industrial relations systemis much more decentralised in its focus. However, the system remains closely linkedto the centralised award process, in terms of the safety net and the no disadvantage testprovisions. For some non-unionised enterprises it can also result in a degree of unioninvolvement in the negotiation and ratification process.
Appendix 3 examines Australia’s experience with enterprise agreements to date. Itfinds that the number of enterprise agreements ratified by the AIRC has increasedsubstantially since the AIRC’s 1991 decision to endorse formal enterprise bargainingin the federal system. By early October 1995 over 5 800 agreements had been ratifiedby the AIRC.4 As discussed in appendix 3 these agreements contain a range ofproductivity enhancing measures which could produce significant changes at manyworkplaces. However, data on the actual productivity gains achieved throughenterprise agreements is relatively scant. There is, however, some firm level evidenceto indicate that enterprise agreements may be contributing to increases in productivity.For example, a survey conducted by the Department of Industrial Relations indicatedthat managers in workplaces with enterprise agreements were more likely to report anincrease in productivity than managers in workplaces without enterprise agreements(DIR 1995a). Appendix 3 also examines the number of employees covered and thesectoral distribution of agreements.
3 An enterprise flexibility clause allows individual workplaces to reach agreement to adapt
award provisions to suit their needs. A facilitative provision is part of an award clause whichenables agreement at the enterprise level to determine the manner in which the clause is appliedby the enterprise. A majority clause is a means of increasing award flexibility, it provides that,where a minority of employees in an enterprise are covered by one award and the majority arecovered by another award, the award covering the majority shall apply (see AIRC 1995b forfurther details).
4 This represents the cumulative number of agreements, including replacement agreements,ratified by the AIRC.

78 MONITORING MICRO REFORM — SETTING THE SCENE
5.2.4 Industrial relations reform: what of the future?
The federal industrial relations system has experienced a number of significantchanges over the last decade. The system, once highly centralised and based onindustry wide multi-employer awards, has progressively evolved. Enterpriseagreements, underpinned by an award structure, are now the system’s major focus.Discussing the new industrial relations system the Minister for Industrial Relationsobserved:
The new industrial relations system provides the framework and with it comes unprecedentedscope and incentive for firms to achieve increased flexibility and productivity. Now that theframework is there, it is up to the parties to use it to their mutual advantage, and for theeconomic benefit of Australia (Brereton 1994, p. 5141).
Reflecting divergent views and different judgements about the merits of particulararrangements, this assessment is not fully accepted by all bargaining parties andindustrial relations commentators. For example, the Business Council of Australia(BCA) has supported the need for further labour market reform to make it:
... more responsive to the circumstances of individual enterprises and their employees. ... Inprinciple, the Business Council believes the labour market should not be immune fromcompetition. Indeed, in the view of the Business Council, where competition law has beenapplied to the labour market it has assisted the competitive process... (BCA 1994, p. 12).
Reflecting these considerations, in November 1994 peak employer bodies applied tothe Commonwealth for significant changes to the existing industrial relations laws.Their proposals were for:
• awards to contain only ‘core’ minimum conditions, so that enterprise bargainingis more flexible;
• unions’ role in negotiating wage deals to be reduced so that employees have theright to choose who represents them;
• strengthened powers for the AIRC to order an end to strikes; and• a code of conduct to prevent unions acting as spoilers in non-union wage
agreements (Norrington 1995).
The Industry Commission echoed these views, suggesting that the continued existenceof multiple awards and the present structure of the safety net ‘constrain the ability ofworkforces to adjust to change’ (IC 1994, p. 11). The Commission has also noted that:
... prescriptive provisions, such as the ‘no disadvantage test’ should be interpreted broadly sothat they do not unnecessarily constrain the implementation of enterprise bargainingagreements and restrict flexibility in the employment of labour (IC 1995c, p. vi).
The proposals referred to above run counter to the views espoused by the accordparties. For its part, the Commonwealth holds that minimum wages and standards ofemployment are necessary to ensure worker commitment to enterprise bargaining. Itdoes not support a wholesale reduction in the content of awards, because:

BUREAU OF INDUSTRY ECONOMICS
INDUSTRIAL RELATIONS AND WORKPLACE REFORM 79
.. this would cause a substantial reduction in the effectiveness of the award framework. Whilethe emphasis should increasingly be on enterprise bargaining, the maintenance of an effectiveand relevant award system is of vital importance. It acts as the safety net for the system -underpinning bargaining arrangements and providing adequate protection for those who areunable to reach workplace agreements (Commonwealth of Australia 1994b, p. 148).
Similar views have been expressed by the ACTU. In support of the current industrialrelations system and, in particular the maintenance of the award system, the ACTUindicated that:
Awards are what preserves most workers’ minimum conditions of employment.... Thealternative model for industrial relations... is either the immediate or eventual destruction ofaward protections. In their place will be a skeletal amount of minimum standards andindividual contractual arrangements to fill the void - if you’re lucky and your boss is generous(Pallas 1995, p. 31).
Some other commentators also agree that the maintenance of awards is critical.However, they query whether the current arrangements meet the needs of manygroups who do not have the capacity to bargain on a workplace by workplace basis.For example, the National Pay Equity Coalition in its submission to the AIRC’s 1995review of wage fixing principles said:
Enterprise bargaining is clearly not relevant to substantial numbers of workers, and awardwages are decreasingly relevant to the cost of living.
With enterprise bargaining the work undertaken by the AIRC and the parties to establish aframework for fair and equitable relationships on an industry and occupational basis throughthe structural efficiency principle and minimum rates adjustments is being undermined.
If access to the award system continues to be constrained, while limited numbers (and evenfewer of the industrially weaker groups) can achieve enterprise agreements, for many workersthere is no industrial system at all, just whatever arrangements organisations choose to provide(NPEC 1995, p. 38).
In commenting on the nature of Australia’s current industrial relations system, Sloan,at one extreme observed:
The premises on which compulsory arbitration and enterprise bargaining are based areprofoundly inconsistent... The former is about the power of state intervention to eliminate (orreduce) industrial action and the ability of single parties (mainly unions) to access the tribunalsto order binding decisions on others. It is an administrative solution, not a market-basedsolution, although the scope for over-award bargaining has added an element of flexibility inthe past. Enterprise bargaining, on the other hand, is based on the proposition that the parties tobargaining are best-placed to assess their interests and to engage in negotiations that canproduce a balanced outcome based on these interests. To be sure, the parties may play ‘hard-ball’ and there is a case for some rules governing procedure — in relation to recognition andvictimisation, for example. The case for a third party to judge the outcomes of negotiations ismuch weaker. The point is that compulsion and voluntarism are a very odd combination,particularly when the line between the two is unclear (Sloan 1995, p. 7).
In contrast, Short and Buchanan consider that by the end of 1994 Australia wascontinuing to develop:

80 MONITORING MICRO REFORM — SETTING THE SCENE
...[a] novel approach to using industrial relations and wages policy as an instrument forpromoting labour market reform that simultaneously encouraged efficiency and equity.... Itappears that those involved in negotiating agreements are developing a unique approach tolabour market reform that combines flexibility through agreements with co-ordination throughawards. The emerging system of ‘co-ordinated flexibility’ may be more effective than one thatprimarily relies on arbitration, or one that is predominantly market based (Short and Buchanan1995, p. 131).
Some of the disagreement about the merits of the current industrial relations systemreflects the relative complexity of the arrangements. For example, Naughton pointsout that the enterprise bargaining provisions introduced via the Industrial RelationsReform Act are ‘breathtakingly complex’ covering something like 40 pages of theconsolidated Act. This compares with less than four pages for the enterprisebargaining provisions in the previous, now repealed, legislation (Naughton 1994).Similarly, Stewart notes:
... the provisions regulating both EFAs [enterprise flexibility agreements] and certifiedagreements are extremely complex and contain many potential areas of uncertainty: forexample, as to the definition of an ‘enterprise’, as to what constitutes ‘disadvantage’ toworkers, and as to what level of consultation is required with the workforce. It is also unclearwhat attitude the Commission will take in those instances where it has a discretion to apply thepublic interest (Stewart 1994, p. 145).
Reflecting, in part, these considerations Stewart stated that:
Despite the attractiveness of registering an agreement in order to oust the operation of an awardwhose provision may be regarded as insufficiently flexible where the needs of the enterprise areconcerned, it would not surprise if many employers baulked at the cost and effort associatedwith the process (Stewart 1994, p. 145).
In relation to the employee protection and equity provisions in the currentarrangements the Sex Discrimination Commissioner has submitted that:
... guidelines should be developed on the meaning and operation of the Industrial Relations Actprovisions on discrimination, “no disadvantage”, unfair exclusion from an agreement, and onthe information and consultation requirements including the specific requirements regarding“relevant employees” (HR&EOC 1995, p. 2).
The National Pay and Equity Coalition also drew the AIRC’s attention to the need forguidelines submitting that:
... the development of guidelines is necessary to assist parties reach agreements that complywith the Act, and thus provide the framework necessary to an increased spread of enterprisebargaining agreements, and the increased inclusion of equity initiatives within agreements(NPEC 1995, p. 20).
Complexity and uncertainty can increase the costs and reduce the flexibility associatedwith enterprise bargaining. That said, it is reasonable to expect initial adjustment costswith any new industrial relations system. These costs and constraints should diminishsomewhat as managers, unions and workers become more experienced in negotiating
BUREAU OF INDUSTRY ECONOMICS
INDUSTRIAL RELATIONS AND WORKPLACE REFORM 81
agreements and current uncertainties are progressively lessened by future AIRCdecisions.
In commenting on the issue of relative complexity, the Department of IndustrialRelations observed that the Workplace Bargaining Survey conducted in October andNovember 1994 found that none of the workplaces which had unsuccessfullyattempted to negotiate an agreement in the 12 months prior the survey (covering 3 percent of workplaces without an agreement) nominated the legislative arrangements as acause. Further only about 3 per cent of private sector workplaces used a lawyer orconsultant to help them in negotiating their agreements. The Department also drewattention to the spread of enterprise agreements, as evidenced by an 82 per centincrease in the number of agreements formalised in 1994-95 compared with 1993-94.Moreover, the incidence of agreements covering small business (with 20 or feweremployees) has almost doubled since the new legislative arrangements came into forcein March 1994. In the light of these developments they submitted that there is noevidence that the legislation’s alleged complexity has been a barrier to agreementmaking.
In summary, it is apparent that there are quite divergent views on the appropriatedirection of future reform. Some of this reflects different assessments about theappropriate extent of government involvement in wages policy. There is alsodisagreement over the merits of a system which has a centralised componentunderpinning a decentralised bargaining component. In particular, there isdisagreement over the appropriate role of unions, the extensiveness of the centralisedframework overseeing the development of enterprise bargaining initiatives, and theappropriate form of safety net protection.
5.3 Some other workplace and labour market reformsEducation and training programs can have an important bearing on the ability of firmsand enterprises to adjust to changes in market demands. For new entrants to theworkforce, appropriate training qualifications provide a credible endorsement of theircompetencies, necessary to attract prospective employers. Even for the moreexperienced workers, structural change has heightened the relevance of training as ameans of adjusting to new employment challenges. Often, workers and managementmust learn new ways of adding value to an enterprise and, inevitably, this requiressome training. Such training may come either on-the-job or through external(institutional) sources. Government’s recognising the importance of education andtraining have taken steps to improve Australia’s human capital. Section 5.3.1 brieflyoutlines some of the reforms undertaken by the Commonwealth government in thearea of workforce training.
The discussion of the labour market so far has focused on reforms affecting employersand their working relations with employees. However, the number of people without

82 MONITORING MICRO REFORM — SETTING THE SCENE
jobs has remained stubbornly high. For example, in May 1994, in seasonally adjustedterms, there were 862 800 unemployed persons or 9.9 per cent of the workforcelooking for full time or part time jobs. Approximately 310 800 of these people wereconsidered as being long term unemployed (ABS 1995b). The main aim of the federalgovernment’s May 1994 Working Nation statement was to reduce this unacceptablyhigh level of unemployment. Changes to labour market assistance programsintroduced in Working Nation are briefly discussed in section 5.3.2.
5.3.1 Training reforms
The award restructuring process initiated a greater focus on vocational training as ameans of achieving both worker and employer goals. The structural efficiencyprinciple highlighted multi-skilling and the development of career paths as keyelements of enterprise productivity improvement, linking pay increases to progress inthe development of firm structures for skill enhancement.
Most industry training is informal, on-the-job training and therefore difficult to assess,both in quantum and content. Structured, off-the-job training has traditionally comethrough public institutions, namely universities and the technical and further education(TAFE) system. The state/territory governments which run the TAFEs haveindividually set training standards, approved curricula and accredited trainingprograms and providers.
While recognising the value of regional diversification and tailoring training to localneeds, governments found a balancing need for a national approach to settingpriorities, curricula, competencies and allocating funds. Although constitutionallylimited in its powers over training, the Commonwealth has acted as the catalyst forchange to improve the quality, relevance and effectiveness of training. Since 1989, ithas more than doubled federal expenditures on vocational education and training.
National training reform agenda
In 1990, the federal government set out its priorities for training reform in whatbecame known as the national training reform agenda, which aimed to:• substantially increase the level of national investment in training;• improve the quality and flexibility of national training arrangements;• improve the national consistency of training arrangements and the coordination of
the national training effort;• improve access for disadvantaged groups; and• reform arrangements for the recognition of overseas qualifications (Dawkins 1989).
The implementation of a competency-based approach to training, the reform of entry-level training arrangements and the provision of structured training in the workplace

BUREAU OF INDUSTRY ECONOMICS
INDUSTRIAL RELATIONS AND WORKPLACE REFORM 83
have been key elements of the training reforms. Competency-based training focuseson outcomes. Importance is placed on demonstrating what people can do in theworkplace rather than the length of time spent in training or in formal educationinstitutions. Competency standards are adopted as the benchmarks for theaccreditation of training, delivery of training, the registration of providers and therecognition and certification of individuals.
The (federal and state) ministers for vocational education and training have overseenthe agenda. They have cooperated to introduce a number of initiatives for developinga competitive training market and building a client focused culture in the vocationaleducation and training system. Under the new system, the Australian NationalTraining Authority (ANTA) took over responsibility in 1994 for national strategicplanning and the allocation of funds to the states. The government intended theestablishment of a network of industry training advisory bodies to ensure the relevanceof the system to business needs.
Federal, state and territory governments jointly established the National TrainingBoard in 1990. The board included representatives from industry, the ACTU andgovernment. It has facilitated the development and endorsement of nationalcompetency standards developed by industry. The functions of this board have beentransferred to a new Standards and Curriculum Council which operates under ANTA’sframework.
A Senate Employment, Education and Training References Committee review of theANTA commenced mid 1995. Submissions to this review have revealed concern withsome elements of the training agenda (Dwyer 1995). For example, the BCA observedthat ‘ANTA needs to be given the necessary support to ensure that all state/territorybodies act in accordance with the common national agenda’ (BCA 1995a). The reviewis expected to be completed by early 1996.
Training guarantee levy
Finding that half of Australia’s employers made no expenditure on structured training,the federal government sought to introduce a training culture into business. On therecommendation of a report by the National Board of Employment, Education andTraining (ESFC 1989) the government introduced a training guarantee levy. Firmswhich failed to spend a minimum 1.5 per cent of their payroll cost on training weresubject to the levy.
This compulsory levy drew criticism, particularly from business (see, for example,Shann 1989). A study of training by Clare and Johnston (1993) concluded the levywas a blunt instrument for achieving the government’s objectives.
The government in its policy statement of May 1994, Working Nation: Policies andPrograms, suspended the levy for two years. This decision was in response to the

84 MONITORING MICRO REFORM — SETTING THE SCENE
increased training undertaken by firms since 1990. The Prime Minister on announcingthe decision noted:
Now almost all eligible firms are complying with their obligation to train.... Firms throughoutAustralia are investing in training and are far more aware of and committed to training since theintroduction of the Training Guarantee (Keating 1994a, p. 103)
The government has indicated that it will abolish the levy altogether ‘if there is acredible commitment to the creation of these [expected] new training places bybusiness’ (Keating 1994a, p. 103).
Working Nation training initiatives
The Commonwealth Government announced a number of important training initiativesin Working Nation which aim to make Australia’s training system more flexible andresponsive to the requirements of both industry and individuals. The changes reflect arecognition that ‘education and training should be a life long process’ and that ‘skilldevelopment is central to improving productivity and contribution to the performanceand viability of industry’ (Keating 1994a, p. 98).
Reforming Australia’s vocational, educational and training system was an importantelement of the Working Nation program of reform. Initiatives in this area included:
• expanding the number of entry-level training places available;
• the Australian Student Traineeship Foundation which is designed to forge strongerlinks between schools and industry by allowing students to combine school basedstudies with work experience and off-the-job training; and
• funding to improve curriculum quality and further assist in the professionaldevelopment of teachers and trainers.
Another training initiative was the introduction of a national training wage. Prior to itsintroduction many employers where constrained in their options to employ workersunder a traineeship. This was, in part, because training and wages needed to benegotiated on an award by award basis. The new training wage, unlike the training orapprentice wages prescribed under specific industry or occupation awards may applyto adults. Employees taken on under the training wage arrangements undergo aformally recognised training period. At the completion of this period the relevantaward wage applicable to other workers in the industry or occupation applies. InSeptember 1994, the AIRC approved the national training wage interim award. Theterms and conditions of this award have been progressively introduced into all stateand territory industrial jurisdictions. As a consequence awards covering approximately60 per cent of Australia’s workforce include provision for the national training wage.The government provides incentive payments to employers who take on new traineesunder the National Training Wage Award. The level of subsidy depends on factorssuch as the level of training offered and the degree of disadvantage a potential traineefaces in the labour market. For example, higher subsidies are available for the long

BUREAU OF INDUSTRY ECONOMICS
INDUSTRIAL RELATIONS AND WORKPLACE REFORM 85
term unemployed. By the end of June 1995 just under 8 000 trainees had commencedunder the program (DEET 1995).
The new National Employment and Training Taskforce (NETTFORCE) aims to buildemployer commitment to provide employment and training places, particularly foryoung people and the unemployed. NETTFORCE also aims to streamlineadministrative processes and promote Working Nation initiatives. NETTFORCE hasestablished 25 industry training companies to help achieve these goals. In 1994-95,$6.7 million was expended on the program (DEET 1995).
Working Nation also announced a Youth Training Initiative. The initiative providesintensive case management and offers opportunities for training, education and jobplacement for unemployed people under the age of 18 years. The initiative alsoincludes a new income support arrangement designed to encourage young people toparticipate in education and training.
5.3.2 Labour market assistance programs
The Working Nation statement also introduced wide-ranging changes to the socialsecurity system as well as its relationship with the taxation system. An extensive suiteof labour market programs complemented these initiatives. The overall thrust of thegovernment’s approach is to move from spending on income support to more activeprograms to return unemployed people, particularly long term unemployed, to work.
The Job Compact represents the government’s strategy for dealing with this problem.For people who have been on unemployment allowances for more than 18 months, itguarantees a job placement of 6 to 12 months (primarily in the private sector). Thisgives them training and some work experience to keep them in touch with workforceand skill requirements. In turn, the government has placed a ‘reciprocal obligation’ onthe unemployed to actively pursue work or training. Greater penalties now apply forfailure to accept job offers, attend interviews or training courses.
In the year to the end of March 1995, 184 500 Job Compact clients achieved anoutcome which ceased their Commonwealth Employment Service (CES) registrationand unemployment benefits. Around 60 per cent of these found employment (Crean1995a). While it is too early to fully judge the effects of the Working Nationinitiatives, the trend in unemployment since the statement has been encouraging. Inseasonally adjusted terms, the unemployment rate fell from 9.5 per cent in July 1994to 8.3 per cent of the labour force in August 1995. Notwithstanding an increase in theunemployment rate to 8.5 per cent in September 1995, the proportion of long termunemployed in the unemployed labour pool declined from 35.6 per cent in July 1994to 31.1 per cent in September 1995 (ABS 1995b).
In addition, the government adopted a case-mix approach to helping find jobs forthose most at risk of becoming long term unemployed. The government also moved to

86 MONITORING MICRO REFORM — SETTING THE SCENE
develop a market for the provision of services to the unemployed, a functionpreviously dominated by the CES. This initiative allows community groups, privateorganisations and representatives of state and local governments to add depth to themarket for case management. The government has contracted over 270 communityand private case management providers since the initiative was introduced (Crean1995a). Working Nation also strengthened the CES capability with additional humanand capital resources.
Working Nation has led to the restructuring of the interaction of taxation and socialsecurity provisions in dealing with low levels of income. This was in response to the‘poverty trap’ which can arise because:
... wage levels in low skilled occupations are now quite low relative to Social Securitypayments to unemployed families. As a result, in some cases people are disadvantaged if theytake a full time job (Keating 1994a, p. 13).
To reduce this perverse incentive, the government lowered the withdrawal rate forsocial security benefits from a full dollar to 70 cents for each additional dollar earned.Working Nation also extended the income range over which these revised ratesoperate. The Prime Minister expected this to ‘provide an additional incentive for theunemployed to take part time jobs to supplement their income where they cannot findfull time employment’ (Keating 1994a, p. 14).
5.4 Managing for a new workplace cultureAustralia’s history of industry protection, in the past, allowed many Australian firmswith weaknesses in industrial organisation to operate without meeting the standards oftheir more efficient rivals overseas. When barriers to imports fell, internationalcompetition intensified and exposed a myriad of shortcomings in such firms. Theseincluded inefficient work practices and industrial processes and poor quality control.In 1990, a major report on Australian manufacturing noted:
one of the clearest legacies of our protectionist past is the lack of an internationally competitiveculture within the Australian workplace (AMC/PCEK 1990, p. 59).
The report found Australia performed poorly against the world’s best. It urged thedevelopment of a ‘new workplace culture’ emphasising international best practice. Ina later report, the AMC defined best practice as:
the co-operative way in which firms and their employees undertake business activities in allkey processes: leadership, planning, customers, suppliers, community relations, production andsupply of products and services, and the use of benchmarking. These practices, wheneffectively linked together, can be expected to lead to sustainable world-class outcomes inquality and customer service, flexibility, timeliness, innovation, cost and competitiveness(AMC 1994, p. 1).
BUREAU OF INDUSTRY ECONOMICS
INDUSTRIAL RELATIONS AND WORKPLACE REFORM 87
5.4.1 Best practice and Australian firms
In the Prime Minister’s Building a Competitive Australia statement of March 1991,the federal government introduced the Australian Best Practice DemonstrationProgram as part of its microeconomic reform agenda.
The Best Practice Demonstration Program aims to speed up the introduction andspread of new ways of working, based on international best practice. The program, byway of grants to participating firms, funds projects aimed at aspects of workplace bestpractice. Characteristics of best practice identified by the program include: a sharedvision; flatter organisational structures; cooperative and participative industrialrelations; a culture focusing on suppliers and customers; innovation in technologybenchmarking; environmental management; innovative human resource systems;continuous improvement and learning; and networking. The government support is onthe grounds that firms within the program provide a ‘demonstration effect’ and raiseawareness of best practice methods.
Assessing the program for its desired ‘demonstration effect’, an interim evaluationfound it had been effective in raising awareness of best practice in other, unfundedenterprises. Project recipients found that most enterprises had achieved or expectedbenefits from the program. Companies reported improvements in their workforce skilllevels and flexibility, industrial relations and partnerships with suppliers andcustomers. For example, almost 30 per cent of participants reported productivityimprovements had flowed from the best practice project; a further 40 per centexpected productivity gains to happen in the short term (DIR 1993a). A subsequentevaluation of the program’s demonstration component found awareness of the bestpractice program in 1994 was higher than awareness one year earlier. And over 50 percent of enterprises which had adopted business improvement initiatives reportedimprovements in key performance measures (Elliot 1995).
A study by the Australian Manufacturing Council found there is a clear link betweenbest practice and business performance in Australia and New Zealand:
Leaders in the adoption of best practice ... enjoy superior export growth and positive cashflows. These business performance outcomes are separate from the operational outcomes ofcost, quality, flexibility, timeliness, innovation and competitiveness that are an intrinsic part ofthe [best manufacturing practice] model (AMC 1994, p. 9).
The AMC report found Australia’s leader5 firms were almost level with the world’sbest. However, a wide gap separated these leaders from the average and lagger firmssurveyed. Australian (and New Zealand) manufacturers had come a long way in ashort time, the study found. However, it also reported:
5 The AMC defined ‘leaders’ as the top scoring 20 per cent of surveyed firms in each country
against indices of strategy and practice. By contrast, ‘laggers’ are the lowest scoring 20 percent.

88 MONITORING MICRO REFORM — SETTING THE SCENE
A disturbing finding of the study [was] that 35 per cent of Australian [manufacturing] firms ...have not yet embarked on any change program aimed at achieving best practice. Thesemanufacturers, which tend to be small/medium and independent sites, are less likely tobenchmark or export (AMC 1994, p. 19).
A more recent survey of best practice, covering the manufacturing, mining andservices sector6, also found low best practice adoption rates. Around 20 per cent ofresponding firms had commenced a formal best practice program. Large firms weremore likely to have adopted a best practice program than medium and small firms(Elliot 1995).
Best practice is a moving target, since competitors overseas are continuously workingto improve their performance. The AMC (1994) recommended that if Australianfirms, even leaders, are to attain world best standards they must increase theiremphasis on people practices and leadership.
5.4.2 A new paradigm for management?
Perhaps the most important determinant of the culture in an enterprise is itsmanagement. Managers affect the implementation of workplace change and thequality of bargaining outcomes. The OECD has suggested that, in the past, Australianbusiness:
....may not have attracted the best talent. Indeed, a world-class management culture may havebeen slow to develop in Australia, due to the slow opening-up of the economy to worldcompetition (OECD 1994, p. 66).
A recent report commissioned by the Commonwealth Government found Australia’sleadership and management skills lacking in many significant respects (Karpin 1995).The Karpin taskforce considered that:
it is critical for managers to be trained to operate in the new workplace culture, wherenegotiation and agreed productivity improvements are key workplace measures. Thecomplacency engendered by protectionism and outdated and non-productive attitudesencouraged by years of adversarial industrial relations needs to be replaced by more effectivepeople and workplace oriented approaches (Karpin 1995, p. 98).
Despite the various reforms of Australia’s employee relations, Australian managersoverall have not adequately responded to the new business environment. Althoughranking well on some criteria, Australia’s managers were relatively weak in attributessuch as leadership, entrepreneurial skills, adaptability and long term vision (Karpin1995).
The Karpin taskforce advanced a ‘new paradigm of management’ emphasisingflexibility, open communication, strategic and organisational learning and
6 The survey’s coverage did not extend to accommodation cafes and restaurants, Government
administration and defence or Personal and other services industries.

BUREAU OF INDUSTRY ECONOMICS
INDUSTRIAL RELATIONS AND WORKPLACE REFORM 89
empowering the workforce. Managers need to adopt this paradigm in order to succeedin the new business environment brought about by increasing globalisation,widespread technological innovation and pressure on business to customise productsand services (Karpin 1995).The taskforce foresaw some important new challenges forAustralia’s managers and made numerous recommendations to meet these challenges.These recommendations focused on changing management culture through education,demonstration and accreditation.
The government responded to the taskforce recommendations by:• introducing a national training strategy for frontline managers (developed with the
Australian National Training Authority). The strategy will commence in 1996;• developing agreed strategies between education and industry departments in the
state, territory and federal governments to progress enterprise education in schoolsand develop enterprise awareness in the community; and
• providing $1 million in seed funding for the development of course materials to suitthe needs of small business managers for delivery through an open learningapproach (Crean 1995b).
The government rejected the task force recommendation of a move towards full feesfor all post graduate courses as inconsistent with the government policy principles ofequity and access. It has indicated it will develop a more comprehensive response tothe challenges raised by the task force report after feedback from relevantstakeholders. In this context, the BCA has cautioned against excessive governmentinvolvement through, for example, the task force’s recommended new AustralianCouncil for Management Development. Although recognising the need for increasedand more effective management training, the BCA considers that ‘business isaccountable for getting its management house in order: there is no excuse for it tohand the baton over to any committee’ (BCA 1995b).
Drawing on the Karpin report, the government, as part of its recent InnovationStatement, announced it would fund a range of initiatives to help develop best practicemanagers. These initiatives include a mentoring scheme and a range of education andadvisory activities to upgrade management skills
5.5 Concluding commentsAustralia’s industrial relations and vocational training systems have changedconsiderably over the last decade or so. A variety of factors have driven thesechanges, including the challenges created by other microeconomic reforms directed atinternationalising the Australian economy.
The centralised industrial relations system is progressively giving way to a moredecentralised system focused on workplace bargaining. Firms — managers and

90 MONITORING MICRO REFORM — SETTING THE SCENE
workers — now have greater autonomy in organising, training and rewarding theirefforts at the enterprise level than they had a decade ago. Although information onproductivity improvements actually achieved from the industrial relations reformprocess is relatively scant, there is some firm-level evidence to indicate that enterpriseagreements are contributing to increases in productivity.
Nevertheless, critics of the current system remain vocal. Some groups have raisedconcerns that the more decentralised system will undermine the equity principlesestablished under the previous more centralised system. Others have expressedconcerns in relation to the mix of compulsion and voluntarism evident in the currentarrangements. There is disagreement over the appropriate role of unions, the influenceof the centralised framework in the development and approval of enterprise bargaininginitiatives, and the appropriate form of safety net protection.
That said, the changes made to the industrial relations system, in conjunction with thereforms to labour assistance programs and reforms to workplace education andtraining, should encourage greater flexibility in the labour market and the workplace.Despite these changes, there remains a significant proportion of firms that have not yetembarked on a change program which could bring them to the level of internationalbest practice. The ability of management and the workforce to do so will be critical toAustralia’s international competitiveness.

BUREAU OF INDUSTRY ECONOMICS
91
6 Structural change — a broadoverview
Structural change is a term used to refer to the larger and more lasting changesoccurring in the structure of an economy. It is reflected in changes in the relative sizeand characteristics of industries and sectors. Such changes may encompass anindustry’s share of output, value added (or gross domestic product) and employment.Australia’s structural change has, in the main, tended to follow the pattern evident inother developed countries (see BIE 1995f). Structural change is an inevitable processand reflects the influence of a wide range of market and government related factors.Government policies, such as trade liberalisation and other microeconomic reforms,also influence the extent and pace of structural change. According to EPAC, prior tothe mid 1980s, Australia’s insulation from international markets retarded structuralchanges in the economy:
Australia’s economic structure until recently has been relatively sclerotic for a significant partof the post war period...The slow pace of structural change may reflect the existence ofdomestic impediments to the flow of resources between sectors of the economy, and the lack ofadequate exposure through world markets to competitive pressures to improve our productivityand economic growth (EPAC 1993, p. v).
As outlined in chapter 2, since the mid 1980s the Australian government has pursuedpolicies designed to integrate Australia into the world economy. As these policychanges influence the incentives environment faced by firms and industries anacceleration in structural change could be expected. This chapter briefly examines theextent of structural changes since the early 1970s in terms of:• changes in the composition of Australia’s output and employment (section 6.1);• a structural change index (section 6.2);• the internationalisation of the economy (section 6.3); and• the different influences affecting the rate of change in the economy (section 6.4).
A concluding comment is presented in section 6.5.
6.1 Changes in the composition of Australia’s outputand employment
Over the last two decades, there has been considerable change in the composition ofAustralia’s output. Service industries, including infrastructure industries and finance,property and business services, have become increasingly important in the Australianeconomy. This change is in line with the experiences of other developed countries.
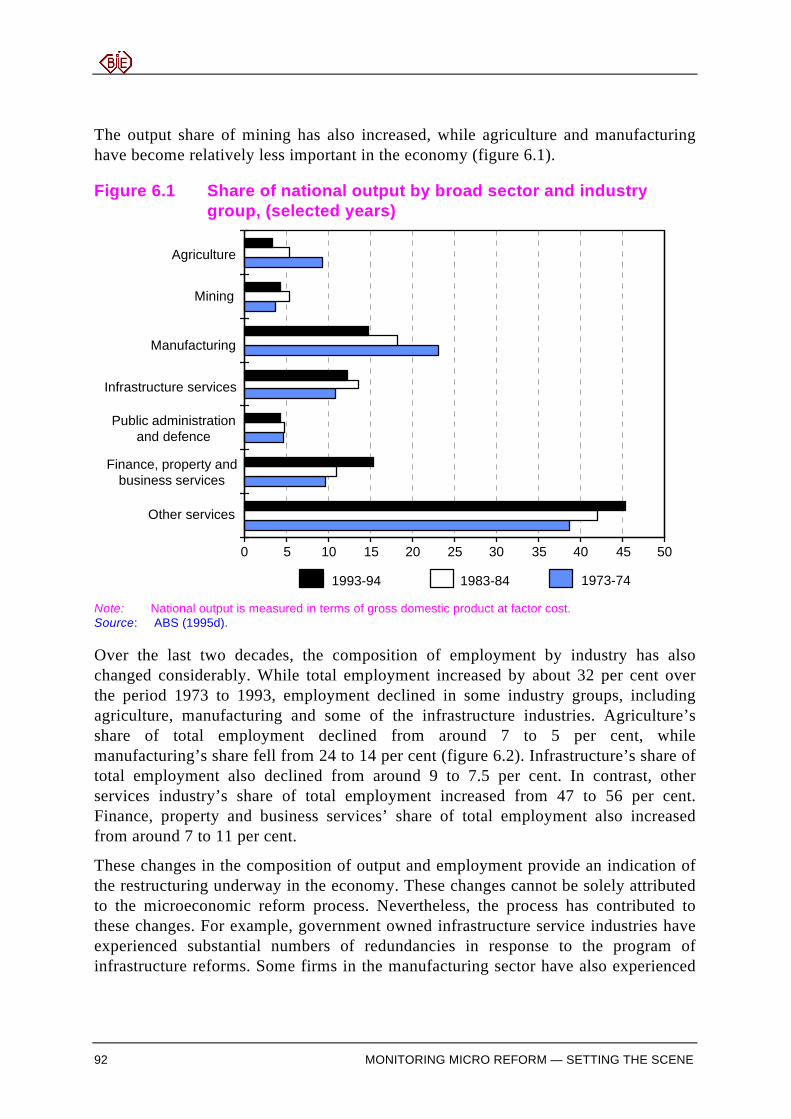
92 MONITORING MICRO REFORM — SETTING THE SCENE
The output share of mining has also increased, while agriculture and manufacturinghave become relatively less important in the economy (figure 6.1).
Figure 6.1 Share of national output by broad sector and industrygroup, (selected years)
0 5 10 15 20 25 30 35 40 45 50
Other services
Finance, property andbusiness services
Public administrationand defence
Infrastructure services
Manufacturing
Mining
Agriculture
1973-741993-94 1983-84
Note: National output is measured in terms of gross domestic product at factor cost.Source: ABS (1995d).
Over the last two decades, the composition of employment by industry has alsochanged considerably. While total employment increased by about 32 per cent overthe period 1973 to 1993, employment declined in some industry groups, includingagriculture, manufacturing and some of the infrastructure industries. Agriculture’sshare of total employment declined from around 7 to 5 per cent, whilemanufacturing’s share fell from 24 to 14 per cent (figure 6.2). Infrastructure’s share oftotal employment also declined from around 9 to 7.5 per cent. In contrast, otherservices industry’s share of total employment increased from 47 to 56 per cent.Finance, property and business services’ share of total employment also increasedfrom around 7 to 11 per cent.
These changes in the composition of output and employment provide an indication ofthe restructuring underway in the economy. These changes cannot be solely attributedto the microeconomic reform process. Nevertheless, the process has contributed tothese changes. For example, government owned infrastructure service industries haveexperienced substantial numbers of redundancies in response to the program ofinfrastructure reforms. Some firms in the manufacturing sector have also experienced

BUREAU OF INDUSTRY ECONOMICS
STRUCTURAL CHANGE — A BROAD OVERVIEW 93
redundancies, plant closures and even closures in response to phased reductions inassistance. However, any negative effects are likely to have been more pronounced inthe industries experiencing substantial reductions in assistance. Indeed, the number ofpersons employed in the highly assisted industries, such as textiles, clothing andfootwear and transport equipment, has fallen substantially over the last decade.
Figure 6.2 Sector and broad industry shares of total employment,(selected years)
0 10 20 30 40 50 60
Other services
Public administration anddefence
Finance, property andbusiness services
Infrastructure services
Manufacturing
Mining
Agriculture
August 1993 August 1983 August 1973
Source: ABS (1995f).
While we should not discount the costs of the reform process, it is also important toconsider ‘what might have occurred if the economy had not experienced the reformprogram?’. Answering such a hypothetical question is not easy. However, we do knowthat Australia has not embarked on this program of reform in isolation. For example,Henderson (1995) has recently drawn attention to the programs of reform underway ina number of our competing economies. In the absence of reform, it is likely thatAustralia would have experienced substantial structural change and its associatedcosts if our national competitiveness, relative to other economies, declined as ourcompetitors pushed forward their reform agendas.
One thing we do know is that the decline in employment experienced by Australia’smore highly assisted industries is not a recent phenomenon. Despite the high barriers
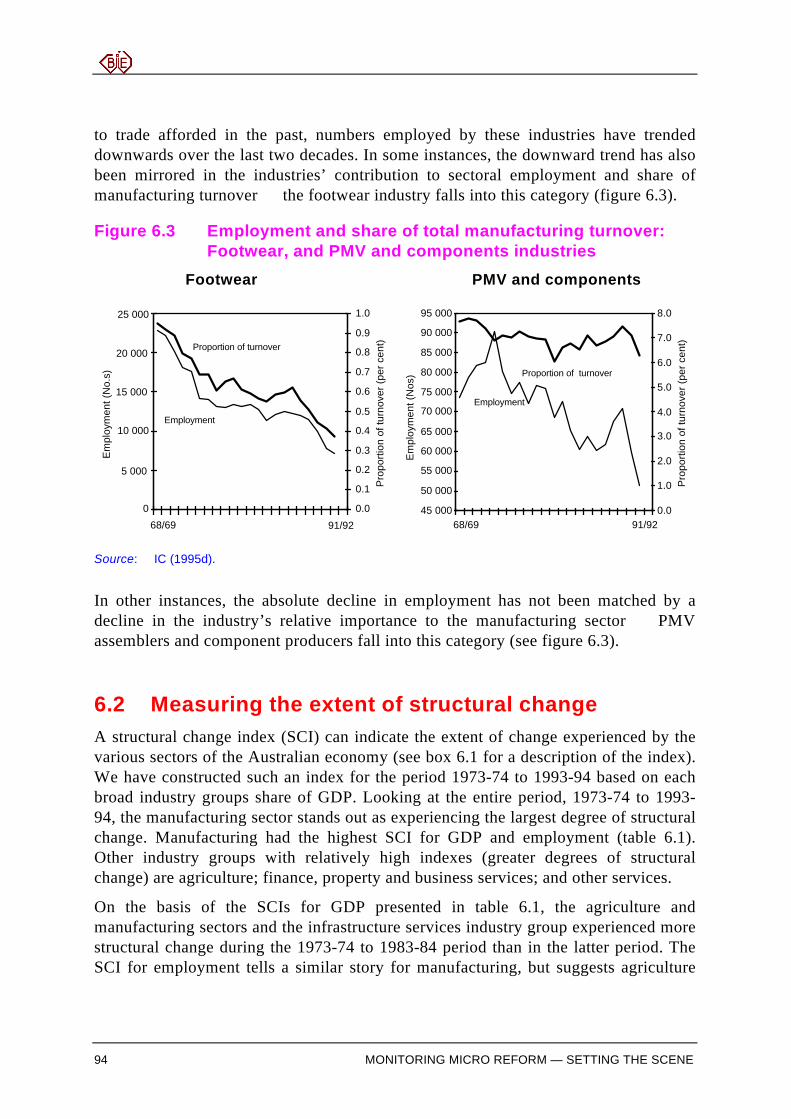
94 MONITORING MICRO REFORM — SETTING THE SCENE
to trade afforded in the past, numbers employed by these industries have trendeddownwards over the last two decades. In some instances, the downward trend has alsobeen mirrored in the industries’ contribution to sectoral employment and share ofmanufacturing turnover the footwear industry falls into this category (figure 6.3).
Figure 6.3 Employment and share of total manufacturing turnover:Footwear, and PMV and components industries
Footwear PMV and components
45 000
50 000
55 000
60 000
65 000
70 000
75 000
80 000
85 000
90 000
95 000
68/69
Em
ploy
men
t (N
os)
0.0
1.0
2.0
3.0
4.0
5.0
6.0
7.0
8.0
Pro
porti
on o
f tur
nove
r (pe
r cen
t)
Employment
Proportion of turnover
Em
ploy
men
t (N
o.s)
Pro
porti
on o
f tur
nove
r (pe
r cen
t)
0.0
0.1
0.2
0.3
0.4
0.5
0.6
0.7
0.8
0.9
1.0
0
5 000
10 000
15 000
20 000
25 000
68/69
Employment
Proportion of turnover
91/92 91/92
Source: IC (1995d).
In other instances, the absolute decline in employment has not been matched by adecline in the industry’s relative importance to the manufacturing sector PMVassemblers and component producers fall into this category (see figure 6.3).
6.2 Measuring the extent of structural changeA structural change index (SCI) can indicate the extent of change experienced by thevarious sectors of the Australian economy (see box 6.1 for a description of the index).We have constructed such an index for the period 1973-74 to 1993-94 based on eachbroad industry groups share of GDP. Looking at the entire period, 1973-74 to 1993-94, the manufacturing sector stands out as experiencing the largest degree of structuralchange. Manufacturing had the highest SCI for GDP and employment (table 6.1).Other industry groups with relatively high indexes (greater degrees of structuralchange) are agriculture; finance, property and business services; and other services.
On the basis of the SCIs for GDP presented in table 6.1, the agriculture andmanufacturing sectors and the infrastructure services industry group experienced morestructural change during the 1973-74 to 1983-84 period than in the latter period. TheSCI for employment tells a similar story for manufacturing, but suggests agriculture

BUREAU OF INDUSTRY ECONOMICS
STRUCTURAL CHANGE — A BROAD OVERVIEW 95
and infrastructure services experienced more employment change in the period 1983-84 to 1993-94. On the basis of the GDP SCIs, the finance, property and businessservices industry group experienced greater change during the 1983-84 to 1993-94period. The degree of structural change for other services industry group, as measuredby the SCIs for GDP, was similar over both periods. The other services industrygroup, however, experienced substantially greater structural change, as measured bythe employment SCIs, in the 1983-84 to 1993-94 period.
Box 6.1 Measuring structural change
A standard technique for measuring the rate of structural change is to construct structuralchange indexes (SCIs) for each sector and/or industry group of the economy over a uniformtime period. The SCI is calculated by taking half the sum of the absolute value of the changein each sector’s or industry’s share of, for example, GDP, turnover or employment. The SCIis bounded between zero and 100, with zero representing no structural change and 100indicating a complete reversal of structure. For example, significant movements in the shareof GDP of a particular sector (either up or down) would result in a large number for theindex. On the other hand, a sector that has maintained its share of GDP or where only minorchanges have occurred would have a small index number.
Table 6.1 Structural change in Australia, 1973-74 to 1993-94
Sector and industry groups Structural change index
1973-74 to 1993-94 1973-74 to 1983-84 1983-84 to 1993-94GDP Employment GDP Employment GDP Employment
Agriculture 2.96 1.03 2.02 0.40 0.94 0.63Mining 0.32 0.01 0.80 0.16 0.48 0.16Manufacturing 4.18 4.90 2.51 2.88 1.67 2.02Infrastructure services 0.73 0.88 1.37 0.49 0.64 1.37Public administration anddefence
0.08 0.61 0.07 0.57 0.15 0.04
Finance, property and businessservices
2.80 2.15 0.61 1.15 2.20 1.00
Other services 3.36 4.12 1.68 0.97 1.69 3.15
Source: BIE estimates.
The SCI estimates suggest that structural change for the manufacturing sector wasmore significant, in terms of changes in GDP and employment, during the 1973-74 to1983-84 period than in the 1983-84 to 1993-94 period. This finding tends to be at oddswith the widely held view that structural change and the internationalisation of theAustralian economy gathered pace during the 1980s. Pressures for structural changehave generally been thought to be closely associated with the phasing of tariffreductions for manufacturing industry and the deregulation of financial markets.

96 MONITORING MICRO REFORM — SETTING THE SCENE
The level of aggregation of the data used to construct a SCI can sometimes mask therate of change that has actually occurred (see BIE 1995f). Indexes calculated on thebasis of more disaggregated manufacturing data indicate that substantial structuralchange occurred during the 1980’s and early 1990s, particularly in terms ofemployment (see box 6.2). Unfortunately, detailed disaggregated data are not readilyavailable for most sectors other than manufacturing.
Box 6.2 Manufacturing sector change at a more disaggregated levelSCIs are calculated using disaggregated manufacturing data based on 142 industrycategories. The years chosen for this analysis differ from those chosen for the economy-wide analysis presented in table 6.1. This is because data for 1993-94 is not available at thelevel of disaggregation presented here. Similarly, turnover and sales data have been usedrather than value added because of data availability.
Structural change index for share of manufacturing sector
Turnover Sales Employment
1971-72 to 1991-92 16.07 15.73 17.441971-72 to 1981-82 9.81 9.74 8.621981-82 to 1991-92 10.30 10.57 12.341981-82 to 1986-87 6.69 6.69 6.971986-87 to 1991-92 6.33 6.38 7.20
The indexes for turnover and sales suggest that structural change was relatively even duringthe periods 1971-72 to 1981-82 and 1981-82 to 1991-92, but slightly greater in the latterperiod. The SCI for employment suggests that substantially greater structural changeoccurred during the 1981-82 to 1991-92 period with an index number of just over 12compared with 9 during 1971-72 to 1981-82. These data would appear to support the viewthat structural change (at least in the manufacturing sector) has gained momentum duringthe 1980s. When the 1981-82 to 1991-92 period is divided into two sub-time periods (1981-82 to 1986-87 and 1986-87 to 1991-92) the indexes for turnover, sales and employment aresubstantially the same indicating that structural change has been occurring at a reasonablyeven rate during the 1980s.While the SCI for manufacturing gives an indication of when change has occurred, thischange can be the result of some industries share’s of manufacturing turnover, sales andemployment declining at the same time as others industries share’s are expanding. A closerexamination of the manufacturing industry data used to calculate the SCI shows thatindustry groups such as: motor vehicles and components; other transport equipment;textiles, clothing and footwear; appliances and electrical equipment; industrial machineryand equipment; and other fabricated metal products have experienced a decline in theirshare of manufacturing turnover, sales and employment. Conversely, industries including:beverages and malt; printing and allied industries; other chemicals; basic non-ferrousmetals; and plastics and related products have all increased their shares.

BUREAU OF INDUSTRY ECONOMICS
STRUCTURAL CHANGE — A BROAD OVERVIEW 97
6.3 Increased internationalisation of the economyIncreased internationalisation — the extent to which Australian firms are developingglobal outlooks and strategies, and are sourcing out of, or selling into various overseaslocations — is seen by many commentators as a key driver of much of the structuralchange (see for example, Ergas and Wright 1994). As many of Australia’smicroeconomic reforms have been designed to obtain gains (static and dynamic) frominternationalising the economy, it is also a partial indicator of their success orotherwise.
The ratio of gross trade (goods and services exports plus imports) to GDP provides auseful summary measure of trade intensity for the Australian economy. This ratio isalso used as a measure of openness to international trade. Australia’s trade intensityhas increased significantly over the past two decades. In 1973-74, the volume of tradewas equivalent to about 28 per cent of GDP. This increased to about 30 per cent in1983-84 and around 38 per cent in 1993-94 (figure 6.4).
The increase in Australia’s trade intensity was achieved by strong growth in both thevolume of exports and imports. In 1973-74 imports accounted for 14.2 per cent ofGDP, rising to 19.1 per cent in 1993-94. Similarly, exports (goods and services) as aproportion of GDP increased from 14.2 per cent in 1973-74 to 18.8 per cent in1993-94.
Figure 6.4 Australia’s trade intensity, 1973-74 to 1993-94
24
26
28
30
32
34
36
38
73/74 83/84 93/94
Sources: ABS (1995a) and Econdata.
Despite this increased exposure to the international economy, Australia’s tradeintensity is lower than most industrial economies. A study examining the trade

98 MONITORING MICRO REFORM — SETTING THE SCENE
intensity of 56 countries found the gap between Australian and average OECD tradeintensity remains large ‘being equivalent to almost 30 per cent of 1990 GDP’ (Ergasand Wright 1994, p. 56). The authors found, however, that while Australia’s tradeintensity increased in recent years, the trade intensity of the OECD (as a whole) and alarge group of other countries appeared to have plateaued (Ergas and Wright 1994).
There are a number of factors which influence a country’s trade intensity. Theseinclude its overall size (as measured by GDP, for example), its location relative topotential markets and natural and artificial barriers to trade. As documented in chapter3, Australia has experienced substantial reductions in its artificial barriers to imports.In addition, countries in close proximity to Australia are becoming increasingindustrialised. In the process they offer new market opportunities for our exports aswell as greater competition for import competing industries. Australia’s tradecomposition reflects this, with a substantial proportion of trade moving our from themore traditional markets in Europe and North America to countries in the region (seeBIE 1994e). This trend could accelerate with the introduction of APEC free tradeinitiatives.
While there has been a significant increase in Australia’s trade intensity over the last20 years, its trade potential is hindered by the relatively high transport costs associatedwith being an island continent some distance from major world markets. According toestimates by Ergas and Wright (1994), this geographic isolation from centers of worldproduction now accounts for a sizeable proportion of Australia’s low trade intensity,relative to the OECD average. Allowing for this geographic isolation, Australia’s tradeintensity in 1990, at least, was not exceptionally different to other industrial countries.
6.4 Isolating the factors contributing to structuralchange
Isolating the factors contributing to a long-term phenomenon like structural change isdifficult. The background ‘noise’ of cyclical fluctuations in the economy complicatesthe analysis. A recent study by EPAC (1993) has endeavoured to identify the majorfactors influencing structural change over a five year period, 1986-87 to 1990-91.While this period is relatively short, the findings illustrate the diverse influenceswhich can lead to structural change.
EPAC concludes that a wide range of factors contributed to structural change inAustralia over the five year period. However, change was largely driven bydevelopments in world trading conditions which improved Australia’s terms of tradeand had a positive effect on output. (There has been a slight deterioration inAustralia’s terms of trade since this time, see chapter 3). However, this positive outputeffect was offset by a reduction in the economy’s overall level of productivity. EPACconcludes that the overall fall in productivity levels was largely a reflection of the

BUREAU OF INDUSTRY ECONOMICS
STRUCTURAL CHANGE — A BROAD OVERVIEW 99
recession, which began in 1990, and the over-investment in property, which occurredin the mid to late 1980s. EPAC did, however, find strong growth in productivity insome sectors, such as electricity and communications, which were subject tosignificant microeconomic reforms.
Tariff reductions, according to EPAC, contributed positively, albeit to a small extent,to income growth over the period. EPAC found that no industry was particularlyadversely affected by assistance reductions, and the effects of other sources ofstructural change were much more significant. The results indicated that tariff reformcontributed in only a very minor way to employment losses in the short term. Theseresults, however, do not capture the full extent of the reductions in tariff assistance(tariff reductions announced in March 1991 are not included in the period).
6.5 Concluding commentsOver the last two decades Australia has experienced considerable structural change interms of the composition of both output and employment. Over the period, serviceindustries have become increasingly important in the economy, while agriculture andmanufacturing have become relatively less important.
A structural change index, at the broad industry group level, indicates some sectoraldifferences in the degree of change experienced over the last two decades. Foragriculture and manufacturing more structural change, measured in terms of GDP,occurred between 1973-74 to 1983-84, than between 1983-84 to 1993-94. On theother hand, more change appears to have occurred during 1983-84 to 1993-94 forpublic administration and defence, finance, property and business services industrygroups.
Using more disaggregated data, we found that substantial structural change occurredin the manufacturing sector during the 1980s and early 1990s. This finding is moreconsistent with the widely held view that structural change and internationalisation ofthe Australian economy gathered pace in the 1980s.
Australia’s trade intensity has also increased significantly over the last two decades.The volume of trade as a proportion of GDP increased from about 28 per cent in 1973-74 to around 38 per cent in 1993-94. While the trade intensity of the Australianeconomy remains well below that of many other industrial economies the gap hasdiminished in recent years. Much of the remaining gap appears to reflect Australia’srelative isolation from centres of world production.
Structural change reflects the influence of a wide range of both market andgovernment related factors. Isolating the influence of microeconomic reform onstructural change is therefore difficult, and complicated by factors such as cyclicalfluctuations in the economy. Using a general equilibrium model, a recent EPAC studyattempted to identify the major factors influencing structural change over the five year

100 MONITORING MICRO REFORM — SETTING THE SCENE
period 1986-87 to 1990-91. It found that tariff reductions had only a relatively smallimpact on structural change. These results, however, do not capture the full extent ofthe tariff program or many of the infrastructure reforms. (In the period covered by thestudy, the tariff reductions announced in March 1991 had not commenced and manyreforms to infrastructure had only just begun.)
A number of other studies, using both general equilibrium analysis and partial(industry) studies have attempted to measure the impact of microeconomic reform onthe economy and on individual firms and industries. These models attempt to isolatethe impact of microeconomic reform from other sources of on-going structural changein the economy (such as changes in international markets and technology). Chapter 7looks at the findings of a number of general equilibrium models on the effects ofmicroeconomic reform on the economy and sectors within the economy. The chapteralso explores how microeconomic reform (in terms of reductions in assistance, pricesand productivity) might impact on individual industries and firms.

BUREAU OF INDUSTRY ECONOMICS
101
7 Microeconomic reform: somepotential impacts
Studies quantifying the potential benefits of microeconomic reform at the economy-wide level have played an important part in the evolution and ultimate acceptance ofthe microeconomic reform process in Australia. Such analysis has proven useful inhelping to identify the potential magnitude of the benefits and main processes bywhich these benefits emerge over time. Nevertheless, many view the models and themethodologies used as black boxes. Often the mechanisms and assumptions used toderive the results are highly stylised. Beyond this, these studies provide littleinformation about the adjustment process and the differential impacts of reform.
By their very nature, general equilibrium models cannot provide clear-cut indicationsof the impact of microeconomic reform at the detailed industry and firm level. Theprimary purpose of the BIE’s Monitoring Micro Reform project is to help fill thisinformation gap. The study aims to provide pointers to the main drivers of the impactsof recent reforms on different industries and firms within them. The project is alsolikely to highlight important inter-relationships between reforms as well as areaswhere further reforms could complement existing ones.
This chapter examines how microeconomic reform might impact on individualindustries and firms, drawing on insights provided by general equilibrium as well aspartial studies of the reform process. Section 7.1 provides a backdrop to thediscussion. It briefly examines the findings of a number of general equilibrium studieswhich identify various sectors and industries which may gain (or lose) from themicroeconomic reform process. Some limitations of these studies are also highlighted.Section 7.2 draws on a conceptual framework and illustrative examples to explore howmicroeconomic reform might ‘bite’ at the industry/firm level. The section alsodiscusses the importance of competition and prices in the reform process. It considersthe response options available to individual firms and the impact on the economy ofimproved productivity. Section 7.3 presents some concluding comments.
7.1 General equilibrium analysisA general equilibrium model treats the economy as a system of inter-related industries.These models attempt to capture the interdependencies that arise between industriesfrom the purchase of each other’s outputs in the process of producing final productsfor sale on the domestic and export markets. They also try to capture the industrylinkages that arise from competition for available resources, including labour andcapital.
102 MONITORING MICRO REFORM — SETTING THE SCENE
General equilibrium models can be used to provide information on the economy-wideeffects of microeconomic reform. They provide an insight into the inter-sectoralimpacts of a policy-induced change. An important assumption behind generalequilibrium models is that when the Australian economy experiences a ‘shock’, suchas the current program of microeconomic reform, it will return to an equilibrium state.In this new equilibrium, demand equals supply in all markets. This new equilibriumposition, for employment, gross domestic product etc., is notionally compared to theequilibrium ‘baseline’ state that would have occurred in the absence of the ‘shock’.1
General equilibrium modelling can provide an indication of the impacts of reform(positive and negative) on various sectors and broad industry groups. By contrast,partial equilibrium analysis of the impact of a reform on an individual industry’ssupply and demand conditions does not take into account inter-industry relationships.Partial analysis typically does not take into account how an industry-specific reformmight indirectly affect other industries. These indirect effects can feed back to theindustry experiencing the reform (through changes in income, demand etc.) andmodify the outcome for the industry undergoing the reform.
Economy-wide studies of microeconomic reform have used a variety of generalequilibrium models, including versions of the ORANI and Access/Murphy models ofthe Australian economy.2 As discussed in appendix 4, the detail and coverage ofreforms included in various model scenarios have varied as the microeconomic reformagenda developed. Early modelling exercises focused on the impact of tradeliberalisation. Since the late 1980s, these exercises have progressively included a muchwider range of reforms. The most recent modelling exercises (for example,HILORANI) exclude trade liberalisation and concentrate on reforms designed toencourage competition.
Although the actual reform packages included have varied, they have typically coveredreforms to infrastructure industries (such as transport, communications and energyutilities), various other government activities and, more recently, reforms to increasecompetition. The estimated impacts of microeconomic reform emerging from thesemodels are determined by a number of factors. A key factor is the size of the ‘shock’introduced into the model to account for the reform. The size of this ‘shock’ will begoverned by:
• the assumed change in relative prices arising from the reform; and/or
• in the case of a productivity change, the associated change in relative prices arisingfrom a change in the technical relationships between outputs and inputs.
1 In some modelling exercises the assumption that all markets are in equilibrium can be
modified. For example, simulations may allow for disequilibrium in labour markets in order torepresent unemployment.
2 For a detailed explanation of the technical features of these models see IAC (1987b) and Filmerand Dao (1994).

BUREAU OF INDUSTRY ECONOMICS
MICROECONOMIC REFORM: SOME POTENTIAL IMPACTS 103
Other key factors affecting the estimated impacts include:
• the relative economic significance of the industries directly affected by the reform;
• the significance of inter-industry linkages between the directly affected industriesand the rest of the economy, net of leakages to imports;
• the responsiveness of demand and supply conditions in affected product and inputmarkets to the assumed changes in relative prices;
• assumptions made in relation to how product price changes feed through into wagelevels; and
• the mechanism by which productivity gains are distributed through the economy.
7.1.1 Where can we expect to see gains?
A key conclusion emerging from these general equilibrium studies of microeconomicreform is that the estimated effects are significantly positive and widespread.Moreover, the gains are not simply one-off benefits for a single year, but rather are on-going in nature. Table 7.1 summarises the results of some of the major generalequilibrium studies which have examined the impact of microeconomic reform on theAustralian economy in recent years. Appendix 4 presents a more detailed overview ofthese studies, including information on the reforms covered.
The studies project that microeconomic reforms increase Australia’s gross domesticproduct (GDP) and a range of other macroeconomic variables. However, themagnitude of the increases vary. For example, the projected permanent increase inGDP, for the modelling studies summarised in table 7.1, ranges from 5.5 to 20.5 percent. These variations are due to a number of factors including differences in the typeof reforms covered, the time frames used, the base lines utilised to measure thechange, and the assumptions incorporated in the modelling process.
Each of the studies indicates all sectors gain from the reforms they analyse. Overall,the impact of microeconomic reform at the sectoral and industry level tends to bepositive for reforms leading to productivity gains. However, those reforms whichincrease foreign competition or involve changes to domestic pricing policies, lead to amixture of positive and negative effects at the industry level.
The mining sector stands out as being a major beneficiary of the reform process. Forexample, in IC (1990) the mining sector captured by far the largest benefit from thereforms covered in the analysis. One explanation for the substantial growth in themining sector is that virtually all reforms result in cost reductions for this exportoriented sector (IC 1994). Some early microeconomic reform simulations, particularlythose using ORANI, did not realistically constrain the mining sector’s potential toincrease exports in response to a change in production costs (see Yetton, Davis andSwan (1992)). The introduction of a constraint in the form of lower export supply

104 MONITORING MICRO REFORM — SETTING THE SCENE
elasticities in more recent models, (such as IC (1990)), has lessened the estimatedgains. Nevertheless, in most cases, particularly with ORANI modelling, mining hasremained the major beneficiary of microeconomic reform.
Table 7.1 Some general equilibrium models projected effects ofmicroeconomic reformsa
IC ‘90 BIEb ‘90 EPACc ‘94 BCA ‘94 IC ‘95
Time horizon of projections Long run(10+ yrs)
Medium run (7 yrs)
Long run(10+ yrs)
Long run(20+ yrs)
Long run(10+ yrs)
Starting point 1988-89 1988-89 1994 1994 1994ORANI ORANI-F AEM-CGE Murphy) HILORANI
Macroeconomic aggregates
Real Gross Domestic Product 6.5 9.5 12.7 20.5 5.5Real consumption 5.4 0.3 14.4 na 3.4Export volume growth 17.6 11.7 na na 15.4Import volume growth 11.6 11.2 na na 1.2Aggregate capital stock 7.2 7.5 na na 5.7Sectoral changes
OutputAgriculture 2.8 6.8 12.3 d 22.0 d 4.4Mining 32.6 22.4 12.2 d 35.5 d 18.5Manufacturing 2.7 15.1 13.6 d 29.0 d 5.4Services 4.4 8.8 12.5 d 16.6 d 3.4
Notes: a All results are expressed as percentage changes. Each column compares a reform scenario with abaseline scenario at some point in the future. b The BIE analysis examined a number of reform andmacroeconomic scenarios. The scenario reported here compares a level playing field reform agendato a baseline scenario that includes planned reforms as at 1988-89, but no further reforms. c Thiscompares the estimates of a conservative reform scenario to an end point that excludes announcedbut unrealised tariff reforms. d Output in value-added (GDP) terms. In reform scenarios, value-addedgains are usually slightly larger than corresponding output gains (e.g. HILORANI projected GDPgains of 5.5 per cent and output gains of 4.2 per cent).
Sources: IC (1990), BIE (1990), Filmer and Dao (EPAC 1994 in this table), BIE estimates derived from Filmerand Dao (1994), IC (1995b).
Unlike mining, the estimated overall positive outcomes for the manufacturing andagricultural sectors are made up of quite divergent results for individual industrieswithin these sectors. Activity within these sectors tends to contract in the more highlyassisted industries, but expands for the least assisted industries (see appendix 4 formore details). Recent modelling exercises (such as IC (1995e)) have included a widerrange of reforms and the results suggest that most activities gain from the reformprocess.
7.1.2 General equilibrium modelling: some limitations
All models, including general equilibrium models, rely on simplifying assumptions.These assumptions have the potential to hide some of the more dynamic responses wemight expect to see arising from the reform process. The models, for example,

BUREAU OF INDUSTRY ECONOMICS
MICROECONOMIC REFORM: SOME POTENTIAL IMPACTS 105
generally assume industries are operating at their optimal productivity levels (i.e. allfirms within industries are assumed to be technically efficient) because firms areassumed to maximise profits (minimise costs). As a consequence, gains arising fromthese models tend to rely on changes in the way resources are allocated within theeconomy. To some extent, the studies have modified this assumption by allowing forproductivity improvements expected to arise from the reform process.
These productivity improvements are usually simulated by a reduction in the amountof labour and/or capital used to produce a given level of output. They are often basedon productivity improvement estimates associated with partial studies of a specificreform, for example, rail reform. The results that general equilibrium models generateare highly dependent on the ‘shocks’ that are imposed. Thus the ‘quality’ of the partialstudies used to estimate the magnitude of the ‘shock’ plays a key role in determiningthe ultimate impact of various modelled microeconomic reforms. For some reforms,there have been extensive partial studies undertaken by the BIE and IC, amongstothers, to estimate the likely change in productivity as a result of reforms. Theseinclude energy generation and distribution, rail transport, aviation, coastal shipping,telecommunications and the waterfront. However, in areas where there has been littleor no research, modellers are forced to use the available information and develop a‘best guess’ of the probable improvement or change in specifying the appropriate‘shock’.
Beyond this, general equilibrium models do not deal with impacts at the firm level,such as the sources and causes of differences in inter-firm performances. The studiesalso tend to focus on the gross gains associated with a program of reform. This isparticularly relevant for the static models which compare one equilibrium point withanother. In these cases, the up-front or adjustment costs associated with a reformprogram are not identified. These costs can include labour redundancies, retraining andrelocation costs, and capital losses. These costs, or even the threat of such costs, canhave important effects on the way economic players react to the process of reform.Some other limitations applying to these models are briefly outlined in appendix 4.
The following section examines, in a stylised way, how microeconomic reform mayimpact at the firm level and highlights the importance of differential responses toreform that cannot be adequately captured in a general equilibrium framework. Thesection draws on insights provided by industry specific (partial equilibrium) studies.
7.2 How microeconomic reform might affect firmsThe chronology of reforms outlined in chapter 2 highlights the extensive nature ofAustralia’s reform process. Most areas of the economy have been affected by theprogram of reform, although the extent and pace of particular reforms has varied.Individual reforms have not been undertaken in isolation. In some instances, oneparticular reform may, to a lesser or greater extent, magnify the impact of another

106 MONITORING MICRO REFORM — SETTING THE SCENE
seemingly unrelated reform. In other cases, different reforms may have countervailinginfluences. This is where the general equilibrium studies, referred to above, come intotheir own. Although the net impact of core areas of a number of reforms can beestimated relatively easily using these models, the analysis does mask many aspects ofindustry and firm level impacts.
Increasing competition has been a central focus of the microeconomic reform agendain Australia. In its simplest form, this is highlighted by the phased reduction of tariffsand other forms of industry assistance. These reductions have led to increases in thelevel of international competition faced by import-competing firms. On the domesticfront, Hilmer and related reforms have the potential to significantly increase the levelof competition in the non-traded sector of the economy. Of particular relevance hereare the infrastructure services provided by government business enterprises (GBEs).
Microeconomic reform has direct and indirect influences on the competitiveenvironment faced by firms and industries. According to Porter (1990), thisenvironment is shaped by five key forces:(1) the threat of new entrants;(2) the threat of substitute products or services;(3) the bargaining power of suppliers;(4) the bargaining power of buyers; and(5) the rivalry among existing competitors (see figure 7.1).
These factors affect the revenue earned by firms as well as the costs incurred forintermediate inputs and capital.
Microeconomic reforms of the type applied in Australia combine to produce direct aswell as indirect changes in firms’ unit revenues and costs. They have additionalimpacts through their effects on:
• the intensity of the threat of competition from substitute products or services(trade liberalisation and reductions in industry assistance fall into this category);
• the potential for new entrants and rivalry among existing competitors(infrastructure and competition reforms fall into this category); and
• the bargaining power of suppliers and buyers (statutory marketing, industrialrelations and competition reforms fall into this category).
The intensity of competitive pressure can influence the way firms use their resources.For example, managers and firm owners in an industry with only limited competitionmay choose an ‘easy life’. For example, they may not negotiate the hardest bargainswith their suppliers and employees and may fail to implement other measures tominimise their costs of production (Leibenstein 1966). The increased competition

BUREAU OF INDUSTRY ECONOMICS
MICROECONOMIC REFORM: SOME POTENTIAL IMPACTS 107
Figure 7.1 Forces determining industry competition
THREAT OF NEW ENTRANTS
BARGAINING POWER RIVALRY AMONG BARGAINING POWER OF SUPPLIERS EXISTING COMPETITORS OF BUYERS
THREAT OF SUBSTITUTEPRODUCTS OR SERVICES
Source : Porter (1990).
arising from the reform process can countervail this. Stronger competitive pressurescan impose threats on the continued existence of firms and encourage them to pursuecontinuous improvement strategies. As a result, firms are stimulated to seek higherlevels of productivity, develop innovative products and improve the ways in whichthey supply their customers. This improves the ability of the economy to sustainhigher real wages and returns to firm owners and thus achieve a higher standard ofliving for Australians.
That said, we should be mindful that Australia’s reform process has not gone on inisolation. Our international competitors are also striving to reduce costs and increaseproductivity. This point is starkly highlighted by the BIE’s international benchmarkingwork. This work has identified sizeable performance gaps applying to ourinfrastructure services industries relative to world best practice. The BIE’s workhighlights that being competitive is about the continuous upgrading of productiveperformance, as our international competitors are not standing still.
In the sub-sections that follow we consider how microeconomic reform encouragesdifferent firms to respond to changes in their operating environment. The treatmentcovers direct as well as indirect effects of reform and, where relevant, factorsinfluencing the distribution of the effects of reforms between producers, workers, andusers and consumers are addressed. This discussion is generalised, although use ismade of examples to illustrate some actual and expected firm responses. Initially, weconsider how firms in assisted industries, previously sheltered from competition, mightrespond to reductions in assistance (section 7.2.1). Of course, the reform process hasbeen much broader than this and section 7.2.2 considers how reforms affect the wide
108 MONITORING MICRO REFORM — SETTING THE SCENE
range of prices facing firms. The section comments on how these price changes affectfirms’ decision making and competitiveness. Section 7.2.3 discusses howmicroeconomic reform and, in particular, industrial relations and workplace reformmight enable firms and industries to increase their productivity.
7.2.1 Assistance reductions and assisted firms
Governments have used a variety of measures to provide assistance to industry. Theseinclude tariffs, quantitative restrictions, production bounties, export facilitationarrangements and statutory marketing arrangements. However, tariffs have been themajor instrument used. The reduction in tariffs has been a key component ofAustralia’s program of trade liberalisation (see chapter 3).
In general, tariffs raise the price of the imported good in the domestic market. Theyallow domestic firms to charge a higher price for their products. At this higher price,domestic firms increase their output and supply a larger share of the domestic marketthan would otherwise be the case. The impact of a tariff reduction on importcompeting firms will depend on the nature of competitive pressures these firms face,as well as the capacity of individual firms to compete effectively. These pressures willin part be determined by the type of product they produce. At one extreme, firms mayproduce a standardised or homogenous product. For such products, competition isessentially price driven firms are effectively price takers. At the other extreme,firms may produce a product which is highly differentiated from another firm’sproduct. For these products, competition occurs on the basis of the price and non-priceattributes of goods. The impact will also be affected by the nature of the market inwhich they compete. The number of firms competing in the market, for example, canhave implications for the outcome.
Box 7.1 illustrates the first round impact of tariff reductions for import competingindustries and firms producing standardised or homogenous products. Firms are likelyto experience an increase in the level of competition from foreign firms as the price ofcompeting imports falls, reflecting a cut in the tariff. Assuming a competitive marketand a relatively homogeneous product, any attempt by domestic firms to charge a pricehigher than the landed price of the import would result in loss of market share. Thiswill occur because another producer’s product is likely to be a very close substitute.
If all firms in the industry are price takers, the lower market price will diminish theirrevenue streams and, thereby, profitability. If these firms purchase their inputs incompetitive markets, there may be scope to access inputs at lesser prices offsettingsome of the reduction in revenue.
Those firms that were marginally profitable prior to the tariff reduction may have toreduce their production levels or even exit the industry. This effect is likely to be morepronounced where the assistance reductions are large and the opportunities forreducing costs are limited.

BUREAU OF INDUSTRY ECONOMICS
MICROECONOMIC REFORM: SOME POTENTIAL IMPACTS 109
Box 7.1 The effects of removing a tariffWe can use a demand and supply diagram to illustrate the first round or ‘partial equilibrium’effects of the removal of tariffs for an import-competing industry in a small country wherefirms compete on price. We ignore dynamic gains or other supply shifts that may resultfrom reforms that, for example, reduce costs.
Price
D
S
p t
p0
q 1q 0q 0aq 1a0
Quantity
Initially, with a domestic supply schedule S and domestic demand D, imports face a tariffrate equal to (pt—po/po). This allows domestic firms to sell their output to domesticconsumers at a price pt. This is above the world price po. Initially, domestic productionequals qoa. After the tariff is removed price falls to po and domestic production falls to q1a.At this lower price, domestic consumption increases to q1 and imports increase fromqo—qoa to q1—q1a.While this is likely to be the outcome at the industry level, the reduction in tariffs hasdifferential effects at the firm level because different firms have different cost structures.We can use the same example as above to examine the potential impacts of the reduction intariffs on firms.
Pt
Po
qa qbqb’
Firm A Firm BPrice
Quantity
Price
Quantity
SA SB
Firm A (a high cost producer) and firm B (a lower cost producer) initially produce qa andqb, respectively. They receive price pt (the tariff inclusive price). After the reduction intariffs, the price falls to po. For firm A, with supply curve SA, the impact of the tariffreduction is that this firm’s costs of production are now higher than the new price po. FirmA is therefore not able to supply the market at the new price and any attempt to charge ahigher price would result in no sales (assuming firms only compete on price). Thus, firm Ais likely to cease production. The impact of the tariff reductions for the lower cost producer,firm B, is not as dramatic. When the price falls from pt to po, firm B is still willing tosupply, but a lesser quantity qb’.

110 MONITORING MICRO REFORM — SETTING THE SCENE
Where firms are able to differentiate their products they may respond to a reduction inassistance against imports by seeking to improve their competitive position bychanging the nature of their product. This was an important response by many NewZealand firms that faced increased competitive pressures from trade liberalisation inthat country (Cambell, Bollard and Savage, 1989).
Firms can endeavour to differentiate their products from their competitor's products ina number of ways. For example, firms may seek to obtain an edge in the market byfocussing on quality, flexible marketing arrangements, better after sales service. Firmsmay also seek to supply different product variants to meet varying customerrequirements. Hence, although all firms in an industry may produce the same generaltype of product, each firm’s product can have distinguishing features. These can set itapart, to some extent, from those of other firms in the industry.
If a firm can successfully differentiate its product it may be able to charge a premiumprice and, assuming cost comparability with competitors, earn a higher than industryaverage profit. At the same time, a new entrant into a market may seek to trade on, saysuperior product quality, establishing itself on the basis of value for money andcapturing market share. One of the implications for domestic producers operating insuch a market where barriers to entry are low is that existing producers arecontinuously under pressure.
Scope to compete through successful product differentiation also has implications forhow such industries can respond to microeconomic reform. Box 7.2 details how theAustralian citrus industry has responded to increased international competition arisingfrom reductions in tariffs and other forms of border protection. An important aspect ofthe industry’s response involved the differentiation of its product from imports.
The economic literature has identified a number of potentially important impacts ofimport protection on firms competing in markets with few domestic players. Protectioncan increase the potential for these domestic firms to develop market power andsustain above ‘normal’ profitability (Caves et al 1981). Research by Katics andPetersen (1994) supports this view. They found that price-cost margins declined forconcentrated US industries experiencing increased import competition over the period1976 to 1986.
A lack of competitive pressure can also be a significant factor in the failure of firms toachieve minimum production costs (Leibenstein 1966). Reductions in protectionshould therefore lead to pressure on domestic firms’ profit margins and pressure toreduce inefficiencies in production and marketing. Reorganising the productionprocess, reducing wastage, shedding excess staff, tighter cost controls, andinvestments in new technology represent different ways in which such firms can seekto reduce production inefficiencies.
BUREAU OF INDUSTRY ECONOMICS
MICROECONOMIC REFORM: SOME POTENTIAL IMPACTS 111
Box 7.2 Product differentiation: the case of Australian orange juice
Australia’s citrus fruit growing industry is characterised by a large number of relativelysmall producers operating in a very price competitive market. Prior to the recent phasedreductions in industry assistance, producers mainly sold fresh fruit on the domestic marketand supplied domestic processors with fruit, notably oranges, for the juice market.
Production of juice took approximately 60 per cent of the Australian orange crop. Juice inthe form of frozen concentrated orange juice (FCOJ) is an internationally tradedcommodity. FCOJ can be readily stored and transported with price being the keydeterminant of the source of supply. Australian producers of FCOJ, a mix of citrus growercooperatives and public companies, faced fierce import competition. They were protectedby a range of assistance measures including high tariffs (both specific and ad valorem),differential sales tax arrangements related to a local content scheme and at times, a floorprice was imposed on FCOJ imports. In the mid 1980s imports of FCOJ from Brazil,Australia’s major competitor, faced an ad valorem tariff equivalent of approximately 35 percent.
Progressive reductions in the tariff applying to imported FCOJ and the removal of variousother assistance measures over the period since the late 1980s led to increasing pressure ongrower and processor prices. This also coincided with rapid production growth in Australiaand overseas. This increase in supply placed further downward pressure on the world priceand hence the tariff inclusive domestic price of FCOJ. In response to the unfavourablereturns from the processing sector, growers sent more fruit to the domestic fresh market.However, this resulted in increased competition and lower unit returns in this market.Growers also built up existing export markets and exploited new export opportunities forfresh fruit. Over the past five years, Australian fresh orange exports more than doubled (toabout 14 per cent of production in 1994) with little change in the real unit value (ABARE1995).
The industry also responded by differentiating its product more effectively. This entailedintroducing and promoting a fresh orange juice product with a relatively short shelf lifewhich could not use either imported or locally produced FCOJ. Consumer demand for this‘fresh style’ juice has grown rapidly and production now requires about 40 to 50 per cent oforanges destined for processing.
The introduction of this fresh juice product has created an entirely new market with onlyvery limited substitution away from other citrus products. Supplies for this new market are,in part, from fruit previously destined for local FCOJ production. Other supplies come fromincreases in citrus production resulting from planting decisions undertaken years before.Imported FCOJ, by definition, cannot be used as fresh Australian juice. Generally, fruitdirected to the fresh Australian juice market commands a premium above the fruit directedto the local FCOJ processing sector. Citrus growers are receiving prices significantly aboveFCOJ import parity and are no longer bearing the full brunt of declines in assistance and

112 MONITORING MICRO REFORM — SETTING THE SCENE
fluctuations in the world price for FCOJ.
A recent survey of 100 New Zealand firms suggests that an increase in competitiondoes elicit such responses. The survey found that the most significant responses toincreased foreign and domestic competition ‘were to improve quality, reduce pricesand increase the range of products’ (Baird and Savage 1990, p. 17). Ergas and Wright,(1994) using data from a survey of Australian manufacturers, also found thatcompetitive conditions are an important determinate of firms’ product quality.
A depreciation(appreciation) of the exchange rate may reduce(increase) the pressureassociated with reductions in assistance. As demand for imports rises in response tothe lower landed duty paid price of imports there is the potential for a depreciation ofthe exchange rate. Such a depreciation would help offset the tariff reduction. In reality,however, tariff reductions are not once off, as assumed here, but phased. Furtherpressure for depreciation arising from reductions in protection tends to be hidden byother influences on the exchange rate such as changes in Australia's commodity pricesand interest rates. Changes in these influences may offset the pressure for depreciationall together, such as where export prices rise. Notwithstanding this, a depreciation(regardless of its cause) occurring at the same time as tariff reductions can mask theimpact of tariff reform. What is important in these circumstances is that the domesticfirm's competitiveness would have been lower had the tariff reduction occurredwithout any depreciation.
7.2.2 Microeconomic reform and prices
Assistance reductions are not the only form of microeconomic reform which lead tochanges in prices. As outlined in chapter 4, reforms to infrastructure service provisionsuch as those underway in electricity and telecommunications have led, and willcontinue to lead, to changes in prices. Firms operating in all sectors of the economystand to gain from price reductions arising from reform to infrastructure services.Assistance reductions and infrastructure reform will, to varying degrees, benefitdomestic consumers and industries that use these products or services. Moreover,firms suffering a decline in tariff protection can achieve lower production costs as aresult of cost reducing microeconomic reforms. This highlights the potential benefitsof a broadly based approach to microeconomic reform.
Reforms that involve changes in prices, such as the removal or reduction of crosssubsidies in the electricity and coal rail freight sectors, can improve resourceallocation. For some infrastructure services, cross subsidies to fund community serviceobligations have long been a common feature of pricing. In these instances some usersare ‘taxed’ while other users are ‘subsidised’ relative to a situation where crosssubsidies are not applied.
Tariffs, quantitative import restrictions and statutory marketing arrangements also actas de facto taxes on businesses who use the assisted input. These input ‘taxes’
BUREAU OF INDUSTRY ECONOMICS
MICROECONOMIC REFORM: SOME POTENTIAL IMPACTS 113
discriminate against industries that are relatively dependent on the input in question.Those industries that benefit from cross-subsidisation or assistance arrangements areable to expand at the expense of other industries. Subsidised and assisted businessesmay attract resources (land, labour and capital) that may be more productively utilisedin the ‘taxed’ and unsubsidised industries.
The extent of the reduction in input costs associated with trade liberalisation willdepend on whether or not importers are able to capture the reduced import cost (in theform of higher profits) or pass it on to the input user (in the form of a reduced price).The extent of flow on, in the short term, depends on how homogeneous the input isand the extent of competition in the product market and its key factor markets. Themore homogeneous a product and the more competitive its market, the greater theextent of the pass on of the benefits of the lower tariff to users of the product. Thus,the price of a tariff assisted input, such as plastic for packaging (a relativelyhomogeneous product), is likely to fall to the full extent of any tariff reduction. Whilethe price of capital equipment, which is often highly specialised, may fall to a lesserdegree because business demand for specific equipment is often less responsive toprice changes. The extent of competition in factor (land, labour and capital) marketswill also influence the degree to which potential price reductions flow through tousers. Where competition for factors, such as labour, is limited or highly specific theyare likely to capture a sizeable proportion of the potential gains from microeconomicreform.
Infrastructure services are important input costs for many firms (see chapter 4).Reform of the infrastructure sector, including transport, communications and energy,has the potential to directly impact on the cost of production. Improved efficiency andproductivity in infrastructure provision can have two major impacts on firms usingthese services. First, lower infrastructure costs per se will be directly reflected in lowercosts of production. Second, the firm may also experience a reduction in costs throughan improvement in the quality of the service, such as improved reliability. BIE studieshave found that, for many infrastructure services, reliability can be more importantthan price. For example, liner shipping companies operate to fixed schedules and asubstantial delay in a port can lead to the costly situation of having to by-passsubsequent ports and make alternative shipping arrangements (BIE 1995c).
Firms may also have more options in terms of the choice of infrastructure serviceproviders as a result of deregulation. For example, competition reforms, such as thirdparty access to infrastructure, may mean that the use of rail transport, for example,becomes a true alternative to the use of road for some users.
While infrastructure reform can help import competing industries offset pressures fromreductions in tariff assistance, some aspects can also improve the cost structures ofcompeting importers. Maritime and waterfront reform, for example, could lead toreductions in the landed duty paid price of competing imports and thus also makeimported products more competitive on the domestic market. For export oriented

114 MONITORING MICRO REFORM — SETTING THE SCENE
firms, cost reductions resulting from infrastructure reforms will improve theircompetitive positions on both the domestic and international markets. As identified bythe BIE (1993), the opening up of coal rail haulage in New South Wales tocompetition may lead to a 20 per cent reduction in the cost of transporting coal to theport for export (see box 7.3).
Cost reductions from the reform process may also assist firms which previouslyfocused on domestic customers to exploit export opportunities.
Improved efficiency in the infrastructure sector does not, however, always translateinto lower costs for importers, domestic firms or consumers (BIE 1995d). If, forexample, infrastructure suppliers have some degree of monopoly power they may beable to absorb the benefits of productivity gains due to reform. The extent to whichthis occurs depends on a number of factors. These include: government’s dividendpolicy; the range of substitute products or services; and various governmentmonitoring and regulatory instruments designed to deal with the problems associatedwith monopoly service providers.
Competition reform can be a useful adjunct to other infrastructure reforms (such ascommercialisation) in forcing infrastructure providers to pass on the productivitybenefits of reforms and to improve service quality (see chapters 2 and 4 for details ofreforms in competition policy).
Price-based reforms to infrastructure, even in the absence of some monopoly pricingpower, may lead to a rise in prices to users. For example, some reforms will lead toprices being realigned to reflect the true economic cost of provision. This may result inprice rises. Some infrastructure pricing reforms, such as reforms to water pricing andthe removal of infrastructure cross subsidies, fall into this category. The overall impacton a firm’s costs will depend on its response to any price rises. Some producers maycontinue to demand the same quantity and hence their costs will rise. Others mayadopt strategies to reduce the quantity required which, to a lesser or greater extent,may offset the price rise. For example, farmers facing an increase in the price ofirrigation water may switch from surface irrigation to a less water intensive irrigationsystem, produce less water intensive crops or switch to dry land farming.
7.2.3 Microeconomic reform and productivity
Essentially microeconomic reform aims to improve the efficiency with which thenation uses its resources. This can occur through changes in the allocation of resourcesin the economy. That is different combinations of resources may be used in the sameindustry, or alternatively, resources may flow from one industry into another, moreproductive, industry. This change in the allocation of resources is a response to therealignment of prices arising from the reform process. A change in an industry’sexternal operating environment can also be a catalyst for a firm to find new ways ofcompeting (section 7.2.2). For example, firms’ responses to increased competitive

BUREAU OF INDUSTRY ECONOMICS
MICROECONOMIC REFORM: SOME POTENTIAL IMPACTS 115
pressures can be expected to promote higher levels of technical and dynamicefficiency.
Box 7.3 Reform, input costs and the coal industry’s competitiveness
Coal is Australia’s largest export. New South Wales and Queensland are the industry'smajor producing states. The industry employs some 26 000 people and is an extensive userof rail and port services(ACA 1994). The Australian Coal Association believes thatrigidities in the labour market and high-cost rail and port services impede its internationalcompetitiveness. In part, the high prices paid for rail and port services arise frominefficiencies associated with their monopoly provision by GBEs. In addition, the state railauthorities have charged “excess freight rates” to appropriate some of the high returnsavailable in the industry over the last few decades. In some instances, the higher profitsearned by transporting coal have enabled the authorities to subsidise other users.
The reform process is leading to some reductions in coal rail and port charges. For example,since 1990-91, rail freight charges in NSW and Queensland have declined in real terms by 7and 10 per cent respectively. However, the industry believes further reductions arewarranted. For example, the industry argues that in 1993 Queensland Rail’s coal freightrevenue was more than $500 million in excess of the commercial norm (ACA 1994). Stateauthorities agree that the reform process will lead to further reductions in coal rail freights.For example, the recent decision to allow competition on Hunter Valley coal rail lines“could save coal companies between $1.80 to $1.90 per tonne of coal hauled with in fiveyears” (Fahey 1994, p. 1). Port authority charges have, to varying degrees, also declined.For example, the MSB Hunter Ports Authority reports that the average cost per tonne ofusing the Port of Newcastle fell from $1.06 per tonne in 1990-91 to $0.85 per tonne in1991-92 (MSB 1992).
Over the last 5 years labour costs per tonne have increased marginally in Queensland.However, in New South Wales labour costs declined by one third. This dramatic decline inlabour costs reflects changing technology, a move towards the less labour intensive open cutmines and labour market reforms. While work practices have improved there is considerablescope for further improvement (ACA 1994). Company managers argue that safetyregulations are too prescriptive, reduce flexibility in the working environment and add tocosts rather than contributing efficiently to making mines safer. Companies maintain thatthe labour savings achieved between 1987-88 and 1992-93 are mainly through increasedcapital expenditure per worker rather than work place reforms. (ACA 1994).
Microeconomic reform has had a positive impact on the cost competitiveness of the coalindustry. Infrastructure reform has played an important role in cost reductions. Labourmarket reform has also played a part. However, industry believes considerable scoperemains for cost savings from reforms to both the pricing and delivery of rail and portservices and reforms to the labour market.

116 MONITORING MICRO REFORM — SETTING THE SCENE
Ergas and Wright’s (1994) study of Australian firms’ conduct and productivity foundthat the intensity of competition impacts on the range of differences in firmperformance in an industry. For example, they found that the dispersion in firmperformance was greatest in those industries with few domestic competitors andwhich, until recently, enjoyed high levels of assistance (Ergas and Wright 1994, p. 85).Their analysis, however, provided only limited support for the notion that intensifiedcompetition, from any source, generates increases in productive efficiency. Thisfinding, they suggest, may reflect the absence for their study of an accurate indicatorof the intensity of competition faced by firms. However, they found a strongrelationship between firms with superior performance and an export orientation fortheir production, rather than to competition per se. They believe their results suggestthat:
Involvement in the international economy provides firms with expanded opportunities to learn.Firms more heavily involved with the international economy (be it through exporting orthrough foreign direct investment) are more likely than are domestically-oriented firms to:systematically measure themselves up against world-best practice; focus on improving productquality and customer satisfaction; and successfully learn from customers and suppliers. All ofthese activities feed into productivity gains in the medium term (Ergas and Wright 1994, p. 55).
The change in incentives arising from increased competition may trigger firms toreassess their production and marketing strategies. Such assessments may lead to achange in technology or management practices. This appears to have occurred amongNew Zealand firms facing increased competition from their microeconomic reformprocess. For example, the major objectives of investment undertaken by New Zealandfirms facing increased competition ‘were to improve technology and reduce costs’(Baird and Savage 1990, p. 24).
While the decision to undertake investment is within the control of a firm’s owners,the introduction of new management techniques often requires the cooperation of thefirm's employees. Reforms to industrial relations and work place arrangements becomeparticularly relevant in this context.
There have been a number of significant reforms to Australia’s industrial relationssystem since the late 1980s (see chapter 5). A central aim of these reforms has beenthe gradual movement away from a highly centralised industrial relations systemtowards a greater emphasis on arrangements that allow more flexibility at the firm orenterprise level.
Recent reforms to the industrial relations system have, amongst other things, involvedthe promotion of multi-skilling of the workforce. Multi-skilling describes thebroadening of tasks performed by individual employees. It is a central element ofmodern enterprise reform because it permits greater flexibility in the use of staffresources. Multi-skilling enables firms to develop internal labour markets byintegrating training, skills and wages. This allows higher quality and more autonomous

BUREAU OF INDUSTRY ECONOMICS
MICROECONOMIC REFORM: SOME POTENTIAL IMPACTS 117
team work within the firm. The enterprise agreement covering SPC provides a usefulillustration of the value of this development (see box 7.4).
Box 7.4 An early enterprise agreement the SPC case
SPC, a long established cooperative fruit canner, ran into financial problems in 1990. Toredress this, SPC sold or renegotiated its interests in a number of capital draining venturesand undertook a program of voluntary retrenchments. Despite this action, the company’sbankers expressed concerns over the continued funding of SPC’s operations for the 1991season. In response, SPC targeted additional cost savings of $2.5 million in order to returnto profitability and improve financial market perceptions of the company.
The cooperative sought advice from an advisory committee comprised of workplace unionrepresentatives, management and staff. The committee made a close examination of the 58awards and site-agreements as well as all over award payments and proposed a package of11 points be put to the workforce. The proposed package involved workers giving up anumber of conditions of work. It also involved a 3 per cent reduction in wages for a periodof 12 months. However, the Victorian Trades Hall Council and the ACTU expressedconcern that the package involved a weakening and reduction in award conditions. Theyargued that savings should only be made by reducing over-award payments. Ultimately SPCand the unions agreed to achieve savings by removing over-award payments. The SPCworkforce later ratified this agreement. The enterprise agreement and the initial redundancypackage resulted in:
• a cut in employees and management’s nominal wages and reductions in over-awardconditions;
• the removal of some ‘non-productive’ paid time such as additional rest breaks;
• ‘on-cost’ savings of $100 000 resulting from electronic funds transfer of wages; and
• substantial productivity increases, with the number of cartons filled per hour risingfrom 6.7 in 1990 to 8.8 in 1991.
With the implementation of this agreement, financial pressures from SPC’s banks declined.By February 1991, SPC reported its first ever, first quarter profit. Subsequently acombination of factors including the depreciation of the Australian dollar, lower interestrates, crop failures in competing countries, and public support for SPC’s productscontributed to a rapid improvement in profitability. The turnaround in SPC’s fortunes wasso significant that the original 12 month agreement terminated seven months early.
By the end of 1991, SPC paid back the workforce’s earlier wage reduction. The cooperativealso paid fruit growers a bonus in recognition of depressed fruit prices and was still able torecord a $6.7 million profit.
Source: IC (1993b).

118 MONITORING MICRO REFORM — SETTING THE SCENE
Reforms involving reductions in the number of unions within an industry or enterprisehave the potential to reduce demarcation disputes and improve management andlabour communication.
A major thrust of the industrial relations reform process has been the introduction andpromotion of enterprise level agreements. Enterprise agreements allow employers,employees and unions to work together to develop and agree on work andmanagement arrangements better suited to their specific workplace circumstances. Ineffect, they encourage a shift in responsibility away from the centralised wage systemand distant third parties (such as national union and employer organisations) to partiesthat have a direct involvement, understanding and interest in the workplace.
As evident from appendix 3, reform through enterprise based agreements can liftproductivity in a number of ways. These include: increased flexibility of work shifts;improved and more efficient work practices (resulting in improved product quality andlower wastage and scrapage costs and easier absorption of new productiontechniques); streamlining of union workplace coverage; and better managementtechniques. Enterprise level agreements have the potential to improve a firm'sflexibility to adapt and succeed in an environment of increased competition. Theycould play a significant part in maintaining and/or improving an individual firm’scompetitive position.
General equilibrium studies indicate labour market reforms and improved labourproductivity flowing from other microeconomic reforms are an important source ofgain from the overall reform process. In many cases, the models suggest thatimprovements in labour productivity are one of the main sources of gains to theeconomy (see appendix 4). However, these models cannot take into account a numberof the more dynamic effects likely to arise from the reform process which have beendiscussed in section 7.2.
7.3 Concluding commentsThe microeconomic reform process aims to increase Australia’s standard of living byincreasing productivity and reducing costs of production. This will allow us toincrease, or at least maintain, in a relative sense, the nation’s level of income. Whilethe overall aim of the reform process is clear, the ultimate distribution of the benefitsis not intuitively obvious. By contrast, the costs associated with the reform programare often much more transparent. This is because the gains accrue over time and arewidely dispersed throughout the economy, while the costs tend to be experienced earlyin the reform process and are more concentrated.
This chapter has outlined how various microeconomic reforms could impact on firmsand the economy. We can make some observations about the impact of particularreforms at the firm level. However, as many reforms are underway at the same time,some having positive impacts with others having negative impacts, these observationsoften fail to adequately capture the full effects. The net effect of reform on an

BUREAU OF INDUSTRY ECONOMICS
MICROECONOMIC REFORM: SOME POTENTIAL IMPACTS 119
individual firm or industry is, therefore, not clear-cut. Nevertheless, it is clear that thereform process is not costless. Some firms in assisted industries may downsize or evengo out of business as a result of reductions in assistance. Reforms to infrastructureindustries often involve redundancies within these industries. This will generally lead,at least in the short term, to an increase in the number of unemployed.
At the same time, many firms will be able to take advantage of cost reductions andopportunities that arise as a result of structural change induced by microeconomicreform. Export oriented industries, in particular, can be expected to gain from thereform process. Firms in export industries, directly, bear little of the cost of the reformprocess and have the potential to take advantage of cost reductions flowing from manyreforms. Overall, the economy should be able to increase its productivity and producemore with the same or even less resources.
The impact of microeconomic reform on individual firms depends, first, on how eachfirm chooses to react to the immediate pressures arising from the process of reform. Italso, subsequently, depends on the second-round effects that emerge. Although somefirms adversely affected by reforms may simply go out of business, others may makesignificant changes to their operations. This can lead to improved performance andprofitability. These individual, firm specific, responses to change are therefore a veryimportant feature of the microeconomic reform process. Firms facing the same set ofpressures may take very different restructuring paths. While economic theory andgeneral equilibrium modelling can shed some light on the potential impact ofmicroeconomic reform on firms and industries, little hard evidence is available.
Detailed analysis by case studies of industries and firms which have experienced thereform process will help address this information gap. The BIE, as part of itsMonitoring Micro Reform program of work, is undertaking a series of case studies toassess the impact of microeconomic reform on firms. The next chapter outlines theBIE’s future work program for this project and gives details of the industries chosenfor the first two case studies.
BUREAU OF INDUSTRY ECONOMICS
120
8 Future directions: the work program
In the report so far, we have examined the evolution of the microeconomic reformagenda and discussed how reforms in some key areas are likely to impact on firms andindustries. In this chapter we provide a rationale for the use of a case study approachin examining the impact of microeconomic reforms at the firm and industry level. Wealso outline the BIE’s future work program, including key case studies to beundertaken as part of the Monitoring Micro Reform project.
8.1 Case study approachAs discussed in chapter 7, microeconomic reform is likely to have differential impactson industries in the economy and individual firms within an industry. A keydeterminant of how microeconomic reform impacts on the economy are the individualresponses of firms to the changed environment. Firm and industry specificcharacteristics, as well as, the nature and extent of individual reforms are likely toshape firms’ responses to change.
The BIE, therefore, considers a case study approach, pitched at the firm level forparticular industries, is the most appropriate research vehicle to assess the impact ofmicroeconomic reform. The BIE judged alternative approaches, covering analysis ofinput-output tables for selected industries and sectors and data available at the industrylevel from surveys conducted by the Australian Bureau of Statistics (ABS), asinappropriate. In the main, this reflects the high level of aggregation in these data andthe absence of the necessary detail to systematically pair particular reforms withimpacts at the firm/industry level. Put simply, important drivers of differences in theimpact of reform can only be adequately captured through detailed firm and industrylevel studies. This assessment was spelt out by the BIE in an issues paper released forcomment in September 1994. The BIE circulated the paper to over 30 industry groupsand government agencies. Feedback on the paper indicated wide support for theMonitoring Micro Reform project, its objectives and the proposed case studyapproach.
On the basis of this feedback and the BIE’s own analysis of relevant issues, casestudies will aim to assess individual firms’ reactions to the process of microeconomicreform. The case studies will, in part, rely on survey data and face-to-face discussionswith firms. The analysis will be quantitative and qualitative in nature. Whereappropriate and feasible, the analysis will look at the extent of differences in theprocess of reform at the state level.

BUREAU OF INDUSTRY ECONOMICS
FUTURE DIRECTIONS: THE WORK PROGRAM 121
The survey questionnaires will require firms to report their observations/insights intomicroeconomic reforms which have occurred over a period of time (typically between1989 and the present). The questionnaires will also request some time series financialand employment information. In addition, firms will be requested to provide details ofchanges in, for example, operating structure, investments, products or servicesproduced and human resource management. Thus, in addition to perceptions aboutwhat has happened to the firm and why it has happened, the survey will also recordthe performance of the firms over time. Where possible, changes in firms’performance will be linked to changes in the operations of firms which capture theirresponses to microeconomic reform.
The BIE will ask firms to indicate their perceptions of how a range of microeconomicreforms have impacted on the competitiveness of their business. Table 8.1 summarisesthese reforms. On the basis of this information and with reference to the type ofreform and the operating characteristics of respondents the BIE plans to rank thereforms which have made the greatest contribution to firms’ competitiveness.
Table 8.1 Microeconomic reforms
• Australia’s tariff reductions • Statutory marketing arrangement reforms• Industrial relations reforms • Changes to taxes on inputs/on-costs• Changes to product standards & regulations • Road freight reforms• Coastal shipping reforms • Aviation reforms• Rail transport reforms • Telecommunications reforms• Electricity reforms • Gas reforms• Water supply reforms • Environmental regulation
The case studies will also provide opportunities for firms to indicate which of thereforms listed in table 8.1 are operating well, and which reform areas are lagging andin need of further attention. Firms will be requested to assess the adequacy orotherwise of the pace of current reforms. Firms will also be asked to indicate theirperceptions of the most important reforms for their future competitiveness. They willalso be given an opportunity to comment on any other initiatives, within the control ofgovernments, which could be practically taken to improve their competitiveness.
As discussed in chapter 7, initiatives directed at increasing the level of competitionhave been a central feature of the microeconomic reform process. The case studieswill aim to assess whether firms have experienced any change in the level ofcompetition they face. Firms will be asked to indicate the factors (includingmicroeconomic reforms) which have contributed to any change. Firms' responses tochanges in the level of competition will also be examined. For example, the studieswill aim to examine the impact of the reform process on:• firms’ revenue and cost structures;• levels of production, products produced and sold;

122 MONITORING MICRO REFORM — SETTING THE SCENE
• levels of input usage covering capital, labour, and materials; and• individual firms’ productivity over time; and investment levels (ie. equipment
and R&D).Information will also be sought on whether firms have:• differentiated their products through, for example, changing product quality;• changed their patterns of assembly to improve the quality and/or reduce their
costs to make and sell;• changed the suppliers used to source their inputs or required existing suppliers to
improve their operations and, if so, how;• sought out new markets - domestic and/or export;• changed their relations between management and workers; and• instituted best practice techniques and, if so, in what areas, and with what
effects.As discussed in chapter 7, the reform process is expected to induce productivityimprovements. Data obtained from firms will allow the BIE to assess whetherimprovements in productivity have occurred. The questionnaire data should also allowan assessment of some of the main drivers of any productivity improvements. Forexample, firms will be asked to indicate the significance of certain industrial relationsreforms, management and workplace reforms to changes in productivity. Firms willalso be requested to rank the importance of contributing factors.
The case studies will also endeavour to gauge whether microeconomic reform hasexpanded firms opportunities to export. For example, firms will be asked to indicatewhich factors have contributed to any change in their export intensity.
Microeconomic reform has also seen substantial changes in the environment in whichmanagement and workers operate. The answers to the questionnaires will allow theBIE to gauge the extent to which industrial relations reforms have been implementedin the workplace and whether management’s relationships with its employees havechanged over the last few years and, if so, what factors have contributed to the change.
Overall, the case study approach is expected to provide valuable insights at severaldifferent levels covering:
• the main impacts of microeconomic reform on the activities, operations andperformance of firms;
• the significance of micro-economic reforms relative to other influences shapingchanges to firms’ operations over time;
• key drivers of differences in the experiences of firms within particular industries;
• the nature and extent of the dynamic effects of microeconomic reform on firms;

BUREAU OF INDUSTRY ECONOMICS
FUTURE DIRECTIONS: THE WORK PROGRAM 123
• firms’ assessments of the relative importance of different reforms to theiroperations; and
• firms’ views on the need, if any, for additional reforms having regard for thenature of their operating environment.
8.2 Choice of case studiesThe BIE currently envisages that the Monitoring Micro Reform project willencompass a suite of case studies over a two to three year period. Work is already welladvanced on the BIE’s first case study which is examining the agri-food industries.The BIE recently commenced a second case study covering the automotive industry.Both these industries were foreshadowed as potential case study candidates in theBIE’s Issues Paper referred to earlier. Feedback from government and industrysources indicated that these industries were viewed as good candidates for case studyanalysis. Other areas currently being evaluated as potential case studies include:mineral processing; tourism; textiles, clothing and footwear; chemicals and financialservices. The rationale for selecting the agri-food and automotive industries as theinitial case studies is briefly discussed below.
8.2.1 Agri-food industries case study
Australia’s agri-food industries account for over 20 per cent of the manufacturingsector’s output and 18 per cent of its employment. These industries comprise a widerange of export oriented as well as import competing activities. In 1992-93, agri-foodproducts accounted for around 25 per cent of all manufactured exports and 5 per centof manufactured imports.1
Recent studies of the performance of the agri-food industries by the AustralianAcademy of Technical Sciences and Engineering and the Prime Minister's Science andEngineering Council have drawn attention to the importance of microeconomic reformfor these industries (DPM&C 1994 and AATS&E 1994). Both studies stressed theneed for an acceleration in the pace of microeconomic reform.
A number of key microeconomic reforms have been identified as being relevant to theagri-food group of industries including:
• reforms to statutory marketing arrangements for agricultural products;
• reductions in assistance to agriculture and manufacturing;
• labour market reforms;
• infrastructure reforms; 1 BIE estimate, based on ABS data presented in IC (1995e).

124 MONITORING MICRO REFORM — SETTING THE SCENE
• mutual recognition of regulations including product standards; and
• reforms to government services such as export inspection.
Agri-food industries have strong linkages to up-stream (eg to the agricultural sector)and down-stream industries (eg food processing machinery manufacturers andsuppliers and packaging manufacturers). This feature should enable the case study toprovide a broader view of the impact of microeconomic reform.
Despite the agri-food industry’s sizeable contribution to the manufacturing sector’sturnover and exports, significant segments of the industry have been perceived asinward looking and in danger of losing market share to imports. For example, theFood Processing Reference Group (FPRG 1991) suggests that the perishable nature ofcertain products and the low value/weight ratios of simply-processed productsprovides some agri-food industries, or products, with a degree of natural protection.The FPRG reported that this protection, coupled with strong domestic demand, hasencouraged ‘an entrenched resistance to achieving international competitiveness’(FPRG 1991, p. I). The FPRG also identified a range of external impediments to thesector’s performance. These included ‘corrupt’ world markets, the high assistanceprovided to other Australian industries and high transport costs.
With a view to encouraging a more outward looking and internationally competitiveindustry, the federal government announced an Agri-food Industries Strategy in July1992. According to DITARD (1993, p. 16):
Under the Strategy, specific programs focus on building Australia’s image as an exporter ofclean food, improving industry language and literacy skills to assist workplace reform,benchmarking and industry networking. A Processed Food Market Access Committeecoordinates and focuses industry and government efforts to achieve better access to overseasmarkets.
An Agri-Food Council, comprising leaders representing the major interests in the industry, hasbeen established to provide overall strategic direction to the initiative and to assist infacilitating communication between stakeholders.
The Strategy has the potential to be a catalyst for achieving further microeconomicreform within the agri-food industries.
The Agri-Food Council has given its support to the agri-food case study and aSteering Committee has assisted the BIE in identifying key industry segments foranalysis. The committee has also provided comments which assisted with thedevelopment of a survey questionnaire and is providing on-going feedback to the BIEon the study. The responsible program area within the Department of Industry,Science and Technology and a number of key firms within the industry have providedthe BIE with sponsorship in support of the study. This support has enabled the BIE toundertake a more comprehensive analysis than otherwise would have been possible.
The BIE utilised the ABS business register to undertake a survey of approximately1 500 firms with five or more employees in the following agri-food industries:

BUREAU OF INDUSTRY ECONOMICS
FUTURE DIRECTIONS: THE WORK PROGRAM 125
ANZSIC Industry ANZSIC Industry
2111 Meat processing 2171 Sugar manufacturing2121 Milk and cream processing 2172 Confectionery
manufacturing2129 Dairy products n.e.c. 2174 Prepared animal and bird
feed2130 Fruit and vegetable
processing4715 Fruit and vegetable
wholesaling2151 Flour mill products
manufacturing2863 Food processing
machinery2151 Cereal food & baking mix
The BIE also utilised the Packaging Council of Australia’s membership list to surveythe major food packaging manufacturers.
The industries surveyed produce a mix of products which either compete with imports,are export oriented or face little international competition. Product coverage rangesfrom those which are minimally processed to those involving extensive processing. Awide range of past, present and potential microeconomic reforms appear to be highlyrelevant to these industries.
The agri-food questionnaire was sent out to targeted firms in May 1995. This followedextensive consultation with the ABS on the design and development of thequestionnaire and a pilot testing of the questionnaire with some 35 firms. The datagathering aspect of the survey work was completed in August 1995. The BIE expectsto report the results of its analysis around April 1996.
8.2.2 Automotive industry case study
The passenger motor vehicle and parts industries represent a significant share ofAustralian manufacturing output. The majority of the industries production competeswith imports. The industry (along with the textiles, clothing and footwear industries)has been one of the most highly assisted manufacturing industries in Australia, with aneffective rate of assistance of over 30 per cent in 1995-96. This level of assistance iswell above the average for manufacturing as a whole of 8 per cent. Despite thisdisparity, assistance to the industry has declined substantially since the mid 1980s andwill continue to decline to the year 2000.
Given this background, the automotive industry was judged to be an appropriate casestudy for a number of reasons including:
• the process of trade liberalisation, a key element of the microeconomic reformprocess, has presented the industry with a significant direct challenge to improve itscompetitiveness in the face of much lower assistance levels; and
126 MONITORING MICRO REFORM — SETTING THE SCENE
• the industry and other players (including the Industry Commission) have identifiedthe wider process of microeconomic reform as having an important impact on theinternational competitiveness of the industry as well as its capacity to adapt to alower tariff assistance regime.
A case study of the automotive industry is also likely to provide a useful input to theGovernment’s review of the industry’s post 2000 assistance arrangements. Thisreview is expected to commence in 1996.
The automotive industry program area within the Department of Industry, Science andTechnology, the Federal Chamber of Automotive Industries and the Federation ofAutomotive Products Manufacturers have agreed to part-sponsor this case study.Again, this will enable the BIE to undertake a more detailed case study than otherwisewould have been possible. The case study commenced in September 1995 and, at thisstage, is expected to be completed by around September 1996.
8.2.3 Other case studies
Case studies to be undertaken after the completion of the agri-food and automotiveprojects will be chosen from industries within the manufacturing, mining and servicesectors. Industries currently being considered as potential case studies include: mineralprocessing; tourism; textiles, clothing and footwear; chemicals and financial services.The final choice of case studies will be based on a range of factors including:
• the economic significance of the industry;
• the coverage and relative importance of microeconomic reforms to the industry; and
• the economic characteristics of the industry industries with a diverse mix ofeconomic characteristics may allow for a richer understanding of the reform processand its impacts on firms and industries.
8.3 Future work programCurrently the BIE plans to undertake two further cases studies following completionof the agri-food and automotive industries case studies. Beyond this, it is possible thatthe BIE will undertake a further one or two case studies. At one stage, the BIE hadcontemplated undertaking a detailed and comprehensive ‘economy wide’ survey as anelement of the project. However, feedback from the ABS and industry suggests thatsuch an approach is unlikely to generate an adequate response rate. In view of thealready high level of information requests to industry from various governmentagencies, the BIE has decided not to proceed with such a survey.
With the completion of the case study phase of the project the BIE currently envisagesat least three potential further dimensions to the overall project. These involve:

BUREAU OF INDUSTRY ECONOMICS
FUTURE DIRECTIONS: THE WORK PROGRAM 127
• preparing a synthesis report drawing out the main findings and lessons to emergefrom the case studies;
• following up a selection of firms in the earlier case studies and undertaking aninterview-based analysis. The number and variety of firms could be extended byselecting additional firms from a cross-section of manufacturing and serviceindustries. This analysis could, amongst other things, be directed at identifying theimpacts of microeconomic reform on firm growth experiences; and
• examining the feasibility of drawing on the results of the case studies and interviewbased analysis to:
- enhance future economy-wide modelling exercises through the use of thericher data base provided by this project; and
- review the main areas in which the case studies provide insights different fromthose obtained through general equilibrium modelling exercises.

BUREAU OF INDUSTRY ECONOMICS
128
Appendix 1 Chronology of keymicroeconomic reforms inAustralia
Much of the microeconomic reform agenda in Australia has evolved over the pastdecade or so. This process has included governments at all levels and an array ofreforms that have impacted on most areas of the economy, although to varyingdegrees. The table below, while by no means comprehensive, provides a chronologyof some of the key events that have helped to shape Australia’s microeconomic reformprocess. It focuses largely on Commonwealth Government initiatives.
Table A1.1 Some key events in the evolution of microeconomic reform inAustralia
Date Reform/Event Description
1981-82 Reducing controls onbanks
These included: reducing restrictions on assets and liabilitieswhich banks could hold; the development of the treasury note;and the introduction of the tender system for selling governmentsecurities.
1983 Floating of $ARemoval of exchangecontrols
Floating of the Australian dollar and removal of foreign exchangecontrols.
The Accord First Accord between the Government & the ACTU.
Industry plans From 1983 onwards, the Government began implementingindustry plans, including plans for the steel, passenger motorvehicle, ship building, heavy engineering and the textiles,clothing and footwear industries.
1985 Business RegulationReview Unitestablished
The BRRU’s role involved assessing the impact of regulation onbusiness and screening all new Commonwealth regulations toensure they were efficient, cost effective and avoidedduplication.
National Tax Summit A summit held in July 1985 to discuss major tax reform options.In September 1985, the Government announced a lessambitious tax package that included: the introduction of fringebenefits tax; capital gains tax; a new foreign tax credit system;reductions in personal income tax and a full dividend imputationscheme for company taxation.
1986 The Treasurer’s‘Banana Republic’comment
‘Once you slow the growth under 3 per cent, unemploymentstarts to rise again....Then you are gone; then you’re a bananarepublic’.

BUREAU OF INDUSTRY ECONOMICS
CHRONOLOGY OF KEY MICROECONOMIC REFORMS IN AUSTRALIA 129
Date Reform/Event) Description
1987 Two tier wagessystem
The AIRC established two tier wages system in March 1987.
Guidelines on GBEs Guidelines set down for Commonwealth statutory authorities &GBEs. These guidelines established processes for definingGBEs objectives.
1988 Oil marketingderegulated
Deregulation of crude oil marketing arrangements took effectfrom January 1988, resulting in a free market for crude oil andrefined petroleum products.
IAC inquiry programextended
IAC’s inquiry program extended to cover inquiries intoimpediments to efficiency and competitiveness of the wholespectrum of industry.
Passenger motorvehicle assistanceplan revised
The revised plan removed import quotas, effectively removedthe local content arrangements for components and reduced thetariff rate from 57.5 to 45 per cent.
CommonwealthGovernment’s May1988 EconomicStatement
The statement announced:• tariff rates greater than 15 per cent were to be phased down
to 15 per cent by 1992 and tariffs between 10-15 per centwere to be phased to 10 per cent over the same period;
• textiles, clothing and footwear plan would be accelerated;• 2 per cent revenue duty on imports would be abolished;• removal of the embargo on sugar imports and its
replacement with a tariff (initially set at a rate of $115 pertonne);
• tax reforms: removal of gold mining income taxationexemption; depreciation to be based on effective life;changes to treatment of foreign source income &superannuation;
• removal of government’s day-to-day controls overCommonwealth GBEs and removal of their tax exemptions;and
• termination of two airline policy and introduction ofcompetition in telecommunications.
Industrial RelationsAct 1988
This Act became effective from March 1989. It provided aframework for decentralising the wages system and facilitatingworkplace reform. The legislation introduced the first federalprovision for the certification of enterprise agreements.
1989 Waterfront IndustryReform Authorityestablished
WIRA implemented extensive changes to employmentstructures, management and work practices, training and careerstructures over a three year period.
1990 Industry Commissionestablished
IC established as the Commonwealth Government’s majorreview and inquiry body on structural reform. The IC absorbedthe functions previously performed by the IAC, the Inter-StateCommission and the BRRU.

130 MONITORING MICRO REFORM — SETTING THE SCENE
Date Reform/Event Description
1991 CommonwealthGovernment’sBuilding aCompetitive AustraliaStatement
The statement announced that:• the general level of assistance would be phased down to 5
per cent by 1996;• tariffs on passenger motor vehicles would be phased down
from 35 per cent in 1992 to 15 per cent in 2000; tariffreductions on textiles, clothing & footwear to be acceleratedso that maximum TCF tariff is 25 per cent by year 2000 &the termination of TCF quotas brought forward to 1993;
• exemptions from sales tax for business inputs be widened &changes to depreciation provisions be introduced ‘to bringthem more into line with business realities’; and
• BIE would be commissioned to undertake research oninternational performance benchmarking of infrastructureservices supplied to businesses.
Special Premiers’Conference
Agreement reached in July 1991 to:• commence national performance monitoring of GBEs;• establish the National Rail Corporation;• establish a National Grid Management Council for
electricity; and• introduce a reform package for the heavy vehicle road
transport sector, including implementing full cost recoverycharges by July 1995.
Australian IndustrialRelationsCommissionendorsed enterprisebargaining
The AIRC’s October 1991 National Wage Case decisionestablished the enterprise bargaining principle for agreementsbetween firms and (unionised) employees in the federal system.
1992 CommonwealthGovernment’s OneNation statement
Initiatives announced included:• proposals for developing integrated infrastructure networks
— interstate electricity grid and a national standard gaugerail highway;
• proposals to promote competition between electricitygenerating systems; and by allowing further entry of foreignbanks; and by reducing barriers between domestic &international aviation sectors;
• further amendments to industrial relations legislation toencourage workplace agreements;
• introduction of a new system of vocational education &training; and
• changes to tax rules to encourage investment.
Council of AustralianGovernments
COAG established in May 1992.
Mutual recognition ofregulation agreement
The Commonwealth, state and territory governments agreed toremove regulatory barriers to goods and services trade betweenthe states. The agreement came into effect in March 1993.

BUREAU OF INDUSTRY ECONOMICS
CHRONOLOGY OF KEY MICROECONOMIC REFORMS IN AUSTRALIA 131
Date Reform/Event Description
1992 Inquiry intocompetition policy
(Hilmer) Committee of Inquiry into a National Competition Policyestablished in October 1992.
Expanded role for theIndustry Commission
Expanded role for IC included new industry developmentreferences and an enhanced role for the states and territories.
1993 Hilmer report Main recommendations of Hilmer review were to:• pursue a national competition policy;• extend the Trade Practices Act;• implement policy principles to regulate monopoly power in
certain markets; and• establish a National Competition Council and an Australian
Competition and Consumer Commission.
Industrial RelationsReform Act 1993introduced
The act, which became operative in March 1994, furtherfacilitates enterprise bargaining, particularly in non-unionisedworkplaces. It also introduced equity features to protectemployees in accordance with international conventions.
1994 Special Premiers’Conference
Agreement reached for a review of Commonwealth and stateservices provision.
Meetings of Councilof AustralianGovernments
Feb 1994 — meeting of the COAG gave in principleendorsement to the competition policy principles of the Hilmerreport.Aug 1994 — COAG meeting agreed, in principle, to a packageof competition policy reforms and transitional arrangements.
Special Premiers’Conference
Agreement to establish a process for achieving tax uniformityand competitive neutrality between activities undertaken byGBEs and the private sector.
CommonwealthGovernment’sWorking NationStatement
Initiatives announced included:• introduction of a training wage, changes to social security
benefits to reduced disincentives to work, and establishmentof the National Employment and Training Taskforce;
• decision that tariffs would remain at a maximum of 5 percent beyond 1996;
• establishment of an enhanced regulatory review process;additional resources provided for the Business RegulationReview Unit; and a new Council of BusinessRepresentatives to advise Cabinet on regulation review andreform; and
• BIE commissioned to monitor the impact of microeconomicreform on industries and firms; and internationalperformance benchmarking of infrastructure servicesextended to 1998-99, with the addition of benchmarking ofgovernment services to business.

132 MONITORING MICRO REFORM — SETTING THE SCENE
Date Reform/Event Description
1995 Agreement onnational competitionpolicy
The Commonwealth, state and territory governments agreed toa new national competition policy. Major initiatives includedagreement to:• apply a set of principles to govern the operating
environments of GBEs;• extend the reach of the Trade Practices Act;• establish the Australian Competition and Consumer
Commission and the National Competition Council;• introduce new access regimes for essential facilities; and• pass legislation, at the state and territory level. applying to
anti-competitive rules.
Implementation ofaspects of nationalcompetition policy
The Assistant Treasurer announced on 31 October 1995 that:
• the Australian Competition and Consumer Commission andthe National Competition Council will commence operationson 6 November 1995;
• a new access regime for essential facilities will also comeinto effect on 6 November 1995;
• prices surveillance will be extended to state and territoryGBEs; and
• trade practices law is expected to be extended to areasbeyond Commonwealth jurisdiction from 21 July 1996.

BUREAU OF INDUSTRY ECONOMICS
133
Appendix 2 Infrastructure prices andquality
Infrastructure services, to varying degrees, contribute to costs of production in allindustries and, consequently, can influence the competitiveness of Australian firms.The cost of infrastructure services accrues through services used directly by a firm.Infrastructure costs also accrue indirectly through the passing on of infrastructureservice costs used in the production of intermediate inputs. The BIE estimates that thecost of infrastructure service inputs to those of final output vary between industriesand ranges from around 7 to almost 27 per cent (see chapter 4).
Infrastructure services also influence a firm’s cost of production through their quality.For example, firms expect infrastructure services to be reliable and this reliability (orthe lack of it) is factored into production, investment and marketing decisions. A lackof reliability can impose costs on the firm which are usually not reflected in the pricepaid for a service. Hence, both price and quality are important aspects of infrastructureprovision. This appendix reviews changes in the price and quality of key infrastructureservices during the reform process. The review, where possible, also includes aninternational dimension by drawing on past BIE studies which have benchmarkedAustralian infrastructure prices and quality against world best practice. A detailedoverview of the results of these studies is provided in BIE (1994a and 1995b).
The appendix covers the following infrastructure service industries; electricity, naturalgas, water, telecommunications, waterfront, coastal shipping, aviation, rail and roadfreight.
A2.1 ElectricityReforms to the electricity industry, including commercialisation, corporatisation,privatisation, pricing reforms, and, more recently, reforms aimed at increasingcompetition, have resulted in an improvement in the overall performance of theindustry. This is reflected in both an increase in dividend payments to governmentsand a fall in real electricity prices.
Real electricity prices in Australia have fallen, on average, by about 9 per cent overthe period 1987-88 to 1993-94 (figure A2.1). Pricing reforms have seen stateelectricity utilities reducing cross-subsidies between users. The electricity utilitieshave reduced prices to large customers, such as commercial and industrial users, whilekeeping real prices for residential customers relatively unchanged. Figure A2.1 showsresidential electricity prices declining, on average, by around 1 per cent, between

134 MONITORING MICRO REFORM — SETTING THE SCENE
1987-88 and 1993-94. Average prices for commercial users have declined by about12.5 per cent.
Figure A2.1 Average real electricity prices, 1987-88 to 1993-94
7
7.5
8
8.5
9
9.5
10
87-88 88-89 89-90 90-91 91-92 92-93 93-94
cent
s/kW
h
Average
Residential
Commercial
Note: Prices are in 1989-90 dollars.Source: ESAA (1995).
The nature and pace of pricing reforms have varied between states. Price restructuringbetween consumer categories has occurred in each of the states, although to varyingdegrees (table A2.1). In most states, this has resulted in a substantial real reduction incommercial and/or industrial tariffs with an increase or a smaller decrease in the realprices paid by residential consumers. In New South Wales, for example, average realelectricity prices for industrial users declined by around 14 per cent over the period1987-88 to 1993-94. Over the same period, average real prices paid by commercialusers declined by 24 per cent. This compares with a small increase in residential pricesof less than 1 per cent over the same period.
But cross-subsidises still remain in the electricity industry. By way of example, figureA2.2 illustrates Sydney Electricity’s cost recovery levels for domestic and generalsupply over the period 1992-93 to 1995-96. The figure shows that while domesticsupply fails to cover costs, general supply more than covers its costs. It also showsthat although cross subsidisation between domestic and general supply has beenreduced in recent years, substantial cross-subsidisation still remains (i.e domesticsupply continues to make losses while general supply more than covers costs).
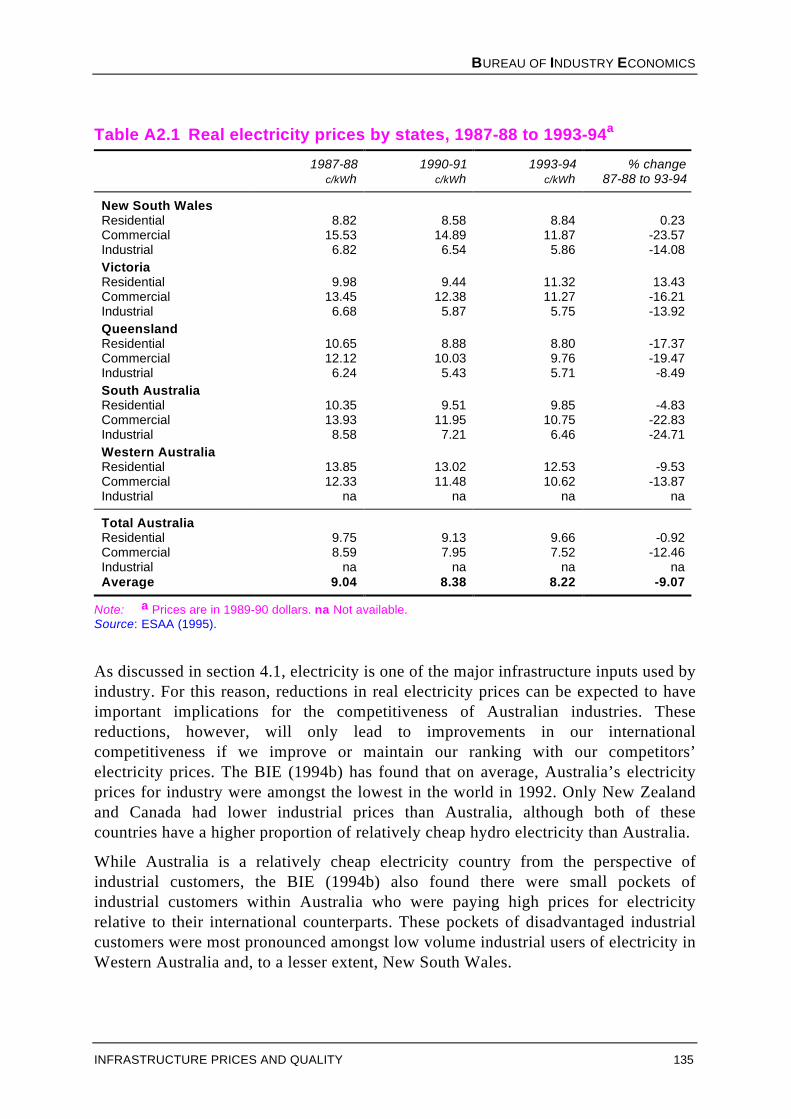
BUREAU OF INDUSTRY ECONOMICS
INFRASTRUCTURE PRICES AND QUALITY 135
Table A2.1 Real electricity prices by states, 1987-88 to 1993-94a
1987-88c/kWh
1990-91c/kWh
1993-94c/kWh
% change87-88 to 93-94
New South WalesResidential 8.82 8.58 8.84 0.23Commercial 15.53 14.89 11.87 -23.57Industrial 6.82 6.54 5.86 -14.08VictoriaResidential 9.98 9.44 11.32 13.43Commercial 13.45 12.38 11.27 -16.21Industrial 6.68 5.87 5.75 -13.92QueenslandResidential 10.65 8.88 8.80 -17.37Commercial 12.12 10.03 9.76 -19.47Industrial 6.24 5.43 5.71 -8.49South AustraliaResidential 10.35 9.51 9.85 -4.83Commercial 13.93 11.95 10.75 -22.83Industrial 8.58 7.21 6.46 -24.71Western AustraliaResidential 13.85 13.02 12.53 -9.53Commercial 12.33 11.48 10.62 -13.87Industrial na na na na
Total AustraliaResidential 9.75 9.13 9.66 -0.92Commercial 8.59 7.95 7.52 -12.46Industrial na na na naAverage 9.04 8.38 8.22 -9.07
Note: a Prices are in 1989-90 dollars. na Not available.Source: ESAA (1995).
As discussed in section 4.1, electricity is one of the major infrastructure inputs used byindustry. For this reason, reductions in real electricity prices can be expected to haveimportant implications for the competitiveness of Australian industries. Thesereductions, however, will only lead to improvements in our internationalcompetitiveness if we improve or maintain our ranking with our competitors’electricity prices. The BIE (1994b) has found that on average, Australia’s electricityprices for industry were amongst the lowest in the world in 1992. Only New Zealandand Canada had lower industrial prices than Australia, although both of thesecountries have a higher proportion of relatively cheap hydro electricity than Australia.
While Australia is a relatively cheap electricity country from the perspective ofindustrial customers, the BIE (1994b) also found there were small pockets ofindustrial customers within Australia who were paying high prices for electricityrelative to their international counterparts. These pockets of disadvantaged industrialcustomers were most pronounced amongst low volume industrial users of electricity inWestern Australia and, to a lesser extent, New South Wales.

136 MONITORING MICRO REFORM — SETTING THE SCENE
Figure A2.2 Sydney Electricity — cost recovery levels, 1992-93 to1995-96
-20
-10
0
10
20
30
92-93 93-94 94-95 95-96
DomesticGeneral Supply
%
Source: Parry (1995).
The BIE’s international benchmarking also shows there is room for productivityimprovement which could lead to further cost reductions. In 1992, Australian state’stotal factor productivity levels for electricity were below world best practice, althoughthis gap narrowed some what between 1989-90 and 1991-92. In 1992, productivitygaps relative to US investor owned utilities ranged from a low of 16.6 per cent forQueensland to a high of 33.4 per cent in Victoria (BIE 1994b).
Evidence concerning the reliability of electricity supply suggests that the averageinterruption time per customer was higher in Australia than overseas. But, there isevidence to suggest that this is improving. The BIE will be publishing an update onthe international performance of the electricity industry in early 1996.
A2.2 Natural gasThe gas industry in Australia, unlike most infrastructure industries is characterised bya relatively large amount of private sector participation, particularly in the productionand transmission of gas. Of the GBEs involved in the gas industry, the Gas and FuelCorporation of Victoria (GFCV) is the largest utility.
International comparisons of natural gas prices reveals that Australian industrial,commercial and residential prices of natural gas compare favourably to prices paid inmost industrial countries. In 1992, the average industrial price of natural gas waslower in Australia than in Japan, Europe and New Zealand, but higher than in both theUnited States and Canada. Once differences in consumption per customer are taken

BUREAU OF INDUSTRY ECONOMICS
INFRASTRUCTURE PRICES AND QUALITY 137
into account Australia’s natural gas prices were comparable to those in North America(BIE 1994c).
In contrast to electricity prices, real gas prices in both Victoria and South Australiahave increased in recent years. Over the period 1987-88 to 1993-94, real gas pricesincreased by around 11 per cent in Victoria and 2 per cent in South Australia (figureA2.3). In Western Australia, on the other hand, real gas prices have declined byaround 19 per cent since 1987-88. The increase in Victorian gas prices has largelybeen a result of the renegotiation of major contracts. Victoria has, however, had thelowest gas prices in Australia for over 20 years. The BIE (1994c, p. 22) reports thatVictoria’s prices were around 50 per cent lower than those in Queensland and WesternAustralia.
Figure A2.3 Percentage change in real gas prices, 1987-88 to 1993-94
-20
-15
-10
-5
0
5
10
15
State EnergyCommission
of WA
PipelineAuthority of
South Australia
Gas & FuelCorporationof Victoria
%
Source: SCNPMGTE (1994, 1995).
Some pricing reforms have also been applied to the gas industry in an attempt toreduce the cross-subsidisation between industrial users and residential and commercialusers. For example, the GFCV has frozen tariffs for industrial users while increasingresidential prices. But, according to the SCNPMGTE (1995, p. 42), significant cross-subsidies remain in the gas industry.
These pricing reforms are reflected in variations in price movements betweencustomer classes. Figure A2.4 illustrates that while average Australian residential andcommercial gas prices have increased (4 per cent and 9 per cent respectively), averageindustrial gas prices have declined by around 2 per cent over the period 1987-88 to1992-93.

138 MONITORING MICRO REFORM — SETTING THE SCENE
Figure A2.4 Average real gas prices by customer classes, 1987-88 to1992-93
2
3
4
5
6
7
8
87-88 88-89 89-90 90-91 91-92 92-93
Residential
Commercial
Industrial $/G
J
Note: Prices are in 1987-88 dollars. Average prices are a weighted average covering all states exceptTasmania.
Source: AGA (1994).
Due to a lack of data, the BIE’s international benchmarking of gas did not undertake adetailed analysis of quality of service indicators for the natural gas industry. However,the Bureau in discussions with a number of major industrial customers found that gassupply reliability was not a major issue. The future continuity of supply, was the keyconcern (BIE 1994c).
A2.3 WaterPricing reforms in the water industry, including increasing reliance on user pays andincreased emphasis on cost recovery, have resulted in real water prices in Australiaincreasing by around 9 per cent since 1987-88 (figure A2.5).
Water pricing reforms have also seen water utilities reducing cross subsidies betweennon-domestic and residential users. The adoption of user-pay principles has resulted inless reliance on property based charges which previously resulted in cross subsidiesbetween small users of water with large property values to intensive residential andcommercial users with low property values.
Irrigation services, which account for more than two-thirds of Australia’s total waterconsumption, are still priced well below the full cost of provision. And, althoughwater pricing has been a significant issue for providers of irrigation services, they arestill a long way from recovering costs. According to SCNPMGTE (1995, p. 52), thelow level of cost recovery for irrigation services has a significant impact on theprofitability and return to assets of water authorities involved in irrigation.

BUREAU OF INDUSTRY ECONOMICS
INFRASTRUCTURE PRICES AND QUALITY 139
Figure A2.5 Real water prices, 1987-88 to 1993-94
94
96
98
100
102
104
106
108
110
87-88 88-89 89-90 90-91 91-92 92-93 93-94
Inde
x (1
987-
88=1
00)
Source: SCNPMGTE (1994, 1995).
One indicator of service quality for water GTEs is compliance with water qualitystandards. According to the SCNPMGTE (1995, p. 57), compliance with water qualityhas generally been high throughout the period 1989-90 to 1993-94, averaging around95 per cent.
The BIE expects to publish its first international performance benchmarking report onthe water and sewerage industry in late 1996.
A2.4 TelecommunicationsPublished telecommunications prices have fallen in real terms in Australia followingthe introduction of competition. Over the period 1990 to 1994, prices for a basket ofnational services for business users (including fixed charges, local and long distancecalls) declined by around 9 per cent. Over the same period, international call chargesin Australia declined by 28 per cent and mobile call charges declined by 26 per cent(figure A2.6). Putting together a composite basket of telecommunications services, theBIE (1995e) found that Australia ranked 11th out of the 24 OECD countries. Thisranking had remained unchanged since 1989.
Although telecommunications prices have fallen in real terms, Telstra only managedto meet its 1993-94 price cap obligations by virtue of discounts and the alloweddeferral of 1 per cent until next year (Austel 1994). According to the BTCE (1995b),Telstra’s prices have not fallen any faster than in the period leading up to theintroduction of competition. Prior to the introduction of competition price falls wouldhave largely reflected changes in technology and productivity.

140 MONITORING MICRO REFORM — SETTING THE SCENE
Figure A2.6 Average real telecommunications prices, 1990-1994
60
70
80
90
100
110
1990 1992 1994
National BusinessBasket
International CallCharges
Mobile CallCharges
Inde
x (1
990=
100)
Source: BIE (1995e).
Although published telecommunications prices in Australia have declined in realterms, they have not declined as fast as our competitors’ prices. Table A2.2 illustratesthat while the basket of national services for business users and international callshave been declining in Australia, these declines have been less than the OECDaverage. Only on mobile call charges, have published prices in Australia fallen morethan the OECD average (BIE 1995e). The BIE (1995e) observed that discounts offthese published prices are an increasingly important element of pricing in Australiaand other countries. Based on a constructed business basket, small business users hadaccess to discounts of around 6.5 per cent of the published prices. Medium and largebusiness users had access to larger discounts, of around 8 and 10 per cent of publishedprices, respectively. Businesses could also obtain greater volume discounts for specificservices. Discounts of up to 25 per cent on voice communication charges wereavailable through aggregators or resellers. BIE analysis suggests that while discountsin Australia appear to be among the highest in the OECD they are insufficient to alterour relative ranking.
Table A2.2 Comparison of changes in published real telecommunicationprices, 1990 to 1994
Telecommunications category Australia
(%)
OECD average
(%)
National business basket -8.9 -15.3
International calls to OECD countriesa -28.4 -34.6
Mobile services basket -26.3 -20.6
Note: a Peak rate 3 minutes international calls to OECD countries.Source: BIE (1995e).
BUREAU OF INDUSTRY ECONOMICS
INFRASTRUCTURE PRICES AND QUALITY 141
In terms of quality of service, the BIE (1995e) found some improvement in thereliability of the telecommunications network since the introduction of competition,but significant scope for improvement remained. In 1992-93, Australia’s performancewas below international best practice on such quality of service indicators as callcompletion rates and fault clearances.
Australian productivity in telecommunications, while improving, was low byinternational standards. Out of a sample of 11 comparable countries, Australia rankedlast in terms of labour productivity and seventh in terms of capital productivity in1992 (BIE 1995e p. xv). This suggests there is still considerable scope for furtherprice reductions for both industry and domestic consumers.
A2.5 WaterfrontThe performance of Australia’s waterfront industry is crucial to the competitiveness ofAustralian businesses because the vast majority of Australia’s international cargomoves through sea ports. Beyond this, a sizeable proportion of the domestic transporttask (for intermediate and finished goods) involves the use of sea transport betweenAustralian ports.
The extensive reliance on the waterfront means that the costs associated with anywaterfront inefficiencies can be high. During the 1980s it became increasingly obviousthat the waterfront was inhibiting the competitiveness of Australian firms. Forexample, the Task Force on Shore Based Shipping (Webber 1986) highlighted lowproductivity, delays and costs as being major problems. The BTCE (1989) estimatedthe costs of waterfront unreliability in 1988 ranged between $850 million and $1 000million. The Australian waterfront has undergone a substantial program of reformsince 1988. Reforms have affected stevedoring, towage, grain handling and portauthorities. The following discussion relies extensively on the BIE’s latestinternational benchmarking report on the waterfront (BIE 1995c).
Stevedoring productivity, as measured by crane rates, is generally used as an indicatorof how performance has changed. Productivity improved between 1989 and 1992 andthis in turn benefited port users through lower charges and improved service quality,for example, faster turnaround times. From mid 1991, crane rates (containers movedper crane hour) started to show real improvements, coinciding with the introduction ofthe enterprise agreements. The national average container rates increased from12.8 teus per hour in 1989 to 20.1 teus per hour in September 1992. However, ratherthan witnessing continuing progress in waterfront productivity, the past two years sawsome serious setbacks in crane rates.
From the September quarter 1993 to the December quarter 1994 crane rates fell atMelbourne, Sydney and Brisbane, but increased at Fremantle and Adelaide(figure A2.7). This volatility has continued into 1995 with improved performances

142 MONITORING MICRO REFORM — SETTING THE SCENE
recorded at Sydney, Melbourne and Adelaide but falls in Brisbane and Fremantle. Theoverall five port average fell between September 1993 and December 1994, butimproved in March 1995 quarter. This improvement in the five-port average wasreversed in the June quarter when the teus per hour rate fell to 18.9. In that quarter set-backs occurred at Melbourne, Sydney, Brisbane, Adelaide and Fremantle (figureA2.7). Subsequent data indicates some improvement, with the five-port averageincreasing to 19.5 teus per hour. However, this rate remains below the rate achieved inSeptember 1992.
According to the PSA (1994a), the real price of container stevedoring services fell byaround 42 per cent over the seven years to 1993. The bulk of this reduction occurredthroughout 1991 and 1992 with the implementation of the major elements of thewaterfront reform process. But, not all of the price fall can be attributed to the reformprocess. Lower volumes through the recession and competition also placed pressureon stevedores’ charges (BIE 1995c).
According to the PSA (1994b), harbour towage charges had generally not beenreduced as waterfront reforms were implemented. The PSA found that towage reformshad significantly reduced crewing costs, but that these had been offset by otherincreases (e.g. fuel). The PSA stated that ‘the impact of the reforms has been, at best,to restrain charges, although these have increased in some ports (PSA 1994b, p. 101).
Shippers have also benefited from lower terminal handling charges. Reductions interminal handling charges were most marked for 40 foot containers, but declines incharges were not consistent across all lines or trades (PSA 1994c).
The performance of port authorities improved since the beginning of the reformprocess. This is reflected in improved financial performance, in terms of the operatingsales margin and dividends. On average port authority charges fell, with the averageindex of real prices for port authority services declining by 14 per cent between 1989-90 and 1993-94 (SCNPMGTE 1995).
Despite these improvements in costs to users, an international comparison ofAustralia’s waterfront charges has revealed that while waterfront charges for coalhandling in Australia are among the lowest in the world, charges for containers areconsiderably higher than most ports in New Zealand, Asia and Europe. Relativelyhigh terminal charges were the main reason for the high charges for containers, butthese were compounded by relatively high port authority, pilot and towage charges.Australia’s non-terminal waterfront charges for break bulk (non-containerised general)cargoes were also high by international standards, being substantially higher thanthose applying to ports in the southern United States, Mexico and Panama. Portauthority and ancillary charges were the main cause of the differences in break bulkcharges between the ports (BIE 1995c).

BUREAU OF INDUSTRY ECONOMICS
INFRASTRUCTURE PRICES AND QUALITY 143
Figure A2.7 Crane ratesa by major Australian ports, June 1990 to June 1995
Brisbane
0
5
10
15
20
25
Jun-90 Jun-91 Jun-92 Jun-93 Jun-94 Jun-95
TEUs per hourMelbourne
0
5
10
15
20
25
Jun-90 Jun-91 Jun-92 Jun-93 Jun-94 Jun-95
TEUs per hour
10
15
20
25Adelaide
0
5
Jun-90 Jun-91 Jun-92 Jun-93 Jun-94 Jun-95
TEUs per hourFremantle
0
5
10
15
20
25
Jun-90 Jun-91 Jun-92 Jun-93 Jun-94 Jun-95
TEUs per hour
Sydney
0
5
10
15
20
25
Jun-90 Jun-91 Jun-92 Jun-93 Jun-94 Jun-95
TEUs per hour Five port average
0
5
10
15
20
25
Jun-90 Jun-91 Jun-92 Jun-93 Jun-94 Jun-95
TEUs per hour
Notes: Net rates measure the number of teus moved per net hour (the time the ship is at berth less time due to shift breaks or unforseen circumstances — eg bad weather and industrial disputes. Crane
rate is the number of teus moved per crane per net hour. Neither the WIRA nor the BTCE monitored terminal performance between December 1992 and June 1993 hence the break in the series. The
five port average is an average of Melbourne, Sydney, Brisbane, Fremantle and Adelaide.Source: BIE (1995b).

144 MONITORING MICRO REFORM — SETTING THE SCENE
While high costs are an important concern for liner shipping companies and theirAustralian customers, timeliness and reliability can be a more crucial issue for overallcompetitiveness. The containers moved by liner shippers tend to contain high valueand time sensitive goods. Timeliness and reliability are also important for linershipping companies as they operate according to fixed schedules.
Reliability of port services can also be measured in terms of the time delaysexperienced by ships at each port. Average time delays, for example, can be estimatedwith reference to the average difference between the planned time in port and actualtime in port for a vessel. While average delays provide a crude performance indicator,the duration of the delays is important when assessing the costs imposed on linershipping activities and ultimately shippers. For instance, liner shippers delayed in aport for, say 10 hours, can generally make up this lost time during the voyage to thenext port. However, if delays extend to, say 2 days, this potential to make up lost timeis largely removed. In this instance, companies may be forced into the costly situationof by-passing subsequent ports. In the case of Sydney, for example, the overallperformance of the port, has in the past, compounded the effect of poor terminalperformance. In 1994, for instance, while Barcelona had the poorest terminalperformance (ie actual production rates compared to planned production rates),Sydney recorded the highest average delays for P&O vessels. Average delays werealso high at Melbourne (BIE 1995c).
Average delays, however, tend to hide the true costs associated with delays in someAustralian ports. In Sydney and Melbourne, for example, the high average delaysexperienced by P&O in 1994 were due to a large proportion of vessels experiencinglengthy delays. For example, the most common delay, in Sydney experienced by25 per cent of P&O’s ships was around 1 day (20 to 30 hours). At Melbourne, themost common delay experienced by 45 per cent of ships was lower and wasunder 20 hours (figure A2.8).
Despite this, P&O’s experience indicates Melbourne could be considered a moreunreliable port. For instance, in 1994 30 per cent of P&O’s vessels at Melbourne, asagainst 20 per cent at Sydney, experienced delays of over 40 hours. Such lengthydelays can be extremely costly for liner operators.
P&O’s experience at the overseas ports is in some contrast to its Australianexperience. Similar to Melbourne and Sydney, P&O’s vessels experienced highaverage delays at Barcelona and Fos (15 to 25 hours). Like Melbourne, the majority ofthese delays were under 20 hours. Delays of this duration can usually beaccommodated within schedules. In contrast to the Australian ports only 10 per cent ofP&O’s vessels at Barcelona and Fos experienced the more potentially costly delays inexcess of 40 hours, in 1994.
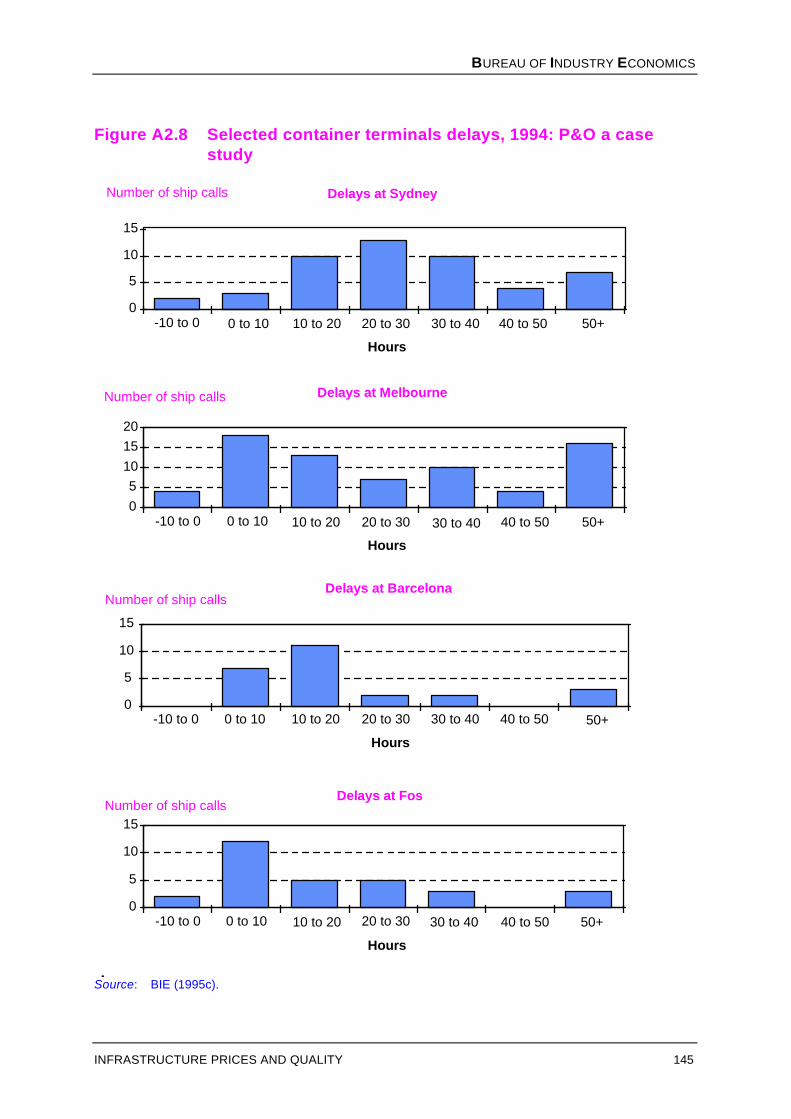
BUREAU OF INDUSTRY ECONOMICS
INFRASTRUCTURE PRICES AND QUALITY 145
Figure A2.8 Selected container terminals delays, 1994: P&O a casestudy
Number of ship calls Delays at Sydney
0
5
10
15
-10 to 0 0 to 10 10 to 20 20 to 30 30 to 40 40 to 50 50+
Hours
Delays at Melbourne
05
101520
-10 to 0 0 to 10 10 to 20 20 to 30 30 to 40 40 to 50 50+
Hours
Delays at Fos
0
5
10
15
-10 to 0 0 to 10 10 to 20 20 to 30 30 to 40 40 to 50 50+
Hours
Number of ship calls
Delays at Barcelona
0
5
10
15
-10 to 0 0 to 10 10 to 20 20 to 30 30 to 40 40 to 50 50+
Hours
Number of ship calls
Number of ship calls
Source: BIE (1995c).

146 MONITORING MICRO REFORM — SETTING THE SCENE
In terms of container productivity, the BIE (1995c) found that while most overseasports were moving ahead, Australia had stepped backwards. This highlights theimportance of implementing reforms that provide in-built incentives for continuousperformance improvements. Productivity improvements need to be consistentlymaintained over long periods before they can be expected to be reflected in revisedship schedules and lower freight rates.
A2.6 Coastal shippingAustralia’s coastal shipping industry provides vital transport services to a number ofindustries whose products are not readily amenable to long distance land transportalternatives. The competitiveness of some key Australian industries such as steelmaking and mineral processing is consequently importantly influenced by theperformance of coastal shipping. Australia’s large island land mass and relativelysmall and dispersed population also means that domestic users of transport servicesare generally more reliant on coastal shipping than in other countries.
In the 1970s and 1980s, coastal shipping lost a sizeable share of both container andnon-bulk cargoes to land transport (wherever these alternatives were available) andthose general cargo services remaining had a reputation for unreliability. Despitecoastal shipping’s natural advantage in the carriage of bulk cargoes, several reportscriticised the industry for being high cost, inefficient and unreliable (see, for example,Crawford 1982, p. 4).
Reforms to the coastal shipping industry, designed to improve the efficiency andcompetitiveness of the industry, have seen some sizeable improvements in labour andvessel productivity and to a lesser extent freight rates in recent years. The PricesSurveillance Authority reported that ‘reforms have been successful in providing lowercost structures for coastal ship operations’ and ‘shippers have also benefited withstable freight rates in 1991 and 1992 (constant in real terms) following significantsavings in 1990’ (PSA 1993).
Data provided by the PSA in 1995 indicates that real implicit freight rates for the BassStrait trade increased marginally between 1991-92 and 1993-94 (ie by less than oneper cent). The implicit freight rate for the Bass Strait trade in 1993-94 was 1.5 per centlower than in 1986-87 (BIE 1995g).
Vessel costs are an important factor in in-house pricing for vertically integratedoperators and are a good proxy for freight rates paid for independent users. The BIEhas found that Australian vessel costs were higher than those for similar vesselsregistered in five of the seven overseas countries chosen for benchmarking(BIE 1995g). Only the United States and Japan had higher vessel costs (figure A2.9).The capital cost component for Australian vessels was the lowest observed. However,manning costs were higher than five of the seven countries benchmarked the main

BUREAU OF INDUSTRY ECONOMICS
INFRASTRUCTURE PRICES AND QUALITY 147
contributors being high leave and wage on-costs. Australian fuel costs were moreexpensive than all countries selected, this largely reflects the excise tax paid on fuel.Vessel costs in all countries fell between June 1992 and June 1994. However, the BIEobserved that, with the exception of Norway, the decline in Australian vessel costswas less than the decline observed in the countries selected for benchmarking. As aconsequence ‘Australia’s uncompetitive cost standing did not change despite theexistence of a shipping reform process’ (BIE 1995g p. xv).
Figure A2.9 Dry bulk vessel costsa, selected countries, June 1994 andpercentage changeb on June 1992
0
50
100
150
200
250
USA Japan Australia NZ Germany Norway UK Korea
Index of costs in Australian dollars
244
123.1107.1 103.6 95.8 93.9 87.8 87.4
.0
-6-4-20
Percentage change in costs
Note: a Index Australia 1992 = 100. Size = 35 000 dwt. Vessel costs relate to the sailing segments of seavoyages and comprise capital, operating and voyage costs. b Percentage change not calculated forSouth Korea as it was not included in the set of selected countries in 1992.
Source: BIE (1995g).
A BIE survey of independent (i.e. not in-house) shippers indicated that both bulk andnon-bulk users perceived a general trend of improvement in coastal shipping servicesbetween 1993 and 1994 (BIE 1995g). Shippers generally rated the level of servicethey received quite highly in 1994. Particularly, for the most important elements ofservice such as reliability of delivery time, care of goods and equipment suitability.However, both bulk and non-bulk shippers expressed concerns about freight ratesbeing too high. Non-bulk survey respondents reported that more than 86 per cent ofships arrived on time, down from around 88 per cent in 1993. Similarly, bulkrespondents reported that more than 85 per cent of ships arrived on time in 1994,down from 95 per cent recorded in 1993 (BIE 1995g).

148 MONITORING MICRO REFORM — SETTING THE SCENE
The BIE (1995g) also found that for both bulk and non-bulk shippers, reliability ofdelivery time was the most important aspect of coastal shipping service. A measure ofreliability in the industry is the ratio of ship days lost through industrial disputes toship days available. The movement in this indicator between 1987 and 1994 showsthat the reliability of the industry improved considerably in terms of a markedreduction in ship days lost due to crew disputes (table A2.3). There was, however, asizeable deterioration in this indicator in 1994. The number of ship days lost throughcrew industrial disputes increased from 0.07 per cent in 1993 to 0.19 per cent in 1994(BIE 1995g).
Table A2.3 Australian ship days lost due to crew disputes, 1987 to 1994
Year Ship days lost Ship days available % days lost
1987 119 35 000 0.341988 72 33 480 0.221989 48 33 840 0.141990 28 33 480 0.081991 38 33 120 0.111992 50 32 400 0.151993 23 32 400 0.071994 63 32 400 0.19
Source: Information supplied by ASA, found in BIE (1995g).
A2.7 AviationThe deregulation of Australia’s domestic aviation industry in 1990 was accompaniedby a fall in average domestic air fares. As illustrated in figure A2.10, average fares in1995, were around 26 per cent lower than before deregulation (PSA 1995). However,the downward movement in average fares obscures trends in different fare classes androutes. Economy, business and first class fares increased in real terms since September1990, but average fares fell because of discounting and because an increasingproportion of passengers were able to take advantage of fare discounts (BIE 1994d).
The BIE (1994d) found that many private sector firms restructured their travelmanagement to access discount fares, despite the often limiting conditions attached tosuch fares. Use of economy fares by business also increased.
As a result of lower average fares, demand for air travel increased since deregulation.The number of passengers carried by the major airlines in the March quarter 1995 wasaround 70 per cent higher than in the September quarter of 1990 (figure A2.10).

BUREAU OF INDUSTRY ECONOMICS
INFRASTRUCTURE PRICES AND QUALITY 149
Figure A2.10 Average air fares and number of passengers carried,1991 to 1995
2
2.2
2.4
2.6
2.8
3
3.2
3.4
3.6
3.8
4
Mar 91 Mar 92 Mar 93 Mar 94 Mar 9512
13
14
15
16
17
18
19
20
Cen
ts p
er p
asse
nger
km
Mill
ion
Average Air FaresPassengers Carried
Source: PSA (1995).
The percentage of domestic flights arriving and departing on time at capital cityairports also improved since deregulation (table A2.4). In 1992, the percentage offlights which arrived/departed within 15 minutes of schedule (by internationalconventions this is considered to be ‘on time’) was substantially higher than in the twoprevious years.
Table A2.4 Percentage of flights arriving and departing on time,September quarters, 1990 to 1992
Arrivals Departures
Airport 1990 1991 1992 1990 1991 1992
Adelaide na 69 77 na 85 94Brisbane 72 75 82 77 87 94Melbourne 60 77 78 63 85 94Perth na 49 63 na 85 90Sydney 75 82 84 79 83 91
Note: na not available.Source: BTCE [1993, pp. 117-119] found in BIE (1994d).
There is some evidence to suggest, however, that the performance of this sector, interms of some aspects of service quality, then regressed. Increased departure delaysexperienced at Sydney airport were an indication of this. While there is no officialdata covering this area, the on time performance of Kingsford Smith airport has been
150 MONITORING MICRO REFORM — SETTING THE SCENE
affected by continuing problems with the introduction of new air traffic controlsoftware. Based on advice from the Commonwealth Department of Transport, Sydneyairport’s average aircraft movement rate, during busy hours, has increased from 54movements per hour, prior to the commissioning of the parallel runway, to an averagerate in October 1995 of around 60 movements per hour. While there is no directrelationship between movements per hour in busy periods and on-time performance,the increases in hourly capacity could lead to improvements in recorded on-timeperformance.
The BIE’s (1994d) international comparisons of air fares reveals that Australia’s airfares and freight rates were among the lowest in the world. Australia’s domestic airfares were well below those levied on similar length routes than those in Japan andwithin Europe and North America. However, despite the quite sizeable priceadvantage which existed for the first, business and economy class fares, much of thisadvantage was eroded once economy discount fares were considered.
These findings also extended to Australia’s international routes, although the picturewas more complicated. On the shorter haul international routes (e.g. Sydney-Auckland), air fares to and from Australia were well below those experienced oncomparable routes overseas. On medium haul routes (eg Melbourne-Singapore andCairns-Tokyo), the economy fares tended to be above those charged on comparableroutes overseas (such as London-New York and Amsterdam-New York). This mayhave been due to differences in the level of competition on these routes, as well asdemand side factors. Over the longer haul routes, no distinct trend was apparent. Forexample, the Sydney-London fares were competitive with the London-Singaporefares, but the Sydney-Los Angeles fares were well above the Hong Kong-Los Angelesfares.
Freight rates on Australia’s domestic routes were, in general, below the internationalaverage and well below those charged in Europe and from Japan. The freight ratecomparisons revealed very competitive freight rates from Australia. Freight rates fromAustralia were consistently below those for cargo travelling to Australia over the sameroutes (BIE 1994d).
On service standards the BIE (1994d) found that Australia standards are consistentwith many of the better performing airlines overseas. Areas where Qantas’ andAnsett’s performance are rated highly are safety, on-board comfort and in-cabinservice.
A2.8 RailRail transport makes up a significant proportion of the costs of some of Australia’slargest exporting industries, including coal and grains. Inefficiencies within the railindustry therefore have the potential to significantly affect the competitiveness of key

BUREAU OF INDUSTRY ECONOMICS
INFRASTRUCTURE PRICES AND QUALITY 151
Australian industries. The inefficient operation of railway services in Australia hasbeen reflected in the large financial losses incurred by many of the rail authorities.Governments in the past have also frequently required rail authorities to fulfilgovernment social policies which have resulted in pricing practices such as crosssubsidisation. Reforms aimed at improving the performance of the rail industry haveincluded: commercialisation, corporatisation, pricing reforms and moves towardsincreasing competition.
The reforms to the industry have seen average real prices for rail GTEs decline byaround 7 per cent over the period 1987-88 to 1993-94 (figure A2.11). This decline,however, masks significant variation in price movements for freight and passenger railservices. Since 1989-90, rail freight prices have fallen by nearly 19 per cent whileurban passenger fares increased by 20 per cent and non-urban passenger faresincreased by 50 per cent (SCNPMGTE 1995). This differential, in part, reflects areduction in the cross subsidies which are common in Australia’s rail networks.
While rail freights are declining there is still substantial potential for furtherreductions. The BIE (1993) found that Australian rail freight rates were, with theexception of general freight, much higher than world best practice. For example, in1991-92, NSW State Rail Authority and Queensland Rail had rail freight rates for coalhaulage that were 22 and 38 per cent higher, respectively, than US rates forcomparable haul lengths. Rail freight rates for general freight (comprising containers,steel, motor vehicles, paper products and other general merchandise) in Australia wereclose to best observed overseas rates in 1991-92.
Figure A2.11 Average real rail charges — all services, 1987-88 to 1993-94
88
90
92
94
96
98
100
87-88 88-89 89-90 90-91 91-92 92-93 93-94
Inde
x (1
987-
88=1
00)
Note: Average price index excludes National Rail Corporation.Source: SCNPMGTE (1994, 1995).

152 MONITORING MICRO REFORM — SETTING THE SCENE
The reliability of Australia’s rail networks, whether measured by transit time, on-timearrival performance, or availability of goods to the customer at the time promised, isgenerally inferior to that of road transport (BIE 1993). While there was a slightimprovement in the average timeliness of freight trains for some Australian systemsover the period 1989-90 to 1993-94, there was some variation between systems. Forexample, in 1993-94 the timeliness of freight in Queensland, although improvingmarginally, was significantly below that in the other states (table A2.5).
Table A2.5 On-time running of freight trainsa, 1989-90 to 1993-94
System 1989-90 1990-91 1991-92 1992-93 1993-94
Queensland Railways na na 45 48 50
State Rail Authority of NSW 59 79 78 81 85
Westrail na 65 72 83 70
Australian National RailwaysCommission
53 72 81 63 65
Public Transport Corporation ofVictoria
89 92 96 89 78
Note: a Defined as percentage of trains arriving within 30 minutes of the scheduled arrival time. na Notavailable.
Source: SCNPMGTE (1994, 1995), BIE (1993).
A2.9 Road freightRoad freight in Australia is essentially a private enterprise service. Australianbusinesses appear to be generally well served by the road freight industry (BIE 1992).In relation to price, indicative survey data suggests that Australian road freight rateswere broadly similar to those applying overseas in 1992 (BIE 1992).
Table A2.6 International comparison of road freight timeliness, reliability,loss and damage rates, 1992
Country On-time pick-up
(%)
On-time delivery
(%)
Loss and damage
(%)
Australia:
Operator survey 94 96 0.4 User survey 95 96 0.6
United Statesa 94 97 0.9
Canadaa 96 96 0.4
United Kingdoma na 92 0.4
New Zealanda na 85 1.6
Note: a Data for overseas countries based on operator survey information. na Not available.Source: BIE 1992.

BUREAU OF INDUSTRY ECONOMICS
INFRASTRUCTURE PRICES AND QUALITY 153
Likewise, in terms of on-time delivery relative to promised time, Australian roadfreight services were on a par with the United States, Canada and the UnitedKingdom. On incidence of lost and damaged freight, Australia’s performance wassuperior to that in the United States and equivalent to that in Canada and the UnitedKingdom in 1992 (table A2.6).
A2.10 Concluding commentsIn the same way as the nature and pace of infrastructure reform has varied betweenindustries, so has the impact of reform varied between individual GBEs. In someinstances, the reform process has been successful in reducing prices and improvingquality of infrastructure services. Electricity and telecommunications fall into thiscategory. In other cases, for example water, infrastructure prices have increased,reflecting the reform process and the removal of non-commercial cross subsidies. Inother instances, the impact of the reform process, particularly with respect to servicequality, has been positive but appears to be short lived, with quality improving for ashort time before backsliding. Some areas of the waterfront fall into this category.
Even in those infrastructure industries which might be considered as reform successesthere is no room for complacency. International benchmarking undertaken by the BIEsuggests that much more adjustment is needed before Australia’s infrastructure can besaid to be operating at world best practice. Even when this goal is ultimately achieved,incentives must be in place to ensure that the momentum continues the BIE’sbenchmarking work starkly illustrates that while we are improving, so is the rest of theworld.
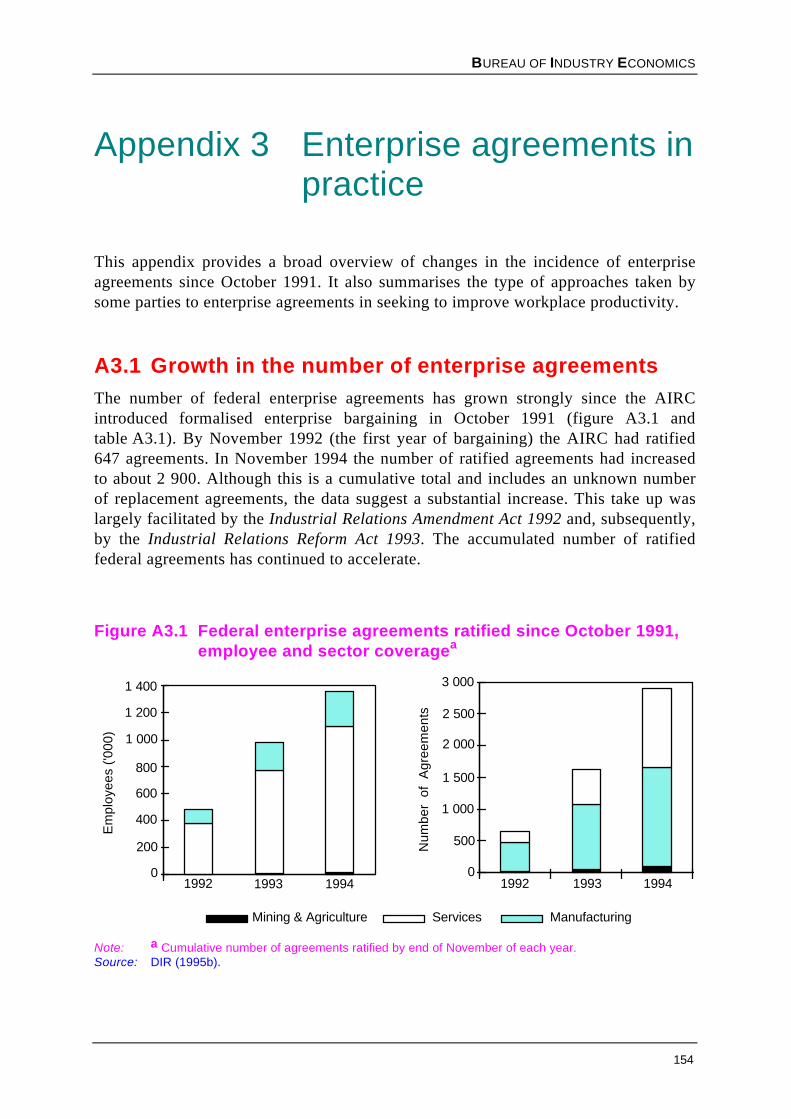
BUREAU OF INDUSTRY ECONOMICS
154
Appendix 3 Enterprise agreements inpractice
This appendix provides a broad overview of changes in the incidence of enterpriseagreements since October 1991. It also summarises the type of approaches taken bysome parties to enterprise agreements in seeking to improve workplace productivity.
A3.1 Growth in the number of enterprise agreementsThe number of federal enterprise agreements has grown strongly since the AIRCintroduced formalised enterprise bargaining in October 1991 (figure A3.1 andtable A3.1). By November 1992 (the first year of bargaining) the AIRC had ratified647 agreements. In November 1994 the number of ratified agreements had increasedto about 2 900. Although this is a cumulative total and includes an unknown numberof replacement agreements, the data suggest a substantial increase. This take up waslargely facilitated by the Industrial Relations Amendment Act 1992 and, subsequently,by the Industrial Relations Reform Act 1993. The accumulated number of ratifiedfederal agreements has continued to accelerate.
Figure A3.1 Federal enterprise agreements ratified since October 1991,employee and sector coveragea
0
200
400
600
800
1 000
1 200
1 400
1992 1993 1994
Em
ploy
ees
('000
)
0
500
1 000
1 500
2 000
2 500
3 000
1992 1993 1994
Num
ber
of A
gree
men
ts
ManufacturingMining & Agriculture Services
Note: a Cumulative number of agreements ratified by end of November of each year.Source: DIR (1995b).

BUREAU OF INDUSTRY ECONOMICS
ENTERPRISE AGREEMENTS IN PRACTICE 155
As at 6 October 1995, an estimated 5865 federal agreements had been formalisedsince October 1991 (DIR 1995b). The majority of new agreements came fromunionised workplaces (DIR 1995a). Thus, the extension of formal enterprisebargaining, through enterprise flexibility agreements, to workplaces with little or nounion coverage one of the central features of the 1993 Reform Act had littleeffect in the first months of operation. While the number of flexibility agreements isstill small, there has been a steady increase in their number with 13 approved in theDecember quarter 1994, 21 in the March quarter 1995, 26 in the June quarter 1995and 37 in the September quarter 1995 (DIR 1995b).
DIR (1995a) suggests that the slow spread of formal agreements in non-unionisedworkplaces may reflect a number of factors including lack of experience inbargaining. The department also drew attention to a lower incidence of any formalbargaining in these workplaces. However, other factors are also relevant. Theseinclude the importance of informal agreements for this sector and the complexities anduncertainties associated with participating in the formal bargaining process.
Initially, most federal agreements occurred in the manufacturing sector but morerecently they have spread to the services sector (table A3.1). In 1992, 72 per cent ofall federal agreements were in manufacturing (particularly metals related industrieswhich accounted for 62 per cent)1 but the proportion of manufacturing agreements fellto 54 per cent in November 1994.
Over the same period, agreements in the services sector grew from 27 per cent of thetotal to 43 per cent. A further breakdown of the service sector agreement approved byNovember 1994 shows that 21 per cent of all agreements are in infrastructureindustries (electricity, gas and water, construction, transport and storage, andcommunication), 6 per cent are in public administration and defence. Business,community and personal services account for 16 per cent (DIR 1995b). Serviceindustries such as wholesale and retail trade, education, health and communityservices tend to have a lower proportion of agreements than other industries in theservices sector (DIR 1995b). This may be due to a high proportion of these workersbeing covered by state awards. Other factors may also contribute to these differencesin coverage. These include inter-industry differences in workplace size and employerand union strategies. In the mining and agriculture sector, federal agreements remainfew — in 1994 they represented just 3 per cent of the total. DIR (1995b) has advisedthe BIE that the former Coal Industry Tribunal approved 43 site agreements, coveringsome 12 500 employees, which presently are not included in their statistics.
1 The predominance of agreements in the metals related industries reflected the influence of the
metals workplace bargaining framework agreement which was negotiated before the October1991 national wage case decision. DIR (1993b, p. 6) point out that manufacturing sectoragreements have spread beyond these metal related industries and agreements have beenratified throughout the sector.

156 MONITORING MICRO REFORM — SETTING THE SCENE
Table A3.1 Federal enterprise agreements, 1992 to 1994a
1992 1993 1994 1995
All AIRC ratified federal agreements
Number of formalised agreements 647 1 624 2 886 5 865Number of employeesb 477 000 983 000 1 360 000 naEmployees as a proportion of employees underfederal awards (%)b 24 49 57 naEmployees covered as a proportion of allAustralian employees (%)b
7 15 21 na
Average annual wage increases for currentagreementsc- per agreement (%)- per employee (%)
8.95.7
5.03.3
4.73.5
nana
Private Sector
Number of formalised agreements 566 1 351 2 373 naNumber of employeesb 222 000 389 000 638 000 naProportion of private sector employees underfederal awards (%)b 18 32 44 na
Public Sector
Number of formalised agreements 81 273 513 naNumber of employeesb 255 000 594 000 726 000 naProportion of public sector employees underfederal awards (%)b 32 75 77 na
Formal duration of agreements (%)
Less than 12 months 59 41 32 na1 year but less than 2 years 30 39 46 na2 years and longer 11 19 22 naMedian duration (months) 9.5 18 18 na
Notes: a Cumulative number of agreements — including replacement agreements — as at end Novemberof each year except 1995 where data reports cumulative number of agreements as at 6 October. bEmployee coverage net of replacement agreements, as estimated by DIR. DIR has indicated that areview it is undertaking of employee estimates may lead to some variation to the numbers reported.However, DIR believes the variations will not affect the trends shown in this table. c Excludingbonuses, performance pay, gain sharing and share acquisition. The relatively high wage increasesfor 1992 reflect the large number of short term metals agreements at that time and the relatively fewagreements in the service sector — where wage increases have tended to be lower. na = Notavailable.
Source: DIR (1995b).
The government has set a target of 80 per cent of employees in the federal jurisdictionin direct bargains by the end of 1996 (Keating 1994a). At the end of 1994, anestimated 57 per cent of all employees covered by federal awards had been party to anenterprise agreement, a significant increase since 1992, when there was only 24 percent coverage (table A3.1). Informal bargaining agreements, that is agreements notratified by the AIRC, are also important in the federal system. ‘At the end of 1994approximately seven in ten workplaces in the federal system with ten or moreemployees were covered by some form of direct bargain’ (DIR 1995a, p.20).

BUREAU OF INDUSTRY ECONOMICS
ENTERPRISE AGREEMENTS IN PRACTICE 157
The duration of agreements also varies substantially but has tended to increase since1992. The predominance of short term agreements in 1992 reflects the high incidenceof agreements (32 per cent of total 1992 agreements) made pursuant to the metalindustry framework agreement — all 235 or so metals agreements made under theframework expired on 1 January 1993.
The number of employees covered by federal agreements has more than doubled since1992, increasing from about 477 000 to just under 1.4 million in November 1994(figure A3.1). DIR (1995b) reports that the number of employees had increased to1.46 million by the end of 1994.2 Although the manufacturing sector accounts for justover half of all enterprise agreements at the federal level, manufacturing employeesaccount for about 20 per cent of all employees covered by federal enterpriseagreements. Service industry employees account for about 80 per cent of allemployees covered by federal agreements (reflecting the service sector’s high share ofthe total labour force).
Enterprise agreement coverage of public sector employees has outpaced that achievedin the private sector (table A3.1). At the end of November 1994 there were 2 373private sector agreements ratified by the AIRC, covering an estimated 44 per cent (or638 000 employees) of the private workforce in the federal jurisdiction. By contrast,the equivalent public sector coverage of about 77 per cent (726 000 employees) camefrom just 513 federal enterprise agreements.
Despite the growth in federal employee coverage, the agreements to date cover onlyabout 21 per cent of the total Australian workforce. This reflects the large proportionof employees who are either under state awards or have no award coverage at all.
In the states, progress with enterprise agreement coverage has been slower. Datasupplied to the BIE indicates that in any one state less than 30 per cent of employeescovered by state awards have enterprise agreements.3 Coverage ranges from 29 cent inNew South Wales and Queensland to 5 per cent of employees in Tasmania (DIR1995b).4
2 These estimates of employee coverage, should however, be considered as upper limits because
there may be an element of double counting associated with agreements which have beensubsequently replaced with another agreement.
3 DIR could not provide coverage estimates for Victorian state award employees.4 Although employee coverage data for a particular category of agreements in Tasmania are
unavailable.
A3.2 The underlying nature of enterprise agreementsIn general, the quality of agreements is more important than their quantity, however,data on the productivity gains achieved through enterprise agreements is relativelyscant.
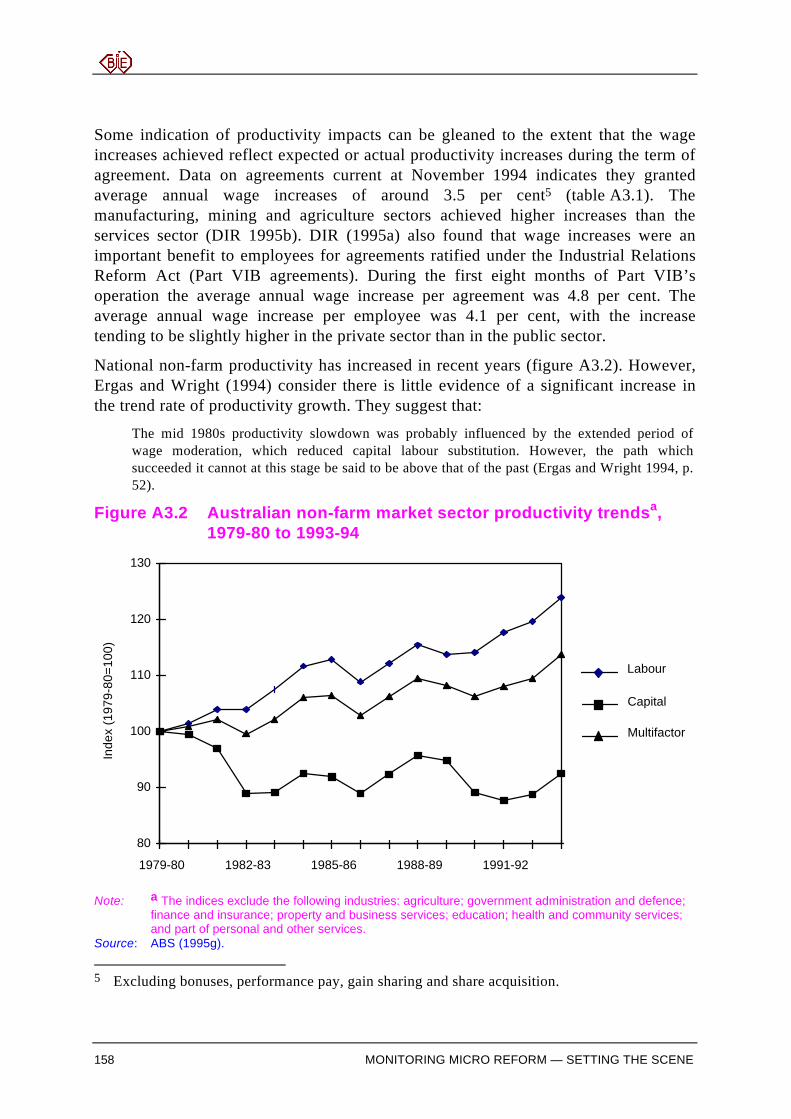
158 MONITORING MICRO REFORM — SETTING THE SCENE
Some indication of productivity impacts can be gleaned to the extent that the wageincreases achieved reflect expected or actual productivity increases during the term ofagreement. Data on agreements current at November 1994 indicates they grantedaverage annual wage increases of around 3.5 per cent5 (table A3.1). Themanufacturing, mining and agriculture sectors achieved higher increases than theservices sector (DIR 1995b). DIR (1995a) also found that wage increases were animportant benefit to employees for agreements ratified under the Industrial RelationsReform Act (Part VIB agreements). During the first eight months of Part VIB’soperation the average annual wage increase per agreement was 4.8 per cent. Theaverage annual wage increase per employee was 4.1 per cent, with the increasetending to be slightly higher in the private sector than in the public sector.
National non-farm productivity has increased in recent years (figure A3.2). However,Ergas and Wright (1994) consider there is little evidence of a significant increase inthe trend rate of productivity growth. They suggest that:
The mid 1980s productivity slowdown was probably influenced by the extended period ofwage moderation, which reduced capital labour substitution. However, the path whichsucceeded it cannot at this stage be said to be above that of the past (Ergas and Wright 1994, p.52).
Figure A3.2 Australian non-farm market sector productivity trendsa,1979-80 to 1993-94
80
90
100
110
120
130
1979-80 1982-83 1985-86 1988-89 1991-92
Labour
Capital
Multifactor
Inde
x (1
979-
80=1
00)
Note: a The indices exclude the following industries: agriculture; government administration and defence;finance and insurance; property and business services; education; health and community services;and part of personal and other services.
Source: ABS (1995g).
5 Excluding bonuses, performance pay, gain sharing and share acquisition.

BUREAU OF INDUSTRY ECONOMICS
ENTERPRISE AGREEMENTS IN PRACTICE 159
Ergas and Wright hypothesise that this result may be because the economy is stilladjusting to the microeconomic reform process. They suggest that change is morelikely to show up in aggregates, such as national productivity growth, at sometime inthe future. For this reason they suggest that micro-level studies, that is studies at thefirm and industry level are a more realistic means of identifying the extent of changeat this point in time.
A review of the first 1 000 enterprise agreements ratified by the AIRC (up to July1993) showed companies had implemented a range of productivity enhancingmeasures relating to re-organisation of work, enhanced flexibility in the use of labourand changes to other aspects of employment, many of them inter-related (box A3.1).This trend has continued, DIR (1995a) indicates that the 1 360 agreements formalisedin 1994 under the Reform Act provisions covered a wide range of changes in theconditions of employment (table A3.2). Nearly 70 per cent of these agreementsincluded changes to the hours of work. For example, working longer hours duringpeak periods and shorter hours during off-peak periods and the introduction ofcontinuous shifts over seven days.
Table A3.2 Part VIB 1994 agreements, employment conditions
Conditions covered Proportion of agreements(per cent)
• Work organisation 35• Use of capital 10• Hours of work 68• Overtime 37• Shift penalties 11• Public holidays 16• Contract of employment 35• Annualised salary 4• Method of payment 29• Long service leave 11• Sick leave 25• Family leave 17• Annual leave loading 16• Occupational health and safety 39• Equity provisions 17• Termination, change and redundancy 54• Training and skill formation 67• Performance indicators 32
Source DIR (1995a)

160 MONITORING MICRO REFORM — SETTING THE SCENE
Box A3.1 Workplace bargaining — evidence from the first 1 000agreements
The first 1 000 enterprise agreements ratified by the AIRC highlights the variety ofapproaches taken by individual enterprises to increase productivity at the firm level (DIR1993a). The types of measures used in these agreements can be loosely grouped into fourbroad categories. The following list gives examples of measures in each category.
Work organisation
• multi-skilling and the reduction of demarcation barriers;• introduction of team work;• introduction of consultative processes at the work place;• introduction of new production processes such as Total Quality Control;• introduction of continuous improvement and best practice programs;• organisational restructuring and broad banding; and• introduction of performance indicators.Conditions of employment• changes to hours of work provisions;• changes to employment contract (particularly for casual, part-time and contract labour);• rationalisation of penalty rates (particularly annualised salary and overtime); and• changes to leave provisions (particularly sick leave and family leave provisions).Working environment
• consultation and communication;• equality of opportunity;• occupational health and safety; and• improving absenteeism.Training and skill formation
• introduction of new classification structures based on competence or skill;• introduction of skills related career paths;• linkage of remuneration to skills acquired/used;• recognition of prior learning;• portability of skills;• provision and delivery of appropriate training; and• introduction or increased use of multi-skilling and cross skilling.
Surveys conducted by DIR in December 1992 and July 1993 suggest the pace ofchange at the workplace has increased since 1990 (DIR 1994).6 The most common 6 These findings come from two DIR surveys which have sample bias. The ‘workplace survey’
was of a sub-sample from AWIRS (1991) of workplaces with 20 or more employees in allindustries except agriculture and defence, covering the 12 months to December 1992. The‘enterprise survey’ sampled two business registers, one private and one public, for firms with100 or more employees.

BUREAU OF INDUSTRY ECONOMICS
ENTERPRISE AGREEMENTS IN PRACTICE 161
changes reported were the multi-skilling of employees and the introduction of newtechnology. In addition, DIR suggested that, over the survey period ‘the formalbargaining framework determined by the tribunals and legislation was of only minorsignificance in explaining bargaining patterns at the workplace’ (DIR 1994, p. 83).Their survey results highlighted the importance of informal bargaining — both written(but not registered with industrial tribunals) and verbal — in supplementing the formalsystem. Bargaining had positive impacts on productivity and output, and in only a fewcases did it result in industrial action.
A more recent survey conducted by the Department of Industrial Relations inNovember 1994 suggests that enterprise agreements may be contributing to increasesin productivity (DIR 1995a). Managers at workplaces with agreements were morelikely to perceive an increase in productivity during the previous twelve months thanmanagers in workplaces with no recent workplace agreements. On the basis ofmanagers’ perceptions, nearly 80 per cent of workplaces with either a formal orunregistered agreement experienced an increase in productivity. This compared toperceived productivity increases in 56 per cent of workplaces with no recentagreement (DIR 1995a). There was relatively little difference in productivityperceptions between workplaces with different forms of agreement. However,marginally more managers in workplaces with unregistered (informal) agreementsperceived an increase in productivity. Also, managers in workplaces with formal stateagreements were less likely to perceive a productivity increase than managers withother forms of agreement.
The case studies of firms and industries being conducted by the BIE as part of theMonitoring Micro Reform project should provide further insights into productivitychanges at the micro-level (see chapter 8).

162
Appendix 4 Economy-wide impacts ofmicroeconomic reform
The process of microeconomic reform is aimed at improving the way in which theeconomy uses its productive resources. Whilst the benefits of the reform process areexpected to be large, the process is not costless. Such costs are often more visible thanthe benefits because they tend to be concentrated among relatively small groups in thecommunity whereas the gains tend to be far more widely dispersed. Since the losersfrom change tend to be more concentrated and cohesive than those who gain, they areusually far more vocal and there is a danger that the reform process may be disrupted.General equilibrium modelling of reforms has helped governments, industry and thegeneral community see the broader economic picture.
A broad overview of the results of a number of microeconomic reform modellingstudies is presented in section A4.1. This section also provides an indication of thepotential benefits to the economy as a whole and assists in identifying the industriesmost likely to grow or decline as a result of the microeconomic reform program. Insection A4.2 an examination is made of the factors that help to explain differences inthe gains from microeconomic reform reported in these studies. Section A4.3discusses some of the limitations of the general equilibrium modelling approach. Abrief summary is presented in section A4.4.
A4.1 General equilibrium modelsStudies that have estimated the economy-wide impacts of microeconomic reform haveused various general equilibrium models, including versions of the ORANI andMurphy models of the Australian economy. As the microeconomic reform agendadeveloped and evolved, so too has the detail and coverage of reforms included invarious model scenarios (see table A4.1).
In the discussion that follows we will examine some key studies published by theIndustry Commission, the Bureau of Industry Economics, the Economic Planning andAdvisory Council, and the Business Council of Australia. For each of these studies anexamination is made of the impact of microeconomic reform on macroeconomicaggregates such as GDP, as well as the likely output effects at a sectoral and industrylevel. While the magnitude of these model results tend to vary, overall they all showthe impact of the reform process to be positive.

BUREAU OF INDUSTRY ECONOMICS
ECONOMY-WIDE IMPACTS OF MICROECONOMIC REFORM 163
Table A4.1 Microeconomic reforms assessed in different studies
IC ‘90 BIE ‘90 EPAC ‘94 BCA ‘94 IC ‘95
Model ORANI ORANI-F AEM-CGE Murphy HILORANIStarting pointa 1988-89 1988-89 1994 1994 1994Number of industries/sectorsNature of model run
112 (Static)
112(Dynamic)
25(Static)
12(Dynamic)
128(Static)
Reforms coveredTransport
water– domestic– internationalbulk commodity handlingrailaviation– domestic– internationalroad
Communicationsposttelecommunications
Utilitieselectricity bwater
Industry assistanceruralrural — statutory marketing
arrangementsmanufacturinginvestment incentives
Government activitiesgovernment services– level– efficiency– contracting out
(competitive tendering)– indirect tax mix
Induced improvementsproductivity– manufacturing– servicesreduced unemployment c
Unincorporated enterprisesbusiness services (legal profession)health (dentists, medical profession, optometrists)
Anti-competitive legislationbuilding regulationsbuilding approvalsremoval of monopoly
provision of servicesself-regulation
Note: a The BIE baseline includes the planned program of tariff reforms, while the reform scenarioincludes removing tariffs altogether. The EPAC base end-point excludes announced but unrealisedtariff reductions. b Includes gains prior to 1994. c Reported in a separate modelling exercise ratherthan in the main body of projected gains.
Sources: IC (1990), BIE (1990), Filmer and Dao (EPAC 1994 in this table), BCA (1994) and IC (1995b).
164 MONITORING MICRO REFORM — SETTING THE SCENE
Industry Commission 1990 — ORANI model
The IAC used the ORANI model to analyse various reforms during the mid-1980s. Anearly study examined the economy-wide effects of reduced protection in the textile,clothing and footwear industries (IAC 1986). Later, the IAC examined a range ofmicroeconomic reforms to the transport sector in 1989. The IAC drew on this work,other studies of the impact of reforms to industry assistance and its inquiry intogovernment (non-tax) charges (IAC 1989) in a study published in its 1988-89 AnnualReport (IAC 1989b).1
The IC subsequently revised these projections, extending the range of reforms, in their1989-90 Annual Report (IC 1990). The analysis covered reforms to domestic water,rail, air and road transport, international liner shipping and aviation, grain storage andhandling, post and telecommunications, electricity supply, water and sewerage,contracting out by governments and removal of rural and manufacturing assistance. Asshown in table A4.2, the estimates indicated that in the longer term (about 10 years)microeconomic reform would produce large gains in GDP, real consumption,investment and exports. The IC summarised the gains as follows:
The results suggest longer term annual gains in real GDP of 6.5 per cent, equivalent to just over$22 billion 1988-89 dollars. Of this about $14 billion accrues in terms of higher consumptionexpenditure. This is equivalent to about $2 300 a household. The reforms are estimated togenerate an extra 53 000 jobs (IC 1990, p. 30).
Whilst gains were reported for all sectors of the economy, the mining sector, with anestimated 32.6 per cent increase in sectoral output was seen as capturing by far thelargest benefit from the reforms covered in the analysis. Of the 112 industriesinvolved in the analysis only the textiles, clothing and footwear, motor vehicle,miscellaneous manufacturing and international aviation industries suffered significantlong-term declines. The IC attributed these declines largely to the impact of reductionsin manufacturing assistance and increased foreign competition.
Bureau of Industry Economics 1990 – ORANI-F model
To assist the Australian Manufacturing Council in its deliberations on the futuredirection of industry policy in Australia the BIE also studied the general equilibriumeffects of microeconomic reforms. In contrast to the IC analysis, which reported thelonger run annual gains from reform within a notional 10 year time horizon, the BIE(1990) made estimates of the impact of reforms over a seven year period — 1988-89to 1994-95.
1 This study projected the gains from microeconomic reform to result in real GDP gains of
almost 5 per cent or $16 billion in 1988-89 dollars. With real consumption gains equivalent toaround $1 600 per household and employment gains equal to approximately 35 000 extra jobs.

BUREAU OF INDUSTRY ECONOMICS
ECONOMY-WIDE IMPACTS OF MICROECONOMIC REFORM 165
Table A4.2 Projected effects of microeconomic reforms a
IC '90 BIEb ‘90 EPACc ‘94 BCA ‘94 IC ‘95
Time horizon of projections Long run(10+ yrs)
Medium run (7 yrs)
Long run(10+ yrs)
Long run(20+ yrs)
Long run(10+ yrs)
Model ORANI ORANI-F AEM-CGE Murphy) HILORANI
Macroeconomicaggregates
Real GDP 6.5 9.5 12.7 20.5 5.5Real consumption 5.4 0.3 14.4 na 3.4Export volume growth 17.6 11.7 na na 15.4Import volume growth 11.6 11.2 na na 1.2Aggregate capital stock 7.2 7.5 na na 5.7Sectoral changes
OutputAgriculture 2.8 6.8 12.3 d 22.0 d 4.4Mining 32.6 22.4 12.2 d 35.5 d 18.5Manufacturing 2.7 15.1 13.6 d 29.0 d 5.4Services 4.4 8.8 12.5 d 16.6 d 3.4
Notes: a All results are expressed as percentage changes. Each column compares a reform scenario with abase scenario at some point in the future. b The BIE analysis examined a number of reform andmacroeconomic scenarios. The scenario reported here compares a level playing field reform agendato a baseline scenario that includes planned reforms as at 1988-89, but no further reforms. c Thiscompares the estimates of a conservative reform scenario to an end point that excludes announcedbut unrealised tariff reforms. d Output in value-added (GDP) terms. In reform scenarios, value-added gains are usually slightly larger than corresponding output gains, (e.g. HILORANI projectedGDP gains of 5.5 per cent and output gains of 4.2 per cent). na=Not available.
Sources: IC (1990), BIE (1990), Filmer and Dao (EPAC 1994 in this table), BIE estimates derived from Filmerand Dao (1994), IC (1995b).
The BIE’s results reported in table A4.2 reflect the medium-term differences betweenthe ‘no policy change’ and the ‘level playing field’ scenarios. In the ‘no policychange’ scenario the BIE assumed that existing policies, such as the planned tariffreforms announced in May 1988 would continue. The ‘level playing field’ reformswent further and included substantial reductions in manufacturing and agriculturalassistance, with zero assistance assumed by 1995. Other reforms, in addition to thoseprojected by the IC, included the impact of investment incentives as well as labourmarket reforms assumed to result in large increases in labour productivity.
The inclusion in this study of assumed labour productivity improvements was partlyan attempt to simulate the impact of reforms in the industrial relations system. It wasalso an attempt to include some of the ‘dynamic effects’ that microeconomic reform islikely to induce in the economy.2 For example, labour market reform could result in animproved working environment. Within this new environment, the adoption of
2 Economic models find it very hard to handle such dynamic gains which result from
endogenous changes in productivity, innovation and tastes. As a proxy for some of theseeffects, exogenous improvements in productivity can be imposed on the models as is done inthe BIE, EPAC and BCA studies reported here.

166 MONITORING MICRO REFORM — SETTING THE SCENE
technical, managerial and shop-floor improvements could emerge. Theseimprovements or gains would be in addition to the labour productivity increasesdirectly achieved from industrial relations reform.
The results of the BIE study (table A4.2), at the economy-wide level, indicated anincrease in GDP of 9.5 per cent. At the sectoral level, the ‘level playing field’ scenarioresulted in gains in output exceeding the ‘no policy change’ scenario by 6.8 per cent inagriculture, 22.4 per cent in mining, 15.1 per cent in manufacturing and 8.8 per cent inservices in the medium term (table A4.2). The larger gains in manufacturing andservices compared with the earlier IC projections reflect mostly the assumed labourproductivity improvements in industries that are relatively large users of labour.
In this study the mining and metals industries and ‘other food products’ record highoutput growth, reflecting the magnitude of direct impacts of reforms. Large increasesin projected output also occur in industries supplying capital goods — ‘agriculturalmachinery’, ‘structural and other metal products’, ‘cement’, ‘plant and machinery’ and‘non-residential construction’. This derived demand reflects increased investment byindustries that experience first round gains as costs fall due to reforms.
Economic Planning and Advisory Council 1994 — AccessEconomics-Murphy model
Filmer and Dao (1994) used the static, 25-sector Access Economics-Murphy (AEM-CGE) model to analyse the effects of microeconomic reform on industry for an EPACbackground paper.3 The study included a total of 38 reforms, proposed but not fullyimplemented by February 1994. The reforms covered in the analysis included:reductions in tariffs and subsidies, labour market reform, facilitation of the operationof markets, transport and communications reforms, GBE reform, gains frominternational trade negotiations and support for emerging exporters. Also, the analysiswas extended to cover a range of general government activities, including the leveland efficiency of government service provision.
The authors noted that there was some debate over how many industries have potentialfor direct gains from reforms and how large these gains would be. So, they projectedthe effects of two reform scenarios. The conservative scenario included direct impactsof a limited magnitude on a relatively small number of industries. The favourablescenario assumed that all industries could move to world best practice. This discussionpresents results for the conservative scenario only.4
3 EPAC published a second modelling study (Dao and Jowett 1994). The essential differences
between the approaches in the two EPAC papers are presented in section 4.2.4 In the favourable scenario, GDP gains are 15.4 per cent compared with 12.7 per cent for the
conservative scenario.

BUREAU OF INDUSTRY ECONOMICS
ECONOMY-WIDE IMPACTS OF MICROECONOMIC REFORM 167
In addition, Filmer and Dao (1994) projected the benefits of a reduction in thesustainable rate of unemployment from 7.3 to 5.0 per cent.5 In order to reduce theunemployment rate, they assumed:
• the labour market adjusts to reduce job mismatch;
• enterprise bargaining allows greater flexibility to balance better the supply anddemand for labour;
• improved education and training, and
• the increased availability of retraining programs, ensure that the labour force hasthe skills demanded by industry.
The gains from lowering the unemployment rate account for about two fifths of theoverall 12.7 per cent gain in GDP (table A4.3). This factor explains most of thedifference between Filmer’s and Dao’s projections of GDP gains and the earlierstudies by the IC and BIE (table A4.2).
At the sectoral level there are relatively even gains of between 12 and 14 per centacross the agricultural, mining, manufacturing and services sectors6 (table A4.2). Allof the model’s twenty-five industries experience GDP growth (table A4.3). The largestgrowth in industry level value-added occurs in ‘transport’. The highly assisted‘textiles’, ‘transport equipment’ and ‘miscellaneous manufacturing’ industries initiallysuffer as a result of reductions in their assistance levels. However, the increaseddemand stemming from increased employment and the improvement in private sectorproductivity more than offset the negative impact of the tariff reductions (table A4.3).
Business Council of Australia 1994 — Murphy model
The BCA’s study (BCA 1994) covered a similar set of reforms to those of the Filmerand Dao study (table A4.1). The BCA’s baseline included the existing program ofreforms at that stage, including phased tariff reductions. The reform scenario (or‘Australia 2010 scenario’) included the replacement of the existing indirect tax systemwith a broad based consumption tax, improvements in the level and efficiency ofgovernment services, further improvements in the efficiency of GBEs, and in theprivate sector — improvements to labour productivity that were assumed to bridge thegap between Australian productivity levels and world’s best practice (except to theextent that these gaps are due to economies of scale). The BCA indicated that thereform scenario is an optimistic forecast of what reforms might achieve.
5 Again, this could be considered as an attempt to include some dynamic effects of reform.6 The sectoral gains in the EPAC study are relatively even, compared with the IC or BIE studies.
Filmer and Dao attribute this to the allowance in their model for inflexibilities in all industriesin switching production between domestic and export markets.

168 MONITORING MICRO REFORM — SETTING THE SCENE
Table A4.3 EPAC study — longer run industry output implications ofmicroeconomic reform
Percentage change in industry output (conservative scenario)
Industry
Shareof
GDP
Infrastructure reforms
incl. GBEsTariff
reduction
Governmentservices
productivityimprovement
s
Improvedprivatesector
productivity
Increasedemployment expansion
Totalgains
Agriculture 4.0 0.0 1.9 1.3 3.9 5.2 12.3
Mining 5.3 0.0 5.4 1.0 0.0 5.4 12.2
ManufacturingFood 2.1 1.2 1.2 1.2 7.4 4.9 16.0Beverages 2.0 1.3 0.0 1.3 6.6 5.3 15.8Textiles 0.6 0.0 -4.5 0.0 9.1 4.5 13.6Clothing and footwear 0.8 0.0 0.0 0.0 10.0 6.7 16.7Wood, paper & printing
2.8 0.9 0.0 0.9 5.7 5.7 13.2
Chemicals 1.2 0.0 0.0 0.0 4.2 6.3 12.5Petroleum & coal products 2.5 1.1 1.1 1.1 3.2 5.3 11.6Mineral products 3.2 0.8 1.6 0.8 4.9 5.7 13.9Transport equipment 2.4 0.0 -2.2 1.1 7.6 5.4 12.0Other machinery 2.4 0.0 0.0 1.1 6.5 5.4 13.0Misc. manufacturing 1.2 0.0 -2.2 0.0 8.9 6.7 13.3
ServicesElectricity, gas, water 3.3 2.3 0.8 0.8 3.9 5.4 13.2Residential building 2.3 2.2 0.0 2.2 3.4 5.6 12.4Other construction 5.2 0.5 2.0 0.5 3.0 5.0 11.4Wholesale, retail trade 13.2 1.0 1.0 1.4 4.9 5.3 13.6Transport 5.4 11.6 1.9 1.0 1.4 5.3 20.8Communication 2.1 3.7 1.2 1.2 2.5 4.9 13.6Finance, property etc. 10.5 0.7 0.7 0.7 3.5 5.2 11.1Public administration 2.8 0.0 0.0 3.7 0.9 5.6 9.3Defence 1.1 0.0 0.0 7.3 0.0 4.9 12.2Community services 12.0 0.2 -0.2 3.9 0.6 5.2 9.9Recreational services 3.9 1.3 0.0 1.3 2.7 5.3 10.7Ownership of dwellings
7.8 1.7 0.0 2.0 3.7 5.0 12.7
All industries 100.0 1.5 0.8 1.6 3.5 5.3 12.7
Source: Filmer and Dao (1994), Table 9b.
The BCA used the 12-sector dynamic Murphy model. The long run in this model is amuch longer time period (20 years or more) than the other models examined here. Andbecause there are fewer industries, the model assesses impacts at a more aggregatedlevel. In this model, one industry covers ‘transport and communications’, whereas inAEM, two industries cover these services. In ORANI and ORANI-F, 5 industriescovers these services. And in HILORANI (discussed in the next section), there are 14transport and communication industries.
The projected effects of microeconomic reform reveal a similar pattern to previousstudies (table A4.2). At the sectoral level there are widespread gains from reforms.

BUREAU OF INDUSTRY ECONOMICS
ECONOMY-WIDE IMPACTS OF MICROECONOMIC REFORM 169
Overall, gains are greater than in other studies. This basically reflects a longer timehorizon, larger assumed induced productivity improvements in manufacturing, andmore extensive government reforms.
Table A4.4 shows projected changes in sectoral output for the baseline and reformscenarios over the period to 2010-11. In value-added (GDP) terms, the only shrinkagein absolute terms occurs in ‘agriculture’ in the period 1991-92 to 1995-96. Thisreflects mainly historical events including; the decline in commodity prices in theearly 1990s and the drought that prevailed for much of this time over a large part ofeastern Australia. In the forecast period — beyond the historical period — all sectorsgrow in the baseline, partly due to microeconomic reforms that were already underway.
Output growth is significantly stronger in the reform scenario in all sectors except‘public administration and defence’ (table A4.4). This sector loses from a reduction inthe level of government services as a result of the reform process. Among the otherservice sectors, ‘transport and communications’ derives large benefits from furtherreforms — growth is 6.6 per cent each year in the reform scenario between 1996-97and 2000-01 for this sector, compared with 4.9 per cent in the baseline. The BCAassumes significant induced labour and capital productivity improvements in thereform scenario, with its more extensive program of reform. In all sectors, thedifferences between the two scenarios are smaller in the period 2001-02 to 2010-11.The difference between the growth rates of the two scenarios steadily declines overtime giving an indication of the extent to which the reforms have been fullyincorporated into the economy. While the growth rates in the reform scenario decline,it is important to remember that they apply to a level of national output that ispermanently higher than in the baseline scenario.
IC study of Hilmer and related reforms 1995 — HILORANI model
The Council of Australian Governments asked the IC to assess the growth andgovernment revenue implications of the Hilmer and related reforms (IC 1995e). TheIC made various modifications to the ORANI model in order to trace the implicationsof reform on both Commonwealth and state government revenue. The overall impactof Hilmer and related reforms on state government revenues was seen as an importantissue because the first round impacts of the reform process appeared to have a largenegative impact on revenue collections by the states (particularly revenue fromGBEs). Further, state governments were unlikely to participate in the reform processunless they were appropriately compensated for perceived revenue losses.

170 MONITORING MICRO REFORM — SETTING THE SCENE
Table A4.4 Sectoral effects — BCA scenarios (GDP growth per annum,per cent)
Baseline scenario Reform scenario (Australia 2010)
Sector 1991-921995-96
1996-972000-01
2001-022010-11
1991-921995-96
1996-972000-01
2001-022010-11
Long-rungainsa
Agriculture -2.4 4.9 3.4 -1.5 8.0 3.8 22.1Mining 2.9 5.7 3.9 4.3 8.5 5.6 35.5Manufacturing 3.5 3.5 2.8 5.7 7.5 2.9 29.0Electricity, gas & water 2.4 3.0 2.3 2.7 5.5 2.8 20.2Construction 1.2 3.5 2.0 2.8 6.6 1.8 19.7Wholesale and retail
trade3.1 2.9 2.4 3.6 5.2 2.9 19.1
Transport andcommunications
4.9 3.7 2.6 5.7 6.6 3.1 19.1
Financial and businessservices
0.8 3.4 2.3 1.5 6.2 2.7 21.9
Public admin. & defence 2.8 2.5 2.2 2.8 2.5 2.2 0.6Community services 4.2 2.5 2.3 3.7 3.5 2.7 6.0Recreation etc. services 3.7 3.5 2.4 2.9 6.1 3.1 14.6Ownership of dwellings 3.0 2.4 2.4 3.0 4.1 2.9 23.5
Total 2.9 3.3 2.5 3.6 6.0 3.0 20.5
Note: a Average annual difference between reform scenario and baseline scenario.Source: BCA (1994), tables 3,7 and 9.
The package of Hilmer and related reforms included both Commonwealth reforms andstate, territory and local government reforms. As discussed in chapter 2, Hilmerregarded regulation by all levels of government as the greatest impediment tocompetition. To eliminate this impediment, Hilmer proposed the removal of regulatoryrestrictions on competition not clearly demonstrated to be in the public interest. TheIC emphasised that it was impossible to capture the full implications of the Hilmer andrelated reforms in a modelling exercise. However, the IC did model the impact ofvarious reforms to the transport, communications and utilities sectors, statutorymarketing arrangements, government services, unincorporated enterprises and anti-competitive legislation (see table A4.1 for details).
The IC projected that as a result of Hilmer and related reforms Australia’s GDP wouldgrow by 5.5 per cent or $23 billion a year, equivalent to $1 500 more per householdper year. The IC suggested that this could represent an increase in real wages of 3per cent and 30 000 extra jobs (or even more jobs if real wages grow by less).
The IC projected that the gains from Commonwealth reforms would increase realGDP by 1 per cent. State, territory and local government reforms would increase realGDP by 4.5 per cent (table A4.5). This result underlines the significance of gains fromundertaking microeconomic reform at the state and territory level and also suggeststhat relatively smaller gains are attainable from further Commonwealth reforms.

BUREAU OF INDUSTRY ECONOMICS
ECONOMY-WIDE IMPACTS OF MICROECONOMIC REFORM 171
Substantial revenue gains would accrue to all tiers of government following thereforms. The IC estimated that the reform package would increase Commonwealthrevenue by $5.9 billion per year (6.0 per cent of total revenue), while state, territoryand local governments would gain $3.0 billion per year (4.5 per cent of total revenue)in real terms.
Table A4.5 A summary of gains from reforms
Commonwealthreforms
State, territory and localgovernment reforms
Total
Real GDP 1.0% 4.5% 5.5%Commonwealth revenue $1.2 bn (1.2%) $4.7 bn (4.8%) $5.9 bnState, territories and local
government revenue$0.4 bn (0.6%) $2.6 bn (3.8%) $3.0 bn
Total revenue $1.6 bn $7.3 bn $8.9 bn
Sectoral outputs % % %
Agriculture 0.2 4.2 4.4Mining 4.2 14.3 18.5Manufacturing 1.0 4.4 5.4Services 0.7 2.7 3.4
Source: IC (1995d).
Overall, at the sectoral level, mining would gain the most from reforms with outputexpanding by an estimated 18.5 per cent (table A4.5). This largely reflects the degreeto which mining could benefit from reforms to transport and utilities, undertaken bystate and territory governments in particular. Output increases of between 4.4 per centand 5.4 per cent were projected for the agricultural, manufacturing and servicessectors.
At the industry level, the benefits of reforms are widely distributed (see table A4.7,p. 172). Gains are generally more noticeable in sectors exposed to internationalcompetition both export oriented and import competing (including textiles, clothingand motor vehicles). Very few individual industries are projected to expand orcontract dramatically as a result of any individual Hilmer or related reform.7 Overall,the vast majority of industries are clear winners from the reform package. Given thebroad nature of the reforms, losses from one reform tend to be offset by gains fromother reforms. Overall the small impacts of individual reforms add up to widespreadsubstantial gains.
7 Of the 128 industries in the HILORANI model only seven industries register losses overall.
The dairy and related industries are adversely effected by reform of Commonwealth statutorymarketing arrangements. While the ‘railway rollings’, ‘non-bulk rail’, ‘passenger rail’ andrelated industries are adversely affected by moves to full cost recovery.

172 MONITORING MICRO REFORM — SETTING THE SCENE
A4.2 Why gains from reforms vary in different studiesTo date we have examined the impact of microeconomic reforms at the economy-wideand broader sectoral levels as presented in various published studies. The importantsimilarity between these models is that they all project gains from microeconomicreforms over time. However, the magnitudes of these gains differ from model tomodel. Table A4.6 shows differences in the projected gains from reforms between thedifferent studies.
There are a number of reasons why variations in model results are likely to occur.These include differences in the:
• range of reforms covered;• magnitudes of specified shocks or cost savings;• assumptions about how gains flow through the economy (ie model closure);• databases; and• key parameters.
The role of each of these factors is discussed below.
Table A4.6 Projected increase in GDP resulting from specified group ofreforms
IC’90 BIE’90 EPAC’94 BCA’94 IC’95
Time horizon of projections 10+ years 7 years 10+ years 20+ years 10+ years
Reform group % increase in GDP resulting from specified group of reforms
Transport 3.2 1.5 } } 0.5Communications 0.5 0.3 } 1.5 } 1.1 0.7Utilities 0.7 0.4 } } 1.5Industry assistance 1.1 0.1 0.8 0.7
– statutory marketingarrangements
0.2
Government activities– efficiency 1.0 1.6 2.6 1.0– level 0.8 0.9– indirect tax mix 3.0
Induced improvements– higher productivity 7.2 3.5 5.0– lower unemployment 5.3 8.0
Unincorporated sector 0.3Other 0.4
Total 6.5 9.5 12.7 20.5 5.5
Sources: Filmer and Dao (EPAC 1994 in this table), table 8; IC (1990), table a1.2; BIE (1990), tables 6.3.0and 6.3.1; BCA (1994), table 9; IC (1995d), tables c2.4, c2.5 and c3.2.

BUREAU OF INDUSTRY ECONOMICS
ECONOMY-WIDE IMPACTS OF MICROECONOMIC REFORM 173
Range of reforms covered
The microeconomic reform agenda has grown over time. This means that modellershave added new reforms to their projections. However, if reforms are alreadyunderway, further gains from a particular reform are likely to be smaller than in earlierprojections. And in some cases, modellers relegate certain reforms to the basescenario. For example, tariff reductions were an important reform in the IC’s earlierwork (IC 1990). But the IC excluded tariff cuts from their reform scenario in theHILORANI projections (table A4.1).
EPAC published the results of two modelling exercises in 1994. In the first (Filmerand Dao 1994, described earlier in this appendix), they froze reforms at the startingpoint (1994) in their base scenario. Their reform scenario assessed the impacts offurther reforms plus further gains from existing (or already announced) reforms. In thelater study, EPAC used a similar base scenario (Dao and Jowett 1994). But theyincluded two reform scenarios. The first scenario tracked the effects of further gainsfrom existing reforms. The second projected gains from further reforms. Thus themagnitude of gains varied due to these different scenarios.
Magnitudes of specified shocks or cost savings
The microeconomic reform agenda influences the scope of reforms incorporated intomodels. Further to this, the magnitude of direct gains from reforms will have a largebearing on economy-wide effects. Modellers rely on partial studies, including forexample, the BIE benchmarking series, to estimate and impose direct impacts ofreforms on the models. Such partial studies might indicate how far a particularinfrastructure industry is from world best practice. In addition, they may also discusswhether it is possible with the implementation of reforms to achieve best practice inthe Australian environment. For example, Australia’s large land area and smallpopulation may make it impossible to achieve best practice in some infrastructureindustries. Assumptions of this nature lead to ‘shocks’ of different sizes being appliedto models for a particular reform scenario and result in varied impacts.
Some differences in the magnitude of the applied ‘shock’ arise from the stage ordegree of implementation of a particular reform. For example, reduced industryassistance played a bigger part in the IC (1990) study than later studies because itsstarting point was before the reforms had any effect.
Assumptions about how gains flow through the economy
How a model distributes gains from reforms through the economy is dependent on themodel ‘closure’ and can also lead to differences in model results. The ‘closure’ refersto which variables are determined outside the model (i.e. exogenous) and which aregenerated by the model (i.e. endogenous).

174 MONITORING MICRO REFORM — SETTING THE SCENE
A model can only generate results for a given scenario if the modeller treats somevariables as exogenous. Thus in practice a number of values for a number of variablesare selected by the modeller and are supplied as inputs to the model. The form ofclosure, therefore, has an important influence on the results, as it determines theconstraints under which different groups in the economy are deemed to be operating.The decision on how the gains from reform are distributed between the variousoptions including for example, applying them to debt repayments, enabling increasedinvestment or increased consumption can result in significantly different results. TheBIE (1990) study, for example, examines a situation where governments might wishto repay debt if they perceive current debt levels as unsustainable. Thus in thisscenario the emphasis is on improving the current account and thereby reducing netforeign debt as a proportion of GDP. As a result of this particular closure, few of thegains from microeconomic reform are reflected in increases in real consumption in theBIE study compared with other studies (see table A4.2).
Databases
Databases may vary between models due to the following:
• variations in the input-output data used;• national accounts data differ in year from model to model; and• different models have different levels of aggregation.
The lack of up-to-date databases may have important implications for the results of amodelling exercise. Some sectors of the economy, such as agriculture, may have coststructures that vary considerably from year to year.8 If a cost structure no longerreflects a particular industry’s inputs, then the projected effects of reforms may differfrom what they would be with an up-to-date cost structure. Such effects may not resultin significant differences at the economy-wide level, but at the industry level,magnitudes of change could differ greatly. Most models now use updated nationalaccounts data (e.g. AEM-CGE, Murphy and HILORANI). In general, even if theinput-output structure of a model is dated, modellers include more recent data fromother sources in an attempt to correct areas of particular concern.
The level of industry aggregation in a model also has an effect on the results. Modelsthat have more industries demand more data. This may make it more difficult to obtainrecent data and to update the model’s database. The trade off for having greaterdisaggregation is that such a model projects more detailed information on the industrycomposition of changes following reforms. For example, with its 14 transport andcommunication industries, HILORANI users can distinguish between the effects of,
8 To overcome this in ORANI and HILORANI, the input structure of agricultural industries is
based on weights derived from ten years’ data. The actual year of the database is used for theagricultural industry’s output only.

BUREAU OF INDUSTRY ECONOMICS
ECONOMY-WIDE IMPACTS OF MICROECONOMIC REFORM 175
for example, individual road, rail and telecommunications reforms. This is notpossible in the Murphy model with its single ‘transport and communications’ industry.This greater ‘precision’ could also be reflected in variations in results at the macrolevel between various models.
Key parameters
Parameters that determine supply and demand relationships and responsiveness ofeconomic agents to ‘shocks’ may also vary between models. This in turn can drivevariations in sectoral outcomes. The 1990 IC projections raised concerns about thedominance of mining in the gains from microeconomic reform (see table A4.2). In theORANI model, the mining sector combined price-responsive supply with price-responsive export demand. This meant that small productivity increases led to largegains in this export-oriented sector.9
In response to the dominance of mining in the reform scenarios (IAC 1989, IC 1990),the IC modified the ORANI model. They effectively fixed the ore resource availableto mining industries, thereby reducing the price responsiveness of mining supply. As aconsequence, the model now projects smaller increases in mining output from a givenrange of reforms, (however there is little change in the economy-wide results). Thisconstraint applies to HILORANI (IC 1995e). Since mining has a small share of GDP,changing the parameters for mining has little effect on total GDP.10
Yetton, Davis and Swan (1992) felt that ORANI was likely to understate the gains tomanufacturing industries from reforms. They modified ORANI further by extendingthe list of endogenous exporters (ie industries whose export volumes vary in responseto prices). Endogenous exporters have more scope for gains following reforms, withina model, than industries with fixed export volumes. Yetton et al. did not, however,project stronger growth in manufacturing arising from the inclusion of the constraintto mining output. But extending the list of endogenous exporters resulted in increasedmanufacturing exports (McDougall and Wear 1992).
Wittwer and Connolly (1993) completed a further study to extend the list ofendogenous exporters in ORANI. They designated industries as potentially export
9 Various modellers have expressed different opinions on the realism of such gains. McDougall
and Wear (1993) stated that such gains were within the bounds of recent experience. Forexample, between 1986-87 and 1989-90, Australia’s value of production of the five miningindustries in ORANI increased by 16 per cent in real terms (ABS 1994; ABS 1990). From1989-90 to 1993-94, their real value of exports increased by 20 per cent (Waring and Hogan1994).
10 Mining production is a relatively small part of the economy, accounting for around 4.3 per centof GDP. However, mining does account for about 35 per cent of total exports, reflectingAustralia’s resource-based economy (ABARE 1994).

176 MONITORING MICRO REFORM — SETTING THE SCENE
oriented if exports approached or exceeded 20 per cent of production.11 They agreedwith some additions of Yetton et al. to the list of manufacturing endogenous exporters,including ‘electronic equipment’, ‘basic chemicals nec’, ‘construction etc machinery’and ‘machinery equipment nec’. But they questioned adding other industries,including ‘chemical fertilisers’ and ‘petroleum and coal products’. Other suitableindustries, including ‘alcoholic beverages’, were left off the list.
To summarise, when dealing with differences between model parameters and thechoice of endogenous exporters, outcomes tend to change at the industry level. Hence,these issues are more of a concern in industry-specific studies. But, in comparing theoutcome of different industries in a highly disaggregated model, modellers need to bewary of possible assumption-driven differences.
A4.3 Limitations of modelling studiesBy necessity, all models have simplifying assumptions. Modellers of economy-wideeffects make assumptions about many variables. So results projected by these modelsare illustrative only, showing how direct cost savings due to particular reforms at theindustry level might impact on the whole economy.
The discussion in this section covers the limitations of modelling studies under thefollowing headings:
• limited information (ie demands on data and measures outside a typicaleconomic framework); and
• the timing of a reform and its impacts.
Limited information
Models rely on limited information. Typically there are difficulties in obtaining data ata highly disaggregated level, so as to project the effects of reforms on particularindustries or groups (as discussed above). Further, a lot of information relevant tomarkets lies outside a typical economic framework. For example, models do notcapture induced quality improvements. Some firms may attempt to improve thequality of their products or services in order to maintain profitability followingreforms (see chapter 7). Such improvements are difficult to measure and consequentlydifficult to model. And consumers may benefit without apparent changes in prices orsales volumes. It is possible to impose a taste change on a model just as it is possibleto impose a productivity change on a model. Indeed, dynamic or induced gains fromreforms may be more significant than the direct gains. But modellers cannot attribute
11 If exports are a small proportion of production, allowing exports to expand will have a
correspondingly small effect on total output.

BUREAU OF INDUSTRY ECONOMICS
ECONOMY-WIDE IMPACTS OF MICROECONOMIC REFORM 177
great accuracy to their estimates of general gains if they impose direct induced gainsby assumption.
The BIE’s benchmarking studies and this project on monitoring microeconomicreform at the firm and industry level may provide better information on the realisablebenefits of reforms. In particular, such studies may allow better assessments of themagnitude of dynamic gains induced by reforms, such as gains in labour and capitalproductivity.
The timing of a reform and its impacts
The timing of benefits is of particular interest to policy makers. If benefits fromreforms do not appear quickly, the task of persuading various interest groups thatparticular reforms are likely to be beneficial becomes more difficult. It might assist thereform debate if modellers can estimate the time it takes for benefits to emerge.Estimating the benefits of a particular reform over time is more complicated thanestimating the eventual benefit alone.
None of the general equilibrium studies referred to in this appendix capture the costsassociated with undertaking adjustments in response to microeconomic reforms.Further, to capture such costs in a cost-benefit framework, we would need to know thetiming of costs and benefits of reforms. When analysts ascribe a discount rate to costsand benefits, timing issues are important. It is possible that studies that improve theestimates of the size of gains will also improve our knowledge of the timing ofbenefits from reforms.
Model results may indicate which occupational groups are winners and losers fromreforms. For example, early IC projections (IC 1990) indicated that job losses in thetextile, clothing and footwear industries would result from reforms (particularly fromreductions in assistance), while jobs would be created in various export-orientedindustries. But modellers need more information to ascribe the timing of job shifts. Inthis regard, the rate of response of economic agents is important.
In discussing timing issues further, it is useful to cite some of the differences betweenstatic models, including ORANI, AEM-CGE and HILORANI, and dynamic models,including ORANI-F and the Murphy model.
Some of the attributes of static models are as follows:
• no assumptions about the absolute values of variables such as GDP in the basescenario are made (i.e. a scenario excluding proposed reforms);
• results are presented as a comparison of end-points;12 and
12 In this appendix, to compare models both static and dynamic, all results are presented in this
manner (with additional information provided on the BCA study in table A4.4).

178 MONITORING MICRO REFORM — SETTING THE SCENE
• variables that rely on both stocks and flows are not captured (e.g. the flow ofannual interest rate payments on the stock of net foreign debt).

BUREAU OF INDUSTRY ECONOMICS
ECONOMY-WIDE IMPACTS OF MICROECONOMIC REFORM 179
In contrast, dynamic models:
• make year by year forecasts of the macroeconomic environment in the baseline;• compare the year-by-year progress of a reform scenario to the baseline; and• capture variables reliant on a time horizon (for example, net foreign debt).
Potentially, a dynamic model offers a lot more detail on how the various componentsof the economy will respond to reforms. But without better information and details onthe response of economic agents to direct impacts, the year-by-year projections of adynamic model are prone to error. The BCA summarises the use of dynamic modelsfor analysing the impact of microeconomic reforms as follows:
The two long-range scenarios [in the BCA study] are inevitably surrounded by wide margins oferror and should not be considered in isolation. Rather, the aim is to test the effects of furthereconomic reform by analysing the differences between the two scenarios. These estimates ofthe gains from reform are subject to far less uncertainty than any individual scenario (BCA1994, p. 48).
The most reliable information provided by a dynamic model (i.e. the end-pointdifference between the scenarios) is similar to that of a static model. Utilisation of thepotential advantages of dynamic models will require further partial studies. Butgaining knowledge of the timing of benefits, and indeed costs, is an inherentlydifficult exercise.
A4.4 SummaryThis appendix examines the results of various modelling exercises of the economy-wide gains from microeconomic reform. While the gains from reforms differ(reflecting the coverage of reforms and uncertainty about the direct impacts) a keyresult is that all models project significant gains from microeconomic reform at themacro level.
Differences between the model results become more pronounced at the sectoral andindustry level reflecting the model’s different levels of disaggregation. A moredisaggregated model, while being more demanding of industry-level data anddependent on the accuracy of these data, has the potential to give greater insights intothe linkages between industries that could be lost in a higher level of aggregation.Despite this, the model results presented here suggest that the broader the range ofreforms, the greater is the likelihood that all sectors (and many individual industries)of the economy will benefit. This is highlighted by the fact that highly assistedindustries such as motor vehicles and textiles and clothing were projected to lose fromreforms in early modelling exercises (resulting from reductions in assistance, IC(1990) while these same industries are expected to make significant gains from theHilmer and related reforms modelled by the IC using HILORANI (IC 1995e).However, it remains unclear whether the gains from the later reforms will more thanoffset the losses experienced from the earlier reduction in assistance.
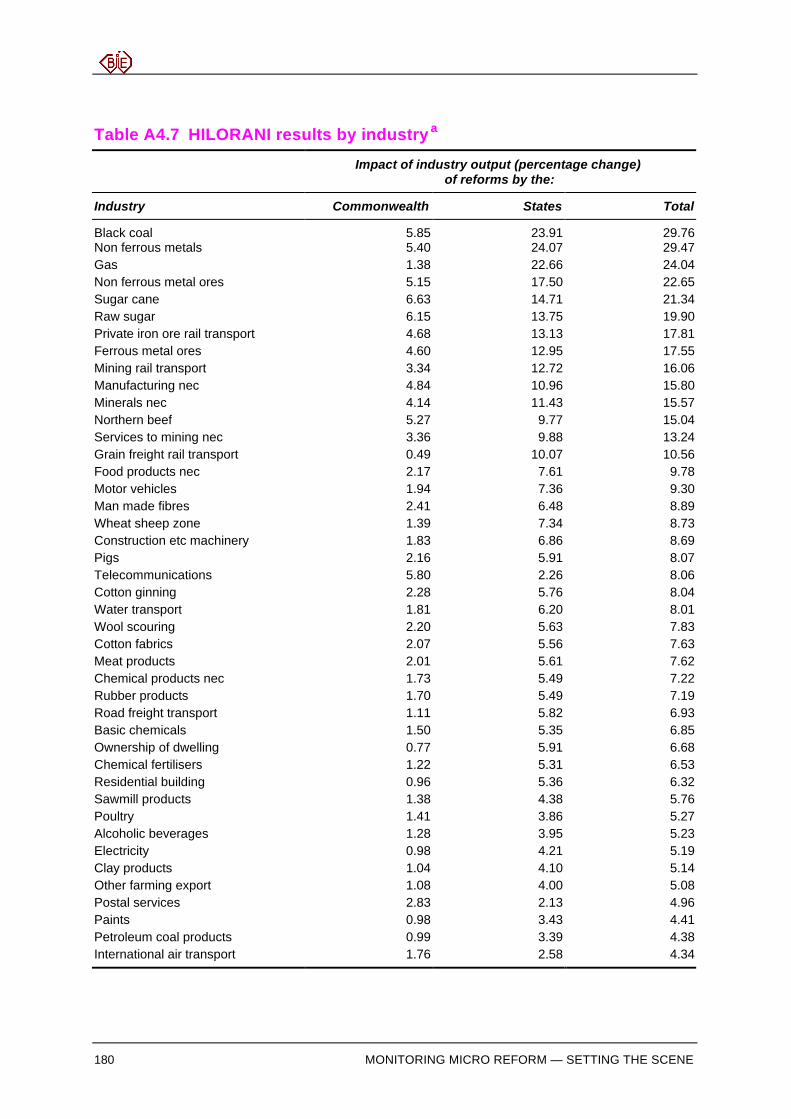
180 MONITORING MICRO REFORM — SETTING THE SCENE
Table A4.7 HILORANI results by industrya
Impact of industry output (percentage change)of reforms by the:
Industry Commonwealth States Total
Black coal 5.85 23.91 29.76Non ferrous metals 5.40 24.07 29.47Gas 1.38 22.66 24.04Non ferrous metal ores 5.15 17.50 22.65Sugar cane 6.63 14.71 21.34Raw sugar 6.15 13.75 19.90Private iron ore rail transport 4.68 13.13 17.81Ferrous metal ores 4.60 12.95 17.55Mining rail transport 3.34 12.72 16.06Manufacturing nec 4.84 10.96 15.80Minerals nec 4.14 11.43 15.57Northern beef 5.27 9.77 15.04Services to mining nec 3.36 9.88 13.24Grain freight rail transport 0.49 10.07 10.56Food products nec 2.17 7.61 9.78Motor vehicles 1.94 7.36 9.30Man made fibres 2.41 6.48 8.89Wheat sheep zone 1.39 7.34 8.73Construction etc machinery 1.83 6.86 8.69Pigs 2.16 5.91 8.07Telecommunications 5.80 2.26 8.06Cotton ginning 2.28 5.76 8.04Water transport 1.81 6.20 8.01Wool scouring 2.20 5.63 7.83Cotton fabrics 2.07 5.56 7.63Meat products 2.01 5.61 7.62Chemical products nec 1.73 5.49 7.22Rubber products 1.70 5.49 7.19Road freight transport 1.11 5.82 6.93Basic chemicals 1.50 5.35 6.85Ownership of dwelling 0.77 5.91 6.68Chemical fertilisers 1.22 5.31 6.53Residential building 0.96 5.36 6.32Sawmill products 1.38 4.38 5.76Poultry 1.41 3.86 5.27Alcoholic beverages 1.28 3.95 5.23Electricity 0.98 4.21 5.19Clay products 1.04 4.10 5.14Other farming export 1.08 4.00 5.08Postal services 2.83 2.13 4.96Paints 0.98 3.43 4.41Petroleum coal products 0.99 3.39 4.38International air transport 1.76 2.58 4.34
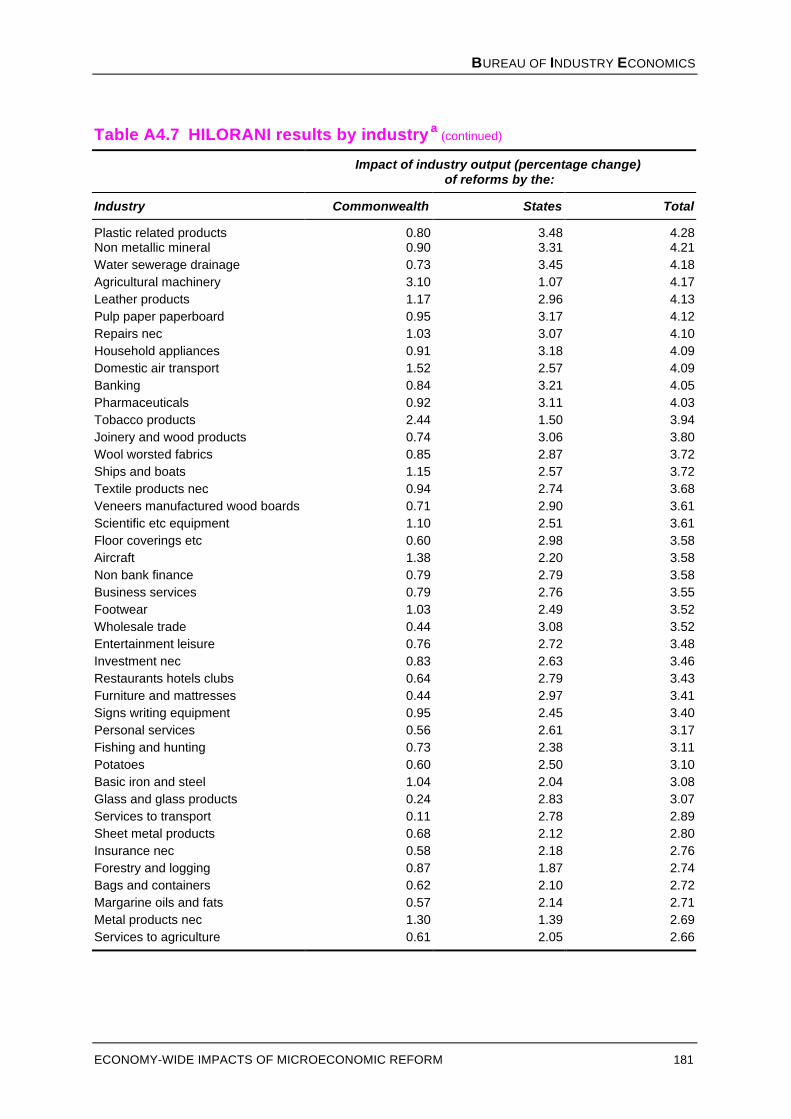
BUREAU OF INDUSTRY ECONOMICS
ECONOMY-WIDE IMPACTS OF MICROECONOMIC REFORM 181
Table A4.7 HILORANI results by industrya (continued)
Impact of industry output (percentage change)of reforms by the:
Industry Commonwealth States Total
Plastic related products 0.80 3.48 4.28Non metallic mineral 0.90 3.31 4.21Water sewerage drainage 0.73 3.45 4.18Agricultural machinery 3.10 1.07 4.17Leather products 1.17 2.96 4.13Pulp paper paperboard 0.95 3.17 4.12Repairs nec 1.03 3.07 4.10Household appliances 0.91 3.18 4.09Domestic air transport 1.52 2.57 4.09Banking 0.84 3.21 4.05Pharmaceuticals 0.92 3.11 4.03Tobacco products 2.44 1.50 3.94Joinery and wood products 0.74 3.06 3.80Wool worsted fabrics 0.85 2.87 3.72Ships and boats 1.15 2.57 3.72Textile products nec 0.94 2.74 3.68Veneers manufactured wood boards 0.71 2.90 3.61Scientific etc equipment 1.10 2.51 3.61Floor coverings etc 0.60 2.98 3.58Aircraft 1.38 2.20 3.58Non bank finance 0.79 2.79 3.58Business services 0.79 2.76 3.55Footwear 1.03 2.49 3.52Wholesale trade 0.44 3.08 3.52Entertainment leisure 0.76 2.72 3.48Investment nec 0.83 2.63 3.46Restaurants hotels clubs 0.64 2.79 3.43Furniture and mattresses 0.44 2.97 3.41Signs writing equipment 0.95 2.45 3.40Personal services 0.56 2.61 3.17Fishing and hunting 0.73 2.38 3.11Potatoes 0.60 2.50 3.10Basic iron and steel 1.04 2.04 3.08Glass and glass products 0.24 2.83 3.07Services to transport 0.11 2.78 2.89Sheet metal products 0.68 2.12 2.80Insurance nec 0.58 2.18 2.76Forestry and logging 0.87 1.87 2.74Bags and containers 0.62 2.10 2.72Margarine oils and fats 0.57 2.14 2.71Metal products nec 1.30 1.39 2.69Services to agriculture 0.61 2.05 2.66

182 MONITORING MICRO REFORM — SETTING THE SCENE
Table A4.7 HILORANI results by industrya (continued)
Impact of industry output (percentage change)of reforms by the:
Industry Commonwealth States Total
Mechanical repairs 0.59 2.00 2.59Printing stationary 0.65 1.80 2.45Electronic equipment -0.62 3.07 2.45Cement 0.59 1.81 2.40Textile finishing 0.61 1.74 2.35Machinery equipment 1.39 0.96 2.35Health 0.31 1.88 2.19Paper products nec 0.57 1.61 2.18Publishing printing 0.65 1.53 2.18Ready mixed concrete 0.53 1.61 2.14Electrical equipment -0.52 2.52 2.00Beer and malt 0.33 1.66 1.99Welfare etc services 0.50 1.46 1.96Cosmetics 0.46 1.49 1.95Soap and detergents 0.45 1.38 1.83Concrete products 0.49 1.32 1.81Confectionery 0.30 1.39 1.69Road passenger transport 0.19 1.44 1.63Other farming import -1.14 2.72 1.58Knitting mills 0.43 1.14 1.57Clothing 0.39 1.03 1.42Pastoral zone 1.38 0.00 1.38Fruit and vegetables 0.24 1.08 1.32Retail trade 0.39 0.92 1.31Flour mill cereal products 0.18 1.09 1.27High rainfall zone 1.46 -0.27 1.19Oil gas and brown coal 1.05 0.04 1.09Soft drinks cordials 0.22 0.85 1.07Construction 0.23 0.74 0.97Bread cakes biscuits 0.17 0.62 0.79Public administration 0.19 0.48 0.67Education libraries 0.09 0.47 0.56Woodchips 0.00 0.00 0.00Railway fixed costs 0.00 0.00 0.00Defence 0.00 0.00 0.00Non competing imports 0.00 0.00 0.00Structural metal products 0.81 -2.65 -1.84Pasteurised milk -3.00 0.74 -2.26Rail passenger transport 0.10 -2.43 -2.33Locomotives rollings 0.79 -10.78 -9.99Non bulk rail transport 0.01 -12.98 -12.97Milk cattle -15.54 0.52 -15.02Milk products -19.99 0.60 -19.39
Note: a The HILORANI model covers 128 separate industry categories.Source: IC (1995b) table C2.4 and C2.8.

BUREAU OF INDUSTRY ECONOMICS
ECONOMY-WIDE IMPACTS OF MICROECONOMIC REFORM 183
185
References
AATS&E (Australian Academy of Technological Sciences and Engineering) 1994,The Competitiveness of Australian Industry, Report No. 1 the Processed FoodIndustry, Brown, Prior Anderson Pty Ltd, Burwood.
ABARE (Australian Bureau of Agricultural and Resource Economics) 1994,Commodity Statistical Bulletin, ABARE, Canberra.
_____ 1995, Australian Commodities, vol. 2, no. 1.
ABC (Australian Broadcasting Corporation) Television 1993, ‘Labour in power’.
ABS (Australian Bureau of Statistics) 1988, Award Coverage, Australia, Cat. No.6315.0, AGPS, Canberra.
_____ 1990, 1986-87 Australian National Accounts: Input-Output Tables (CommodityDetails), Cat. No. 5215.0, AGPS, Canberra.
_____ 1994, 1989-90 Australian National Accounts: Input-Output Tables (CommodityDetails), Cat. No. 5215.0, AGPS, Canberra.
_____ 1995a, Australian Economic Indicators, Cat. No. 1350.0, AGPS, Canberra.
_____ 1995b, The Labour Force, Australia, Cat. No. 6203.0, AGPS, Canberra.
_____ 1995c, Industrial Disputes, Australia, Cat. No. 6322.0, AGPS, Canberra.
_____ 1995d, Labour Statistics, Australia, Cat. No. 6101, AGPS, Canberra.
_____ 1995e, Australian National Accounts: National Income, Expenditure andProduct, Cat. No. 5204.0, AGPS, Canberra.
_____ 1995f, Australian National Accounts: Multifactor Productivity, 1993-94, Cat.No. 5234.0, AGPS, Canberra.
_____ (various years), Balance of Payments, Australia, Cat. No. 5302.0, AGPS,Canberra.
ACA (Australian Coal Association) 1994, Winning Coal, report prepared by ACILEconomics and Policy Pty. Ltd., September.
ACC (Australian Chamber of Commerce) 1984, ‘The future of Australian industrialrelations’, Australian Bulletin of Labour, supplement no. 5, September, pp.S11-S23.
ACCI (Australian Chamber of Commerce and Industry) 1995, Unfair Dismissal inAustralia, discussion paper, July.
186 MONITORING MICRO REFORM — SETTING THE SCENE
Ackland, R. and I. Harper, 1992, ‘Financial deregulation in Australia: boon or bane?’in Forsyth, P. (ed.), Microeconomic Reform in Australia, Allen & Unwin,Sydney.
ACTU (Australian Council of Trade Unions) 1993, Putting Jobs First, AccordAgreement 1993-1996, Melbourne.
AFSI (Australian Financial System Inquiry) 1981, (J. Campbell, Chair), Final Report,AGPS, Canberra
AGA (Australian Gas Association) 1994, Gas Industry Statistics: 1994, Canberra,June.
AIRC (Australian Industrial Relations Commission) 1995a, Industrial Relations Act1988 S.45 appeal against decision [PrintM4371] issued by CommissionerRedmond on 16 August 1995, Print M6526, Sydney, 26 October.
_____ 1995b, Third Safety Net Adjustment & Section 150A Review, October.
AMC 1994, Leading the Way: A Study of Best Manufacturing Practices in Australiaand New Zealand, AMC, Melbourne, November.
AMC/PCEK 1990, The Global Challenge: Australian Manufacturing in the 1990’s,final report of the study by Pappas Carter Evans & Koop/Telesis, AustralianManufacturing Council, Melbourne, July.
Austel (Australian Telecommunications Authority) 1994, Competitive Safeguards andCarrier Performance 1993-94, AGPS, Canberra, November.
AWIRS (R. Callus, A. Morehead, M. Cully, and J. Buchanan) 1991, Industrialrelations at work: the Australian Workplace Industrial Relations Survey,Commonwealth Department of Industrial Relations, AGPS, Canberra.
Baird, M. and J. Savage (with A. Petherick) 1990, Responding to Change: What FirmsSay About Structural Adjustment, research monograph 54, New Zealand Instituteof Economic Research, Wellington, October.
BCA (Business Council of Australia) 1990, Australia’s Foreign Debt: Choices for theFuture, report prepared for the Business Council of Australia’s National Summiton Debt, Canberra, February.
_____ 1994, Investing in Australia’s Future: Achieving Australia 2010 Scorecard,speeches given to the 1994 National Business Summit, Sydney ConventionCentre, 9-10 March.
_____ 1995b, submission to the Senate Employment, Education and TrainingReferences Committee, 13 June.
_____ 1995b, ‘Business Council says that it is up to business to address the challengesanalysed in the Karpin report’, media release, 26 April.

BUREAU OF INDUSTRY ECONOMICS
REFERENCES 187
Benge, M. 1992, ‘Tax reform in Australia’, in Forsyth, P. (ed.) 1992, MicroeconomicReform in Australia, Allen & Unwin, St Leonards.
BIE (Bureau of Industry Economics) 1990, Micro-economic Reform and the Structureof Industry, discussion paper 9, AGPS, Canberra.
_____ 1992, International Performance Indicators — Road Freight, research report 46,AGPS, Canberra.
_____ 1993, International Performance Indicators - Rail Freight Update 1993,research report 52, AGPS, Canberra.
_____ 1994a, International Performance Indicators - Overview, research report 53,AGPS, Canberra.
_____ 1994b, International Performance Indicators - Electricity Update 1994, researchreport 54, AGPS, Canberra.
_____ 1994c, International Performance Indicators - Gas Supply, research report 62,AGPS, Canberra.
_____ 1994d, International Performance Indicators - Aviation, research report 59,AGPS, Canberra.
_____ 1994e, Australian Industry Trends, no. 20, AGPS, Canberra, April.
_____ 1995a, Potential Gains to Australia from APEC Open Regionalism and theBogor Declaration, occasional paper 29, AGPS, Canberra.
_____ 1995b, International Benchmarking - Overview 1995, report 95/20, AGPS,Canberra.
_____ 1995c, International Benchmarking — Waterfront 1995, report 95/16, AGPS,Canberra.
_____ 1995d, Issues in Infrastructure Pricing, research report 69, AGPS, Canberra.
_____ 1995e, International Performance Indicators - Telecommunications 1995,research report 65, AGPS, Canberra.
_____ 1995f, Australian Industry Trends, no. 22, AGPS, Canberra, June.
_____ 1995g, International Performance Indicators - Coastal Shipping 1995, researchreport 68, AGPS, Canberra.
Blandy, R. and C. Walsh (eds) 1989, Budgetary Stress, The South AustralianExperience, Allen and Unwin, Sydney.
Borland, J., B. Chapman, and M. Rimmer 1992, ‘Microeconomic reform in theAustralian labour market’ in Forsyth, P. (ed.) 1992, Microeconomic Reform inAustralia, Allen & Unwin, Sydney.

188 MONITORING MICRO REFORM — SETTING THE SCENE
Brereton, L. (Minister for Industrial Relations) 1993, Industrial Relations Reform Bill1993 Second Reading Speech, House of Representatives, Weekly Hansard, Vol.10 October, p.2781.
Brereton, L. (Minister for Industrial Relations and Minister for Transport) 1994, NewsRelease, Ministerial Document Service, No.151/93-94, 25 March.
Broad, P. 1991, ‘Under new management - focussing on bottom line profitability andreturn on assets’, IRR Conference, Total Asset Management in the Public Sector,Sydney.
BRRU (Business Regulation Review Unit) 1986, Review of Business Regulations,information paper no. 1, AGPS, Canberra.
BTCE 1989, The Costs of Waterfront Unreliability in 1988, occasional paper 101,AGPS, Canberra.
_____ 1995a, Review of the Waterfront Industry Reform Program, Report 91, AGPS,Canberra.
_____ 1995b, Evaluation of the Transitional Period in Australian Telecommunications,working paper 16, AGPS, Canberra.
Button, J. 1984, Motor Vehicle Statement, Minister for Industry & Commerce, newsrelease, Canberra, 29 May.
CAI (Confederation of Australian Industry) 1984, ‘The future of Australianindustrial relations systems’, Australian Bulletin of Labour, supplement no. 5,September, pp. S49-S61.
Campbell, C., A. Bollard, and J. Savage, 1989, Productivity and Quality in NewZealand Firms: Effects of Deregulation, research monograph 46, New ZealandInstitute of Economic Research, Wellington.
Capling, A. and B. Galligan 1992, Beyond the Protective State: the Political Economyof Australia’s Manufacturing Industry, Cambridge University Press, Melbourne.
Catanzaritti, J. and G. Sullivan 1993, ‘Industrial relations legislation in 1992’, Journalof Industrial Relations, March, pp. 110-141.
Caves, R., I. Ward, P. Williams and C. Wright 1981, Australian Industry: Structure,Conduct, Performance, Prentice-Hall, Sydney.
Clare, R. and K. Johnston, 1993, Education in the 1990s, EPAC background paper no.31, AGPS, Canberra.
Clark, D. 1989, Student Economic Briefs 1989/90, The Financial Review Library,Sydney.
BUREAU OF INDUSTRY ECONOMICS
REFERENCES 189
Collins, Cook, McMullan & Gear (Senator Bob Collins, Senator Peter Cook, SenatorBob McMullan and Assistant Treasurer, George Gear) 1994, Joint Statement,DPIE 94/91C, 13 December.
Commonwealth of Australia 1977, White Paper on Manufacturing Industry, AGPS,Canberra, May.
_____ 1984, Budget Statements 1984-85, Budget Paper No. 1, AGPS, Canberra.
_____ 1991, Review of Wage Fixation Principles, exhibits presented by theCommonwealth Government, vol. 1, AGPS, Canberra.
_____ 1994a, Review of Wage Fixation Principles July-September 1993, vol. II,Exhibits presented by the Commonwealth Government, AGPS, Canberra.
_____ 1994b, Review of Wage Fixation Principles July-September 1993, vol. I,Submission by the Commonwealth Government, AGPS, Canberra.
Cook, P. 1994, ‘Major push for microeconomic reform’, Minister for Industry,Science and Technology, news release 373/94, Canberra, 19 December.
COPS (Centre of Policy Studies) 1994, Monash Input-Output Database 1994,unpublished data.
Crawford J. (Chair) 1982, Revitalisation of Australian Shipping: An Overview,Commonwealth Department of Transport, AGPS, Canberra.
Crean, S. 1995a, Working Nation: The First Year 1994-95, Minister for Employment,Education and Training, 18 August.
_____ 1995b, ‘Federal government commits $1.2 million to improving managementtraining’, media release C25/94, Minister for Employment, Education andTraining, Canberra.
Dao, D. and T. Jowett, 1994, Economic Effects of Microeconomic Reform, EPACsupplementary paper, May, AGPS, Canberra.
Davis, J.G. (Chair) 1990, Review of Commonwealth Primary Industry StatutoryMarketing Authorities, report of the committee of review to the Minister forPrimary Industries and Energy, AGPS, Canberra.
Davis, M. 1995, ‘Victoria backtracks on its wages system’, Australian FinancialReview, 22 June.
Dawkins, J. 1989, Improving Australia’s Training System, AGPS, Canberra.
_____ 1992, Treasurer’s press release, Canberra, 13 May.
DEET (Commonwealth Department of Employment, Education and Training) 1995,Annual Report 1994-95, AGPS, Canberra.

190 MONITORING MICRO REFORM — SETTING THE SCENE
DIR (Commonwealth Department of Industrial Relations) 1989, Review of theStructural Efficiency Principle, AGPS, Canberra.
_____ 1990, Report on the Operation of the Restructuring and Efficiency Principle,AGPS, Canberra.
_____ 1993a, Interim Evaluation of the Australian Best Practice DemonstrationProgram, September, DIR, Canberra.
_____ 1993b, Workplace Bargaining: The First 1000 Agreements, DIR, Canberra,August.
_____ 1994, Reform and Bargaining at the Workplace and Enterprise: Evidence fromTwo Surveys, November, DIR, Canberra.
_____ 1995a, Enterprise Bargaining in Australia: Developments under the IndustrialRelations Reform Act, Annual Report 1994, AGPS, Canberra.
_____ 1995b, unpublished data from DIR’s workplace agreements database.
DITARD (Department of Industry, Technology and Regional Development) 1993,Food Australia: Processed Food and Beverages Industry, 3rd edition, Canberra.
Domberger, S. 1992, ‘The role of public enterprises in microeconomic reform’, inMicroeconomic Reform in Australia, Forsyth, P. (ed.), Allen & Unwin, Sydney.
DPIE (Department of Primary Industries and Energy) 1995, Australia’s DairyIndustry: New Marketing Arrangements, unpublished information paper,Canberra, 16 August.
DPM&C (Department of the Prime Minister and Cabinet) 1991, Building aCompetitive Australia, statements by the Prime Minister, Treasurer and industryminister, AGPS, Canberra.
_____ 1994, Food Into Asia: the Next Steps, Prime Minister’s Science and EngineeringCouncil, Office of the Chief Scientist, Canberra.
Drago, R., M Wooden, and J. Sloan, 1992, Productive Relations? AustralianIndustrial Relations and Workplace Performance, Allen & Unwin, Sydney.
Dwyer, M. (1995), ‘Training revolution ambushed’, Australian Financial Review, 24October.
Edwards, G. 1992, ‘Microeconomic reform in Australian agriculture’, in Forsyth, P.(ed.) 1992, Microeconomic Reform in Australia, Allen & Unwin, St Leonards.
EPAC (Economic Planning Advisory Council) 1990a, Microeconomic Reform:Progress in the 1980s and Council Members’ Priorities for the 1990s, councilpaper no. 42, AGPS, Canberra.

BUREAU OF INDUSTRY ECONOMICS
REFERENCES 191
_____ 1990b, The Size and Efficiency of the Public Sector, council paper no. 44, AGPS,Canberra, October.
_____ 1993, Structural Change and Economic Growth, background paper no. 28,National Capital Printing Press, Canberra, June.
Ergas, H. and M. Wright, 1994, ‘Internationalisation, firm conduct and productivity’,in P. Lowe and J. Dwyer (eds), International Integration of the AustralianEconomy, proceedings of a conference held at the H.C. Coombs Centre forFinancial Studies, Kirribilli on 11-12 July, Economic Group, Reserve Bank ofAustralia, Sydney.
ESAA (Electricity Supply Association of Australia) 1995, unpublished data suppliedto the BIE.
ESFC (Employment and Skills Formation Council of the National Board forEmployment, Education and Training) 1989, Industry Training in Australia: TheNeed for Change, report to the Minister for Employment, Education andTraining, 5 May, AGPS, Canberra.
Fahey, J. 1994, ‘Hunter coal rail lines opened to competition’, news release, Premierof New South Wales, 4 November.
Filmer, R. and D. Dao, 1994, Economic Effects of Microeconomic Reform, EPACbackground paper no. 38, AGPS, Canberra.
FitzGerald, V.W. 1993, National Savings, A Report to the Treasurer, AGPS, Canberra
Forsyth, P. (ed.) 1992, Microeconomic Reform in Australia, Allen & Unwin, StLeonards.
FPRG (Food Processing Reference Group) 1991, Exporting Processed Foods: AStrategy for the Development of the Australian Food Processing Industry, reportto Senator the Hon. John Button, Canberra.
Fraser, M. (Prime Minister) 1982, Statement on Taxation and Industry AssistanceMeasures, Commonwealth Record, 19-25 July.
Frenkel, S. and M. Shaw 1989, ‘No tears for the second tier: productivity bargainingin the Australian metal industry’, Australian Bulletin of Labour, vol. 15, June,pp. 90-111.
Garnaut, R. 1990, Australia and the Northeast Asian Ascendancy, report to the PrimeMinister and the Minister for Foreign Affairs, AGPS, Canberra.
Gear, G. (Assistant Treasurer) 1995, ‘New national competition policy comes intoforce’, Press Release, No 150, 30 October.

192 MONITORING MICRO REFORM — SETTING THE SCENE
Gregory, R. 1984, Industry Protection and Adjustment: the Australian Experience,discussion paper no. 111, Australian National University, Centre for EconomicPolicy Research, November.
Gruen, F. and M. Grattan 1993, Managing Government: Labor’s Achievements andFailures, Longman Cheshire, Melbourne.
Hancock, W.K. 1930, Australia, Ernest Benn, London.
Hancock, K. (Chair) 1985, Australian Industrial Relations Law and Systems, report ofthe committee of review, AGPS, Canberra, April.
Harper, I. 1985, Why Financial Deregulation? discussion paper no. 132, AustralianNational University, Centre for Economic Policy Research, October.
Harris, C. 1991, Enterprise bargaining: possible outcomes and policy issues, Bureauof Industry Economics working paper no.72, December, Canberra.
Hawke, R.J.L. (Prime Minister) 1986, Address to the Nation on Economic Situation,Commonwealth Record, 9-15 June.
Henderson, D. 1995, ‘The revival of economic liberalism: Australia in an internationalperspective’, Australian Economic Review, 1st quarter.
Hilmer, F. (Chair) 1993a, National Competition Policy, report of the independentcommittee of inquiry, AGPS, Canberra, 25 August.
Hilmer, F. (Chair) 1993b, Working Relations: A Fresh Start for AustralianEnterprises, Employee Relations Study Commission , Business Council ofAustralia, Melbourne.
HR&EOC (Human Rights and Equal Opportunity Commission) 1995, Submission tothe 1995 Review of the Wage Fixing Principles, August.
IAC (Industries Assistance Commission) 1983, Assistance to Australian Agriculture,information paper, AGPS, Canberra.
_____ 1986, The Textile, Clothing and Footwear Industries, report no. 386, AGPS,Canberra.
_____ 1987a, Assistance to Agricultural and Manufacturing Industries, informationpaper, AGPS, Canberra.
_____ 1987b, A Guide to the IAC’s Use of the ORANI Model, information paper,AGPS, Canberra, December.
_____ 1988a, Annual Report 1987-88, AGPS, Canberra.
_____ 1989a, Government (Non-Tax) Charges, report no. 422, AGPS, Canberra.
_____ 1989b, Estimating the Economic Gains from Certain Transport Reforms, studycommissioned by the BCA, AMIC, ACM and NFF, 21 February.

BUREAU OF INDUSTRY ECONOMICS
REFERENCES 193
IC (Industry Commission) 1990, Annual Report, 1989-90, AGPS, Canberra.
_____ 1991a, Statutory Marketing Arrangements for Primary Products, report no. 10,AGPS, Canberra.
_____ 1993a, Annual Report, 1992-93, AGPS, Canberra.
_____ 1993b, Impediments to Regional Industry Adjustment, report no. 35, AGPS,Canberra.
_____ 1994, Annual Report 1993-94, AGPS, Canberra.
____ 1995a, Annual Report 1994-95, AGPS, Canberra.
_____ 1995b, Assistance to Agricultural and Manufacturing Industries, informationpaper, AGPS, Canberra.
_____ 1995c, The Performance of Australian Industry 1994-95, information paper,AGPS,
_____ 1995d, Australian Manufacturing Industry and International Trade Data 1968-69 to 1992-93, information paper, Union Offset, Canberra.
_____ 1995e, The Growth and Revenue Implications of Hilmer and Related Reforms,report by the Industry Commission to the Council of Australian Governments,March, AGPS, Canberra.
Karpin, D. (Chair) 1995, Enterprising Nation: Renewing Australia’s Managers toMeet the Challenges of the Asia-Pacific Century, report of the Industry TaskForce on Leadership and Management Skills, AGPS, Canberra, April.
Katics, M. and B. Peterson 1994, ‘The effect of rising import competition on marketpower: a panel data study of US manufacturing’, Journal of IndustrialEconomics, vol. XLII, no. 3, September.
Keating, P.J. 1987, Treasurer’s press release, 6 November.
_____ 1988, Economic Statement May 1988, statement by the Treasurer, AGPS,Canberra, 25 May.
_____ 1989, Treasurer’s press release, no. 76, Canberra, 15 August.
_____ 1992a, One Nation, statement by the Prime Minister, AGPS, Canberra, 26February.
_____ 1992b, speech by the Prime Minister to the Business Council of Australia’sAnnual General Meeting, Sydney, 15 October.
_____ 1994a, Working Nation: Policies and Programs, AGPS, Canberra.

194 MONITORING MICRO REFORM — SETTING THE SCENE
_____ 1994b, Working Nation: The White Paper on Employment and Growth,statement by the Prime Minister, AGPS, Canberra, 4 May.
Keirath, G. 1995, ‘Industrial relations reforms in Western Australia, 1993’, Journal ofIndustrial Relations, March, pp. 52-62.
Larkin, J. and T. Dwyer 1995, Refocusing Microeconomic Reform, report prepared forthe BCA, Melbourne.
Leibenstein, H. 1966, ‘Allocative efficiency v. X-efficiency’, American EconomicReview, vol. 56, pp. 392-415.
Long, S. (ed.) 1995, Enterprise Flexibility Agreements: 25 case studies for andagainst EFAs in Australia, Print n Run, Milsons Point.
Lyons, M. 1994, ‘Only curses fly at Sydney airport’, Business Review Weekly, 31October.
McDonald, T. and M. Rimmer 1988, ‘Award structure and the Second Tier’,Australian Bulletin of Labour, September, pp. 469-91.
McDougall, R. and S. Wear, 1992, ‘Manufactured exports, microeconomic reform,and model specification: an analysis of ORANI results in a report to theAustralian Chamber of Manufactures’, Industry Commission researchmemorandum OA-596, Canberra, November.
Macken, J. 1989, Award Restructuring, The Federation Press, Annandale.
Moore, D. 1995, The Implications of Globalisation for Macroeconomic Policy, IPAbackgrounder vol 7, no. 4, 17 May.
MSB (Metropolitan Services Board Hunter Ports Authority) 1992, ‘High-watermarks’, Newcastle, 8 December.
MTIA (Metal Trades Industry Association of Australia) 1990, Review of theOperation of the Structural Efficiency Principle and the Minimum RatesAdjustment Exercise: MTIA position, Canberra.
NPEC (National Pay Equity Coalition) 1995, Submission to the 1995 Review of theWage Fixing Principles, August.
Naughton, R. 1994, ‘The new bargaining regime under the Industrial RelationsReform Act’, Australian Journal of Labour Law, Vol. 7, August.
Norrington, B. 1995, ‘Bosses bid to slash awards’, Sydney Morning Herald, 23February.
NSW Agriculture and Fisheries 1991, Egg-o-nomics Weekly Flock Recording Service,Sydney.

BUREAU OF INDUSTRY ECONOMICS
REFERENCES 195
NSW Commission of Audit 1988, Focus on Reform: Report on the State’s Finances,Sydney, 29 July.
NSW Treasury 1994, A Social Program Policy for NSW Government TradingEnterprises, NSW Government, Sydney.
NSW Steering Committee on Government Trading Enterprises 1988, A PolicyFramework for Improving the Performance of Government Trading Enterprises,(G. Sturgess, Chairman), NSW Government Printer, September.
O’Connor, D. 1995, ‘Equity in the workplace: the implications of the IndustrialRelations Reform Act 1993’, Journal of Industrial Relations, March, vol.37,no.1, pp. 63-71.
OECD (Organisation for Economic Co-operation and Development) 1987, StructuralAdjustment and Economic Performance, OECD, Paris.
_____ 1990, OECD Economic Surveys: Australia 1989-90, OECD, Paris.
_____ 1994, Economic Surveys: Australia, OECD, Paris.
Office of State Owned Enterprises, Department of Treasury 1994, Community ServiceObligations, Policy Statement and Background to Policy, Victorian Government,Melbourne.
P&O (P&O Containers Limited) 1995, ‘Trade development and port performance,Australia/New Zealand-Europe trade: an operator’s perspective’, paper presentedat Port Strategy to 2000, AIC Conference, Sheraton Wentworth Hotel, Sydney,9-10 March.
Pallas, T. 1995, ‘The right to choose’, Workplace The ACTU Magazine, Autum.
Parry, T. 1995, The NSW Approach to GBE regulation, NSW Government PricingTribunal, paper presented to BIE Infrastructure Pricing Forum, Canberra, 15August.
Plowman, D. 1993, Opting Out: the Operation of Section 115 of the IndustrialRelations Act 1988, industrial relations research series no. 6, Department ofIndustrial Relations, AGPS, Canberra.
Porter, M. 1990, The Competitive Advantage of Nations, Macmillan Press, HongKong.
PSA (Prices Surveillance Authority) 1993a, Monitoring of Coastal Shipping FreightRates, no. 2, PSA, Melbourne, November.
_____ 1994a, Monitoring of Stevedoring Costs and Charges, no. 4, PSA, Melbourne,August.
_____ 1994b, Monitoring of Terminal Handling Charges, April, PSA, Melbourne.

196 MONITORING MICRO REFORM — SETTING THE SCENE
_____ 1994c, Monitoring of Stevedoring Costs and Charges, no. 4, PSA, Melbourne,August.
_____ 1995, Monitoring of Movements in Average Airfares No. 11, monitoring reportno. 23, PSA, Melbourne, January.
Rattigan, A. 1986, Industry Assistance: The Inside Story, Melbourne University Press,Collingwood.
RBA (Reserve Bank of Australia) 1995, Reserve Bank Bulletin (various issues),Sydney.
Reitano, R. 1995, ‘Legislative change in 1994’, Journal of Industrial Relations,March, pp. 84-94.
Rimmer, M. and J. Zappala 1988, ‘Labour market flexibility and the second tier’,Australian Bulletin of Labour, vol. 15, September, pp. 564-91.
Romeyn, J. 1994, The Law, Arbitration and Bargaining, AGPS, Canberra.
SCNPMGTE (Steering Committee on National Performance Monitoring ofGovernment Trading Enterprises) 1993, News Release, July.
_____ 1994, Government Trading Enterprises Performance Indicators 1987-88 to1992-93, Industry Commission, Melbourne.
_____ 1995, Government Trading Enterprises Performance Indicators 1989-90 to1993-94, Industry Commission, Melbourne.
Shann, E. 1989, ‘Training levy can’t beat market forces’, Business Review Weekly, 20October.
Short, M. and Buchanan, J. 1995, ‘Wages Policy and Wage Determination in 1994’,The Journal of Industrial Relations, Vol.37, No.1 March, pp.119-131.
Sloan, J. 1994, ‘Wage fixing under Accord Mark VII and the role of national wageprinciples’, Australian Bulletin of Labour, September, pp. 218-240.
_____ 1995, ‘The labour market: the challenge of reform and the costs of failing tomeet it’, Menzies Research Centre, Sydney, 5 July.
_____ and M. Wooden 1989, ‘The Australian labour market’, Australian Bulletin ofLabour, vol. 15, December, pp. 259-86.
_____ and M. Wooden 1990, ‘The structural efficiency principle in action -management views’, Australian Bulletin of Labour, vol. 16, September, pp. 199-223.
Stanford, J. (ed.) 1992, Industrial Policy in Australia and Europe, AGPS, Canberra.
Stewart, A. 1994, ‘The Industrial Relations Reform Act 1993: counting the cost’,Australian Bulletin of Labour, vol. 20, no. 2, June.

BUREAU OF INDUSTRY ECONOMICS
REFERENCES 197
Still, L. and D. Mortimer 1993, ‘The effectiveness of award restructuring and thetraining levy in providing a more educated workforce: a comparative study’,International Journal of Employment Studies, vol 1, April, pp. 77-101.
Walsh, P. 1987, Policy Guidelines for Commonwealth Statutory Authorities andGovernment Business Enterprises, Minister for Finance, AGPS, Canberra.
Waring, T. and J. Hogan, 1994, ‘Minerals and energy overview’, AustralianCommodities, vol. 1, no. 4, December, pp. 430-32.
Webber, I. (Chair) 1986, Shore-based Shipping, report by task force toCommonwealth Government, AGPS, Canberra.
Wittwer, G. and G. Connolly, 1993, ‘A reconsideration of export demand elasticitiesin ORANI’, Industry Commission paper presented at Australian Conference ofEconomists, Perth, 27-30 September.
Yetton, P., J. Davis, and P. Swan, 1992, Going International: Export Myths andStrategic Realities, report to the Australian Manufacturing Council, AustralianGraduate School of Management, Sydney.