Embed Size (px)
Citation preview
Private Hospitalsin Australia
CommissionResearch Paper
Commonwealth of Australia 1999
ISBN 1 74037 120 8
This work is subject to copyright. Apart from any use as permitted under theCopyright Act 1968, the work may be reproduced in whole or in part for study ortraining purposes, subject to the inclusion of an acknowledgment of the source.Reproduction for commercial use or sale requires prior written permission fromAusInfo. Requests and inquiries concerning reproduction and rights should beaddressed to the Manager, Legislative Services, AusInfo, GPO Box 1920, Canberra,ACT, 2601.
Inquiries:Media and PublicationsProductivity CommissionLocked Bag 2Collins Street East Post OfficeMelbourne Vic 8003
Tel: (03) 9653 2244Fax: (03) 9653 2303Email: [email protected]
An appropriate citation for this paper is:
Productivity Commission 1999, Private Hospitals in Australia, CommissionResearch Paper, AusInfo, Canberra.
The Productivity Commission
The Productivity Commission, an independent Commonwealth agency, is theGovernment’s principal review and advisory body on microeconomic policy andregulation. It conducts public inquiries and research into a broad range of economic andsocial issues affecting the welfare of Australians.
The Commission’s independence is underpinned by an Act of Parliament. Its processesand outputs are open to public scrutiny and are driven by concern for the wellbeing ofthe community as a whole.
Information on the Productivity Commission, its publications and its current workprogram can be found on the World Wide Web at www.pc.gov.au or by contactingMedia and Publications on (03) 9653 2244.
FOREWORD III
Foreword
Over the past decade, a number of reports by the Commission and its predecessorshave looked at aspects of Australia’s health care system. These include: Exports ofHealth Services (IC 1991); The Pharmaceutical Industry (IC 1996); Stocktake ofProgress in Microeconomic Reform (PC 1996); Private Health Insurance (IC1997); and Productivity Commission Submission to the National Review ofPharmacy (PC 1999b). The Commission also acts as Secretariat for the Review ofCommonwealth/State Service Provision’s work on monitoring the performance ofhealth and other government services (SCRCSSP 1999).
This research report on Australia’s private hospital industry had its origins in theCommission’s private health insurance inquiry. That inquiry raised a range of issuesrelating to demand for, and the efficiency of, private hospital services; and thenature of contracting between hospitals, health funds and doctors. This reportaddresses those and other relevant issues.
The primary objectives of the report are informational: to provide a comprehensiveoverview of the private hospital industry and to detail the key factors affecting itsperformance. While the report draws attention to a number of related policy issueswarranting examination, it does not contain any detailed policy analysis orrecommendations.
The report draws extensively on unpublished data contained in the AustralianBureau of Statistic’s Private Hospital Expenditure collection and the Department ofHealth and Aged Care’s Casemix Protocol collection. As such, it is likely to be ofinterest to those in the industry as well as in government. The report has alsobenefited from information provided in informal discussions between theCommission and government officials and members of the industry. TheCommission is grateful to all those organisations and individuals who contributed.Ian Bickerdyke was the primary researcher for the report.
Gary BanksChairman
December 1999
CONTENTS V
Contents
Foreword iii
Glossary vii
Summary xi
CHAPTERS
1 Introduction 1
1.1 Scope of the report 1
1.2 Information sources 2
1.3 Report outline 3
2 The private hospital industry 5
2.1 The private sector’s role in the delivery of hospital services 5
2.2 Defining the private hospital industry for this study 10
2.3 Industry structure and activity 11
2.4 Mergers and hospital diversification 17
3 The market for private hospital services 19
3.1 Market definition 19
3.2 Market participants 21
4 Financial performance 29
4.1 Private hospital revenues 29
4.2 Private hospital costs 34
4.3 Profitability 38
5 Broader performance indicators 45
5.1 Hospital efficiency 45
5.2 Quality of care 52
5.3 Appropriateness of care 57
VI CONTENTS
6 The regulatory and legislative environment 59
6.1 State and Territory regulation 59
6.2 Commonwealth regulation of the private hospital industry 65
7 Competition in the private hospital market 73
7.1 The relationship between private hospitals and doctors 73
7.2 The relationship between private hospitals and health funds 77
7.3 The relationship between health funds and doctors 85
7.4 The Trade Practices Act and the ACCC 88
7.5 Other competitive aspects of the private hospital market 89
8 Broad drivers of demand for private hospital services 93
8.1 Income growth and distribution 93
8.2 Population growth and ageing 95
8.3 Technological developments 97
8.4 Community attitudes to health care 99
9 Some future policy issues 101
9.1 Industry-specific issues 101
9.2 Some broader health policy issues 111
APPENDICES
A Private hospital revenues, charges and costs 117
B Additional hospital performance and State-based structural data 139
References 159
GLOSSARY VII
Glossary
Accreditation Verification by either the Australian Council on HealthcareStandards or the International Standards Organisation that ahospital meets specified quality-related processes and clinicalperformance requirements.
Acute carehospital
An establishment which provides at least minimal medical,surgical or obstetric services for inpatient treatment and/orcare, with round-the-clock qualified nursing and otherprofessional services.
Amendment Act1995
Abbreviation for the Health Legislation (Private HealthInsurance Reform) Amendment Act 1995. Amongst otherthings, this Act provides the legislative basis for contractingbetween hospitals, doctors and health funds through HPPAs,MPPAs and PAs.
Average lengthof stay (ALOS)
Average number of days spent by individual patients in aparticular hospital or group of hospitals.
BOO(T) facility Facility treating public patients financed, built and run by aprivate operator in return for patient payments from the Stategovernment concerned. Depending on the nature of theparticular contract, ownership of the facility may transfer to theState government at the end of the contract period.
Casemix Describes the mix and types of patients treated by a hospitalaccording to their medical conditions. Casemix is oftendescribed with reference to Diagnosis Related Groups (seebelow).
Clinical revenueprofile
Revenue of a hospital segmented according to the hospital’sclinical mix of services.
Co-locatedprivate hospital
Private hospital sited on the premises of a public hospital toform a joint medical facility or precinct. The two hospitals maysometimes share infrastructure and services.
VIII GLOSSARY
Compensablepatient
Patient whose medical and hospital costs are met by a thirdparty motor vehicle or workers’ compensation insurer.
Competitiveneutrality
Term used to describe a market outcome in which noindividual supplier is advantaged or disadvantaged bygovernment regulations, subsidies, taxation arrangements andthe like.
Copayment Portion of the cost of an insured health service met by the user.
Diagnosis relatedgroup (DRG)
Basis for a clinical classification of services provided inhospitals. The criteria for developing groupings are that theyare clinically meaningful and involve similar resource use.
DVA patient War veteran or war widow/widower eligible for free hospitaltreatment through the Repatriation Private Patient Scheme runand funded by the Department of Veterans Affairs.
Freestanding dayhospital (or ‘dayhospital’)
An establishment performing minor operations and otherprocedures not requiring an overnight stay, which is not part ofany private hospital providing overnight care.
For-profit grouphospital
A for-profit private hospital whose proprietor owns otherprivate hospitals. Sometimes referred to as ‘chain’ hospitals.
For-profitindependenthospital
A for-profit private hospital whose proprietor does not ownany other private hospital. These hospitals are often owned bydoctors.
Health insurancefund
Organisation registered under the National Health Act toprovide health insurance meeting some or all of the cost oftreatment provided to insured private patients in either publicor private facilities, as well as contributing to the cost of arange of ancillary medical and dental services provided outsidea hospital setting.
GLOSSARY IX
HPPA Hospital Purchaser Provider Agreement. Describes acontractual arrangement between a health fund and a hospitalunder the provisions of the Health Legislation (Private HealthInsurance Reform) Amendment Act 1995. Where an HPPA is inplace, and unless the agreement specifies a pre-determinedpatient copayment, the hospital must accept the HPPA price asfull payment by the fund for the episode of care for eligiblecontributors.
MPPA Medical Purchaser Provider Agreement. Describes acontractual arrangement under the Health Legislation (PrivateHealth Insurance Reform) Amendment Act 1995 between ahealth fund and a doctor, covering the provision of medicalservices to contributors in hospitals. If an MPPA is in place, ahealth fund is able to pay medical benefits in excess of theMedicare schedule fee, thus allowing for the elimination ofout-of-pocket expenses for patients (or limiting them to a pre-determined copayment).
Occupancy rate Number of patient days provided by a hospital expressed as apercentage of the total number of bed days potentiallyavailable in that hospital.
PA Practitioner Agreement. Describes a contractual arrangementunder the Health Legislation (Private Health InsuranceReform) Amendment Act 1995 between a hospital and a doctorallowing hospitals to receive payment under HPPAs formedical services provided by the doctor.
Patient revenue Revenue from patients received by a hospital foraccommodation and other fees.
Psychiatrichospital
An establishment devoted primarily to the treatment and careof inpatients with psychiatric, mental, or behavioural disorders.
Other not-for-profit hospital
A not-for-profit private hospital owned by someone other thana religious order or charitable organisation. Bush nursing,community and memorial hospitals account for most of thefacilities in this grouping.
X GLOSSARY
Recoveries Private hospital income from items such as staff meals andaccommodation, facility fees paid by medical practitioners, andpatient payments for telephone, TV hire and prostheses.Revenue related to inter-hospital transfers is sometimesincluded in recoveries.
Religious/charitablehospital
A not-for-profit private hospital owned and operated by areligious or charitable body. Some of these belong to groups orchains, such as St John of God, Sisters of Mercy or Sisters ofCharity. Others operate as independent hospitals.
Self-payingpatient
Private hospital patient (or private patient in a public hospital)without private health insurance who meets the full cost ofhis/her treatment.
Separations Number of patients treated in a hospital in any particular timeperiod.
Specialised unit Unit within a hospital providing specialised equipment andback-up staff. Examples include intensive care, coronary careand neo-natal units.

SUMMARY XI
Summary
Private sector involvement in the provision of hospital services takes a number offorms — including the delivery of services to some public patients. However, thetreatment of fee-paying patients in ‘traditional’ private hospitals is by far the mostimportant.
Private hospitals currently provide 30 per cent of acute hospital beds and treat 45per cent of all surgical patients. Moreover, demand for private hospital services hasbeen growing much faster than demand for public hospital services. Reflecting this,the private hospital share of total expenditure on hospital services increased from 18per cent in 1991–92 to 22 per cent in 1996–97 (figure 1).
Figure 1 Growth in private hospital expenditure share, 1991–92 to1996–97
10
12
14
16
18
20
22
24
1991-92 1992-93 1993-94 1994-95 1995-96 1996-97
Sh
are
of
tota
l ho
spit
al e
xpen
dit
ure
(%
)
Data source: AIHW, Health Expenditure Bulletin No. 15, 1997-98.
Like their public sector counterparts, private hospitals are undergoing somesignificant structural changes:
• Procedures performed without the need for an overnight hospital stay areaccounting for an increasing proportion of activity.
• At the same time, procedures performed on overnight patients are becomingmore complex.
XII SUMMARY
• Changes to the relationship between private hospitals and the health funds haveincreased the pressure on hospitals to deliver their services efficiently.
• Private hospitals are increasingly co-locating with public hospitals to allow forthe sharing of facilities and equipment and to provide greater convenience fordoctors and patients. These co-locations have had significant ramifications forthe viability of smaller, stand-alone, private hospitals.
Yet despite these changes, it is more than a decade since the last major independentstudy of the ‘private hospital industry’, undertaken by a Senate StandingCommittee.
This report attempts to fill this information gap. Amongst other things, it:
• provides a statistical overview of the industry, drawing on a range of previouslyunpublished data;
• examines some indicators of the industry’s financial performance, efficiency andquality of service (though it does not attempt to benchmark private hospitalsagainst the public hospital system);
• looks at some of the key factors affecting performance; and
• draws attention to some policy issues germane to the industry’s futureperformance. The report does not, however, contain any detailed analysis ofthese issues or provide policy recommendations.
Structure of the private hospital industry
In 1997–98, there were 317 private acute care and psychiatric hospitals providingtreatment to both overnight and day patients and 175 freestanding day facilities. Theacute care and psychiatric hospitals are responsible for the large bulk of industryactivity, accounting for around 85 per cent of total separations and more than 95 percent of total industry revenue (table 1).
There are four main ownership types in the industry — for-profit group, for-profitindependent, religious/charitable, and other not-for-profit hospitals. Together, for-profit group and religious/charitable operators provide around 80 per cent ofavailable beds in private acute care and psychiatric hospitals. Individual hospitalsrange in size from very small facilities of fewer than 25 beds to major facilities withseveral hundred beds.
SUMMARY XIII
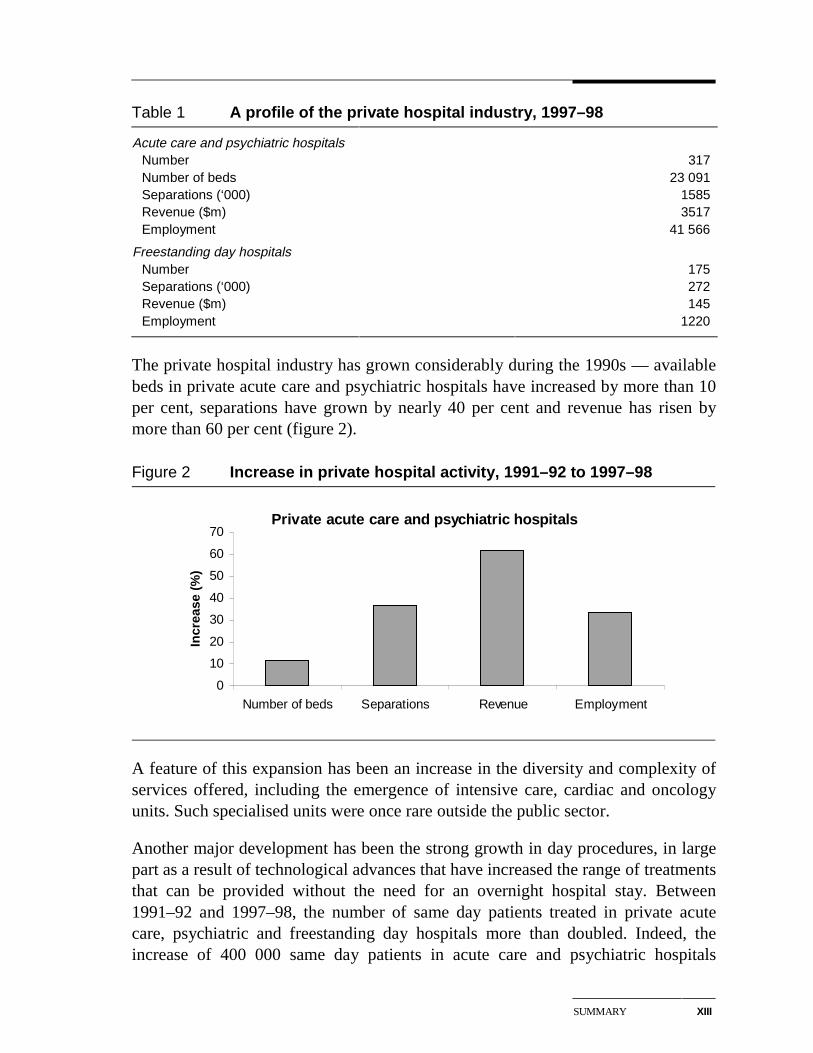
Table 1 A profile of the private hospital industry, 1997–98
Acute care and psychiatric hospitals Number 317 Number of beds 23 091 Separations (‘000) 1585 Revenue ($m) 3517 Employment 41 566
Freestanding day hospitals Number 175 Separations (‘000) 272 Revenue ($m) 145 Employment 1220
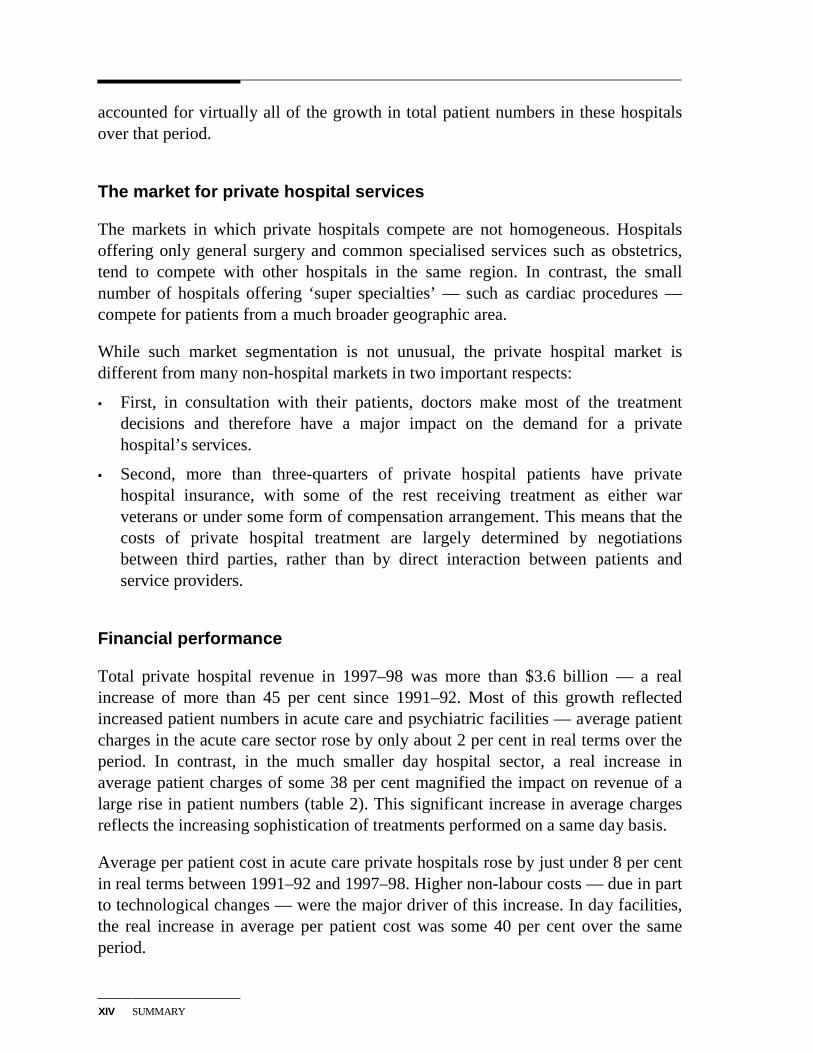
The private hospital industry has grown considerably during the 1990s — availablebeds in private acute care and psychiatric hospitals have increased by more than 10per cent, separations have grown by nearly 40 per cent and revenue has risen bymore than 60 per cent (figure 2).
Figure 2 Increase in private hospital activity, 1991–92 to 1997–98
Private acute care and psychiatric hospitals
0
10
20
30
40
50
60
70
Number of beds Separations Revenue Employment
Incr
ease
(%
)
A feature of this expansion has been an increase in the diversity and complexity ofservices offered, including the emergence of intensive care, cardiac and oncologyunits. Such specialised units were once rare outside the public sector.
Another major development has been the strong growth in day procedures, in largepart as a result of technological advances that have increased the range of treatmentsthat can be provided without the need for an overnight hospital stay. Between1991–92 and 1997–98, the number of same day patients treated in private acutecare, psychiatric and freestanding day hospitals more than doubled. Indeed, theincrease of 400 000 same day patients in acute care and psychiatric hospitals
XIV SUMMARY
accounted for virtually all of the growth in total patient numbers in these hospitalsover that period.
The market for private hospital services
The markets in which private hospitals compete are not homogeneous. Hospitalsoffering only general surgery and common specialised services such as obstetrics,tend to compete with other hospitals in the same region. In contrast, the smallnumber of hospitals offering ‘super specialties’ — such as cardiac procedures —compete for patients from a much broader geographic area.
While such market segmentation is not unusual, the private hospital market isdifferent from many non-hospital markets in two important respects:
• First, in consultation with their patients, doctors make most of the treatmentdecisions and therefore have a major impact on the demand for a privatehospital’s services.
• Second, more than three-quarters of private hospital patients have privatehospital insurance, with some of the rest receiving treatment as either warveterans or under some form of compensation arrangement. This means that thecosts of private hospital treatment are largely determined by negotiationsbetween third parties, rather than by direct interaction between patients andservice providers.
Financial performance
Total private hospital revenue in 1997–98 was more than $3.6 billion — a realincrease of more than 45 per cent since 1991–92. Most of this growth reflectedincreased patient numbers in acute care and psychiatric facilities — average patientcharges in the acute care sector rose by only about 2 per cent in real terms over theperiod. In contrast, in the much smaller day hospital sector, a real increase inaverage patient charges of some 38 per cent magnified the impact on revenue of alarge rise in patient numbers (table 2). This significant increase in average chargesreflects the increasing sophistication of treatments performed on a same day basis.
Average per patient cost in acute care private hospitals rose by just under 8 per centin real terms between 1991–92 and 1997–98. Higher non-labour costs — due in partto technological changes — were the major driver of this increase. In day facilities,the real increase in average per patient cost was some 40 per cent over the sameperiod.
SUMMARY XV
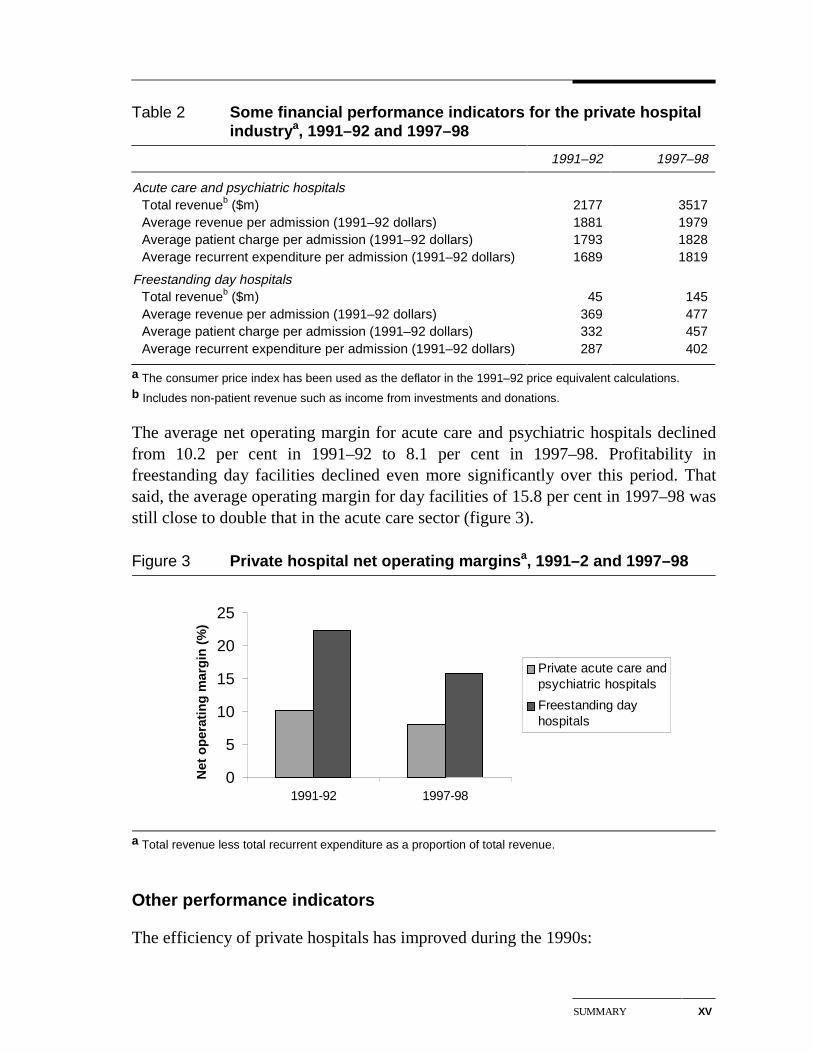
Table 2 Some financial performance indicators for the private hospitalindustrya, 1991–92 and 1997–98
1991–92 1997–98
Acute care and psychiatric hospitals Total revenueb ($m) 2177 3517Average revenue per admission (1991–92 dollars) 1881 1979Average patient charge per admission (1991–92 dollars) 1793 1828Average recurrent expenditure per admission (1991–92 dollars) 1689 1819
Freestanding day hospitals Total revenueb ($m) 45 145Average revenue per admission (1991–92 dollars) 369 477Average patient charge per admission (1991–92 dollars) 332 457Average recurrent expenditure per admission (1991–92 dollars) 287 402
a The consumer price index has been used as the deflator in the 1991–92 price equivalent calculations.b Includes non-patient revenue such as income from investments and donations.
The average net operating margin for acute care and psychiatric hospitals declinedfrom 10.2 per cent in 1991–92 to 8.1 per cent in 1997–98. Profitability infreestanding day facilities declined even more significantly over this period. Thatsaid, the average operating margin for day facilities of 15.8 per cent in 1997–98 wasstill close to double that in the acute care sector (figure 3).
Figure 3 Private hospital net operating marginsa, 1991–2 and 1997–98
0
5
10
15
20
25
1991-92 1997-98
Net
op
erat
ing
mar
gin
(%
)
Private acute care andpsychiatric hospitals
Freestanding dayhospitals
a Total revenue less total recurrent expenditure as a proportion of total revenue.
Other performance indicators
The efficiency of private hospitals has improved during the 1990s:
XVI SUMMARY
• While average costs per separation have increased, when allowance is made forgreater patient complexity, unit costs have declined. For example, between1993–94 and 1996–97, real casemix-adjusted costs per separation in acute carehospitals fell by 3 per cent.
• Average length of patient stay (casemix-adjusted) fell from 4.3 days in 1993–94to 3.7 days in 1996–97.
There are, however, marked variations in outcomes within the industry. Inparticular, for-profit group hospitals tend to have the lowest costs and have beenmainly responsible for the industry-wide reductions in casemix-adjusted costs.
But considerable caution is required in drawing any conclusions about the relativeefficiency of for-profit private hospitals and their not-for-profit counterparts.Observed differences in unit costs could reflect a range of factors other thanvariations in efficiency. One relevant consideration is service quality, althoughdetermining the contribution (if any) of quality differentials to variations in hospitalcosts is very difficult. Indeed, indicators of the quality and appropriateness ofprivate hospital care are limited, even at the industry-wide level. Nevertheless, oneindicator of quality is that nearly 70 per cent of private acute care and psychiatrichospitals are accredited by either the Australian Council on Healthcare Standards orthe International Standards Organisation.
Factors influencing private hospital performance
Regulatory requirements
The operation of Medicare, the institutional and funding arrangements for publichospitals and the regulation of the private health insurance sector, all havesignificant impacts on outcomes in the private hospital industry.
There are also regulations that directly influence the operations of private hospitals.These include:
• State and Territory licensing provisions for private hospitals, which mandatecompliance with a range of operational and quality requirements. In mostjurisdictions, they also incorporate controls on the number and geographicallocation of private hospital beds; and
• Commonwealth legislation governing the relationships between privatehospitals, doctors and health funds.
SUMMARY XVII
These regulations are variously directed at ensuring the provision of safe, highquality private hospital services, promoting equitable access to these services andproviding incentives for efficient service delivery.
However, the industry and some commentators have raised concerns about aspectsof the regulatory framework.
Contractual relationships
Contractual and other arrangements between private hospitals and doctors andhealth funds influence outcomes in the industry in a number of ways. For example:
• Arrangements with doctors on such things as terms of access to hospitalfacilities, and equipment and staffing levels, can have significant ramificationsfor hospital costs.
• The level of remuneration for treating insured patients which is provided for incontracts with health funds can be crucial to a hospital’s financial viability.
In this latter regard, private hospital operators claim that the current contractingframework gives the funds too much negotiating power, which they are using tounfairly reduce rates paid to hospitals.
Determining whether the balance of negotiating power is appropriate is far fromeasy. While the current contracting framework (introduced in 1995) may well haveshifted the balance towards the health funds, the funds still need contracts withsufficient hospitals in each geographic area to offer their members adequatecoverage. Thus, the negotiating strength of individual hospitals will depend on theservices they provide and the degree of competition they face from other hospitals.More generally, a negotiating framework that allowed hospitals to readily pass onany cost increases to health funds and their members would not be in the interests ofthe community.
That said, there may be a case for examining some aspects of the current contractingframework. For example, private hospitals (other than those in the same ownershipgroup) are not allowed to share information with other hospitals on the outcomes ofrate negotiations with the health funds. While this prohibition may help to precludecollusion between hospitals, it may also impose costs by making it more difficultfor hospitals to determine what performance improvements are necessary to securecontracts with the funds.
XVIII SUMMARY
Demand drivers
While future demand for private hospital services will depend crucially on theregulatory and health policy framework, there will also be some broader influencesat work:
• Continued growth in incomes will increase demand for health care, includingprivate hospital services. This is particularly the case given the discretionarycomponent of many private hospital treatments — some may be genuinelyoptional from a health perspective while, in other cases, treatment at somepersonal cost in a private hospital is a way of avoiding queues in the publichospital system, or gaining access to a higher standard of accommodation.
• Technological developments will provide new treatment options. Some of thesewill increase the range of services that private hospitals can offer. Some willimprove the safety of treatments and the likelihood of successful outcomes. Andsome will reduce the time spent in hospital and thereby the cost of treatments.Technological changes are also likely to facilitate an even greater emphasis onday surgery.
A number of commentators have suggested that ageing of the population will beanother significant influence on demand for private hospital services into the nextcentury. However, there is evidence that the primary effect of ageing is to delay theonset of high expenditure on health care, rather than to increase its duration. Thesignificant recent growth in per capita health expenditures in the over 65 age groupappears to have more to do with the expanded range of treatment options and toincome growth, than to ageing as such.
A future policy agenda
As noted, this report does not include detailed policy analysis or contain any policyrecommendations.
However, the Commission has briefly explored a number of policy issues that areimportant to private hospitals and which may warrant closer assessment, including:
• whether it is appropriate for governments to restrict the number of privatehospital beds;
• the implications of differences in licensing requirements across jurisdictions andbetween day hospitals and acute care hospitals;
• a lack of competitive neutrality, both within the private hospital sector —particularly as regards input tax exemptions for not-for-profit hospitals — andbetween private and public hospitals competing for private patients;
SUMMARY XIX
• the efficacy of the legislative framework underpinning agreements betweenprivate hospitals and doctors and health funds, including the effects of controlson information sharing by stand-alone hospitals;
• how to improve quality and clinical indicators for hospital services and makemore information available to consumers, health funds and other interestedparties; and
• the arrangements governing the supply of medical specialists available to workin private (and public) hospitals.
INTRODUCTION 1
1 Introduction
The private sector’s role in the delivery of hospital services takes a number offorms. Apart from the treatment of fee-paying patients in ‘traditional’ privatehospitals, private operators deliver services to some public patients under a varietyof contract arrangements with government. And, private contractors provide variousclinical and non-clinical services to many public hospitals.
While private sector involvement in the delivery of public patient services isincreasing, the treatment of private patients continues to be its most important role.Private hospitals provide 30 per cent of acute hospital beds and account for 45 percent of all surgical episodes.
Like its public sector counterpart, the ‘private hospital industry’ is undergoing somesignificant structural changes. Private hospitals are performing more complexprocedures, the importance of day surgery is growing, hospitals’ relationships withhealth funds are changing significantly, and co-located public and private hospitalsare becoming increasingly common.
Yet despite these changes, and the importance of private hospitals to Australia’soverall health care system, the last major independent study of the industry wasmore than a decade ago (SSCPHNH 1987). This report presents up-to-dateinformation on the nature and role of the industry.
1.1 Scope of the report
Australia needs a private hospital industry that delivers high quality, cost efficientand appropriate services and that is responsive to its customers needs. The first partof this report looks at how well the industry is performing against these broadcriteria.
But it is also important to look forward. Indeed, from a policy perspective, thefuture development of the industry and the role of government in helping to shapethat development are crucial. To this end, the second part of the report looks atsome key influences on the private hospital industry’s future performance.
2 PRIVATE HOSPITALSIN AUSTRALIA
However, the report does not contain any detailed analysis of these issues orprovide policy recommendations. Rather, it sets out an agenda for further researchand analysis and identifies areas where better information is needed to informpolicy choices.
In looking at the industry, it is important to recognise that private hospitals are nothomogeneous. The size of hospitals, the services they provide and ownershipstructures vary considerably. And, with increasing contracting out of the financingand operation of public facilities, the distinction between ‘public’ and ‘private’hospitals is becoming blurred. The report draws attention to the implications ofdifferences within the private hospital industry for performance, as well as forfuture policy arrangements. While the report does not benchmark the performanceof private hospitals against that of public hospitals, it draws attention to the inter-relationships between the two hospital systems and the institutional and fundingarrangements applying to them.
1.2 Information sources
Each year since the early 1990s, the Australian Bureau of Statistics (ABS) hascollected information on the structure and performance of the private hospitalindustry. The results of this annual survey are published in Private Hospitals,Australia.
However, to facilitate a more comprehensive analysis of the industry, theCommission has drawn together a range of previously unpublished data.
• It obtained a large amount of unpublished data from the 1991–92 and 1996–97ABS surveys. These data cover such things as staffing, costs and revenues,patient characteristics and types of treatment. The data differentiate betweenhospitals according to ownership, size, casemix and the like.
• The Commission also accessed material from the Hospital Casemix Protocolcollection maintained by the Commonwealth Department of Health and AgedCare (DHAC). This collection contains data from all the health insurance fundson hospital charges, benefits paid, types of procedures and patientcharacteristics, for the different types of private hospital.
• One of the major health funds assisted the Commission by augmenting the datasupplied to the DHAC.
The Commission supplemented this information with ‘desk top’ research andinterviews with: private hospital owners, managers and staff; the major healthfunds; Commonwealth and State government officials; industry bodies and
INTRODUCTION 3
associations; quality accreditation agencies; and academics. The Commissionthanks those organisations and individuals who contributed to the report.
1.3 Report outline
As noted above, the first part of the report examines the nature and performance ofthe private hospital industry:
• Chapter 2 looks at the different forms of private sector involvement in theprovision of hospital services, the structure of the ‘private hospital industry’ andhow the industry is evolving over time.
• Chapter 3 discusses the markets for private hospital services. As well asexamining differences in the types of services provided and the geographicaldistribution of private hospitals, it looks at the characteristics of private hospitalpatients, the doctors providing services to them and the health insurance funds.
• Chapter 4 provides an overview of the industry’s financial performance,including information on its revenues, costs and profitability.
• Chapter 5 looks at broader economic and social performance indicators,including cost-efficiency and service quality.
The second part of the report examines some of the key influences on the industry’sperformance:
• Chapter 6 describes the industry-specific regulatory arrangements, as well asnoting some broader health care policies impinging on demand for privatehospital services.
• Chapter 7 discusses the nature and implications of the relationships betweenprivate hospitals, doctors and the health funds.
• Chapter 8 looks briefly at some of the non-policy influences on future demandfor private hospital services, including income growth and distribution,technological change and the ageing of Australia’s population.
Drawing on this analysis, the final chapter canvasses a future policy agenda for theprivate hospital industry.
THE PRIVATEHOSPITAL INDUSTRY
5
2 The private hospital industry
This chapter examines the structural characteristics of the private hospital industry,and how these are changing over time.
However, these changes are occurring against a backdrop of broader developmentsin the private sector’s role in the delivery of hospital services. The chapter thereforecommences with a brief discussion of that changing role.
2.1 The private sector’s role in the delivery of hospitalservices
Traditionally, private hospitals were primarily involved in the provision of servicesto fee-paying private patients. The treatment of public patients free of charge waslargely the responsibility of public hospitals, which also provided care for asignificant number of fee-paying patients.
In recent years, the role of public hospitals in treating private patients has declinedsignificantly — in 1997–98, around 19 per cent of insured separations were inpublic institutions, compared with 36 per cent in 1993–94 (AIHW, AustralianHospital Statistics).
Conversely, governments are looking increasingly to the private sector to helpprovide public health care services. In keeping with this trend, the private sector’srole in the delivery of public hospital services is becoming more important.
A number of factors have contributed to this change, including:
• (self imposed) funding constraints on governments which have limited theircapacity to invest in new or expanded public hospital facilities;
• the perception that private involvement will lead to higher quality care and/orbetter value for money because of sharper efficiency incentives and the scope forprivate firms to exploit synergies from bundling construction, financing andhospital operations.
For their part, private hospital operators have seen the development of links with thepublic sector as a way of augmenting demand for their services and skills.
6 PRIVATE HOSPITALSIN AUSTRALIA
A variety of arrangements now exist that involve a mix of public and privateparticipation in ownership, management, delivery of services and financing ofhospitals. The key types of arrangements can be characterised as follows.
Traditional public hospitals
According to the AIHW (1999a) a public hospital is:
An establishment controlled by State and Territory health authorities which providesacute care. It provides free shared-ward accommodation and treatment by a hospital-appointed doctor. In addition it provides, to those who choose to be private patients,private ward accommodation and/or doctor of choice.
In the limiting case, a public hospital’s services would be provided without anyprivate sector involvement.
However, many public hospitals contract out some non-clinical services such ascatering, cleaning and information technology support. And, private health carecompanies supply clinical services such as pathology to some public facilities.Public hospitals contract out services for a variety of reasons, includingopportunities to reduce costs, improve service quality and increase flexibility.
Franchised public hospital services
Franchising is an extended form of contracting out. In essence, it involves a stategovernment contracting out the entire management of an existing public hospital toa private health care company. For instance, in 1995, Health Care of Australia(HCOA) leased the Mersey Hospital in the north of Tasmania.
BOOT-type arrangements
BOO and BOOT arrangements extend the franchising approach by introducingprivate sector financing to the construction and operation of facilities for treatingpublic patients. Under such arrangements, the private sector builds and financesnew hospital facilities to treat public patients in return for the right to operate thefacilities and receive patient payments from state governments:
• Under a BOO arrangement, the private sector Builds, Owns and Operates ahospital facility. The state government then purchases public hospital servicesfor a specified period of time. When the agreement expires or is terminated, theprivate company or consortium retains ownership of the facility.
THE PRIVATEHOSPITAL INDUSTRY
7
• A BOOT project is the same except that, at the end of the contract period,ownership transfers to the state government.
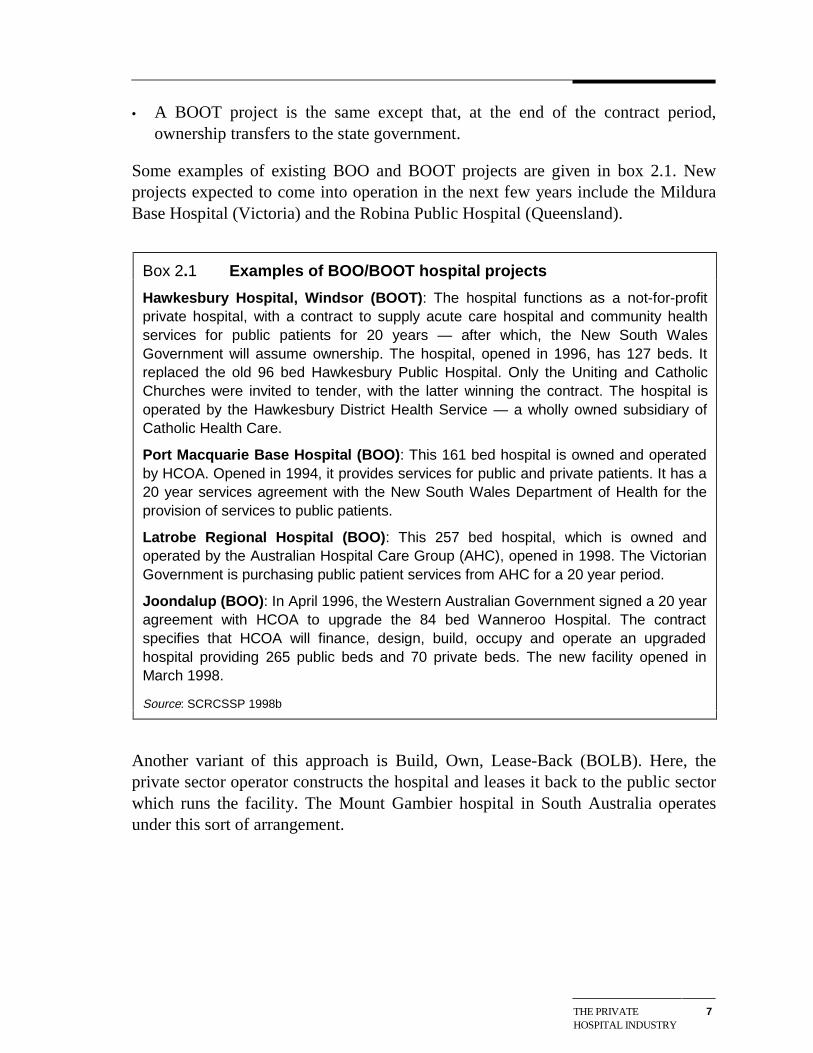
Some examples of existing BOO and BOOT projects are given in box 2.1. Newprojects expected to come into operation in the next few years include the MilduraBase Hospital (Victoria) and the Robina Public Hospital (Queensland).
Box 2.1 Examples of BOO/BOOT hospital projects
Hawkesbury Hospital, Windsor (BOOT): The hospital functions as a not-for-profitprivate hospital, with a contract to supply acute care hospital and community healthservices for public patients for 20 years — after which, the New South WalesGovernment will assume ownership. The hospital, opened in 1996, has 127 beds. Itreplaced the old 96 bed Hawkesbury Public Hospital. Only the Uniting and CatholicChurches were invited to tender, with the latter winning the contract. The hospital isoperated by the Hawkesbury District Health Service — a wholly owned subsidiary ofCatholic Health Care.
Port Macquarie Base Hospital (BOO): This 161 bed hospital is owned and operatedby HCOA. Opened in 1994, it provides services for public and private patients. It has a20 year services agreement with the New South Wales Department of Health for theprovision of services to public patients.
Latrobe Regional Hospital (BOO): This 257 bed hospital, which is owned andoperated by the Australian Hospital Care Group (AHC), opened in 1998. The VictorianGovernment is purchasing public patient services from AHC for a 20 year period.
Joondalup (BOO): In April 1996, the Western Australian Government signed a 20 yearagreement with HCOA to upgrade the 84 bed Wanneroo Hospital. The contractspecifies that HCOA will finance, design, build, occupy and operate an upgradedhospital providing 265 public beds and 70 private beds. The new facility opened inMarch 1998.
Source: SCRCSSP 1998b
Another variant of this approach is Build, Own, Lease-Back (BOLB). Here, theprivate sector operator constructs the hospital and leases it back to the public sectorwhich runs the facility. The Mount Gambier hospital in South Australia operatesunder this sort of arrangement.
8 PRIVATE HOSPITALSIN AUSTRALIA
Joint delivery of public and private hospital services by religiousgroups
Under arrangements with state and territory governments, more than 20religious/charitable hospitals, including seven major teaching hospitals, provideabout 3000 beds for use by public patients.
As a joint venture between the religious/charitable owners and governments, thesearrangements have much in common with BOOT-type facilities:
• the owners finance the construction and operation of these facilities;
• the government pays them for treating public patients;
• there can often be one management structure covering both the public andprivate components; and
• the two components often share staff.
However, in contrast to a BOOT-type facility, the private hospital component isoperated (and licensed) as a separate ‘private hospital’ within the hospital complex.Thus, costs and accounts are separately maintained.
Traditional private hospitals
The AIHW (1999a) defines private hospitals as:
Privately owned and operated institutions catering for patients who are treated by adoctor of their own choice. Patients are charged fees for accommodation and otherservices provided by the hospital and relevant medical and paramedical practitioners.Includes private freestanding day hospital facilities.
Hence, the key characteristics of a private hospital are: private ownership; privatemanagement; doctor of choice; and charges for services rendered.
The traditional private hospital grouping includes facilities that the public sector hassold to private owners. Some of these facilities continue to provide some services togovernments under contract. Two examples are:
• the Repatriation General Hospital, Hollywood, Western Australia, privatised in1994; and
• the Repatriation General Hospital, Greenslopes, Queensland, privatised in 1995.
Both were sold as part of a divestment program by the Commonwealth. Access forveterans to these facilities continues through specific Hospital Services Agreementsbetween the Department of Veterans Affairs and the hospitals.
THE PRIVATEHOSPITAL INDUSTRY
9
Co-locations
The traditional private hospital group also includes hospitals that are co-locatedwith a public facility to form a joint medical facility or precinct. While there may besome ‘sharing’ of facilities, the private hospital is not usually involved in thedelivery of any public hospital services. Moreover, co-located public and privatehospitals operate at arm’s length. Indeed, the Commonwealth has guidelines to thiseffect, which it applies before ‘declaring’ a co-located private hospital for healthinsurance purposes (see chapter 6). These are principally designed to reduce theCommonwealth’s exposure to cost shifting. This could occur, for example, ifservices that were formerly provided to public patients in the public hospital — at astate government’s expense — are provided, after co-location, by the privatehospital (with the Commonwealth incurring some of the expense for the medicalservices involved).
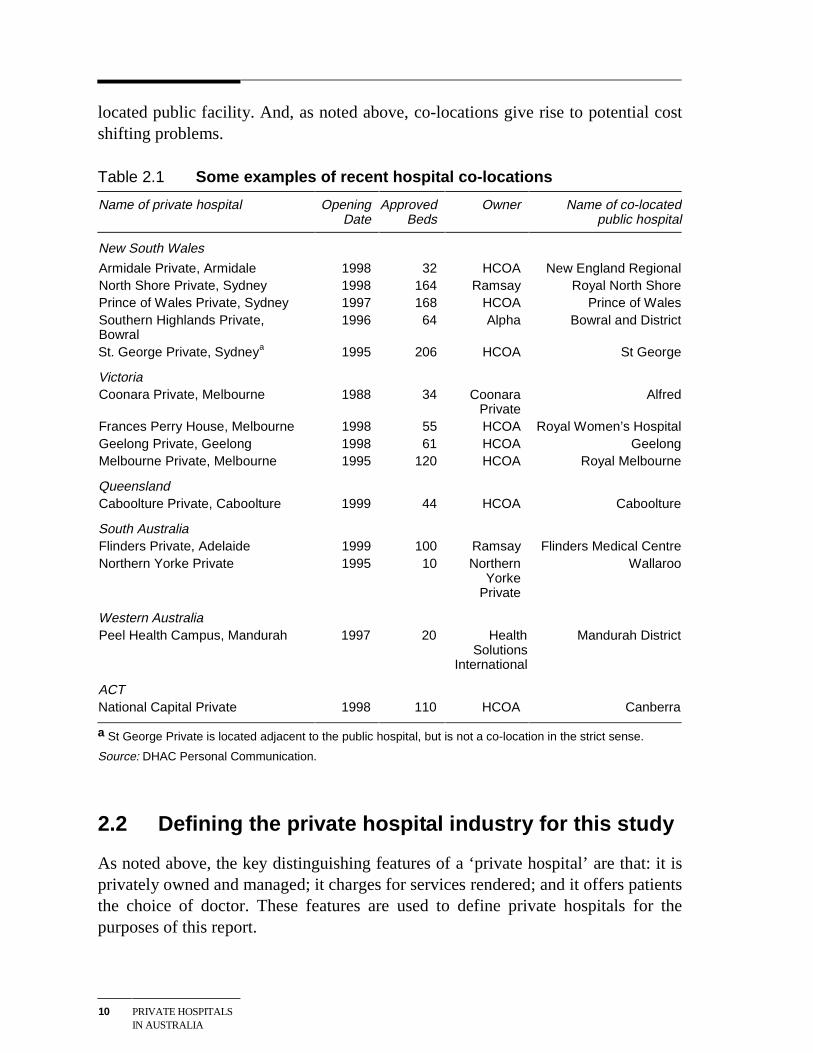
Co-location was rare in Australia a decade ago, but has gained popularity since themid 1990s, particularly in New South Wales and Victoria (see table 2.1).
The growth in co-locations reflects complementarities and economies of scope inthe provision of public and private hospital services:
• Co-locations may reduce duplication of services and facilities and allow forsome sharing of costs.
• Co-locations may help the public sector retain and/or attract medical specialists,by providing them with convenient access to private patients. As well ascontributing to the quality of patient care, this may increase the viability ofteaching services, allow public hospitals to install better technology and assist innursing recruitment.
• Apart from greater convenience in accessing their private patients, co-locationsoffer medical specialists a back-up service in the public hospital in the event ofcomplications in treating those patients. Moreover, specialists may prefer towork in conditions that enable them to interact with their peers and to haveaccess to a wider range of cases.
• Access to a wider range of specialists and the security of a back-up service in thepublic facility will, in turn, assist the private hospital to attract patients.
That said, co-locations can have downsides. Some free-standing hospitals haveclaimed that the relationships between co-located private and public hospitals maybreach competitive neutrality principles (see chapter 7). Further, while co-locationsmay be financially advantageous for state governments, the magnitude of thebenefit is likely to be reduced by some loss of private patient revenue in the co-
10 PRIVATE HOSPITALSIN AUSTRALIA
located public facility. And, as noted above, co-locations give rise to potential costshifting problems.
Table 2.1 Some examples of recent hospital co-locations
Name of private hospital OpeningDate
ApprovedBeds
Owner Name of co-locatedpublic hospital
New South Wales
Armidale Private, Armidale 1998 32 HCOA New England RegionalNorth Shore Private, Sydney 1998 164 Ramsay Royal North ShorePrince of Wales Private, Sydney 1997 168 HCOA Prince of WalesSouthern Highlands Private,Bowral
1996 64 Alpha Bowral and District
St. George Private, Sydneya 1995 206 HCOA St George
VictoriaCoonara Private, Melbourne 1988 34 Coonara
PrivateAlfred
Frances Perry House, Melbourne 1998 55 HCOA Royal Women’s HospitalGeelong Private, Geelong 1998 61 HCOA GeelongMelbourne Private, Melbourne 1995 120 HCOA Royal Melbourne
QueenslandCaboolture Private, Caboolture 1999 44 HCOA Caboolture
South AustraliaFlinders Private, Adelaide 1999 100 Ramsay Flinders Medical CentreNorthern Yorke Private 1995 10 Northern
YorkePrivate
Wallaroo
Western AustraliaPeel Health Campus, Mandurah 1997 20 Health
SolutionsInternational
Mandurah District
ACTNational Capital Private 1998 110 HCOA Canberra
a St George Private is located adjacent to the public hospital, but is not a co-location in the strict sense.
Source: DHAC Personal Communication.
2.2 Defining the private hospital industry for this study
As noted above, the key distinguishing features of a ‘private hospital’ are that: it isprivately owned and managed; it charges for services rendered; and it offers patientsthe choice of doctor. These features are used to define private hospitals for thepurposes of this report.
THE PRIVATEHOSPITAL INDUSTRY
11
Under this definition, the following types of hospitals collectively comprise theprivate hospital industry:
• privately owned and operated hospitals (acute care, psychiatric and day) thatcharge patients fees for accommodation and other services. (This group includesfacilities co-located with public hospitals and formerly government-ownedfacilities sold to the private sector);
• the private hospital component of religious/charitable hospitals; and
• the private hospital component of BOOT-type facilities such as Hawkesbury,Port Macquarie and Joondalup, where the public and private components areowned and managed by the same operator.
This definition is the same as that employed by the ABS and the CommonwealthDepartment of Health and Aged Care from whom the bulk of data used in thisreport is sourced. And, with the exception of BOOT-type facilities, the definitionalso coincides with the types of institutions licensed as private acute care orpsychiatric hospitals by state/territory governments, plus freestanding day hospitalsapproved by the Commonwealth. (BOOT-type facilities providing services to bothpublic and private patients are regarded by state governments as part of their publichealth care systems.)
2.3 Industry structure and activity
This section describes the structure and activity of the private hospital industry onan Australia-wide basis. (Industry data classified by state are provided in appendixB). All of the data in this section comes from the ABS Private Hospitals collection.Most of the tables are current to 1997–98. However, in those tables relying onunpublished data from the collection, the latest year is 1996–97. This is also true ofthe ABS data reported in subsequent chapters.
Number of hospitals
In 1997–98, there were 492 private hospitals in Australia. Of these, 294 were acutecare hospitals and 23 psychiatric hospitals. These hospitals are the principal focus ofthis report. The remaining 175 hospitals were freestanding day facilities.
Acute care and psychiatric hospitals
The number of acute care and psychiatric hospitals operating in 1997–98 wasvirtually the same as in 1991–92.
12 PRIVATE HOSPITALSIN AUSTRALIA
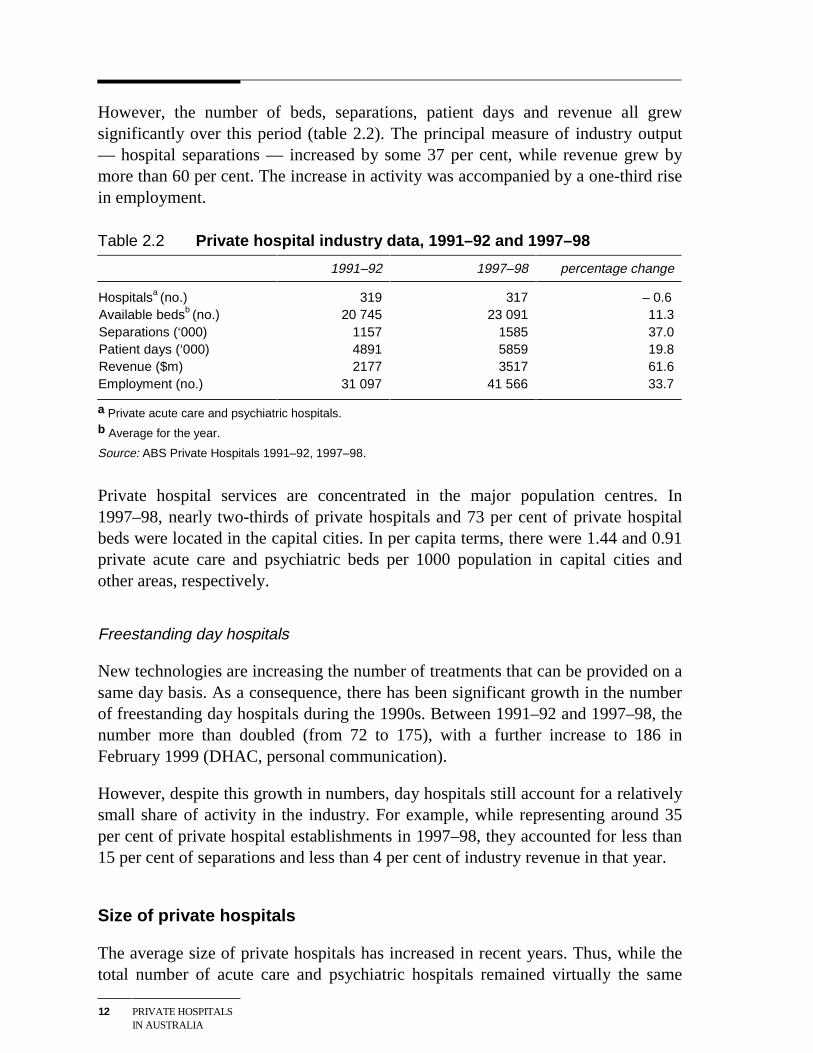
However, the number of beds, separations, patient days and revenue all grewsignificantly over this period (table 2.2). The principal measure of industry output— hospital separations — increased by some 37 per cent, while revenue grew bymore than 60 per cent. The increase in activity was accompanied by a one-third risein employment.
Table 2.2 Private hospital industry data, 1991–92 and 1997–98
1991–92 1997–98 percentage change
Hospitalsa (no.) 319 317 – 0.6 Available bedsb (no.) 20 745 23 091 11.3 Separations (‘000) 1157 1585 37.0 Patient days (‘000) 4891 5859 19.8 Revenue ($m) 2177 3517 61.6 Employment (no.) 31 097 41 566 33.7
a Private acute care and psychiatric hospitals.
b Average for the year.
Source: ABS Private Hospitals 1991–92, 1997–98.
Private hospital services are concentrated in the major population centres. In1997–98, nearly two-thirds of private hospitals and 73 per cent of private hospitalbeds were located in the capital cities. In per capita terms, there were 1.44 and 0.91private acute care and psychiatric beds per 1000 population in capital cities andother areas, respectively.
Freestanding day hospitals
New technologies are increasing the number of treatments that can be provided on asame day basis. As a consequence, there has been significant growth in the numberof freestanding day hospitals during the 1990s. Between 1991–92 and 1997–98, thenumber more than doubled (from 72 to 175), with a further increase to 186 inFebruary 1999 (DHAC, personal communication).
However, despite this growth in numbers, day hospitals still account for a relativelysmall share of activity in the industry. For example, while representing around 35per cent of private hospital establishments in 1997–98, they accounted for less than15 per cent of separations and less than 4 per cent of industry revenue in that year.
Size of private hospitals
The average size of private hospitals has increased in recent years. Thus, while thetotal number of acute care and psychiatric hospitals remained virtually the same
THE PRIVATEHOSPITAL INDUSTRY
13
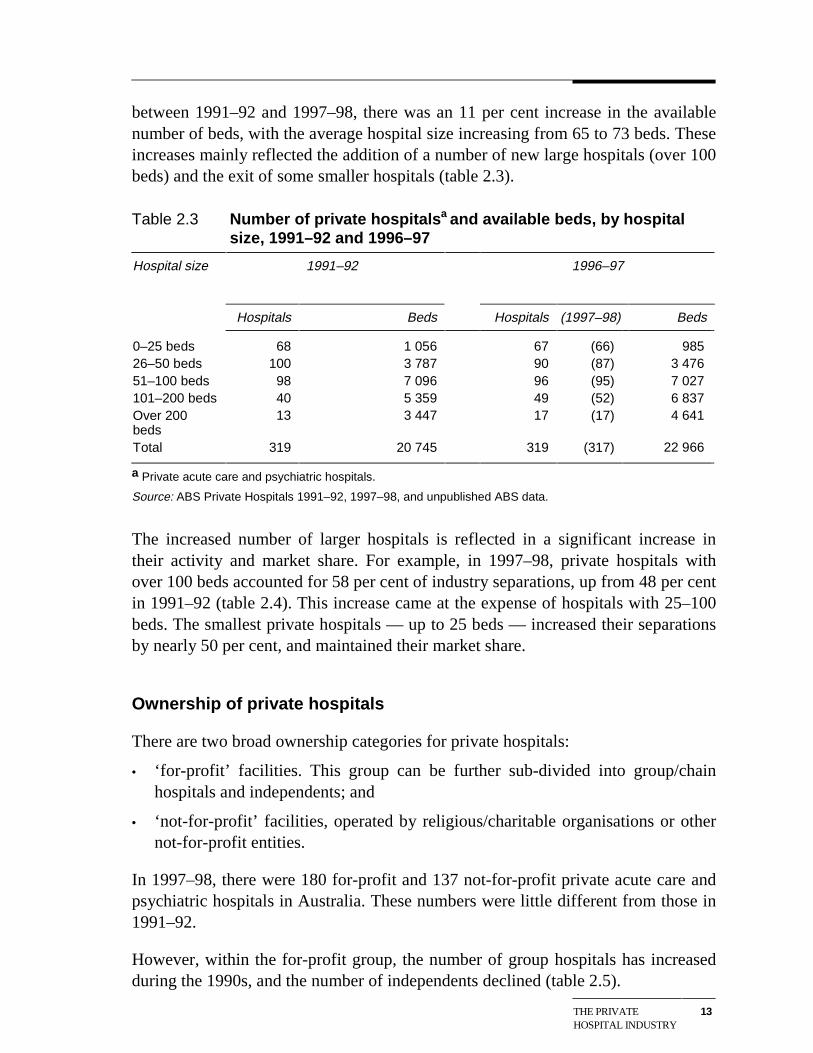
between 1991–92 and 1997–98, there was an 11 per cent increase in the availablenumber of beds, with the average hospital size increasing from 65 to 73 beds. Theseincreases mainly reflected the addition of a number of new large hospitals (over 100beds) and the exit of some smaller hospitals (table 2.3).
Table 2.3 Number of private hospitalsa and available beds, by hospitalsize, 1991–92 and 1996–97
Hospital size 1991–92 1996–97
Hospitals Beds Hospitals (1997–98) Beds
0–25 beds 68 1 056 67 (66) 985 26–50 beds 100 3 787 90 (87) 3 476 51–100 beds 98 7 096 96 (95) 7 027 101–200 beds 40 5 359 49 (52) 6 837 Over 200beds
13 3 447 17 (17) 4 641
Total 319 20 745 319 (317) 22 966
a Private acute care and psychiatric hospitals.
Source: ABS Private Hospitals 1991–92, 1997–98, and unpublished ABS data.
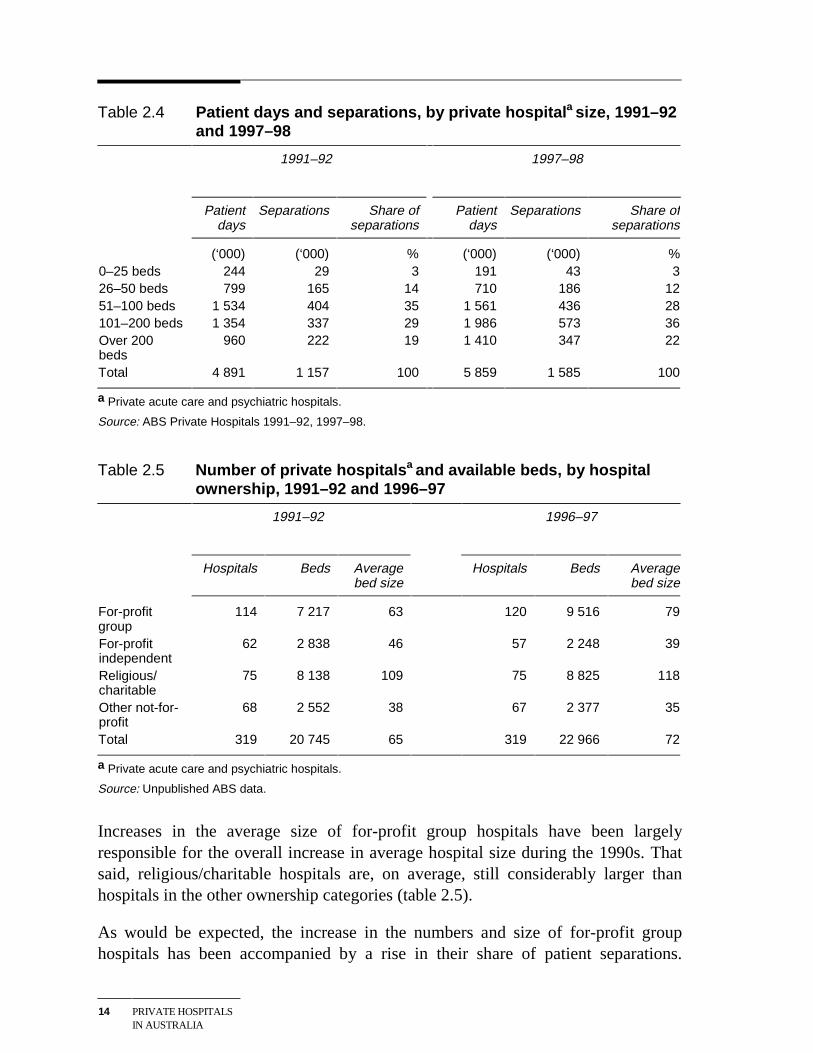
The increased number of larger hospitals is reflected in a significant increase intheir activity and market share. For example, in 1997–98, private hospitals withover 100 beds accounted for 58 per cent of industry separations, up from 48 per centin 1991–92 (table 2.4). This increase came at the expense of hospitals with 25–100beds. The smallest private hospitals — up to 25 beds — increased their separationsby nearly 50 per cent, and maintained their market share.
Ownership of private hospitals
There are two broad ownership categories for private hospitals:
• ‘for-profit’ facilities. This group can be further sub-divided into group/chainhospitals and independents; and
• ‘not-for-profit’ facilities, operated by religious/charitable organisations or othernot-for-profit entities.
In 1997–98, there were 180 for-profit and 137 not-for-profit private acute care andpsychiatric hospitals in Australia. These numbers were little different from those in1991–92.
However, within the for-profit group, the number of group hospitals has increasedduring the 1990s, and the number of independents declined (table 2.5).
14 PRIVATE HOSPITALSIN AUSTRALIA
Table 2.4 Patient days and separations, by private hospitala size, 1991–92and 1997–98
1991–92 1997–98
Patientdays
Separations Share ofseparations
Patientdays
Separations Share ofseparations
(‘000) (‘000) % (‘000) (‘000) % 0–25 beds 244 29 3 191 43 3 26–50 beds 799 165 14 710 186 12 51–100 beds 1 534 404 35 1 561 436 28 101–200 beds 1 354 337 29 1 986 573 36 Over 200beds
960 222 19 1 410 347 22
Total 4 891 1 157 100 5 859 1 585 100
a Private acute care and psychiatric hospitals.
Source: ABS Private Hospitals 1991–92, 1997–98.
Table 2.5 Number of private hospitalsa and available beds, by hospitalownership, 1991–92 and 1996–97
1991–92 1996–97
Hospitals Beds Averagebed size
Hospitals Beds Averagebed size
For-profitgroup
114 7 217 63 120 9 516 79
For-profitindependent
62 2 838 46 57 2 248 39
Religious/charitable
75 8 138 109 75 8 825 118
Other not-for-profit
68 2 552 38 67 2 377 35
Total 319 20 745 65 319 22 966 72
a Private acute care and psychiatric hospitals.
Source: Unpublished ABS data.
Increases in the average size of for-profit group hospitals have been largelyresponsible for the overall increase in average hospital size during the 1990s. Thatsaid, religious/charitable hospitals are, on average, still considerably larger thanhospitals in the other ownership categories (table 2.5).
As would be expected, the increase in the numbers and size of for-profit grouphospitals has been accompanied by a rise in their share of patient separations.
THE PRIVATEHOSPITAL INDUSTRY
15
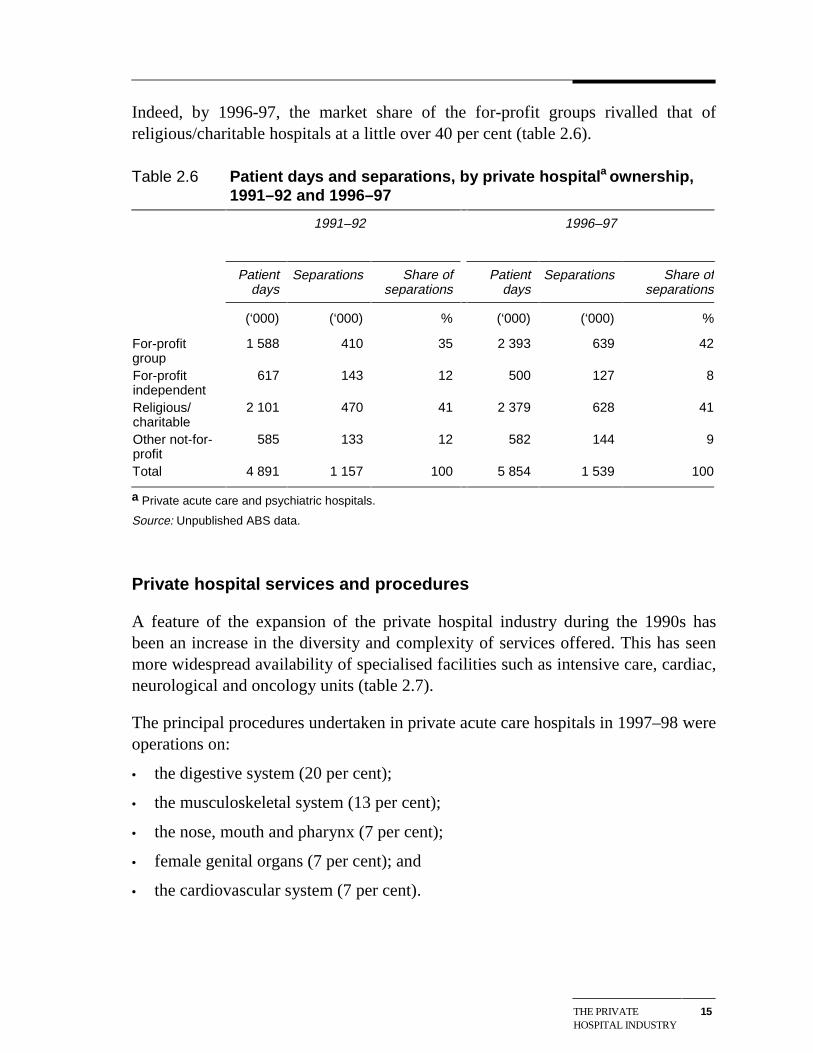
Indeed, by 1996-97, the market share of the for-profit groups rivalled that ofreligious/charitable hospitals at a little over 40 per cent (table 2.6).
Table 2.6 Patient days and separations, by private hospitala ownership,1991–92 and 1996–97
1991–92 1996–97
Patientdays
Separations Share ofseparations
Patientdays
Separations Share ofseparations
(‘000) (‘000) % (‘000) (‘000) %
For-profitgroup
1 588 410 35 2 393 639 42
For-profitindependent
617 143 12 500 127 8
Religious/charitable
2 101 470 41 2 379 628 41
Other not-for-profit
585 133 12 582 144 9
Total 4 891 1 157 100 5 854 1 539 100
a Private acute care and psychiatric hospitals.
Source: Unpublished ABS data.
Private hospital services and procedures
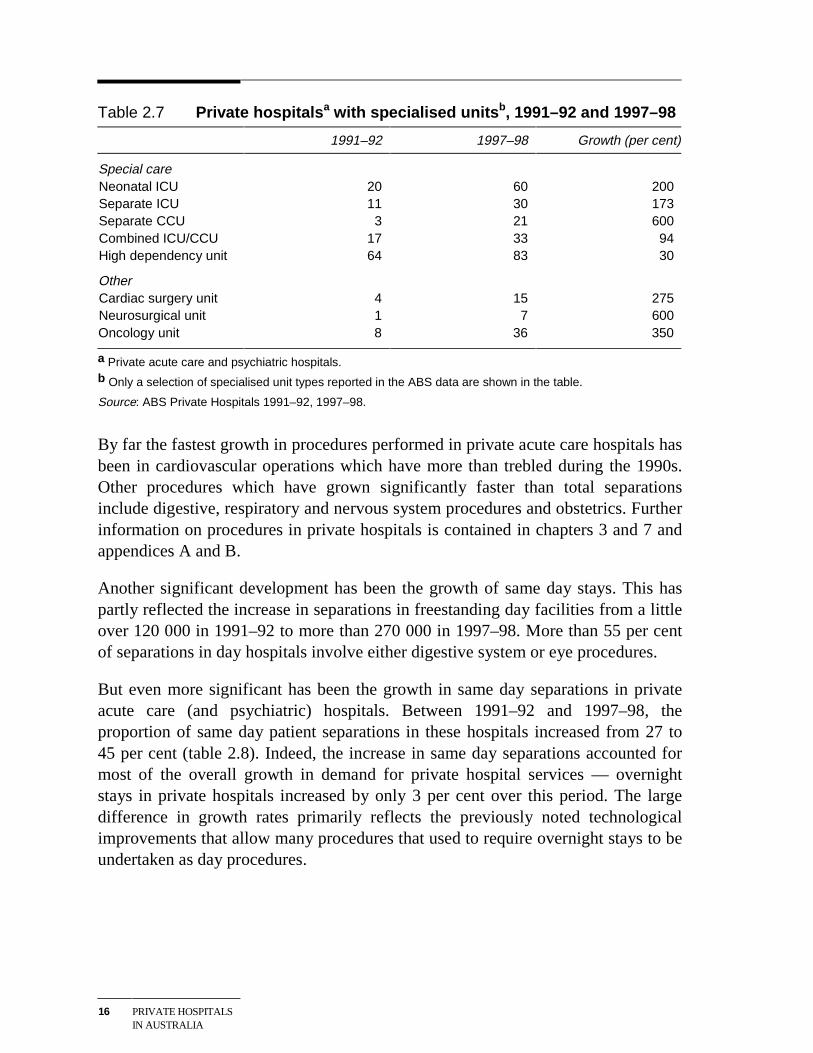
A feature of the expansion of the private hospital industry during the 1990s hasbeen an increase in the diversity and complexity of services offered. This has seenmore widespread availability of specialised facilities such as intensive care, cardiac,neurological and oncology units (table 2.7).
The principal procedures undertaken in private acute care hospitals in 1997–98 wereoperations on:
• the digestive system (20 per cent);
• the musculoskeletal system (13 per cent);
• the nose, mouth and pharynx (7 per cent);
• female genital organs (7 per cent); and
• the cardiovascular system (7 per cent).
16 PRIVATE HOSPITALSIN AUSTRALIA
Table 2.7 Private hospitalsa with specialised unitsb, 1991–92 and 1997–98
1991–92 1997–98 Growth (per cent)
Special care Neonatal ICU 20 60 200 Separate ICU 11 30 173 Separate CCU 3 21 600 Combined ICU/CCU 17 33 94 High dependency unit 64 83 30
Other Cardiac surgery unit 4 15 275 Neurosurgical unit 1 7 600 Oncology unit 8 36 350
a Private acute care and psychiatric hospitals.b Only a selection of specialised unit types reported in the ABS data are shown in the table.
Source: ABS Private Hospitals 1991–92, 1997–98.
By far the fastest growth in procedures performed in private acute care hospitals hasbeen in cardiovascular operations which have more than trebled during the 1990s.Other procedures which have grown significantly faster than total separationsinclude digestive, respiratory and nervous system procedures and obstetrics. Furtherinformation on procedures in private hospitals is contained in chapters 3 and 7 andappendices A and B.
Another significant development has been the growth of same day stays. This haspartly reflected the increase in separations in freestanding day facilities from a littleover 120 000 in 1991–92 to more than 270 000 in 1997–98. More than 55 per centof separations in day hospitals involve either digestive system or eye procedures.
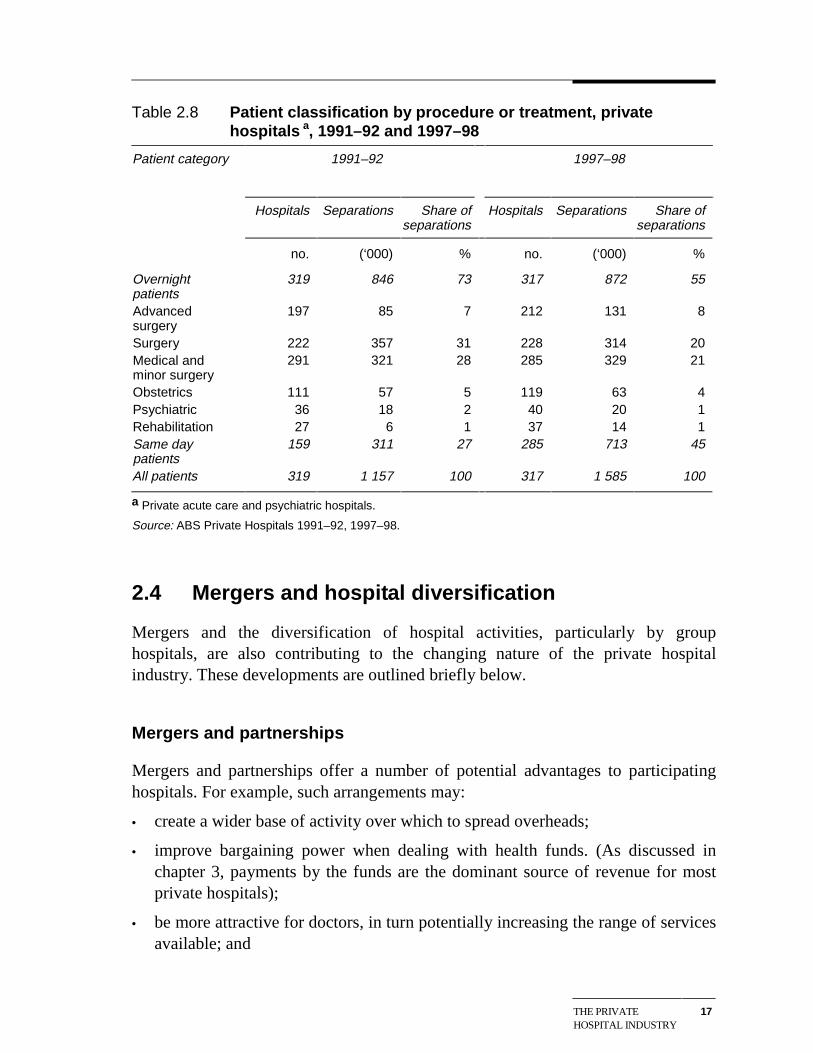
But even more significant has been the growth in same day separations in privateacute care (and psychiatric) hospitals. Between 1991–92 and 1997–98, theproportion of same day patient separations in these hospitals increased from 27 to45 per cent (table 2.8). Indeed, the increase in same day separations accounted formost of the overall growth in demand for private hospital services — overnightstays in private hospitals increased by only 3 per cent over this period. The largedifference in growth rates primarily reflects the previously noted technologicalimprovements that allow many procedures that used to require overnight stays to beundertaken as day procedures.
THE PRIVATEHOSPITAL INDUSTRY
17
Table 2.8 Patient classification by procedure or treatment, privatehospitals a, 1991–92 and 1997–98
Patient category 1991–92 1997–98
Hospitals Separations Share ofseparations
Hospitals Separations Share ofseparations
no. (‘000) % no. (‘000) %
Overnightpatients
319 846 73 317 872 55
Advancedsurgery
197 85 7 212 131 8
Surgery 222 357 31 228 314 20 Medical andminor surgery
291 321 28 285 329 21
Obstetrics 111 57 5 119 63 4 Psychiatric 36 18 2 40 20 1 Rehabilitation 27 6 1 37 14 1 Same daypatients
159 311 27 285 713 45
All patients 319 1 157 100 317 1 585 100
a Private acute care and psychiatric hospitals.
Source: ABS Private Hospitals 1991–92, 1997–98.
2.4 Mergers and hospital diversification
Mergers and the diversification of hospital activities, particularly by grouphospitals, are also contributing to the changing nature of the private hospitalindustry. These developments are outlined briefly below.
Mergers and partnerships
Mergers and partnerships offer a number of potential advantages to participatinghospitals. For example, such arrangements may:
• create a wider base of activity over which to spread overheads;
• improve bargaining power when dealing with health funds. (As discussed inchapter 3, payments by the funds are the dominant source of revenue for mostprivate hospitals);
• be more attractive for doctors, in turn potentially increasing the range of servicesavailable; and
18 PRIVATE HOSPITALSIN AUSTRALIA
• provide an opportunity to increase the average casemix complexity of thehospital’s procedures. As discussed later in the report, hospitals indicated thatcomplex procedures are more profitable than less complex ones.
Reflecting these advantages, there have been several recent merger and partnershiptype arrangements. For example, in 1998, the Sisters of Mercy combined with theSisters of Charity in Melbourne to merge Mercy Private and St Vincent’s Private.
Diversification
Some of the for-profit groups have broadened their operations to include otherhealth related activities. HCOA and Alpha have been the most active players in thisregard, acquiring a range of health care services, including GP services anddiagnostic services, such as pathology and radiology. Amongst other things, suchdiversification may make hospital groups less dependent on the outcomes ofcontract negotiations with the health insurance funds.
Other hospital groups have sought to strengthen their market position bydiversifying their patient base. One example is Ramsay’s contract with theDepartment of Veterans Affairs to treat war veterans.
At the individual hospital level, one facility told the Commission that, in response toincreased competition from other hospitals, it had introduced an emergencydepartment. While this emergency department is unlikely to be profitable in its ownright, the hospital said that it provides a significant flow of patients to other parts ofthe facility — approximately one in four emergency admissions at the hospital aresubsequently admitted as patients and 27 per cent of all bed days now originatefrom the emergency department.
PRIVATE HOSPITALMARKETS
19
3 The market for private hospitalservices
This chapter describes the market in which private hospitals operate (section 3.1)and profiles the other key market participants — patients, health funds and doctors(section 3.2).
3.1 Market definition
In looking at the market for private hospital services, two important features are thenature of the activities (or the ‘products’ sold) and the geographic distribution ofthose activities. These aspects are considered below.
It is also important to recognise that private hospitals face competition from thepublic hospital system. For example, around 19 per cent of insured private patientsreceive their treatment in public hospitals, (although whether many of these patientsare potential private hospitals customers has been the subject of debate — seechapter 7). More generally, demand for private hospital services is influenced by theavailability of free treatment in public hospitals, including for those with privatehealth insurance who elect to be treated as public patients.
Product markets
Hospitals provide the infrastructure that allows doctors to treat patients. Thisincludes human resources — particularly nursing staff — as well as beds, theatres,equipment and other facilities.
However, hospitals are not homogeneous institutions — the ‘infrastructurepackages’ available to doctors and their patients are typically tailored to meetspecific doctor/patient requirements.
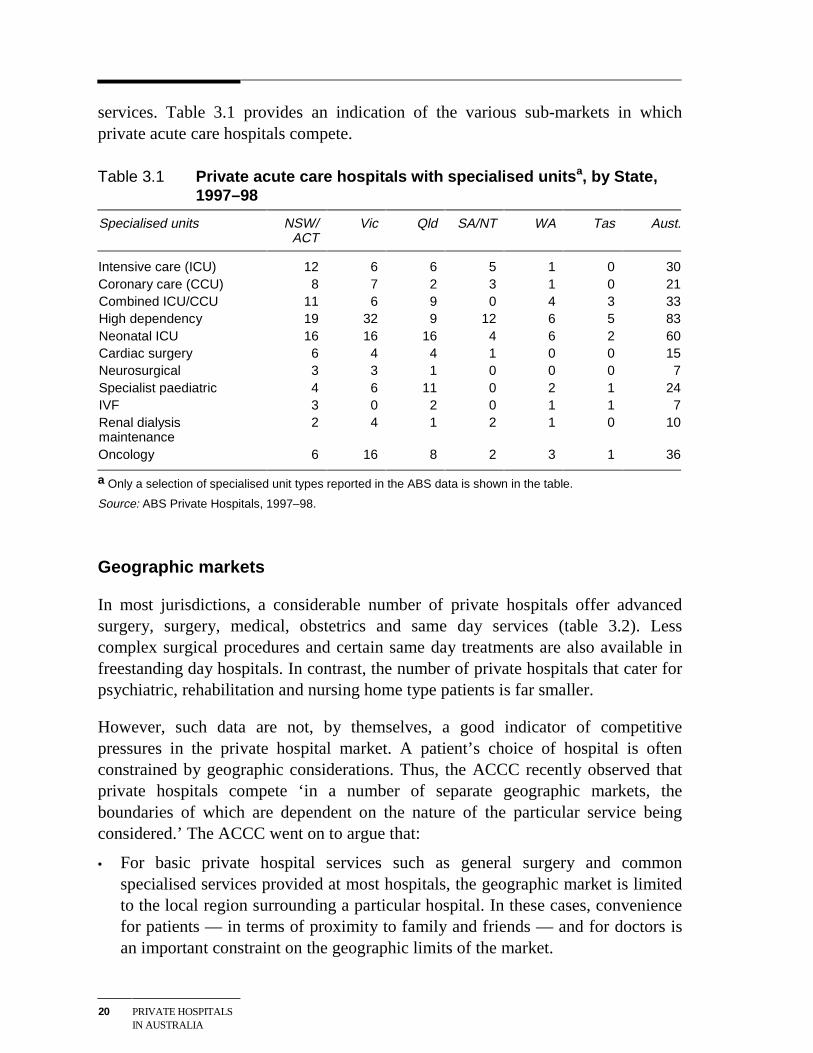
Thus, while many private hospitals have the capacity to provide sophisticatedsurgical procedures as well as basic medical treatments, in practice, the facilitiesand services offered vary significantly. Indeed, many private hospitals target nichemarkets using specialised equipment and back-up staff to differentiate their
20 PRIVATE HOSPITALSIN AUSTRALIA
services. Table 3.1 provides an indication of the various sub-markets in whichprivate acute care hospitals compete.
Table 3.1 Private acute care hospitals with specialised unitsa, by State,1997–98
Specialised units NSW/ACT
Vic Qld SA/NT WA Tas Aust.
Intensive care (ICU) 12 6 6 5 1 0 30Coronary care (CCU) 8 7 2 3 1 0 21Combined ICU/CCU 11 6 9 0 4 3 33High dependency 19 32 9 12 6 5 83Neonatal ICU 16 16 16 4 6 2 60Cardiac surgery 6 4 4 1 0 0 15Neurosurgical 3 3 1 0 0 0 7Specialist paediatric 4 6 11 0 2 1 24IVF 3 0 2 0 1 1 7Renal dialysismaintenance
2 4 1 2 1 0 10
Oncology 6 16 8 2 3 1 36
a Only a selection of specialised unit types reported in the ABS data is shown in the table.
Source: ABS Private Hospitals, 1997–98.
Geographic markets
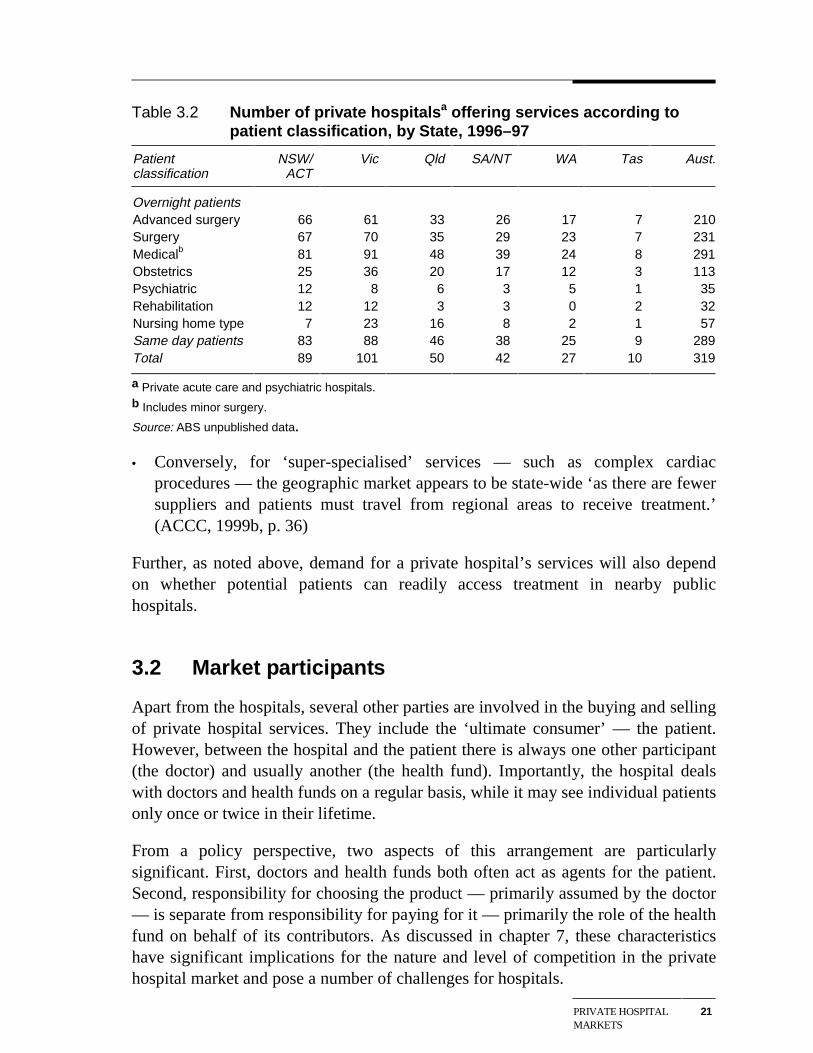
In most jurisdictions, a considerable number of private hospitals offer advancedsurgery, surgery, medical, obstetrics and same day services (table 3.2). Lesscomplex surgical procedures and certain same day treatments are also available infreestanding day hospitals. In contrast, the number of private hospitals that cater forpsychiatric, rehabilitation and nursing home type patients is far smaller.
However, such data are not, by themselves, a good indicator of competitivepressures in the private hospital market. A patient’s choice of hospital is oftenconstrained by geographic considerations. Thus, the ACCC recently observed thatprivate hospitals compete ‘in a number of separate geographic markets, theboundaries of which are dependent on the nature of the particular service beingconsidered.’ The ACCC went on to argue that:
• For basic private hospital services such as general surgery and commonspecialised services provided at most hospitals, the geographic market is limitedto the local region surrounding a particular hospital. In these cases, conveniencefor patients — in terms of proximity to family and friends — and for doctors isan important constraint on the geographic limits of the market.
PRIVATE HOSPITALMARKETS
21
Table 3.2 Number of private hospitalsa offering services according topatient classification, by State, 1996–97
Patientclassification
NSW/ACT
Vic Qld SA/NT WA Tas Aust.
Overnight patientsAdvanced surgery 66 61 33 26 17 7 210Surgery 67 70 35 29 23 7 231Medicalb 81 91 48 39 24 8 291Obstetrics 25 36 20 17 12 3 113Psychiatric 12 8 6 3 5 1 35Rehabilitation 12 12 3 3 0 2 32Nursing home type 7 23 16 8 2 1 57Same day patients 83 88 46 38 25 9 289Total 89 101 50 42 27 10 319
a Private acute care and psychiatric hospitals.b Includes minor surgery.
Source: ABS unpublished data.
• Conversely, for ‘super-specialised’ services — such as complex cardiacprocedures — the geographic market appears to be state-wide ‘as there are fewersuppliers and patients must travel from regional areas to receive treatment.’(ACCC, 1999b, p. 36)
Further, as noted above, demand for a private hospital’s services will also dependon whether potential patients can readily access treatment in nearby publichospitals.
3.2 Market participants
Apart from the hospitals, several other parties are involved in the buying and sellingof private hospital services. They include the ‘ultimate consumer’ — the patient.However, between the hospital and the patient there is always one other participant(the doctor) and usually another (the health fund). Importantly, the hospital dealswith doctors and health funds on a regular basis, while it may see individual patientsonly once or twice in their lifetime.
From a policy perspective, two aspects of this arrangement are particularlysignificant. First, doctors and health funds both often act as agents for the patient.Second, responsibility for choosing the product — primarily assumed by the doctor— is separate from responsibility for paying for it — primarily the role of the healthfund on behalf of its contributors. As discussed in chapter 7, these characteristicshave significant implications for the nature and level of competition in the privatehospital market and pose a number of challenges for hospitals.
22 PRIVATE HOSPITALSIN AUSTRALIA
Patients
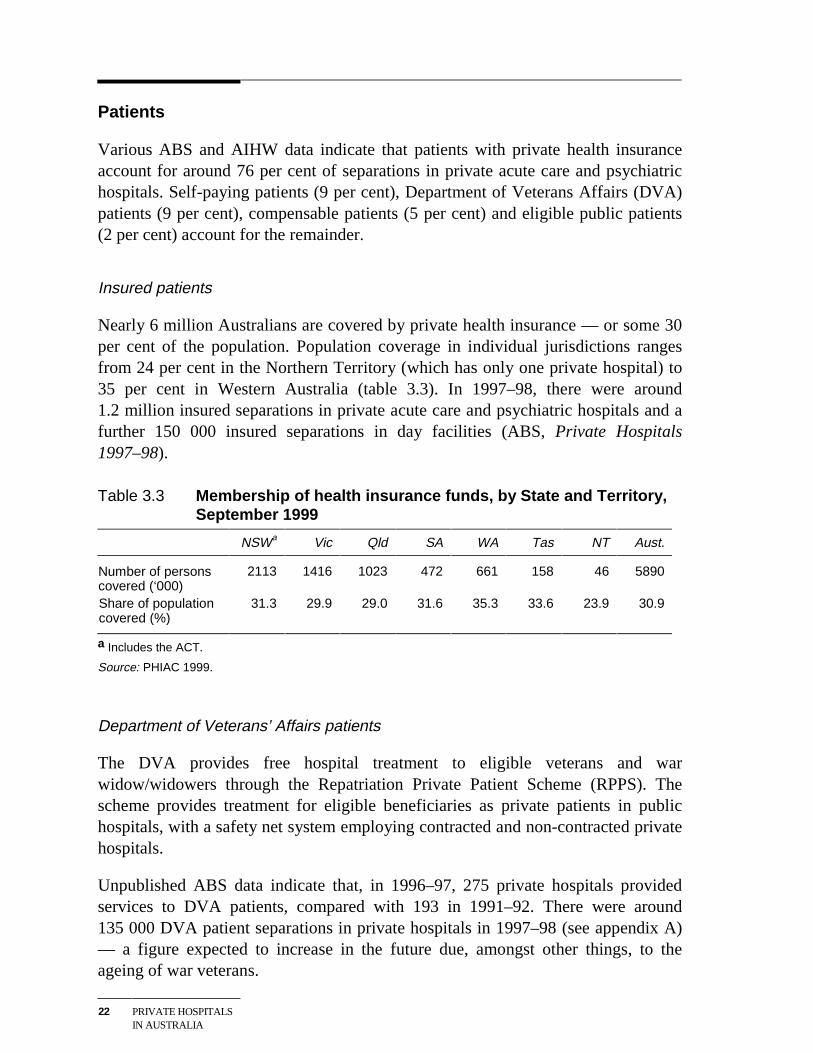
Various ABS and AIHW data indicate that patients with private health insuranceaccount for around 76 per cent of separations in private acute care and psychiatrichospitals. Self-paying patients (9 per cent), Department of Veterans Affairs (DVA)patients (9 per cent), compensable patients (5 per cent) and eligible public patients(2 per cent) account for the remainder.
Insured patients
Nearly 6 million Australians are covered by private health insurance — or some 30per cent of the population. Population coverage in individual jurisdictions rangesfrom 24 per cent in the Northern Territory (which has only one private hospital) to35 per cent in Western Australia (table 3.3). In 1997–98, there were around1.2 million insured separations in private acute care and psychiatric hospitals and afurther 150 000 insured separations in day facilities (ABS, Private Hospitals1997–98).
Table 3.3 Membership of health insurance funds, by State and Territory,September 1999
NSWa Vic Qld SA WA Tas NT Aust.
Number of personscovered (‘000)
2113 1416 1023 472 661 158 46 5890
Share of populationcovered (%)
31.3 29.9 29.0 31.6 35.3 33.6 23.9 30.9
a Includes the ACT.
Source: PHIAC 1999.
Department of Veterans’ Affairs patients
The DVA provides free hospital treatment to eligible veterans and warwidow/widowers through the Repatriation Private Patient Scheme (RPPS). Thescheme provides treatment for eligible beneficiaries as private patients in publichospitals, with a safety net system employing contracted and non-contracted privatehospitals.
Unpublished ABS data indicate that, in 1996–97, 275 private hospitals providedservices to DVA patients, compared with 193 in 1991–92. There were around135 000 DVA patient separations in private hospitals in 1997–98 (see appendix A)— a figure expected to increase in the future due, amongst other things, to theageing of war veterans.
PRIVATE HOSPITALMARKETS
23
Compensable patients
Compensable patients are those whose hospital treatment is payed for by some formof compensation scheme. Most suffer from workplace or motor vehicle injuries andare covered by workers’ compensation and third party motor insurance,respectively. The number of compensable patients treated in private hospitalsincreased by nearly 30 per cent between 1991–92 and 1997–98 to around 73 000(see appendix A).
Self–paying patients
As noted above, self-paying patients account for about 9 per cent of private hospitalseparations in Australia.
However, it is important to recognise that self-paying patients provide less than halfof the revenue private hospitals receive directly from patients. As set out inappendix A, copayments made by insured patients account for the bulk of paymentsby individuals to private hospitals.
Eligible public patients
A small number of public patients currently receive treatment in private hospitalsunder contract arrangements with state governments. Unpublished ABS dataindicate that, in 1996–97, there were around 40 000 such separations in more than60 private hospitals, compared to around 16 000 separations in 1991–92.
Doctors
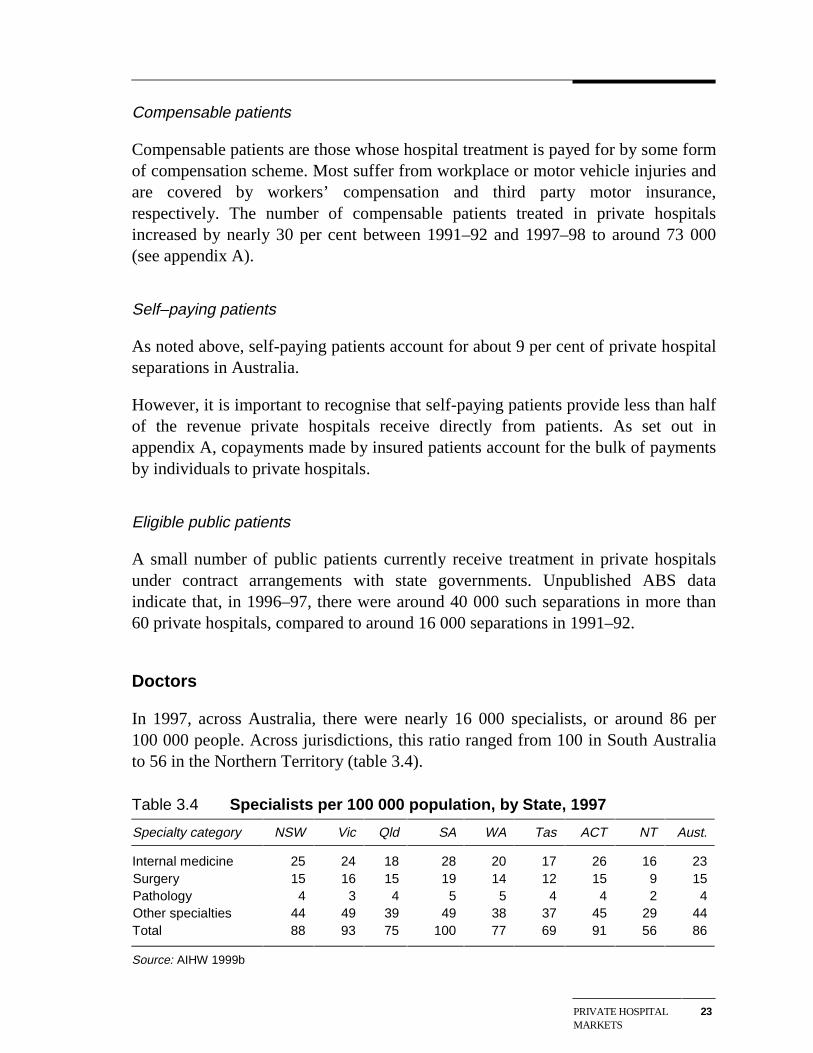
In 1997, across Australia, there were nearly 16 000 specialists, or around 86 per100 000 people. Across jurisdictions, this ratio ranged from 100 in South Australiato 56 in the Northern Territory (table 3.4).
Table 3.4 Specialists per 100 000 population, by State, 1997
Specialty category NSW Vic Qld SA WA Tas ACT NT Aust.
Internal medicine 25 24 18 28 20 17 26 16 23 Surgery 15 16 15 19 14 12 15 9 15 Pathology 4 3 4 5 5 4 4 2 4 Other specialties 44 49 39 49 38 37 45 29 44 Total 88 93 75 100 77 69 91 56 86
Source: AIHW 1999b
24 PRIVATE HOSPITALSIN AUSTRALIA
Categorisation of specialists and levels of availability are sensitive to the taxonomyused. However, in broad terms, most specialists work in ‘internal medicine’ and inthe ‘other specialties’ category which includes specialties such as anaesthesia,dermatology, ophthalmology, obstetrics, diagnostic radiology and psychiatry. In1997, less than one-fifth worked in the surgery field.
The supply of specialists is controlled by medical colleges having regard to suchthings as ‘optimal’ specialist to population ratios and the availability of teachingpositions in hospitals. Specialist to population ratios vary widely across individualspecialties — for example, in 1997, there were 5.5 general surgeons, 3.7orthopaedic surgeons, 0.5 cardiothoracic surgeons and 10.0 anaesthetists per100 000 population respectively (Commission estimates based on AIHW 1999b).As noted in chapter 9, there has been ongoing debate about the adequacy of thesupply of some specialities.
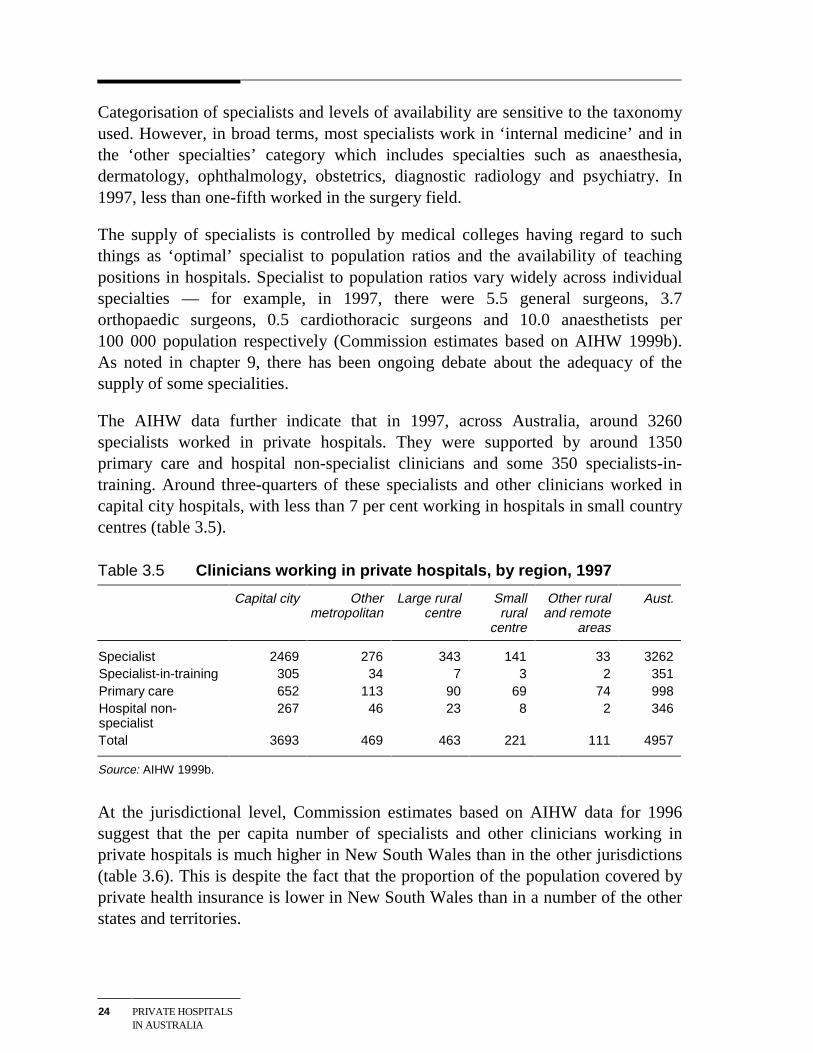
The AIHW data further indicate that in 1997, across Australia, around 3260specialists worked in private hospitals. They were supported by around 1350primary care and hospital non-specialist clinicians and some 350 specialists-in-training. Around three-quarters of these specialists and other clinicians worked incapital city hospitals, with less than 7 per cent working in hospitals in small countrycentres (table 3.5).
Table 3.5 Clinicians working in private hospitals, by region, 1997
Capital city Othermetropolitan
Large ruralcentre
Smallrural
centre
Other ruraland remote
areas
Aust.
Specialist 2469 276 343 141 33 3262 Specialist-in-training 305 34 7 3 2 351 Primary care 652 113 90 69 74 998 Hospital non-specialist
267 46 23 8 2 346
Total 3693 469 463 221 111 4957
Source: AIHW 1999b.
At the jurisdictional level, Commission estimates based on AIHW data for 1996suggest that the per capita number of specialists and other clinicians working inprivate hospitals is much higher in New South Wales than in the other jurisdictions(table 3.6). This is despite the fact that the proportion of the population covered byprivate health insurance is lower in New South Wales than in a number of the otherstates and territories.
PRIVATE HOSPITALMARKETS
25
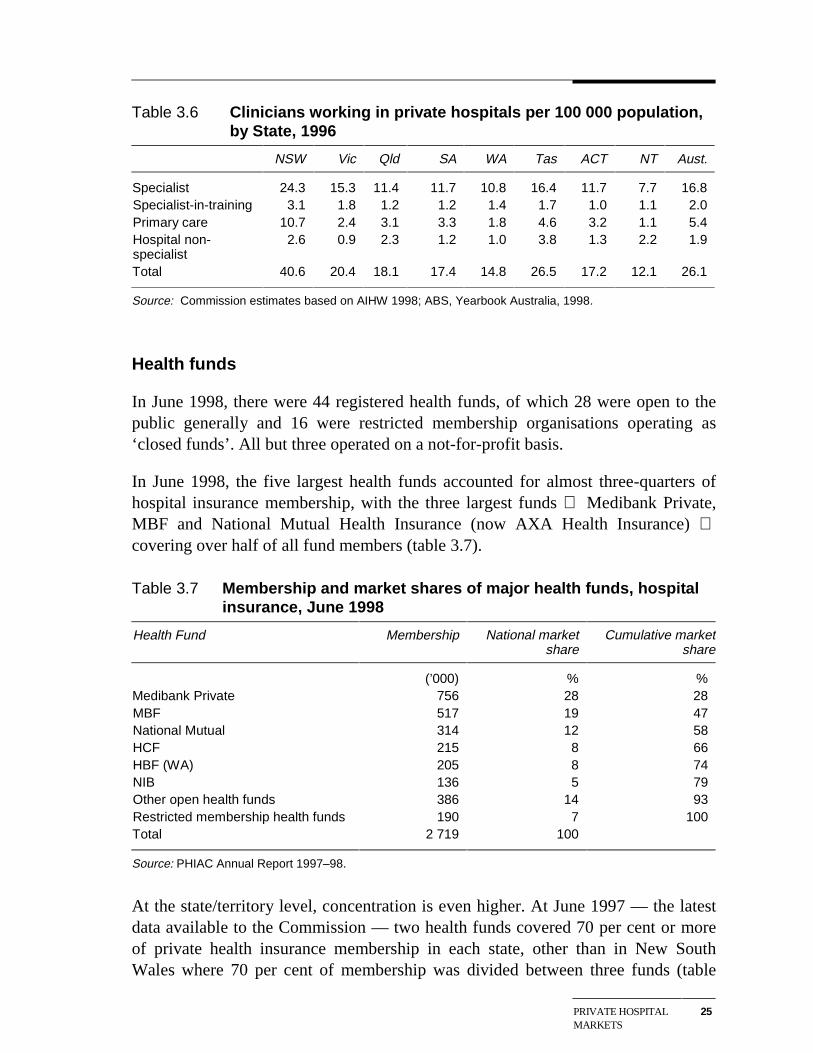
Table 3.6 Clinicians working in private hospitals per 100 000 population,by State, 1996
NSW Vic Qld SA WA Tas ACT NT Aust.
Specialist 24.3 15.3 11.4 11.7 10.8 16.4 11.7 7.7 16.8 Specialist-in-training 3.1 1.8 1.2 1.2 1.4 1.7 1.0 1.1 2.0 Primary care 10.7 2.4 3.1 3.3 1.8 4.6 3.2 1.1 5.4 Hospital non-specialist
2.6 0.9 2.3 1.2 1.0 3.8 1.3 2.2 1.9
Total 40.6 20.4 18.1 17.4 14.8 26.5 17.2 12.1 26.1
Source: Commission estimates based on AIHW 1998; ABS, Yearbook Australia, 1998.
Health funds
In June 1998, there were 44 registered health funds, of which 28 were open to thepublic generally and 16 were restricted membership organisations operating as‘closed funds’. All but three operated on a not-for-profit basis.
In June 1998, the five largest health funds accounted for almost three-quarters ofhospital insurance membership, with the three largest funds Medibank Private,MBF and National Mutual Health Insurance (now AXA Health Insurance) covering over half of all fund members (table 3.7).
Table 3.7 Membership and market shares of major health funds, hospitalinsurance, June 1998
Health Fund Membership National marketshare
Cumulative marketshare
(’000) % % Medibank Private 756 28 28 MBF 517 19 47 National Mutual 314 12 58 HCF 215 8 66 HBF (WA) 205 8 74 NIB 136 5 79 Other open health funds 386 14 93 Restricted membership health funds 190 7 100 Total 2 719 100
Source: PHIAC Annual Report 1997–98.
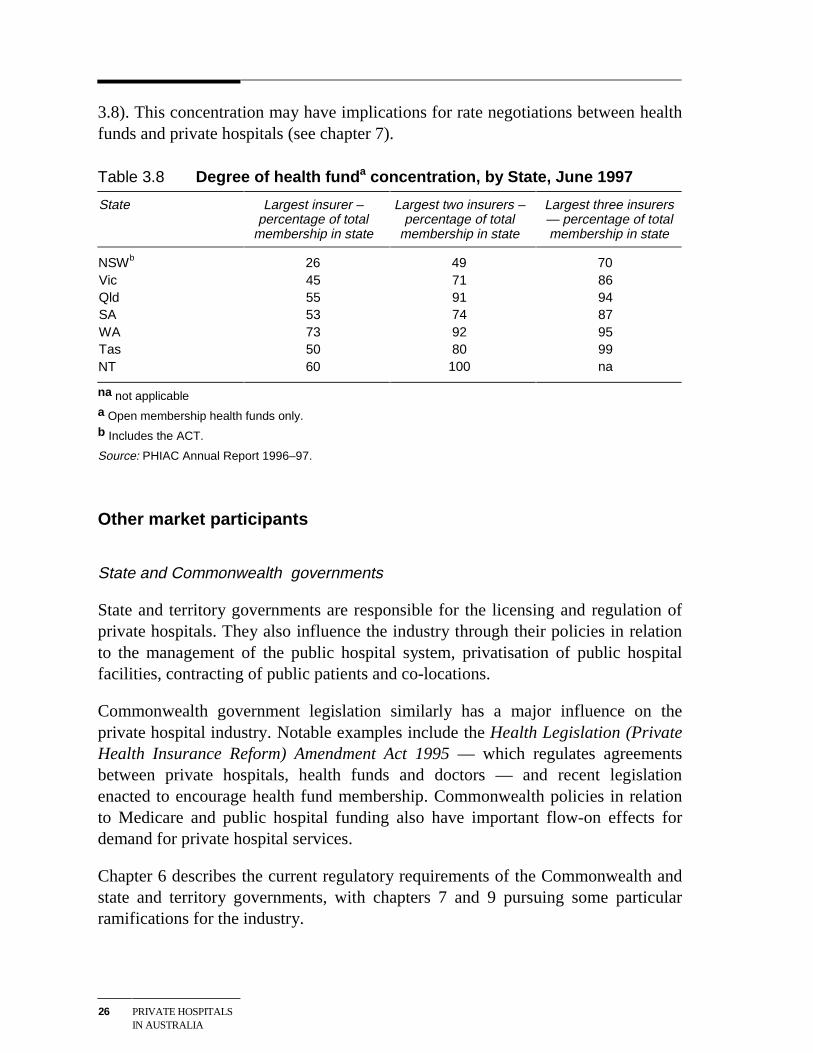
At the state/territory level, concentration is even higher. At June 1997 — the latestdata available to the Commission — two health funds covered 70 per cent or moreof private health insurance membership in each state, other than in New SouthWales where 70 per cent of membership was divided between three funds (table
26 PRIVATE HOSPITALSIN AUSTRALIA
3.8). This concentration may have implications for rate negotiations between healthfunds and private hospitals (see chapter 7).
Table 3.8 Degree of health funda concentration, by State, June 1997
State Largest insurer –percentage of total
membership in state
Largest two insurers –percentage of total
membership in state
Largest three insurers— percentage of totalmembership in state
NSWb 26 49 70 Vic 45 71 86 Qld 55 91 94 SA 53 74 87 WA 73 92 95 Tas 50 80 99 NT 60 100 na
na not applicable
a Open membership health funds only.
b Includes the ACT.
Source: PHIAC Annual Report 1996–97.
Other market participants
State and Commonwealth governments
State and territory governments are responsible for the licensing and regulation ofprivate hospitals. They also influence the industry through their policies in relationto the management of the public hospital system, privatisation of public hospitalfacilities, contracting of public patients and co-locations.
Commonwealth government legislation similarly has a major influence on theprivate hospital industry. Notable examples include the Health Legislation (PrivateHealth Insurance Reform) Amendment Act 1995 — which regulates agreementsbetween private hospitals, health funds and doctors — and recent legislationenacted to encourage health fund membership. Commonwealth policies in relationto Medicare and public hospital funding also have important flow-on effects fordemand for private hospital services.
Chapter 6 describes the current regulatory requirements of the Commonwealth andstate and territory governments, with chapters 7 and 9 pursuing some particularramifications for the industry.
PRIVATE HOSPITALMARKETS
27
Quality accreditation agencies
Private hospitals seek accreditation as a quality assurance measure for patients andclinicians. There are currently two competing accreditation schemes in Australia runby:
• the Australian Council on Healthcare Standards; and
• the International Standards Organisation.
The role of accreditation agencies and their impact on the private hospital industryare discussed in chapter 5.
Consumer advocates
While doctors and health funds often act as agents for private hospital patients,there are several consumer groups that represent patients in a general advocacysense and in helping to resolve particular problems. These include the AustralianConsumers’ Association, the Consumer Health Forum and the Council on theAgeing — ‘an independent consumer organisation representing the interests of allolder people’.
FINANCIALPERFORMANCE
29
4 Financial performance
The financial performance of the private hospital industry has implications for all ofthe parties involved in the delivery and consumption of private hospital services:
• Satisfactory financial performance is obviously a pre-requisite for privatehospitals to survive and prosper.
• The fortunes of hospitals will, in turn, have implications for the quality andrange of services available to patients (see chapter 5) and for the access ofdoctors to private hospital facilities.
• There will also be implications for the capacity of health insurance funds to offerattractive private hospital cover to their members (see chapter 7).
This chapter looks at the two broad drivers of profitability in the sector, namelyrevenues (section 4.1) and costs (section 4.2), before concluding with an analysis ofprofitability (section 4.3).
Much of the data in this and subsequent chapters is presented in both ‘current’ and1991–92 prices. The Consumer Price Index was used as the deflator in all 1991–92price equivalent calculations.
4.1 Private hospital revenues
Overall picture
Private hospital revenue consists principally of patient revenue (around 92 per centof total revenue Australia-wide in 1997–98), with recoveries (5 per cent) and otheritems (for example, investment income and bequests) making up the balance.Around 70 per cent of total revenue comes from health funds. Other sources ofrevenue include payments by patients (self-funded treatment and copayments),funding by the Commonwealth for Department of Veterans Affairs (DVA) patients,and payments made by governments and private insurers for compensable patients(see appendix A).
During the 1990s, private hospital revenues have grown strongly:
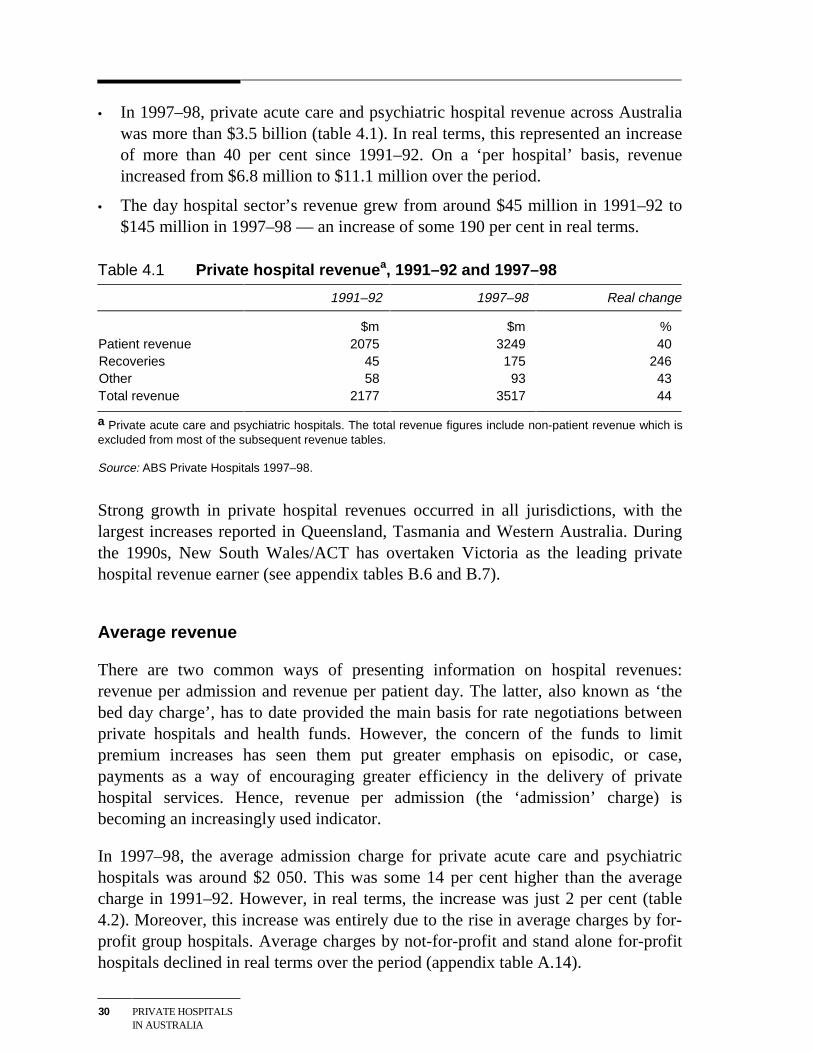
30 PRIVATE HOSPITALSIN AUSTRALIA
• In 1997–98, private acute care and psychiatric hospital revenue across Australiawas more than $3.5 billion (table 4.1). In real terms, this represented an increaseof more than 40 per cent since 1991–92. On a ‘per hospital’ basis, revenueincreased from $6.8 million to $11.1 million over the period.
• The day hospital sector’s revenue grew from around $45 million in 1991–92 to$145 million in 1997–98 — an increase of some 190 per cent in real terms.
Table 4.1 Private hospital revenuea, 1991–92 and 1997–98
1991–92 1997–98 Real change
$m $m %Patient revenue 2075 3249 40Recoveries 45 175 246Other 58 93 43Total revenue 2177 3517 44
a Private acute care and psychiatric hospitals. The total revenue figures include non-patient revenue which isexcluded from most of the subsequent revenue tables.
Source: ABS Private Hospitals 1997–98.
Strong growth in private hospital revenues occurred in all jurisdictions, with thelargest increases reported in Queensland, Tasmania and Western Australia. Duringthe 1990s, New South Wales/ACT has overtaken Victoria as the leading privatehospital revenue earner (see appendix tables B.6 and B.7).
Average revenue
There are two common ways of presenting information on hospital revenues:revenue per admission and revenue per patient day. The latter, also known as ‘thebed day charge’, has to date provided the main basis for rate negotiations betweenprivate hospitals and health funds. However, the concern of the funds to limitpremium increases has seen them put greater emphasis on episodic, or case,payments as a way of encouraging greater efficiency in the delivery of privatehospital services. Hence, revenue per admission (the ‘admission’ charge) isbecoming an increasingly used indicator.
In 1997–98, the average admission charge for private acute care and psychiatrichospitals was around $2 050. This was some 14 per cent higher than the averagecharge in 1991–92. However, in real terms, the increase was just 2 per cent (table4.2). Moreover, this increase was entirely due to the rise in average charges by for-profit group hospitals. Average charges by not-for-profit and stand alone for-profithospitals declined in real terms over the period (appendix table A.14).
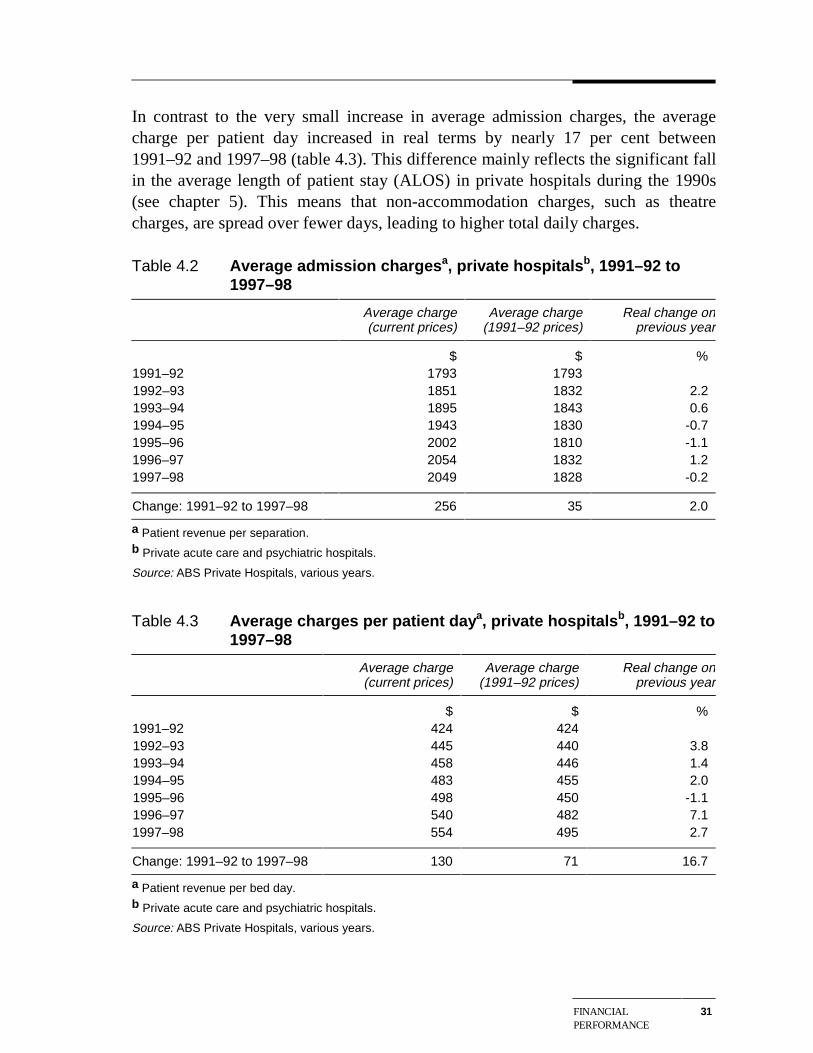
FINANCIALPERFORMANCE
31
In contrast to the very small increase in average admission charges, the averagecharge per patient day increased in real terms by nearly 17 per cent between1991–92 and 1997–98 (table 4.3). This difference mainly reflects the significant fallin the average length of patient stay (ALOS) in private hospitals during the 1990s(see chapter 5). This means that non-accommodation charges, such as theatrecharges, are spread over fewer days, leading to higher total daily charges.
Table 4.2 Average admission chargesa, private hospitalsb, 1991–92 to1997–98
Average charge(current prices)
Average charge(1991–92 prices)
Real change onprevious year
$ $ %1991–92 1793 17931992–93 1851 1832 2.21993–94 1895 1843 0.61994–95 1943 1830 -0.71995–96 2002 1810 -1.11996–97 2054 1832 1.21997–98 2049 1828 -0.2
Change: 1991–92 to 1997–98 256 35 2.0
a Patient revenue per separation.b Private acute care and psychiatric hospitals.
Source: ABS Private Hospitals, various years.
Table 4.3 Average charges per patient daya, private hospitalsb, 1991–92 to1997–98
Average charge(current prices)
Average charge(1991–92 prices)
Real change onprevious year
$ $ %1991–92 424 4241992–93 445 440 3.81993–94 458 446 1.41994–95 483 455 2.01995–96 498 450 -1.11996–97 540 482 7.11997–98 554 495 2.7
Change: 1991–92 to 1997–98 130 71 16.7
a Patient revenue per bed day.b Private acute care and psychiatric hospitals.
Source: ABS Private Hospitals, various years.
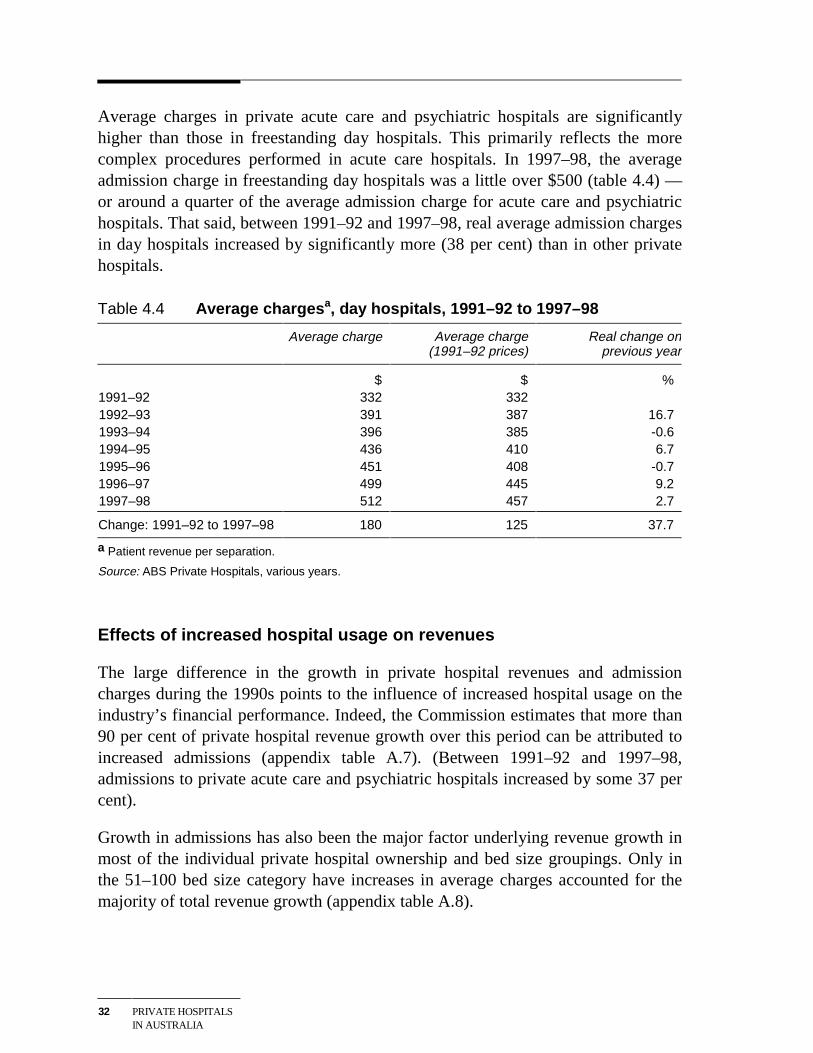
32 PRIVATE HOSPITALSIN AUSTRALIA
Average charges in private acute care and psychiatric hospitals are significantlyhigher than those in freestanding day hospitals. This primarily reflects the morecomplex procedures performed in acute care hospitals. In 1997–98, the averageadmission charge in freestanding day hospitals was a little over $500 (table 4.4) —or around a quarter of the average admission charge for acute care and psychiatrichospitals. That said, between 1991–92 and 1997–98, real average admission chargesin day hospitals increased by significantly more (38 per cent) than in other privatehospitals.
Table 4.4 Average chargesa, day hospitals, 1991–92 to 1997–98
Average charge Average charge(1991–92 prices)
Real change onprevious year
$ $ %1991–92 332 3321992–93 391 387 16.71993–94 396 385 -0.61994–95 436 410 6.71995–96 451 408 -0.71996–97 499 445 9.21997–98 512 457 2.7
Change: 1991–92 to 1997–98 180 125 37.7
a Patient revenue per separation.
Source: ABS Private Hospitals, various years.
Effects of increased hospital usage on revenues
The large difference in the growth in private hospital revenues and admissioncharges during the 1990s points to the influence of increased hospital usage on theindustry’s financial performance. Indeed, the Commission estimates that more than90 per cent of private hospital revenue growth over this period can be attributed toincreased admissions (appendix table A.7). (Between 1991–92 and 1997–98,admissions to private acute care and psychiatric hospitals increased by some 37 percent).
Growth in admissions has also been the major factor underlying revenue growth inmost of the individual private hospital ownership and bed size groupings. Only inthe 51–100 bed size category have increases in average charges accounted for themajority of total revenue growth (appendix table A.8).
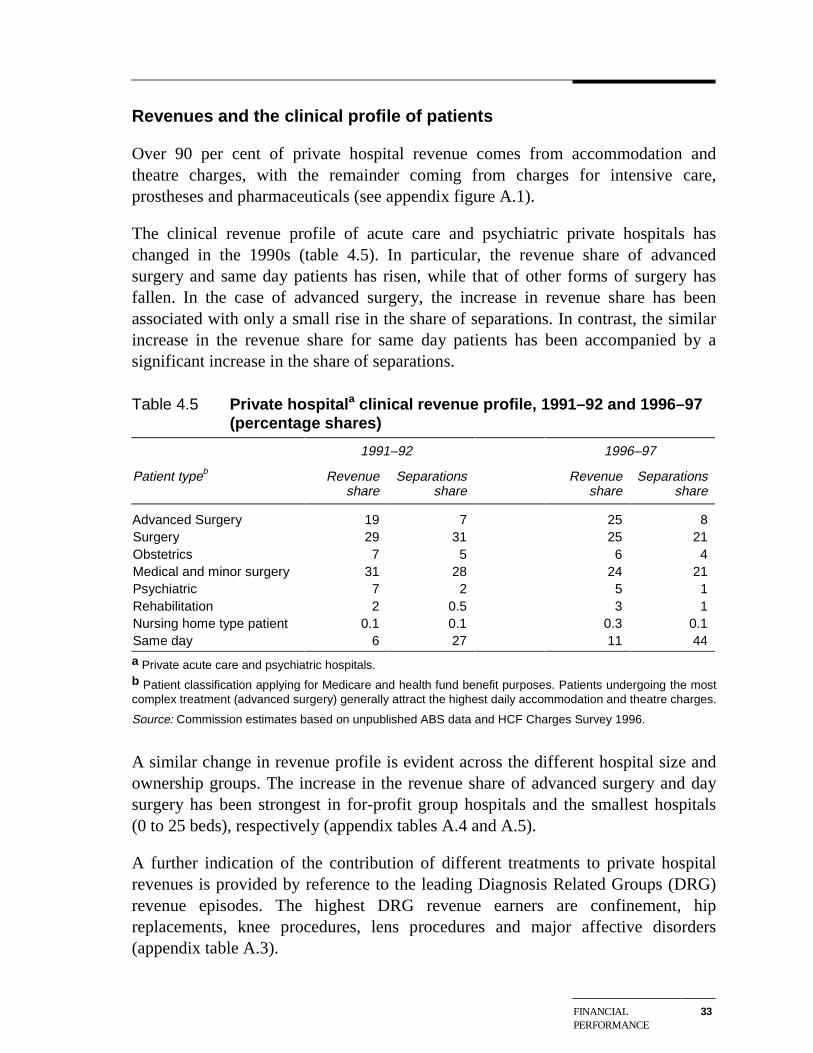
FINANCIALPERFORMANCE
33
Revenues and the clinical profile of patients
Over 90 per cent of private hospital revenue comes from accommodation andtheatre charges, with the remainder coming from charges for intensive care,prostheses and pharmaceuticals (see appendix figure A.1).
The clinical revenue profile of acute care and psychiatric private hospitals haschanged in the 1990s (table 4.5). In particular, the revenue share of advancedsurgery and same day patients has risen, while that of other forms of surgery hasfallen. In the case of advanced surgery, the increase in revenue share has beenassociated with only a small rise in the share of separations. In contrast, the similarincrease in the revenue share for same day patients has been accompanied by asignificant increase in the share of separations.
Table 4.5 Private hospitala clinical revenue profile, 1991–92 and 1996–97(percentage shares)
1991–92 1996–97
Patient typeb Revenueshare
Separationsshare
Revenueshare
Separationsshare
Advanced Surgery 19 7 25 8Surgery 29 31 25 21Obstetrics 7 5 6 4Medical and minor surgery 31 28 24 21Psychiatric 7 2 5 1Rehabilitation 2 0.5 3 1Nursing home type patient 0.1 0.1 0.3 0.1Same day 6 27 11 44
a Private acute care and psychiatric hospitals.b Patient classification applying for Medicare and health fund benefit purposes. Patients undergoing the mostcomplex treatment (advanced surgery) generally attract the highest daily accommodation and theatre charges.
Source: Commission estimates based on unpublished ABS data and HCF Charges Survey 1996.
A similar change in revenue profile is evident across the different hospital size andownership groups. The increase in the revenue share of advanced surgery and daysurgery has been strongest in for-profit group hospitals and the smallest hospitals(0 to 25 beds), respectively (appendix tables A.4 and A.5).
A further indication of the contribution of different treatments to private hospitalrevenues is provided by reference to the leading Diagnosis Related Groups (DRG)revenue episodes. The highest DRG revenue earners are confinement, hipreplacements, knee procedures, lens procedures and major affective disorders(appendix table A.3).
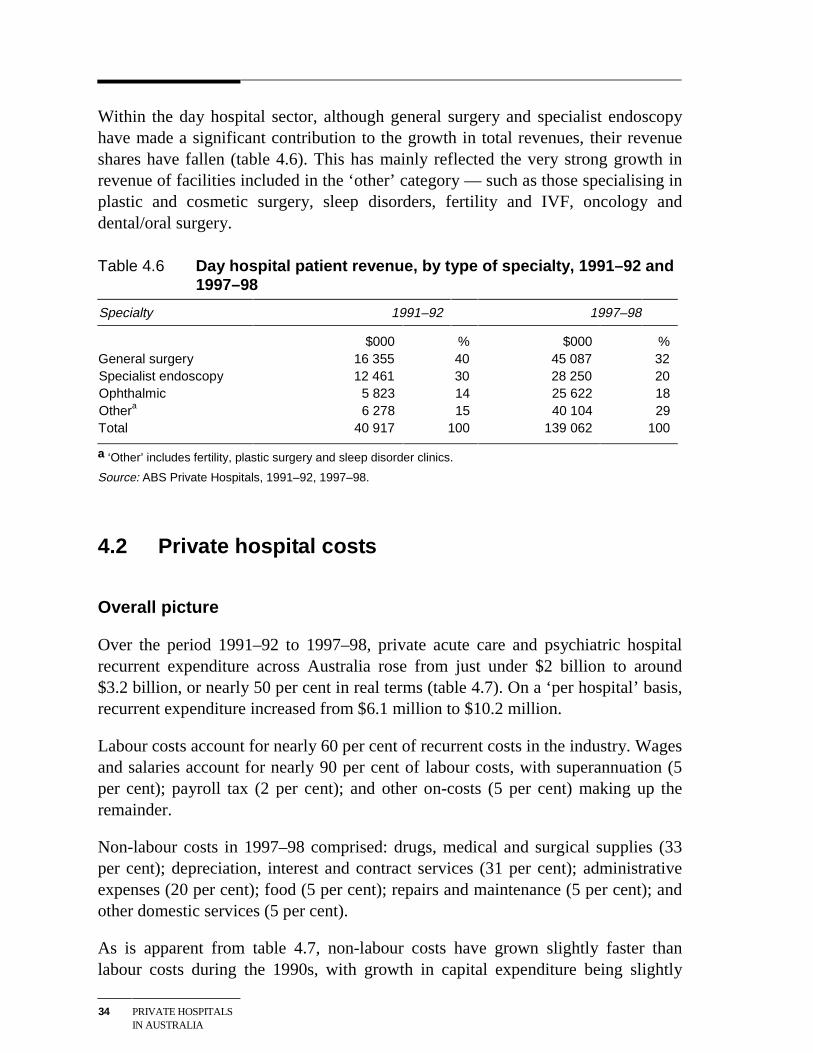
34 PRIVATE HOSPITALSIN AUSTRALIA
Within the day hospital sector, although general surgery and specialist endoscopyhave made a significant contribution to the growth in total revenues, their revenueshares have fallen (table 4.6). This has mainly reflected the very strong growth inrevenue of facilities included in the ‘other’ category — such as those specialising inplastic and cosmetic surgery, sleep disorders, fertility and IVF, oncology anddental/oral surgery.
Table 4.6 Day hospital patient revenue, by type of specialty, 1991–92 and1997–98
Specialty 1991–92 1997–98
$000 % $000 %General surgery 16 355 40 45 087 32Specialist endoscopy 12 461 30 28 250 20Ophthalmic 5 823 14 25 622 18Othera 6 278 15 40 104 29Total 40 917 100 139 062 100
a ‘Other’ includes fertility, plastic surgery and sleep disorder clinics.
Source: ABS Private Hospitals, 1991–92, 1997–98.
4.2 Private hospital costs
Overall picture
Over the period 1991–92 to 1997–98, private acute care and psychiatric hospitalrecurrent expenditure across Australia rose from just under $2 billion to around$3.2 billion, or nearly 50 per cent in real terms (table 4.7). On a ‘per hospital’ basis,recurrent expenditure increased from $6.1 million to $10.2 million.
Labour costs account for nearly 60 per cent of recurrent costs in the industry. Wagesand salaries account for nearly 90 per cent of labour costs, with superannuation (5per cent); payroll tax (2 per cent); and other on-costs (5 per cent) making up theremainder.
Non-labour costs in 1997–98 comprised: drugs, medical and surgical supplies (33per cent); depreciation, interest and contract services (31 per cent); administrativeexpenses (20 per cent); food (5 per cent); repairs and maintenance (5 per cent); andother domestic services (5 per cent).
As is apparent from table 4.7, non-labour costs have grown slightly faster thanlabour costs during the 1990s, with growth in capital expenditure being slightly
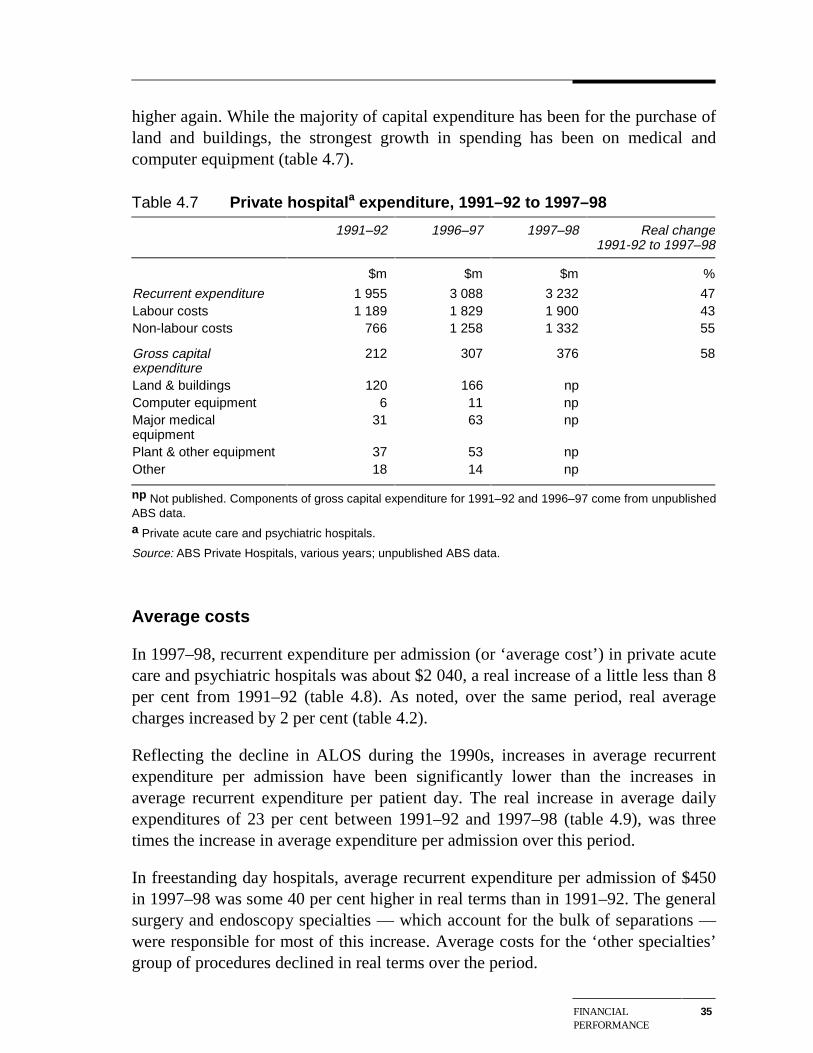
FINANCIALPERFORMANCE
35
higher again. While the majority of capital expenditure has been for the purchase ofland and buildings, the strongest growth in spending has been on medical andcomputer equipment (table 4.7).
Table 4.7 Private hospitala expenditure, 1991–92 to 1997–98
1991–92 1996–97 1997–98 Real change1991-92 to 1997–98
$m $m $m %
Recurrent expenditure 1 955 3 088 3 232 47Labour costs 1 189 1 829 1 900 43Non-labour costs 766 1 258 1 332 55
Gross capitalexpenditure
212 307 376 58
Land & buildings 120 166 npComputer equipment 6 11 npMajor medicalequipment
31 63 np
Plant & other equipment 37 53 npOther 18 14 np
np Not published. Components of gross capital expenditure for 1991–92 and 1996–97 come from unpublishedABS data.a Private acute care and psychiatric hospitals.
Source: ABS Private Hospitals, various years; unpublished ABS data.
Average costs
In 1997–98, recurrent expenditure per admission (or ‘average cost’) in private acutecare and psychiatric hospitals was about $2 040, a real increase of a little less than 8per cent from 1991–92 (table 4.8). As noted, over the same period, real averagecharges increased by 2 per cent (table 4.2).
Reflecting the decline in ALOS during the 1990s, increases in average recurrentexpenditure per admission have been significantly lower than the increases inaverage recurrent expenditure per patient day. The real increase in average dailyexpenditures of 23 per cent between 1991–92 and 1997–98 (table 4.9), was threetimes the increase in average expenditure per admission over this period.
In freestanding day hospitals, average recurrent expenditure per admission of $450in 1997–98 was some 40 per cent higher in real terms than in 1991–92. The generalsurgery and endoscopy specialties — which account for the bulk of separations —were responsible for most of this increase. Average costs for the ‘other specialties’group of procedures declined in real terms over the period.
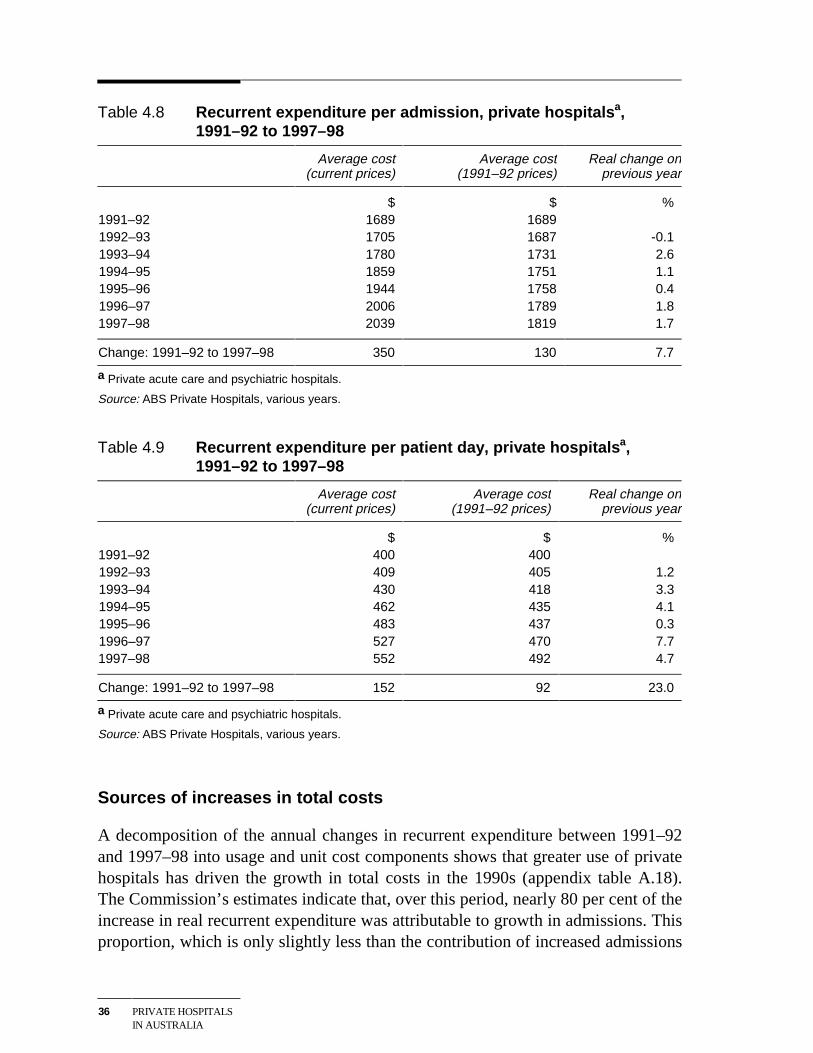
36 PRIVATE HOSPITALSIN AUSTRALIA
Table 4.8 Recurrent expenditure per admission, private hospitalsa,1991–92 to 1997–98
Average cost(current prices)
Average cost(1991–92 prices)
Real change onprevious year
$ $ %1991–92 1689 16891992–93 1705 1687 -0.11993–94 1780 1731 2.61994–95 1859 1751 1.11995–96 1944 1758 0.41996–97 2006 1789 1.81997–98 2039 1819 1.7
Change: 1991–92 to 1997–98 350 130 7.7
a Private acute care and psychiatric hospitals.
Source: ABS Private Hospitals, various years.
Table 4.9 Recurrent expenditure per patient day, private hospitalsa,1991–92 to 1997–98
Average cost(current prices)
Average cost(1991–92 prices)
Real change onprevious year
$ $ %1991–92 400 4001992–93 409 405 1.21993–94 430 418 3.31994–95 462 435 4.11995–96 483 437 0.31996–97 527 470 7.71997–98 552 492 4.7
Change: 1991–92 to 1997–98 152 92 23.0
a Private acute care and psychiatric hospitals.
Source: ABS Private Hospitals, various years.
Sources of increases in total costs
A decomposition of the annual changes in recurrent expenditure between 1991–92and 1997–98 into usage and unit cost components shows that greater use of privatehospitals has driven the growth in total costs in the 1990s (appendix table A.18).The Commission’s estimates indicate that, over this period, nearly 80 per cent of theincrease in real recurrent expenditure was attributable to growth in admissions. Thisproportion, which is only slightly less than the contribution of increased admissions
FINANCIALPERFORMANCE
37
to growth in private hospital revenues (93 per cent), underscores the impact ofdemand growth on recent financial outcomes in the industry.
A similar decomposition according to hospital ownership and size shows that, in allbar the 51–100 bed size category, increased usage has been a more importantcontributor to total cost growth than increases in average costs per admission(appendix table A.19). Indeed, average costs in the for-profit independent and othernot-for-profit ownership groups, and the 26–50 and over 200 bed size groups fellbetween 1991–92 and 1996–97.
Sources of increase in unit costs
Across all private acute care and psychiatric hospitals, increases in non-labour costshave accounted for some two-thirds of the increase in average real costs peradmission during the 1990s (appendix table A.20).
However, the experience varies considerably across individual hospital size andownership groups. For example, real labour costs per separation inreligious/charitable hospitals declined between 1991–92 and 1996–97, meaning thathigher non-labour costs (or outsourced labour costs) accounted for all of theincrease in real unit costs over this period. In contrast, in for-profit group hospitals,higher unit labour costs accounted for nearly two-thirds of the increase in realaverage costs per admission.
Across the industry as a whole, the fastest growing component of labour costs hasbeen superannuation (up 81 per cent per separation in real terms over the period1991–92 to 1996–97). In contrast, real wage and salary costs per separationincreased in real terms by only about 1 per cent over this period. The fastestgrowing components of non-labour costs have been contract services and medicaland surgical supplies (up 60 and 43 per cent per separation in real terms,respectively, between 1991–92 and 1996–97). (See appendix tables B. 16–19, 34–37).
Changes in complexity
The Industry Commission (1997) noted that part of the increase in private hospitalcosts reflects the increasing complexity of procedures undertaken. This hasnecessitated greater use of high technology equipment and more highly qualified(and better paid) nursing staff, as well as higher spending on drugs, medical andsurgical supplies.
38 PRIVATE HOSPITALSIN AUSTRALIA
The impacts of greater casemix complexity on unit treatment costs are likely to bemost significant for that group of patients requiring overnight or more extendedhospital stays. Based on DHFS casemix data, the Commission estimates that, in1996–97, the average overnight patient in a private acute care hospital was 17 percent more costly to treat in real terms than in 1993–94. This was nearly three timesthe increase of 6 per cent in the average real unit cost of treating all patients(including same day patients) over the same period.
4.3 Profitability
A firm’s or sector’s profits can be expressed in a number of ways, including as apercentage of turnover, or as a percentage of the asset base. For comparisons ofprofitability across sectors, the choice of methodology can be critical, with rate ofreturn on asset measures usually being preferred. However, for comparisons ofprofitability within a sector over time, more flexibility is possible, with the nature ofthe available data being an important consideration in the choice of methodology.
In this report, the Commission’s has reported four measures of profitability in theprivate hospital industry — dollar margins on a per day and per separation basis,revenue minus operating costs as a percentage of revenue, and revenue minus totalcosts as a percentage of revenue. The first three should be regarded as only verygeneral indicators of changes in profitability, as they include no capital costcomponent. Thus, they do not distinguish the impacts of changes in operatingefficiency on profitability from, say, the impacts of investment in new revenuegenerating equipment. In contrast, the last measure incorporates interest costs anddepreciation in the cost base and is therefore likely to provide a better indicator ofmovements in the industry’s profitability over time.
Private acute care and psychiatric hospitals
Reflecting the larger increases in patient costs than in patient revenues, theprofitability of private acute care and psychiatric hospitals has declined during the1990s. Specifically, for the industry as a whole, the ‘net operating margin’ (totalrevenue minus total recurrent expenditure, divided by total revenue) declined from10.2 per cent in 1991–92 to 8.1 per cent in 1997–98 (table 4.10). Indeed, in 1997–98, patient revenues only marginally exceeded expenditures (see tables 4.1 and 4.7).Hence, the positive operating margin was largely attributable to recoveries and non-patient revenues such as investment income and bequests.
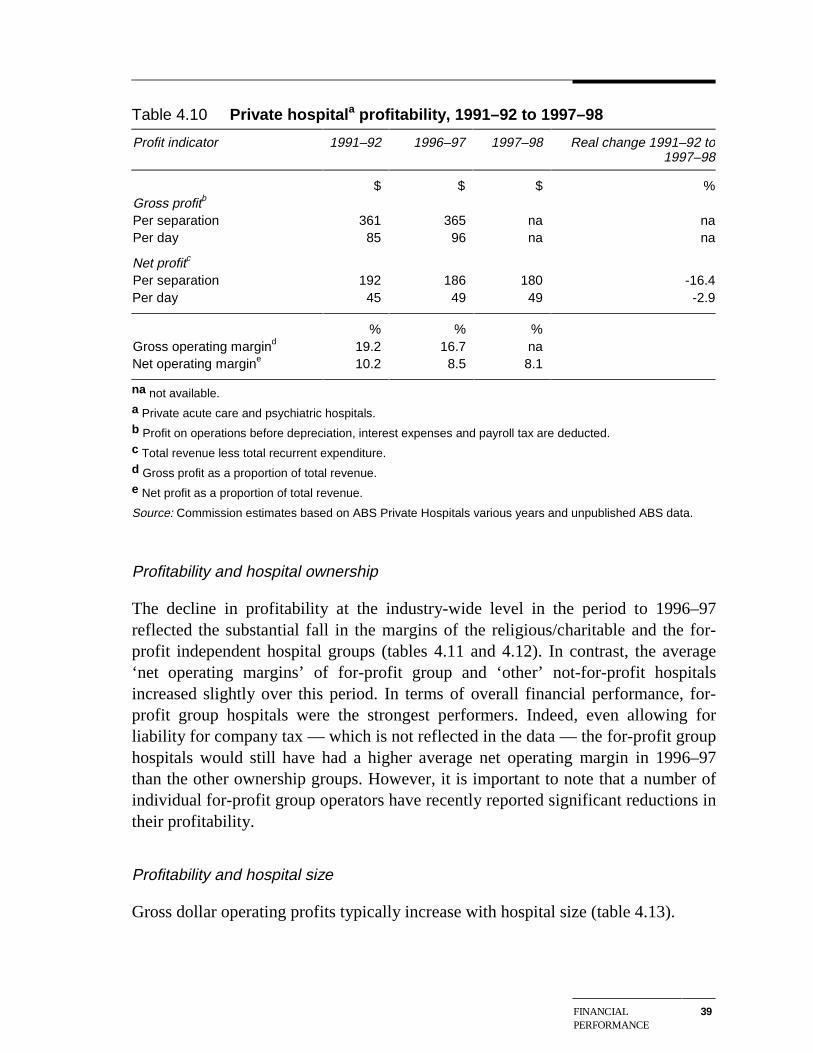
FINANCIALPERFORMANCE
39
Table 4.10 Private hospitala profitability, 1991–92 to 1997–98
Profit indicator 1991–92 1996–97 1997–98 Real change 1991–92 to1997–98
$ $ $ %Gross profitb
Per separation 361 365 na naPer day 85 96 na na
Net profitc
Per separation 192 186 180 -16.4Per day 45 49 49 -2.9
% % %Gross operating margind 19.2 16.7 naNet operating margine 10.2 8.5 8.1
na not available.a Private acute care and psychiatric hospitals.b Profit on operations before depreciation, interest expenses and payroll tax are deducted.c Total revenue less total recurrent expenditure.d Gross profit as a proportion of total revenue.e Net profit as a proportion of total revenue.
Source: Commission estimates based on ABS Private Hospitals various years and unpublished ABS data.
Profitability and hospital ownership
The decline in profitability at the industry-wide level in the period to 1996–97reflected the substantial fall in the margins of the religious/charitable and the for-profit independent hospital groups (tables 4.11 and 4.12). In contrast, the average‘net operating margins’ of for-profit group and ‘other’ not-for-profit hospitalsincreased slightly over this period. In terms of overall financial performance, for-profit group hospitals were the strongest performers. Indeed, even allowing forliability for company tax — which is not reflected in the data — the for-profit grouphospitals would still have had a higher average net operating margin in 1996–97than the other ownership groups. However, it is important to note that a number ofindividual for-profit group operators have recently reported significant reductions intheir profitability.
Profitability and hospital size
Gross dollar operating profits typically increase with hospital size (table 4.13).
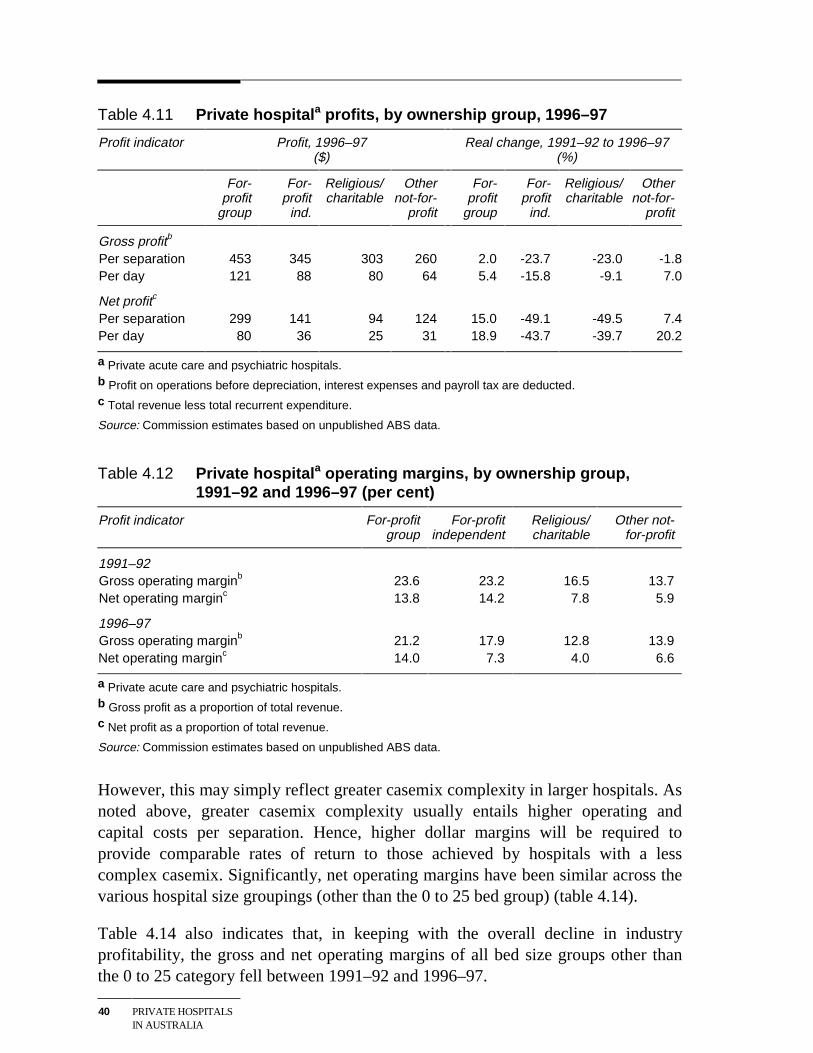
40 PRIVATE HOSPITALSIN AUSTRALIA
Table 4.11 Private hospitala profits, by ownership group, 1996–97
Profit indicator Profit, 1996–97($)
Real change, 1991–92 to 1996–97(%)
For-profit
group
For-profit
ind.
Religious/charitable
Othernot-for-
profit
For-profit
group
For-profit
ind.
Religious/charitable
Othernot-for-
profit
Gross profitb
Per separation 453 345 303 260 2.0 -23.7 -23.0 -1.8Per day 121 88 80 64 5.4 -15.8 -9.1 7.0
Net profitc
Per separation 299 141 94 124 15.0 -49.1 -49.5 7.4Per day 80 36 25 31 18.9 -43.7 -39.7 20.2
a Private acute care and psychiatric hospitals.b Profit on operations before depreciation, interest expenses and payroll tax are deducted.c Total revenue less total recurrent expenditure.
Source: Commission estimates based on unpublished ABS data.
Table 4.12 Private hospitala operating margins, by ownership group,1991–92 and 1996–97 (per cent)
Profit indicator For-profitgroup
For-profitindependent
Religious/charitable
Other not-for-profit
1991–92Gross operating marginb 23.6 23.2 16.5 13.7Net operating marginc 13.8 14.2 7.8 5.9
1996–97Gross operating marginb 21.2 17.9 12.8 13.9Net operating marginc 14.0 7.3 4.0 6.6
a Private acute care and psychiatric hospitals.b Gross profit as a proportion of total revenue.c Net profit as a proportion of total revenue.
Source: Commission estimates based on unpublished ABS data.
However, this may simply reflect greater casemix complexity in larger hospitals. Asnoted above, greater casemix complexity usually entails higher operating andcapital costs per separation. Hence, higher dollar margins will be required toprovide comparable rates of return to those achieved by hospitals with a lesscomplex casemix. Significantly, net operating margins have been similar across thevarious hospital size groupings (other than the 0 to 25 bed group) (table 4.14).
Table 4.14 also indicates that, in keeping with the overall decline in industryprofitability, the gross and net operating margins of all bed size groups other thanthe 0 to 25 category fell between 1991–92 and 1996–97.
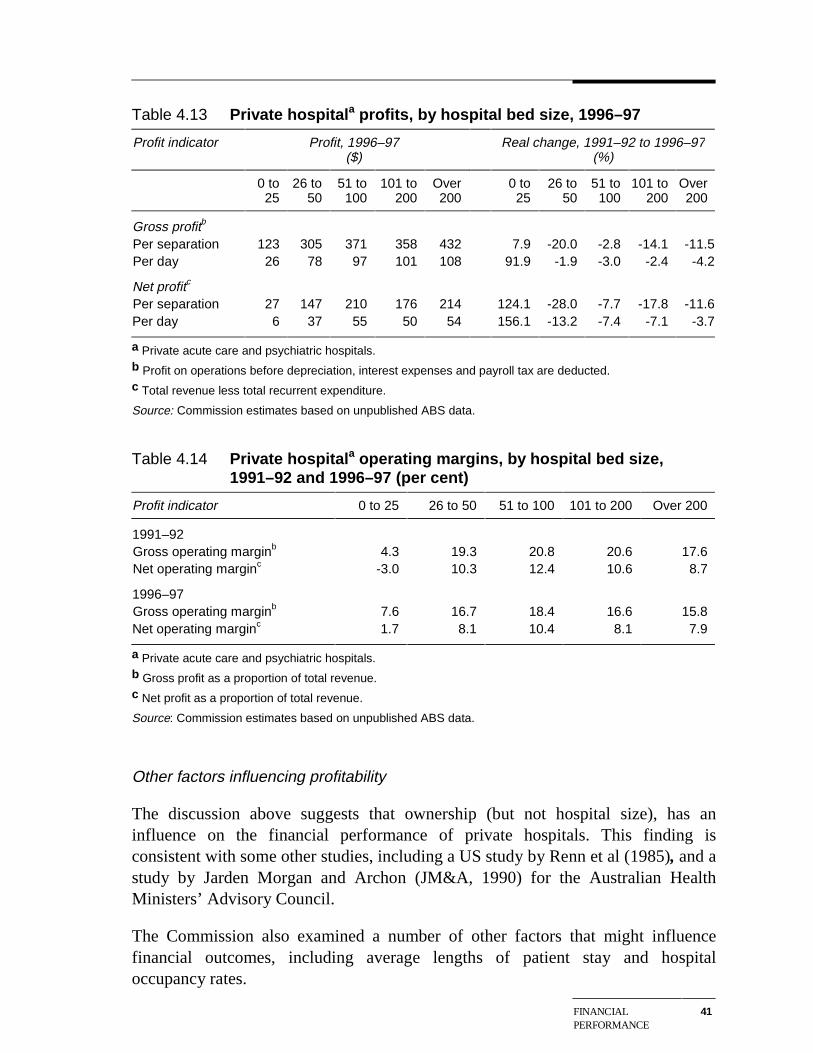
FINANCIALPERFORMANCE
41
Table 4.13 Private hospitala profits, by hospital bed size, 1996–97
Profit indicator Profit, 1996–97($)
Real change, 1991–92 to 1996–97(%)
0 to25
26 to50
51 to100
101 to200
Over200
0 to25
26 to50
51 to100
101 to200
Over200
Gross profitb
Per separation 123 305 371 358 432 7.9 -20.0 -2.8 -14.1 -11.5Per day 26 78 97 101 108 91.9 -1.9 -3.0 -2.4 -4.2
Net profitc
Per separation 27 147 210 176 214 124.1 -28.0 -7.7 -17.8 -11.6Per day 6 37 55 50 54 156.1 -13.2 -7.4 -7.1 -3.7
a Private acute care and psychiatric hospitals.b Profit on operations before depreciation, interest expenses and payroll tax are deducted.c Total revenue less total recurrent expenditure.
Source: Commission estimates based on unpublished ABS data.
Table 4.14 Private hospitala operating margins, by hospital bed size,1991–92 and 1996–97 (per cent)
Profit indicator 0 to 25 26 to 50 51 to 100 101 to 200 Over 200
1991–92Gross operating marginb 4.3 19.3 20.8 20.6 17.6Net operating marginc -3.0 10.3 12.4 10.6 8.7
1996–97Gross operating marginb 7.6 16.7 18.4 16.6 15.8Net operating marginc 1.7 8.1 10.4 8.1 7.9
a Private acute care and psychiatric hospitals.b Gross profit as a proportion of total revenue.c Net profit as a proportion of total revenue.
Source: Commission estimates based on unpublished ABS data.
Other factors influencing profitability
The discussion above suggests that ownership (but not hospital size), has aninfluence on the financial performance of private hospitals. This finding isconsistent with some other studies, including a US study by Renn et al (1985), and astudy by Jarden Morgan and Archon (JM&A, 1990) for the Australian HealthMinisters’ Advisory Council.
The Commission also examined a number of other factors that might influencefinancial outcomes, including average lengths of patient stay and hospitaloccupancy rates.
42 PRIVATE HOSPITALSIN AUSTRALIA
The unpublished ABS data reveal that, in 1996–97, private hospitals with anaverage patient stay of less than three days were more profitable than those withaverage patient stays of 3 to 6 days. However, the one-quarter of hospitals with anALOS of over 6 days recorded the highest average net operating margin (12.6 percent). This latter result is, in turn, consistent with the finding that hospitals treatinglonger stay non-surgical patients have been more profitable than those treatingmainly surgical patients (see below).
The unpublished ABS data further demonstrate an expected link betweenoccupancy rates and profitability. In 1996–97, private hospitals with an occupancyrate of over 75 per cent achieved the highest average net operating margin (10.2 percent), followed by hospitals with 65–74 per cent occupancy (8.2 per cent) and 50–64 per cent occupancy (5.8 per cent). Hospitals with occupancy rates of less than 50per cent had an average net operating margin of only 2.9 per cent.
A number of hospital owners consulted during this study also stressed theimportance for good financial outcomes of attracting advanced surgery patients.
However, analysis undertaken by the Commission using unpublished ABS dataindicates that in 1996–97:
• While surgical hospitals with the largest proportion of advanced surgery patientsrecorded the highest dollar profit margins for hospitals in that group, their netoperating margins were slightly below the industry average.
• The 109 private hospitals with no advanced surgery patients achieved an averagenet operating margin more than 50 per cent above the industry average.
Moreover, as noted above, net operating margins do not appear to increase withhospital size, despite the fact that larger hospitals tend to have greater averagecasemix complexity than smaller hospitals. Together, these data suggest that, acrossthe industry as a whole, charges and health fund benefits relative to treatment costsare not skewed in favour of advanced surgery patients.
Profitability of day hospitals
Reflecting the short stay nature of day hospital procedures, profits per separation aregenerally lower than in private acute care and psychiatric hospitals (table 4.15). Thenotable exception is day facilities specialising in ophthalmic procedures, whereprofits per separation are similar to the average for the acute care sector.
As in the acute care sector, average operating margins achieved by day hospitalsdeclined between 1991–92 and 1997–98 (table 4.16). That said, these margins
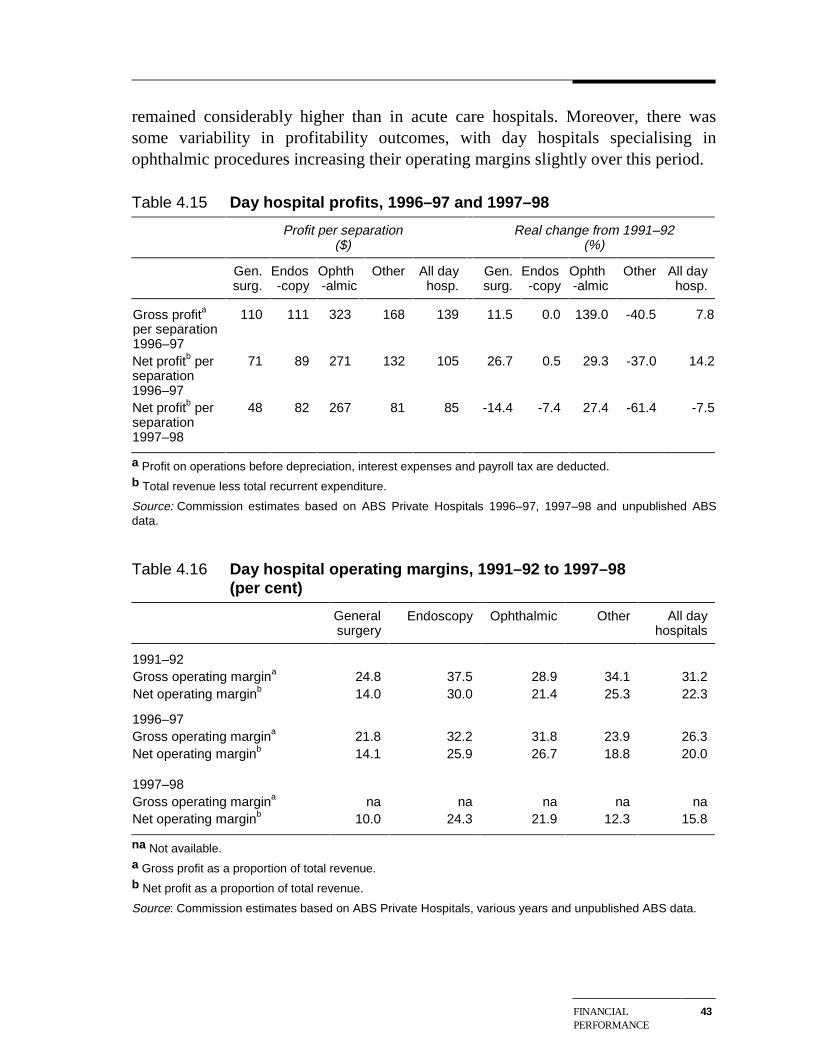
FINANCIALPERFORMANCE
43
remained considerably higher than in acute care hospitals. Moreover, there wassome variability in profitability outcomes, with day hospitals specialising inophthalmic procedures increasing their operating margins slightly over this period.
Table 4.15 Day hospital profits, 1996–97 and 1997–98
Profit per separation($)
Real change from 1991–92(%)
Gen.surg.
Endos-copy
Ophth-almic
Other All dayhosp.
Gen.surg.
Endos-copy
Ophth-almic
Other All dayhosp.
Gross profita
per separation1996–97
110 111 323 168 139 11.5 0.0 139.0 -40.5 7.8
Net profitb perseparation1996–97
71 89 271 132 105 26.7 0.5 29.3 -37.0 14.2
Net profitb perseparation1997–98
48 82 267 81 85 -14.4 -7.4 27.4 -61.4 -7.5
a Profit on operations before depreciation, interest expenses and payroll tax are deducted.b Total revenue less total recurrent expenditure.
Source: Commission estimates based on ABS Private Hospitals 1996–97, 1997–98 and unpublished ABSdata.
Table 4.16 Day hospital operating margins, 1991–92 to 1997–98(per cent)
Generalsurgery
Endoscopy Ophthalmic Other All dayhospitals
1991–92Gross operating margina 24.8 37.5 28.9 34.1 31.2Net operating marginb 14.0 30.0 21.4 25.3 22.3
1996–97Gross operating margina 21.8 32.2 31.8 23.9 26.3Net operating marginb 14.1 25.9 26.7 18.8 20.0
1997–98Gross operating margina na na na na naNet operating marginb 10.0 24.3 21.9 12.3 15.8
na Not available.a Gross profit as a proportion of total revenue.b Net profit as a proportion of total revenue.
Source: Commission estimates based on ABS Private Hospitals, various years and unpublished ABS data.
BROADERPERFORMANCEINDICATORS
45
5 Broader performance indicators
This chapter looks at some non-financial indicators of private hospital performance,namely:
• hospital efficiency;
• service quality; and
• appropriateness of services provided.
5.1 Hospital efficiency
Typically, hospital outputs are expressed in terms of episodes of care, as measuredby separations or patient days. The following sections examine three indicators ofhow efficiently these outputs are delivered: cost efficiency, labour productivity andaverage length of stay.
In interpreting the results, it is important to bear in mind a number of broaderfactors impinging on the delivery of services by private hospitals:
• The input of doctors and health funds to the delivery of services means thathospital operators do not have full, or even significant, control over manyoutcomes. Thus, for example, hospital efficiency is affected by how long doctorstake in theatre.
• While hospital management can vary some costs in the short term, costs relatedto such things as infrastructure and equipment can only be changed over thelonger term.
• The objectives pursued by hospitals differ. For example, not-for-profit hospitalsmay put less emphasis on reducing costs and increasing surpluses than for-profithospitals, particularly if there is any suggestion of compromising the quality ofcare provided.
Cost efficiency
Widely varying complexity and severity of patient conditions have a significantimpact on the cost of hospital treatments.
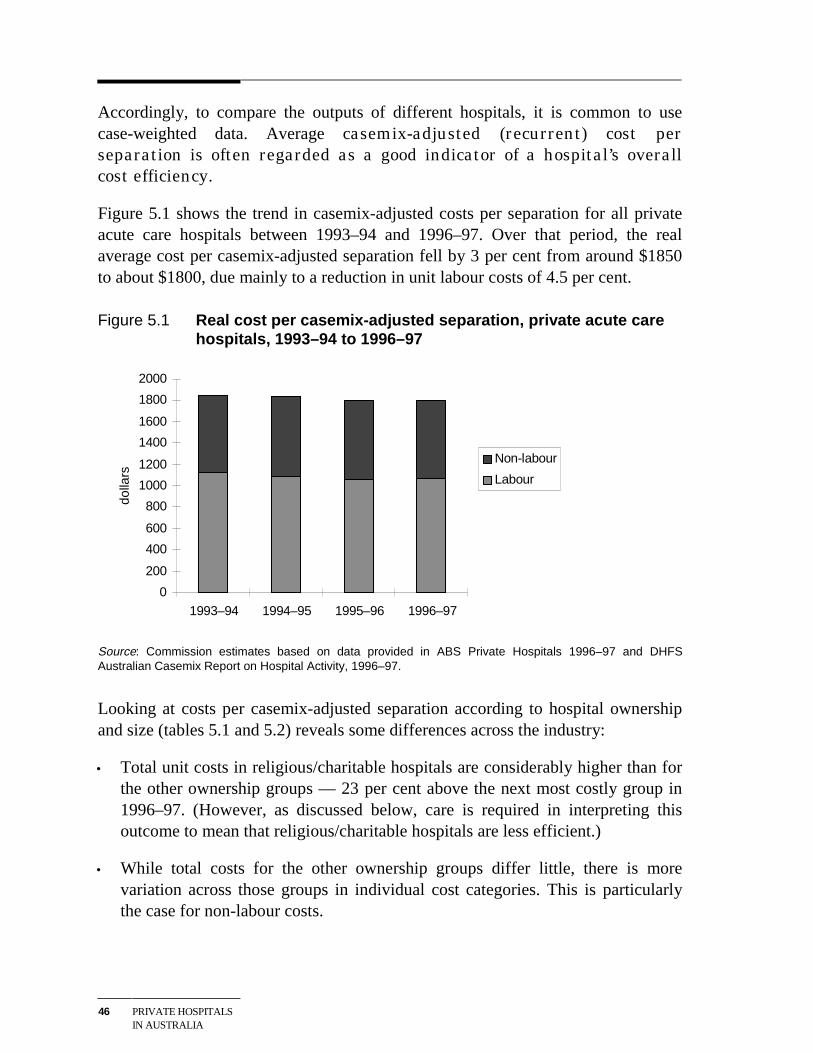
46 PRIVATE HOSPITALSIN AUSTRALIA
Accordingly, to compare the outputs of different hospitals, it is common to usecase-weighted data. Average casemix-adjusted (recurrent) cost perseparation is often regarded as a good indicator of a hospital’s overallcost efficiency.
Figure 5.1 shows the trend in casemix-adjusted costs per separation for all privateacute care hospitals between 1993–94 and 1996–97. Over that period, the realaverage cost per casemix-adjusted separation fell by 3 per cent from around $1850to about $1800, due mainly to a reduction in unit labour costs of 4.5 per cent.
Figure 5.1 Real cost per casemix-adjusted separation, private acute carehospitals, 1993–94 to 1996–97
0
200
400
600
800
1000
1200
1400
1600
1800
2000
1993–94 1994–95 1995–96 1996–97
dolla
rs
Non-labour
Labour
Source: Commission estimates based on data provided in ABS Private Hospitals 1996–97 and DHFSAustralian Casemix Report on Hospital Activity, 1996–97.
Looking at costs per casemix-adjusted separation according to hospital ownershipand size (tables 5.1 and 5.2) reveals some differences across the industry:
• Total unit costs in religious/charitable hospitals are considerably higher than forthe other ownership groups — 23 per cent above the next most costly group in1996–97. (However, as discussed below, care is required in interpreting thisoutcome to mean that religious/charitable hospitals are less efficient.)
• While total costs for the other ownership groups differ little, there is morevariation across those groups in individual cost categories. This is particularlythe case for non-labour costs.
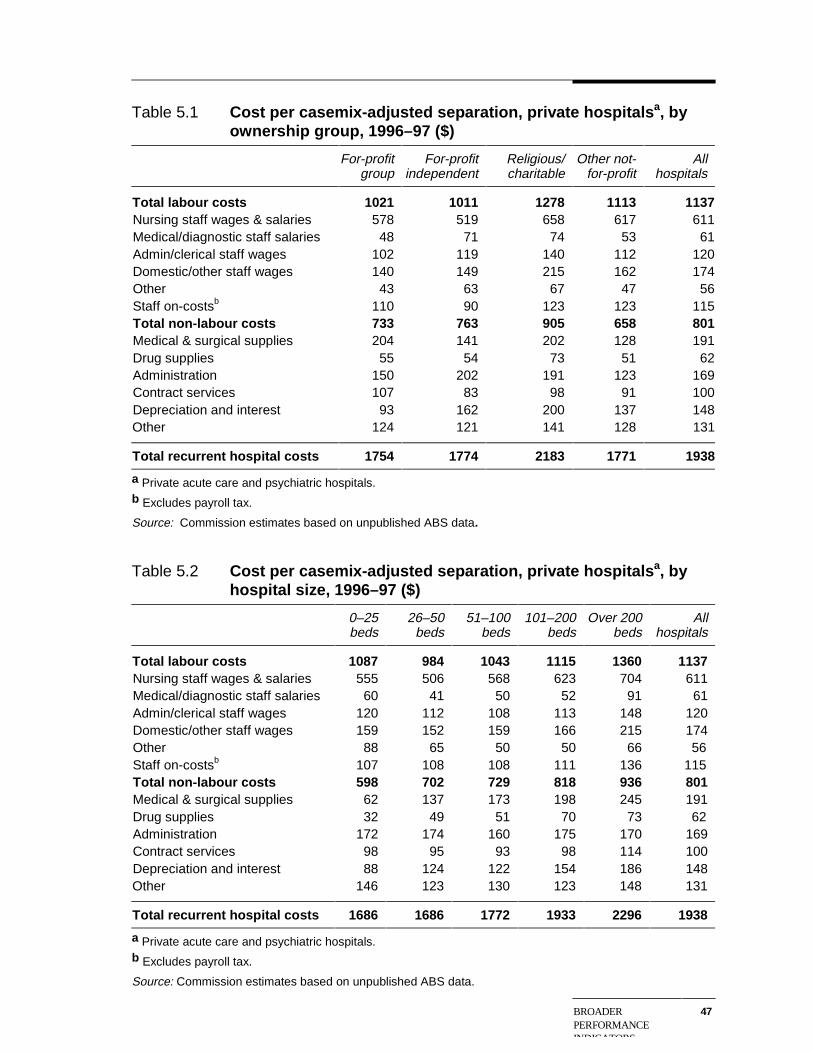
BROADERPERFORMANCEINDICATORS
47
Table 5.1 Cost per casemix-adjusted separation, private hospitalsa, byownership group, 1996–97 ($)
For-profitgroup
For-profitindependent
Religious/charitable
Other not-for-profit
Allhospitals
Total labour costs 1021 1011 1278 1113 1137 Nursing staff wages & salaries 578 519 658 617 611 Medical/diagnostic staff salaries 48 71 74 53 61 Admin/clerical staff wages 102 119 140 112 120 Domestic/other staff wages 140 149 215 162 174 Other 43 63 67 47 56 Staff on-costsb 110 90 123 123 115 Total non-labour costs 733 763 905 658 801 Medical & surgical supplies 204 141 202 128 191 Drug supplies 55 54 73 51 62 Administration 150 202 191 123 169 Contract services 107 83 98 91 100 Depreciation and interest 93 162 200 137 148 Other 124 121 141 128 131
Total recurrent hospital costs 1754 1774 2183 1771 1938
a Private acute care and psychiatric hospitals.b Excludes payroll tax.
Source: Commission estimates based on unpublished ABS data.
Table 5.2 Cost per casemix-adjusted separation, private hospitals a, byhospital size, 1996–97 ($)
0–25beds
26–50beds
51–100beds
101–200beds
Over 200beds
Allhospitals
Total labour costs 1087 984 1043 1115 1360 1137 Nursing staff wages & salaries 555 506 568 623 704 611 Medical/diagnostic staff salaries 60 41 50 52 91 61 Admin/clerical staff wages 120 112 108 113 148 120 Domestic/other staff wages 159 152 159 166 215 174 Other 88 65 50 50 66 56 Staff on-costsb 107 108 108 111 136 115 Total non-labour costs 598 702 729 818 936 801 Medical & surgical supplies 62 137 173 198 245 191 Drug supplies 32 49 51 70 73 62 Administration 172 174 160 175 170 169 Contract services 98 95 93 98 114 100 Depreciation and interest 88 124 122 154 186 148 Other 146 123 130 123 148 131
Total recurrent hospital costs 1686 1686 1772 1933 2296 1938
a Private acute care and psychiatric hospitals.b Excludes payroll tax.
Source: Commission estimates based on unpublished ABS data.
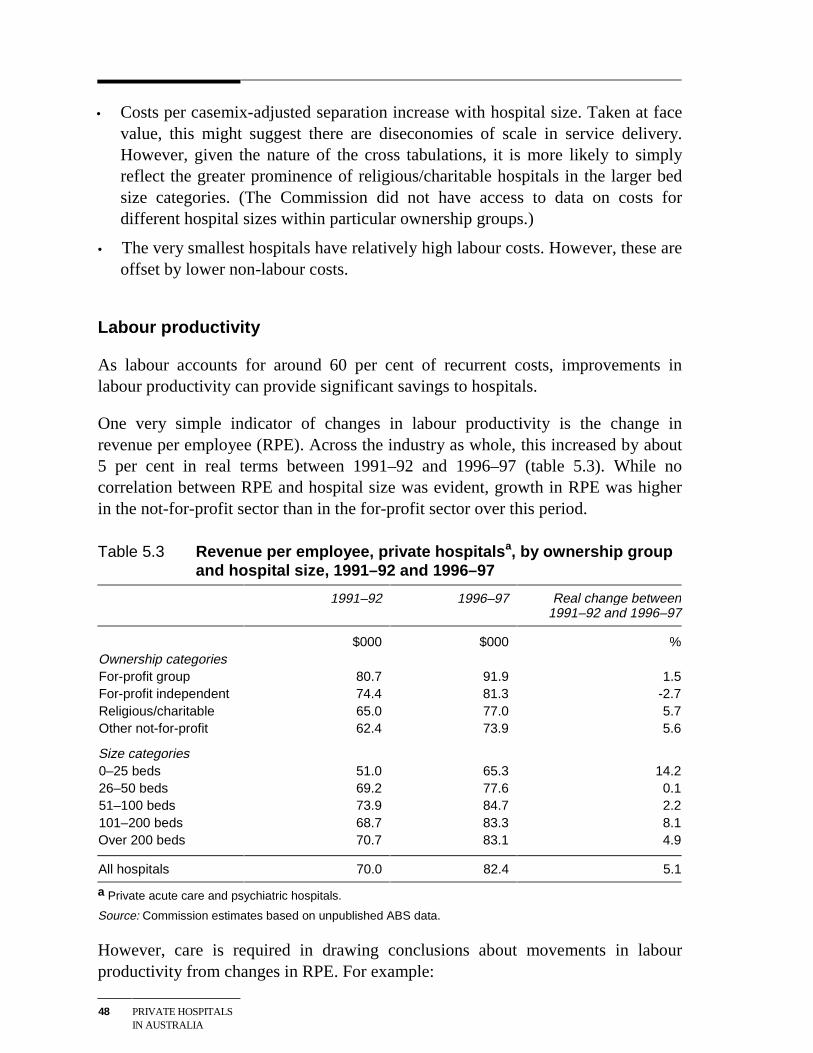
48 PRIVATE HOSPITALSIN AUSTRALIA
• Costs per casemix-adjusted separation increase with hospital size. Taken at facevalue, this might suggest there are diseconomies of scale in service delivery.However, given the nature of the cross tabulations, it is more likely to simplyreflect the greater prominence of religious/charitable hospitals in the larger bedsize categories. (The Commission did not have access to data on costs fordifferent hospital sizes within particular ownership groups.)
• The very smallest hospitals have relatively high labour costs. However, these areoffset by lower non-labour costs.
Labour productivity
As labour accounts for around 60 per cent of recurrent costs, improvements inlabour productivity can provide significant savings to hospitals.
One very simple indicator of changes in labour productivity is the change inrevenue per employee (RPE). Across the industry as whole, this increased by about5 per cent in real terms between 1991–92 and 1996–97 (table 5.3). While nocorrelation between RPE and hospital size was evident, growth in RPE was higherin the not-for-profit sector than in the for-profit sector over this period.
Table 5.3 Revenue per employee, private hospitalsa, by ownership groupand hospital size, 1991–92 and 1996–97
1991–92 1996–97 Real change between1991–92 and 1996–97
$000 $000 %Ownership categoriesFor-profit group 80.7 91.9 1.5For-profit independent 74.4 81.3 -2.7Religious/charitable 65.0 77.0 5.7Other not-for-profit 62.4 73.9 5.6
Size categories0–25 beds 51.0 65.3 14.226–50 beds 69.2 77.6 0.151–100 beds 73.9 84.7 2.2101–200 beds 68.7 83.3 8.1Over 200 beds 70.7 83.1 4.9
All hospitals 70.0 82.4 5.1
a Private acute care and psychiatric hospitals.
Source: Commission estimates based on unpublished ABS data.
However, care is required in drawing conclusions about movements in labourproductivity from changes in RPE. For example:
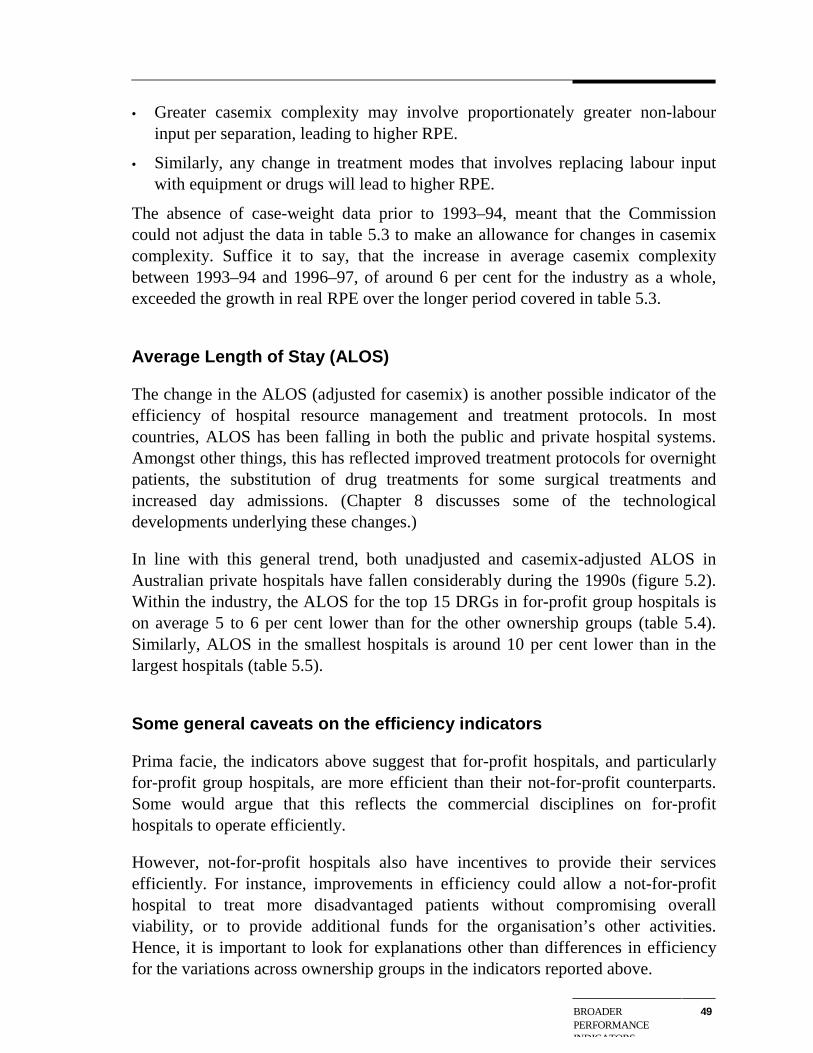
BROADERPERFORMANCEINDICATORS
49
• Greater casemix complexity may involve proportionately greater non-labourinput per separation, leading to higher RPE.
• Similarly, any change in treatment modes that involves replacing labour inputwith equipment or drugs will lead to higher RPE.
The absence of case-weight data prior to 1993–94, meant that the Commissioncould not adjust the data in table 5.3 to make an allowance for changes in casemixcomplexity. Suffice it to say, that the increase in average casemix complexitybetween 1993–94 and 1996–97, of around 6 per cent for the industry as a whole,exceeded the growth in real RPE over the longer period covered in table 5.3.
Average Length of Stay (ALOS)
The change in the ALOS (adjusted for casemix) is another possible indicator of theefficiency of hospital resource management and treatment protocols. In mostcountries, ALOS has been falling in both the public and private hospital systems.Amongst other things, this has reflected improved treatment protocols for overnightpatients, the substitution of drug treatments for some surgical treatments andincreased day admissions. (Chapter 8 discusses some of the technologicaldevelopments underlying these changes.)
In line with this general trend, both unadjusted and casemix-adjusted ALOS inAustralian private hospitals have fallen considerably during the 1990s (figure 5.2).Within the industry, the ALOS for the top 15 DRGs in for-profit group hospitals ison average 5 to 6 per cent lower than for the other ownership groups (table 5.4).Similarly, ALOS in the smallest hospitals is around 10 per cent lower than in thelargest hospitals (table 5.5).
Some general caveats on the efficiency indicators
Prima facie, the indicators above suggest that for-profit hospitals, and particularlyfor-profit group hospitals, are more efficient than their not-for-profit counterparts.Some would argue that this reflects the commercial disciplines on for-profithospitals to operate efficiently.
However, not-for-profit hospitals also have incentives to provide their servicesefficiently. For instance, improvements in efficiency could allow a not-for-profithospital to treat more disadvantaged patients without compromising overallviability, or to provide additional funds for the organisation’s other activities.Hence, it is important to look for explanations other than differences in efficiencyfor the variations across ownership groups in the indicators reported above.
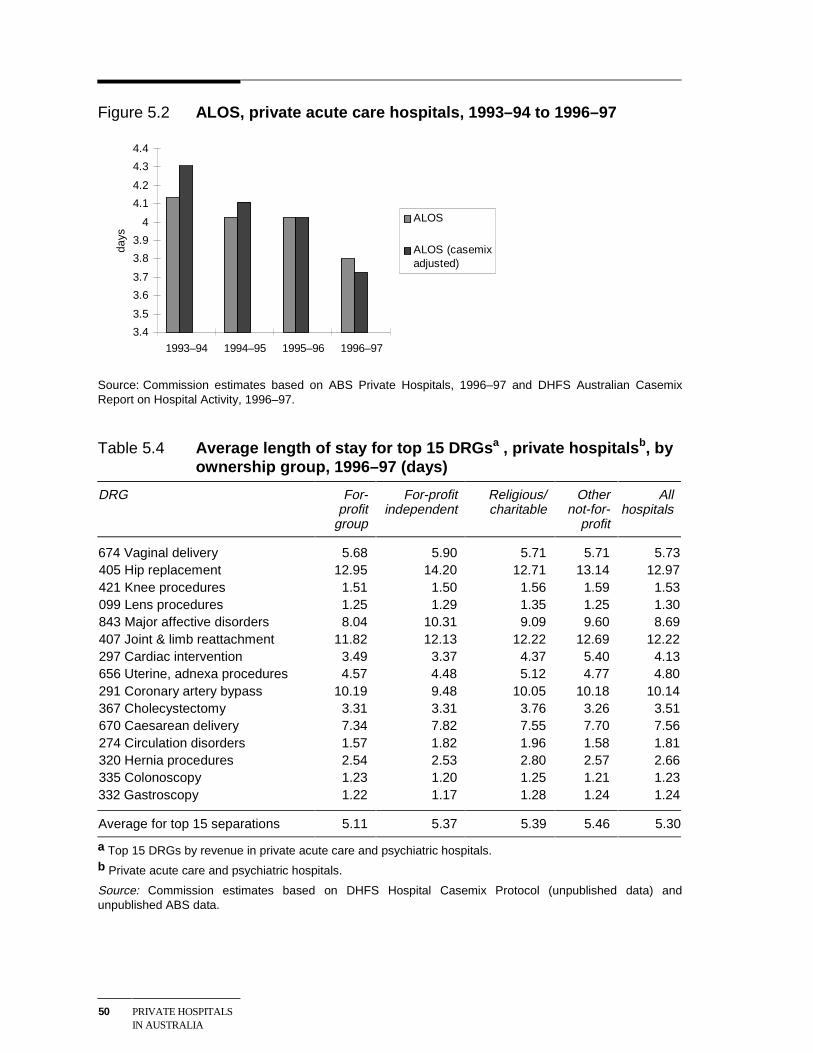
50 PRIVATE HOSPITALSIN AUSTRALIA
Figure 5.2 ALOS, private acute care hospitals, 1993–94 to 1996–97
3.4
3.5
3.6
3.7
3.8
3.9
4
4.1
4.2
4.3
4.4
1993–94 1994–95 1995–96 1996–97
days
ALOS
ALOS (casemixadjusted)
Source: Commission estimates based on ABS Private Hospitals, 1996–97 and DHFS Australian CasemixReport on Hospital Activity, 1996–97.
Table 5.4 Average length of stay for top 15 DRGsa , private hospitalsb, byownership group, 1996–97 (days)
DRG For-profit
group
For-profitindependent
Religious/charitable
Othernot-for-
profit
Allhospitals
674 Vaginal delivery 5.68 5.90 5.71 5.71 5.73405 Hip replacement 12.95 14.20 12.71 13.14 12.97421 Knee procedures 1.51 1.50 1.56 1.59 1.53099 Lens procedures 1.25 1.29 1.35 1.25 1.30843 Major affective disorders 8.04 10.31 9.09 9.60 8.69407 Joint & limb reattachment 11.82 12.13 12.22 12.69 12.22297 Cardiac intervention 3.49 3.37 4.37 5.40 4.13656 Uterine, adnexa procedures 4.57 4.48 5.12 4.77 4.80291 Coronary artery bypass 10.19 9.48 10.05 10.18 10.14367 Cholecystectomy 3.31 3.31 3.76 3.26 3.51670 Caesarean delivery 7.34 7.82 7.55 7.70 7.56274 Circulation disorders 1.57 1.82 1.96 1.58 1.81320 Hernia procedures 2.54 2.53 2.80 2.57 2.66335 Colonoscopy 1.23 1.20 1.25 1.21 1.23332 Gastroscopy 1.22 1.17 1.28 1.24 1.24
Average for top 15 separations 5.11 5.37 5.39 5.46 5.30
a Top 15 DRGs by revenue in private acute care and psychiatric hospitals.b Private acute care and psychiatric hospitals.
Source: Commission estimates based on DHFS Hospital Casemix Protocol (unpublished data) andunpublished ABS data.
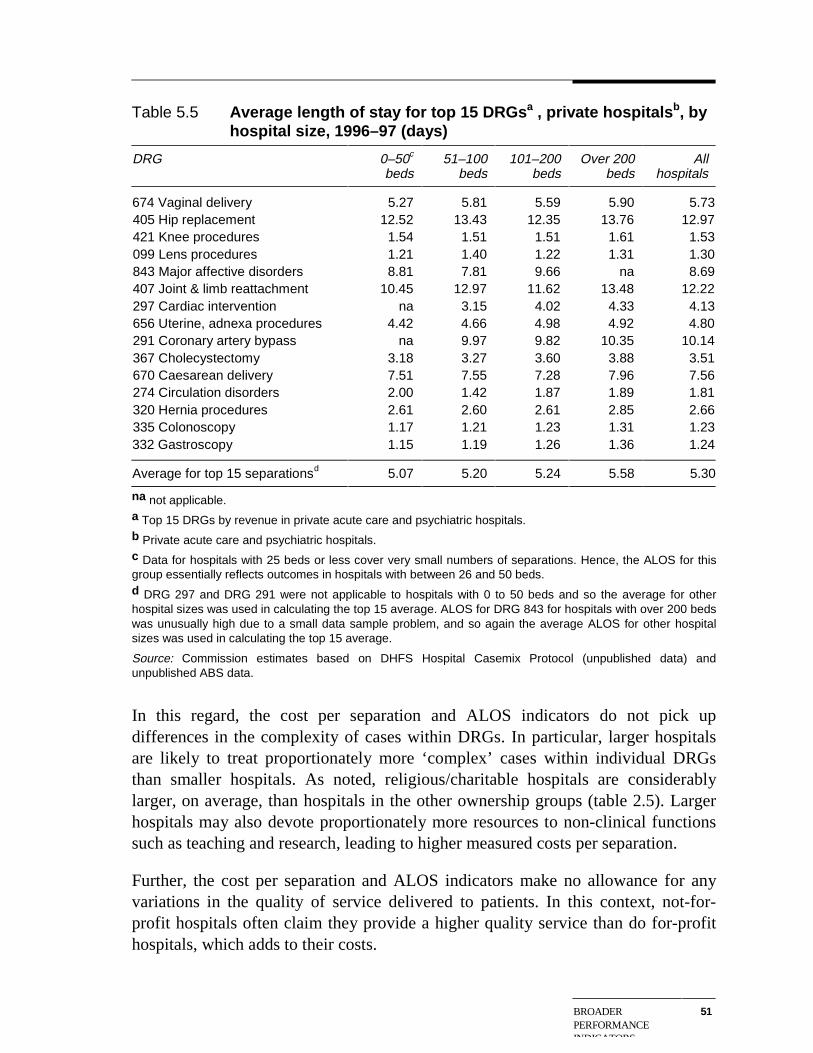
BROADERPERFORMANCEINDICATORS
51
Table 5.5 Average length of stay for top 15 DRGsa , private hospitalsb, byhospital size, 1996–97 (days)
DRG 0–50c
beds51–100
beds101–200
bedsOver 200
bedsAll
hospitals
674 Vaginal delivery 5.27 5.81 5.59 5.90 5.73405 Hip replacement 12.52 13.43 12.35 13.76 12.97421 Knee procedures 1.54 1.51 1.51 1.61 1.53099 Lens procedures 1.21 1.40 1.22 1.31 1.30843 Major affective disorders 8.81 7.81 9.66 na 8.69407 Joint & limb reattachment 10.45 12.97 11.62 13.48 12.22297 Cardiac intervention na 3.15 4.02 4.33 4.13656 Uterine, adnexa procedures 4.42 4.66 4.98 4.92 4.80291 Coronary artery bypass na 9.97 9.82 10.35 10.14367 Cholecystectomy 3.18 3.27 3.60 3.88 3.51670 Caesarean delivery 7.51 7.55 7.28 7.96 7.56274 Circulation disorders 2.00 1.42 1.87 1.89 1.81320 Hernia procedures 2.61 2.60 2.61 2.85 2.66335 Colonoscopy 1.17 1.21 1.23 1.31 1.23332 Gastroscopy 1.15 1.19 1.26 1.36 1.24
Average for top 15 separationsd 5.07 5.20 5.24 5.58 5.30
na not applicable.a Top 15 DRGs by revenue in private acute care and psychiatric hospitals.b Private acute care and psychiatric hospitals.c Data for hospitals with 25 beds or less cover very small numbers of separations. Hence, the ALOS for thisgroup essentially reflects outcomes in hospitals with between 26 and 50 beds.d DRG 297 and DRG 291 were not applicable to hospitals with 0 to 50 beds and so the average for otherhospital sizes was used in calculating the top 15 average. ALOS for DRG 843 for hospitals with over 200 bedswas unusually high due to a small data sample problem, and so again the average ALOS for other hospitalsizes was used in calculating the top 15 average.
Source: Commission estimates based on DHFS Hospital Casemix Protocol (unpublished data) andunpublished ABS data.
In this regard, the cost per separation and ALOS indicators do not pick updifferences in the complexity of cases within DRGs. In particular, larger hospitalsare likely to treat proportionately more ‘complex’ cases within individual DRGsthan smaller hospitals. As noted, religious/charitable hospitals are considerablylarger, on average, than hospitals in the other ownership groups (table 2.5). Largerhospitals may also devote proportionately more resources to non-clinical functionssuch as teaching and research, leading to higher measured costs per separation.
Further, the cost per separation and ALOS indicators make no allowance for anyvariations in the quality of service delivered to patients. In this context, not-for-profit hospitals often claim they provide a higher quality service than do for-profithospitals, which adds to their costs.
52 PRIVATE HOSPITALSIN AUSTRALIA
Broader influences on efficiency outcomes
Efficiency outcomes in the private hospital industry as a whole reflect a wide rangeof factors including the regulatory and policy environment (see chapter 6), and themarket relationships between the hospitals, doctors and health funds (see chapter 7).
However, at this juncture, it is worth emphasising that changes implemented in themid 1990s to the framework within which private hospitals and the health fundsnegotiate, have strengthened the incentives for private hospitals to deliver theirservices efficiently. These changes have reduced the scope for hospitals to pass oncost increases to health funds and their members. This, in turn, has increased thepressure on hospitals to avoid unnecessary patient stays or the delivery of excessservices.
5.2 Quality of care
Quality problems in the delivery of hospital services can arise for a number ofreasons (see box 5.1). Clinical quality problems — as distinct from poor qualityaccommodation and meals — can range from minor errors to serious and lifethreatening events.
The development of indicators of the quality of hospital services has provendifficult for at least two reasons:
• Determining the impact of hospital treatments on the health status of patients canbe problematic, particularly if the assessment attempts to go beyond determiningthe number of patient misadventures.
• Separating the contribution of doctors and hospitals to misadventures and otherunsuccessful treatments can also be difficult. This may have contributed to thereluctance of some hospitals and doctors to embrace transparency in relation toquality outcomes.
Quality in the hospital sector is currently monitored using a suite of methodsincluding:
• process indicators that monitor the internal procedures hospitals follow inproviding treatment to their patients. This is the basis for the qualityaccreditation regime applying in the sector (see below);
• clinical performance indicators that record hospital misadventures; and
• indicators of client satisfaction measured via patient surveys. Some hospitalshave extended this approach to include follow up checks on patient’s healthoutcomes after their hospital stay.
BROADERPERFORMANCEINDICATORS
53
Box 5.1 Sources of clinical quality problems in hospitals
Most of the serious clinical quality problems in hospitals are the result of human error.This is sometimes due to acts of commission by doctors or other health care workers(doing the wrong thing, or the right thing at the wrong time) but, just as often, due toacts of omission (failing to act when action would have helped). According to Wilson etal 1999, the most common errors of omission are failing to review all the availableinformation when making a diagnosis and not organising tests or operations when theywould help.
Wilson et al contend that there are four broad factors contributing to mistakes indiagnosis:
• Some doctors are more likely to make mistakes, due to inexperience, poorjudgment, failure to keep up with new medical developments and the like.
• Some patients — for example, the very young or old — are unable to effectivelycommunicate with doctors and hospital staff.
• The work environment may be poor, so that the results of completed tests or patientrecords are unavailable when required.
• The hospital culture may contribute to faulty diagnosis — for example, poorcommunication between doctors can be a barrier to second opinions.
Some of these contributing factors are beyond the control of hospital management.And, their relative significance may vary between the public and private systems.
Another possible quality indicator is the volume of staff resources devoted topatient care. In this regard, not-for-profit hospitals often point out that they employconsiderably more staff per patient than for-profit hospitals. For example, in1996–97, religious/charitable hospitals had in the order of 15 per cent more nursingand 30 per cent more total staff per patient than for-profit group hospitals (seeappendix table B.23).
But while greater staff to patient ratios may facilitate a better service to patients,they may equally reflect inefficiency in service delivery. Thus, this particularindicator is not pursued further below.
Quality accreditation
The level of quality accreditation of private hospitals by external agencies providesone broad indicator of quality in the industry.
Two organisations offer quality accreditation to Australian hospitals:
54 PRIVATE HOSPITALSIN AUSTRALIA
• The Australian Council on Healthcare Standards (ACHS) operates theEvaluation and Quality Improvement Program (EQuIP). This involves an auditof a hospital’s processes in a broad range of areas (such as staffing levels andsterilisation procedures), and measurements of clinical performance, such as therate of hospital acquired infection.
• The International Standards Organisation (ISO) has a health-care specificaccreditation process, linked to ISO 9002. As with EQuIP, the process involvesan audit of a range of internal procedures. However, the audit team comes froman accredited quality assessment organisation, rather than ACHS trainedvolunteers from other hospitals.
ACHS accreditation currently sets industry standards, with only a few privatehospitals having sought and achieved ISO accreditation. In 1998, around two-thirdsof private acute care and psychiatric hospitals had ACHS accreditation.
The level of accreditation is strongly correlated with hospital size (see figure 5.3),with the smallest hospitals seemingly much less likely to be prepared to bear thecosts of achieving accreditation. Levels of accreditation according to hospitalownership mirror this result — the for-profit groups and religious/charitableorganisations, which own most of the largest hospitals, have the highest levels ofaccreditation.
While quality accreditation has been available for more than a decade, the incentivefor hospitals to seek accreditation has increased in recent years:
• There has been greater pressure from health funds for hospitals to be accredited— or at least be working towards it. In the past, health funds sometimesprovided extra funding to a private hospital as a ‘reward’ for accreditation. But,with the introduction of the current contracting framework in 1995 (see chapter6), it has become common practice for the funds to include accreditation as acondition of a contract with hospitals; and
• Commonwealth legislation specifies that, to be eligible for second tier insurancebenefits (see chapter 6), hospitals without a contract with a health fund must beaccredited.
However, the lack of good data on hospital outcomes means that it is hard toestablish a strong link between levels of accreditation and the quality of privatehospital care.
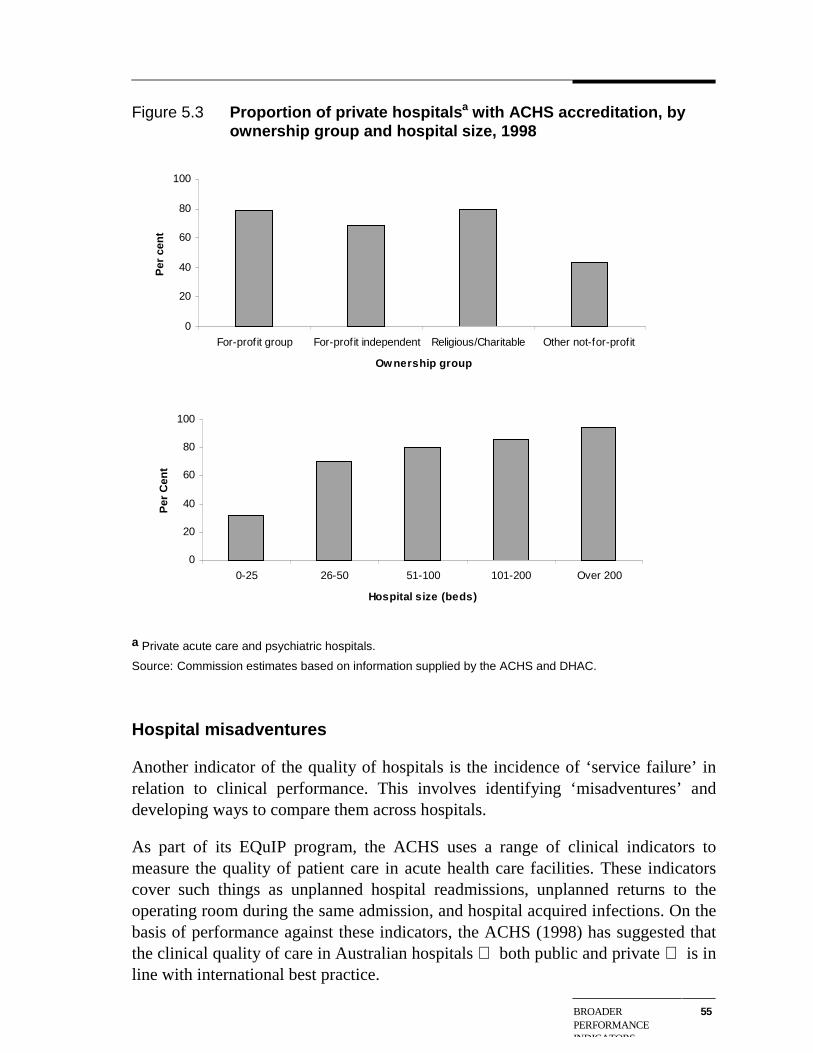
BROADERPERFORMANCEINDICATORS
55
Figure 5.3 Proportion of private hospitalsa with ACHS accreditation, byownership group and hospital size, 1998
0
20
40
60
80
100
For-profit group For-profit independent Religious/Charitable Other not-for-profit
Ownership group
Per
cen
t
0
20
40
60
80
100
0-25 26-50 51-100 101-200 Over 200
Hospital size (beds)
Per
Cen
t
a Private acute care and psychiatric hospitals.
Source: Commission estimates based on information supplied by the ACHS and DHAC.
Hospital misadventures
Another indicator of the quality of hospitals is the incidence of ‘service failure’ inrelation to clinical performance. This involves identifying ‘misadventures’ anddeveloping ways to compare them across hospitals.
As part of its EQuIP program, the ACHS uses a range of clinical indicators tomeasure the quality of patient care in acute health care facilities. These indicatorscover such things as unplanned hospital readmissions, unplanned returns to theoperating room during the same admission, and hospital acquired infections. On thebasis of performance against these indicators, the ACHS (1998) has suggested thatthe clinical quality of care in Australian hospitals both public and private is inline with international best practice.
56 PRIVATE HOSPITALSIN AUSTRALIA
Patient satisfaction surveys
Patient satisfaction surveys cover such issues as the patient’s perception ofadmission and discharge procedures, hospital catering, the standard ofaccommodation and the helpfulness of hospital staff. Most hospitals consultedduring this study said that, in general, over 90 per cent of those filling in patientsurvey forms are satisfied with their hospital stay. This percentage is broadly in linewith the results obtained in surveys of public hospital patients (see SCRCSSP 1999,p. 264).
However, such surveys may offer relatively few insights into clinical concerns orspecific areas requiring improvement. Also, the nature of these surveys means thatthe results are difficult to compare across hospitals and are prone to problems suchas selection bias.
Conclusions
While limited in scope, the quality indicators discussed above paint a reasonablypositive picture of quality in the private hospital industry.
However, a number of commentators have questioned whether strong conclusionson quality can be drawn from these sorts of measures. For example:
• Ibrahim et al (1998) argued that there is a ‘clinically weak and statisticallyinsignificant relationship between [such] indicators and the overall assessment ofquality of care’.
• The Report on Government Services (SCRCSSP 1998a) commented that ‘thelack of generally accepted indicators of the quality of care provided inAustralia’s public acute care hospitals continues to be a major concern’. Thesame observation could be applied to the private hospital industry.
• The ACHS (1998) report contains criticisms by participating hospitals that theindicators are too broad to be meaningful, and that the definitional conventionshave excluded many of the procedures undertaken in hospitals.
Moreover, it can be very hard for patients (and sometimes even their doctors) toaccess the available information on hospital quality. This is because much of theinformation is collected for internal management purposes, or to informnegotiations between hospitals and health funds, rather than to inform consumers.
These concerns reinforce the importance of the range of initiatives underway toimprove the measurement and monitoring of quality in Australia’s hospitals and to
BROADERPERFORMANCEINDICATORS
57
provide better information to consumers on the quality of services on offer (seechapter 9).
5.3 Appropriateness of care
A related dimension of service quality is whether the treatment provided isappropriate to the particular condition of the patient. Where inappropriate treatmentleads to significant health problems for the patient, it may be picked up in indicatorsof hospital misadventures. However, there may also be instances where a patientreceives:
• high quality, but unnecessary, treatment; or
• an expensive treatment when a cheaper treatment would have provided acomparable health outcome.
Judging what is an ‘appropriate’ treatment, or what is the ‘right’ number of medicalservices for a particular patient is not straightforward. And, although hospitals havesome input to decisions on treatments and service levels, doctors make many ofthese decisions in consultation with their patients. Thus, the limited data on theappropriateness of care relate primarily to the treatments provided by doctors inprivate hospitals, rather than on the components of care for which the hospitals aresolely or largely responsible — for example, nursing services.
Variations in treatment between public and private hospitals
The Industry Commission (1997) found that patients in private hospitals are morelikely to receive a greater number of in-hospital medical services than they would asprivate patients in public hospitals. Similarly, unpublished data from the thenDHFS’s Hospital Casemix Protocol show that, in 1996–97, there was an average of6.83 medical services per episode in private acute hospitals, compared with 5.32services per episode for private patients in public hospitals. More specifically, aspart of an international study coordinated by Harvard and Stanford universities,Richardson and Robertson (1998) looked at variations in the treatment of heartattack admissions to public and private hospitals in Victoria and Western Australiaover the ten years to 1996. Amongst other things, the Australian study found thatprivate hospital patients were much more likely to receive ‘expensive high-tech’medical interventions following a heart attack than patients in public hospitals.
However, as noted by Richardson and Robertson (1998), it is not clear whether thissort of data is evidence of overservicing in private hospitals or underservicing inpublic facilities, or both. Significantly, a new study — the Measures of Appropriate

58 PRIVATE HOSPITALSIN AUSTRALIA
Clinical Care project — is seeking to develop a set of indicators to assess theappropriateness of clinical care in private hospitals. The project was initiated by theACHS and is being funded by the Australian Health Insurance Association.Measures to promote appropriate high quality care in private hospitals areconsidered further in chapter 9.
THE REGULATORYAND LEGISLATIVEENVIRONMENT
59
6 The regulatory and legislativeenvironment
This chapter outlines the main government regulations and legislation directlyaffecting private hospitals and their relationships with health funds and doctors.
6.1 State and Territory regulation
Licensing controls
Responsibility for licensing (or registering) private acute care and psychiatrichospitals and freestanding day hospitals lies principally with State and Territorygovernments. Where stated, the objectives of these controls primarily relate eitherto:
• ensuring the quality and safety of private hospital services; or
• encouraging the provision of the ‘right’ level of hospital services, including anappropriate geographical distribution of those services (see table 6.1).
Licensing controls are one of a number of mechanisms that operate in the industryto promote quality and safety. Others include:
• the two quality accreditation schemes for private hospitals (see chapter 5);
• contracts between health funds and private hospitals which typically containquality requirements, including accreditation, that hospitals must meet (seechapter 7); and
• the strong commercial and ethical incentives for hospital operators and doctorsto ensure that safety and quality standards are maintained.
Features of licensing controls
Through licensing controls, administering authorities can exercise significantcontrol over the nature of private hospital services and hospital conduct. Thecontrols cover a range of matters including:
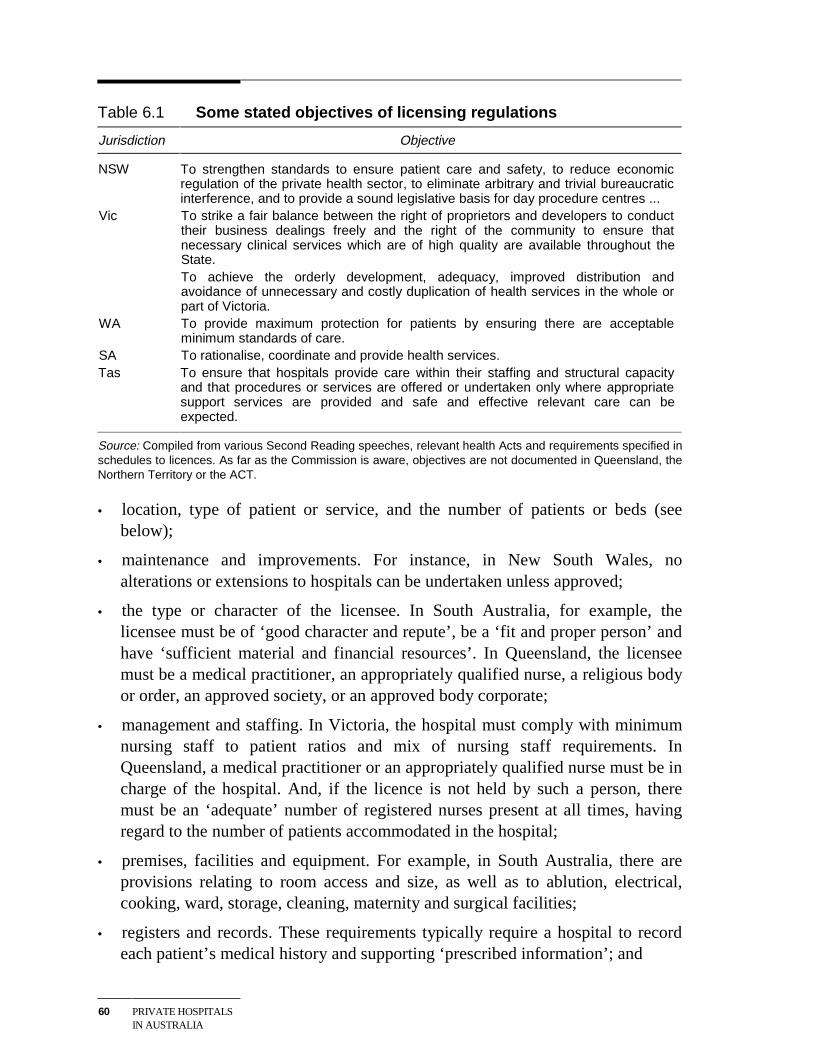
60 PRIVATE HOSPITALSIN AUSTRALIA
Table 6.1 Some stated objectives of licensing regulations
Jurisdiction Objective
NSW To strengthen standards to ensure patient care and safety, to reduce economicregulation of the private health sector, to eliminate arbitrary and trivial bureaucraticinterference, and to provide a sound legislative basis for day procedure centres ...
Vic To strike a fair balance between the right of proprietors and developers to conducttheir business dealings freely and the right of the community to ensure thatnecessary clinical services which are of high quality are available throughout theState.To achieve the orderly development, adequacy, improved distribution andavoidance of unnecessary and costly duplication of health services in the whole orpart of Victoria.
WA To provide maximum protection for patients by ensuring there are acceptableminimum standards of care.
SA To rationalise, coordinate and provide health services.Tas To ensure that hospitals provide care within their staffing and structural capacity
and that procedures or services are offered or undertaken only where appropriatesupport services are provided and safe and effective relevant care can beexpected.
Source: Compiled from various Second Reading speeches, relevant health Acts and requirements specified inschedules to licences. As far as the Commission is aware, objectives are not documented in Queensland, theNorthern Territory or the ACT.
• location, type of patient or service, and the number of patients or beds (seebelow);
• maintenance and improvements. For instance, in New South Wales, noalterations or extensions to hospitals can be undertaken unless approved;
• the type or character of the licensee. In South Australia, for example, thelicensee must be of ‘good character and repute’, be a ‘fit and proper person’ andhave ‘sufficient material and financial resources’. In Queensland, the licenseemust be a medical practitioner, an appropriately qualified nurse, a religious bodyor order, an approved society, or an approved body corporate;
• management and staffing. In Victoria, the hospital must comply with minimumnursing staff to patient ratios and mix of nursing staff requirements. InQueensland, a medical practitioner or an appropriately qualified nurse must be incharge of the hospital. And, if the licence is not held by such a person, theremust be an ‘adequate’ number of registered nurses present at all times, havingregard to the number of patients accommodated in the hospital;
• premises, facilities and equipment. For example, in South Australia, there areprovisions relating to room access and size, as well as to ablution, electrical,cooking, ward, storage, cleaning, maternity and surgical facilities;
• registers and records. These requirements typically require a hospital to recordeach patient’s medical history and supporting ‘prescribed information’; and
THE REGULATORYAND LEGISLATIVEENVIRONMENT
61
• reporting and notification of information. In New South Wales, the licenseemust furnish an annual statement detailing the chief nurse’s authority to practiseand his/her qualifications and the shareholdings of office bearers such as thedirector, chief executive and secretary; and a monthly statistical statement. InQueensland, the licensee must provide monthly reports on admissions,separations, patient type and occupied bed days, and information on individualpatients.
Licensing provisions also typically include a range of miscellaneous requirementscovering such things as: patient rights; fire safety and emergency evacuation;hospital administrative practices and policies; the storage and handling of drugs andchemicals; waste management and disposal; food safety; and infection control. Theymay also specify compliance with other legislation or regulations. For example, theschedule to licences issued in Tasmania requires compliance with certain standardsprepared by the National Therapeutic Goods Committee, the National Health andMedical Research Council, the New South Wales Department of Health, theAustralian Council on Healthcare Standards, the Society of Hospital Pharmacists ofAustralia, and the Pharmaceutical Society of Australia.
Table 6.2 summarises the key features of each jurisdictions’ licensing controls. It isimportant to note, however, that some jurisdictions do not enforce particularrequirements. For example, in Tasmania, there is no regular or periodic inspectionof private hospitals despite there being provisions requiring such inspections.According to Tasmanian authorities, inspections instead occur whenever there issignificant construction work — an arrangement which has apparently resulted infrequent contact with hospitals. Conversely, between 1994 and 1996, licenceapplications in Queensland were assessed against planning criteria, even thoughthere were no express provisions authorising the administering authority to do so.
Once licensed, hospitals are still subject to inspection and to the reportingrequirements noted above. Failure to comply can lead to cancellation of the licence,fines, or some other sanction (although an appeals process is usually available).Licences can be renewed, amended and, in most jurisdictions, transferred.
Planning controls
As set out in table 6.2, licensing arrangements in most jurisdictions includeplanning controls which may variously cover the location of private hospitals, thenature of services available in them, and the number of beds. Underlying thesecontrols are concerns that relying solely on the market to determine the location andlevel of private hospital services could lead to inappropriate outcomes, such as:
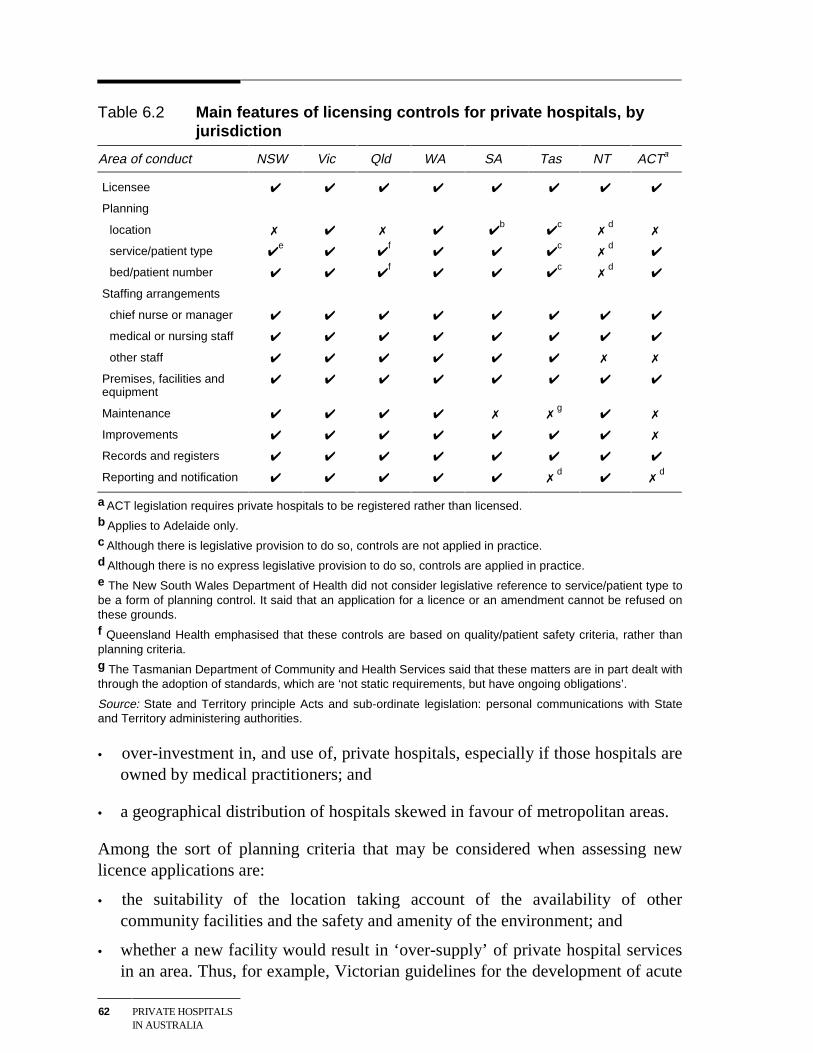
62 PRIVATE HOSPITALSIN AUSTRALIA
Table 6.2 Main features of licensing controls for private hospitals, byjurisdiction
Area of conduct NSW Vic Qld WA SA Tas NT ACTa
Licensee ✔ ✔ ✔ ✔ ✔ ✔ ✔ ✔
Planning
location ✗ ✔ ✗ ✔ ✔b
✔c
✗d
✗
service/patient type ✔e
✔ ✔f
✔ ✔ ✔c
✗d
✔
bed/patient number ✔ ✔ ✔f
✔ ✔ ✔c
✗d
✔
Staffing arrangements
chief nurse or manager ✔ ✔ ✔ ✔ ✔ ✔ ✔ ✔
medical or nursing staff ✔ ✔ ✔ ✔ ✔ ✔ ✔ ✔
other staff ✔ ✔ ✔ ✔ ✔ ✔ ✗ ✗
Premises, facilities andequipment
✔ ✔ ✔ ✔ ✔ ✔ ✔ ✔
Maintenance ✔ ✔ ✔ ✔ ✗ ✗g
✔ ✗
Improvements ✔ ✔ ✔ ✔ ✔ ✔ ✔ ✗
Records and registers ✔ ✔ ✔ ✔ ✔ ✔ ✔ ✔
Reporting and notification ✔ ✔ ✔ ✔ ✔ ✗d
✔ ✗d
a ACT legislation requires private hospitals to be registered rather than licensed.b Applies to Adelaide only.c Although there is legislative provision to do so, controls are not applied in practice.d Although there is no express legislative provision to do so, controls are applied in practice.e The New South Wales Department of Health did not consider legislative reference to service/patient type tobe a form of planning control. It said that an application for a licence or an amendment cannot be refused onthese grounds.f Queensland Health emphasised that these controls are based on quality/patient safety criteria, rather thanplanning criteria.g The Tasmanian Department of Community and Health Services said that these matters are in part dealt withthrough the adoption of standards, which are ‘not static requirements, but have ongoing obligations’.
Source: State and Territory principle Acts and sub-ordinate legislation: personal communications with Stateand Territory administering authorities.
• over-investment in, and use of, private hospitals, especially if those hospitals areowned by medical practitioners; and
• a geographical distribution of hospitals skewed in favour of metropolitan areas.
Among the sort of planning criteria that may be considered when assessing newlicence applications are:
• the suitability of the location taking account of the availability of othercommunity facilities and the safety and amenity of the environment; and
• whether a new facility would result in ‘over-supply’ of private hospital servicesin an area. Thus, for example, Victorian guidelines for the development of acute
THE REGULATORYAND LEGISLATIVEENVIRONMENT
63
care hospital services allow the Secretary of the Victorian Department of HumanServices and Health to refuse a licence if this would result in more than 4.1 bedsper 1000 of population becoming available in the area concerned (HSPR 1999,p. 54).
One effect of planning controls has been the creation of a market in bed licences,with trade between different hospital owners and within the same ownership group.Indeed, private hospital expansions in a number of jurisdictions have occurredthrough the purchase of existing licences, rather than through the issue of newlicences. Anecdotal evidence indicates that, in 1998, the value of bed licences inindividual jurisdictions ranged from negligible to around $20 000.
Views on the effectiveness of the licensing regime
There is widespread acceptance by the industry of governments’ role in ensuringclinical services are of a high quality and are provided in an atmosphere ofmaximum safety. Moreover, private hospital operators told the Commission thatwhile there are some problems with the current arrangements (and relatedregulations) — see box 6.1, in broad terms, they do not impose an excessiveregulatory burden on operators.
These views may reflect a licensing regime which is working reasonably well.
But equally they could be consistent with a regime that was inadequate or not wellenforced. Accordingly, the Commission sought further input from the administeringauthorities in the States and Territories on the effectiveness and enforcement oftheir licensing controls.
According to the administering authorities:
• Some jurisdictions undertake annual inspections. However, in New SouthWales, there has been a move away from routine inspection towards ‘a riskmanagement needs based approach’ focusing on such issues as admission ofchildren, infection control, the history of concerns and complaints. And, as notedabove, inspections in Tasmania only occur when a hospital wishes to undertakesignificant construction work.
• Formal refusal of new licensing applications is uncommon. Most problems tendto be addressed in early discussions between hospitals and administeringauthorities, thus clearing the way for administrative approval. Of thoseapplications that have been formally refused, the grounds have included breachof a bed cap and an individual not being a ‘fit and proper person’.
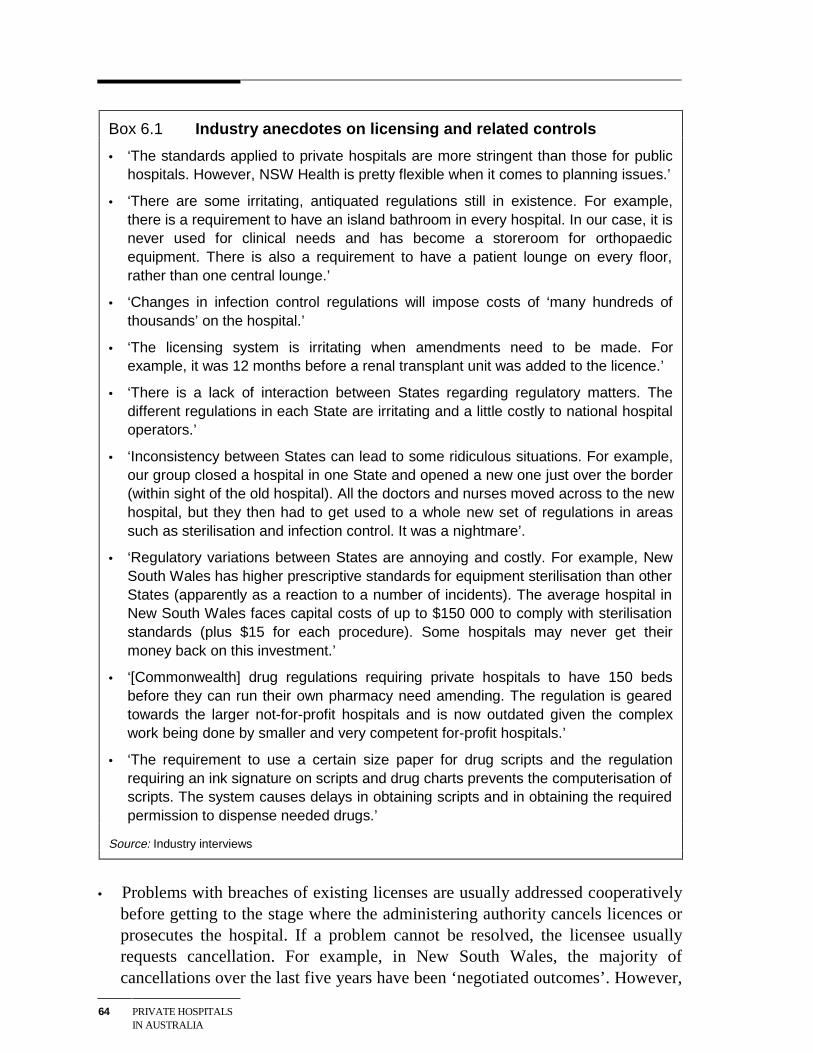
64 PRIVATE HOSPITALSIN AUSTRALIA
Box 6.1 Industry anecdotes on licensing and related controls
• ‘The standards applied to private hospitals are more stringent than those for publichospitals. However, NSW Health is pretty flexible when it comes to planning issues.’
• ‘There are some irritating, antiquated regulations still in existence. For example,there is a requirement to have an island bathroom in every hospital. In our case, it isnever used for clinical needs and has become a storeroom for orthopaedicequipment. There is also a requirement to have a patient lounge on every floor,rather than one central lounge.’
• ‘Changes in infection control regulations will impose costs of ‘many hundreds ofthousands’ on the hospital.’
• ‘The licensing system is irritating when amendments need to be made. Forexample, it was 12 months before a renal transplant unit was added to the licence.’
• ‘There is a lack of interaction between States regarding regulatory matters. Thedifferent regulations in each State are irritating and a little costly to national hospitaloperators.’
• ‘Inconsistency between States can lead to some ridiculous situations. For example,our group closed a hospital in one State and opened a new one just over the border(within sight of the old hospital). All the doctors and nurses moved across to the newhospital, but they then had to get used to a whole new set of regulations in areassuch as sterilisation and infection control. It was a nightmare’.
• ‘Regulatory variations between States are annoying and costly. For example, NewSouth Wales has higher prescriptive standards for equipment sterilisation than otherStates (apparently as a reaction to a number of incidents). The average hospital inNew South Wales faces capital costs of up to $150 000 to comply with sterilisationstandards (plus $15 for each procedure). Some hospitals may never get theirmoney back on this investment.’
• ‘[Commonwealth] drug regulations requiring private hospitals to have 150 bedsbefore they can run their own pharmacy need amending. The regulation is gearedtowards the larger not-for-profit hospitals and is now outdated given the complexwork being done by smaller and very competent for-profit hospitals.’
• ‘The requirement to use a certain size paper for drug scripts and the regulationrequiring an ink signature on scripts and drug charts prevents the computerisation ofscripts. The system causes delays in obtaining scripts and in obtaining the requiredpermission to dispense needed drugs.’
Source: Industry interviews
• Problems with breaches of existing licenses are usually addressed cooperativelybefore getting to the stage where the administering authority cancels licences orprosecutes the hospital. If a problem cannot be resolved, the licensee usuallyrequests cancellation. For example, in New South Wales, the majority ofcancellations over the last five years have been ‘negotiated outcomes’. However,
THE REGULATORYAND LEGISLATIVEENVIRONMENT
65
no jurisdiction appears to publish information about breaches or the outcomes ofinspections.
Licensing arrangements and planning controls are discussed further in chapter 9.
6.2 Commonwealth regulation of the private hospitalindustry
Regulation of both public and private health care is an important tool used by theCommonwealth to help ensure: the provision of quality health care; equitable accessto services; the efficient delivery of services; and satisfaction for consumers andproviders. Where the private sector is involved in service delivery, Commonwealthregulation also aims to reduce potential cost shifting to the Commonwealth, healthfunds and health fund members.
The main pieces of Commonwealth legislation directly relevant to the privatehospital industry can be divided into three groups:
• legislation governing the ‘declaration’ of hospitals for health insurancepurposes;
• legislation covering the relationships between private hospitals, doctors andhealth funds; and
• legislation designed to encourage membership of health funds.
Other relevant Commonwealth regulation includes the legislation specifying‘default’ and ‘second tier’ benefits for ‘non-contracted’ hospital services and theprovisions relating to the ‘Private Patients Hospital Charter’. More generalCommonwealth legislation relating to the taxation of non-profit organisations isalso relevant to outcomes in the industry (see chapter 9).
Hospital declarations
While State and Territory governments are responsible for licensing or approvingprivate hospitals and day hospital facilities, the Health Insurance Act 1973 and theNational Health Act 1953 require that a hospital be ‘declared’ by theCommonwealth in order to receive health insurance benefits.
To obtain a declaration, a hospital licensed/approved by a State or Territory mustcomply with any Commonwealth guidelines in force under this legislation.
66 PRIVATE HOSPITALSIN AUSTRALIA
However, the general policy has been that the Commonwealth relies on State andTerritory licensing mechanisms. At present, Commonwealth guidelines apply onlyto co-located private hospitals and day facilities. These guidelines state that, inconsidering a declaration, the Minister for Health and Aged Care should haveregard to whether:
• the private facility would materially affect access by public patients to areasonable range of services;
• there are adequate arrangements at the public hospital to ensure that patients areable to exercise freely their right to elect to be treated as public patients;
• there would be a transfer of costs from the State/Territory to any other party; and
• the State/Territory and hospital agree to supply data to allow the Commonwealthto monitor such things as access by public patients to a reasonable range ofservices, the adequacy of arrangements for patient election, and costs.
There are also requirements under this legislation relating to the provision byprivate hospitals of pharmacy services under the Pharmaceutical Benefits Scheme,and standards for special care nurseries in private hospitals.
The Commonwealth is currently investigating options to link a wider range ofquality requirements — for example, credential arrangements and clinical pathways— to health fund benefit payments. The intention is to progressively introduce theseadditional requirements within two years. The Department of Health and Aged Careplans to issue a discussion paper on possible measures in the near future.
Relationships between hospitals, doctors and health funds
Commonwealth legislation has an important influence on agreements between theparties involved in the delivery of private hospital services. There are two mainpieces of legislation involved — the Trade Practices Act 1974 (TPA) and theHealth Legislation (Private Health Insurance Reform) Amendment Act 1995(subsequently referred to as the Amendment Act 1995).
The TPA is administered by the Australian Competition and Consumer Commission(ACCC) and addresses a range of competition and market power issues relevant inthe private hospital industry. In particular, the formation of hospitals (or doctors)into negotiating groups risks contravening the restrictive trade practices provisionsof the Act (see box 6.2). However, the ACCC can authorise joint negotiations byhospitals that are in competition with each other, where the public benefit outweighsthe anti-competitive cost.
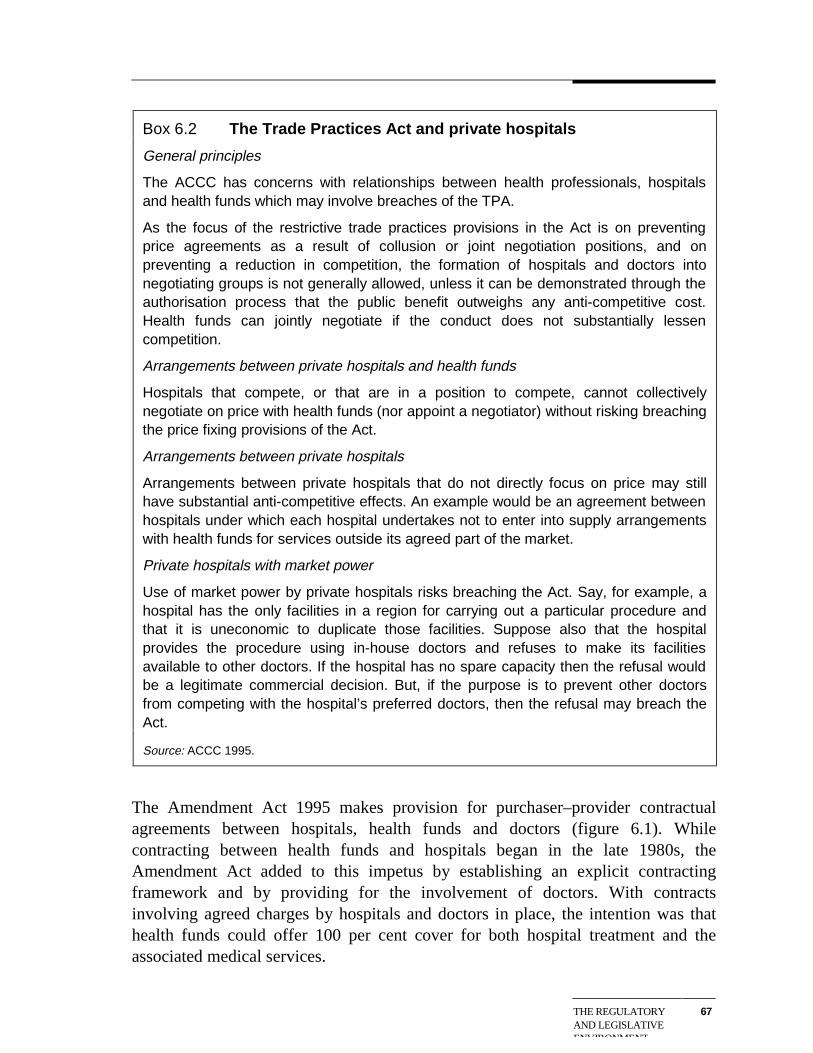
THE REGULATORYAND LEGISLATIVEENVIRONMENT
67
Box 6.2 The Trade Practices Act and private hospitals
General principles
The ACCC has concerns with relationships between health professionals, hospitalsand health funds which may involve breaches of the TPA.
As the focus of the restrictive trade practices provisions in the Act is on preventingprice agreements as a result of collusion or joint negotiation positions, and onpreventing a reduction in competition, the formation of hospitals and doctors intonegotiating groups is not generally allowed, unless it can be demonstrated through theauthorisation process that the public benefit outweighs any anti-competitive cost.Health funds can jointly negotiate if the conduct does not substantially lessencompetition.
Arrangements between private hospitals and health funds
Hospitals that compete, or that are in a position to compete, cannot collectivelynegotiate on price with health funds (nor appoint a negotiator) without risking breachingthe price fixing provisions of the Act.
Arrangements between private hospitals
Arrangements between private hospitals that do not directly focus on price may stillhave substantial anti-competitive effects. An example would be an agreement betweenhospitals under which each hospital undertakes not to enter into supply arrangementswith health funds for services outside its agreed part of the market.
Private hospitals with market power
Use of market power by private hospitals risks breaching the Act. Say, for example, ahospital has the only facilities in a region for carrying out a particular procedure andthat it is uneconomic to duplicate those facilities. Suppose also that the hospitalprovides the procedure using in-house doctors and refuses to make its facilitiesavailable to other doctors. If the hospital has no spare capacity then the refusal wouldbe a legitimate commercial decision. But, if the purpose is to prevent other doctorsfrom competing with the hospital’s preferred doctors, then the refusal may breach theAct.
Source: ACCC 1995.
The Amendment Act 1995 makes provision for purchaser–provider contractualagreements between hospitals, health funds and doctors (figure 6.1). Whilecontracting between health funds and hospitals began in the late 1980s, theAmendment Act added to this impetus by establishing an explicit contractingframework and by providing for the involvement of doctors. With contractsinvolving agreed charges by hospitals and doctors in place, the intention was thathealth funds could offer 100 per cent cover for both hospital treatment and theassociated medical services.
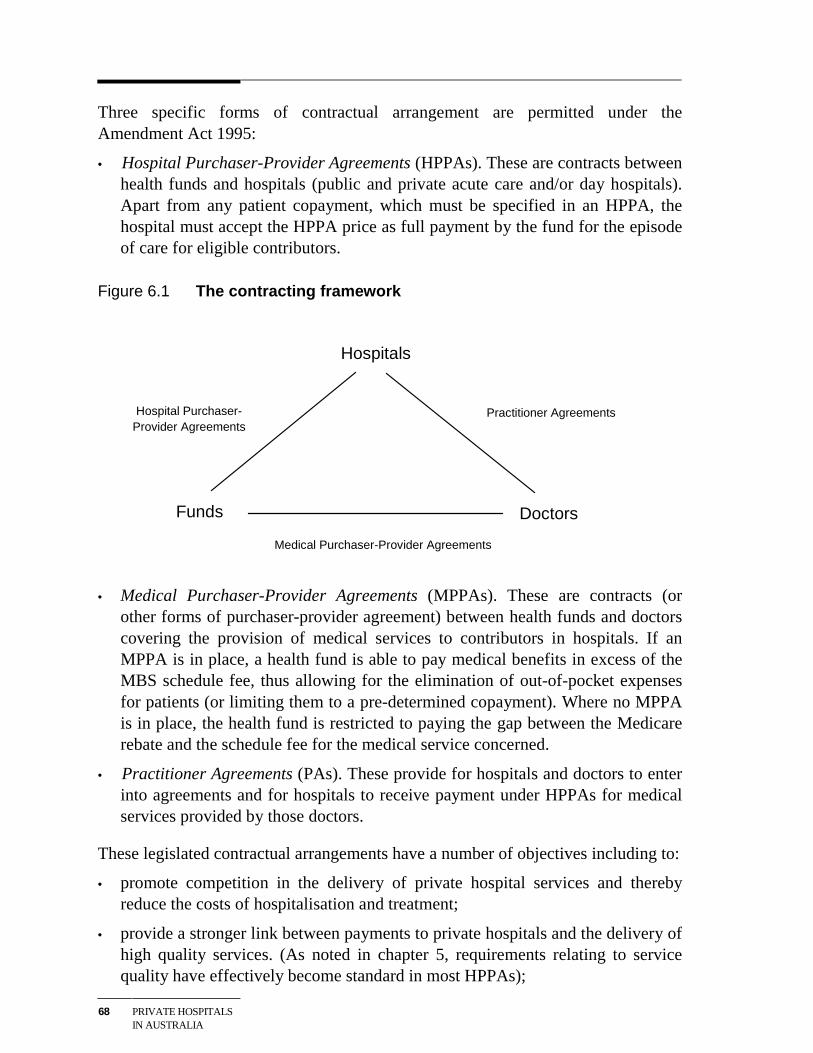
68 PRIVATE HOSPITALSIN AUSTRALIA
Three specific forms of contractual arrangement are permitted under theAmendment Act 1995:
• Hospital Purchaser-Provider Agreements (HPPAs). These are contracts betweenhealth funds and hospitals (public and private acute care and/or day hospitals).Apart from any patient copayment, which must be specified in an HPPA, thehospital must accept the HPPA price as full payment by the fund for the episodeof care for eligible contributors.
Figure 6.1 The contracting framework
Hospitals
DoctorsFunds
Hospital Purchaser-Provider Agreements
Practitioner Agreements
Medical Purchaser-Provider Agreements
• Medical Purchaser-Provider Agreements (MPPAs). These are contracts (orother forms of purchaser-provider agreement) between health funds and doctorscovering the provision of medical services to contributors in hospitals. If anMPPA is in place, a health fund is able to pay medical benefits in excess of theMBS schedule fee, thus allowing for the elimination of out-of-pocket expensesfor patients (or limiting them to a pre-determined copayment). Where no MPPAis in place, the health fund is restricted to paying the gap between the Medicarerebate and the schedule fee for the medical service concerned.
• Practitioner Agreements (PAs). These provide for hospitals and doctors to enterinto agreements and for hospitals to receive payment under HPPAs for medicalservices provided by those doctors.
These legislated contractual arrangements have a number of objectives including to:
• promote competition in the delivery of private hospital services and therebyreduce the costs of hospitalisation and treatment;
• provide a stronger link between payments to private hospitals and the delivery ofhigh quality services. (As noted in chapter 5, requirements relating to servicequality have effectively become standard in most HPPAs);
THE REGULATORYAND LEGISLATIVEENVIRONMENT
69
• provide the opportunity for health funds to eliminate out-of-pocket expenses forpatients treated in private hospitals; and
• simplify the billing and payment of benefits process by allowing hospitals tocollate the separate medical bills and collect the medical benefits payable forthem.
A number of amendments to the 1995 Amendment Act were legislated in April1998 via the Health Legislation Amendment Act (No. 2) 1998. As a result:
• if a hospital has a PA with doctors for in-hospital medical services, health fundsare now able to pay the hospital above the MBS fee for the medical componentof treatment under an HPPA;
• MPPAs and PAs must include an undertaking by the health fund or hospital tomaintain the professional freedom of doctors to identify the appropriatetreatment for their patients within the scope of accepted clinical practice;
• any person may request copies of HPPAs, MPPAs or PAs; and
• patients are now able to assign their Medicare benefits to approved billingagents for in-hospital medical treatment (thus providing an alternative billingsystem to patients if hospitals do not have agreements with doctors and patientsrelating to out-of-pocket costs).
The impacts of these contracting arrangements on the private hospital industry areconsidered in the next chapter.
Assistance to health fund members
The bulk of private hospital revenue comes from treating privately insured patients(see chapter 3). Hence, government measures designed to assist health funds andtheir members can have a significant effect on demand for private hospital servicesand thereby hospitals’ financial performance.
As noted, the Amendment Act 1995 aimed to make private health insurance moreattractive by reducing the cost of private hospital services and providing scope forhealth funds to offer 100 per cent cover, thus eliminating medical gaps.
But with continuing upward pressure on premiums and declining fund membership,subsequent Commonwealth legislation took a more direct route, providing financialincentives for people to take out (or maintain) private health insurance.
• As part of its 1996 Budget, the Government announced that there would bemeans-tested rebates for people with private health insurance, and a Medicare
70 PRIVATE HOSPITALSIN AUSTRALIA
levy surcharge on those above (higher) specified income thresholds withoutprivate patient hospital cover.
These measures, which were enacted through the Private Health InsuranceIncentives Act 1997, had a number of objectives:
- assisting people to keep private health insurance;
- relieving pressure on public hospitals;
- encouraging the private provision of hospital services; and
- providing choice of public and private hospital services. (IC 1997, p. 78)
• In 1998, the Government announced that the means-tested rebate would bereplaced by a general (non-means tested) 30 per cent rebate on all health fundpremiums. The objectives of the revised rebate scheme — introduced via thePrivate Health Insurance Incentives Act 1998 — are similar to those of theprevious rebate arrangements. The new arrangements, which took effect on 1January 1999, are estimated to cost the Commonwealth between$1.4 billion and $1.7 billion a year.
The legislation also includes provisions directed at reducing medical gaps.Under these provisions, health funds have until July 2000 to offer ‘no gaps’ or‘known gaps’. Funds that do not comply will be unable to provide their memberswith the 30 per cent rebate in the form of a premium reduction — the mostpopular means of accessing the rebate.
• The Health Legislation Amendment Act 1999 incorporated a number ofprovisions to give health funds greater flexibility in packaging health insuranceproducts — including amendments relating to discounts on contributions andloyalty bonus schemes.
• In the 1999–2000 Budget, the Government announced that a Lifetime HealthCover scheme will commence in July 2000. The aim of the scheme is toencourage people to maintain a lifetime commitment to private health insuranceand thereby to prevent opportunistic opting in and out of cover. Specifically, thenew arrangements provide for lifetime community rating of premiums, withthose not taking out private health insurance by the age of 30 facing a 2 per centpremium surcharge for every year’s delay thereafter. The surcharge is capped at70 per cent. Those born on or before 1 July 1934 are automatically entitled tocover at base rates. The National Health Amendment (Lifetime Health Cover)Bill 1999 to give effect to the new arrangements was passed by the Senate inSeptember 1999.
The government has supported these financial measures with ‘public education’campaigns.
THE REGULATORYAND LEGISLATIVEENVIRONMENT
71
Other Commonwealth regulation
Second tier and default insurance benefits
Under provisions in the National Health Act 1953, Government legislated defaultbenefits are payable to insured patients treated in eligible private hospitals and dayfacilities that do not have an HPPA (or similar arrangement) with the health fundconcerned. To attract second tier default benefits, a hospital must be ableto demonstrate that it:
• has a simplified billing system in place;
• has a mechanism in place to inform patients of what expenses they are likely toincur;
• is quality accredited by either the Australian Council on Healthcare Standards,the International Standards Organisation, or other bodies agreed between thefund and the hospital; and
• meets quality criteria relating to the episode of care which the fund has specifiedin all HPPAs with comparable private hospitals.
Second tier benefits are set at 85 per cent of the average benefit paid by the fund forthe episode of care in all comparable private hospitals with which the fund has anHPPA (or similar arrangement), in the State/Territory in which the treatment isprovided.
If the health fund has no HPPAs in place in the State or Territory for that episode ofcare, or if the hospital fails to meet the second tier default criteria, then the basicdefault benefit is payable. This benefit, which is determined by the Minister forHealth and Aged Care, is a little over $200 a day, although it varies somewhatacross jurisdictions. Higher default benefits may apply for insured patients admittedto hospital in an emergency. As discussed in chapter 9, the default benefiteffectively determines accommodation charges for private patients treated in publichospitals.
Consumer information
As well as establishing a contracting framework for the private hospital industry,the Amendment Act 1995 includes consumer information provisions — the ‘PrivatePatients’ Hospital Charter’. Under these provisions, the Minister can issue astatement informing private patients what they can expect from the doctorsproviding their treatment, the hospital where the treatment is provided and their

72 PRIVATE HOSPITALSIN AUSTRALIA
health fund. The statement may also provide advice on matters relevant to aconsumer’s decision on whether to purchase private health insurance.
The Charter was first published in January 1996 and is currently under review. Arevised version, incorporating information on recent private health insurancechanges, is expected to be released in early 2000.
COMPETITION IN THEPRIVATE HOSPITALMARKET
73
7 Competition in the private hospitalmarket
As noted in chapter 3, competition in the private hospital market is significantlyinfluenced by the surrounding institutional arrangements:
• While private hospitals are in the business of providing services to patients,doctors generate much of that demand on behalf of their patients and healthfunds pay most of the bills for treatment on behalf of their contributors.Accordingly, hospitals must provide an environment in which doctors arewilling to treat their patients, and supply their services at a price which isattractive to the health funds. The latter requirement has become increasinglyimportant in recent years, with hospitals now having to compete for contractswith some of the funds.
• Private hospitals also compete with public hospitals — both directly for someprivate patients and indirectly through the availability of free treatment to publicpatients in the public system.
This chapter examines the nature of competition within the private hospital industryand, in particular, the relationships between the hospitals, doctors and the healthfunds. It also draws attention to a number of policy questions that arise from theanalysis, which are explored further in the final chapter of the report. The finalchapter also looks at some of the policy questions that arise in relation tocompetition between public and private hospitals.
7.1 The relationship between private hospitals anddoctors
While doctors are not generally involved in the day to day management of privatehospitals, they are an integral part of what hospitals do and how they operate:
• Doctors, typically in some form of group arrangement, own a significant numberof private hospitals.
• More importantly, in consultation with their patients, doctors determine whetherhospitalisation is required and, often, in which hospital treatment is provided.For example, a 1997 survey indicated that doctors determined the institution
74 PRIVATE HOSPITALSIN AUSTRALIA
used for 64 per cent of admissions (Quints and Marks 1997). This explains whyprivate hospitals will sometimes go to great lengths to attract and retain doctors’patronage.
Hospitals compete for the custom of doctors in a number of ways.
Perhaps most importantly, hospitals use the quality of their facilities and equipmentas a way of attracting doctors. Some have termed this the hospital ‘arms race’ (seebox 7.1).
Box 7.1 Some views on the hospital arms race
Private hospitals told the Commission that doctors are continuously seeking newequipment so they can undertake more advanced surgical procedures. Even ifinvestment in such equipment is not justified on normal commercial grounds, hospitalmanagement must take into account the risk of losing the business of its doctors if itdoes not agree to their requests.
The economics of Intensive Care Units (ICUs) provide a good illustration of these sortsof trade-offs. It is apparently difficult for private hospitals to make money directly out ofICUs. However, they are needed for surgery back-up. Hospitals therefore often viewthem as ‘loss leaders’ to attract the best doctors doing the most advanced procedures.
A number of hospitals pointed to the downsides of this form of competition betweenhospitals for doctors, noting the potential for wasteful duplication of equipment,particularly in the major cities.
Source: Discussions with private hospital operators.
Location can also provide a private hospital with an edge in attracting doctors. Inparticular, co-location of a private and a public hospital allows doctors to treat theirpublic and private patients on the same site (see box 7.2). But some stand-aloneprivate hospitals also have a competitive edge because of their location. Theoperator of a private hospital in Sydney, for example, pointed to the benefits thatcome from the hospital’s location at both a catchment area crossroads and close totwo public teaching hospitals.
Further, private hospitals can influence demand for their services by cultivatingrelationships with medical practitioners. In this regard, one new private hospital saidthat senior hospital representatives had visited numerous population centres in thecatchment area to ensure that general practitioners and specialists were aware of thenew hospital’s credentials.
COMPETITION IN THEPRIVATE HOSPITALMARKET
75
Box 7.2 The impact of co-located private and public facilities
New co-located private hospitals may cater for previously unmet demands, as well asdrawing business from the adjacent public hospital and other private hospitals.
Competitors of co-located hospitals said that it has proved difficult to compete againsttheir big drawcards for doctors of convenience and time savings. In this regard, smallerhospitals seem to be particularly vulnerable. One for-profit group said that the openingof a co-located private hospital would often result in 3 or 4 small hospitals closing.
These impacts have led some competitors to talk of ‘unfair competition’. For example,one private hospital raised questions about ‘special’ financial relationships between co-located private and public hospitals. And, the ACT Legislative Assembly held an inquiryinto the establishment of the co-located National Capital Private Hospital amidconcerns that the hospital would gain an unfair advantage from service contracts withCanberra (public) Hospital. (The ACT government argued that competition from thenew hospital would increase choice, service standards and efficiency in Canberra’sprivate hospital sector.)
Source: Discussions with private hospital operators.
Agreements between private hospitals and doctors
As described in chapter 6, the Amendment Act 1995 includes provisions forPractitioner Agreements (PAs) between hospitals and doctors which allow hospitalsto receive payments under Hospital Purchaser Provider Agreements (HPPAs) formedical services provided by those doctors.
Amongst other things, PAs are a vehicle for simplifying billing arrangements forpatients. Yet, to date, there has been little enthusiasm for them. This may havepartly reflected the provision under the original legislation that restrictedreimbursement to a hospital under an HPPA for treatment provided by a doctorcovered by a PA to the MBS fee. As described in section 6.2, that issue has nowbeen addressed through the 1998 amendments to the legislation which allow forpayments above the schedule fee. However, it is still too early to say whether theamended legislation will increase interest in PAs.
Implications for private hospitals
Given the integral nature of doctors to hospital services, private hospitals willstruggle to survive unless they can obtain and maintain the custom of doctors. Asdiscussed, to attract doctors, hospitals must provide acceptable terms of access,equipment and support staff. Also, the practices of doctors can have a significant
76 PRIVATE HOSPITALSIN AUSTRALIA
influence on a hospital’s financial performance. Thus, hospitals will sometimesneed to negotiate with doctors on the clinical services to be provided.
In cases where the practising doctors also own a hospital, any imbalance ofnegotiating power may be of little consequence. More generally, some of the largesthospitals may be able to negotiate with doctors in the knowledge they will not needto make concessions inimical to the hospital’s interests. For example, one religiousgroup said that the specialists who work in its hospitals tend to share its public-spirited values and are happy to be associated with the prestige teaching facilities.Similarly, a private hospital enjoying a regional monopoly will be in a strongernegotiating position than one operating in a market serviced by several providers.
That said, doctors will often be in a strong negotiating position — especially whendealing with small hospitals (see box 7.3). In this regard, one hospital manager saidthat his small hospital faced financial problems when its two regular surgeons tookholidays or attended conferences. But it is also the case for larger hospitals in someregional centres and metropolitan areas like Central/East Melbourne where thepopulation is not sufficient to fully support the available number of hospital beds.
Box 7.3 Views on the relationship between private hospitals anddoctors
One private hospital likened the relationship with its doctors and patients to travelagents making block bookings in hotels for tourists. The tourists (patients) have fairlylimited knowledge and rely on the agents (doctors) to sort out their accommodation.And hospitals, like hotels, rely on the agents to bring continuing business. If the oddtourist (patient) has an unpleasant stay at a hotel (hospital), this may not be a majorproblem. But the hotel (hospital) cannot afford to get the agents (doctors) offside asthey might take their business elsewhere.
One for-profit hospital group observed that hospitals have to work hard to keepdoctors, saying that ultimately they ‘just have to give doctors everything they want tokeep them sweet’. As noted, this can include purchasing high technology equipment.Another private hospital told of a plastic surgeon who wanted to perform a non-urgentoperation on a public holiday. Notwithstanding the additional financial cost for thehospital, it went along with the surgeon’s request because he supported the hospitalthroughout the year.
One large hospital that missed out on a contract with a major health fund noted howmuch more devastating it would be to lose the patronage of its doctors. Some hospitalsalso commented on the difficulties of dealing with doctors who spend much longer thanaverage in surgery, or who consistently use more consumables than average, or who‘waste’ prostheses.
Source: Discussions with private hospital operators.
COMPETITION IN THEPRIVATE HOSPITALMARKET
77
In one sense, the often strong negotiating position of doctors reflects their veryimportant role in the delivery of hospital services. In policy terms, an issue wouldonly arise if there was evidence that doctors were misusing their bargaining powerwhen dealing with the hospitals.
However, it is important to recognise that ‘misuse’ of market power could takeforms other than demanding overly generous access to hospital facilities, orexcessive equipment and staffing levels. For example, there would be legitimateconcerns if, by virtue of their strong bargaining positions, doctors were able toprovide sub-standard services without fear of challenge. This raises the question ofwhether enhanced clinical performance indicators would reduce the scope for anysuch problems to arise. And, there is the broader question of whether restrictions onthe number of training positions and access for overseas trained specialists areartificially enhancing the negotiating power of some doctors (see chapter 9).
7.2 The relationship between private hospitals andhealth funds
Given that the bulk of private hospital revenue comes from treating insured patients,negotiations between a hospital and the health insurance funds can have a crucialbearing on the hospital’s financial performance and its ongoing viability.Specifically:
• Negotiations will determine the rates a private hospital receives for variousservices provided to health fund members (such as accommodation and theatre),and for various patient types (advanced surgery, medical, obstetrics etc).Moreover, these rates will set charges for most self-paying patients.
• To secure contracts, hospitals may have to make changes to their servicedelivery. In particular, the funds can place significant pressure on hospitals toreduce costs and/or meet a range of quality requirements.
• Failure to obtain a contract from a health fund is likely to see many members ofthat fund seeking treatment in other, contracted, hospitals. As discussed inchapter 4, high occupancy levels are important for hospital profitability.
Importantly, there have been major changes in the contracting process in recentyears.
Until the mid-1990s, private hospitals typically set their charges on a cost-plus basiswith the health funds automatically passing on cost increases to members in theform of higher premiums. Moreover, the funds and hospitals worked together to sellthe ‘difference’ between private and public care. This contributed to the switch by
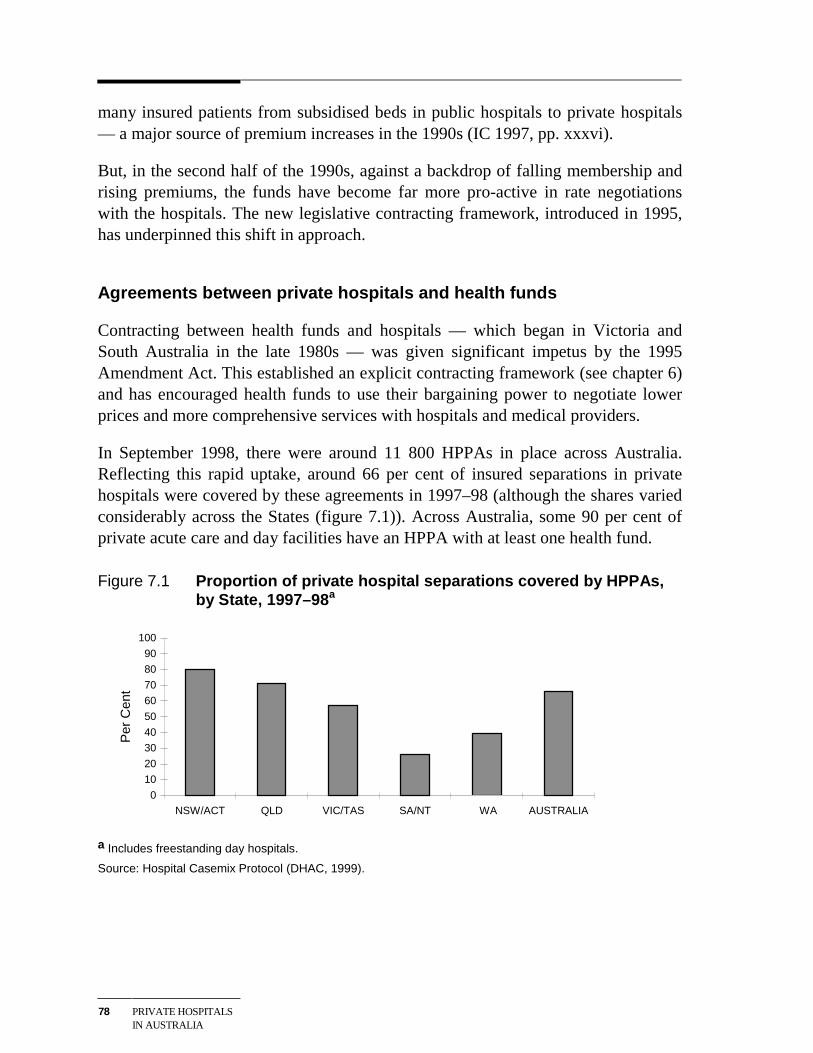
78 PRIVATE HOSPITALSIN AUSTRALIA
many insured patients from subsidised beds in public hospitals to private hospitals— a major source of premium increases in the 1990s (IC 1997, pp. xxxvi).
But, in the second half of the 1990s, against a backdrop of falling membership andrising premiums, the funds have become far more pro-active in rate negotiationswith the hospitals. The new legislative contracting framework, introduced in 1995,has underpinned this shift in approach.
Agreements between private hospitals and health funds
Contracting between health funds and hospitals — which began in Victoria andSouth Australia in the late 1980s — was given significant impetus by the 1995Amendment Act. This established an explicit contracting framework (see chapter 6)and has encouraged health funds to use their bargaining power to negotiate lowerprices and more comprehensive services with hospitals and medical providers.
In September 1998, there were around 11 800 HPPAs in place across Australia.Reflecting this rapid uptake, around 66 per cent of insured separations in privatehospitals were covered by these agreements in 1997–98 (although the shares variedconsiderably across the States (figure 7.1)). Across Australia, some 90 per cent ofprivate acute care and day facilities have an HPPA with at least one health fund.
Figure 7.1 Proportion of private hospital separations covered by HPPAs,by State, 1997–98 a
0
10
20
30
40
50
60
70
80
90
100
NSW/ACT QLD VIC/TAS SA/NT WA AUSTRALIA
Per
Cen
t
a Includes freestanding day hospitals.
Source: Hospital Casemix Protocol (DHAC, 1999).
COMPETITION IN THEPRIVATE HOSPITALMARKET
79
Who contracts with whom?
Many of the major health funds have contracted with nearly all private acute carehospitals in their areas of operation.
This partly reflects legislative provisions which limit the grounds for health fundsnot entering into contracts with hospitals. For example, failure to contract cannot bebased on the size of a hospital or its ownership.
More fundamentally, the funds have strong commercial incentives to contract with abroad range of hospitals. This is because failure to provide 100 per cent cover foraccommodation costs in popular hospitals would see many members shift to fundsthat did have contracts with those hospitals. Also, it is clear that the funds regardcontracting as a way of influencing the costs and quality of hospital services.
That said, commercial imperatives will not necessarily require a fund to enter intoHPPAs with all hospitals in its area of operation. This is illustrated by AXA HealthInsurance’s policy of excluding a proportion of hospitals from its contracts. AXAuses a competitive tendering process to select private hospitals with which it willcontract for 100 per cent cover (see box 7.4). In 1997–98, this process provided for100 per cent cover for some 70 to 80 per cent of private hospital beds in Victoriaand South Australia. Medibank Private and MBF also use a tendering approach.
Box 7.4 AXA’s Participating Provider Program
In response to falling private health insurance membership and lower occupancy ratesin private hospitals, AXA Health Insurance (then National Mutual) introduced theParticipating Provider Program in 1997. An important objective of the program is toimprove the value of health insurance to the fund’s members by ‘purchasing highquality health care services at an affordable price’. The Program involves:
• a move away from ‘the adversarial model of negotiating annual price increases withall hospitals’ towards a ‘cooperative model of creating longer term relationships withselect providers’;
• the use of a competitive process to select participating hospitals; and
• entering into agreements with medical providers or ‘medical purchaser provideragreements’ (see section 7.3).
The competitive tendering process consists of a number of stages including an‘invitation to tender’ and interviews. Eight criteria are used to assess tenders:location/demand; range of specialties; capacity; vision; performance; facilities; qualityand price. Hospitals need to achieve a minimum score for each criterion to be offered acontract.
Source: Discussions with AXA Health Insurance.
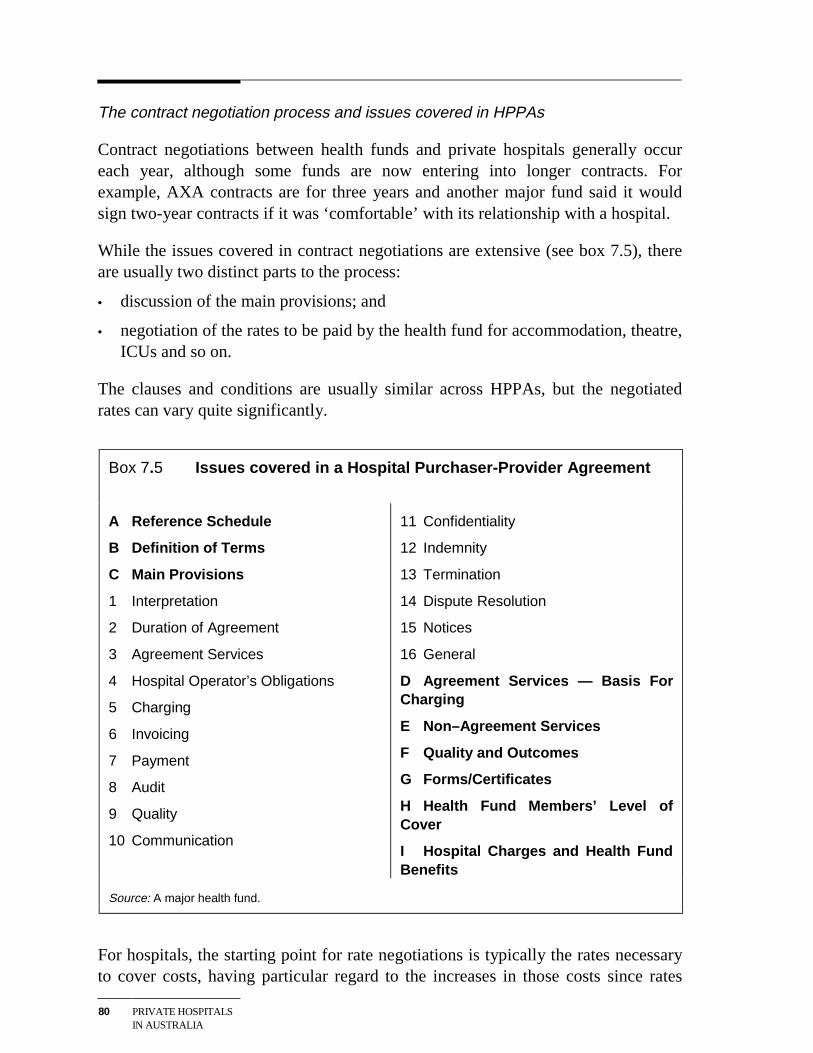
80 PRIVATE HOSPITALSIN AUSTRALIA
The contract negotiation process and issues covered in HPPAs
Contract negotiations between health funds and private hospitals generally occureach year, although some funds are now entering into longer contracts. Forexample, AXA contracts are for three years and another major fund said it wouldsign two-year contracts if it was ‘comfortable’ with its relationship with a hospital.
While the issues covered in contract negotiations are extensive (see box 7.5), thereare usually two distinct parts to the process:
• discussion of the main provisions; and
• negotiation of the rates to be paid by the health fund for accommodation, theatre,ICUs and so on.
The clauses and conditions are usually similar across HPPAs, but the negotiatedrates can vary quite significantly.
Box 7.5 Issues covered in a Hospital Purchaser-Provider Agreement
A Reference Schedule
B Definition of Terms
C Main Provisions
1 Interpretation
2 Duration of Agreement
3 Agreement Services
4 Hospital Operator’s Obligations
5 Charging
6 Invoicing
7 Payment
8 Audit
9 Quality
10 Communication
11 Confidentiality
12 Indemnity
13 Termination
14 Dispute Resolution
15 Notices
16 General
D Agreement Services — Basis ForCharging
E Non–Agreement Services
F Quality and Outcomes
G Forms/Certificates
H Health Fund Members’ Level ofCover
I Hospital Charges and Health FundBenefits
Source: A major health fund.
For hospitals, the starting point for rate negotiations is typically the rates necessaryto cover costs, having particular regard to the increases in those costs since rates

COMPETITION IN THEPRIVATE HOSPITALMARKET
81
were last fixed. For the health funds, the concern is to provide good hospitalcoverage for members while minimising increases in premiums.
Within this framework, a range of factors can influence outcomes (see box 7.6).However, the underlying driver will be the relative bargaining strength of the twoparties. As discussed in the next section, this is the subject of much discussion in theindustry.
Box 7.6 Factors determining private hospital rate outcomes
According to the industry, the rates negotiated between a private hospital and a healthfund will depend upon such factors as:
Hospital features and performance
• the standard of the hospital;
• the credibility of the hospital’s doctors;
• the hospital’s commitment to outcomes;
• benefits paid in the previous period;
• the hospital’s ALOS outcomes; and
• whether the hospital is achieving cost efficiencies.
Local market factors
• how dominant the hospital is in the local market;
• what is happening to levels of demand in the market; and
• whether the market is high or low cost in terms of the mix of treatments provided.
Health fund specifics
• the hospital’s patient volumes with the fund;
• how attractive the hospital is to the fund’s members;
• whether the hospital has complied with previous contracts; and
• the historical rates paid to the hospital and how those compare with the averagerates paid for that particular hospital type.
Source: Industry interviews.
Implications for private hospitals
There are widespread concerns in the private hospital industry about the currentcontracting process. Indeed, the private hospitals’ peak body, the Australian Private
82 PRIVATE HOSPITALSIN AUSTRALIA
Hospitals Association (APHA), has been advocating the development of a code ofpractice for contract negotiations between hospitals and the funds.
The hospitals’ primary concern is that the health funds have excessive bargainingpower and that the rates negotiated under HPPAs are insufficient to cover legitimatecost increases. They also contend that the funds have imposed unreasonablecontract clauses and employed inappropriate negotiation practices — for example,deferring contract re-negotiations, allegedly often for many months after thecontract expiry date.
In contrast, insurers have argued that the health funds need contracts with hospitalsas much as the hospitals need contracts with the funds. In particular, they contendthat funds must have contracts with sufficient hospitals to ensure adequategeographic and clinical coverage for their members. Also, the funds claim that therequirement for them to pay a legislated minimum default benefit for the treatmentof a member in a hospital not covered by an HPPA acts as an additional balancingforce in negotiations (see, for example, IC 1997).
Outside the industry, the Senate Committee (SCALC 1996) reviewing the currentcontracting legislation found that the health funds are generally in a much strongernegotiating position than the hospitals. In contrast, the ACCC (1999c) has expressedthe view that the balance of negotiating power will depend on the circumstancesinvolved.
But even if there was unanimous agreement on where the balance of negotiatingpower lies, determining what constitutes a misuse of that power would still bedifficult. This can be illustrated drawing on the following quotation attempting todefine market power in the private hospital industry:
The existence of market power can best be described by considering the position of thehospital. If acceptance of a price offered by a health fund places the hospital’s future injeopardy and not accepting a price offered by a health fund also places the hospital’sfuture in jeopardy, then the health fund has market power.’ (Herring Health andManagement in evidence to the ACCC 1999a).
Some would argue that threatening a hospital’s existence is a clear misuse of marketpower. But is it necessarily misuse of market power to force an inefficient hospitalto improve its performance or exit the industry? And how should the benefits toconsumers of lower premiums be set against reduced diversity of private hospitalservices? Moreover, as the ACCC (1998) noted in relation to an application by agroup of private hospitals to negotiate jointly with health funds (see section 7.4), itis not necessarily anti-competitive for the funds to use negotiating power for thepurposes of protecting their financial position.
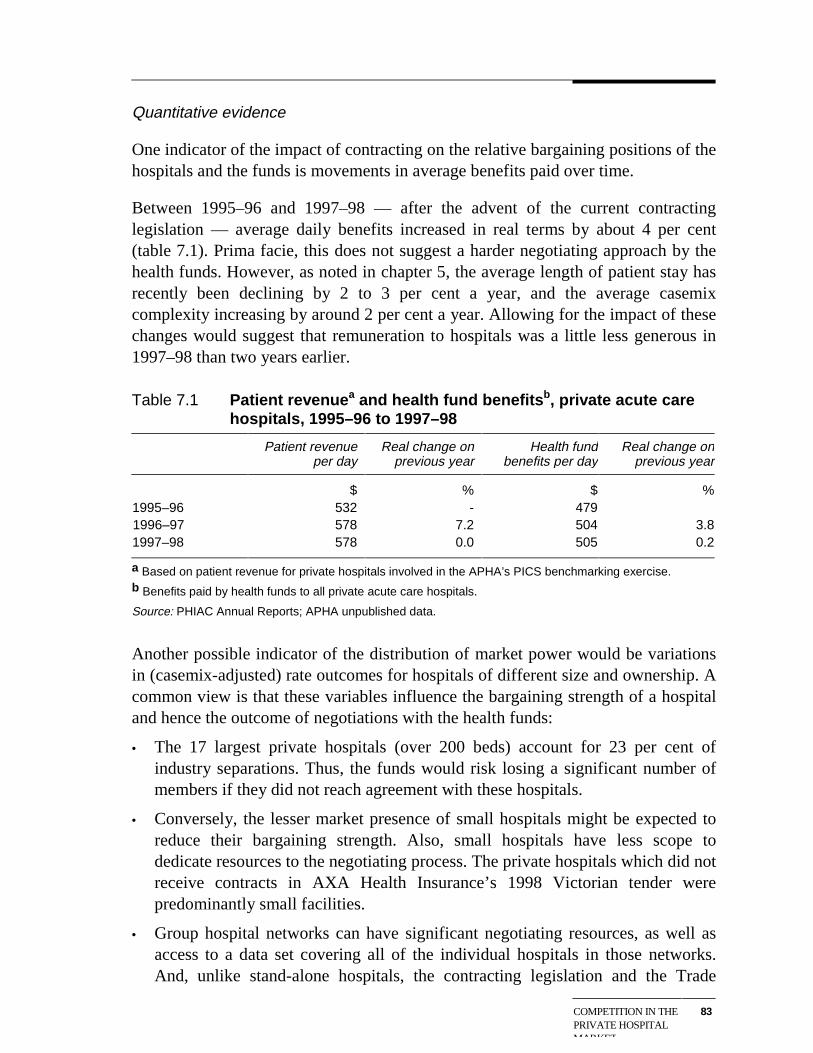
COMPETITION IN THEPRIVATE HOSPITALMARKET
83
Quantitative evidence
One indicator of the impact of contracting on the relative bargaining positions of thehospitals and the funds is movements in average benefits paid over time.
Between 1995–96 and 1997–98 — after the advent of the current contractinglegislation — average daily benefits increased in real terms by about 4 per cent(table 7.1). Prima facie, this does not suggest a harder negotiating approach by thehealth funds. However, as noted in chapter 5, the average length of patient stay hasrecently been declining by 2 to 3 per cent a year, and the average casemixcomplexity increasing by around 2 per cent a year. Allowing for the impact of thesechanges would suggest that remuneration to hospitals was a little less generous in1997–98 than two years earlier.
Table 7.1 Patient revenuea and health fund benefitsb, private acute carehospitals, 1995–96 to 1997–98
Patient revenueper day
Real change onprevious year
Health fundbenefits per day
Real change onprevious year
$ % $ %1995–96 532 - 4791996–97 578 7.2 504 3.81997–98 578 0.0 505 0.2
a Based on patient revenue for private hospitals involved in the APHA’s PICS benchmarking exercise.b Benefits paid by health funds to all private acute care hospitals.
Source: PHIAC Annual Reports; APHA unpublished data.
Another possible indicator of the distribution of market power would be variationsin (casemix-adjusted) rate outcomes for hospitals of different size and ownership. Acommon view is that these variables influence the bargaining strength of a hospitaland hence the outcome of negotiations with the health funds:
• The 17 largest private hospitals (over 200 beds) account for 23 per cent ofindustry separations. Thus, the funds would risk losing a significant number ofmembers if they did not reach agreement with these hospitals.
• Conversely, the lesser market presence of small hospitals might be expected toreduce their bargaining strength. Also, small hospitals have less scope todedicate resources to the negotiating process. The private hospitals which did notreceive contracts in AXA Health Insurance’s 1998 Victorian tender werepredominantly small facilities.
• Group hospital networks can have significant negotiating resources, as well asaccess to a data set covering all of the individual hospitals in those networks.And, unlike stand-alone hospitals, the contracting legislation and the Trade
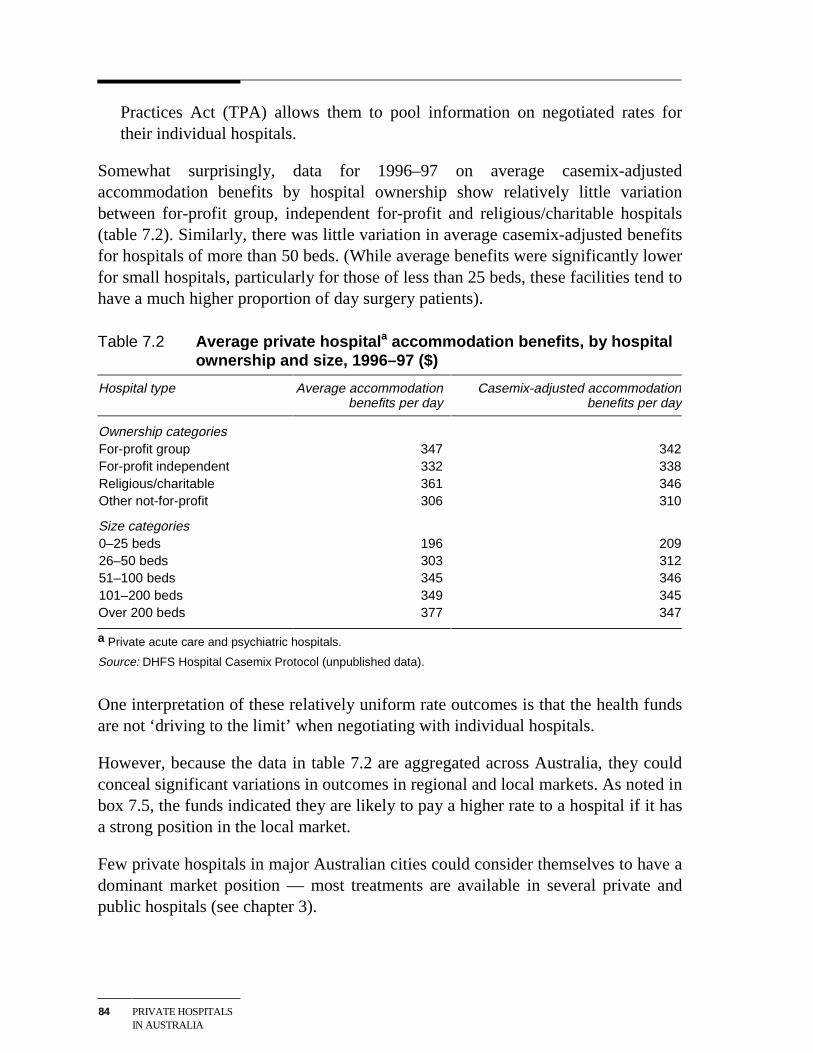
84 PRIVATE HOSPITALSIN AUSTRALIA
Practices Act (TPA) allows them to pool information on negotiated rates fortheir individual hospitals.
Somewhat surprisingly, data for 1996–97 on average casemix-adjustedaccommodation benefits by hospital ownership show relatively little variationbetween for-profit group, independent for-profit and religious/charitable hospitals(table 7.2). Similarly, there was little variation in average casemix-adjusted benefitsfor hospitals of more than 50 beds. (While average benefits were significantly lowerfor small hospitals, particularly for those of less than 25 beds, these facilities tend tohave a much higher proportion of day surgery patients).
Table 7.2 Average private hospitala accommodation benefits, by hospitalownership and size, 1996–97 ($)
Hospital type Average accommodationbenefits per day
Casemix-adjusted accommodationbenefits per day
Ownership categoriesFor-profit group 347 342For-profit independent 332 338Religious/charitable 361 346Other not-for-profit 306 310
Size categories0–25 beds 196 20926–50 beds 303 31251–100 beds 345 346101–200 beds 349 345Over 200 beds 377 347
a Private acute care and psychiatric hospitals.
Source: DHFS Hospital Casemix Protocol (unpublished data).
One interpretation of these relatively uniform rate outcomes is that the health fundsare not ‘driving to the limit’ when negotiating with individual hospitals.
However, because the data in table 7.2 are aggregated across Australia, they couldconceal significant variations in outcomes in regional and local markets. As noted inbox 7.5, the funds indicated they are likely to pay a higher rate to a hospital if it hasa strong position in the local market.
Few private hospitals in major Australian cities could consider themselves to have adominant market position — most treatments are available in several private andpublic hospitals (see chapter 3).
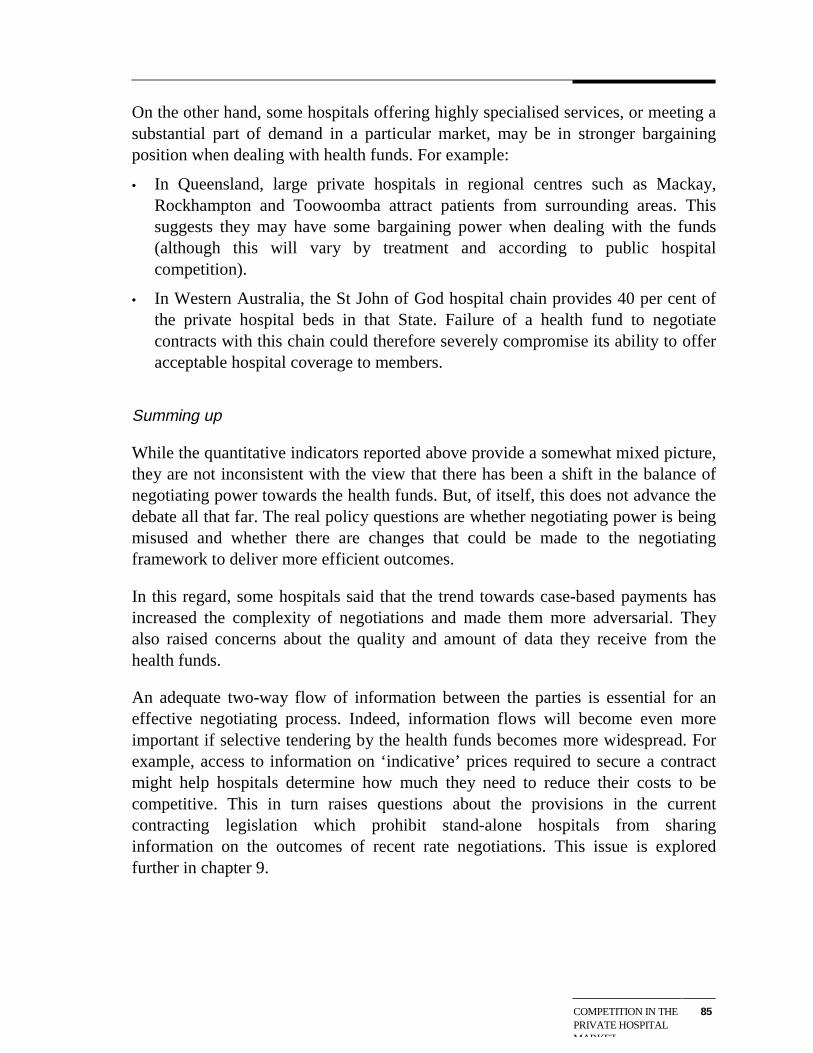
COMPETITION IN THEPRIVATE HOSPITALMARKET
85
On the other hand, some hospitals offering highly specialised services, or meeting asubstantial part of demand in a particular market, may be in stronger bargainingposition when dealing with health funds. For example:
• In Queensland, large private hospitals in regional centres such as Mackay,Rockhampton and Toowoomba attract patients from surrounding areas. Thissuggests they may have some bargaining power when dealing with the funds(although this will vary by treatment and according to public hospitalcompetition).
• In Western Australia, the St John of God hospital chain provides 40 per cent ofthe private hospital beds in that State. Failure of a health fund to negotiatecontracts with this chain could therefore severely compromise its ability to offeracceptable hospital coverage to members.
Summing up
While the quantitative indicators reported above provide a somewhat mixed picture,they are not inconsistent with the view that there has been a shift in the balance ofnegotiating power towards the health funds. But, of itself, this does not advance thedebate all that far. The real policy questions are whether negotiating power is beingmisused and whether there are changes that could be made to the negotiatingframework to deliver more efficient outcomes.
In this regard, some hospitals said that the trend towards case-based payments hasincreased the complexity of negotiations and made them more adversarial. Theyalso raised concerns about the quality and amount of data they receive from thehealth funds.
An adequate two-way flow of information between the parties is essential for aneffective negotiating process. Indeed, information flows will become even moreimportant if selective tendering by the health funds becomes more widespread. Forexample, access to information on ‘indicative’ prices required to secure a contractmight help hospitals determine how much they need to reduce their costs to becompetitive. This in turn raises questions about the provisions in the currentcontracting legislation which prohibit stand-alone hospitals from sharinginformation on the outcomes of recent rate negotiations. This issue is exploredfurther in chapter 9.
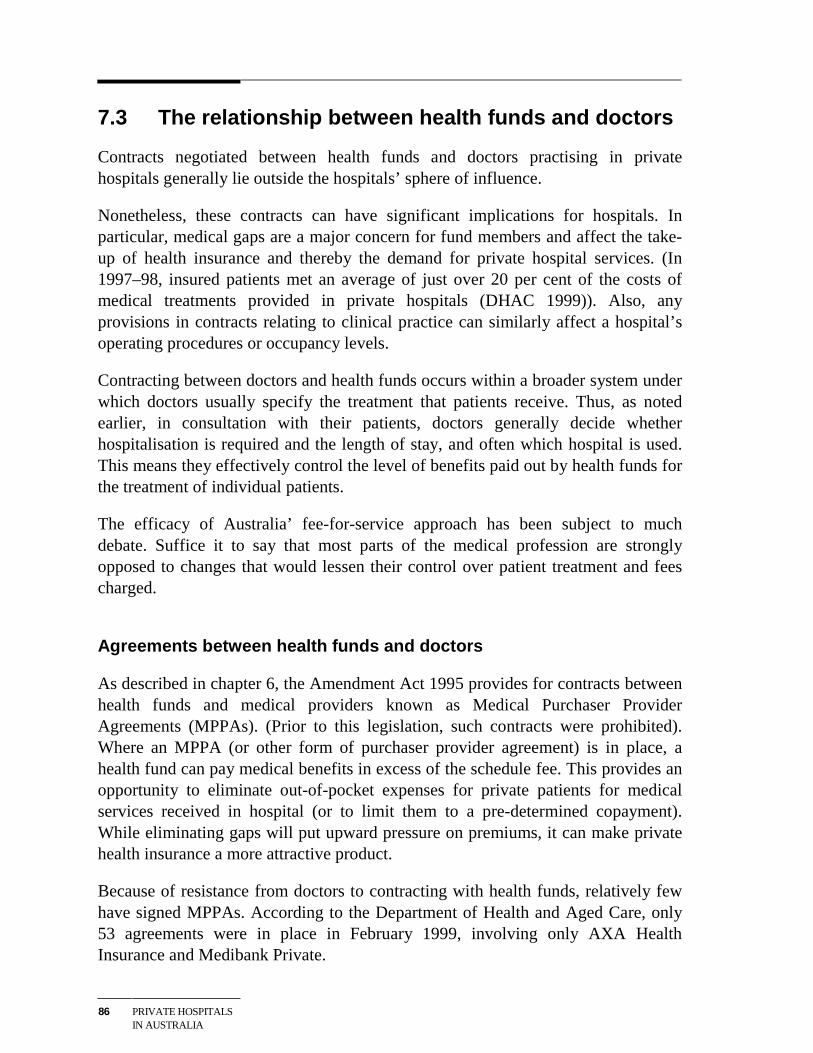
86 PRIVATE HOSPITALSIN AUSTRALIA
7.3 The relationship between health funds and doctors
Contracts negotiated between health funds and doctors practising in privatehospitals generally lie outside the hospitals’ sphere of influence.
Nonetheless, these contracts can have significant implications for hospitals. Inparticular, medical gaps are a major concern for fund members and affect the take-up of health insurance and thereby the demand for private hospital services. (In1997–98, insured patients met an average of just over 20 per cent of the costs ofmedical treatments provided in private hospitals (DHAC 1999)). Also, anyprovisions in contracts relating to clinical practice can similarly affect a hospital’soperating procedures or occupancy levels.
Contracting between doctors and health funds occurs within a broader system underwhich doctors usually specify the treatment that patients receive. Thus, as notedearlier, in consultation with their patients, doctors generally decide whetherhospitalisation is required and the length of stay, and often which hospital is used.This means they effectively control the level of benefits paid out by health funds forthe treatment of individual patients.
The efficacy of Australia’ fee-for-service approach has been subject to muchdebate. Suffice it to say that most parts of the medical profession are stronglyopposed to changes that would lessen their control over patient treatment and feescharged.
Agreements between health funds and doctors
As described in chapter 6, the Amendment Act 1995 provides for contracts betweenhealth funds and medical providers known as Medical Purchaser ProviderAgreements (MPPAs). (Prior to this legislation, such contracts were prohibited).Where an MPPA (or other form of purchaser provider agreement) is in place, ahealth fund can pay medical benefits in excess of the schedule fee. This provides anopportunity to eliminate out-of-pocket expenses for private patients for medicalservices received in hospital (or to limit them to a pre-determined copayment).While eliminating gaps will put upward pressure on premiums, it can make privatehealth insurance a more attractive product.
Because of resistance from doctors to contracting with health funds, relatively fewhave signed MPPAs. According to the Department of Health and Aged Care, only53 agreements were in place in February 1999, involving only AXA HealthInsurance and Medibank Private.
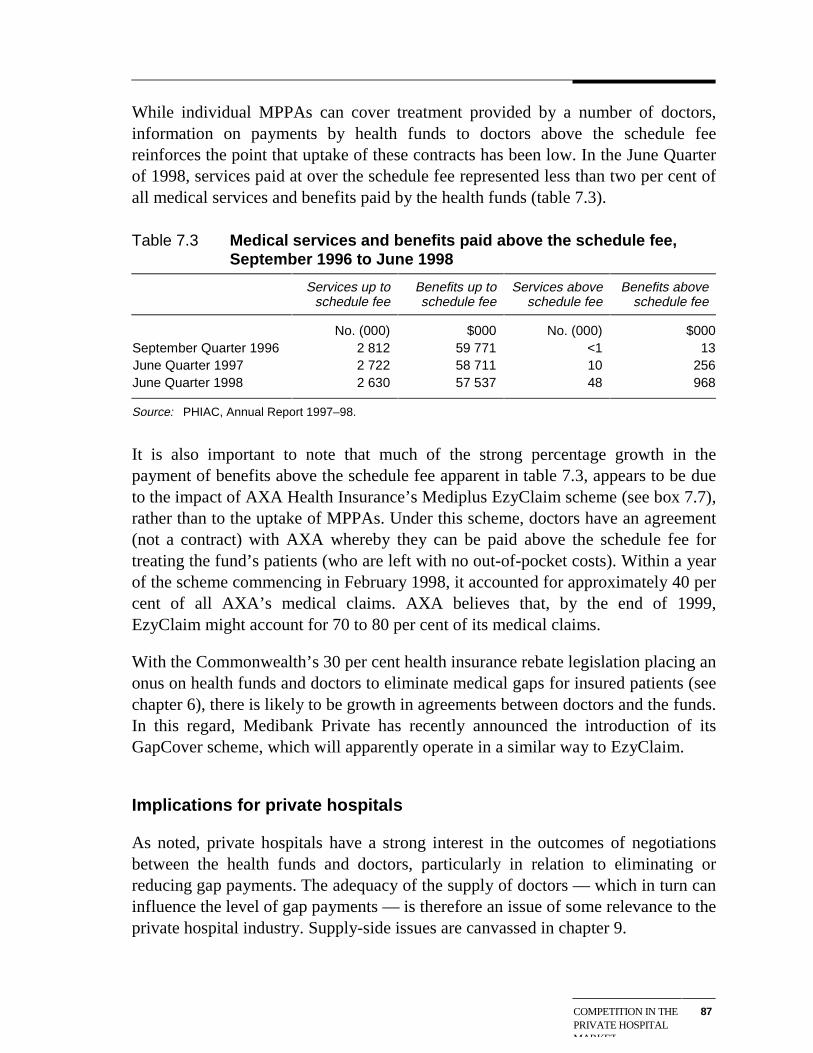
COMPETITION IN THEPRIVATE HOSPITALMARKET
87
While individual MPPAs can cover treatment provided by a number of doctors,information on payments by health funds to doctors above the schedule feereinforces the point that uptake of these contracts has been low. In the June Quarterof 1998, services paid at over the schedule fee represented less than two per cent ofall medical services and benefits paid by the health funds (table 7.3).
Table 7.3 Medical services and benefits paid above the schedule fee,September 1996 to June 1998
Services up toschedule fee
Benefits up toschedule fee
Services aboveschedule fee
Benefits aboveschedule fee
No. (000) $000 No. (000) $000September Quarter 1996 2 812 59 771 <1 13June Quarter 1997 2 722 58 711 10 256June Quarter 1998 2 630 57 537 48 968
Source: PHIAC, Annual Report 1997–98.
It is also important to note that much of the strong percentage growth in thepayment of benefits above the schedule fee apparent in table 7.3, appears to be dueto the impact of AXA Health Insurance’s Mediplus EzyClaim scheme (see box 7.7),rather than to the uptake of MPPAs. Under this scheme, doctors have an agreement(not a contract) with AXA whereby they can be paid above the schedule fee fortreating the fund’s patients (who are left with no out-of-pocket costs). Within a yearof the scheme commencing in February 1998, it accounted for approximately 40 percent of all AXA’s medical claims. AXA believes that, by the end of 1999,EzyClaim might account for 70 to 80 per cent of its medical claims.
With the Commonwealth’s 30 per cent health insurance rebate legislation placing anonus on health funds and doctors to eliminate medical gaps for insured patients (seechapter 6), there is likely to be growth in agreements between doctors and the funds.In this regard, Medibank Private has recently announced the introduction of itsGapCover scheme, which will apparently operate in a similar way to EzyClaim.
Implications for private hospitals
As noted, private hospitals have a strong interest in the outcomes of negotiationsbetween the health funds and doctors, particularly in relation to eliminating orreducing gap payments. The adequacy of the supply of doctors — which in turn caninfluence the level of gap payments — is therefore an issue of some relevance to theprivate hospital industry. Supply-side issues are canvassed in chapter 9.
88 PRIVATE HOSPITALSIN AUSTRALIA
Box 7.7 AXA Health Insurance’s Mediplus EzyClaim scheme
Mediplus EzyClaim is a ‘no medical gap’ scheme that allows specialists to bill anynumber of claims to AXA at an agreed rate. It was established in December 1997 withthe first trials commencing in February 1998, supported by the National Association ofObstetricians and Gynaecologists.
EzyClaim operates on a doctor-by-doctor basis with no interference from the healthfund in the doctor-patient relationship. Participating doctors can choose whether tocharge a patient under EzyClaim or outside the scheme. AXA evaluates what totalpayment for a particular procedure will be attractive to most doctors, and then paysdoctors the difference between that rate and the Medicare payment of 75 per cent ofthe schedule fee.
EzyClaim has widespread clinical coverage including cardiac surgery and obstetrics.However, the fund said it still prefers to have pathology and radiology providerscovered by MPPAs as it is important that all members are assured of no gaps in theseareas.
Source: AXA Health Insurance (personal communication).
It is also important to note that the often strong negotiating position of doctors whendealing with the funds may have flow-on effects for contracts between the hospitalsand the funds. A case in point is the way that the funds have sought to address thecontrol that doctors have on the volume of hospital admissions and thus on the totalbenefits payable for private hospital services. In essence, the funds have looked toindirectly limit patient volumes by constraining payments to hospitals. For example:
• Medibank Private places volume caps on total benefit payments for services insome hospitals. If a hospital exceeds the cap, Medibank Private reduces the dailybenefit on extra services to the basic default level.
• The selective hospital tendering process adopted by some funds is partly aimedat reducing total benefit payments by limiting the number of hospitals able tooffer 100 per cent hospital cover to fund members.
Such ‘external influences’ on contracts between health funds and private hospitalsare likely for as long as fee-for-service arrangements for doctors continue todominate.
7.4 The Trade Practices Act and the ACCC
As noted in chapter 6, contracting in the private hospital industry must also complywith the relevant provisions of the TPA. In particular, the formation of hospitals ordoctors into negotiating groups is not allowed under the Act, although the ACCC

COMPETITION IN THEPRIVATE HOSPITALMARKET
89
can authorise joint negotiating arrangements that reduce competition if it judgesthem to be in the public interest. The ACCC has previously recognised the‘promotion of equitable dealings in the market’ as one potential public benefit.
Prima facie, authorisation of joint negotiations is a mechanism for giving privatehospitals more negotiating power in their dealings with health funds. But, as the1998 application by five Queensland private hospitals for authorisation of an inter-hospital agreement (see box 7.8) shows, this route is likely to be time consumingand uncertain in outcome.
The principal objectives of this agreement included:
• sharing and collective presentation of cost and price information;
• wider dissemination of cost reduction strategies amongst members; and
• increased efficiency of purchaser provider contracts entered into by members.
The proposed arrangement was similar to the approach taken by large hospitalnetworks, such as HCOA and Ramsay.
As set out in box 7.8, the ACCC changed its position on the application on threeoccasions. And, while ultimately granting a conditional authorisation for theproposed agreement, it has attached conditions that, amongst other things, limit thecapacity of the five hospitals to share price information.
Whatever the merits of this particular application, it points to the differentialimpacts of the TPA across ownership structures. Group hospital networks have asignificant advantage over stand alone private hospitals because their integratedownership means they can share information (including on rates) in their dealingswith health funds, without any TPA concerns. This issue is canvassed further in thefinal chapter.
7.5 Other competitive aspects of the private hospitalmarket
Competition between private hospitals for patients
While the fortunes of private hospitals depend heavily on their ability to attractdoctors and to secure workable contracts with health funds, there is still some scopefor them to compete directly for patients.
90 PRIVATE HOSPITALSIN AUSTRALIA
Box 7.8 Application to the ACCC for an inter-hospital agreement
In June 1998, the Friendly Society Private Hospital Bundaberg, St Stephen’s PrivateHospital Maryborough, St Andrew’s Private Hospital Toowoomba, St Andrew’s WarMemorial Hospital Brisbane and the Wesley Hospital Brisbane applied to the ACCC forauthorisation of an agreement which would permit them to:
• exchange fee and non-fee related information; and
• establish a common agent to facilitate the exchange of aggregated data and toassist in the negotiation of HPPAs.
In support of their application, the five hospitals submitted that the exchange ofinformation would allow them to improve efficiency and service quality, and that acommon agent would assist in redressing an imbalance of negotiating power betweenhealth funds and the individual hospitals. They also argued that the agreement wouldnot result in a substantial lessening of competition.
The health funds argued against authorisation, principally on the grounds that there isno imbalance in negotiating power between hospitals and the funds, and that theexchange of price-related information is contrary to the Amendment Act 1995.
In an initial draft determination in December 1998, the ACCC concluded that theproposed agreement would not substantially lessen competition and would assist thehospitals to improve their efficiency and quality of service. The ACCC also said therewould be public benefit in the provision of countervailing negotiating power to thehospitals. It granted a draft authorisation for five years, subject to certain conditions(ACCC 1998).
However, following a subsequent pre-decision conference in February 1999 and taking
account of further submissions, the ACCC reversed this decision in a second draft
determination (ACCC 1999b). It said that, in the light of the additional input, it was
concerned that the agreement would not deliver a public benefit sufficient to outweigh
its anti-competitive effects.
In its final determination in September 1999, the ACCC again modified its position. Itsaid that for the purposes of the determination it had revised its definition of therelevant markets and concluded that the proposed conduct would not result in asubstantial lessening of competition in either the hospital-patient or private hospital-health insurer markets. The ACCC did, however, argue that some aspects of theproposed arrangement could potentially negate the arrangement’s public benefits. Ittherefore granted a conditional authorisation for three years. Some of the attachedconditions will restrict the sharing of price information by the five hospitals (ACCC1999c).
Source: ACCC 1998, 1999a,b,c.
Notably, such competition is not normally price-based. For insured patients, chargesare usually set by the contracts negotiated with health funds. Those negotiated rates
COMPETITION IN THEPRIVATE HOSPITALMARKET
91
also have a strong influence on charges for the relatively small number of self-paying patients. Indeed, health funds generally discourage hospitals from offeringdiscounts to self-paying patients (see appendix A).
However, around one-third of patients decide the hospital in which they will receivetreatment (Quints and Marks 1997). Hence, hospitals can compete for customthrough marketing their:
• location and thereby ease of access for patients and their visitors;
• facilities;
• range of services and procedures;
• prestige and reputation; and/or
• contracts with health funds.
In many respects, the way hospitals compete for patients is little different from theway they compete for the custom of doctors. Just as hospitals expend resources tomarket themselves to specialists and general practitioners, they will often seek toinform potential patients about their services and facilities. In some cases, this willinvolve advertising in the media. In others, it will involve a lower key approach. Forexample, one small for-profit surgical hospital in Victoria told the Commission thatit markets itself to the general public through letter box drops. It went on to say thatthis marketing takes on a different dimension around Christmas when the fewsurgeons who bring in the bulk of business take leave. At this time of the year, thehospital more actively seeks medical and respite care patients.
Competition between private and public hospitals
In 1997–98, some 19 per cent of insured private patients across Australia receivedtheir treatment in public hospitals (AIHW, Australian Hospital Statistics, 1997–98).Prima facie, this suggests that there is considerable competition between the twohospital sectors in the treatment of private patients.
However, views differ on the actual extent of such competition.
Some consider that private and public hospitals operate in largely different markets.They contend that the focus of the public system is on treating the acutely andseriously ill and those with chronic conditions, whereas the focus of the privatesystem is on treating those with less-urgent clinical needs, including electivesurgery. (See, for example, Hall 1999). Some go on to argue that insured patientswill usually seek to avoid public hospital waiting lists for non-urgent treatments byusing the private hospital system. To support this point, they note that a significant
92 PRIVATE HOSPITALSIN AUSTRALIA
proportion of private patients treated in public hospitals initially enter as‘emergency’ patients and/or receive treatments not available in nearby privatefacilities.
But while there is a much greater emphasis on elective treatments in privatehospitals, this does not mean there is no competition for private patients with publichospitals. Many private hospitals are now offering services and treatments that werepreviously only available at major public teaching hospitals. Thus, insured patientsand/or their doctors will often have a choice of hospital provider. One result hasbeen that the public sector’s share of the private patient market has been decliningsteadily (19 per cent of insured separations in 1997–98 compared with 36 per centin 1993–94).
The commonality in the leading DRG groups for insured patients treated in publicand private hospitals is another indication of the scope for some competitionbetween the two sectors. As indicated in table 7.4, four of the top 10 DRGs forinsured patients are common to public and private acute care hospitals.
Table 7.4 Top 10 DRGs by number of insured separations, private acutecare hospitals and private patients in public hospitals, 1996–97
Private acute care hospitals Private patients in public hospitals
332 Gastroscopy (non–digestive diseases) 678 Post abortion diagnoses335 Colonoscopy 572 Renal dialysis780 Chemotherapy 332 Gastroscopy (non–digestive diseases)572 Renal dialysis 335 Colonoscopy674 Vaginal delivery 943 Other factors influencing health status099 Lens procedures 349 Oesophagitis, gastroent & mdd421 Knee procedures 353 Digestive system diagnoses128 Dental extractions & restorations 674 Vaginal delivery843 Major affective disorders 941 Rehabilitation484 Skin, subcut. tissue & breast procedures 939 Aftercare of malignancy
Source: DHFS, Hospital Casemix Protocol 1996–97 (unpublished data).
Overall, there is little doubt that there is competition between private and publichospitals for some private patients. And, any extension of current initiatives tocontract out the delivery of some public patient services to private hospitals could,in future, lead to greater competition between the two sectors. Such competitionraises a number of issues in relation to the application of the competitive neutralityprinciples specified in the National Competition Policy. These issues are discussedin chapter 9.
DRIVERS OF DEMAND 93
8 Broad drivers of demand for privatehospital services
The fortunes of individual private hospitals will depend on a range of sector-specific factors discussed in previous chapters, including their location andfacilities, their capacity to attract doctors, and their cost efficiency.
However, there are also two groups of broader factors that will influence overalldemand for private hospital services:
• policy factors such as the level of funding for the public hospital system, andregulatory and policy arrangements affecting the cost and quality of privatehospital services and the affordability of private health insurance; and
• non-policy drivers of demand such as income levels and dispersion, populationgrowth and the age structure of the population, and technological capacity.
This chapter looks at some of the key non-policy drivers of demand for privatehospital services. Some of the more important policy-related influences on demandare canvassed in the final chapter.
8.1 Income growth and distribution
It is widely accepted that health services are ‘luxury’ goods meaning that, asincomes rise, spending on these services increases more than proportionately. Oneconsequence is that spending on health care as a proportion of GDP tends toincrease over time:
• Expenditure on health services in Australia is currently equivalent to around 8.5per cent of GDP. This share is 10 per cent higher than a decade ago, and almost50 per cent higher than in 1971 (AIHW, Australia’s Health, various years).
• While inflation in health costs over and above the general rate of inflation helpsto explain some of this growth in expenditure share, there has also been asignificant increase in consumption of health care services. Between 1975–76and 1995–96, real per capita expenditure on health care rose by around 2.2 percent a year (AIHW Australia’s Health, 1998), compared with an average
94 PRIVATE HOSPITALSIN AUSTRALIA
increase in real per capita income of around 1.5 per cent a year over the sameperiod.
Some commentators have suggested that the luxury good status of health careprimarily reflects the impact of increases in government spending rather thanspending by individuals. In this regard, Richardson and Robertson (1999) arguethat:
… personal income elasticities are very low… While poorly articulated in the literaturethere is clearly an ‘institutional income effect’ which operates through the growth ofbudgetary allocations to health authorities that are roughly improportional to incomegrowth and adjusted upwards or downwards by either a ‘betterment’ or an ‘efficiency’factor. (p. 350)
But this is not to deny the possibility that future increases in income may lead toproportionately larger increases in non-government spending on private hospitalservices. This is particularly the case given the significant discretionary componentof many private hospital treatments — some treatments may be genuinely optionalfrom a health perspective, while in other cases, treatment at some personal cost in aprivate hospital is a way of avoiding queues in the public hospital system, oraccessing a higher standard of accommodation.
The increasing share of health care expenditure going to private hospital servicesover the last decade serves to illustrate this point. Between 1984–85 and 1995–96,expenditure on private hospital services as a share of total recurrent expenditure onhealth care rose from 5.6 to 8.2 per cent (AIHW, Australia’s Health, 1998, p. 167).Moreover, the ABS (1995) found that high income households were five times morelikely to have private health insurance than those on low incomes. This suggeststhat, other things equal, income growth may lead to higher health fund membershipand thereby greater use of private hospital services.
At the same time, the impacts of income growth on the demand for private hospitalservices are likely to depend partly on how that growth is dispersed across thepopulation:
• There is evidence to suggest that income growth over the past twenty years inAustralia has been concentrated at the upper end of the income distribution.(See, for example, Harding 1997). Many higher income earners will alreadyhave private health insurance. Thus, if the recent pattern of income growthcontinues, the resulting increase in demand for private hospital services is likelyto be lower than if income growth were more evenly distributed across thepopulation.
• Against this, incomes of older people have been increasing faster than for thepopulation generally (Whiteford and Bond 1999). Factors such as greater
DRIVERS OF DEMAND 95
superannuation coverage and higher female workforce participation are likely tosee this trend continue in the future. As discussed below, older Australians arethe highest users of the health care system. Hence, any improvement in theirrelative income status is likely to result in proportionately higher spending onprivate hospital and other health care services.
8.2 Population growth and ageing
Two aspects of demographic change are of particular relevance to demand forhealth care services in general and private hospital services in particular.
First, and most obviously, population growth will increase demand for theseservices. While an unremarkable observation in an aggregate sense, the preciseeffects of population growth will depend on the composition and distribution of thatgrowth. For example, the availability of private hospital services is significantlylower in rural and regional areas than in the major cities (see chapter 2). Hence, themore any overall increase in population is focussed in rural and regional areas, thesmaller may be the total increase in demand for private hospital services. Similarly,population growth associated with migration may have less of an impact on demandfor hospital services than natural population growth — at least in the short tomedium term. Apart from the hospital services often involved in child birth, the firstyear or so of life is usually a period of relatively high usage of health care services.
Second, in common with most other developed countries, Australia’s population hasbeen ageing over the last 25 years. This has seen a change in the age profile of thepopulation with a larger proportion of Australians aged 45 and older. If, asexpected, this trend continues, by the middle of the next century the majority ofAustralians could be older than 50 and a significant proportion older than 70(McDonald and Kippen 1999).
The impact of ageing on the demand for health services has been the subject ofconsiderable debate.
Some — for example, the National Commission of Audit (1996) — have suggestedthat the effect will be very significant. Such views are premised on the observationthat per capita health expenditures rise significantly from about the age of 65. In thisregard, Commission estimates based on AIHW hospital usage data show that the percapita number of patient days in private hospitals in the 75 and over age cohort ismore than 2.5 times that in the 55–64 cohort. And even in the 65–74 cohort, percapita usage is nearly 60 per cent higher than in the 55–64 cohort. Similarly,consultants to a recent review of NSW Health by the Independent Pricing and
96 PRIVATE HOSPITALSIN AUSTRALIA
Regulatory Tribunal indicated that people aged over 65 are 4.5 times more likely torequire a hospital stay than those under 65. (IPART 1998, p. 78)
But other commentators suggest that, of itself, increased longevity is likely toreduce per capita expenditures on health care services in the older age cohorts. Theycontend that the period of highest health expenditure for individuals is usually thelast few years of their lives. In this regard, US statistics indicate that, on average, 40per cent of health expenditures are in the last two years of life with 30 per cent inthe last year alone (Fuchs 1984). The implication is that, outside of this two-yearsunset period, the major impact of increased longevity on health care expenditure isto delay the onset of the period of high expenditure.
Modelling by Richardson and Robertson (1999), which makes adjustments for thiseffect, suggests that the impact of ageing on health care expenditures may be quitesmall (see box 8.1). Indeed, Richardson and Robertson conclude that:
Application of the simple needs model suggests that the impact of future ageing on theneed for medical services will be so small that, in the absence of other factors, the sizeof the health sector would diminish in relation to GDP. (p. 348)
Prima facie, there is some tension between the assumption underlying thisconclusion — namely that greater longevity will reduce per capita health careexpenditures in older age cohorts — and the increase in these expenditure levels inrecent years. (As noted in box 8.1, the Richardson and Robertson modellingindicates that there would be a substantial increase in the health expenditure shareof GDP if the recent growth in expenditure levels in the older age cohortscontinues).
However, there is widespread agreement that recent increases in expenditure onhealth care services in the older age cohorts have reflected a number of factorsadditional to the ‘pure ageing’ effect. In particular:
• Improvements in treatments used primarily by older people — for example,better joint replacement therapies and prostheses — are likely to haveencouraged greater spending on health care and hospital services by this agegroup. (The impact of technological change on demand is considered in the nextsection).
• Greater uptake of these treatments by older people will have been facilitated bytheir faster than average income growth in recent years (see above).
• Some have also suggested that supplier-induced demand has been a contributingfactor to higher per capita expenditures (see chapter 9).
More generally, these observations highlight the high degree of interaction betweenthe key non-policy drivers of demand for health care services.
DRIVERS OF DEMAND 97
Box 8.1 Estimating the impact of ageing on the demand for health careservices
Using a model made available through the Australian Private Hospitals Associationwebsite, Richardson and Roberts (1999) examined the impacts of ageing on healthcare expenditures under a number of different scenarios. Under each of the scenarios,adjustments were made to allow for reductions in per capita age cohort expendituresas a result of increased longevity (see text).
Amongst, other things, the modelling suggested that:
• If the only source of expenditure growth on health care was ageing of thepopulation, and holding GDP constant, expenditure as a percentage of GDP wouldrise from a little over 8 per cent to about 10.4 per cent in 2006 and to 11.8 per centin 2051.
• If population and GDP growth (ranging from 2.1 to 3.6 per cent a year) are added tothe ageing effect, expenditures on health care as a percentage of GDP woulddecline.
• If age cohort expenditures continue to grow, then total health care expenditure as apercentage of GDP could rise markedly in the next century. For example, under a‘limiting case’ scenario where expenditures in under 65 age cohorts continued togrow at the same rate as between 1981 and 1994, and those in the over 65 cohortsgrew at double their rate over that period, expenditure on health care as apercentage of GDP could be more than 20 per cent by 2051.
Richardson and Robertson went on to test their hypothesis that the pure effect ofageing on health care expenditures is quite small with reference to historical and crosssectional health care expenditure data for Australia and a number of other countries.They concluded that the results of these analyses also ‘… cast very significant doubton the belief that age/sex based need has been or will be a significant determinant ofdemand for health services’.
Source: Richardson and Robertson 1999.
8.3 Technological developments
Technological developments over the last few decades have greatly increased thecapacity to treat illness and disabling conditions.
Some of these have provided for completely new treatment options, for example:
• organ transplants;
• hip and knee replacements;
• micro-surgery; and
98 PRIVATE HOSPITALSIN AUSTRALIA
• gene therapy.
But equally important have been developments that have improved the safety oftreatments and the likelihood of successful outcomes. For instance, advances inanaesthetics have reduced the risk of most operations. And, perhaps even moreimportantly, there have been dramatic improvements in diagnostic techniques — forexample, the development of magnetic resonance scanners and better resolutionultrasound scanners.
While the benefits of these sorts of technological improvements have come at aconsiderable financial cost to patients and the community, some other developmentshave had the added bonus of reducing treatment costs. A case in point is minimalaccess surgery, performed through small incisions. Apart from involving less painfor patients, it facilitates shorter hospital stays and recovery times than traditionalsurgery methods. A range of procedures can be performed in this way, including theremoval of gall bladders and appendixes, bladder surgery, ulcer repair,hysterectomies, and bowel and knee operations. Similarly, advances inpharmacology have eliminated the need for surgery in the treatment of some formsof cancers and ulcers.
Such technological developments have had significant impacts on the level ofdemand for private hospital services:
• They have allowed private hospitals to offer a wide range of new and improvedtreatments.
• They have extended treatment options to a wider range of patients. For example,improvements in anaesthetics and diagnostic techniques, and the introduction ofminimal access surgery, have made it possible to treat increasingly frail olderpeople.
They have also been an important factor underlying the changing composition ofservices in the private hospital sector. For example, minimal access surgery andimproved lens procedures have been major contributors to the significant growth inday procedures (see chapter 2). In this regard, one CEO of a private hospitalcommented that:
New technology is providing a lot of opportunities, especially in day surgery. Daysurgery [now] accounts for 60 per cent of our patients ...
Looking to the future, technological change will undoubtedly continue to havesignificant impacts on the private hospital industry. While it is obviously impossibleto specify precisely what these impacts will be, it seems likely that futuredevelopments will underpin a continued shortening of treatment times and greater
DRIVERS OF DEMAND 99
demand for day procedures. This is particularly the case, given the more generaltrend away from institutionalised health care (see next section).
Such changes may, in turn, reduce the rate of growth in expenditure on hospital andother health care services. In this regard, Robertson and Richardson note that:
It should not … be assumed that the inflationary pressures from technologies of thepast will continue. Technology in the US is an endogenous variable and the US markethas been undergoing a significant shift from one which rewards cost creation to onewhich rewards cost cutting. (p. 350)
8.4 Community attitudes to health careChanging community preferences in regard to health care treatment and the effectsof health care education will be further broad influences on demand for public andprivate hospital services alike.
As noted, lengths of stay in hospitals have been decreasing and day surgery isgrowing rapidly.
While cost pressures and advances in technology may have been the primary driversof these changes, a concern to minimise time spent out of the home environment hasalso been a factor. Greater emphasis on home-based treatment has been very muchevident in palliative health care. But in areas like child birth, the trend to minimisetime spent in an institutional environment has also been apparent.
A greater emphasis on community and home-based services has also been evidentin the provision of medical care to the elderly. There is now a focus on the elderlybeing able to choose to live in a supportive environment that is as close to theirsocial and geographic community as possible (OECD 1996). Partly as a result ofthis, nursing homes are increasingly providing medical care that would previouslyhave been provided by the hospital sector.
A continuation of these sorts of developments will have obvious ramifications forthe nature and level of demand for private hospital services.
This will particularly be the case if governments move to integrate funding forvarious forms of community, aged and hospital care. In Australia and a number ofother developed countries, governments have begun to canvass funding optionswhich would allow people to move more easily between what are currently quiteseparate components of the care system.
Private health insurers are also beginning to look at similar sorts of initiatives. Forexample, three early discharge trials are currently being conducted in Victoria andSouth Australia. Each trial involves an agreement between the participating private
100 PRIVATE HOSPITALSIN AUSTRALIA
health insurers and hospitals to substitute outreach services for in-hospital care foran agreed daily benefit. The ultimate objective of these trials is to assess the scopeto extend private health insurance to cover clinically appropriate (and potentiallycheaper) alternatives to in-hospital care.
Health care education
Much health care education is designed to help individuals monitor and improvetheir state of health and thereby reduce their subsequent need to access ‘remedial’health care services. Examples include:
• the skin cancer awareness campaign initiated in the early 1980s. The programemphasises the importance of prevention and early detection and treatment ofmelanoma and other types of skin cancer;
• the provision of information on the role of nutrition and exercise in preventingosteoporosis;
• various anti-smoking campaigns; and
• the campaign emphasising the importance of regular screening to assist earlydetection of breast and cervical cancer.
While successful campaigns of this sort will often reduce demand for privatehospital and other remedial health care services, this will not always be the case.For instance, skin cancer campaigns may encourage people to seek treatment forconditions that they would not previously have done so.
SOME FUTUREPOLICY ISSUES
101
9 Some future policy issues
The main aim of this report has been to describe the Australian private hospitalindustry and to look at some of the factors affecting its performance.
Some of these are beyond the power of governments to influence directly.Developments in medical technology and other non-policy drivers of demand forprivate hospital services as described in chapter 8, are cases in point.
But equally, future government health care policies and regulations governing theoperation of private hospitals will have a critical bearing on outcomes in theindustry. While it is not the purpose of this report to pronounce on what futurepolicy settings should be, the discussion in earlier chapters raises a range of issuesin relation to the current policy framework. This chapter explores a number of theseissues further.
9.1 Industry-specific issues
Licensing controls
Restrictions on the number of beds
As set out in chapter 6, planning controls in most States and Territories restrict thenumber of private hospital beds. There are several related rationales for thesecontrols, including:
• facilitating ‘orderly’ industry development, particularly through reducing thelevel of unused bed capacity in private hospitals;
• promoting equitable access to private hospital services;
• guarding against supplier-induced demand; and
• containing health care costs by limiting access to expensive, high technologyequipment.
However, questions arise in relation to all of these:
102 PRIVATE HOSPITALSIN AUSTRALIA
• In most markets, the possibility of substantial unused capacity is accepted as aprice worth paying for the efficiency benefits that usually come fromcompetition between suppliers.
• It seems unlikely that bed controls improve access to private hospital services in‘disadvantaged’ areas. The controls limit access in areas where demand forservices exceeds the number of beds made available through the planningprocess. However, it is not apparent why any such capping effect should bematched by improved access in those areas and regions that do not have theeconomic capacity to support the number of beds that would be allowed underthe planning controls. In this regard, a discussion paper released for the currentreview of Victoria’s Health Services and related Acts (see box 9.1) concludesthat bed licensing has manifestly failed to promote equitable access to privatehospital services in Victoria (HSPR 1999, p. 56).
• The supplier-induced demand hypothesis — which postulates that, in response toan increase in the total number of medical providers, individual providers willsupply more services to patients so as to maintain income levels or workloads —has been questioned by some commentators (see section 9.2). In any event,hospitals in their capacity as the providers of beds would seemingly have lessscope than doctors to influence levels of demand.
• As noted in the HSPR discussion paper (p. 56), there are now various marketpressures on private hospitals to contain costs. Indeed, the hospitals argue thatthe current market environment places undue pressure on their costs (see chapter7).
While the benefits of bed controls seem questionable, equally, the direct costs donot appear to be large. As noted in chapter 6, in some jurisdictions the value of abed licence is negligible, with the maximum cost of a licence in any individualjurisdiction being around $20 000. Using a discount rate of 10 per cent, this equatesto an annual ‘leasing’ cost of $2000 or less than 2 per cent of average revenue perbed. The implication of these low values is that, in most parts of Australia, thecontrols are not significantly reducing the available number of private hospital beds.
Moreover, trade in bed licences (see chapter 6) will mitigate any tendency of thecontrols to reduce efficiency in the delivery of private hospital services. In essence,a market for bed licences provides less efficient operators with financial incentivesto sell their licences to those who can deliver services more efficiently. That said, itwould be unrealistic to expect this mechanism to work perfectly — particularlygiven the significant role of not-for-profit hospitals.
In sum, the need to retain bed controls is far from clear. Significantly, the VictorianHealth Services Policy Review has proposed that this component of that State’s
SOME FUTUREPOLICY ISSUES
103
licensing arrangements be dismantled (see box 9.1). A number of other jurisdictionsare currently reviewing their licensing arrangements for private hospitals.
Box 9.1 Some proposals for legislative reform in Victoria
In March 1999, a review team commissioned to look at the Victorian Health Servicesand related Acts released a discussion paper. In accordance with National CompetitionPolicy legislative review requirements, the paper addresses a range of constraints oncompetition in public and private health care markets. Some of the key proposals in thepaper are set out below.
Planning controls: The Review argues that controls on the number of private hospitalbeds provide little or no benefit in terms of containing health care costs, ensuringequitable access to private hospital services, or limiting the market power of healthfunds. In contrast, it contends that the controls increase hospital costs by a smallamount and impede industry restructuring. It has proposed the controls be abolished.
Licensing of private hospitals: While supporting the need for licensing, the Reviewargues that many of the current requirements do not advance patient safety and canbe dealt with in other ways. It has proposed a simplified licensing regime.
Taxation of private hospitals: The Review argues that not-for-profit private hospitalshave an unfair competitive advantage over their for-profit counterparts by virtue of theirexemption from paying sales tax, payroll tax, land tax, local rates and charges, stampduty and financial transactions taxes. It has proposed that these exemptions end.
Competition between public and private hospitals: The Review documents a rangeof competitive advantages and disadvantages for public hospitals in treating privatepatients. It has proposed various measures to address these, including: requiringpublic hospitals to set commercial fees for private patients and removing controls whichcan prevent them from doing so; allowing public hospitals to retain private fee income;treating public and private hospitals equally for health insurance purposes; andremoving exemptions for public hospitals from input taxes. (The Review specifies that,as an adjunct to the last proposal, there should be increased funding for servicesprovided to public patients to offset the loss of input tax exemptions on those services.)
Day procedure private centres: The Review proposes that registration requirementsfor day procedure centres should be the same as for acute care private hospitals, andthat there should be a redefinition of what constitutes a centre.
Promoting consumer choice and confidence: The Review proposes: considerationbe given to establishing a 24 hour call centre in Victoria to provide health information toconsumers; the publication of risk-adjusted, clinical performance indicators for publicand private hospitals and day procedure centres; enhanced measures to guard againstsub-standard performance by health care providers; and giving consumers right ofaccess to their health care records.
Source: HSPR 1999.
104 PRIVATE HOSPITALSIN AUSTRALIA
Other licensing issues
During the Commission’s discussions with the industry, a number of concerns aboutother aspects of the licensing arrangements emerged, including:
• delays in the processing of licence variations, antiquated requirements andinconsistencies in requirements across jurisdictions. As set out in box 6.1, thesecan sometimes entail not insignificant costs for hospital operators;
• less restrictive inspection requirements for day procedure facilities than for acutecare hospitals. In this regard, the ACT Government (1998, p.8) said that:
Once a private day surgery facility has met the initial approval requirements of theDepartment, it is not subject to routine re-inspection unless required under other publichealth legislation ... Therefore, a day surgery facility could, while remaining in thesame premises, change its practices (eg from ophthalmology to plastic surgery) withoutever being subject to further clinical inspection. There is no mechanism to ensure thatclinical protocols, practices and the quality of patient care are being maintained andsuited to the procedures conducted. Private hospitals, by comparison are required to beinspected annually.
• restrictions limiting day procedure hospitals to treating patients who enter andexit the hospital on the same calendar day, rather than who are treated for lessthan 24 hours.
The Commission notes that the Victorian Health Services Policy Review hasproposed changes to align the registration procedures for acute care and day carehospitals, and to simplify licensing arrangements for private hospitals moregenerally (see box 9.1). Such initiatives may also be relevant to licensing regimes inother jurisdictions.
Taxation arrangements for private hospitals
The efficient delivery of goods and services will usually require that individualproviders are neither advantaged nor disadvantaged by government policies orregulations. The National Competition Policy embodies formal ‘competitiveneutrality’ requirements where government business activities compete with privatebusinesses. However, the underlying principles can be equally relevant tocompetition between private providers, or where the delivery of core governmentservices involves an element of competition with the private sector.
This section looks at some competitive neutrality issues raised by the different taxtreatment of particular types of private hospital. The broader competitive neutralityissues arising in relation to competition between public and private hospitals arecanvassed in section 9.2.
SOME FUTUREPOLICY ISSUES
105
Input tax exemptions
Exemptions from input taxes such as the Fringe Benefits Tax (FBT), payroll tax,sales tax and financial transactions taxes have given not-for-profit hospitals anadvantage over for-profit hospitals in competing for patients. Impending changes tosome of these taxes will reduce this advantage:
• The Goods and Services Tax (GST), to take effect from 1 July 2000, will beaccompanied by the abolition of sales tax and some financial transaction taxes.Services provided by private hospitals — whether for-profit or not-for-profit —will not generally attract the GST.
• Not-for-profit hospitals are to be subject to FBT, although a tax free thresholdfor fringe benefits provided to employees will apply.
Nonetheless, there is still the question of whether the remaining input tax exemptionadvantages for not-for-profit private hospitals are justified.
The major argument put in favour of exemptions is that they help not-for-profithospitals to provide a more caring environment and services to disadvantagedpatients, and to support other community services:
• Staffing levels are higher in not-for-profit hospitals than in for-profit facilities(see appendix tables B.22 and B.23), although it is not clear to what extent thesehigher levels translate to greater levels of care.
• Some religious groups said their hospitals provide a range of services for whichthere is no fee — services which governments would have to take over if the taxconcessions were abolished.
• Another religious group noted that not-for-profit hospitals contributesignificantly to community services such as aged care facilities.
The same sorts of arguments have been put for input tax exemptions for charitableinstitutions (see IC 1995) and not-for-profit nursing homes (see PC 1999a).
However, while the financial savings from the exemptions could be used to promotethese aims, they could also be used to compensate for inefficiencies in not-for-profithospitals. Alternatively, they could allow not-for-profit hospitals to increaseremuneration levels for staff, thereby giving these hospitals a competitive edge inattracting and retaining staff. In this regard, one for-profit group said that salarypackaging made possible by the current exemption from FBT potentially allowsnot-for-profit hospitals to set their nursing salaries 15 per cent higher than in for-profit hospitals. The Victorian Health Services Policy Review (1999, p. 64) said thatsalary packaging in the not-for-profit sector has been increasing with inflationaryeffects across the whole of the industry.
106 PRIVATE HOSPITALSIN AUSTRALIA
Assessing the extent to which input tax exemptions have been used to underwriteinefficiencies in not-for-profit hospitals, or to bolster their competitiveness againstthe for-profit sector, is well nigh impossible. While unit costs in the not-for-profitsector are generally higher than in the for-profit sector, determining the causes ofthese cost differences is difficult (see chapter 5).
Suffice it to say that input tax concessions create the potential for resourcemisallocation to arise. Reflecting this concern, the Victorian Health Services PolicyReview has proposed an end to input tax exemptions for not-for-profit privatehospitals (p. 64).
However, if support provided to not-for-profit organisations by input taxconcessions is significant and governments wish to continue that support, it may bedifficult to identify alternative mechanisms that do not involve even higherefficiency costs (IC 1995, pp. xxxv). And, as the Commission noted in its report onnursing homes, if the value of the exemptions is very small, even the administrativecosts of taking action to remove them might exceed the ensuing efficiency gains(PC 1999a, p. 101).
Aside from data on payroll tax payments by for-profit hospitals, informationindicating the value of the input tax concessions received by not-for-profit hospitalsis limited:
• Some years ago, Health Care of Australia estimated that input tax exemptionsreduced the total costs of not-for-profit hospitals by around 5 per cent (IC 1995).
• It appears that payroll tax exemptions would have accounted for about half ofthis cost reduction. According to unpublished ABS data, all but two of the 177for-profit hospitals paid payroll tax in 1996–97. The average tax paid as a shareof total hospital expenditure ranged from 2.1 per cent for the very largestfacilities to more than 3 per cent for some smaller and medium sized facilities(table 9.1).
As noted above, the introduction of the GST and the changes to FBT arrangementswill remove a significant part of the non-payroll tax component of the advantagecurrently enjoyed by not-for-profit private hospitals. This, in turn, suggests thatpayroll tax exemptions should be the focus of any future initiatives to address non-neutralities in the input tax treatment of the two sectors.
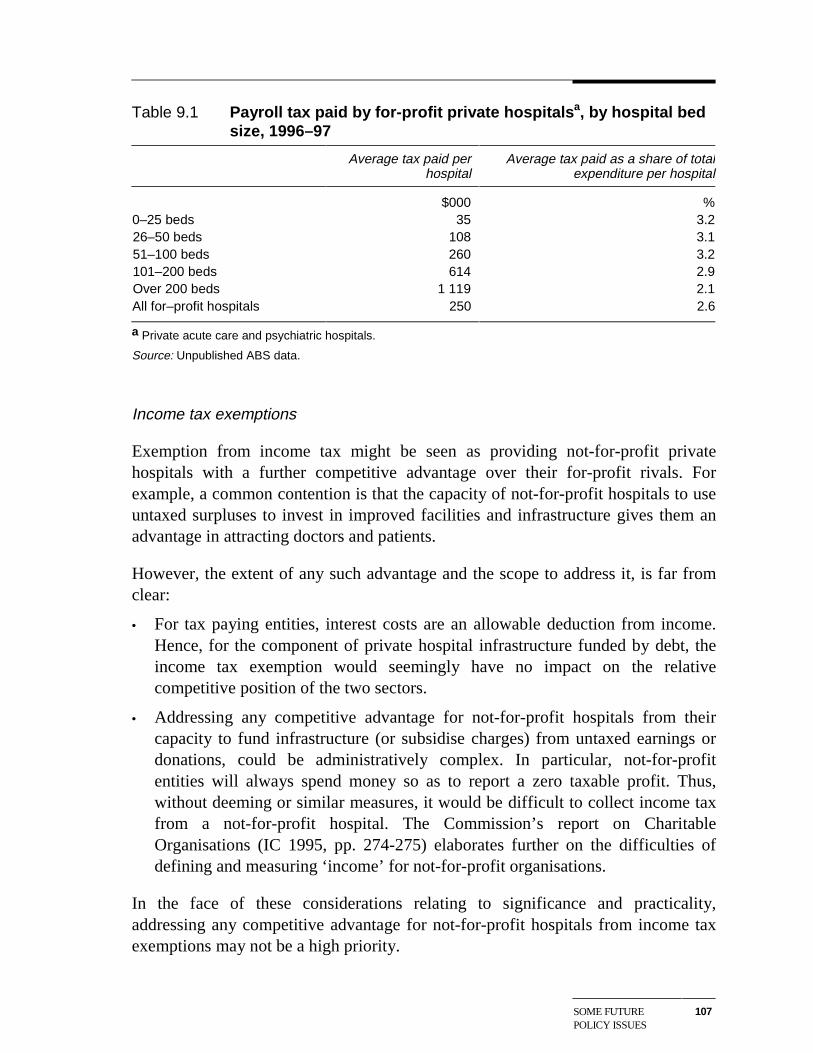
SOME FUTUREPOLICY ISSUES
107
Table 9.1 Payroll tax paid by for-profit private hospitalsa, by hospital bedsize, 1996–97
Average tax paid perhospital
Average tax paid as a share of totalexpenditure per hospital
$000 %0–25 beds 35 3.226–50 beds 108 3.151–100 beds 260 3.2101–200 beds 614 2.9Over 200 beds 1 119 2.1All for–profit hospitals 250 2.6
a Private acute care and psychiatric hospitals.
Source: Unpublished ABS data.
Income tax exemptions
Exemption from income tax might be seen as providing not-for-profit privatehospitals with a further competitive advantage over their for-profit rivals. Forexample, a common contention is that the capacity of not-for-profit hospitals to useuntaxed surpluses to invest in improved facilities and infrastructure gives them anadvantage in attracting doctors and patients.
However, the extent of any such advantage and the scope to address it, is far fromclear:
• For tax paying entities, interest costs are an allowable deduction from income.Hence, for the component of private hospital infrastructure funded by debt, theincome tax exemption would seemingly have no impact on the relativecompetitive position of the two sectors.
• Addressing any competitive advantage for not-for-profit hospitals from theircapacity to fund infrastructure (or subsidise charges) from untaxed earnings ordonations, could be administratively complex. In particular, not-for-profitentities will always spend money so as to report a zero taxable profit. Thus,without deeming or similar measures, it would be difficult to collect income taxfrom a not-for-profit hospital. The Commission’s report on CharitableOrganisations (IC 1995, pp. 274-275) elaborates further on the difficulties ofdefining and measuring ‘income’ for not-for-profit organisations.
In the face of these considerations relating to significance and practicality,addressing any competitive advantage for not-for-profit hospitals from income taxexemptions may not be a high priority.
108 PRIVATE HOSPITALSIN AUSTRALIA
Contracting frameworks
Contracting between hospitals and health funds
As discussed in chapter 7, private hospitals argue that the current contractingframework gives health funds too much bargaining power which they are using tounfairly reduce rates paid to hospitals. Apart from compromising their financialperformance, the hospitals contend that this pressure on rates has flow-ons for thequality of care they can deliver.
However, in the Commission’s view, there would be little merit in returning to anapproach which effectively allowed hospitals to automatically pass on costincreases to health funds and their customers. Rather, the more relevant policyquestion is whether the new contracting framework needs to be modified to producebetter outcomes for the community from the negotiating process.
In this regard, one aspect of the current policy framework that warrants furtherattention is the prohibition on private hospitals (other than those within the oneownership group) voluntarily sharing information on the outcomes of recent ratenegotiations. While this prohibition may help to prevent collusion betweenhospitals, it may also impose costs. For example, as discussed in chapter 7, some ofthe major health funds are no longer offering contracts to all private hospitals. Inthese circumstances, the sharing of information on prices may help individualhospitals determine what performance improvements are necessary to securecontracts. As the ACCC noted in relation to the application by the five Queenslandhospitals for authorisation of a joint negotiating agreement:
... the exchange of price related information may enable [the hospitals] to improve theiroverall cost efficiency (1999b, p. 50).
In effect, the current arrangements disadvantage stand-alone hospitals given thathospitals in the one ownership group can readily and legally share priceinformation.
As well as revisiting this aspect of the current legislative framework, there may alsobe value in implementing a voluntary code of conduct for rate negotiations betweenhospitals and the health funds. This could be a low cost way of ameliorating someof the hospitals’ concerns about the negotiating practices of the funds.
Contracting between hospitals and doctors
As the discussion in chapter 7 indicates, medical specialists have considerablepower in negotiations about their terms of access to private hospitals and the
SOME FUTUREPOLICY ISSUES
109
equipment a hospital purchases. Hospitals also have only limited scope to influencethe clinical practices of specialists operating on their premises.
An issue for future policy is whether this influence is excessive and impedesefficient hospital management. Such problems are more likely to arise if there areinadequate numbers of specialists. Some policy considerations pertaining to thesupply of medical specialists are discussed in section 9.2.
The Trade Practices Act
To guarantee they do not breach the price fixing provisions of the TPA, doctors andhospitals (or hospital groups) must negotiate with the funds on an individual basis.While the ACCC can authorise joint negotiations, the limited experience to date(see section 7.4) suggests that this may be a time consuming and uncertain process.
Also, like the current contracting legislation, the TPA gives group hospitals anegotiating advantage over stand-alone hospitals. This is because, for the purposesof the TPA, group hospitals are treated as single entities, thereby allowing them toshare information (including on rates) in their dealings with health funds, withoutrisking being in breach of the Act.
The impact of different ownership structures on the incidence of the TPA is not anissue for the private hospital industry alone. However, it may warrant considerationin a wider context. (See, for example, PC 1996, pp. 69–70).
Quality of service and consumer information issues
Traditionally, quality objectives in the private hospital industry have been pursuedprimarily through licensing requirements for hospitals and the professional staffworking in them. Word of mouth and the reluctance of doctors to treat patients insub-standard facilities also provided a discipline on quality. More recently, theaccreditation regime and the need for hospitals to secure contracts with health fundshave sharpened the incentives for them to provide quality services.
In some markets, benchmarking of service quality is used to complement explicitquality assurance mechanisms. For example, the Steering Committee for theReview of Commonwealth/State Service Provision collects and tabulatesperformance indicators for services such as education, health and justice (seeSCRCSSP 1999).
Such indicators can help individual providers identify areas where there is scope toimprove performance, as well as inform consumers about the quality of services
110 PRIVATE HOSPITALSIN AUSTRALIA
available. Increasing the capacity of consumers to make informed choices promotescompetition and thereby increases the onus on providers to operate efficiently andeffectively.
As discussed in chapter 5, performance indicators for the hospital sector generally,and private hospitals in particular, are at an early stage of development. Indeed,there are divergent views amongst some of the main players about the nature andform of appropriate indicators.
However, there is general recognition that better information on outcomes isrequired and that more information should be available to prospective patients andtheir families. To this end, there are a range of initiatives underway. For example, inaddition to the EQuIP clinical indicators and the Measures of Appropriate ClinicalCare project noted in chapter 5:
• a range of work has been undertaken or is in train for the National HospitalsOutcomes Program; and
• there have been various initiatives at the State Government level (see, forexample, HSPR 1999, chapter 11).
Those working in this area face many challenges in developing widely acceptedindicators. Part of the problem is that outcomes from hospital treatment must betargeted through clinical indicators of successful treatments and misadventures. Yet,even if these are tabulated for individual DRGs, differences in outcomes acrosshospitals can reflect variations in the complexity of cases rather than in clinicalpractice. Also, such indicators will not directly identify whether performancedifferences are attributable to the input of hospitals or of doctors, or even ofpatients.
To address these challenges, the Victorian Health Services Policy Review hasproposed that the Commonwealth and the States collaborate to develop a set of risk-adjusted clinical performance indicators (HSPR 1999, p. 137). Cross tabulatingresults for doctors who operate in several hospitals would potentially allowseparation of their contributions to observed outcomes from those of the hospitals.
Of course, developing better indicators is only the first step. There is the relatedquestion of how they should be used. In some states of the USA, for example, thereare published ‘scorecards’ for doctors and hospitals. And in the UK, ‘league tables’comparing various National Health Service facilities are now published (HSPR, pp.128–32).
While such scorecards have a number of attractions, they also have drawbacks.Apart from opposition from the medical profession who may become reluctant to
SOME FUTUREPOLICY ISSUES
111
treat high-risk patients, there is a problem in balancing the objective of simplicitywith the need for indicators to be meaningful. For example, a scorecard showing ahospital’s performance averaged across all treatments might provide littleinformation to a patient seeking cardiac treatment. Hence, published informationmay need to differentiate between procedures — a quite complex output for manyconsumers. Finding the right balance between simplicity and useful information willnot be easy. As part of this process, the Commonwealth Government’s ConsumerBenchmarking Project is aiming to provide consumers with information on thequality of both private hospital and health insurance products and services.
Another possible use of clinical indicators is to assist health funds, hospitals andhealth departments deal with sub-standard performance by doctors. This could buildon the peer review systems already in place in the private hospital industry. Thus,the Victorian Health Services Policy Review has raised the prospect that, where apractitioner’s results against clinical indicators are significantly below average, heor she could be counselled, required to undertake additional training, or evenprevented from performing certain procedures (HSPR 1999, p. 137). However,doctors have argued that such proposals amount to interference in the patient doctorrelationship and are a harbinger of ‘managed care’.
Future policy initiatives will need to be sensitive to these divides. But, at the sametime, such divides should not be allowed to jeopardise efforts to improveinformation on the quality of service provided in either the private or public hospitalsystems. Importantly, the absence of good information on service quality couldhamper broader initiatives to improve the delivery of hospital services throughinitiatives such as competitive tendering for the delivery of public patient services(see next section).
9.2 Some broader health policy issues
In addition to the sort of sector-specific issues discussed above, a range of broaderhealth care policies will influence future outcomes in the private hospital industry.Some of these — for example, funding for public hospitals and the generalframework for private health insurance — have been widely addressed in othercontexts, including by the Commission in its report on private health insurance (IC1997).
This section looks at two less widely canvassed health policy issues of relevance tothe private hospital industry — namely competition between the public and privatehospital systems and the supply of medical specialists. It also comments briefly on
112 PRIVATE HOSPITALSIN AUSTRALIA
the recent Commonwealth initiatives to encourage people to take out, or retain,private health insurance.
Competition between private and public hospitals
The principle of competitive neutrality discussed above in relation to competitionbetween different types of private hospital, is equally relevant to competitionbetween private and public hospitals.
Traditionally, competition between the two hospital sectors has mainly been forprivate patients.
However, the role of the private sector in treating public patients is increasing (seechapter 2). In some cases, this involves governments funding existing privatehospitals to deliver some public patient services. More recently, governments haveinvolved the private sector in the financing, construction and operation of newpublic patient facilities through BOO/BOOT type arrangements. In the future,competitive neutrality issues may arguably be more important in these areas than inthe delivery of services to private patients.
Competition for private patients
A number of regulatory/policy arrangements advantage public hospitals incompeting with private hospitals for private patients. For example:
• As discussed above, private hospitals face additional, though relatively small,costs from the bed licensing system. For-profit private hospitals also pay a rangeof taxes from which public hospitals are exempt.
• Accommodation charges for private patients in public hospitals have been set atlevels which have not generally covered costs. This is because charges higherthan the benefits paid by health funds — generally equal to the minimum defaultbenefit set by the Commonwealth of a little over $200 a day — would see manyof these private patients instead opt for treatment as public patients to avoid out-of-pocket costs. Suffice it to say that, on average, accommodation charges forprivate patients in public hospitals are only about half those in private hospitals,providing an incentive for self-paying private patients in particular, to seektreatment in public facilities.
Equally, public hospitals also suffer disadvantages in competing for private patients.For instance:
SOME FUTUREPOLICY ISSUES
113
• Their capacity to actively compete for private patients is constrained. Inparticular, they do not have access to capital market funding for refurbishment offacilities, in order to match the quality of facilities available in the private sector.And, they have not been allowed to give fee-paying private patients preferenceover public patients.
• The financial incentive for them to treat more private patients, or to seek tonegotiate accommodation benefits with health funds that more closely reflect thecosts of treating their private patients, may be limited. One concern is whetherhigher private patient income might lead to reduced levels of Commonwealthhospital funding. Also, unlike private hospitals, they cannot access thePharmaceutical Benefits Scheme for inpatients, meaning that the cost of drugtreatments provided to private patients must come from their general drugbudgets. (However, proposed Commonwealth arrangements which will extendPBS subsidies for pharmaceuticals provided by public hospitals to all non-admitted patients and to admitted patients on discharge, and for chemotherapydrugs provided to public and private day-only admitted patients, would partiallyaddress this disadvantage.)
The Commission’s report on Private Health Insurance (IC 1997) and the discussionpaper for the Victorian Health Services Policy Review elaborate on these and othercompetitive non-neutralities.
However, the pursuit of competitive neutrality in this area is likely to provecomplicated.
At a practical level, while public hospitals are the responsibility of the States andTerritories, some of the possible policy changes would have implications forMedicare arrangements and Commonwealth taxes. Hence, cooperation between theStates and the Commonwealth Government would be required.
More fundamentally, it is important that the pursuit of competitive neutralityobjectives has regard to the broader social goals underlying the operation of thepublic hospital system. For example, queue jumping by private patients in publichospitals would challenge a key tenet of the Medicare system, namely equity ofaccess to public hospital and other basic health care services. The need to temperefficiency goals with broader social considerations is the reason why the NationalCompetition Policy makes provision for a public interest test in determiningwhether to apply competitive neutrality policies to a particular market.
Yet in the absence of a major change to the raison de’etre of the public hospitalsystem, it is a moot point whether reforms that made it more financially attractivefor public hospitals to treat private patients would have a significant impact on their
114 PRIVATE HOSPITALSIN AUSTRALIA
private patient volumes. Similarly, the high proportion of private patients whoalready receive their treatment in private hospitals suggests that addressingcompetitive advantages currently enjoyed by public facilities may also have only alimited impact on the distribution of patients across the two hospital sectors.
Treatment of public patients by the private sector
As noted, the increasing role of the private sector in delivering public patientservices again raises the spectre of competitive neutrality. Indeed, failure to takeaccount of any significant non-neutralities is likely to confuse assessments ofwhether the public or private sector can deliver particular services more efficientlyand effectively.
The increasing role of the private sector in the delivery of public patient servicesalso puts a much greater premium on governments having access to goodinformation on the quality of services and clinical outcomes in both public andprivate hospitals. In addition, further research and evaluation of policyexperimentation will be necessary to help determine which forms of private sectorinvolvement are best suited to particular circumstances.
In this latter regard, the Victorian Health Services Policy Review compared andcontrasted a number of different approaches:
• opening up opportunities ‘at the margin’ for private operators to tender forpublic patient funding;
• opening up large parts of funding for public patients to competition (‘the corebusiness competition model’). The discussion paper identifies two variants ofthis option — wider application of the BOO/BOOT approach where capitalreplacement or augmentation is required, and shorter term contracting potentiallyinvolving the transfer of public infrastructure to the private sector; and
• allowing private operators to compete for the right to manage public facilities.(HSPR 1999, chapter 9).
The Review pointed to weaknesses in all of these approaches. In relation to thelarge scale tendering approach, it raised particular concerns about high transactionscosts and the need to ensure ‘that the public sector thrives as an alternative servicedelivery model’. It also argued that, in Victoria, a significant amount of competitionat the sub-contractor level occurs under current arrangements. The Review went onto conclude:
... we believe that there is insufficient evidence at this stage to support the wholesaletendering of public patient services in Victoria ... The next few years should providerich evidence of the success or otherwise of that model of service delivery as privately
SOME FUTUREPOLICY ISSUES
115
operated hospitals are established and placed under the social microscope. Further,tendering under that model should await the outcome of rigorous evaluation. (HPSR1999, p. 108).
Incentives to take out private health insurance
As set out in chapter 6, in the last few years, there have been severalCommonwealth Government initiatives to try to stem the flow away from privatehealth insurance. These have included rebates that have reduced the cost of privatehealth insurance and the introduction of lifetime community rating arrangements.By increasing the potential number of private hospital patients, these initiatives will,in turn, benefit the private hospital industry.
The lifetime community rating arrangements are broadly in line with proposals inthe Commission’s report on private health insurance (IC 1997). As noted in chapter6, the arrangements provide for higher premiums for those taking out healthinsurance later in life. As such, they will reduce hit and run entry to fundmembership, as well as the more general ‘adverse selection’ problems associatedwith the community rating of premiums. The latter has led to an ongoing cycle oflower risk consumers abandoning private health insurance, an increase in premiumsto reflect the higher risks of those continuing to hold insurance, leading to furtherdeclines in membership.
The latest rebate to those holding private health insurance is projected to costbetween $1.4 billion and $1.7 billion a year. Given the large budgetary costinvolved, it will be important for the government to monitor the impacts of therebate over time.
The supply of medical specialists
The supply of specialists has an important impact on outcomes in both the publicand private hospital systems. As well as influencing the cost of hospital services, theavailability of specialists influences access to services. Some of the particularimplications for private hospitals were described in chapter 7.
The supply of medical specialists is controlled in the first instance by limits on thenumber of training places in professional medical colleges. The colleges setnumbers of places having regard to such things as indicative specialist to populationratios and the availability of training places in teaching hospitals. There are alsorestrictions on the accreditation of specialists trained in other countries.
There are several rationales for these controls on supply, including to:
116 PRIVATE HOSPITALSIN AUSTRALIA
• ensure that specialists are appropriately qualified and trained;
• balance the number of trainees with the capacity of teaching hospitals to providethe necessary practical training; and
• guard against problems with over-servicing of patients, or so called supplier-induced demand.
However, there have been longstanding concerns that some of the colleges haveunduly restricted supply to increase specialists’ incomes and general bargainingpower. Paterson (1994) provided a range of evidence suggestive of such outcomesfor a number of the specialties at that time.
From a policy perspective, more research on supplier-induced demand seemsparticularly important. As well as providing a major rationale for arrangements thathave the potential to indirectly increase the cost of hospital services, the theory ofsupplier-induced demand influences policies in a number of other health care areas.
Yet the theory, and the supporting empirical evidence, remain controversial:
• Critics argue that conventional economic analysis can explain much of thesupplier-induced demand phenomenon. For example, Paterson (1994) contendsthat where consumers value medical services sufficiently to contribute to theircost, an expansion in services in response to increased numbers of suppliers maybe no more than the market operating efficiently to satisfy unmet demand.
• However, others argue that this line of reasoning depends on an assumption thatconsumers of medical services are well informed about their treatment needs.They go on to contend that if this is not the case, there is likely to be scope fordoctors to over-service, even when consumers are prepared to contribute to thecosts of their treatment.
In terms of future policy, the key issue may not be whether there is scope forsupplier-induced demand in the provision of medical services, but rather the extentto which it is a significant determinant of demand. It will also be important toestablish whether any observed ‘supplier-induced demand’ for particular servicescan be explained in terms of a normal market response to insurance rebates set atlevels which obviate the need for a patient contribution to the cost of treatment, asdistinct from a genuine market failure.
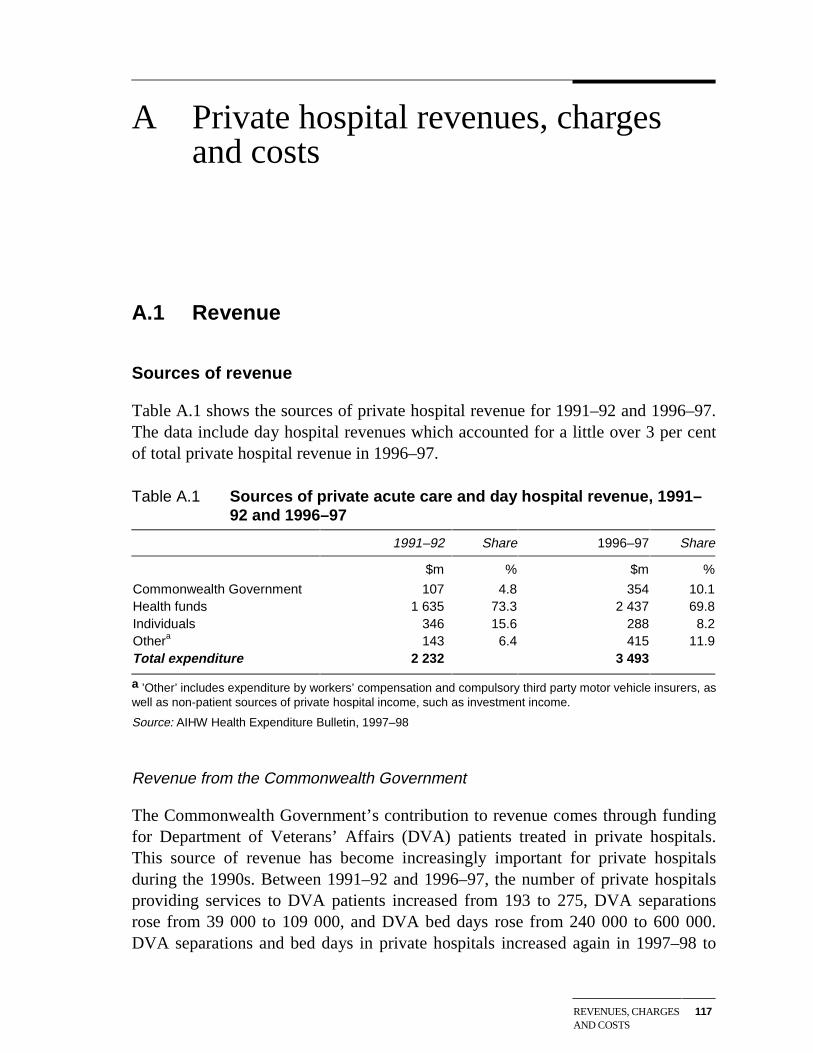
REVENUES, CHARGESAND COSTS
117
A Private hospital revenues, chargesand costs
A.1 Revenue
Sources of revenue
Table A.1 shows the sources of private hospital revenue for 1991–92 and 1996–97.The data include day hospital revenues which accounted for a little over 3 per centof total private hospital revenue in 1996–97.
Table A.1 Sources of private acute care and day hospital revenue, 1991–92 and 1996–97
1991–92 Share 1996–97 Share
$m % $m %
Commonwealth Government 107 4.8 354 10.1Health funds 1 635 73.3 2 437 69.8Individuals 346 15.6 288 8.2Othera 143 6.4 415 11.9Total expenditure 2 232 3 493
a ’Other’ includes expenditure by workers’ compensation and compulsory third party motor vehicle insurers, aswell as non-patient sources of private hospital income, such as investment income.
Source: AIHW Health Expenditure Bulletin, 1997–98
Revenue from the Commonwealth Government
The Commonwealth Government’s contribution to revenue comes through fundingfor Department of Veterans’ Affairs (DVA) patients treated in private hospitals.This source of revenue has become increasingly important for private hospitalsduring the 1990s. Between 1991–92 and 1996–97, the number of private hospitalsproviding services to DVA patients increased from 193 to 275, DVA separationsrose from 39 000 to 109 000, and DVA bed days rose from 240 000 to 600 000.DVA separations and bed days in private hospitals increased again in 1997–98 to
118 PRIVATE HOSPITALSIN AUSTRALIA
135 000 and 715 000, respectively (AIHW, Australian Hospital Statistics,1997–98).
Revenue from the health funds
The health funds are by far the largest contributors to private hospital revenue,accounting for some 70 per cent of total revenue in 1996–97. However, the healthfunds’ share of total revenue has declined somewhat during the 1990s, despite anincrease of over 50 per cent in the number of insured patients treated in privatehospitals.
Revenue from individuals
Payments made by individuals to private hospitals fall into two categories —copayments made by insured patients and payments by self-paying patients:
• DHFS data for 1996–97 indicate that gap payments by insured patientsrepresented around 6 per cent of hospital charges (DHFS, Hospital CasemixProtocol, 1996–97).
• Unpublished ABS data for 1996–97 indicate that self-paying patients accountedfor 4.3 per cent of private hospital patient days. If payments by this group ofpatients are broadly in proportion to their share of patient days, then they wouldhave accounted for about 4 per cent of private hospital revenue in 1996–97.
• The implied total contribution from individuals to revenue of 10 per cent isbroadly consistent with the 8.2 per cent share for individuals reported in tableA.1.
As shown in table A.1, payments by individuals to private hospitals fell in absoluteas well as share terms between 1991–92 and 1996–97. However, a significantincrease in gap payments in 1997–98 to around 7.7 per cent of total private hospitalcharges (DHAC 1999), suggests that total payments by individuals may well havegrown in the last couple of years.
Revenue from compensable patients
Growth in revenue from compensable patients was the major contributor to theincreased revenue share reported in table A.1 for the ‘other’ category. The numberof compensable separations rose from around 53 000 in 1991–92 to more than73 000 in 1997–98, an increase of close to 40 per cent (AIHW, Australian HospitalStatistics, 1997–98).
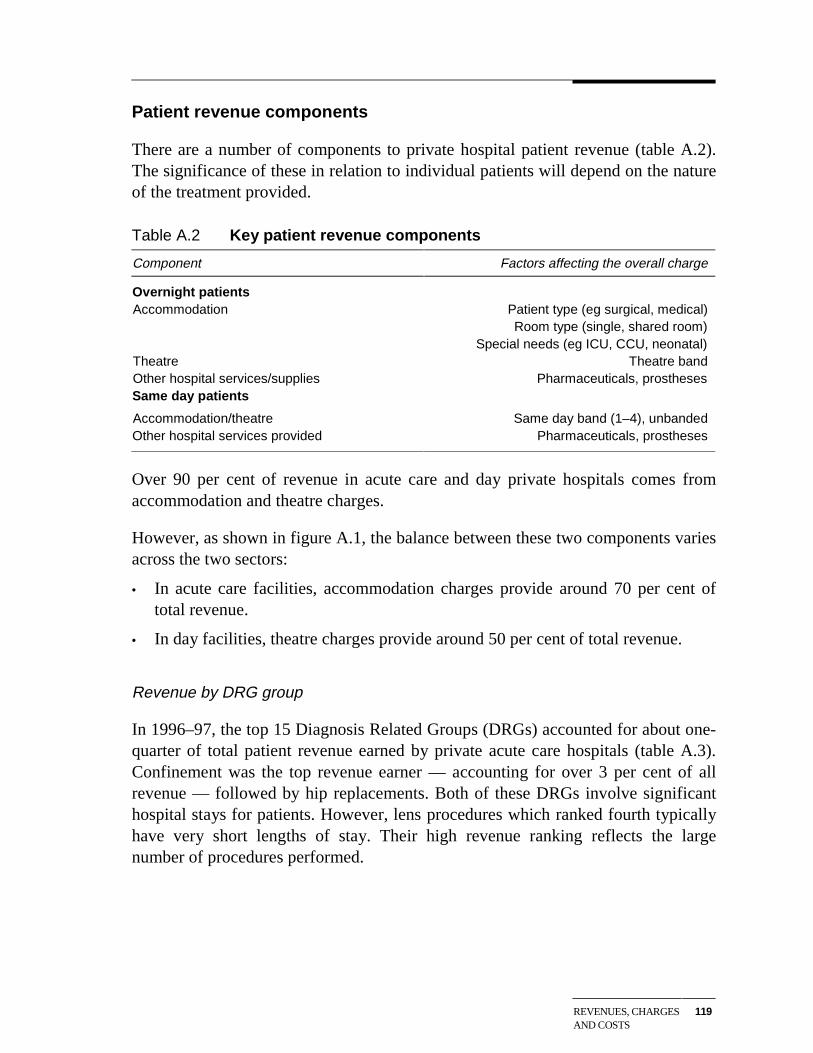
REVENUES, CHARGESAND COSTS
119
Patient revenue components
There are a number of components to private hospital patient revenue (table A.2).The significance of these in relation to individual patients will depend on the natureof the treatment provided.
Table A.2 Key patient revenue components
Component Factors affecting the overall charge
Overnight patientsAccommodation Patient type (eg surgical, medical)
Room type (single, shared room)Special needs (eg ICU, CCU, neonatal)
Theatre Theatre bandOther hospital services/supplies Pharmaceuticals, prosthesesSame day patients
Accommodation/theatre Same day band (1–4), unbandedOther hospital services provided Pharmaceuticals, prostheses
Over 90 per cent of revenue in acute care and day private hospitals comes fromaccommodation and theatre charges.
However, as shown in figure A.1, the balance between these two components variesacross the two sectors:
• In acute care facilities, accommodation charges provide around 70 per cent oftotal revenue.
• In day facilities, theatre charges provide around 50 per cent of total revenue.
Revenue by DRG group
In 1996–97, the top 15 Diagnosis Related Groups (DRGs) accounted for about one-quarter of total patient revenue earned by private acute care hospitals (table A.3).Confinement was the top revenue earner — accounting for over 3 per cent of allrevenue — followed by hip replacements. Both of these DRGs involve significanthospital stays for patients. However, lens procedures which ranked fourth typicallyhave very short lengths of stay. Their high revenue ranking reflects the largenumber of procedures performed.
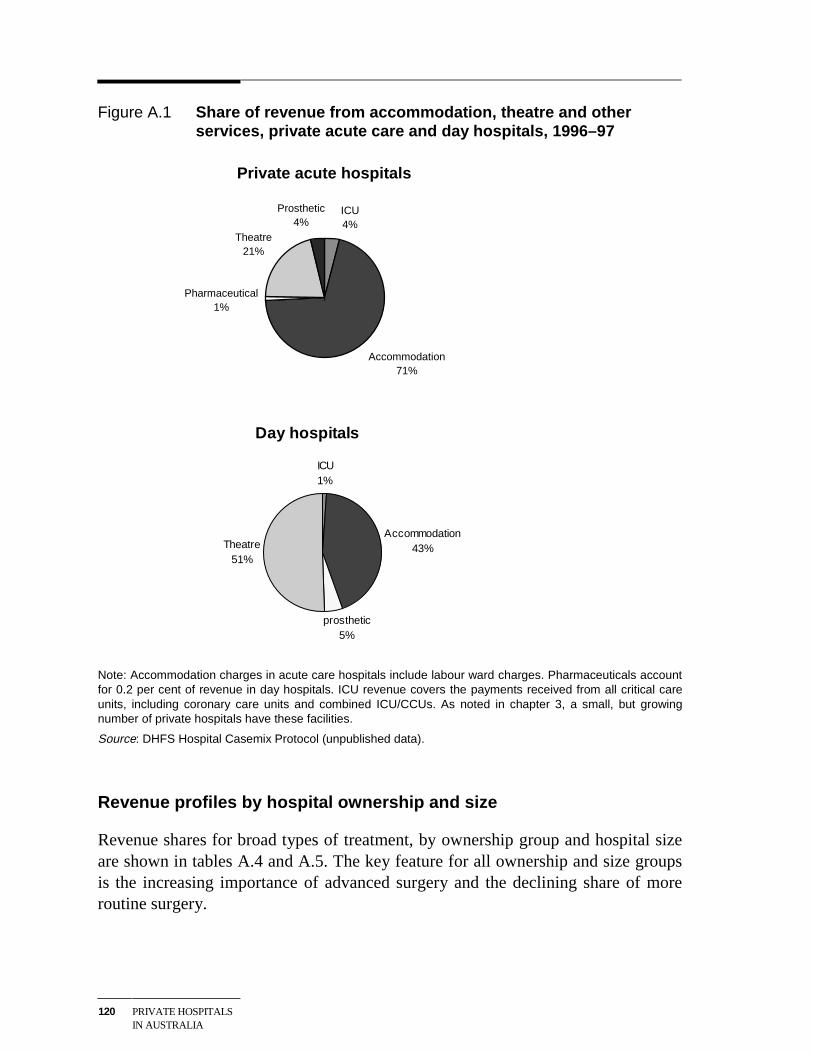
120 PRIVATE HOSPITALSIN AUSTRALIA
Figure A.1 Share of revenue from accommodation, theatre and otherservices, private acute care and day hospitals, 1996–97
Private acute hospitals
Pharmaceutical1%
Theatre21%
ICU4%
Prosthetic4%
Accommodation71%
Day hospitals
ICU1%
Accommodation43%
prosthetic5%
Theatre51%
Note: Accommodation charges in acute care hospitals include labour ward charges. Pharmaceuticals accountfor 0.2 per cent of revenue in day hospitals. ICU revenue covers the payments received from all critical careunits, including coronary care units and combined ICU/CCUs. As noted in chapter 3, a small, but growingnumber of private hospitals have these facilities.
Source: DHFS Hospital Casemix Protocol (unpublished data).
Revenue profiles by hospital ownership and size
Revenue shares for broad types of treatment, by ownership group and hospital sizeare shown in tables A.4 and A.5. The key feature for all ownership and size groupsis the increasing importance of advanced surgery and the declining share of moreroutine surgery.
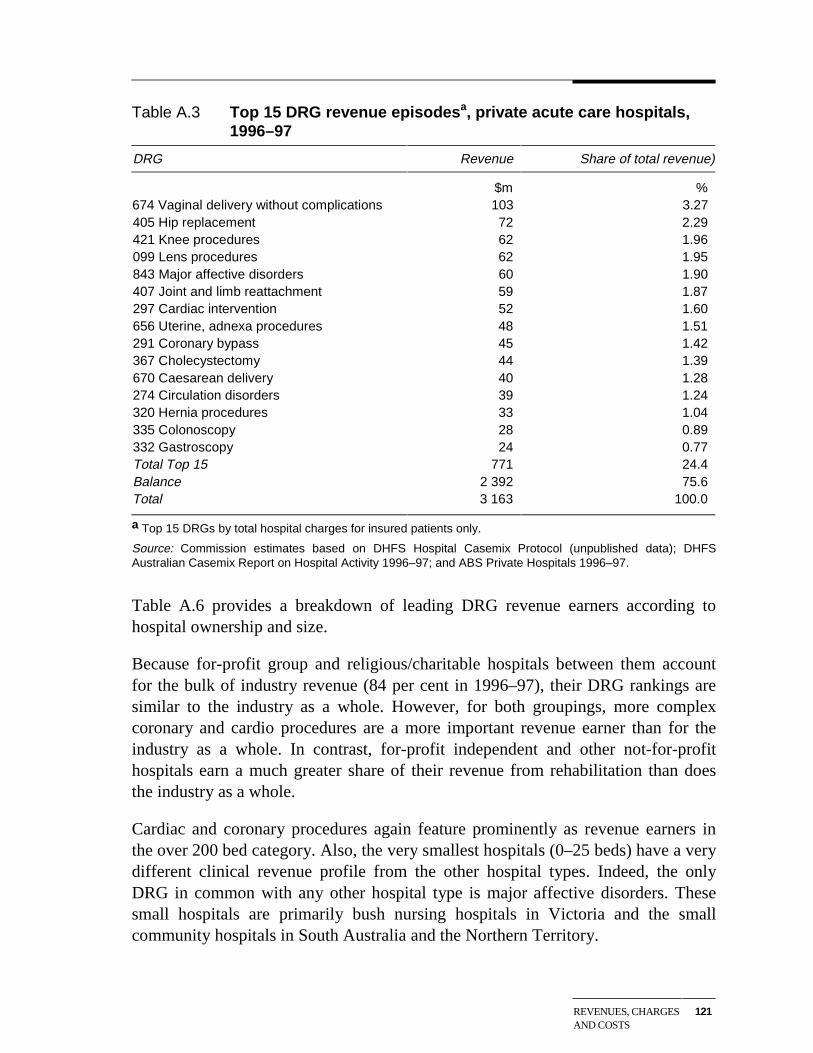
REVENUES, CHARGESAND COSTS
121
Table A.3 Top 15 DRG revenue episodesa, private acute care hospitals,1996–97
DRG Revenue Share of total revenue)
$m %674 Vaginal delivery without complications 103 3.27405 Hip replacement 72 2.29421 Knee procedures 62 1.96099 Lens procedures 62 1.95843 Major affective disorders 60 1.90407 Joint and limb reattachment 59 1.87297 Cardiac intervention 52 1.60656 Uterine, adnexa procedures 48 1.51291 Coronary bypass 45 1.42367 Cholecystectomy 44 1.39670 Caesarean delivery 40 1.28274 Circulation disorders 39 1.24320 Hernia procedures 33 1.04335 Colonoscopy 28 0.89332 Gastroscopy 24 0.77Total Top 15 771 24.4Balance 2 392 75.6Total 3 163 100.0
a Top 15 DRGs by total hospital charges for insured patients only.
Source: Commission estimates based on DHFS Hospital Casemix Protocol (unpublished data); DHFSAustralian Casemix Report on Hospital Activity 1996–97; and ABS Private Hospitals 1996–97.
Table A.6 provides a breakdown of leading DRG revenue earners according tohospital ownership and size.
Because for-profit group and religious/charitable hospitals between them accountfor the bulk of industry revenue (84 per cent in 1996–97), their DRG rankings aresimilar to the industry as a whole. However, for both groupings, more complexcoronary and cardio procedures are a more important revenue earner than for theindustry as a whole. In contrast, for-profit independent and other not-for-profithospitals earn a much greater share of their revenue from rehabilitation than doesthe industry as a whole.
Cardiac and coronary procedures again feature prominently as revenue earners inthe over 200 bed category. Also, the very smallest hospitals (0–25 beds) have a verydifferent clinical revenue profile from the other hospital types. Indeed, the onlyDRG in common with any other hospital type is major affective disorders. Thesesmall hospitals are primarily bush nursing hospitals in Victoria and the smallcommunity hospitals in South Australia and the Northern Territory.
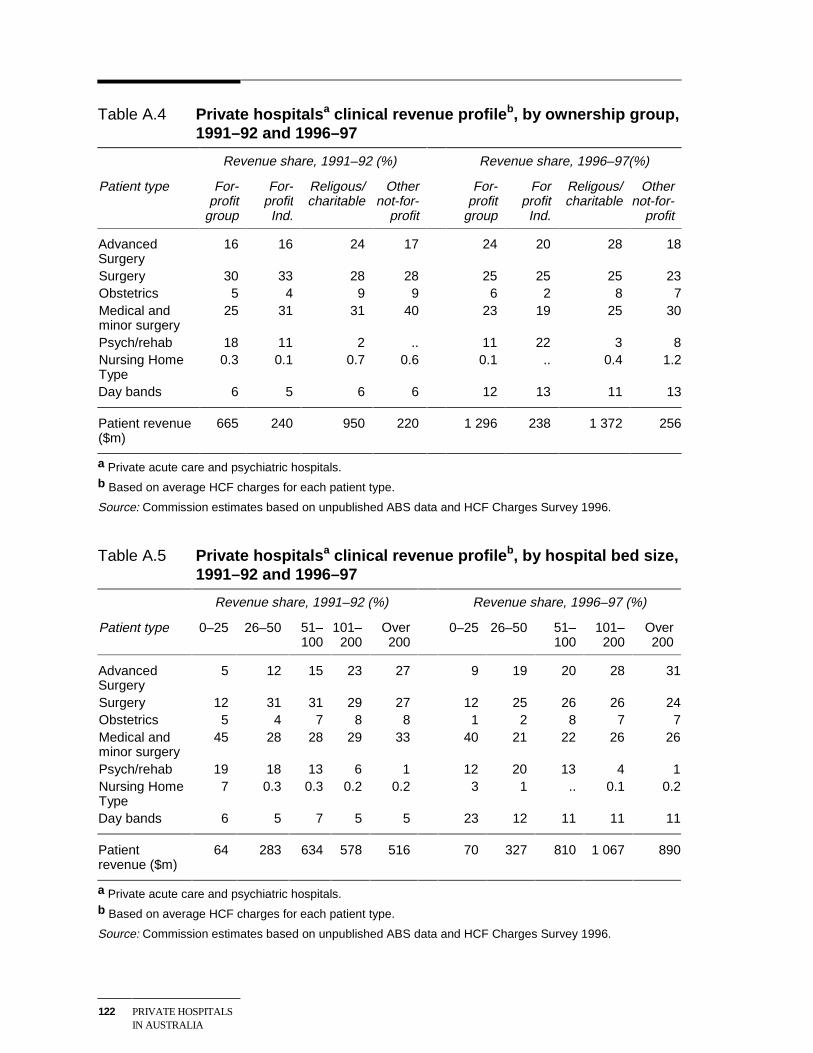
122 PRIVATE HOSPITALSIN AUSTRALIA
Table A.4 Private hospitalsa clinical revenue profileb, by ownership group,1991–92 and 1996–97
Revenue share, 1991–92 (%) Revenue share, 1996–97(%)
Patient type For-profit
group
For-profitInd.
Religous/charitable
Othernot-for-
profit
For-profit
group
ForprofitInd.
Religous/charitable
Othernot-for-
profit
AdvancedSurgery
16 16 24 17 24 20 28 18
Surgery 30 33 28 28 25 25 25 23Obstetrics 5 4 9 9 6 2 8 7Medical andminor surgery
25 31 31 40 23 19 25 30
Psych/rehab 18 11 2 .. 11 22 3 8Nursing HomeType
0.3 0.1 0.7 0.6 0.1 .. 0.4 1.2
Day bands 6 5 6 6 12 13 11 13
Patient revenue($m)
665 240 950 220 1 296 238 1 372 256
a Private acute care and psychiatric hospitals.b Based on average HCF charges for each patient type.
Source: Commission estimates based on unpublished ABS data and HCF Charges Survey 1996.
Table A.5 Private hospitalsa clinical revenue profileb, by hospital bed size,1991–92 and 1996–97
Revenue share, 1991–92 (%) Revenue share, 1996–97 (%)
Patient type 0–25 26–50 51–100
101–200
Over200
0–25 26–50 51–100
101–200
Over200
AdvancedSurgery
5 12 15 23 27 9 19 20 28 31
Surgery 12 31 31 29 27 12 25 26 26 24Obstetrics 5 4 7 8 8 1 2 8 7 7Medical andminor surgery
45 28 28 29 33 40 21 22 26 26
Psych/rehab 19 18 13 6 1 12 20 13 4 1Nursing HomeType
7 0.3 0.3 0.2 0.2 3 1 .. 0.1 0.2
Day bands 6 5 7 5 5 23 12 11 11 11
Patientrevenue ($m)
64 283 634 578 516 70 327 810 1 067 890
a Private acute care and psychiatric hospitals.b Based on average HCF charges for each patient type.
Source: Commission estimates based on unpublished ABS data and HCF Charges Survey 1996.
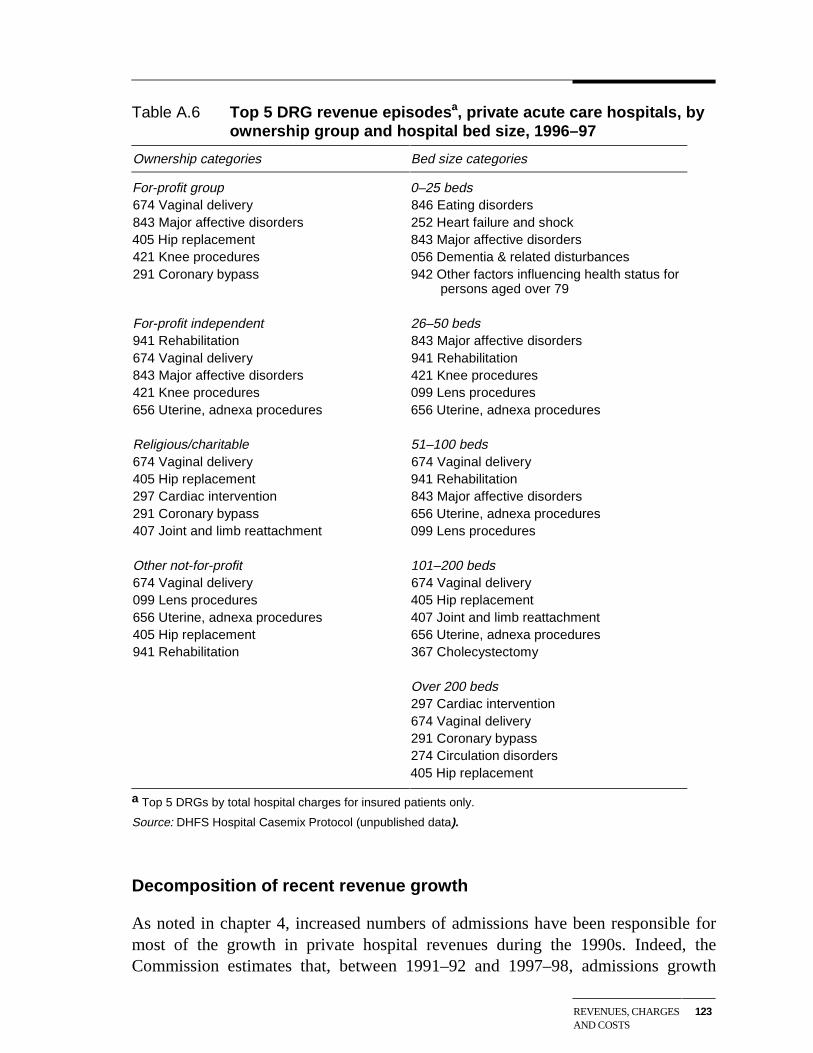
REVENUES, CHARGESAND COSTS
123
Table A.6 Top 5 DRG revenue episodesa, private acute care hospitals, byownership group and hospital bed size, 1996–97
Ownership categories Bed size categories
For-profit group 0–25 beds674 Vaginal delivery 846 Eating disorders843 Major affective disorders 252 Heart failure and shock405 Hip replacement 843 Major affective disorders421 Knee procedures 056 Dementia & related disturbances291 Coronary bypass 942 Other factors influencing health status for
persons aged over 79
For-profit independent 26–50 beds941 Rehabilitation 843 Major affective disorders674 Vaginal delivery 941 Rehabilitation843 Major affective disorders 421 Knee procedures421 Knee procedures 099 Lens procedures656 Uterine, adnexa procedures 656 Uterine, adnexa procedures
Religious/charitable 51–100 beds674 Vaginal delivery 674 Vaginal delivery405 Hip replacement 941 Rehabilitation297 Cardiac intervention 843 Major affective disorders291 Coronary bypass 656 Uterine, adnexa procedures407 Joint and limb reattachment 099 Lens procedures
Other not-for-profit 101–200 beds674 Vaginal delivery 674 Vaginal delivery099 Lens procedures 405 Hip replacement656 Uterine, adnexa procedures 407 Joint and limb reattachment405 Hip replacement 656 Uterine, adnexa procedures941 Rehabilitation 367 Cholecystectomy
Over 200 beds297 Cardiac intervention674 Vaginal delivery291 Coronary bypass274 Circulation disorders405 Hip replacement
a Top 5 DRGs by total hospital charges for insured patients only.
Source: DHFS Hospital Casemix Protocol (unpublished data).
Decomposition of recent revenue growth
As noted in chapter 4, increased numbers of admissions have been responsible formost of the growth in private hospital revenues during the 1990s. Indeed, theCommission estimates that, between 1991–92 and 1997–98, admissions growth
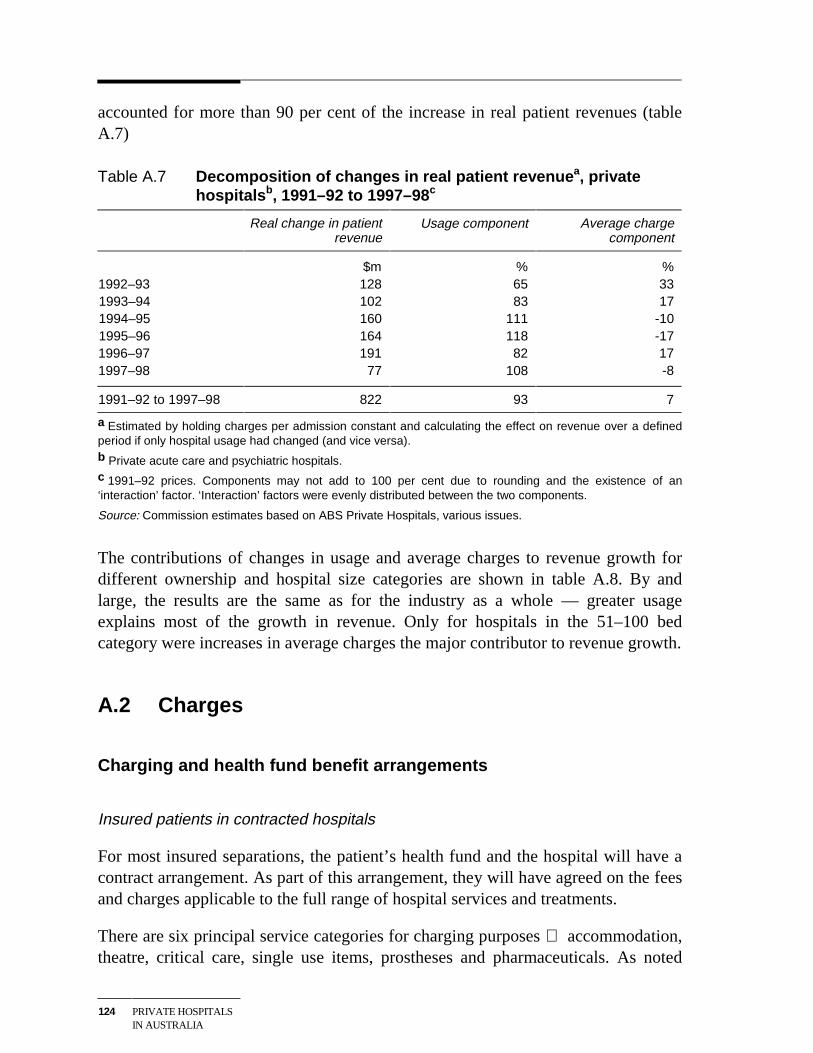
124 PRIVATE HOSPITALSIN AUSTRALIA
accounted for more than 90 per cent of the increase in real patient revenues (tableA.7)
Table A.7 Decomposition of changes in real patient revenuea, privatehospitalsb, 1991–92 to 1997–98 c
Real change in patientrevenue
Usage component Average chargecomponent
$m % %1992–93 128 65 331993–94 102 83 171994–95 160 111 -101995–96 164 118 -171996–97 191 82 171997–98 77 108 -8
1991–92 to 1997–98 822 93 7
a Estimated by holding charges per admission constant and calculating the effect on revenue over a definedperiod if only hospital usage had changed (and vice versa).b Private acute care and psychiatric hospitals.c 1991–92 prices. Components may not add to 100 per cent due to rounding and the existence of an‘interaction’ factor. ‘Interaction’ factors were evenly distributed between the two components.
Source: Commission estimates based on ABS Private Hospitals, various issues.
The contributions of changes in usage and average charges to revenue growth fordifferent ownership and hospital size categories are shown in table A.8. By andlarge, the results are the same as for the industry as a whole — greater usageexplains most of the growth in revenue. Only for hospitals in the 51–100 bedcategory were increases in average charges the major contributor to revenue growth.
A.2 Charges
Charging and health fund benefit arrangements
Insured patients in contracted hospitals
For most insured separations, the patient’s health fund and the hospital will have acontract arrangement. As part of this arrangement, they will have agreed on the feesand charges applicable to the full range of hospital services and treatments.
There are six principal service categories for charging purposes accommodation,theatre, critical care, single use items, prostheses and pharmaceuticals. As noted
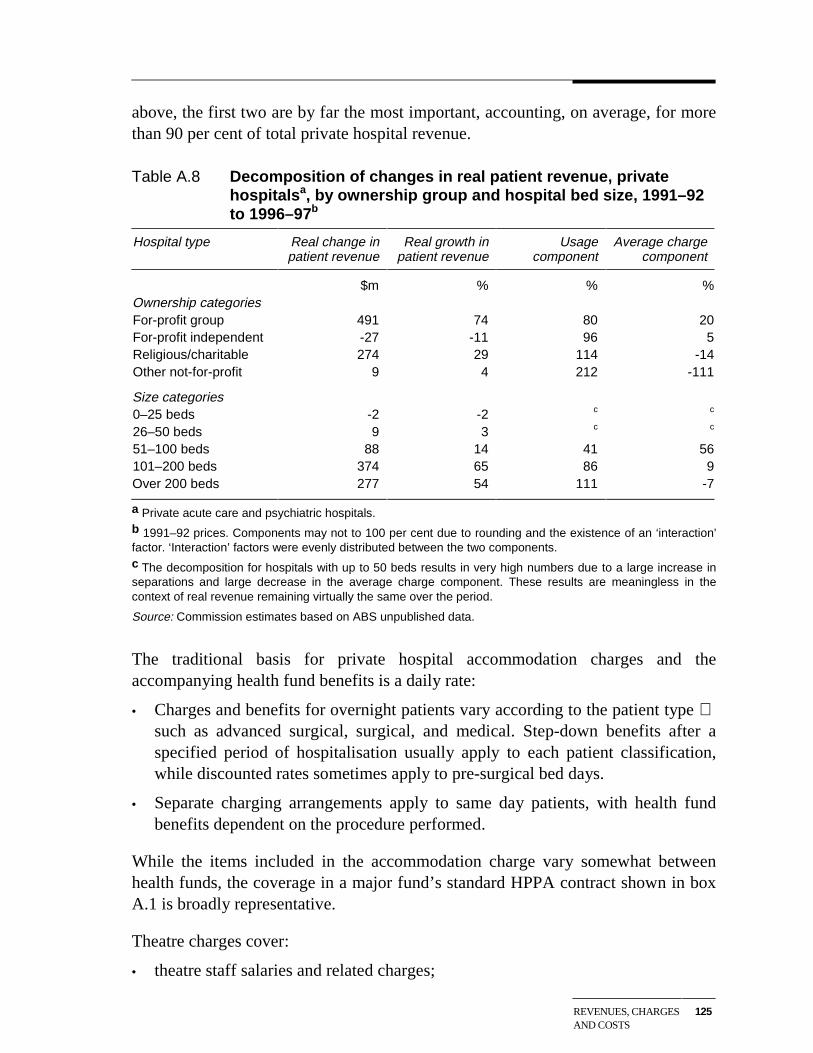
REVENUES, CHARGESAND COSTS
125
above, the first two are by far the most important, accounting, on average, for morethan 90 per cent of total private hospital revenue.
Table A.8 Decomposition of changes in real patient revenue, privatehospitalsa, by ownership group and hospital bed size, 1991–92to 1996–97b
Hospital type Real change inpatient revenue
Real growth inpatient revenue
Usagecomponent
Average chargecomponent
$m % % %Ownership categoriesFor-profit group 491 74 80 20For-profit independent -27 -11 96 5Religious/charitable 274 29 114 -14Other not-for-profit 9 4 212 -111
Size categories0–25 beds -2 -2 c c
26–50 beds 9 3 c c
51–100 beds 88 14 41 56101–200 beds 374 65 86 9Over 200 beds 277 54 111 -7
a Private acute care and psychiatric hospitals.b 1991–92 prices. Components may not to 100 per cent due to rounding and the existence of an ‘interaction’factor. ‘Interaction’ factors were evenly distributed between the two components.c The decomposition for hospitals with up to 50 beds results in very high numbers due to a large increase inseparations and large decrease in the average charge component. These results are meaningless in thecontext of real revenue remaining virtually the same over the period.
Source: Commission estimates based on ABS unpublished data.
The traditional basis for private hospital accommodation charges and theaccompanying health fund benefits is a daily rate:
• Charges and benefits for overnight patients vary according to the patient type such as advanced surgical, surgical, and medical. Step-down benefits after aspecified period of hospitalisation usually apply to each patient classification,while discounted rates sometimes apply to pre-surgical bed days.
• Separate charging arrangements apply to same day patients, with health fundbenefits dependent on the procedure performed.
While the items included in the accommodation charge vary somewhat betweenhealth funds, the coverage in a major fund’s standard HPPA contract shown in boxA.1 is broadly representative.
Theatre charges cover:
• theatre staff salaries and related charges;
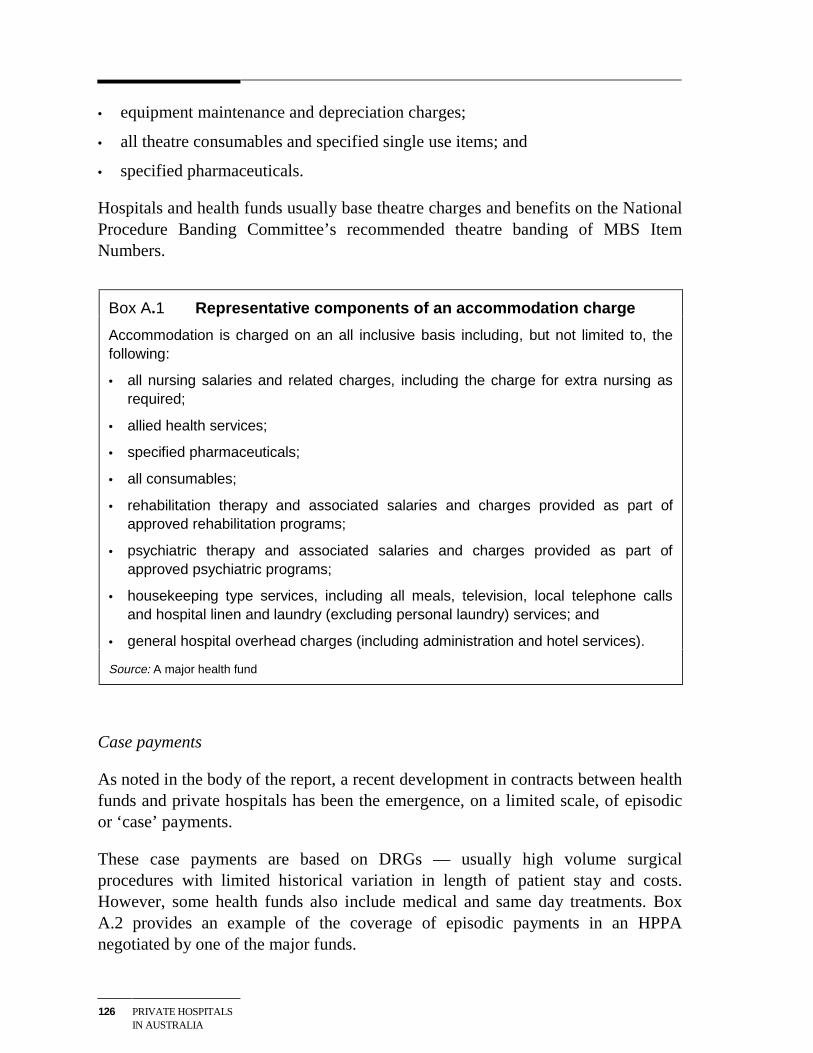
126 PRIVATE HOSPITALSIN AUSTRALIA
• equipment maintenance and depreciation charges;
• all theatre consumables and specified single use items; and
• specified pharmaceuticals.
Hospitals and health funds usually base theatre charges and benefits on the NationalProcedure Banding Committee’s recommended theatre banding of MBS ItemNumbers.
Box A.1 Representative components of an accommodation charge
Accommodation is charged on an all inclusive basis including, but not limited to, thefollowing:
• all nursing salaries and related charges, including the charge for extra nursing asrequired;
• allied health services;
• specified pharmaceuticals;
• all consumables;
• rehabilitation therapy and associated salaries and charges provided as part ofapproved rehabilitation programs;
• psychiatric therapy and associated salaries and charges provided as part ofapproved psychiatric programs;
• housekeeping type services, including all meals, television, local telephone callsand hospital linen and laundry (excluding personal laundry) services; and
• general hospital overhead charges (including administration and hotel services).
Source: A major health fund
Case payments
As noted in the body of the report, a recent development in contracts between healthfunds and private hospitals has been the emergence, on a limited scale, of episodicor ‘case’ payments.
These case payments are based on DRGs — usually high volume surgicalprocedures with limited historical variation in length of patient stay and costs.However, some health funds also include medical and same day treatments. BoxA.2 provides an example of the coverage of episodic payments in an HPPAnegotiated by one of the major funds.
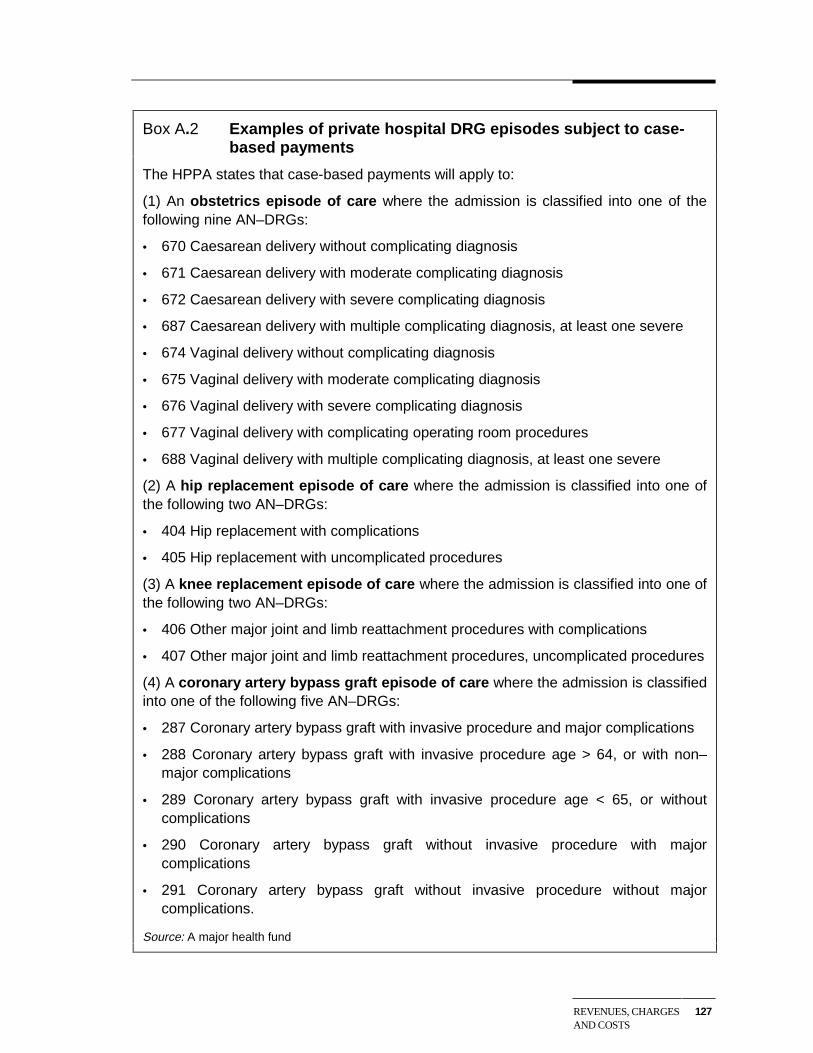
REVENUES, CHARGESAND COSTS
127
Box A.2 Examples of private hospital DRG episodes subject to case-based payments
The HPPA states that case-based payments will apply to:
(1) An obstetrics episode of care where the admission is classified into one of thefollowing nine AN–DRGs:
• 670 Caesarean delivery without complicating diagnosis
• 671 Caesarean delivery with moderate complicating diagnosis
• 672 Caesarean delivery with severe complicating diagnosis
• 687 Caesarean delivery with multiple complicating diagnosis, at least one severe
• 674 Vaginal delivery without complicating diagnosis
• 675 Vaginal delivery with moderate complicating diagnosis
• 676 Vaginal delivery with severe complicating diagnosis
• 677 Vaginal delivery with complicating operating room procedures
• 688 Vaginal delivery with multiple complicating diagnosis, at least one severe
(2) A hip replacement episode of care where the admission is classified into one ofthe following two AN–DRGs:
• 404 Hip replacement with complications
• 405 Hip replacement with uncomplicated procedures
(3) A knee replacement episode of care where the admission is classified into one ofthe following two AN–DRGs:
• 406 Other major joint and limb reattachment procedures with complications
• 407 Other major joint and limb reattachment procedures, uncomplicated procedures
(4) A coronary artery bypass graft episode of care where the admission is classifiedinto one of the following five AN–DRGs:
• 287 Coronary artery bypass graft with invasive procedure and major complications
• 288 Coronary artery bypass graft with invasive procedure age > 64, or with non–major complications
• 289 Coronary artery bypass graft with invasive procedure age < 65, or withoutcomplications
• 290 Coronary artery bypass graft without invasive procedure with majorcomplications
• 291 Coronary artery bypass graft without invasive procedure without majorcomplications.
Source: A major health fund
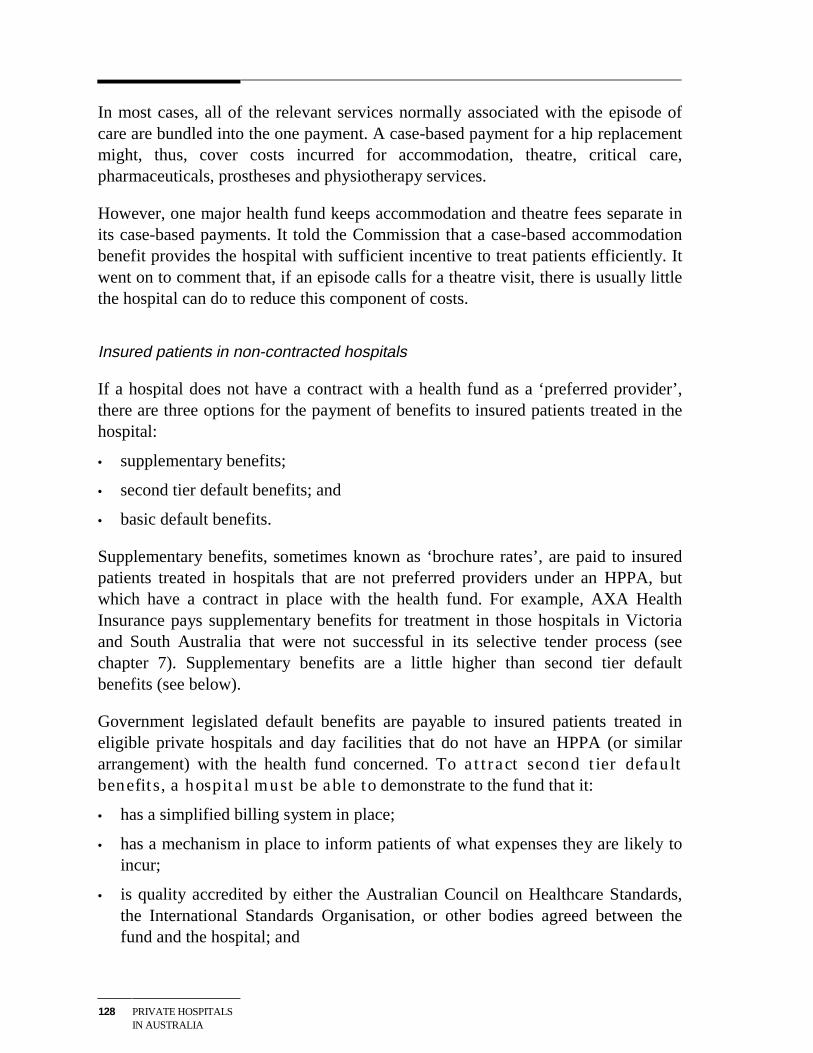
128 PRIVATE HOSPITALSIN AUSTRALIA
In most cases, all of the relevant services normally associated with the episode ofcare are bundled into the one payment. A case-based payment for a hip replacementmight, thus, cover costs incurred for accommodation, theatre, critical care,pharmaceuticals, prostheses and physiotherapy services.
However, one major health fund keeps accommodation and theatre fees separate inits case-based payments. It told the Commission that a case-based accommodationbenefit provides the hospital with sufficient incentive to treat patients efficiently. Itwent on to comment that, if an episode calls for a theatre visit, there is usually littlethe hospital can do to reduce this component of costs.
Insured patients in non-contracted hospitals
If a hospital does not have a contract with a health fund as a ‘preferred provider’,there are three options for the payment of benefits to insured patients treated in thehospital:
• supplementary benefits;
• second tier default benefits; and
• basic default benefits.
Supplementary benefits, sometimes known as ‘brochure rates’, are paid to insuredpatients treated in hospitals that are not preferred providers under an HPPA, butwhich have a contract in place with the health fund. For example, AXA HealthInsurance pays supplementary benefits for treatment in those hospitals in Victoriaand South Australia that were not successful in its selective tender process (seechapter 7). Supplementary benefits are a little higher than second tier defaultbenefits (see below).
Government legislated default benefits are payable to insured patients treated ineligible private hospitals and day facilities that do not have an HPPA (or similararrangement) with the health fund concerned. To attract second tier defaultbenefits, a hospital must be able to demonstrate to the fund that it:
• has a simplified billing system in place;
• has a mechanism in place to inform patients of what expenses they are likely toincur;
• is quality accredited by either the Australian Council on Healthcare Standards,the International Standards Organisation, or other bodies agreed between thefund and the hospital; and
REVENUES, CHARGESAND COSTS
129
• meets quality criteria relating to the episode of care which the fund has specifiedin all HPPAs with comparable private hospitals.
Second tier benefits are set at 85 per cent of the average benefit paid by the fund forthe episode of care in all comparable private hospitals with which the fund has anHPPA (or similar arrangement), in the State/Territory in which the treatment isprovided.
If the health fund has no HPPAs in place in the State or Territory for that episode ofcare, or if the hospital fails to meet the second tier default criteria, then the basicdefault benefit is payable. This benefit, which is determined by the Minister forHealth and Aged Care, is a little over $200 a day, although it varies somewhatacross jurisdictions. Higher default benefits may apply for insured patients admittedto hospital in an emergency.
Self-paying patients
As noted above, self-paying patients account for nearly 9 per cent of privatehospital separations and some 4 per cent of hospital revenue.
Charges for these patients are generally set by charges/benefit rates for insuredpatients. The health funds discourage discounting because it ‘sends the wrongsignals’ to members. Indeed, some funds apparently look to penalise hospitals foundto be offering discounts to self-paying patients. The penalty will generally take theform of a lower rates offer at the next round of negotiations.
Nevertheless, some private hospitals (both not-for-profit and for-profit) discountcharges for self-paying pensioners and other low income patients. One largereligious group said that while only around one per cent of patients receive freetreatment, a much larger number benefit from discounted fees.
Other patients
Charges for treatment provided to eligible veterans and war widow/widowersthrough the Repatriation Private Patient Scheme (RPPS) are negotiated between theDepartment of Veterans Affairs and hospitals. These arrangements can includeprovision to tender for the supply of treatment to eligible veterans and their spouses.
Treatment for most compensable patients is covered by workers’ compensation orthird party motor insurance. The usual basis for payment by the insurance companyis a lump sum according to the nature of the injury or illness.
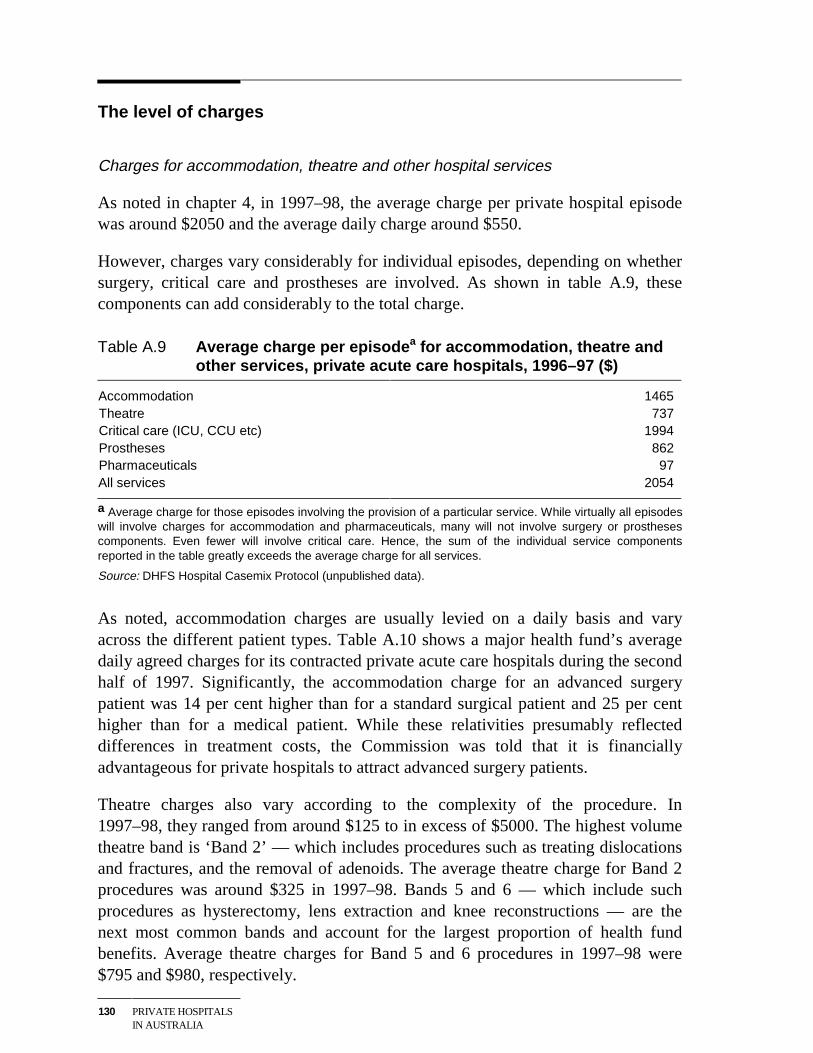
130 PRIVATE HOSPITALSIN AUSTRALIA
The level of charges
Charges for accommodation, theatre and other hospital services
As noted in chapter 4, in 1997–98, the average charge per private hospital episodewas around $2050 and the average daily charge around $550.
However, charges vary considerably for individual episodes, depending on whethersurgery, critical care and prostheses are involved. As shown in table A.9, thesecomponents can add considerably to the total charge.
Table A.9 Average charge per episodea for accommodation, theatre andother services, private acute care hospitals, 1996–97 ($)
Accommodation 1465Theatre 737Critical care (ICU, CCU etc) 1994Prostheses 862Pharmaceuticals 97All services 2054
a Average charge for those episodes involving the provision of a particular service. While virtually all episodeswill involve charges for accommodation and pharmaceuticals, many will not involve surgery or prosthesescomponents. Even fewer will involve critical care. Hence, the sum of the individual service componentsreported in the table greatly exceeds the average charge for all services.
Source: DHFS Hospital Casemix Protocol (unpublished data).
As noted, accommodation charges are usually levied on a daily basis and varyacross the different patient types. Table A.10 shows a major health fund’s averagedaily agreed charges for its contracted private acute care hospitals during the secondhalf of 1997. Significantly, the accommodation charge for an advanced surgerypatient was 14 per cent higher than for a standard surgical patient and 25 per centhigher than for a medical patient. While these relativities presumably reflecteddifferences in treatment costs, the Commission was told that it is financiallyadvantageous for private hospitals to attract advanced surgery patients.
Theatre charges also vary according to the complexity of the procedure. In1997–98, they ranged from around $125 to in excess of $5000. The highest volumetheatre band is ‘Band 2’ — which includes procedures such as treating dislocationsand fractures, and the removal of adenoids. The average theatre charge for Band 2procedures was around $325 in 1997–98. Bands 5 and 6 — which include suchprocedures as hysterectomy, lens extraction and knee reconstructions — are thenext most common bands and account for the largest proportion of health fundbenefits. Average theatre charges for Band 5 and 6 procedures in 1997–98 were$795 and $980, respectively.
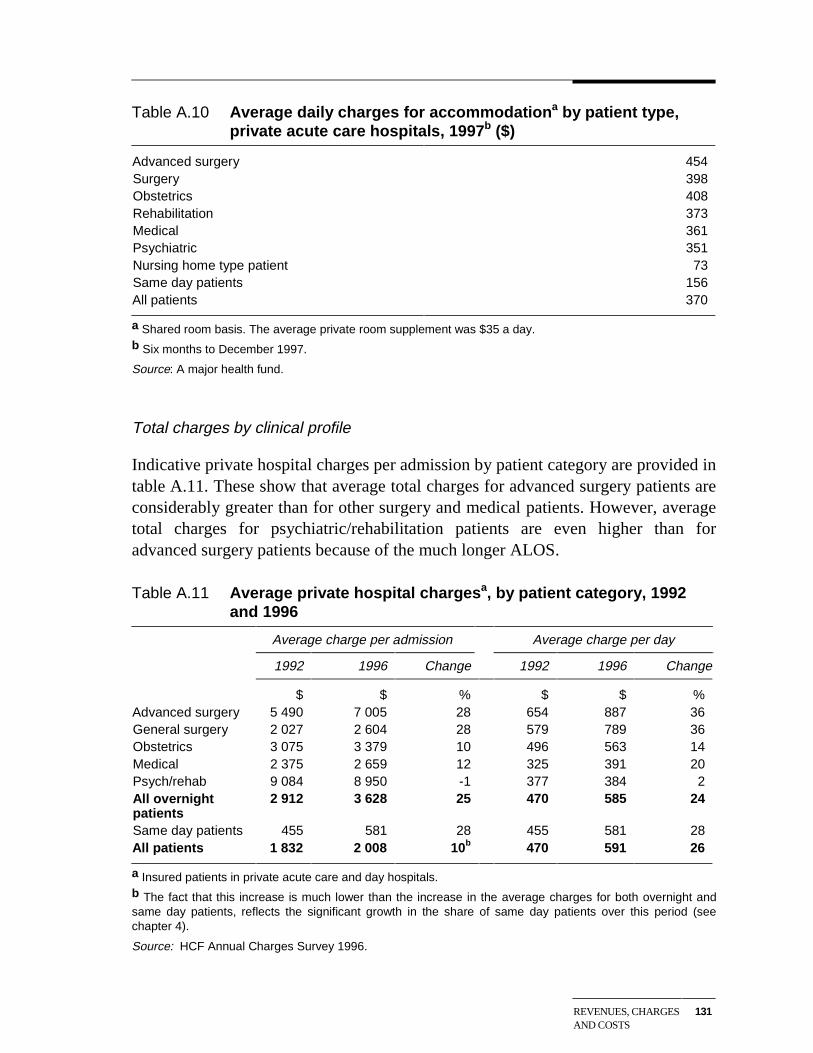
REVENUES, CHARGESAND COSTS
131
Table A.10 Average daily charges for accommodationa by patient type,private acute care hospitals, 1997b ($)
Advanced surgery 454Surgery 398Obstetrics 408Rehabilitation 373Medical 361Psychiatric 351Nursing home type patient 73Same day patients 156All patients 370
a Shared room basis. The average private room supplement was $35 a day.b Six months to December 1997.
Source: A major health fund.
Total charges by clinical profile
Indicative private hospital charges per admission by patient category are provided intable A.11. These show that average total charges for advanced surgery patients areconsiderably greater than for other surgery and medical patients. However, averagetotal charges for psychiatric/rehabilitation patients are even higher than foradvanced surgery patients because of the much longer ALOS.
Table A.11 Average private hospital chargesa, by patient category, 1992and 1996
Average charge per admission Average charge per day
1992 1996 Change 1992 1996 Change
$ $ % $ $ %Advanced surgery 5 490 7 005 28 654 887 36General surgery 2 027 2 604 28 579 789 36Obstetrics 3 075 3 379 10 496 563 14Medical 2 375 2 659 12 325 391 20Psych/rehab 9 084 8 950 -1 377 384 2All overnightpatients
2 912 3 628 25 470 585 24
Same day patients 455 581 28 455 581 28All patients 1 832 2 008 10b 470 591 26
a Insured patients in private acute care and day hospitals.b The fact that this increase is much lower than the increase in the average charges for both overnight andsame day patients, reflects the significant growth in the share of same day patients over this period (seechapter 4).
Source: HCF Annual Charges Survey 1996.
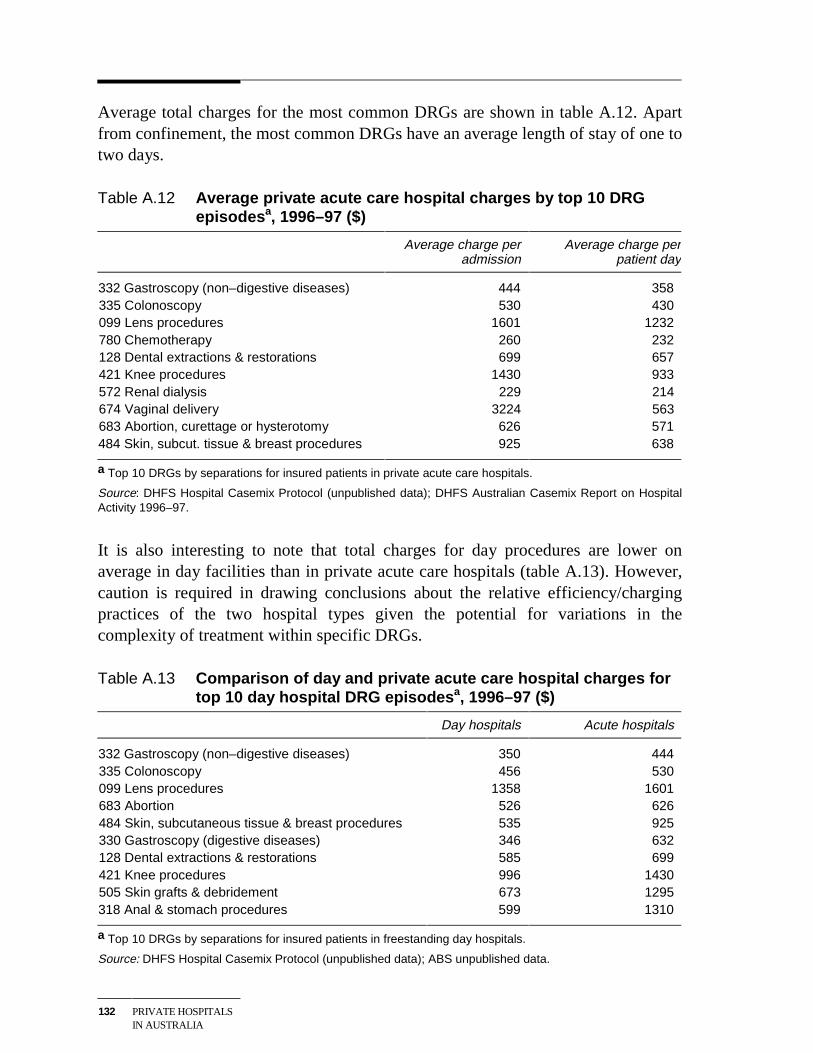
132 PRIVATE HOSPITALSIN AUSTRALIA
Average total charges for the most common DRGs are shown in table A.12. Apartfrom confinement, the most common DRGs have an average length of stay of one totwo days.
Table A.12 Average private acute care hospital charges by top 10 DRGepisodesa, 1996–97 ($)
Average charge peradmission
Average charge perpatient day
332 Gastroscopy (non–digestive diseases) 444 358335 Colonoscopy 530 430099 Lens procedures 1601 1232780 Chemotherapy 260 232128 Dental extractions & restorations 699 657421 Knee procedures 1430 933572 Renal dialysis 229 214674 Vaginal delivery 3224 563683 Abortion, curettage or hysterotomy 626 571484 Skin, subcut. tissue & breast procedures 925 638
a Top 10 DRGs by separations for insured patients in private acute care hospitals.
Source: DHFS Hospital Casemix Protocol (unpublished data); DHFS Australian Casemix Report on HospitalActivity 1996–97.
It is also interesting to note that total charges for day procedures are lower onaverage in day facilities than in private acute care hospitals (table A.13). However,caution is required in drawing conclusions about the relative efficiency/chargingpractices of the two hospital types given the potential for variations in thecomplexity of treatment within specific DRGs.
Table A.13 Comparison of day and private acute care hospital charges fortop 10 day hospital DRG episodesa, 1996–97 ($)
Day hospitals Acute hospitals
332 Gastroscopy (non–digestive diseases) 350 444335 Colonoscopy 456 530099 Lens procedures 1358 1601683 Abortion 526 626484 Skin, subcutaneous tissue & breast procedures 535 925330 Gastroscopy (digestive diseases) 346 632128 Dental extractions & restorations 585 699421 Knee procedures 996 1430505 Skin grafts & debridement 673 1295318 Anal & stomach procedures 599 1310
a Top 10 DRGs by separations for insured patients in freestanding day hospitals.
Source: DHFS Hospital Casemix Protocol (unpublished data); ABS unpublished data.
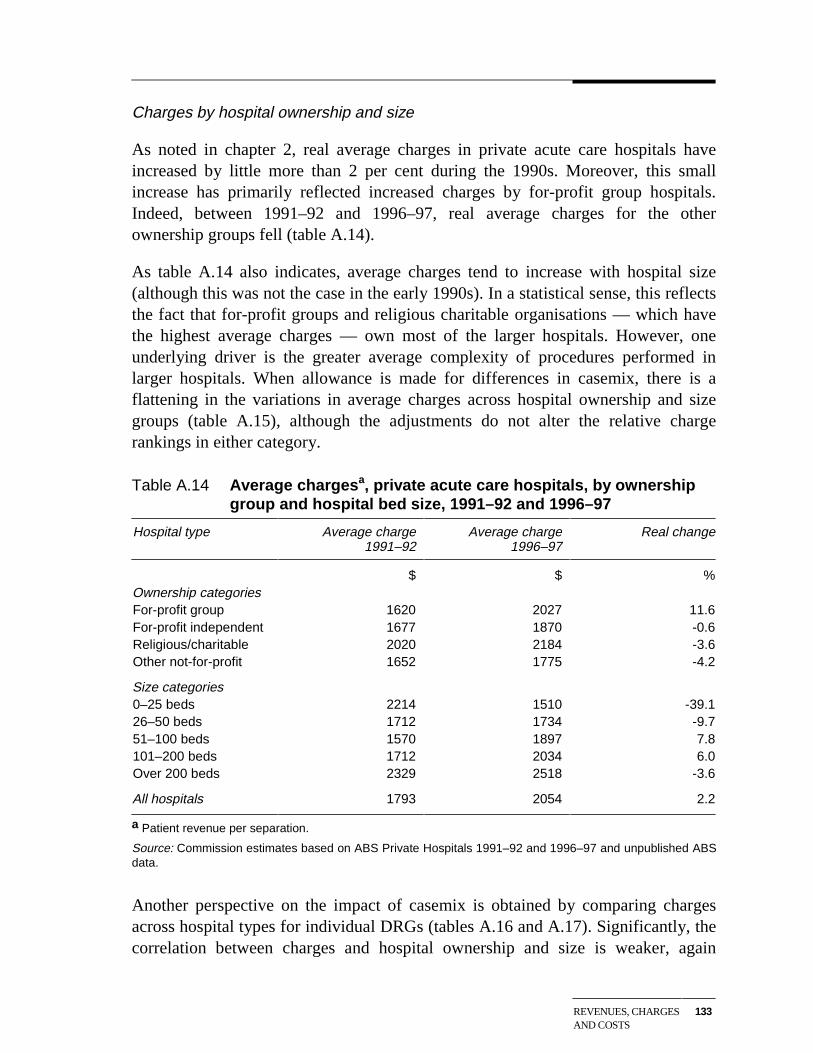
REVENUES, CHARGESAND COSTS
133
Charges by hospital ownership and size
As noted in chapter 2, real average charges in private acute care hospitals haveincreased by little more than 2 per cent during the 1990s. Moreover, this smallincrease has primarily reflected increased charges by for-profit group hospitals.Indeed, between 1991–92 and 1996–97, real average charges for the otherownership groups fell (table A.14).
As table A.14 also indicates, average charges tend to increase with hospital size(although this was not the case in the early 1990s). In a statistical sense, this reflectsthe fact that for-profit groups and religious charitable organisations — which havethe highest average charges — own most of the larger hospitals. However, oneunderlying driver is the greater average complexity of procedures performed inlarger hospitals. When allowance is made for differences in casemix, there is aflattening in the variations in average charges across hospital ownership and sizegroups (table A.15), although the adjustments do not alter the relative chargerankings in either category.
Table A.14 Average chargesa, private acute care hospitals, by ownershipgroup and hospital bed size, 1991–92 and 1996–97
Hospital type Average charge1991–92
Average charge1996–97
Real change
$ $ %Ownership categoriesFor-profit group 1620 2027 11.6For-profit independent 1677 1870 -0.6Religious/charitable 2020 2184 -3.6Other not-for-profit 1652 1775 -4.2
Size categories0–25 beds 2214 1510 -39.126–50 beds 1712 1734 -9.751–100 beds 1570 1897 7.8101–200 beds 1712 2034 6.0Over 200 beds 2329 2518 -3.6
All hospitals 1793 2054 2.2
a Patient revenue per separation.
Source: Commission estimates based on ABS Private Hospitals 1991–92 and 1996–97 and unpublished ABSdata.
Another perspective on the impact of casemix is obtained by comparing chargesacross hospital types for individual DRGs (tables A.16 and A.17). Significantly, thecorrelation between charges and hospital ownership and size is weaker, again
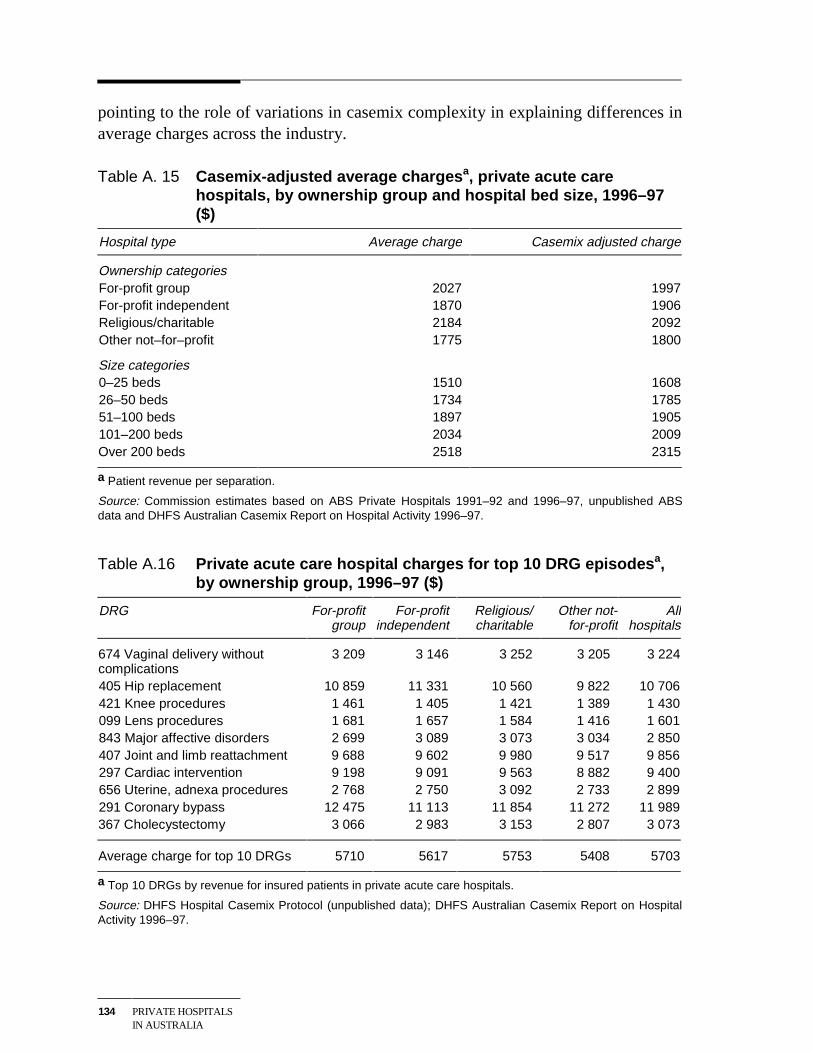
134 PRIVATE HOSPITALSIN AUSTRALIA
pointing to the role of variations in casemix complexity in explaining differences inaverage charges across the industry.
Table A. 15 Casemix-adjusted average chargesa, private acute carehospitals, by ownership group and hospital bed size, 1996–97($)
Hospital type Average charge Casemix adjusted charge
Ownership categoriesFor-profit group 2027 1997For-profit independent 1870 1906Religious/charitable 2184 2092Other not–for–profit 1775 1800
Size categories0–25 beds 1510 160826–50 beds 1734 178551–100 beds 1897 1905101–200 beds 2034 2009Over 200 beds 2518 2315
a Patient revenue per separation.
Source: Commission estimates based on ABS Private Hospitals 1991–92 and 1996–97, unpublished ABSdata and DHFS Australian Casemix Report on Hospital Activity 1996–97.
Table A.16 Private acute care hospital charges for top 10 DRG episodesa,by ownership group, 1996–97 ($)
DRG For-profitgroup
For-profitindependent
Religious/charitable
Other not-for-profit
Allhospitals
674 Vaginal delivery withoutcomplications
3 209 3 146 3 252 3 205 3 224
405 Hip replacement 10 859 11 331 10 560 9 822 10 706421 Knee procedures 1 461 1 405 1 421 1 389 1 430099 Lens procedures 1 681 1 657 1 584 1 416 1 601843 Major affective disorders 2 699 3 089 3 073 3 034 2 850407 Joint and limb reattachment 9 688 9 602 9 980 9 517 9 856297 Cardiac intervention 9 198 9 091 9 563 8 882 9 400656 Uterine, adnexa procedures 2 768 2 750 3 092 2 733 2 899291 Coronary bypass 12 475 11 113 11 854 11 272 11 989367 Cholecystectomy 3 066 2 983 3 153 2 807 3 073
Average charge for top 10 DRGs 5710 5617 5753 5408 5703
a Top 10 DRGs by revenue for insured patients in private acute care hospitals.
Source: DHFS Hospital Casemix Protocol (unpublished data); DHFS Australian Casemix Report on HospitalActivity 1996–97.
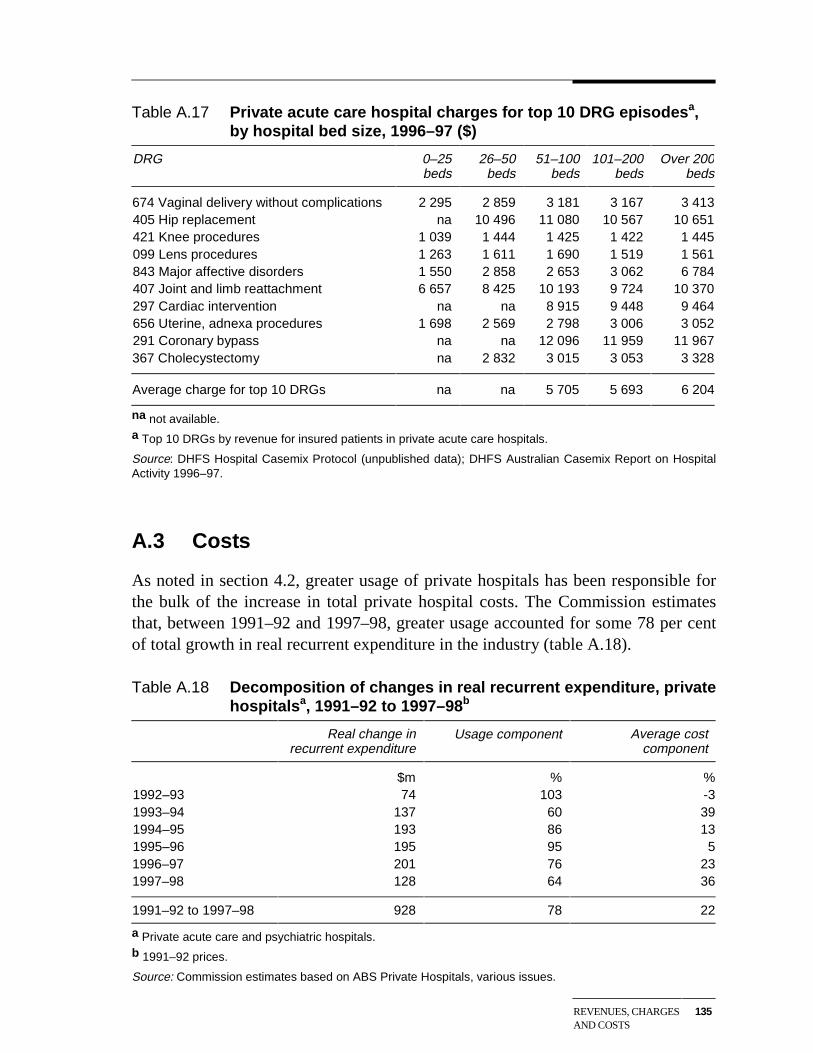
REVENUES, CHARGESAND COSTS
135
Table A.17 Private acute care hospital charges for top 10 DRG episodesa,by hospital bed size, 1996–97 ($)
DRG 0–25beds
26–50beds
51–100beds
101–200beds
Over 200beds
674 Vaginal delivery without complications 2 295 2 859 3 181 3 167 3 413405 Hip replacement na 10 496 11 080 10 567 10 651421 Knee procedures 1 039 1 444 1 425 1 422 1 445099 Lens procedures 1 263 1 611 1 690 1 519 1 561843 Major affective disorders 1 550 2 858 2 653 3 062 6 784407 Joint and limb reattachment 6 657 8 425 10 193 9 724 10 370297 Cardiac intervention na na 8 915 9 448 9 464656 Uterine, adnexa procedures 1 698 2 569 2 798 3 006 3 052291 Coronary bypass na na 12 096 11 959 11 967367 Cholecystectomy na 2 832 3 015 3 053 3 328
Average charge for top 10 DRGs na na 5 705 5 693 6 204
na not available.a Top 10 DRGs by revenue for insured patients in private acute care hospitals.
Source: DHFS Hospital Casemix Protocol (unpublished data); DHFS Australian Casemix Report on HospitalActivity 1996–97.
A.3 Costs
As noted in section 4.2, greater usage of private hospitals has been responsible forthe bulk of the increase in total private hospital costs. The Commission estimatesthat, between 1991–92 and 1997–98, greater usage accounted for some 78 per centof total growth in real recurrent expenditure in the industry (table A.18).
Table A.18 Decomposition of changes in real recurrent expenditure, privatehospitalsa, 1991–92 to 1997–98b
Real change inrecurrent expenditure
Usage component Average costcomponent
$m % %1992–93 74 103 -31993–94 137 60 391994–95 193 86 131995–96 195 95 51996–97 201 76 231997–98 128 64 36
1991–92 to 1997–98 928 78 22
a Private acute care and psychiatric hospitals.b 1991–92 prices.
Source: Commission estimates based on ABS Private Hospitals, various issues.
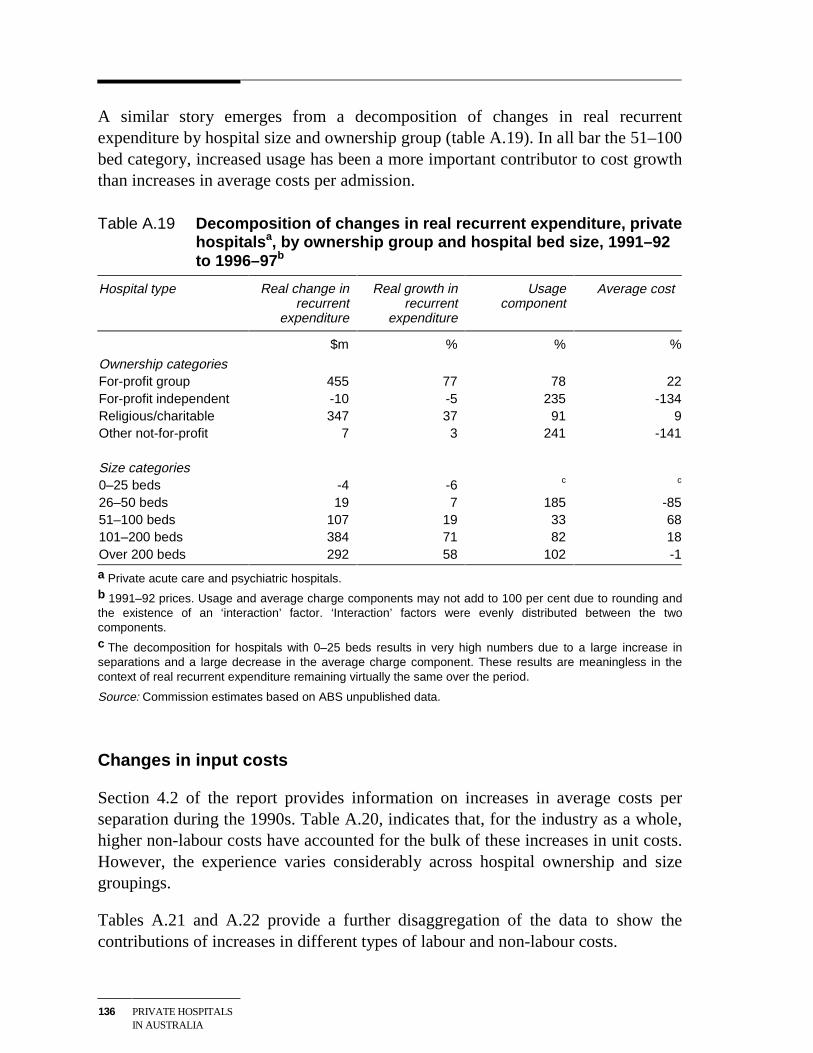
136 PRIVATE HOSPITALSIN AUSTRALIA
A similar story emerges from a decomposition of changes in real recurrentexpenditure by hospital size and ownership group (table A.19). In all bar the 51–100bed category, increased usage has been a more important contributor to cost growththan increases in average costs per admission.
Table A.19 Decomposition of changes in real recurrent expenditure, privatehospitalsa, by ownership group and hospital bed size, 1991–92to 1996–97b
Hospital type Real change inrecurrent
expenditure
Real growth inrecurrent
expenditure
Usagecomponent
Average cost
$m % % %
Ownership categoriesFor-profit group 455 77 78 22For-profit independent -10 -5 235 -134Religious/charitable 347 37 91 9Other not-for-profit 7 3 241 -141
Size categories0–25 beds -4 -6 c c
26–50 beds 19 7 185 -8551–100 beds 107 19 33 68101–200 beds 384 71 82 18Over 200 beds 292 58 102 -1
a Private acute care and psychiatric hospitals.b 1991–92 prices. Usage and average charge components may not add to 100 per cent due to rounding andthe existence of an ‘interaction’ factor. ‘Interaction’ factors were evenly distributed between the twocomponents.c The decomposition for hospitals with 0–25 beds results in very high numbers due to a large increase inseparations and a large decrease in the average charge component. These results are meaningless in thecontext of real recurrent expenditure remaining virtually the same over the period.
Source: Commission estimates based on ABS unpublished data.
Changes in input costs
Section 4.2 of the report provides information on increases in average costs perseparation during the 1990s. Table A.20, indicates that, for the industry as a whole,higher non-labour costs have accounted for the bulk of these increases in unit costs.However, the experience varies considerably across hospital ownership and sizegroupings.
Tables A.21 and A.22 provide a further disaggregation of the data to show thecontributions of increases in different types of labour and non-labour costs.
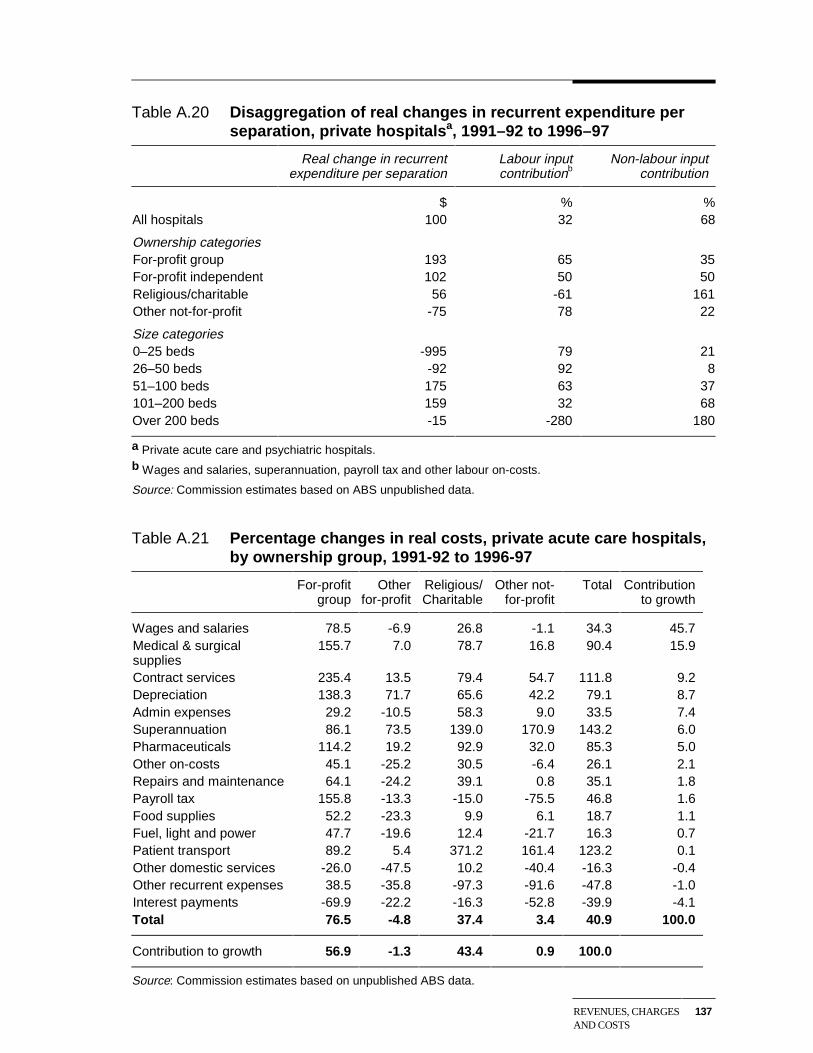
REVENUES, CHARGESAND COSTS
137
Table A.20 Disaggregation of real changes in recurrent expenditure perseparation, private hospitalsa, 1991–92 to 1996–97
Real change in recurrentexpenditure per separation
Labour inputcontributionb
Non-labour inputcontribution
$ % %All hospitals 100 32 68
Ownership categoriesFor-profit group 193 65 35For-profit independent 102 50 50Religious/charitable 56 -61 161Other not-for-profit -75 78 22
Size categories0–25 beds -995 79 2126–50 beds -92 92 851–100 beds 175 63 37101–200 beds 159 32 68Over 200 beds -15 -280 180
a Private acute care and psychiatric hospitals.b Wages and salaries, superannuation, payroll tax and other labour on-costs.
Source: Commission estimates based on ABS unpublished data.
Table A.21 Percentage changes in real costs, private acute care hospitals,by ownership group, 1991-92 to 1996-97
For-profitgroup
Otherfor-profit
Religious/Charitable
Other not-for-profit
Total Contributionto growth
Wages and salaries 78.5 -6.9 26.8 -1.1 34.3 45.7Medical & surgicalsupplies
155.7 7.0 78.7 16.8 90.4 15.9
Contract services 235.4 13.5 79.4 54.7 111.8 9.2Depreciation 138.3 71.7 65.6 42.2 79.1 8.7Admin expenses 29.2 -10.5 58.3 9.0 33.5 7.4Superannuation 86.1 73.5 139.0 170.9 143.2 6.0Pharmaceuticals 114.2 19.2 92.9 32.0 85.3 5.0Other on-costs 45.1 -25.2 30.5 -6.4 26.1 2.1Repairs and maintenance 64.1 -24.2 39.1 0.8 35.1 1.8Payroll tax 155.8 -13.3 -15.0 -75.5 46.8 1.6Food supplies 52.2 -23.3 9.9 6.1 18.7 1.1Fuel, light and power 47.7 -19.6 12.4 -21.7 16.3 0.7Patient transport 89.2 5.4 371.2 161.4 123.2 0.1Other domestic services -26.0 -47.5 10.2 -40.4 -16.3 -0.4Other recurrent expenses 38.5 -35.8 -97.3 -91.6 -47.8 -1.0Interest payments -69.9 -22.2 -16.3 -52.8 -39.9 -4.1Total 76.5 -4.8 37.4 3.4 40.9 100.0
Contribution to growth 56.9 -1.3 43.4 0.9 100.0
Source: Commission estimates based on unpublished ABS data.
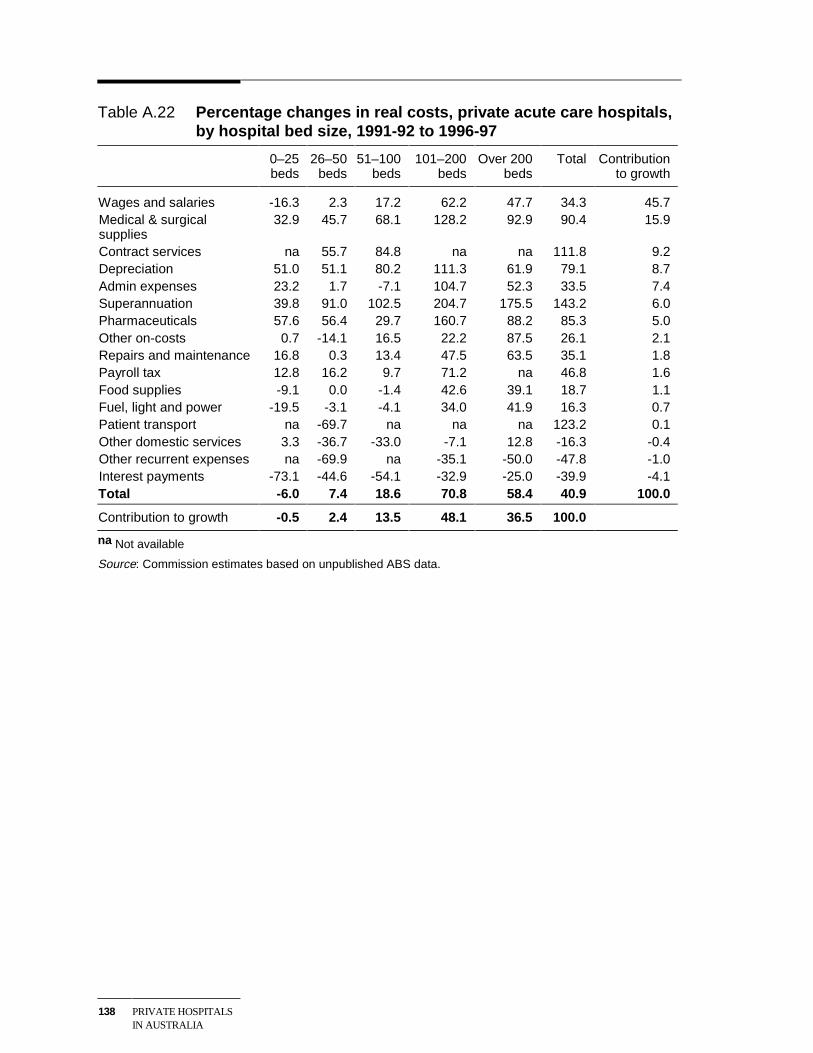
138 PRIVATE HOSPITALSIN AUSTRALIA
Table A.22 Percentage changes in real costs, private acute care hospitals,by hospital bed size, 1991-92 to 1996-97
0–25beds
26–50beds
51–100beds
101–200beds
Over 200beds
Total Contributionto growth
Wages and salaries -16.3 2.3 17.2 62.2 47.7 34.3 45.7Medical & surgicalsupplies
32.9 45.7 68.1 128.2 92.9 90.4 15.9
Contract services na 55.7 84.8 na na 111.8 9.2Depreciation 51.0 51.1 80.2 111.3 61.9 79.1 8.7Admin expenses 23.2 1.7 -7.1 104.7 52.3 33.5 7.4Superannuation 39.8 91.0 102.5 204.7 175.5 143.2 6.0Pharmaceuticals 57.6 56.4 29.7 160.7 88.2 85.3 5.0Other on-costs 0.7 -14.1 16.5 22.2 87.5 26.1 2.1Repairs and maintenance 16.8 0.3 13.4 47.5 63.5 35.1 1.8Payroll tax 12.8 16.2 9.7 71.2 na 46.8 1.6Food supplies -9.1 0.0 -1.4 42.6 39.1 18.7 1.1Fuel, light and power -19.5 -3.1 -4.1 34.0 41.9 16.3 0.7Patient transport na -69.7 na na na 123.2 0.1Other domestic services 3.3 -36.7 -33.0 -7.1 12.8 -16.3 -0.4Other recurrent expenses na -69.9 na -35.1 -50.0 -47.8 -1.0Interest payments -73.1 -44.6 -54.1 -32.9 -25.0 -39.9 -4.1Total -6.0 7.4 18.6 70.8 58.4 40.9 100.0
Contribution to growth -0.5 2.4 13.5 48.1 36.5 100.0
na Not available
Source: Commission estimates based on unpublished ABS data.
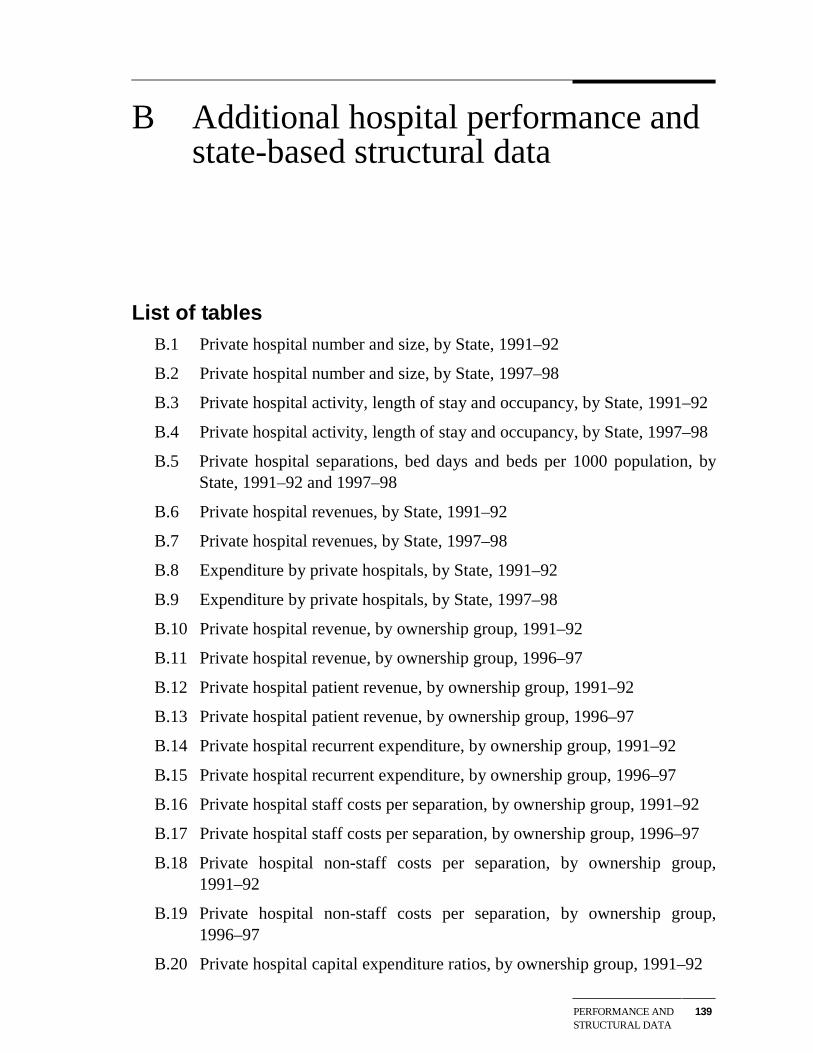
PERFORMANCE ANDSTRUCTURAL DATA
139
B Additional hospital performance andstate-based structural data
List of tablesB.1 Private hospital number and size, by State, 1991–92
B.2 Private hospital number and size, by State, 1997–98
B.3 Private hospital activity, length of stay and occupancy, by State, 1991–92
B.4 Private hospital activity, length of stay and occupancy, by State, 1997–98
B.5 Private hospital separations, bed days and beds per 1000 population, byState, 1991–92 and 1997–98
B.6 Private hospital revenues, by State, 1991–92
B.7 Private hospital revenues, by State, 1997–98
B.8 Expenditure by private hospitals, by State, 1991–92
B.9 Expenditure by private hospitals, by State, 1997–98
B.10 Private hospital revenue, by ownership group, 1991–92
B.11 Private hospital revenue, by ownership group, 1996–97
B.12 Private hospital patient revenue, by ownership group, 1991–92
B.13 Private hospital patient revenue, by ownership group, 1996–97
B.14 Private hospital recurrent expenditure, by ownership group, 1991–92
B.15 Private hospital recurrent expenditure, by ownership group, 1996–97
B.16 Private hospital staff costs per separation, by ownership group, 1991–92
B.17 Private hospital staff costs per separation, by ownership group, 1996–97
B.18 Private hospital non-staff costs per separation, by ownership group,1991–92
B.19 Private hospital non-staff costs per separation, by ownership group,1996–97
B.20 Private hospital capital expenditure ratios, by ownership group, 1991–92
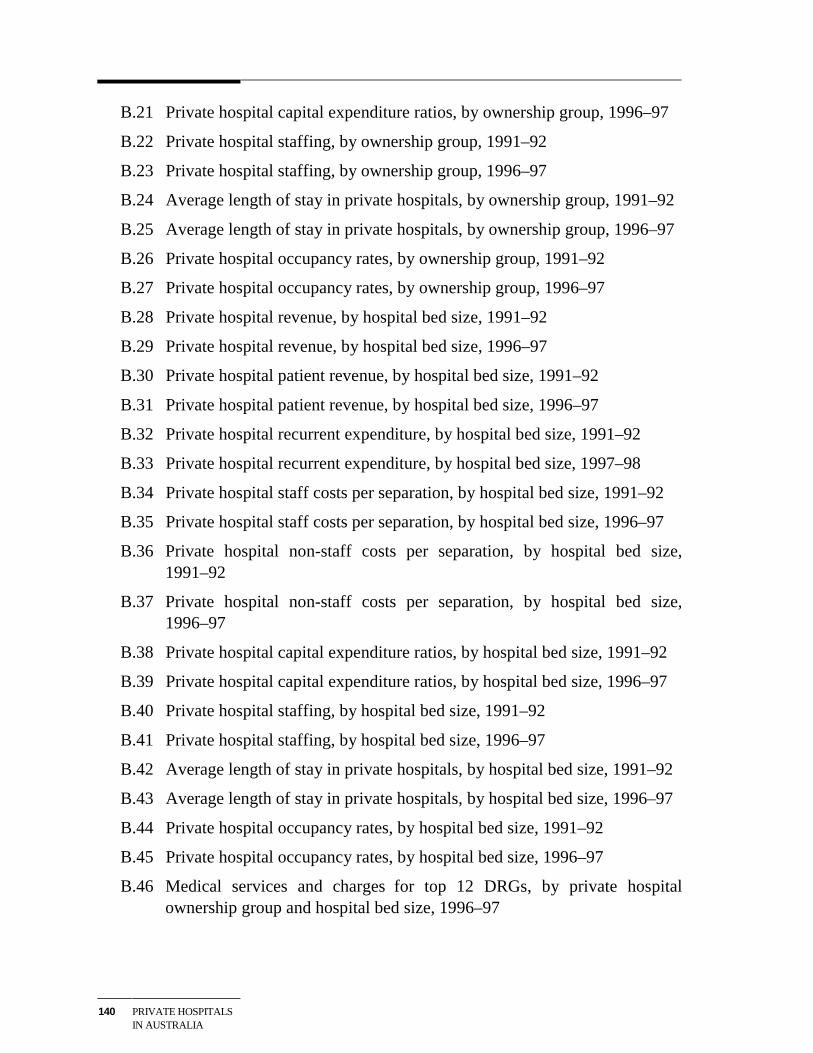
140 PRIVATE HOSPITALSIN AUSTRALIA
B.21 Private hospital capital expenditure ratios, by ownership group, 1996–97
B.22 Private hospital staffing, by ownership group, 1991–92
B.23 Private hospital staffing, by ownership group, 1996–97
B.24 Average length of stay in private hospitals, by ownership group, 1991–92
B.25 Average length of stay in private hospitals, by ownership group, 1996–97
B.26 Private hospital occupancy rates, by ownership group, 1991–92
B.27 Private hospital occupancy rates, by ownership group, 1996–97
B.28 Private hospital revenue, by hospital bed size, 1991–92
B.29 Private hospital revenue, by hospital bed size, 1996–97
B.30 Private hospital patient revenue, by hospital bed size, 1991–92
B.31 Private hospital patient revenue, by hospital bed size, 1996–97
B.32 Private hospital recurrent expenditure, by hospital bed size, 1991–92
B.33 Private hospital recurrent expenditure, by hospital bed size, 1997–98
B.34 Private hospital staff costs per separation, by hospital bed size, 1991–92
B.35 Private hospital staff costs per separation, by hospital bed size, 1996–97
B.36 Private hospital non-staff costs per separation, by hospital bed size,1991–92
B.37 Private hospital non-staff costs per separation, by hospital bed size,1996–97
B.38 Private hospital capital expenditure ratios, by hospital bed size, 1991–92
B.39 Private hospital capital expenditure ratios, by hospital bed size, 1996–97
B.40 Private hospital staffing, by hospital bed size, 1991–92
B.41 Private hospital staffing, by hospital bed size, 1996–97
B.42 Average length of stay in private hospitals, by hospital bed size, 1991–92
B.43 Average length of stay in private hospitals, by hospital bed size, 1996–97
B.44 Private hospital occupancy rates, by hospital bed size, 1991–92
B.45 Private hospital occupancy rates, by hospital bed size, 1996–97
B.46 Medical services and charges for top 12 DRGs, by private hospitalownership group and hospital bed size, 1996–97
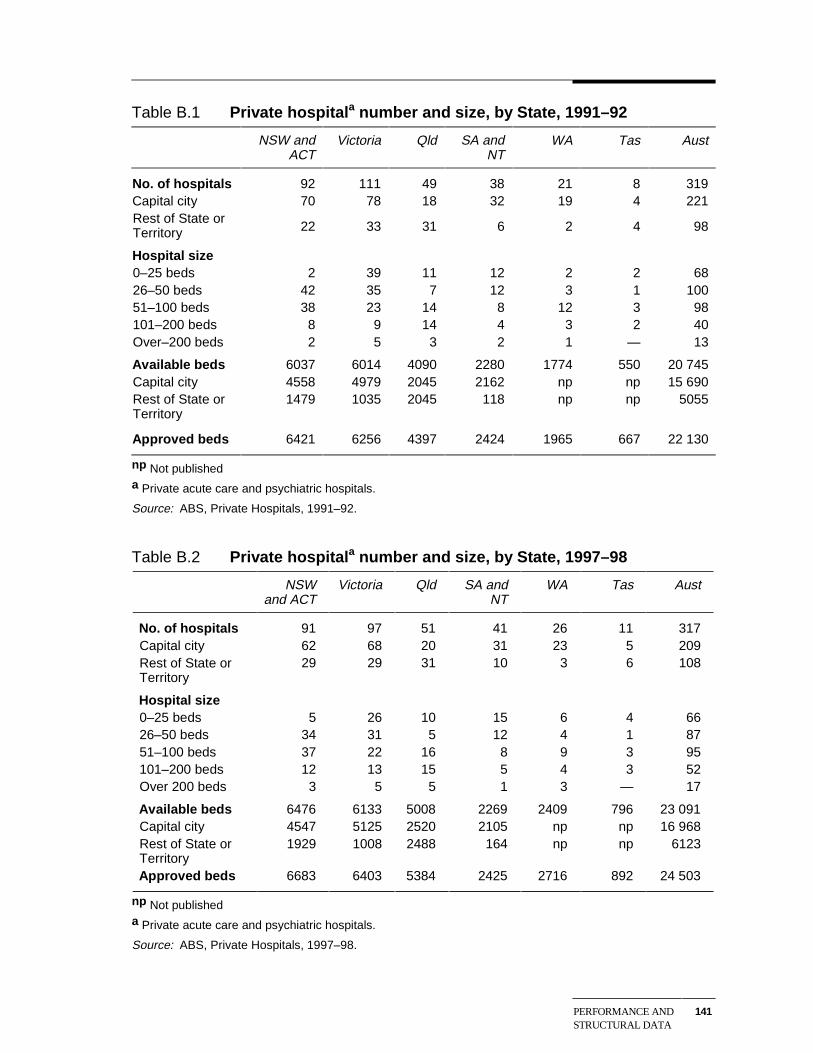
PERFORMANCE ANDSTRUCTURAL DATA
141
Table B.1 Private hospitala number and size, by State, 1991–92
NSW andACT
Victoria Qld SA andNT
WA Tas Aust
No. of hospitals 92 111 49 38 21 8 319Capital city 70 78 18 32 19 4 221Rest of State orTerritory 22 33 31 6 2 4 98
Hospital size0–25 beds 2 39 11 12 2 2 6826–50 beds 42 35 7 12 3 1 10051–100 beds 38 23 14 8 12 3 98101–200 beds 8 9 14 4 3 2 40Over–200 beds 2 5 3 2 1 — 13
Available beds 6037 6014 4090 2280 1774 550 20 745Capital city 4558 4979 2045 2162 np np 15 690Rest of State orTerritory
1479 1035 2045 118 np np 5055
Approved beds 6421 6256 4397 2424 1965 667 22 130
np Not publisheda Private acute care and psychiatric hospitals.
Source: ABS, Private Hospitals, 1991–92.
Table B.2 Private hospitala number and size, by State, 1997–98
NSWand ACT
Victoria Qld SA andNT
WA Tas Aust
No. of hospitals 91 97 51 41 26 11 317Capital city 62 68 20 31 23 5 209Rest of State orTerritory
29 29 31 10 3 6 108
Hospital size0–25 beds 5 26 10 15 6 4 6626–50 beds 34 31 5 12 4 1 8751–100 beds 37 22 16 8 9 3 95101–200 beds 12 13 15 5 4 3 52Over 200 beds 3 5 5 1 3 — 17
Available beds 6476 6133 5008 2269 2409 796 23 091Capital city 4547 5125 2520 2105 np np 16 968Rest of State orTerritory
1929 1008 2488 164 np np 6123
Approved beds 6683 6403 5384 2425 2716 892 24 503
np Not publisheda Private acute care and psychiatric hospitals.
Source: ABS, Private Hospitals, 1997–98.
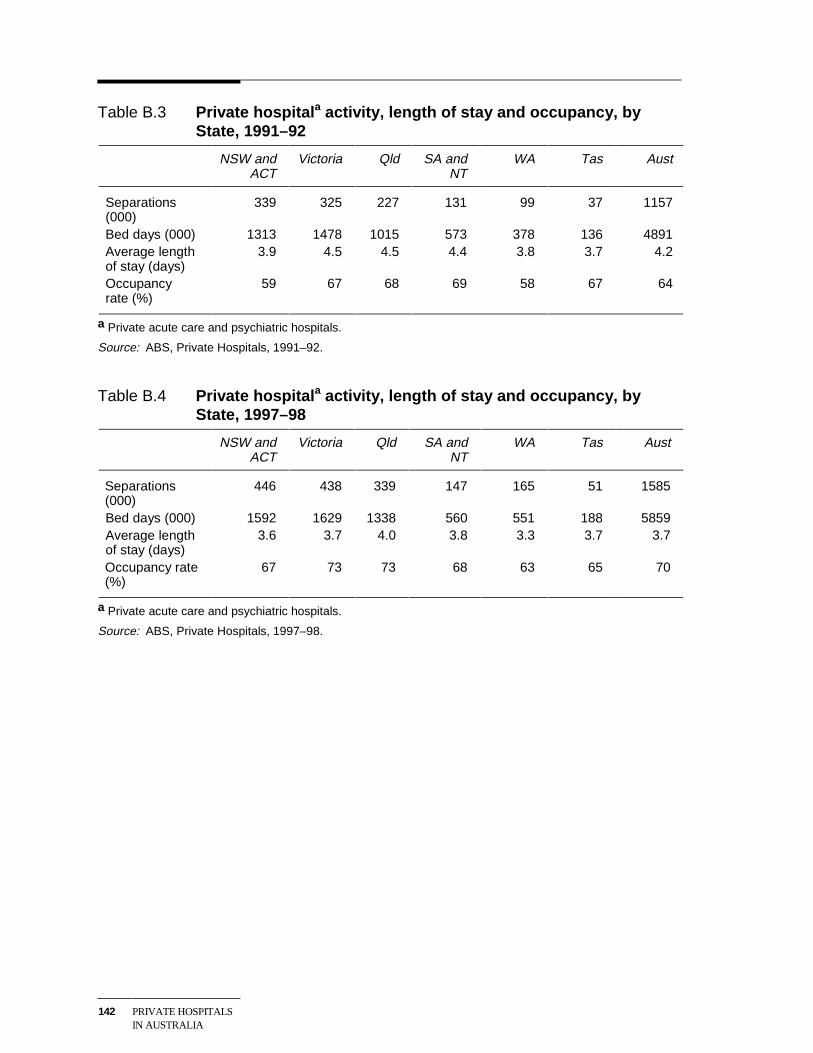
142 PRIVATE HOSPITALSIN AUSTRALIA
Table B.3 Private hospitala activity, length of stay and occupancy, byState, 1991–92
NSW andACT
Victoria Qld SA andNT
WA Tas Aust
Separations(000)
339 325 227 131 99 37 1157
Bed days (000) 1313 1478 1015 573 378 136 4891Average lengthof stay (days)
3.9 4.5 4.5 4.4 3.8 3.7 4.2
Occupancyrate (%)
59 67 68 69 58 67 64
a Private acute care and psychiatric hospitals.
Source: ABS, Private Hospitals, 1991–92.
Table B.4 Private hospitala activity, length of stay and occupancy, byState, 1997–98
NSW andACT
Victoria Qld SA andNT
WA Tas Aust
Separations(000)
446 438 339 147 165 51 1585
Bed days (000) 1592 1629 1338 560 551 188 5859Average lengthof stay (days)
3.6 3.7 4.0 3.8 3.3 3.7 3.7
Occupancy rate(%)
67 73 73 68 63 65 70
a Private acute care and psychiatric hospitals.
Source: ABS, Private Hospitals, 1997–98.
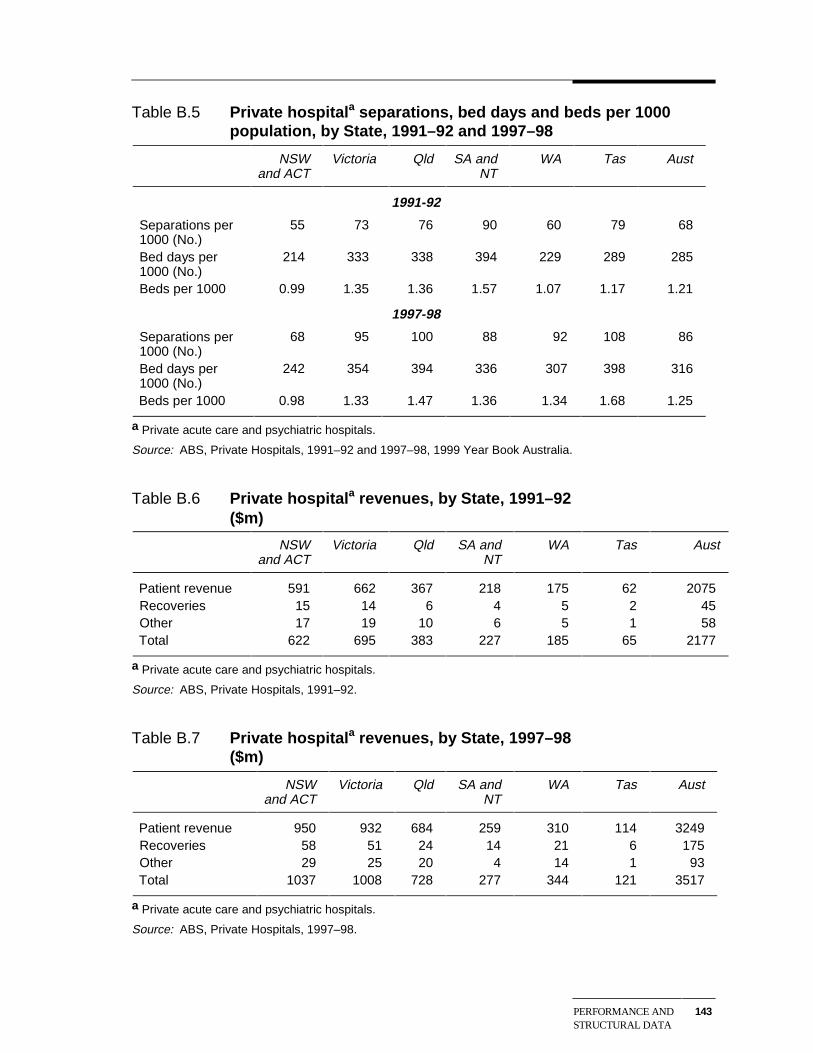
PERFORMANCE ANDSTRUCTURAL DATA
143
Table B.5 Private hospitala separations, bed days and beds per 1000population, by State, 1991–92 and 1997–98
NSWand ACT
Victoria Qld SA andNT
WA Tas Aust
1991-92
Separations per1000 (No.)
55 73 76 90 60 79 68
Bed days per1000 (No.)
214 333 338 394 229 289 285
Beds per 1000 0.99 1.35 1.36 1.57 1.07 1.17 1.21
1997-98
Separations per1000 (No.)
68 95 100 88 92 108 86
Bed days per1000 (No.)
242 354 394 336 307 398 316
Beds per 1000 0.98 1.33 1.47 1.36 1.34 1.68 1.25
a Private acute care and psychiatric hospitals.
Source: ABS, Private Hospitals, 1991–92 and 1997–98, 1999 Year Book Australia.
Table B.6 Private hospitala revenues, by State, 1991–92($m)
NSWand ACT
Victoria Qld SA andNT
WA Tas Aust
Patient revenue 591 662 367 218 175 62 2075Recoveries 15 14 6 4 5 2 45Other 17 19 10 6 5 1 58Total 622 695 383 227 185 65 2177
a Private acute care and psychiatric hospitals.
Source: ABS, Private Hospitals, 1991–92.
Table B.7 Private hospitala revenues, by State, 1997–98($m)
NSWand ACT
Victoria Qld SA andNT
WA Tas Aust
Patient revenue 950 932 684 259 310 114 3249Recoveries 58 51 24 14 21 6 175Other 29 25 20 4 14 1 93Total 1037 1008 728 277 344 121 3517
a Private acute care and psychiatric hospitals.
Source: ABS, Private Hospitals, 1997–98.
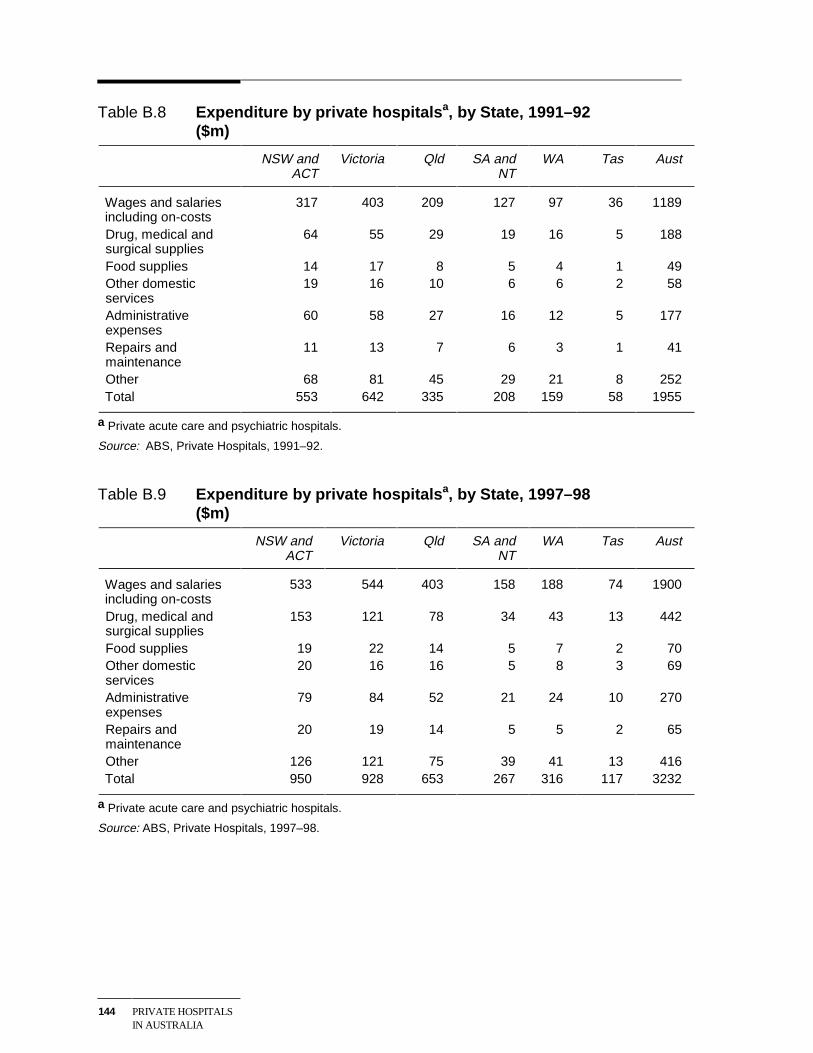
144 PRIVATE HOSPITALSIN AUSTRALIA
Table B.8 Expenditure by private hospitalsa, by State, 1991–92($m)
NSW andACT
Victoria Qld SA andNT
WA Tas Aust
Wages and salariesincluding on-costs
317 403 209 127 97 36 1189
Drug, medical andsurgical supplies
64 55 29 19 16 5 188
Food supplies 14 17 8 5 4 1 49Other domesticservices
19 16 10 6 6 2 58
Administrativeexpenses
60 58 27 16 12 5 177
Repairs andmaintenance
11 13 7 6 3 1 41
Other 68 81 45 29 21 8 252Total 553 642 335 208 159 58 1955
a Private acute care and psychiatric hospitals.
Source: ABS, Private Hospitals, 1991–92.
Table B.9 Expenditure by private hospitalsa, by State, 1997–98($m)
NSW andACT
Victoria Qld SA andNT
WA Tas Aust
Wages and salariesincluding on-costs
533 544 403 158 188 74 1900
Drug, medical andsurgical supplies
153 121 78 34 43 13 442
Food supplies 19 22 14 5 7 2 70Other domesticservices
20 16 16 5 8 3 69
Administrativeexpenses
79 84 52 21 24 10 270
Repairs andmaintenance
20 19 14 5 5 2 65
Other 126 121 75 39 41 13 416Total 950 928 653 267 316 117 3232
a Private acute care and psychiatric hospitals.
Source: ABS, Private Hospitals, 1997–98.
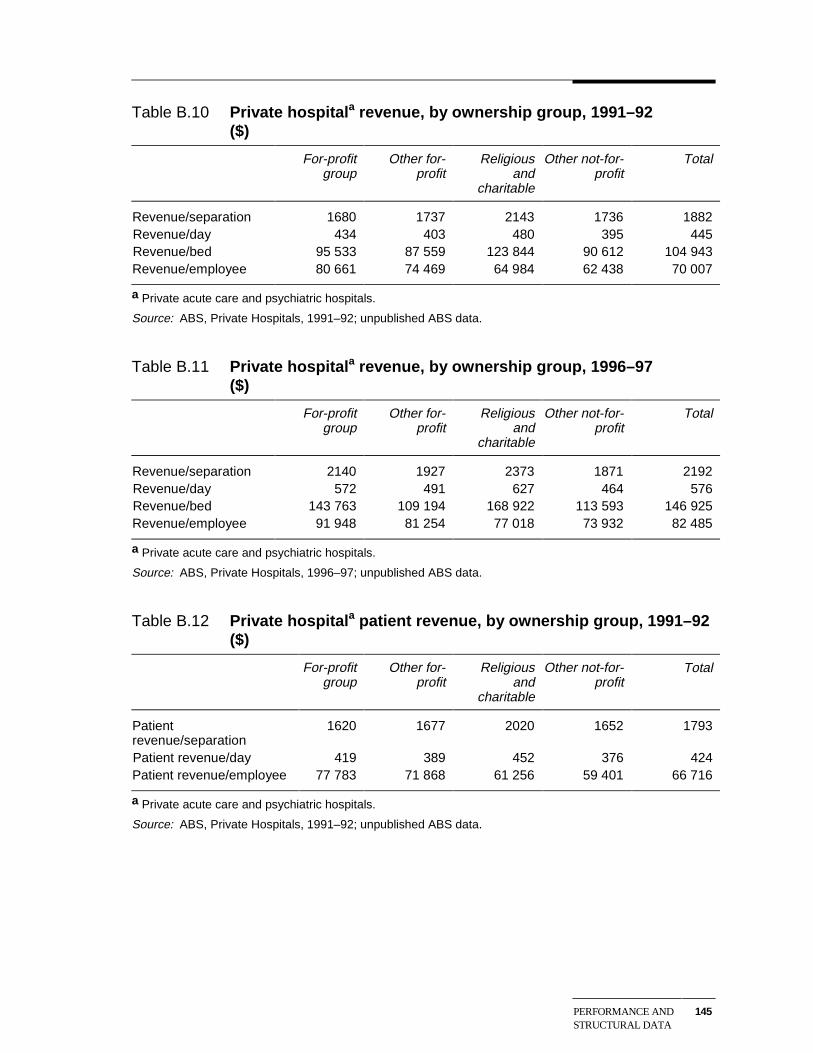
PERFORMANCE ANDSTRUCTURAL DATA
145
Table B.10 Private hospitala revenue, by ownership group, 1991–92($)
For-profitgroup
Other for-profit
Religiousand
charitable
Other not-for-profit
Total
Revenue/separation 1680 1737 2143 1736 1882Revenue/day 434 403 480 395 445Revenue/bed 95 533 87 559 123 844 90 612 104 943Revenue/employee 80 661 74 469 64 984 62 438 70 007
a Private acute care and psychiatric hospitals.
Source: ABS, Private Hospitals, 1991–92; unpublished ABS data.
Table B.11 Private hospitala revenue, by ownership group, 1996–97($)
For-profitgroup
Other for-profit
Religiousand
charitable
Other not-for-profit
Total
Revenue/separation 2140 1927 2373 1871 2192Revenue/day 572 491 627 464 576Revenue/bed 143 763 109 194 168 922 113 593 146 925Revenue/employee 91 948 81 254 77 018 73 932 82 485
a Private acute care and psychiatric hospitals.
Source: ABS, Private Hospitals, 1996–97; unpublished ABS data.
Table B.12 Private hospitala patient revenue, by ownership group, 1991–92($)
For-profitgroup
Other for-profit
Religiousand
charitable
Other not-for-profit
Total
Patientrevenue/separation
1620 1677 2020 1652 1793
Patient revenue/day 419 389 452 376 424Patient revenue/employee 77 783 71 868 61 256 59 401 66 716
a Private acute care and psychiatric hospitals.
Source: ABS, Private Hospitals, 1991–92; unpublished ABS data.
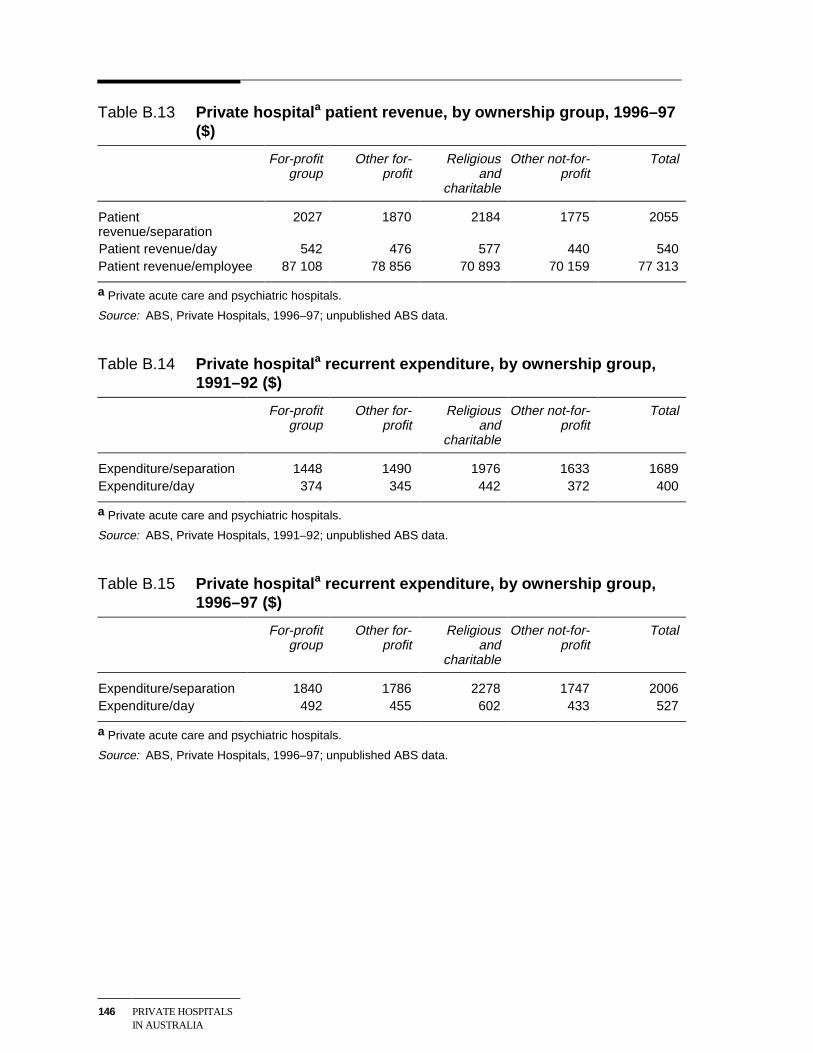
146 PRIVATE HOSPITALSIN AUSTRALIA
Table B.13 Private hospitala patient revenue, by ownership group, 1996–97($)
For-profitgroup
Other for-profit
Religiousand
charitable
Other not-for-profit
Total
Patientrevenue/separation
2027 1870 2184 1775 2055
Patient revenue/day 542 476 577 440 540Patient revenue/employee 87 108 78 856 70 893 70 159 77 313
a Private acute care and psychiatric hospitals.
Source: ABS, Private Hospitals, 1996–97; unpublished ABS data.
Table B.14 Private hospitala recurrent expenditure, by ownership group,1991–92 ($)
For-profitgroup
Other for-profit
Religiousand
charitable
Other not-for-profit
Total
Expenditure/separation 1448 1490 1976 1633 1689Expenditure/day 374 345 442 372 400
a Private acute care and psychiatric hospitals.
Source: ABS, Private Hospitals, 1991–92; unpublished ABS data.
Table B.15 Private hospitala recurrent expenditure, by ownership group,1996–97 ($)
For-profitgroup
Other for-profit
Religiousand
charitable
Other not-for-profit
Total
Expenditure/separation 1840 1786 2278 1747 2006Expenditure/day 492 455 602 433 527
a Private acute care and psychiatric hospitals.
Source: ABS, Private Hospitals, 1996–97; unpublished ABS data.
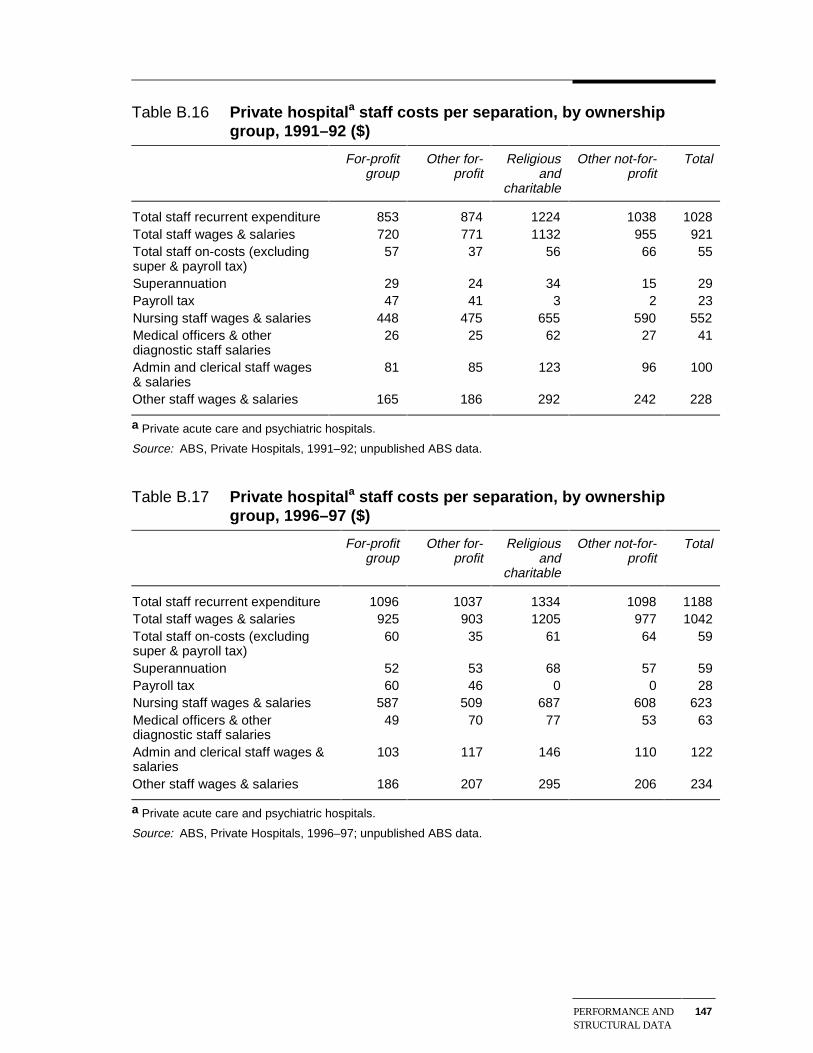
PERFORMANCE ANDSTRUCTURAL DATA
147
Table B.16 Private hospitala staff costs per separation, by ownershipgroup, 1991–92 ($)
For-profitgroup
Other for-profit
Religiousand
charitable
Other not-for-profit
Total
Total staff recurrent expenditure 853 874 1224 1038 1028Total staff wages & salaries 720 771 1132 955 921Total staff on-costs (excludingsuper & payroll tax)
57 37 56 66 55
Superannuation 29 24 34 15 29Payroll tax 47 41 3 2 23Nursing staff wages & salaries 448 475 655 590 552Medical officers & otherdiagnostic staff salaries
26 25 62 27 41
Admin and clerical staff wages& salaries
81 85 123 96 100
Other staff wages & salaries 165 186 292 242 228
a Private acute care and psychiatric hospitals.
Source: ABS, Private Hospitals, 1991–92; unpublished ABS data.
Table B.17 Private hospitala staff costs per separation, by ownershipgroup, 1996–97 ($)
For-profitgroup
Other for-profit
Religiousand
charitable
Other not-for-profit
Total
Total staff recurrent expenditure 1096 1037 1334 1098 1188Total staff wages & salaries 925 903 1205 977 1042Total staff on-costs (excludingsuper & payroll tax)
60 35 61 64 59
Superannuation 52 53 68 57 59Payroll tax 60 46 0 0 28Nursing staff wages & salaries 587 509 687 608 623Medical officers & otherdiagnostic staff salaries
49 70 77 53 63
Admin and clerical staff wages &salaries
103 117 146 110 122
Other staff wages & salaries 186 207 295 206 234
a Private acute care and psychiatric hospitals.
Source: ABS, Private Hospitals, 1996–97; unpublished ABS data.
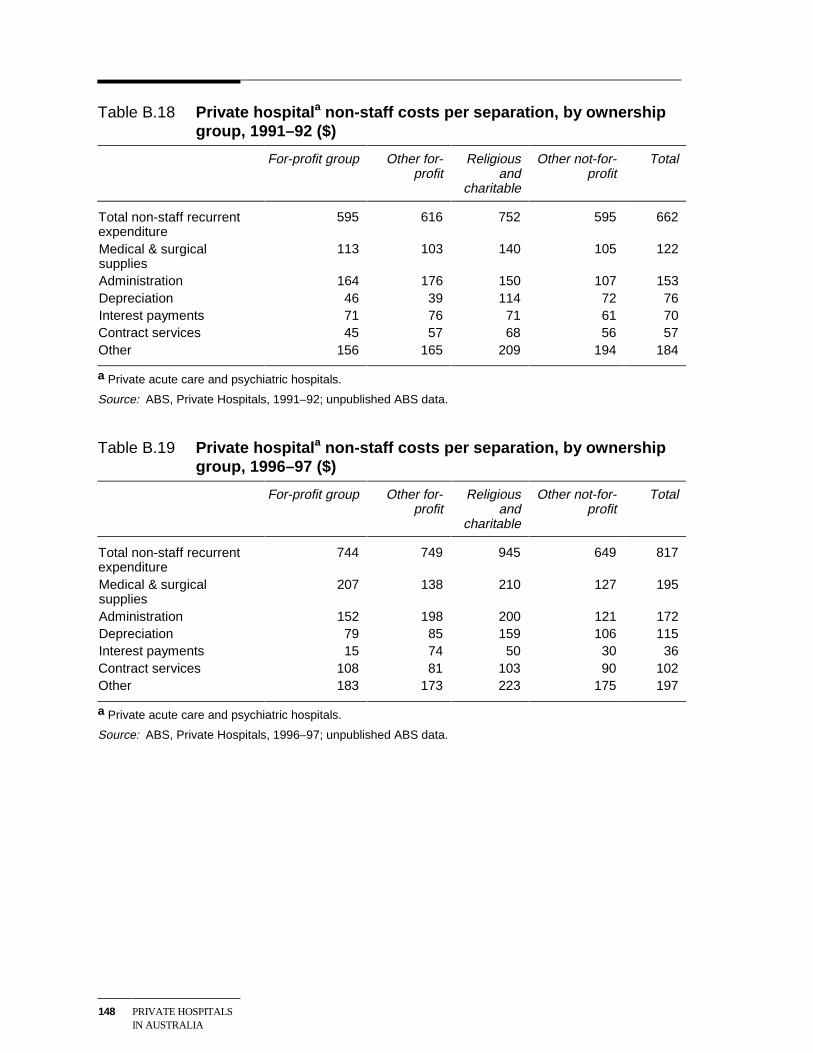
148 PRIVATE HOSPITALSIN AUSTRALIA
Table B.18 Private hospitala non-staff costs per separation, by ownershipgroup, 1991–92 ($)
For-profit group Other for-profit
Religiousand
charitable
Other not-for-profit
Total
Total non-staff recurrentexpenditure
595 616 752 595 662
Medical & surgicalsupplies
113 103 140 105 122
Administration 164 176 150 107 153Depreciation 46 39 114 72 76Interest payments 71 76 71 61 70Contract services 45 57 68 56 57Other 156 165 209 194 184
a Private acute care and psychiatric hospitals.
Source: ABS, Private Hospitals, 1991–92; unpublished ABS data.
Table B.19 Private hospitala non-staff costs per separation, by ownershipgroup, 1996–97 ($)
For-profit group Other for-profit
Religiousand
charitable
Other not-for-profit
Total
Total non-staff recurrentexpenditure
744 749 945 649 817
Medical & surgicalsupplies
207 138 210 127 195
Administration 152 198 200 121 172Depreciation 79 85 159 106 115Interest payments 15 74 50 30 36Contract services 108 81 103 90 102Other 183 173 223 175 197
a Private acute care and psychiatric hospitals.
Source: ABS, Private Hospitals, 1996–97; unpublished ABS data.
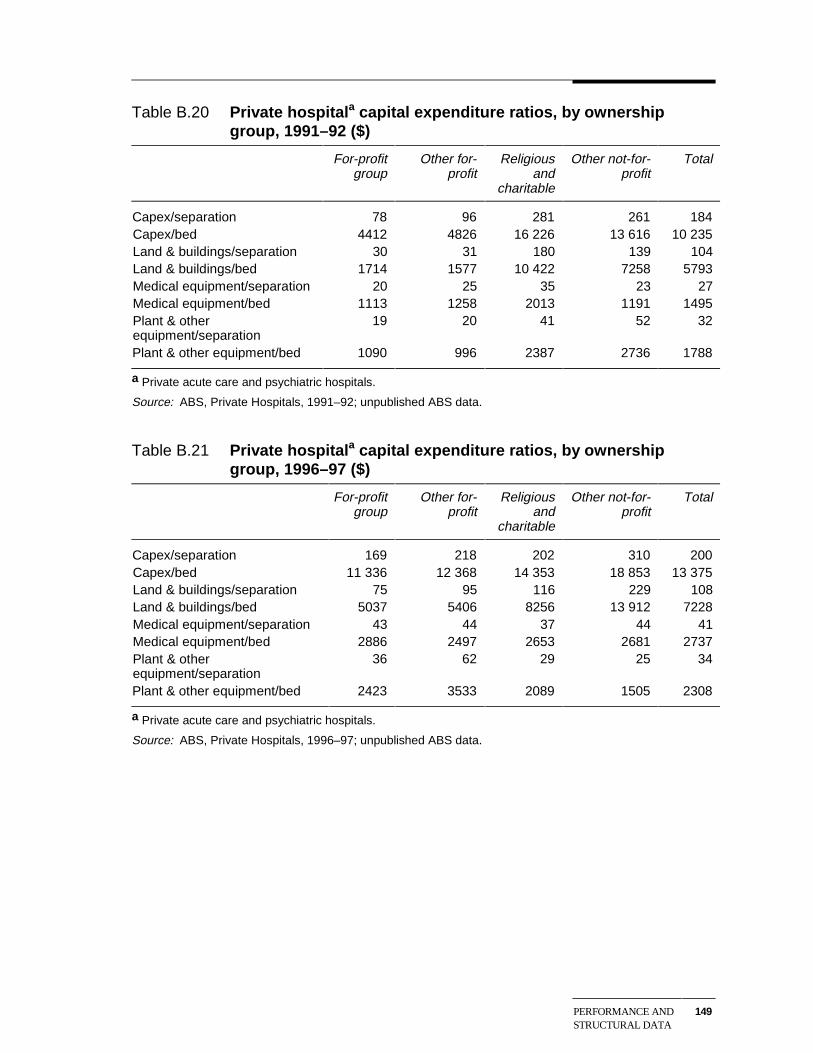
PERFORMANCE ANDSTRUCTURAL DATA
149
Table B.20 Private hospitala capital expenditure ratios, by ownershipgroup, 1991–92 ($)
For-profitgroup
Other for-profit
Religiousand
charitable
Other not-for-profit
Total
Capex/separation 78 96 281 261 184Capex/bed 4412 4826 16 226 13 616 10 235Land & buildings/separation 30 31 180 139 104Land & buildings/bed 1714 1577 10 422 7258 5793Medical equipment/separation 20 25 35 23 27Medical equipment/bed 1113 1258 2013 1191 1495Plant & otherequipment/separation
19 20 41 52 32
Plant & other equipment/bed 1090 996 2387 2736 1788
a Private acute care and psychiatric hospitals.
Source: ABS, Private Hospitals, 1991–92; unpublished ABS data.
Table B.21 Private hospitala capital expenditure ratios, by ownershipgroup, 1996–97 ($)
For-profitgroup
Other for-profit
Religiousand
charitable
Other not-for-profit
Total
Capex/separation 169 218 202 310 200Capex/bed 11 336 12 368 14 353 18 853 13 375Land & buildings/separation 75 95 116 229 108Land & buildings/bed 5037 5406 8256 13 912 7228Medical equipment/separation 43 44 37 44 41Medical equipment/bed 2886 2497 2653 2681 2737Plant & otherequipment/separation
36 62 29 25 34
Plant & other equipment/bed 2423 3533 2089 1505 2308
a Private acute care and psychiatric hospitals.
Source: ABS, Private Hospitals, 1996–97; unpublished ABS data.
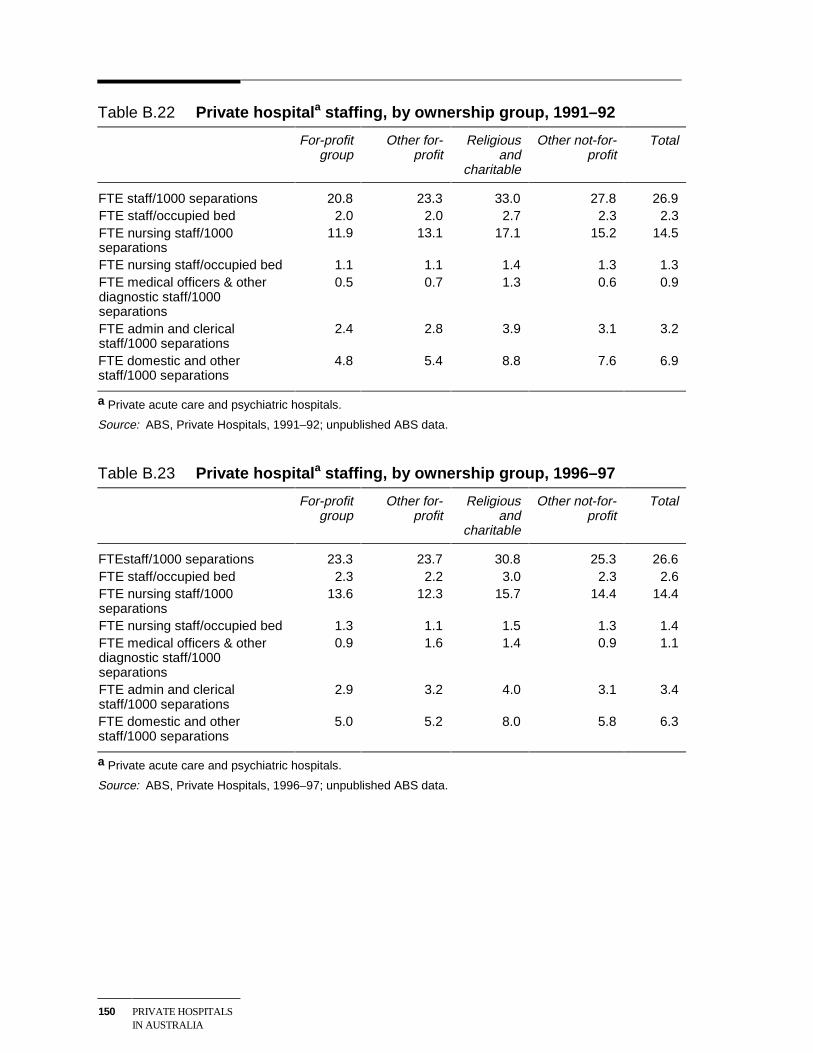
150 PRIVATE HOSPITALSIN AUSTRALIA
Table B.22 Private hospitala staffing, by ownership group, 1991–92
For-profitgroup
Other for-profit
Religiousand
charitable
Other not-for-profit
Total
FTE staff/1000 separations 20.8 23.3 33.0 27.8 26.9FTE staff/occupied bed 2.0 2.0 2.7 2.3 2.3FTE nursing staff/1000separations
11.9 13.1 17.1 15.2 14.5
FTE nursing staff/occupied bed 1.1 1.1 1.4 1.3 1.3FTE medical officers & otherdiagnostic staff/1000separations
0.5 0.7 1.3 0.6 0.9
FTE admin and clericalstaff/1000 separations
2.4 2.8 3.9 3.1 3.2
FTE domestic and otherstaff/1000 separations
4.8 5.4 8.8 7.6 6.9
a Private acute care and psychiatric hospitals.
Source: ABS, Private Hospitals, 1991–92; unpublished ABS data.
Table B.23 Private hospitala staffing, by ownership group, 1996–97
For-profitgroup
Other for-profit
Religiousand
charitable
Other not-for-profit
Total
FTEstaff/1000 separations 23.3 23.7 30.8 25.3 26.6FTE staff/occupied bed 2.3 2.2 3.0 2.3 2.6FTE nursing staff/1000separations
13.6 12.3 15.7 14.4 14.4
FTE nursing staff/occupied bed 1.3 1.1 1.5 1.3 1.4FTE medical officers & otherdiagnostic staff/1000separations
0.9 1.6 1.4 0.9 1.1
FTE admin and clericalstaff/1000 separations
2.9 3.2 4.0 3.1 3.4
FTE domestic and otherstaff/1000 separations
5.0 5.2 8.0 5.8 6.3
a Private acute care and psychiatric hospitals.
Source: ABS, Private Hospitals, 1996–97; unpublished ABS data.
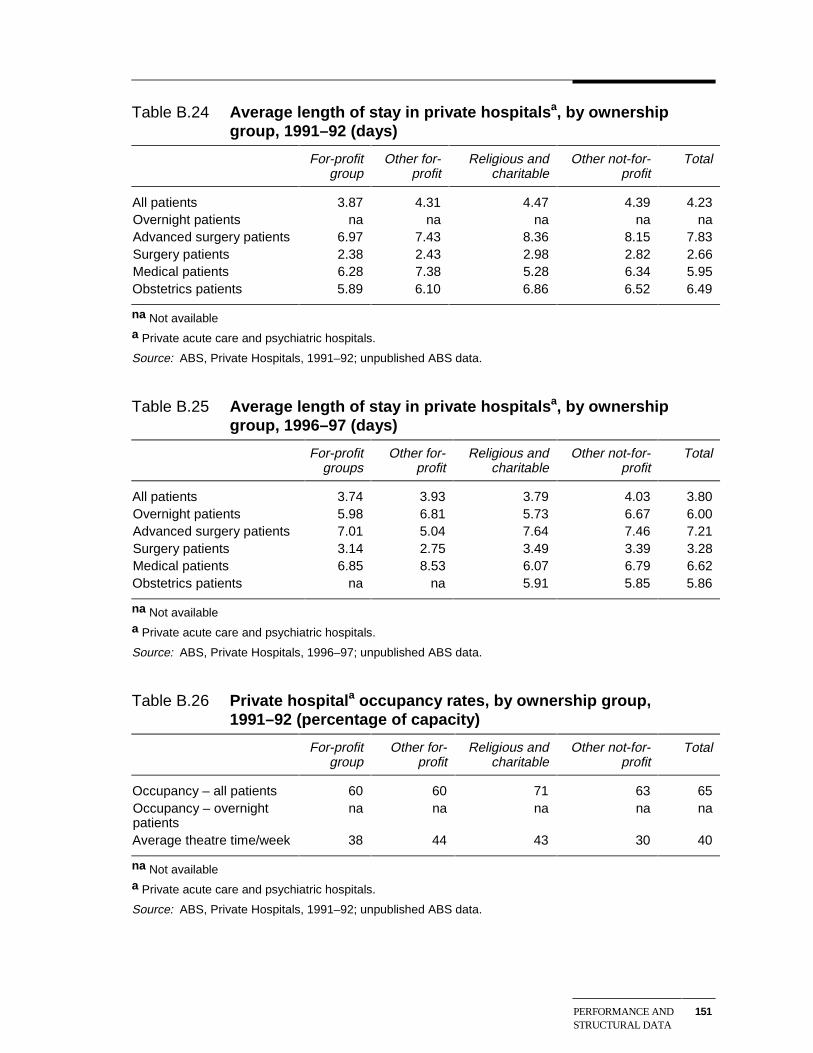
PERFORMANCE ANDSTRUCTURAL DATA
151
Table B.24 Average length of stay in private hospitalsa, by ownershipgroup, 1991–92 (days)
For-profitgroup
Other for-profit
Religious andcharitable
Other not-for-profit
Total
All patients 3.87 4.31 4.47 4.39 4.23Overnight patients na na na na naAdvanced surgery patients 6.97 7.43 8.36 8.15 7.83Surgery patients 2.38 2.43 2.98 2.82 2.66Medical patients 6.28 7.38 5.28 6.34 5.95Obstetrics patients 5.89 6.10 6.86 6.52 6.49
na Not availablea Private acute care and psychiatric hospitals.
Source: ABS, Private Hospitals, 1991–92; unpublished ABS data.
Table B.25 Average length of stay in private hospitalsa, by ownershipgroup, 1996–97 (days)
For-profitgroups
Other for-profit
Religious andcharitable
Other not-for-profit
Total
All patients 3.74 3.93 3.79 4.03 3.80Overnight patients 5.98 6.81 5.73 6.67 6.00Advanced surgery patients 7.01 5.04 7.64 7.46 7.21Surgery patients 3.14 2.75 3.49 3.39 3.28Medical patients 6.85 8.53 6.07 6.79 6.62Obstetrics patients na na 5.91 5.85 5.86
na Not availablea Private acute care and psychiatric hospitals.
Source: ABS, Private Hospitals, 1996–97; unpublished ABS data.
Table B.26 Private hospitala occupancy rates, by ownership group,1991–92 (percentage of capacity)
For-profitgroup
Other for-profit
Religious andcharitable
Other not-for-profit
Total
Occupancy – all patients 60 60 71 63 65Occupancy – overnightpatients
na na na na na
Average theatre time/week 38 44 43 30 40
na Not availablea Private acute care and psychiatric hospitals.
Source: ABS, Private Hospitals, 1991–92; unpublished ABS data.
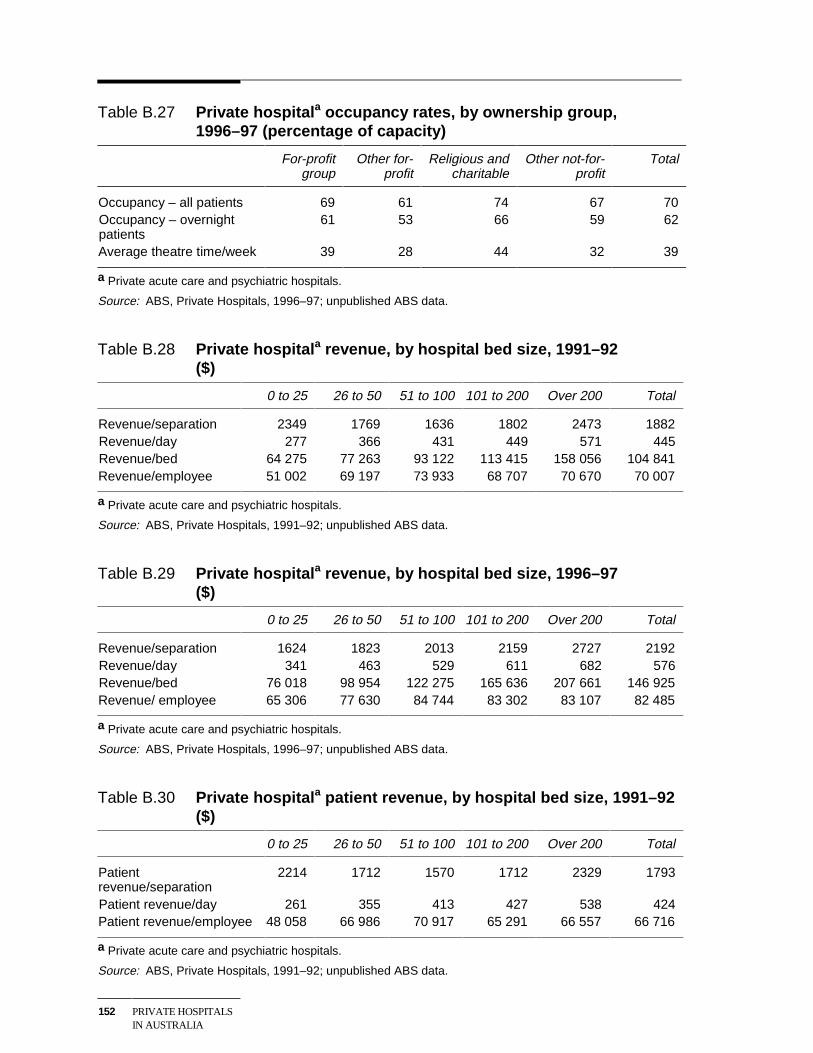
152 PRIVATE HOSPITALSIN AUSTRALIA
Table B.27 Private hospitala occupancy rates, by ownership group,1996–97 (percentage of capacity)
For-profitgroup
Other for-profit
Religious andcharitable
Other not-for-profit
Total
Occupancy – all patients 69 61 74 67 70Occupancy – overnightpatients
61 53 66 59 62
Average theatre time/week 39 28 44 32 39
a Private acute care and psychiatric hospitals.
Source: ABS, Private Hospitals, 1996–97; unpublished ABS data.
Table B.28 Private hospitala revenue, by hospital bed size, 1991–92($)
0 to 25 26 to 50 51 to 100 101 to 200 Over 200 Total
Revenue/separation 2349 1769 1636 1802 2473 1882Revenue/day 277 366 431 449 571 445Revenue/bed 64 275 77 263 93 122 113 415 158 056 104 841Revenue/employee 51 002 69 197 73 933 68 707 70 670 70 007
a Private acute care and psychiatric hospitals.
Source: ABS, Private Hospitals, 1991–92; unpublished ABS data.
Table B.29 Private hospitala revenue, by hospital bed size, 1996–97($)
0 to 25 26 to 50 51 to 100 101 to 200 Over 200 Total
Revenue/separation 1624 1823 2013 2159 2727 2192Revenue/day 341 463 529 611 682 576Revenue/bed 76 018 98 954 122 275 165 636 207 661 146 925Revenue/ employee 65 306 77 630 84 744 83 302 83 107 82 485
a Private acute care and psychiatric hospitals.
Source: ABS, Private Hospitals, 1996–97; unpublished ABS data.
Table B.30 Private hospitala patient revenue, by hospital bed size, 1991–92($)
0 to 25 26 to 50 51 to 100 101 to 200 Over 200 Total
Patientrevenue/separation
2214 1712 1570 1712 2329 1793
Patient revenue/day 261 355 413 427 538 424Patient revenue/employee 48 058 66 986 70 917 65 291 66 557 66 716
a Private acute care and psychiatric hospitals.
Source: ABS, Private Hospitals, 1991–92; unpublished ABS data.
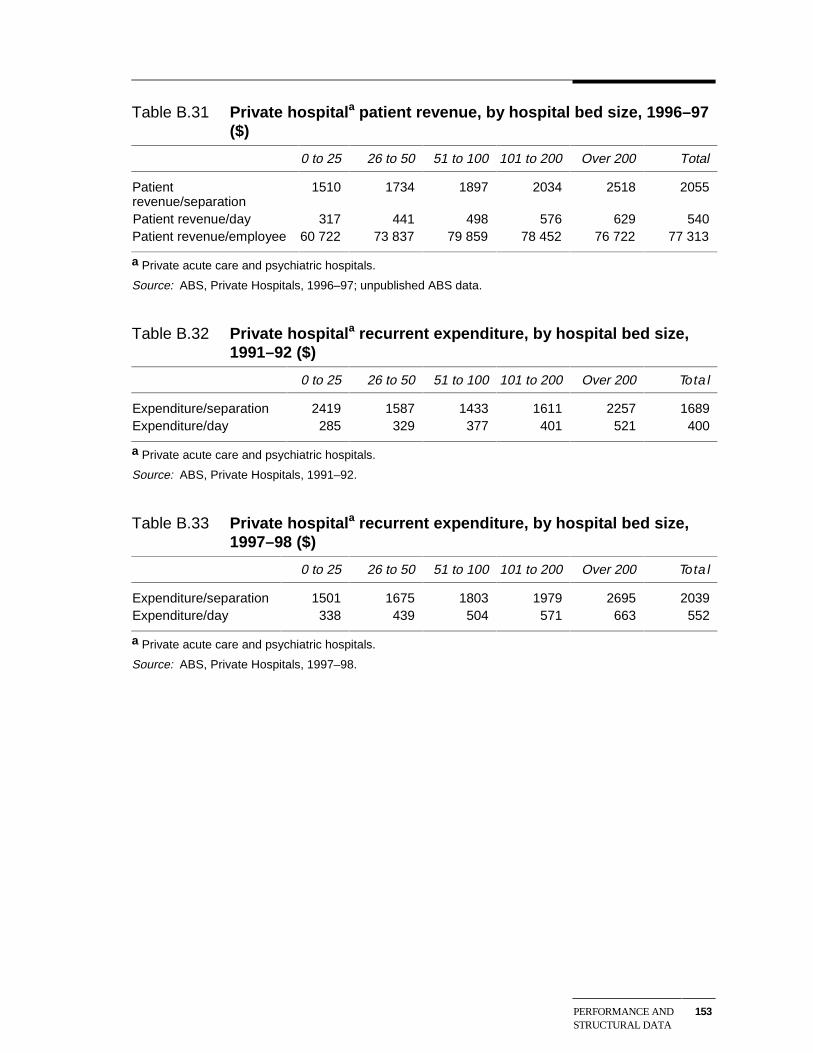
PERFORMANCE ANDSTRUCTURAL DATA
153
Table B.31 Private hospitala patient revenue, by hospital bed size, 1996–97($)
0 to 25 26 to 50 51 to 100 101 to 200 Over 200 Total
Patientrevenue/separation
1510 1734 1897 2034 2518 2055
Patient revenue/day 317 441 498 576 629 540Patient revenue/employee 60 722 73 837 79 859 78 452 76 722 77 313
a Private acute care and psychiatric hospitals.
Source: ABS, Private Hospitals, 1996–97; unpublished ABS data.
Table B.32 Private hospitala recurrent expenditure, by hospital bed size,1991–92 ($)
0 to 25 26 to 50 51 to 100 101 to 200 Over 200 Total
Expenditure/separation 2419 1587 1433 1611 2257 1689Expenditure/day 285 329 377 401 521 400
a Private acute care and psychiatric hospitals.
Source: ABS, Private Hospitals, 1991–92.
Table B.33 Private hospitala recurrent expenditure, by hospital bed size,1997–98 ($)
0 to 25 26 to 50 51 to 100 101 to 200 Over 200 Total
Expenditure/separation 1501 1675 1803 1979 2695 2039Expenditure/day 338 439 504 571 663 552
a Private acute care and psychiatric hospitals.
Source: ABS, Private Hospitals, 1997–98.
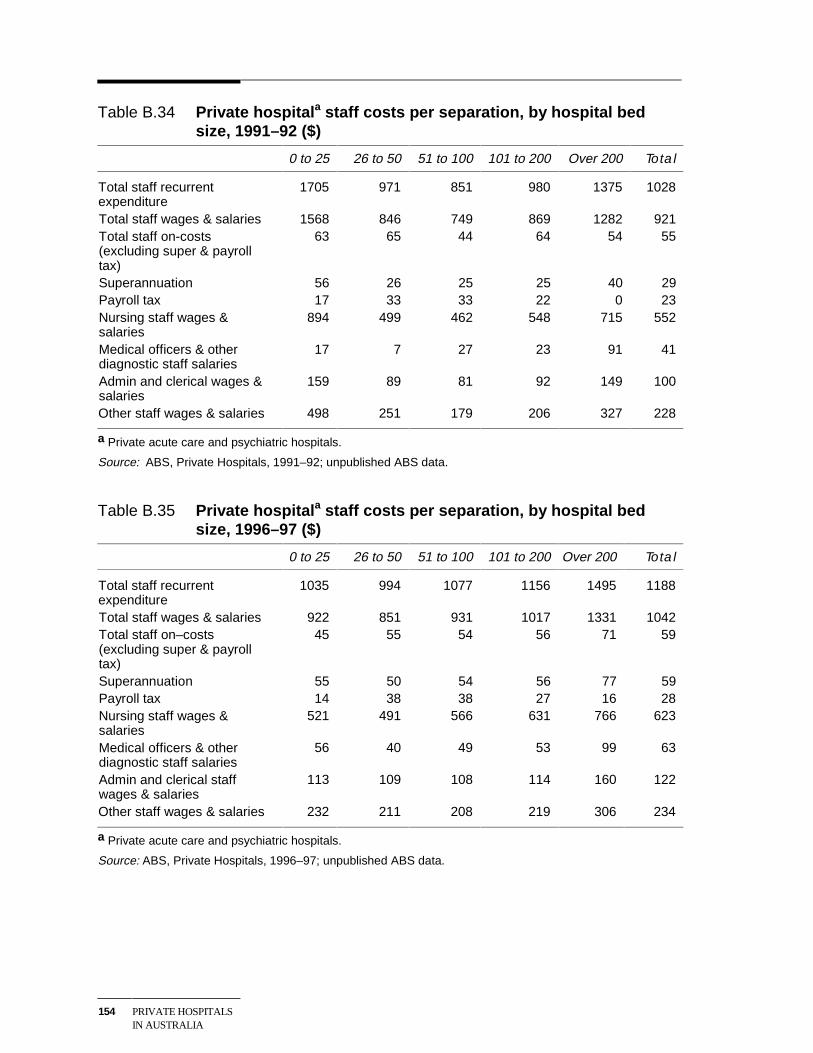
154 PRIVATE HOSPITALSIN AUSTRALIA
Table B.34 Private hospitala staff costs per separation, by hospital bedsize, 1991–92 ($)
0 to 25 26 to 50 51 to 100 101 to 200 Over 200 Total
Total staff recurrentexpenditure
1705 971 851 980 1375 1028
Total staff wages & salaries 1568 846 749 869 1282 921Total staff on-costs(excluding super & payrolltax)
63 65 44 64 54 55
Superannuation 56 26 25 25 40 29Payroll tax 17 33 33 22 0 23Nursing staff wages &salaries
894 499 462 548 715 552
Medical officers & otherdiagnostic staff salaries
17 7 27 23 91 41
Admin and clerical wages &salaries
159 89 81 92 149 100
Other staff wages & salaries 498 251 179 206 327 228
a Private acute care and psychiatric hospitals.
Source: ABS, Private Hospitals, 1991–92; unpublished ABS data.
Table B.35 Private hospitala staff costs per separation, by hospital bedsize, 1996–97 ($)
0 to 25 26 to 50 51 to 100 101 to 200 Over 200 Total
Total staff recurrentexpenditure
1035 994 1077 1156 1495 1188
Total staff wages & salaries 922 851 931 1017 1331 1042Total staff on–costs(excluding super & payrolltax)
45 55 54 56 71 59
Superannuation 55 50 54 56 77 59Payroll tax 14 38 38 27 16 28Nursing staff wages &salaries
521 491 566 631 766 623
Medical officers & otherdiagnostic staff salaries
56 40 49 53 99 63
Admin and clerical staffwages & salaries
113 109 108 114 160 122
Other staff wages & salaries 232 211 208 219 306 234
a Private acute care and psychiatric hospitals.
Source: ABS, Private Hospitals, 1996–97; unpublished ABS data.
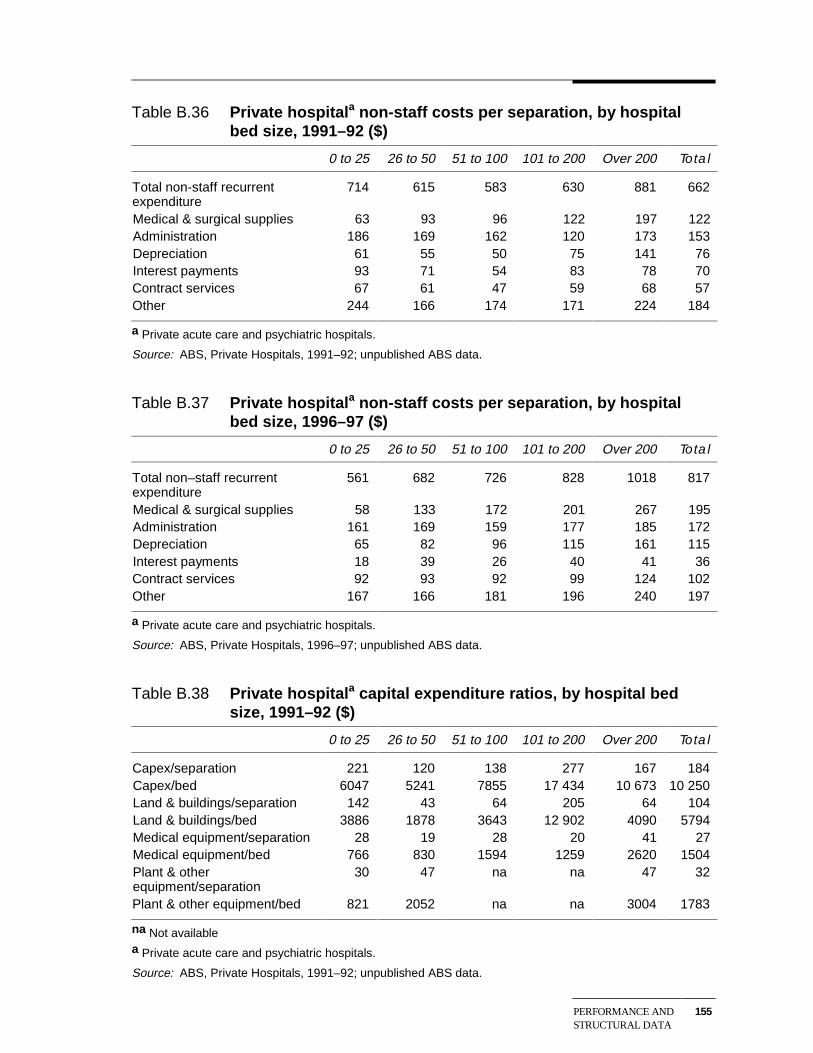
PERFORMANCE ANDSTRUCTURAL DATA
155
Table B.36 Private hospitala non-staff costs per separation, by hospitalbed size, 1991–92 ($)
0 to 25 26 to 50 51 to 100 101 to 200 Over 200 Total
Total non-staff recurrentexpenditure
714 615 583 630 881 662
Medical & surgical supplies 63 93 96 122 197 122Administration 186 169 162 120 173 153Depreciation 61 55 50 75 141 76Interest payments 93 71 54 83 78 70Contract services 67 61 47 59 68 57Other 244 166 174 171 224 184
a Private acute care and psychiatric hospitals.
Source: ABS, Private Hospitals, 1991–92; unpublished ABS data.
Table B.37 Private hospitala non-staff costs per separation, by hospitalbed size, 1996–97 ($)
0 to 25 26 to 50 51 to 100 101 to 200 Over 200 Total
Total non–staff recurrentexpenditure
561 682 726 828 1018 817
Medical & surgical supplies 58 133 172 201 267 195Administration 161 169 159 177 185 172Depreciation 65 82 96 115 161 115Interest payments 18 39 26 40 41 36Contract services 92 93 92 99 124 102Other 167 166 181 196 240 197
a Private acute care and psychiatric hospitals.
Source: ABS, Private Hospitals, 1996–97; unpublished ABS data.
Table B.38 Private hospitala capital expenditure ratios, by hospital bedsize, 1991–92 ($)
0 to 25 26 to 50 51 to 100 101 to 200 Over 200 Total
Capex/separation 221 120 138 277 167 184Capex/bed 6047 5241 7855 17 434 10 673 10 250Land & buildings/separation 142 43 64 205 64 104Land & buildings/bed 3886 1878 3643 12 902 4090 5794Medical equipment/separation 28 19 28 20 41 27Medical equipment/bed 766 830 1594 1259 2620 1504Plant & otherequipment/separation
30 47 na na 47 32
Plant & other equipment/bed 821 2052 na na 3004 1783
na Not availablea Private acute care and psychiatric hospitals.
Source: ABS, Private Hospitals, 1991–92; unpublished ABS data.
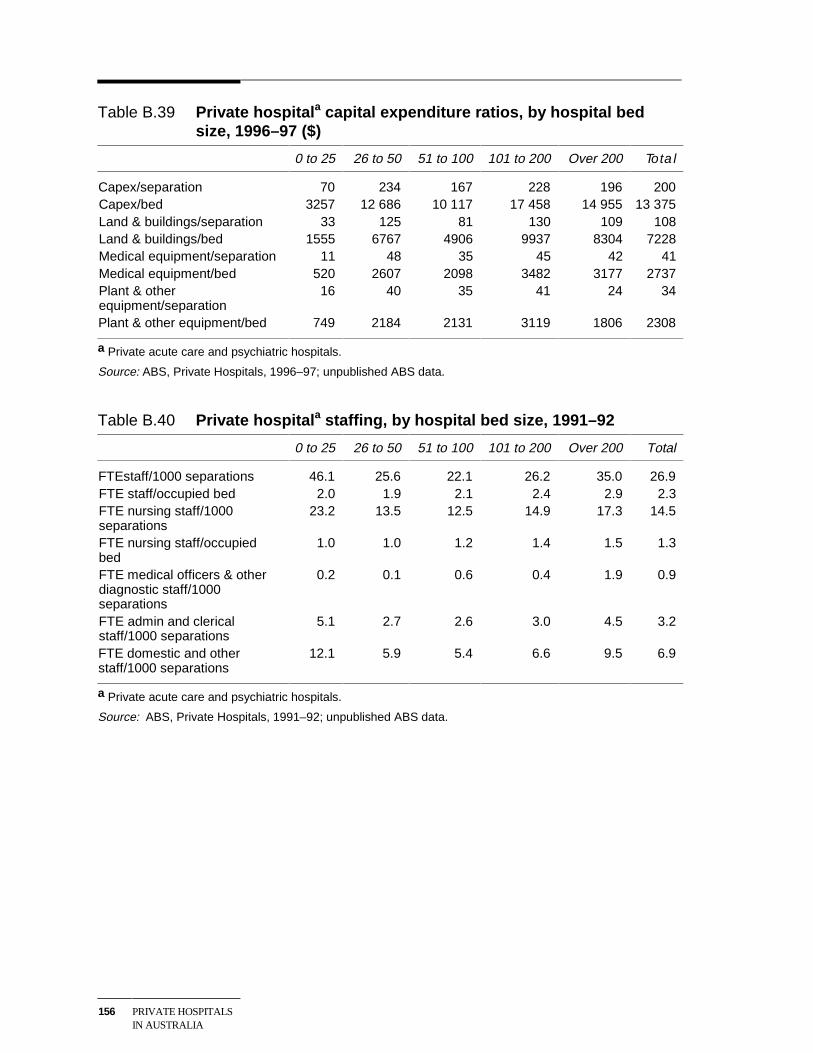
156 PRIVATE HOSPITALSIN AUSTRALIA
Table B.39 Private hospitala capital expenditure ratios, by hospital bedsize, 1996–97 ($)
0 to 25 26 to 50 51 to 100 101 to 200 Over 200 Total
Capex/separation 70 234 167 228 196 200Capex/bed 3257 12 686 10 117 17 458 14 955 13 375Land & buildings/separation 33 125 81 130 109 108Land & buildings/bed 1555 6767 4906 9937 8304 7228Medical equipment/separation 11 48 35 45 42 41Medical equipment/bed 520 2607 2098 3482 3177 2737Plant & otherequipment/separation
16 40 35 41 24 34
Plant & other equipment/bed 749 2184 2131 3119 1806 2308
a Private acute care and psychiatric hospitals.
Source: ABS, Private Hospitals, 1996–97; unpublished ABS data.
Table B.40 Private hospitala staffing, by hospital bed size, 1991–92
0 to 25 26 to 50 51 to 100 101 to 200 Over 200 Total
FTEstaff/1000 separations 46.1 25.6 22.1 26.2 35.0 26.9FTE staff/occupied bed 2.0 1.9 2.1 2.4 2.9 2.3FTE nursing staff/1000separations
23.2 13.5 12.5 14.9 17.3 14.5
FTE nursing staff/occupiedbed
1.0 1.0 1.2 1.4 1.5 1.3
FTE medical officers & otherdiagnostic staff/1000separations
0.2 0.1 0.6 0.4 1.9 0.9
FTE admin and clericalstaff/1000 separations
5.1 2.7 2.6 3.0 4.5 3.2
FTE domestic and otherstaff/1000 separations
12.1 5.9 5.4 6.6 9.5 6.9
a Private acute care and psychiatric hospitals.
Source: ABS, Private Hospitals, 1991–92; unpublished ABS data.
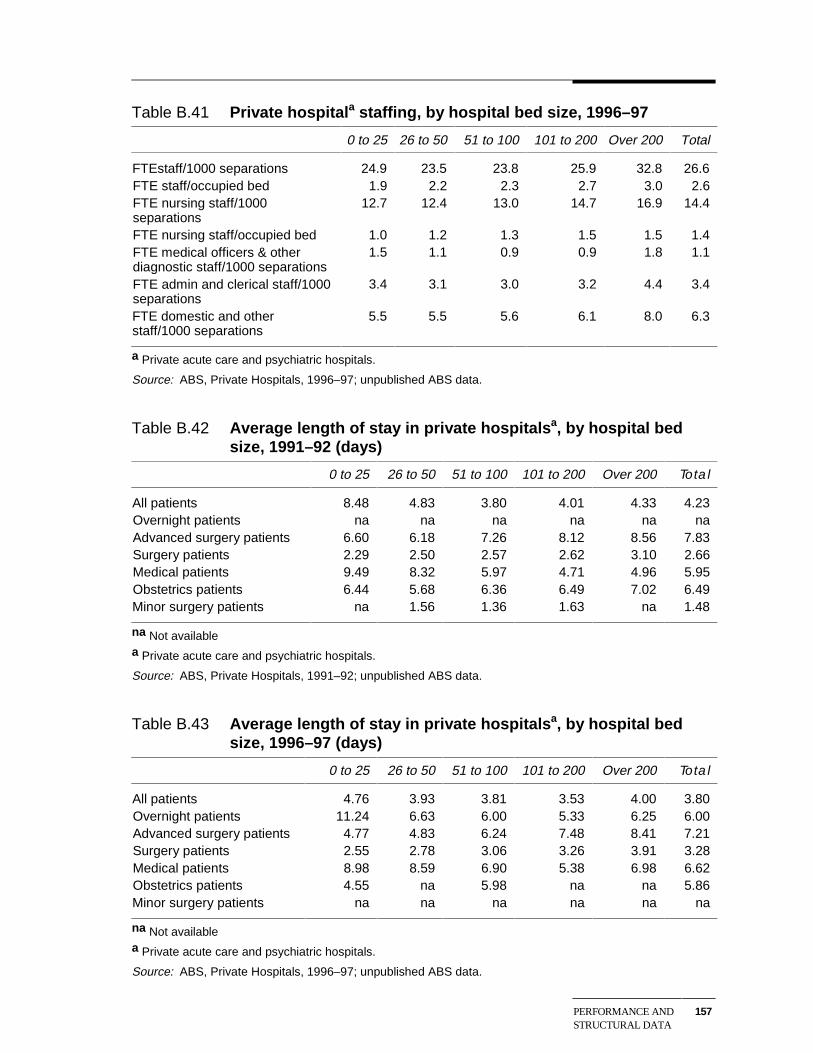
PERFORMANCE ANDSTRUCTURAL DATA
157
Table B.41 Private hospitala staffing, by hospital bed size, 1996–97
0 to 25 26 to 50 51 to 100 101 to 200 Over 200 Total
FTEstaff/1000 separations 24.9 23.5 23.8 25.9 32.8 26.6FTE staff/occupied bed 1.9 2.2 2.3 2.7 3.0 2.6FTE nursing staff/1000separations
12.7 12.4 13.0 14.7 16.9 14.4
FTE nursing staff/occupied bed 1.0 1.2 1.3 1.5 1.5 1.4FTE medical officers & otherdiagnostic staff/1000 separations
1.5 1.1 0.9 0.9 1.8 1.1
FTE admin and clerical staff/1000separations
3.4 3.1 3.0 3.2 4.4 3.4
FTE domestic and otherstaff/1000 separations
5.5 5.5 5.6 6.1 8.0 6.3
a Private acute care and psychiatric hospitals.
Source: ABS, Private Hospitals, 1996–97; unpublished ABS data.
Table B.42 Average length of stay in private hospitalsa, by hospital bedsize, 1991–92 (days)
0 to 25 26 to 50 51 to 100 101 to 200 Over 200 Total
All patients 8.48 4.83 3.80 4.01 4.33 4.23Overnight patients na na na na na naAdvanced surgery patients 6.60 6.18 7.26 8.12 8.56 7.83Surgery patients 2.29 2.50 2.57 2.62 3.10 2.66Medical patients 9.49 8.32 5.97 4.71 4.96 5.95Obstetrics patients 6.44 5.68 6.36 6.49 7.02 6.49Minor surgery patients na 1.56 1.36 1.63 na 1.48
na Not availablea Private acute care and psychiatric hospitals.
Source: ABS, Private Hospitals, 1991–92; unpublished ABS data.
Table B.43 Average length of stay in private hospitalsa, by hospital bedsize, 1996–97 (days)
0 to 25 26 to 50 51 to 100 101 to 200 Over 200 Total
All patients 4.76 3.93 3.81 3.53 4.00 3.80Overnight patients 11.24 6.63 6.00 5.33 6.25 6.00Advanced surgery patients 4.77 4.83 6.24 7.48 8.41 7.21Surgery patients 2.55 2.78 3.06 3.26 3.91 3.28Medical patients 8.98 8.59 6.90 5.38 6.98 6.62Obstetrics patients 4.55 na 5.98 na na 5.86Minor surgery patients na na na na na na
na Not availablea Private acute care and psychiatric hospitals.
Source: ABS, Private Hospitals, 1996–97; unpublished ABS data.
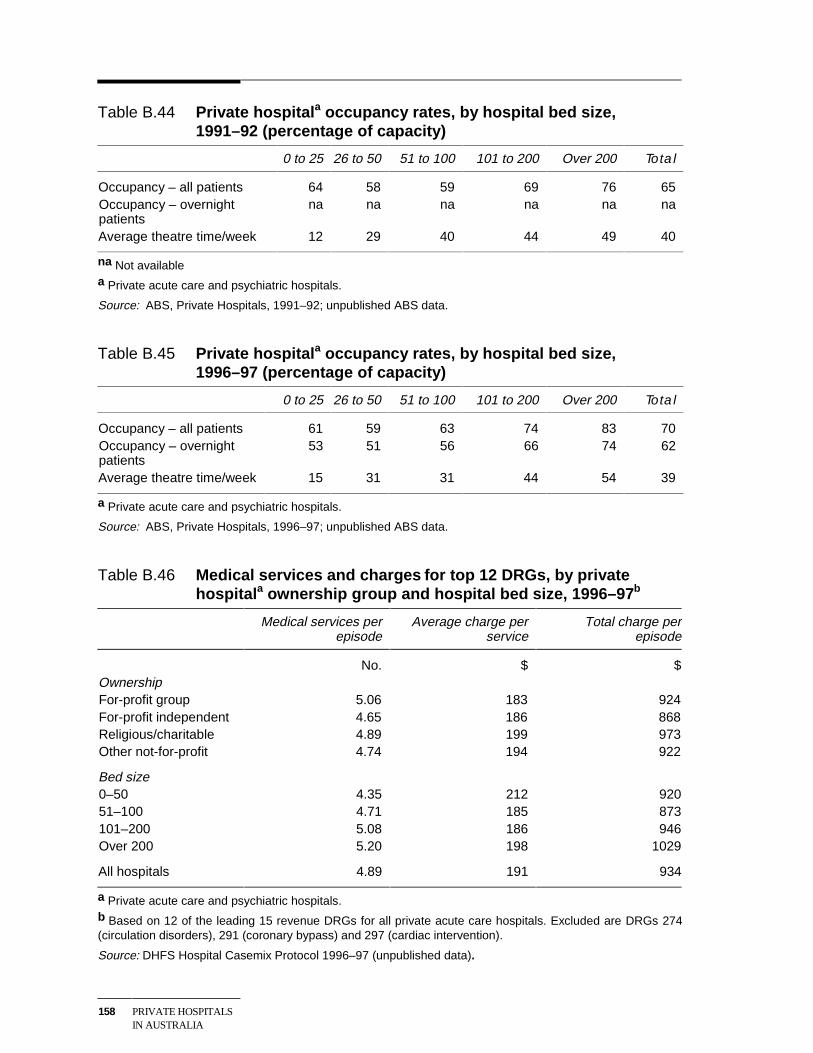
158 PRIVATE HOSPITALSIN AUSTRALIA
Table B.44 Private hospitala occupancy rates, by hospital bed size,1991–92 (percentage of capacity)
0 to 25 26 to 50 51 to 100 101 to 200 Over 200 Total
Occupancy – all patients 64 58 59 69 76 65Occupancy – overnightpatients
na na na na na na
Average theatre time/week 12 29 40 44 49 40
na Not availablea Private acute care and psychiatric hospitals.
Source: ABS, Private Hospitals, 1991–92; unpublished ABS data.
Table B.45 Private hospitala occupancy rates, by hospital bed size,1996–97 (percentage of capacity)
0 to 25 26 to 50 51 to 100 101 to 200 Over 200 Total
Occupancy – all patients 61 59 63 74 83 70Occupancy – overnightpatients
53 51 56 66 74 62
Average theatre time/week 15 31 31 44 54 39
a Private acute care and psychiatric hospitals.
Source: ABS, Private Hospitals, 1996–97; unpublished ABS data.
Table B.46 Medical services and charges for top 12 DRGs, by privatehospitala ownership group and hospital bed size, 1996–97 b
Medical services perepisode
Average charge perservice
Total charge perepisode
No. $ $OwnershipFor-profit group 5.06 183 924For-profit independent 4.65 186 868Religious/charitable 4.89 199 973Other not-for-profit 4.74 194 922
Bed size0–50 4.35 212 92051–100 4.71 185 873101–200 5.08 186 946Over 200 5.20 198 1029
All hospitals 4.89 191 934
a Private acute care and psychiatric hospitals.b Based on 12 of the leading 15 revenue DRGs for all private acute care hospitals. Excluded are DRGs 274(circulation disorders), 291 (coronary bypass) and 297 (cardiac intervention).
Source: DHFS Hospital Casemix Protocol 1996–97 (unpublished data).
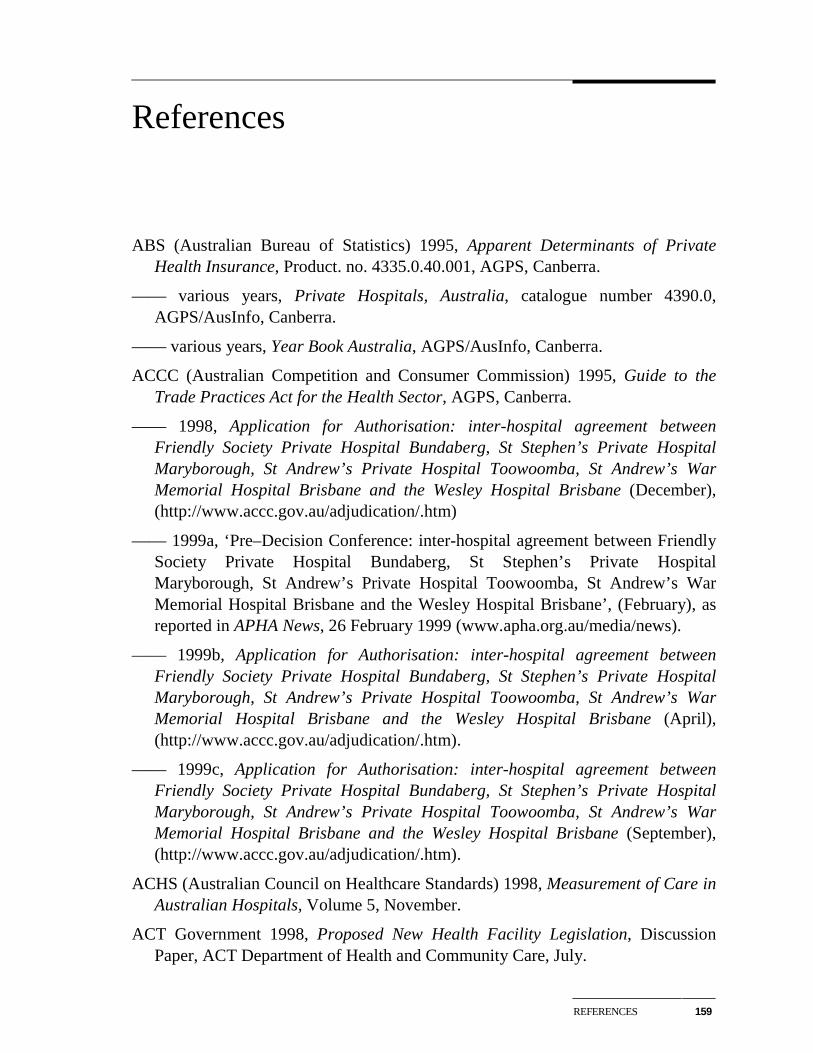
REFERENCES 159
References
ABS (Australian Bureau of Statistics) 1995, Apparent Determinants of PrivateHealth Insurance, Product. no. 4335.0.40.001, AGPS, Canberra.
—— various years, Private Hospitals, Australia, catalogue number 4390.0,AGPS/AusInfo, Canberra.
—— various years, Year Book Australia, AGPS/AusInfo, Canberra.
ACCC (Australian Competition and Consumer Commission) 1995, Guide to theTrade Practices Act for the Health Sector, AGPS, Canberra.
—— 1998, Application for Authorisation: inter-hospital agreement betweenFriendly Society Private Hospital Bundaberg, St Stephen’s Private HospitalMaryborough, St Andrew’s Private Hospital Toowoomba, St Andrew’s WarMemorial Hospital Brisbane and the Wesley Hospital Brisbane (December),(http://www.accc.gov.au/adjudication/.htm)
—— 1999a, ‘Pre–Decision Conference: inter-hospital agreement between FriendlySociety Private Hospital Bundaberg, St Stephen’s Private HospitalMaryborough, St Andrew’s Private Hospital Toowoomba, St Andrew’s WarMemorial Hospital Brisbane and the Wesley Hospital Brisbane’, (February), asreported in APHA News, 26 February 1999 (www.apha.org.au/media/news).
—— 1999b, Application for Authorisation: inter-hospital agreement betweenFriendly Society Private Hospital Bundaberg, St Stephen’s Private HospitalMaryborough, St Andrew’s Private Hospital Toowoomba, St Andrew’s WarMemorial Hospital Brisbane and the Wesley Hospital Brisbane (April),(http://www.accc.gov.au/adjudication/.htm).
—— 1999c, Application for Authorisation: inter-hospital agreement betweenFriendly Society Private Hospital Bundaberg, St Stephen’s Private HospitalMaryborough, St Andrew’s Private Hospital Toowoomba, St Andrew’s WarMemorial Hospital Brisbane and the Wesley Hospital Brisbane (September),(http://www.accc.gov.au/adjudication/.htm).
ACHS (Australian Council on Healthcare Standards) 1998, Measurement of Care inAustralian Hospitals, Volume 5, November.
ACT Government 1998, Proposed New Health Facility Legislation, DiscussionPaper, ACT Department of Health and Community Care, July.
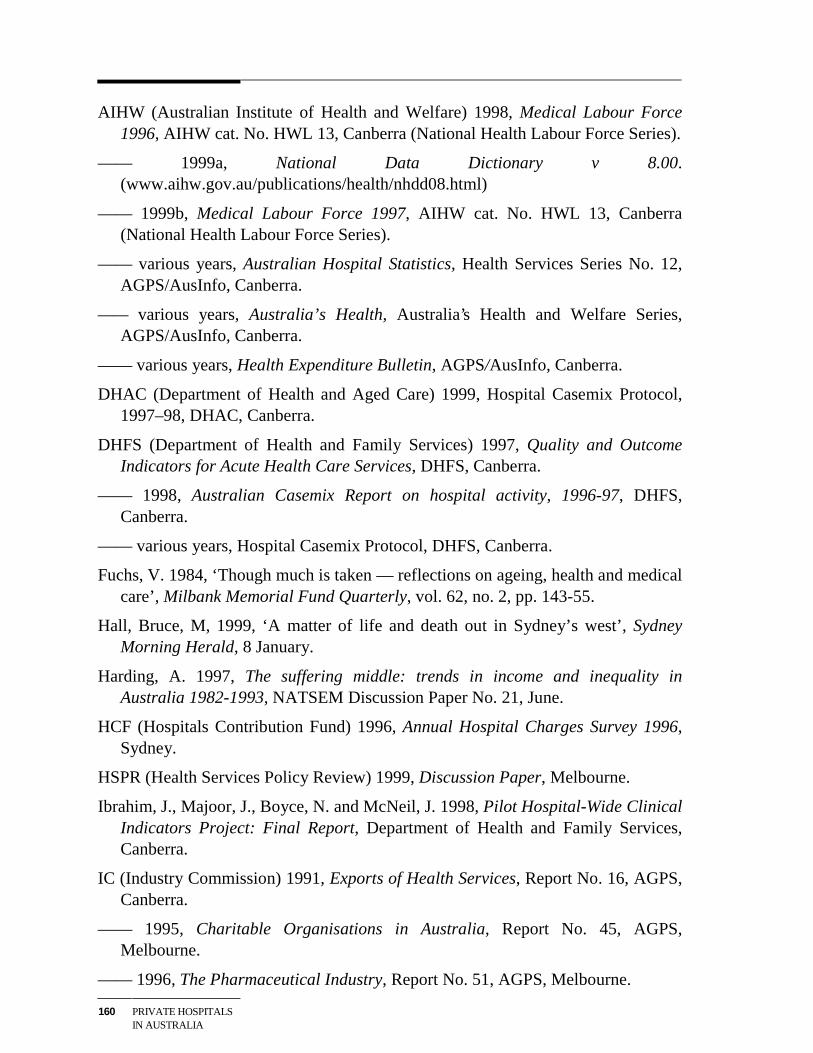
160 PRIVATE HOSPITALSIN AUSTRALIA
AIHW (Australian Institute of Health and Welfare) 1998, Medical Labour Force1996, AIHW cat. No. HWL 13, Canberra (National Health Labour Force Series).
—— 1999a, National Data Dictionary v 8.00.(www.aihw.gov.au/publications/health/nhdd08.html)
—— 1999b, Medical Labour Force 1997, AIHW cat. No. HWL 13, Canberra(National Health Labour Force Series).
—— various years, Australian Hospital Statistics, Health Services Series No. 12,AGPS/AusInfo, Canberra.
—— various years, Australia’s Health, Australia’s Health and Welfare Series,AGPS/AusInfo, Canberra.
—— various years, Health Expenditure Bulletin, AGPS/AusInfo, Canberra.
DHAC (Department of Health and Aged Care) 1999, Hospital Casemix Protocol,1997–98, DHAC, Canberra.
DHFS (Department of Health and Family Services) 1997, Quality and OutcomeIndicators for Acute Health Care Services, DHFS, Canberra.
—— 1998, Australian Casemix Report on hospital activity, 1996-97, DHFS,Canberra.
—— various years, Hospital Casemix Protocol, DHFS, Canberra.
Fuchs, V. 1984, ‘Though much is taken — reflections on ageing, health and medicalcare’, Milbank Memorial Fund Quarterly, vol. 62, no. 2, pp. 143-55.
Hall, Bruce, M, 1999, ‘A matter of life and death out in Sydney’s west’, SydneyMorning Herald, 8 January.
Harding, A. 1997, The suffering middle: trends in income and inequality inAustralia 1982-1993, NATSEM Discussion Paper No. 21, June.
HCF (Hospitals Contribution Fund) 1996, Annual Hospital Charges Survey 1996,Sydney.
HSPR (Health Services Policy Review) 1999, Discussion Paper, Melbourne.
Ibrahim, J., Majoor, J., Boyce, N. and McNeil, J. 1998, Pilot Hospital-Wide ClinicalIndicators Project: Final Report, Department of Health and Family Services,Canberra.
IC (Industry Commission) 1991, Exports of Health Services, Report No. 16, AGPS,Canberra.
—— 1995, Charitable Organisations in Australia, Report No. 45, AGPS,Melbourne.
—— 1996, The Pharmaceutical Industry, Report No. 51, AGPS, Melbourne.
REFERENCES 161
—— 1997, Private Health Insurance, Report No. 57, AGPS, Canberra.
IPART (Independent Pricing and Regulatory Tribunal of New South Wales) 1998,A Review of NSW Health, November.
JM&A (Jarden Morgan and Archon) 1990, Financial Analysis of the AustralianPrivate Hospital Industry, Report to the health care funding working party of theAustralian Health Ministers’ Advisory Council, Canberra.
McDonald P. and Kippen, R. 1999, ‘Ageing: the social and demographicdimensions’, in Productivity Commission and Melbourne Institute of AppliedEconomic and Social Research 1999, Policy Implications of the Ageing ofAustralia’s Population, Conference Proceedings, AusInfo, Canberra, pp. 47-60.
National Commission of Audit 1996, Report to the Commonwealth Government,AGPS, Canberra.
OECD (Organisation for Economic Cooperation and Development) 1996, Caringfor Frail Elderly People — Policies in Evolution, Social Policy Studies No. 19,OECD, Paris.
Paterson, J. 1994, ‘A New Look at National Medical Workforce Strategy’,Australian Health Review, 17:5–42
PC (Productivity Commission) 1996, Stocktake of Progress in MicroeconomicReform, AGPS, Canberra.
—— 1999a, Nursing Home Subsidies, Report No. 4, AusInfo, Canberra.
—— 1999b, Productivity Commission Submission to the National Review ofPharmacy, AusInfo, Canberra.
PHIAC (Private Health Insurance Administration Council) 1999, Membership ofHospital Insurance Tables offered by Registered Health Benefits Organisations,(http://www.phiac.org.au./phiac/stats), November 22.
—— various years, Annual Report, AGPS/AusInfo, Canberra.
Quints, T. and Marks, N. 1997, Health Care and Insurance in Australia 1997,Volume 1, TQA Research Pty Ltd, Melbourne.
Renn, S.C., Schramm, C.J., Watt, J.M., and Derzon, R.A. 1985, ‘The Effect ofOwnership and System Affiliation on the Economic Performance of Hospitals’,Inquiry, vol. 22, Fall, pp. 219-236.
Richardson, J. and Robertson. I. 1998, The Impact of New Technology on Treatmentand Cost of Acute Myocardial Infarction, The Centre for Health ProgramEvaluation, Technical Report 10.
—— 1999 ‘Ageing and the cost of health services’, in Productivity Commissionand Melbourne Institute of Applied Economic and Social Research 1999, Policy
162 PRIVATE HOSPITALSIN AUSTRALIA
Implications of the Ageing of Australia’s Population, Conference Proceedings,AusInfo, Canberra, pp. 329-55.
SCALC (Senate Community Affairs Legislation Committee) 1996, Report on theReview of the Health Legislation (Private Health Insurance Reform) AmendmentAct 1995, AGPS, Canberra, September.
SSCPHNH (Senate Select Committee on Private Hospitals and Nursing Homes)1987, Private hospitals in Australia, their conduct, administration andownership, Report, AGPS, Canberra.
SCRCSSP (Steering Committee for the Review of Commonwealth/State ServiceProvision) 1998a, Report on Government Services 1998, Volume 1, AusInfo,Canberra.
—— 1998b Implementing Reforms in Government Services 1998, AusInfo,Canberra.
—— 1999, Report on Government Services 1999, Volume 1, AusInfo, Canberra.
Wilson, R.M., Harrison, B.T., Gibberd, R.W. and Hamilton, J.D. 1999, An analysisof the causes of adverse events from the Quality in Australian Health CareStudy, Medical Journal of Australia, No.170.
Whiteford, P. and Bond, K. 1999, ‘Income support, retirement incomes and theliving standards of older Australians’, in Productivity Commission andMelbourne Institute of Applied Economic and Social Research 1999, PolicyImplications of the Ageing of Australia’s Population, Conference Proceedings,AusInfo, Canberra, pp. 181-213.