Embed Size (px)
Citation preview
Setting the Scene:Local Property Taxes2017 Report
March 10, 2017
As a key investment in Kansas communities, local government property taxes play a large role in funding the essential services residents have come to both rely on and appreciate as part of a high quality of life. However, the ability to maintain those high-quality city services – such as police, � re, infrastructure or parks – is subject to the ability of cities to collect adequate revenue to invest in these services.
With the state-mandated 2015 property tax lid nearing implementation in 2017, city residents are beginning to ask questions, such as:
• What value do residents receive from their property taxes?
• What’s the truth behind how much is coming out of our pockets each year to pay local property taxes?
• With the tax lid in place, what does the future of our city’s services look like?
� e unfortunate reality is that limiting the ability of local governments to fund essential city services stands to diminish those high-quality services that property owners currently receive when paying their property tax bill. Cities face an already inopportune economic environment. With the erosion of the property tax base and reduction of state aid due to decisions by the Kansas Legislature, cities have been learning to do more with less since the last property tax lid sunset in the late 1990s. Considering the � scal realities city governments in Kansas must live with, here are just a few of the ongoing factors a� ecting all Kansas cities:
• Lagging E� ects of 2008 Recession: Even in 2016, city budgets are still, on average, 4% below their pre-2008 recession levels. As a result, whether it’s spending for infrastructure, healthcare premiums for employees, or paying the energy bill, cities have had to do more with less over the past eight years. 1
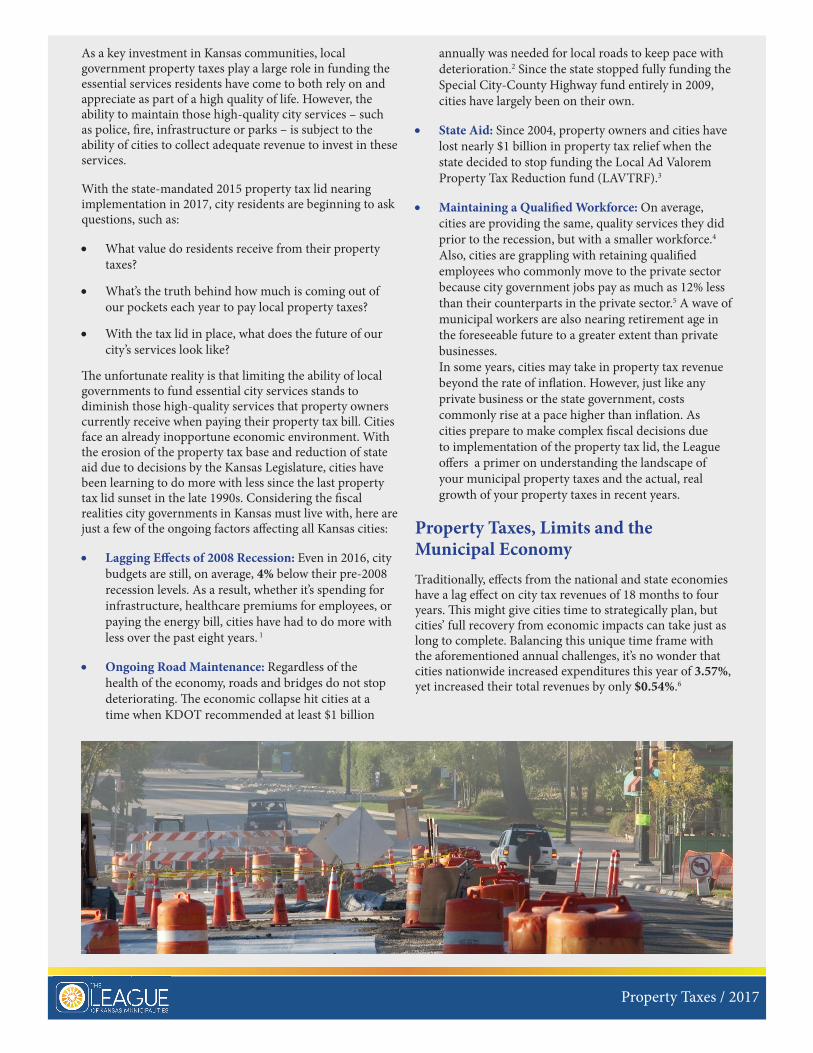
• Ongoing Road Maintenance: Regardless of the health of the economy, roads and bridges do not stop deteriorating. � e economic collapse hit cities at a time when KDOT recommended at least $1 billion
annually was needed for local roads to keep pace with deterioration.2 Since the state stopped fully funding the Special City-County Highway fund entirely in 2009, cities have largely been on their own.
• State Aid: Since 2004, property owners and cities have lost nearly $1 billion in property tax relief when the state decided to stop funding the Local Ad Valorem Property Tax Reduction fund (LAVTRF).3
• Maintaining a Quali� ed Workforce: On average, cities are providing the same, quality services they did prior to the recession, but with a smaller workforce.4 Also, cities are grappling with retaining quali� ed employees who commonly move to the private sector because city government jobs pay as much as 12% less than their counterparts in the private sector.5 A wave of municipal workers are also nearing retirement age in the foreseeable future to a greater extent than private businesses.In some years, cities may take in property tax revenue beyond the rate of in� ation. However, just like any private business or the state government, costs commonly rise at a pace higher than in� ation. As cities prepare to make complex � scal decisions due to implementation of the property tax lid, the League o� ers a primer on understanding the landscape of your municipal property taxes and the actual, real growth of your property taxes in recent years.
Property Taxes, Limits and the Municipal EconomyTraditionally, e� ects from the national and state economies have a lag e� ect on city tax revenues of 18 months to four years. � is might give cities time to strategically plan, but cities’ full recovery from economic impacts can take just as long to complete. Balancing this unique time frame with the aforementioned annual challenges, it’s no wonder that cities nationwide increased expenditures this year of 3.57%, yet increased their total revenues by only $0.54%.6
Property Taxes / 2017
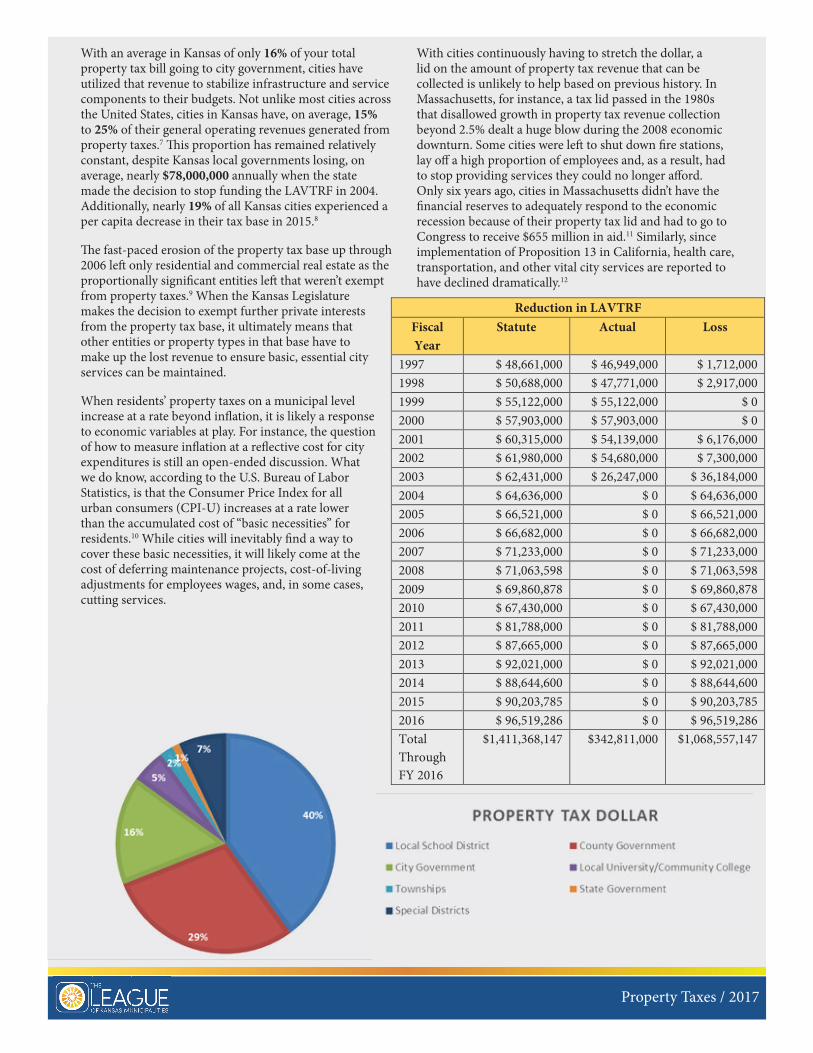
With an average in Kansas of only 16% of your total property tax bill going to city government, cities have utilized that revenue to stabilize infrastructure and service components to their budgets. Not unlike most cities across the United States, cities in Kansas have, on average, 15% to 25% of their general operating revenues generated from property taxes.7 � is proportion has remained relatively constant, despite Kansas local governments losing, on average, nearly $78,000,000 annually when the state made the decision to stop funding the LAVTRF in 2004. Additionally, nearly 19% of all Kansas cities experienced a per capita decrease in their tax base in 2015.8
� e fast-paced erosion of the property tax base up through 2006 le� only residential and commercial real estate as the proportionally signi� cant entities le� that weren’t exempt from property taxes.9 When the Kansas Legislature makes the decision to exempt further private interests from the property tax base, it ultimately means that other entities or property types in that base have to make up the lost revenue to ensure basic, essential city services can be maintained.
When residents’ property taxes on a municipal level increase at a rate beyond in� ation, it is likely a response to economic variables at play. For instance, the question of how to measure in� ation at a re� ective cost for city expenditures is still an open-ended discussion. What we do know, according to the U.S. Bureau of Labor Statistics, is that the Consumer Price Index for all urban consumers (CPI-U) increases at a rate lower than the accumulated cost of “basic necessities” for residents.10 While cities will inevitably � nd a way to cover these basic necessities, it will likely come at the cost of deferring maintenance projects, cost-of-living adjustments for employees wages, and, in some cases, cutting services.
Property Taxes / 2017
With cities continuously having to stretch the dollar, a lid on the amount of property tax revenue that can be collected is unlikely to help based on previous history. In Massachusetts, for instance, a tax lid passed in the 1980s that disallowed growth in property tax revenue collection beyond 2.5% dealt a huge blow during the 2008 economic downturn. Some cities were le� to shut down � re stations, lay o� a high proportion of employees and, as a result, had to stop providing services they could no longer a� ord. Only six years ago, cities in Massachusetts didn’t have the � nancial reserves to adequately respond to the economic recession because of their property tax lid and had to go to Congress to receive $655 million in aid.11 Similarly, since implementation of Proposition 13 in California, health care, transportation, and other vital city services are reported to have declined dramatically.12
Reduction in LAVTRF Fiscal Year
Statute Actual Loss
1997 $ 48,661,000 $ 46,949,000 $ 1,712,000 1998 $ 50,688,000 $ 47,771,000 $ 2,917,000 1999 $ 55,122,000 $ 55,122,000 $ 0 2000 $ 57,903,000 $ 57,903,000 $ 0 2001 $ 60,315,000 $ 54,139,000 $ 6,176,000 2002 $ 61,980,000 $ 54,680,000 $ 7,300,000 2003 $ 62,431,000 $ 26,247,000 $ 36,184,000 2004 $ 64,636,000 $ 0 $ 64,636,000 2005 $ 66,521,000 $ 0 $ 66,521,000 2006 $ 66,682,000 $ 0 $ 66,682,000 2007 $ 71,233,000 $ 0 $ 71,233,000 2008 $ 71,063,598 $ 0 $ 71,063,598 2009 $ 69,860,878 $ 0 $ 69,860,878 2010 $ 67,430,000 $ 0 $ 67,430,000 2011 $ 81,788,000 $ 0 $ 81,788,000 2012 $ 87,665,000 $ 0 $ 87,665,000 2013 $ 92,021,000 $ 0 $ 92,021,000 2014 $ 88,644,600 $ 0 $ 88,644,600 2015 $ 90,203,785 $ 0 $ 90,203,785 2016 $ 96,519,286 $ 0 $ 96,519,286 Total Through FY 2016
$1,411,368,147 $342,811,000 $1,068,557,147
Of speci� c importance for Kansas, cities and counties in the state are largely le� to fend for themselves when it comes to maintaining and improving the local transportation network. Considering 50% of the funding to maintain the local road system is generated entirely from local governments’ budgets and the state has opted to not fund in excess of $280,000,00013 of statutorily owed money since 1997 from the Special City-County Highway Fund, cities are largely le� with little recourse but to either gradually take in more property tax revenue to accommodate the need for road maintenance or defer maintenance on our local roads.14
Explaining the Property Tax Growth in Kansas
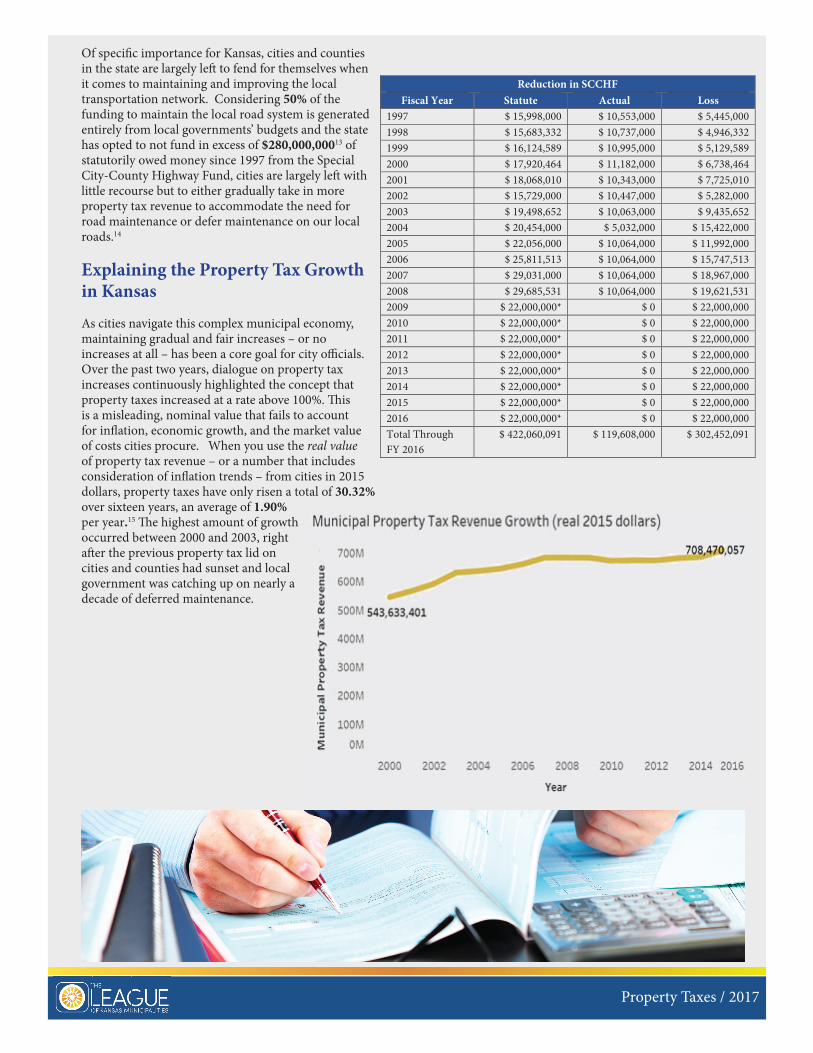
As cities navigate this complex municipal economy, maintaining gradual and fair increases – or no increases at all – has been a core goal for city o� cials. Over the past two years, dialogue on property tax increases continuously highlighted the concept that property taxes increased at a rate above 100%. � is is a misleading, nominal value that fails to account for in� ation, economic growth, and the market value of costs cities procure. When you use the real value of property tax revenue – or a number that includes consideration of in� ation trends – from cities in 2015 dollars, property taxes have only risen a total of 30.32% over sixteen years, an average of 1.90% per year.15 � e highest amount of growth occurred between 2000 and 2003, right a� er the previous property tax lid on cities and counties had sunset and local government was catching up on nearly a decade of deferred maintenance.
Property Taxes / 2017
Reduction in SCCHF Fiscal Year Statute Actual Loss
1997 $ 15,998,000 $ 10,553,000 $ 5,445,000 1998 $ 15,683,332 $ 10,737,000 $ 4,946,332 1999 $ 16,124,589 $ 10,995,000 $ 5,129,589 2000 $ 17,920,464 $ 11,182,000 $ 6,738,464 2001 $ 18,068,010 $ 10,343,000 $ 7,725,010 2002 $ 15,729,000 $ 10,447,000 $ 5,282,000 2003 $ 19,498,652 $ 10,063,000 $ 9,435,652 2004 $ 20,454,000 $ 5,032,000 $ 15,422,000 2005 $ 22,056,000 $ 10,064,000 $ 11,992,000 2006 $ 25,811,513 $ 10,064,000 $ 15,747,513 2007 $ 29,031,000 $ 10,064,000 $ 18,967,000 2008 $ 29,685,531 $ 10,064,000 $ 19,621,531 2009 $ 22,000,000* $ 0 $ 22,000,000 2010 $ 22,000,000* $ 0 $ 22,000,000 2011 $ 22,000,000* $ 0 $ 22,000,000 2012 $ 22,000,000* $ 0 $ 22,000,000 2013 $ 22,000,000* $ 0 $ 22,000,000 2014 $ 22,000,000* $ 0 $ 22,000,000 2015 $ 22,000,000* $ 0 $ 22,000,000 2016 $ 22,000,000* $ 0 $ 22,000,000 Total Through FY 2016
$ 422,060,091 $ 119,608,000 $ 302,452,091
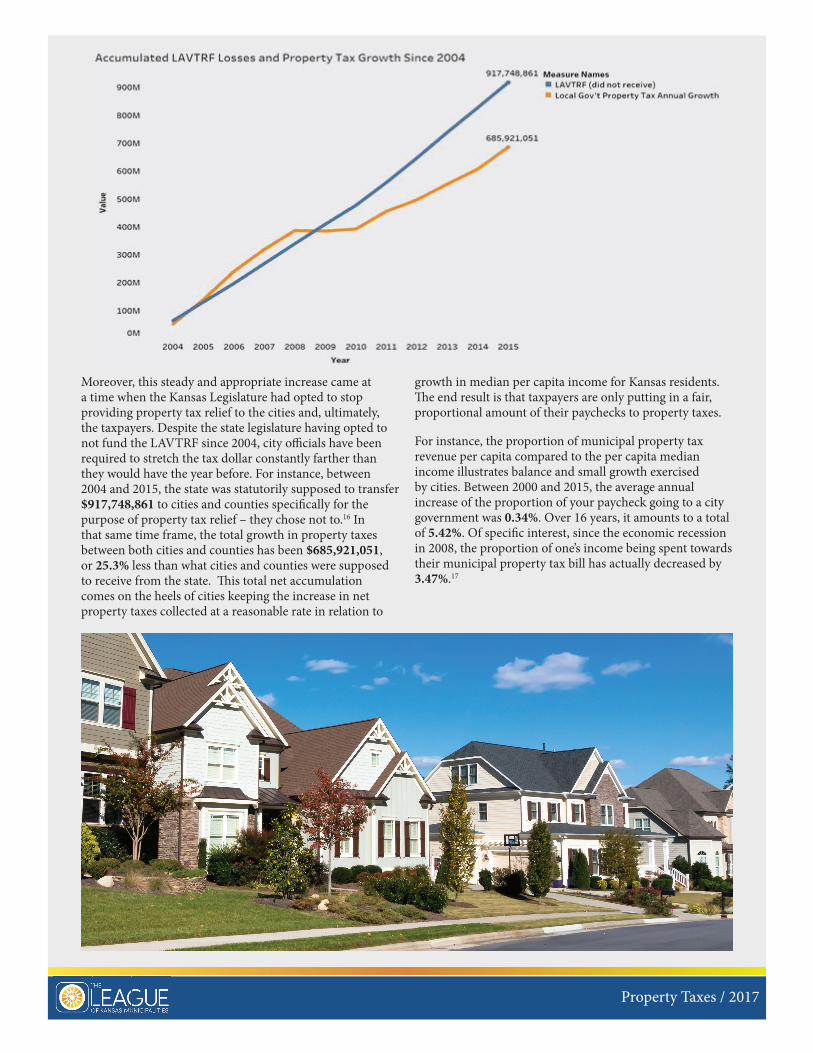
Moreover, this steady and appropriate increase came at a time when the Kansas Legislature had opted to stop providing property tax relief to the cities and, ultimately, the taxpayers. Despite the state legislature having opted to not fund the LAVTRF since 2004, city o� cials have been required to stretch the tax dollar constantly farther than they would have the year before. For instance, between 2004 and 2015, the state was statutorily supposed to transfer $917,748,861 to cities and counties speci� cally for the purpose of property tax relief – they chose not to.16 In that same time frame, the total growth in property taxes between both cities and counties has been $685,921,051, or 25.3% less than what cities and counties were supposed to receive from the state. � is total net accumulation comes on the heels of cities keeping the increase in net property taxes collected at a reasonable rate in relation to
Property Taxes / 2017
growth in median per capita income for Kansas residents. � e end result is that taxpayers are only putting in a fair, proportional amount of their paychecks to property taxes.
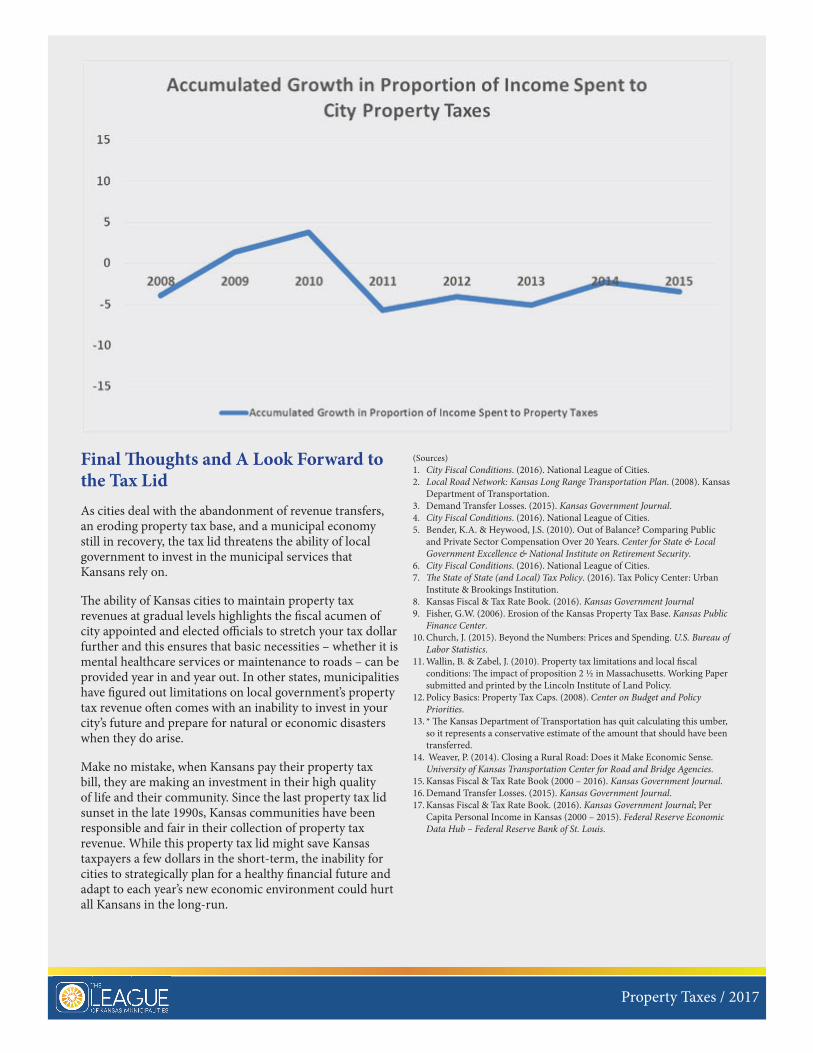
For instance, the proportion of municipal property tax revenue per capita compared to the per capita median income illustrates balance and small growth exercised by cities. Between 2000 and 2015, the average annual increase of the proportion of your paycheck going to a city government was 0.34%. Over 16 years, it amounts to a total of 5.42%. Of speci� c interest, since the economic recession in 2008, the proportion of one’s income being spent towards their municipal property tax bill has actually decreased by 3.47%.17
Final � oughts and A Look Forward to the Tax LidAs cities deal with the abandonment of revenue transfers, an eroding property tax base, and a municipal economy still in recovery, the tax lid threatens the ability of local government to invest in the municipal services that Kansans rely on.
� e ability of Kansas cities to maintain property tax revenues at gradual levels highlights the � scal acumen of city appointed and elected o� cials to stretch your tax dollar further and this ensures that basic necessities – whether it is mental healthcare services or maintenance to roads – can be provided year in and year out. In other states, municipalities have � gured out limitations on local government’s property tax revenue o� en comes with an inability to invest in your city’s future and prepare for natural or economic disasters when they do arise.
Make no mistake, when Kansans pay their property tax bill, they are making an investment in their high quality of life and their community. Since the last property tax lid sunset in the late 1990s, Kansas communities have been responsible and fair in their collection of property tax revenue. While this property tax lid might save Kansas taxpayers a few dollars in the short-term, the inability for cities to strategically plan for a healthy � nancial future and adapt to each year’s new economic environment could hurt all Kansans in the long-run.
Property Taxes / 2017
(Sources)1. City Fiscal Conditions. (2016). National League of Cities.2. Local Road Network: Kansas Long Range Transportation Plan. (2008). Kansas
Department of Transportation. 3. Demand Transfer Losses. (2015). Kansas Government Journal.4. City Fiscal Conditions. (2016). National League of Cities.5. Bender, K.A. & Heywood, J.S. (2010). Out of Balance? Comparing Public
and Private Sector Compensation Over 20 Years. Center for State & Local Government Excellence & National Institute on Retirement Security.
6. City Fiscal Conditions. (2016). National League of Cities.7. � e State of State (and Local) Tax Policy. (2016). Tax Policy Center: Urban
Institute & Brookings Institution. 8. Kansas Fiscal & Tax Rate Book. (2016). Kansas Government Journal9. Fisher, G.W. (2006). Erosion of the Kansas Property Tax Base. Kansas Public
Finance Center. 10. Church, J. (2015). Beyond the Numbers: Prices and Spending. U.S. Bureau of
Labor Statistics. 11. Wallin, B. & Zabel, J. (2010). Property tax limitations and local � scal
conditions: � e impact of proposition 2 ½ in Massachusetts. Working Paper submitted and printed by the Lincoln Institute of Land Policy.
12. Policy Basics: Property Tax Caps. (2008). Center on Budget and Policy Priorities.
13. * � e Kansas Department of Transportation has quit calculating this umber, so it represents a conservative estimate of the amount that should have been transferred.
14. Weaver, P. (2014). Closing a Rural Road: Does it Make Economic Sense. University of Kansas Transportation Center for Road and Bridge Agencies.
15. Kansas Fiscal & Tax Rate Book (2000 – 2016). Kansas Government Journal. 16. Demand Transfer Losses. (2015). Kansas Government Journal. 17. Kansas Fiscal & Tax Rate Book. (2016). Kansas Government Journal; Per
Capita Personal Income in Kansas (2000 – 2015). Federal Reserve Economic Data Hub – Federal Reserve Bank of St. Louis.
Property Taxes / 2017